Appendix A: Cervical cancer—symptoms, detection and treatment
25
69 Appendixes Appendix A: Cervical cancer—symptoms, detection and treatment Cervical cancer affects the cells of the cervix, which is the lower part of the womb (uterus) as it joins the inner end of the vagina. Like other cancers, cervical cancer is a disease where normal cells change, begin to multiply out of control, and form a growth or tumour. The cancer may arise from the squamous cells at the transformation zone where the squamous cells on the outside of the cervix join the columnar cells in the lining of the cervical canal (squamous cell carcinoma) or from the cells in the cervical canal (adenocarcinoma). Over two-thirds of cervical cancers are squamous cell carcinomas, which are most easily detected on the Pap smear, and about 20% are adenocarcinomas. If not detected early, the tumour can invade local tissue and spread (metastasise) to other parts of the body. The main symptoms of cervical cancer are unusual bleeding from the vagina, and very rarely an unusual vaginal discharge. However, these symptoms are quite common and are usually not due to cancer. A cervical cancer may take 10 or more years to develop, but before this the cells may show pre-cancerous changes. These early changes can be detected by a Pap smear (described in more detail below), and if they are promptly treated, cervical cancer can be prevented. The National Health and Medical Research Council recently approved a revised classification system of the Australian Modified Bethesda System (2004) which will be used to classify data collected from July 2006 onwards; however, the data in this report have been collated using the previous classification system in which these pre-cancerous lesions have two levels of severity—low-grade epithelial abnormalities and high-grade epithelial abnormalities. An earlier classification described various grades of cervical intraepithelial neoplasia (CIN). Low-grade abnormalities include minor changes in squamous cells and CIN 1, and high- grade abnormalities include CIN 2, CIN 3, squamous carcinoma in situ, adenocarcinoma in situ and invasive carcinoma (squamous or adenocarcinoma). The Pap smear is the most common way to detect pre-cancerous changes, which rarely cause any symptoms. The test involves a doctor or nurse practitioner inserting a speculum into the vagina and gently scraping the surface of the cervix. This process collects cells that are transferred onto a slide or into a special liquid, which is then sent to a pathology laboratory for assessment. Pap smears are offered by general practitioners, gynaecologists, family planning clinics, women’s health centres, hospital outpatient clinics and, in some circumstances, specially trained nurses. If the Pap smear shows an abnormality, the woman may be advised to have a repeat smear if the abnormality is low grade or she may be advised to have a colposcopy. With colposcopy, a doctor is able to look directly at the cervix under magnification using an instrument called a colposcope. Using a special stain the doctor can highlight any suspicious area, which may be pre-cancerous or cancerous. The doctor will then take a tissue sample (a biopsy) of the suspicious area for further examination by a pathologist. Pre-cancerous changes can be easily and effectively treated to prevent the progression to cervical cancer. The type of treatment depends on whether the change observed is low or
Transcript of Appendix A: Cervical cancer—symptoms, detection and treatment

69
Appendixes
Appendix A: Cervical cancer—symptoms, detection and treatment Cervical cancer affects the cells of the cervix, which is the lower part of the womb (uterus) as it joins the inner end of the vagina. Like other cancers, cervical cancer is a disease where normal cells change, begin to multiply out of control, and form a growth or tumour. The cancer may arise from the squamous cells at the transformation zone where the squamous cells on the outside of the cervix join the columnar cells in the lining of the cervical canal (squamous cell carcinoma) or from the cells in the cervical canal (adenocarcinoma). Over two-thirds of cervical cancers are squamous cell carcinomas, which are most easily detected on the Pap smear, and about 20% are adenocarcinomas. If not detected early, the tumour can invade local tissue and spread (metastasise) to other parts of the body. The main symptoms of cervical cancer are unusual bleeding from the vagina, and very rarely an unusual vaginal discharge. However, these symptoms are quite common and are usually not due to cancer.
A cervical cancer may take 10 or more years to develop, but before this the cells may show pre-cancerous changes. These early changes can be detected by a Pap smear (described in more detail below), and if they are promptly treated, cervical cancer can be prevented. The National Health and Medical Research Council recently approved a revised classification system of the Australian Modified Bethesda System (2004) which will be used to classify data collected from July 2006 onwards; however, the data in this report have been collated using the previous classification system in which these pre-cancerous lesions have two levels of severity—low-grade epithelial abnormalities and high-grade epithelial abnormalities. An earlier classification described various grades of cervical intraepithelial neoplasia (CIN). Low-grade abnormalities include minor changes in squamous cells and CIN 1, and high-grade abnormalities include CIN 2, CIN 3, squamous carcinoma in situ, adenocarcinoma in situ and invasive carcinoma (squamous or adenocarcinoma).
The Pap smear is the most common way to detect pre-cancerous changes, which rarely cause any symptoms. The test involves a doctor or nurse practitioner inserting a speculum into the vagina and gently scraping the surface of the cervix. This process collects cells that are transferred onto a slide or into a special liquid, which is then sent to a pathology laboratory for assessment. Pap smears are offered by general practitioners, gynaecologists, family planning clinics, women’s health centres, hospital outpatient clinics and, in some circumstances, specially trained nurses.
If the Pap smear shows an abnormality, the woman may be advised to have a repeat smear if the abnormality is low grade or she may be advised to have a colposcopy. With colposcopy, a doctor is able to look directly at the cervix under magnification using an instrument called a colposcope. Using a special stain the doctor can highlight any suspicious area, which may be pre-cancerous or cancerous. The doctor will then take a tissue sample (a biopsy) of the suspicious area for further examination by a pathologist.
Pre-cancerous changes can be easily and effectively treated to prevent the progression to cervical cancer. The type of treatment depends on whether the change observed is low or

70
high grade, the woman’s age and general health, whether she wants to have children, and on her preferences.
There is a range of treatments for pre-cancerous changes, including laser treatment, loop excision (LLETZ), cryosurgery (cold coagulation), electrodiathermy, or cone biopsy (either by laser or by scalpel). In a small number of instances, a hysterectomy may be necessary.
For invasive cancer, a cone biopsy or hysterectomy is generally performed. If the cancer cells are detected on the surface of the cervix only, it may be treated by a cone biopsy. If it has invaded deeper into the cervix, a hysterectomy is generally performed. In advanced cases, a radical hysterectomy is needed to remove the cervix and uterus along with a margin of tissue around the cervix and lymph nodes from the pelvis. Radiotherapy is sometimes used as well as surgery, and for more advanced cases it may be used on its own.

71
Appendix B: Data sources and limitations All data used in this report are based on calendar years. Data are derived from multiple sources and are summarised below.
Table B1: Cervical cancer screening indicators data sources
Indicator Description Data source
1 Participation rate for cervical cancer screening National Cervical Screening Program
2 Early re-screening National Cervical Screening Program
3 Low-grade abnormality detection National Cervical Screening Program
4 High-grade abnormality detection National Cervical Screening Program
5.1 Incidence of micro-invasive cervical cancer National Cancer Statistics Clearing House (ICD-10 C53)
National Cancer Statistics Clearing House
5.2 Incidence of squamous, adenocarcinoma, adeno-squamous and other cervical cancer (ICD-10 C53)
National Cancer Statistics Clearing House
5.3 Incidence by location (ICD-10 C53) National Cancer Statistics Clearing House
6.1 Mortality from cervical cancer (ICD-9 180 for data up to and including 1996; ICD-10 C53 for data from 1997 onwards)
AIHW Mortality Database
6.2 Mortality by location AIHW Mortality Database
6.3 Mortality by Indigenous status AIHW Mortality Database
Population data The Australian Bureau of Statistics estimated resident female population has been used to calculate incidence and mortality rates. Participation rates were calculated using the average of the estimated resident female population for the two-year reporting period. There may be some variation in published participation rates because national rates use estimated resident population data in the denominator whereas local data analysis may use Census counts. The denominator population used to calculate cervical screening participation rates has been adjusted by the estimated proportion of women who have had a hysterectomy by age. These data were derived from the 2001 National Health Survey, and are tabled in Appendix D.
The age-standardised rates in this publication are calculated using the total estimated 2001 mid-year Australian resident population. Where appropriate, rates are also standardised to the WHO World Standard Population for international comparison. Both the Australian and the WHO World Standard Populations are in Appendix D.
Indigenous mortality data Due to the difficulties of Indigenous identification, mortality data used in Indicator 6.3 are based on deaths in Queensland, Western Australia, South Australia and the Northern Territory only.

72
Other data limitations • Hysterectomy fractions are calculated using national data derived from the ABS National
Health Survey using aggregate data that do not necessarily reflect variation at the state or territory level. In this report, data from the 2001 National Health Survey have been used.
• Participation rates will be underestimates to the extent that a small percentage of women choose to opt off local registers and have been excluded from the statistics in this report.
• The participation numbers for states and territories other than Victoria, the Australian Capital Territory and the Australian totals may be overestimated because of double counting of some women in registers. This may be the result of difficulty in identifying state or territory of residence for women in border areas and the inclusion in registers of women resident overseas.
• Participation rates published by state and territory programs may differ from those in this publication because of variation in denominators used.
Trend data Where trend data have been provided for indicators relating to participation, early re-screening, low-grade abnormalities or high-grade abnormalities, it is important to note that for some years not all jurisdictions were able to supply data and there were differences in how data were reported for some reporting periods (footnotes advising the limitations of data have been provided wherever this was applicable). For some states and territories the absence of data is due to a later commencement date for the registry, as shown below.
States and territories Date registry commenced
New South Wales July 1996
Victoria November 1989
Queensland February 1999
Western Australia July 1994
South Australia June 1993
Tasmania May 1994
Australian Capital Territory March 1995
Northern Territory March 1996

73
Appendix C: Methods This section describes the methods employed to calculate the estimates presented in the tables in the body of this publication.
Crude rates A crude rate is defined as the number of events over a specified period of time (for example, a year) divided by the total population. For example, a crude cancer incidence rate is similarly defined as the number of new cases of cancer in a specified period of time divided by the population at risk. Crude death rates and cancer incidence rates are expressed in this report as rates per 100,000 population. Crude participation rate is expressed as a percentage.
Age-specific rates Age-specific rates are calculated by dividing the number of cases occurring in each specified age group by the corresponding population in the same age group expressed as a percentage or a rate per 1,000 or 100,000 population. This rate may be calculated for particular age and sex groupings, for example:
years 5450 aged population female 2002
2002)(year years 54–50 aged cases New −
= 100,000 ×
650,212
78 = 100,000×
100,000per 12.0 =
Age-standardised rates (AS rates) Rates are adjusted for age to facilitate comparisons between populations that have different age structures, for example, between youthful and ageing communities. There are two different methods commonly used to adjust for age. In this publication we use direct standardisation in which age-specific rates are multiplied against a constant population (the Australian 2001 Standard Population unless otherwise specified). This effectively removes the influence of age structure on the summary rate that is described as the age-standardised rate. The method may be used for the calculation of participation, incidence and mortality rates. The method used for this calculation comprises three steps.
Step 1: Calculate the age-specific rate (as shown above) for each age group.
Step 2: Calculate the expected number of cases in each five-year age group by multiplying the age-specific rates by the corresponding standard population and dividing by the appropriate factor (that is, 100,000 for mortality and incidence rates and 100 for the participation rate).
Age-specific cervical cancer incidence rate in females aged 50–54 years in 2002
74
Step 3: Sum the expected number of cases in each group, divide by the total of the standard population and multiply by the appropriate factor (that is, 100,000 for mortality and incidence rates and 100 for the participation rate). This gives the age-standardised rate.
Confidence intervals Population numbers for incidence, mortality and screening have a natural level of variability for a single year above and below what might be expected in the mean over many years. The percentage variability is small for large population numbers but high for small numbers such as mortality in a young age group. One measure of the likely difference is the standard error, which indicates the extent to which a population number might have varied by chance in only one year of data.
In the 95% confidence interval there are about 19 chances in 20 that the difference will be less than two standard errors.
The 95% confidence intervals (CIs) in this report were calculated using a method developed by Dobson et al. (1991). This method calculates approximate confidence intervals for a weighted sum of Poisson parameters.
75
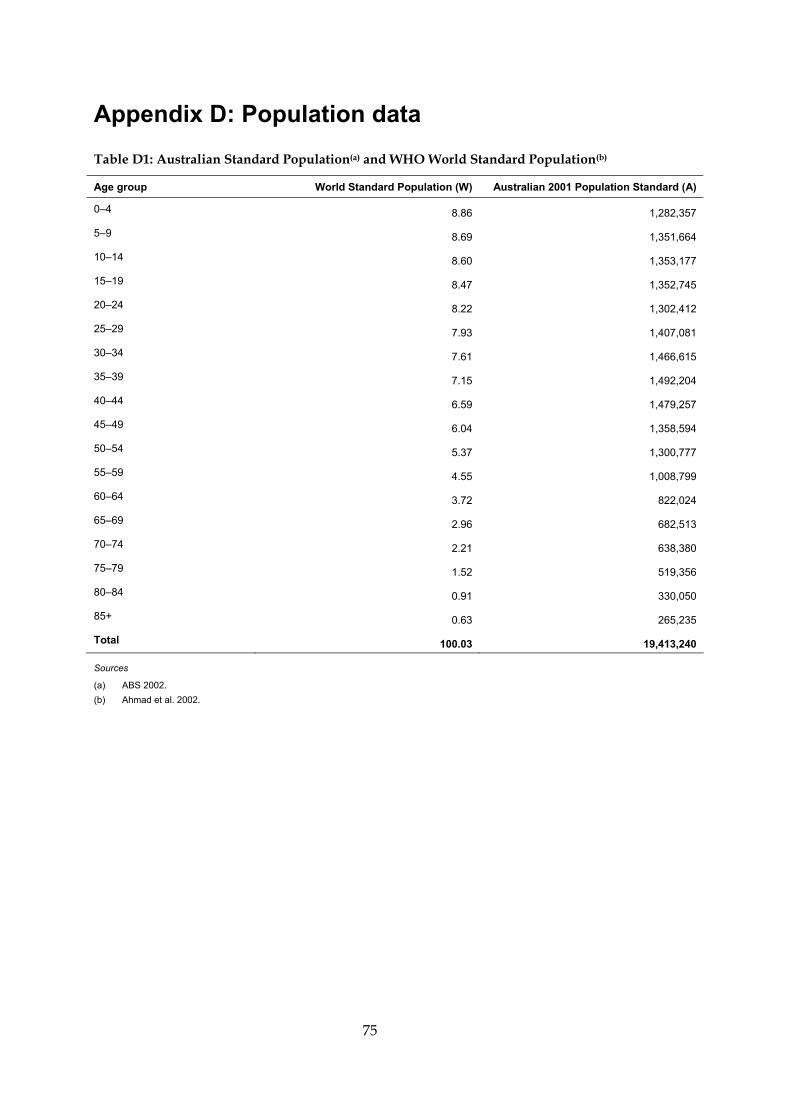
Appendix D: Population data
Table D1: Australian Standard Population(a) and WHO World Standard Population(b)
Age group World Standard Population (W) Australian 2001 Population Standard (A)
0–4 8.86 1,282,357
5–9 8.69 1,351,664
10–14 8.60 1,353,177
15–19 8.47 1,352,745
20–24 8.22 1,302,412
25–29 7.93 1,407,081
30–34 7.61 1,466,615
35–39 7.15 1,492,204
40–44 6.59 1,479,257
45–49 6.04 1,358,594
50–54 5.37 1,300,777
55–59 4.55 1,008,799
60–64 3.72 822,024
65–69 2.96 682,513
70–74 2.21 638,380
75–79 1.52 519,356
80–84 0.91 330,050
85+ 0.63 265,235
Total 100.03 19,413,240
Sources
(a) ABS 2002. (b) Ahmad et al. 2002.

76
Table D2: Hysterectomy fractions for women aged 15–80+ years, 2001
Age group % of women who have not had a hysterectomy
18–19 100.0
20–24 100.0
25–29 100.0
30–34 98.9
35–39 95.6
40–44 90.6
45–49 82.5
50–54 76.5
55–59 66.2
60–64 68.9
65–69 66.8
70–74 68.1
75–79 67.9
80+ 69.0
Total 85.5
Source: ABS 2002.

77
Appendix E: Tables published on the Internet
Indicator 1: Participation Table 1: Proportion of women participating in the National Cervical Screening Program,
by age, 1996–1997 to 2004–2005 Table 2: Proportion of women participating in the National Cervical Screening Program,
by age, states and territories, 1996–1997 to 2004–2005 Table 3: Number of women participating in the National Cervical Screening
Program, by age, states and territories, 2004–2005 Table 4: Proportion of women participating in the National Cervical Screening Program,
by age, states and territories, 2004–2005 Table 5: Number of women participating in the National Cervical Screening
Program, by age, states and territories, 2003–2004 Table 6: Proportion of women participating in the National Cervical Screening Program,
by age, states and territories, 2003–2004 Table 7: Number of women participating in the National Cervical Screening Program, by
age, states and territories, 2002–2003 Table 8: Proportion of women participating in the National Cervical Screening Program,
by age, states and territories, 2002–2003 Table 9: Number of women participating in the National Cervical Screening Program, by
age, states and territories, 2001–2002 Table 10: Proportion of women participating in the National Cervical Screening Program,
by age, states and territories, 2001–2002 Table 11: Number of women participating in the National Cervical Screening Program, by
age, states and territories, 2000–2001 Table 12: Proportion of women participating in the National Cervical Screening Program,
by age, states and territories, 2000–2001 Table 13: Number of women participating in the National Cervical Screening Program, by
age, states and territories, 1999–2000 Table 14: Proportion of women participating in the National Cervical Screening Program,
by age, states and territories, 1999–2000 Table 15: Number of women participating in the National Cervical Screening Program, by
age, states and territories, 1998–1999 Table 16: Proportion of women participating in the National Cervical Screening Program,
by age, states and territories, 1998–1999 Table 17: Number of women participating in the National Cervical Screening Program, by
age, states and territories, 1997–1998 Table 18: Proportion of women participating in the National Cervical Screening Program,
by age, states and territories, 1997–1998 Table 19: Number of women participating in the National Cervical Screening Program, by
age, states and territories, 1996–1997

78
Table 20: Proportion of women participating in the National Cervical Screening Program, by age, states and territories, 1996–1997
Indicator 2: Early re-screening Table 21: Number of women with repeat screenings following a normal Pap smear in
Australian cohorts from 1996 to 2004 Table 22: Percentage of women with repeat screenings following a normal Pap smear
in Australian cohorts from 1996 to 2004 Table 23: Number of women with repeat screenings in the 21 months following a normal
Pap smear in the 2004 cohort, by states and territories and Australia Table 24: Percentage of women with repeat screenings in the 21 months following a normal
Pap smear in the 2004 cohort, by states and territories and Australia Table 25: Number of women with repeat screenings in the 21 months following a normal
Pap smear in the 2003 cohort, by states and territories and Australia Table 26: Percentage of women with repeat screenings in the 21 months following a normal
Pap smear in the 2003 cohort, by states and territories and Australia Table 27: Number of women with repeat screenings in the 21 months following a normal
Pap smear in the 2002 cohort, by states and territories and Australia Table 28: Percentage of women with repeat screenings in the 21 months following a normal
Pap smear in the 2002 cohort, by states and territories and Australia Table 29: Number of women with repeat screenings in the 21 months following a normal
Pap smear in the 2001 cohort, by states and territories and Australia Table 30: Percentage of women with repeat screenings in the 21 months following a normal
Pap smear in the 2001 cohort, by states and territories and Australia Table 31: Number of women with repeat screenings in the 21 months following a normal
Pap smear in the 2000 cohort, by states and territories and Australia Table 32: Percentage of women with repeat screenings in the 21 months following a normal
Pap smear in the 2000 cohort, by states and territories and Australia Table 33: Number of women with repeat screenings in the 21 months following a normal
Pap smear in the 1999 cohort, by states and territories and Australia Table 34: Percentage of women with repeat screenings in the 21 months following a normal
Pap smear in the 1999 cohort, by states and territories and Australia Table 35: Number of women with repeat screenings in the 24 months following a normal
Pap smear in the 1998 cohort, by states and territories and Australia Table 36: Percentage of women with repeat screenings in the 24 months following a normal
Pap smear in the 1998 cohort, by states and territories and Australia Table 37: Number of women with repeat screenings in the 24 months following a normal
Pap smear in the 1997 cohort, by states and territories and Australia Table 38: Percentage of women with repeat screenings in the 24 months following a normal
Pap smear in the 1997 cohort, by states and territories and Australia Table 39: Number of women with repeat screenings in the 24 months following a normal
Pap smear in the 1996 cohort, by states and territories and Australia

79
Table 40: Percentage of women with repeat screenings in the 24 months following a normal Pap smear in the 1996 cohort, by states and territories and Australia
Indicator 3: Low-grade abnormality detection Table 41: Number of low- and high-grade abnormalities on histology for women
aged 20–69 years, 1997–2005 Table 42: Number of low- and high-grade abnormalities on histology for women
aged 20–69 years, states and territories, 2005 Table 43: Number of low- and high-grade abnormalities on histology for women
aged 20–69 years, states and territories, 2004 Table 44: Number of low- and high-grade abnormalities on histology for women
aged 20–69 years, states and territories, 2003 Table 45: Number of low- and high-grade abnormalities on histology for women
aged 20–69 years, states and territories, 2002 Table 46: Number of low- and high-grade abnormalities on histology for women
aged 20–69 years, states and territories, 2001 Table 47: Number of low- and high-grade abnormalities on histology for women
aged 20–69 years, states and territories, 2000 Table 48: Number of low- and high-grade abnormalities on histology for women
aged 20–69 years, states and territories, 1999 Table 49: Number of low- and high-grade abnormalities on histology for women
aged 20–69 years, states and territories, 1998 Table 50: Number of low- and high-grade abnormalities on histology for women
aged 20–69 years, states and territories, 1997
Indicator 4: High-grade abnormality detection Table 51: Rate of histologically confirmed high-grade abnormalities per 1,000 women
screened, in Australia by age, 1997–2005 Table 52: Rate of histologically confirmed high-grade abnormalities per 1,000 women
screened, by age, states and territories, 2005 Table 53: Rate of histologically confirmed high-grade abnormalities per 1,000 women
screened, by age, states and territories, 2004 Table 54: Rate of histologically confirmed high-grade abnormalities per 1,000 women
screened, by age, states and territories, 2003 Table 55: Rate of histologically confirmed high-grade abnormalities per 1,000 women
screened, by age, states and territories, 2002 Table 56: Rate of histologically confirmed high-grade abnormalities per 1,000 women
screened, by age, states and territories, 2001 Table 57: Rate of histologically confirmed high-grade abnormalities per 1,000 women
screened, by age, states and territories, 2000 Table 58: Rate of histologically confirmed high-grade abnormalities per 1,000 women
screened, by age, states and territories, 1999

80
Table 59: Rate of histologically confirmed high-grade abnormalities per 1,000 women screened, by age, states and territories, 1998
Table 60: Rate of histologically confirmed high-grade abnormalities per 1,000 women screened, by age, states and territories, 1997
Table 61: Number of histologically confirmed high-grade abnormalities in Australia by age, 1997–2005
Table 62: Number of histologically confirmed high-grade abnormalities by age, states and territories, 2005
Table 63: Number of histologically confirmed high-grade abnormalities by age, states and territories, 2004
Table 64: Number of histologically confirmed high-grade abnormalities by age, states and territories, 2003
Table 65: Number of histologically confirmed high-grade abnormalities by age, states and territories, 2002
Table 66: Number of histologically confirmed high-grade abnormalities by age, states and territories, 2001
Table 67: Number of histologically confirmed high-grade abnormalities by age, states and territories, 2000
Table 68: Number of histologically confirmed high-grade abnormalities by age, states and territories, 1999
Table 69: Number of histologically confirmed high-grade abnormalities by age, states and territories, 1998
Table 70: Number of histologically confirmed high-grade abnormalities by age, states and territories, 1997
Table 71: Number of women screened, by age, 1997–2005 Table 72: Number of women screened, by age, states and territories, 2005 Table 73: Number of women screened, by age, states and territories, 2004 Table 74: Number of women screened, by age, states and territories, 2003 Table 75: Number of women screened, by age, states and territories, 2002 Table 76: Number of women screened, by age, states and territories, 2001 Table 77: Number of women screened, by age, states and territories, 2000 Table 78: Number of women screened, by age, states and territories, 1999 Table 79: Number of women screened, by age, states and territories, 1998 Table 80: Number of women screened, by age, states and territories, 1997

81
Appendix F: National Cervical Screening Programs contact list New South Wales Ms Robyn Godding Cervical Screening Program Manager Cancer Institute NSW Level 1, Biomedical Building Australia Technology Park EVERLEIGH NSW 2015 Phone: +61 2 8374 5757 Email: [email protected] page: www.cancerinstitute.org.au
Western Australia Ms Gillian Mangan Program Manager Cervical Cancer Prevention Program 1st Floor, Eastpoint Plaza 233 Adelaide Terrace PERTH WA 6000 Phone: +61 8 9237 6920 Fax: +61 8 9237 6991 Email: [email protected]
Victoria Associate Professor Dorota Gertig Head of Registry Victorian Cervical Cytology Registry PO Box 161 CARLTON SOUTH Vic 3053 Ms Vikki Sinnott Manager, Cancer Screening Programs Dept of Human Services 50 Lonsdale Street MELBOURNE Vic 3000 Phone: +61 3 9096 0391 Fax: +61 3 9096 9165 Email: [email protected] Home page: www.dhs.vic.org.au
South Australia Ms Bernadette Kenny Acting Program Manager SA Cervical Screening Program 2nd Floor, Norwich Centre 55 King William Road NORTH ADELAIDE SA 5006 Phone: +61 8 8226 8182 Fax: +61 8 8226 8190 Email: [email protected]
Queensland Ms Jennifer Muller Director Cancer Screening Services Queensland Health PO Box 48 BRISBANE Qld 4001 Phone: +61 7 3234 0905 Fax: +61 7 3235 2629 Email: [email protected]
Tasmania Ms Gail Raw Program Manager Dept of Health and Human Services GPO Box 125B HOBART Tas 7001 Ms Lorraine Wright Data Manager Phone: +61 3 6216 4305 Email: [email protected]

82
Australian Capital Territory Ms Helen Sutherland Program Manager ACT Health GPO Box 825 CANBERRA ACT 2601 Phone: +61 2 6205 1540 Fax: +61 2 6205 1394 Email: [email protected] Mr Peter Couvee Database Manager/Coordinator ACT Cervical Cytology Register ACT Community Health GPO Box 825 Canberra ACT 2601 Phone: +61 2 6205 1955 Fax: +61 2 6205 5035 Email: [email protected]
Northern Territory Ms Chris Tyzack Program Coordinator Well Women’s Cancer Prevention Program Territory Health Services PO Box 40596 CASUARINA NT 0810 Phone: +61 8 8922 6445 Fax: +61 8 8922 5511 Email: [email protected] Mr Guillermo Enciso Data Manager Casuarina Health Services Centre Territory Health Services PO Box 40596 CASUARINA NT 0810 Phone: +61 8 8922 6441 Fax: +61 8 8922 6447 or 6455 Email: [email protected]
Australian Government Department of Health and Ageing Screening Section Department of Health and Ageing GPO Box 9848 CANBERRA ACT 2601 Phone: +61 2 6289 8302 Fax: +61 2 6289 4021 Home page: www.cervicalscreen.health.gov.au
Australian Institute of Health and Welfare
Screening Health Registers and Cancer Monitoring Unit Australian Institute of Health and Welfare GPO Box 570 CANBERRA ACT 2601 Phone: +61 2 6244 1000 Fax: +61 2 6244 1299 Email: [email protected]

App
endi
x G
: Pre
-200
6 N
HM
RC
gui
delin
es fo
r the
man
agem
ent o
f wom
en w
ith
scre
en-d
etec
ted
abno
rmal
ities
Th
is re
fere
nce
shee
t is
a su
mm
ary
of th
e N
HM
RC g
uide
lines
for t
he m
anag
emen
t of w
omen
with
scr
een-
dete
cted
abn
orm
aliti
es. I
t is
inte
nded
to a
ssis
t med
ical
pr
actit
ione
rs to
take
app
ropr
iate
act
ion
on re
ceip
t of P
ap sm
ear r
epor
ts. (
Info
rmat
ion
on th
e ne
w N
HM
RC g
uide
lines
can
be
foun
d on
pag
e 85
.)
Low
-gra
de e
pith
elia
l abn
orm
aliti
es
Pap
smea
r rep
ort
Inve
stig
atio
n M
anag
emen
t N
on-s
peci
fic m
inor
squ
amou
s ce
ll ch
ange
s/at
ypia
Rep
eat s
mea
r at 1
2-m
onth
ly in
terv
als
until
it re
verts
to n
orm
al.
Min
or c
hang
es in
end
ocer
vica
l cel
ls/ l
ow-
grad
e gl
andu
lar c
hang
e R
epea
t sm
ear i
n 6
mon
ths
usin
g cy
tobr
ush
and
spat
ula.
If lo
w-
grad
e ab
norm
ality
per
sist
s, re
fer f
or c
olpo
scop
y an
d bi
opsy
if
indi
cate
d.
If en
doce
rvic
al c
ell a
bnor
mal
ity c
onfir
med
, ref
er to
gyn
aeco
logi
st fo
r ap
prop
riate
trea
tmen
t.
HP
V e
ffect
/HP
V-a
ssoc
iate
d ce
ll ch
ange
s R
epea
t sm
ear a
t 6-m
onth
ly in
terv
als.
If H
PV
-ass
ocia
ted
cell
chan
ges
pers
ist a
fter 1
2 m
onth
s, re
fer f
or c
olpo
scop
y.
If H
PV
con
firm
ed, c
ontin
ue w
ith 6
-mon
thly
sm
ears
unt
il tw
o ne
gativ
e re
ports
are
rece
ived
. Rep
eat s
mea
r ann
ually
for 2
yea
rs
then
reve
rt to
2-y
early
scr
eeni
ng.
Pos
sibl
e C
IN 1
± H
PV
/pos
sibl
e m
ild d
yspl
asia
R
epea
t sm
ear a
t 6-m
onth
ly in
terv
als
until
two
succ
essi
ve n
egat
ive
repo
rts a
re re
ceiv
ed. I
f les
ion
pers
ists
for 1
2 m
onth
s, re
fer f
or
colp
osco
py.
If C
IN 1
con
firm
ed, f
ollo
w e
ither
obs
erva
tiona
l or a
ctiv
e m
anag
emen
t pro
gram
as
expl
aine
d on
reve
rse
of s
heet
.
CIN
1 ±
HP
V/m
ild d
yspl
asia
R
efer
for c
olpo
scop
y an
d bi
opsy
if in
dica
ted.
If
CIN
1 c
onfir
med
, fol
low
eith
er o
bser
vatio
nal o
r act
ive
man
agem
ent p
rogr
am a
s ex
plai
ned
on re
vers
e of
she
et. I
f hig
her
grad
e ab
norm
ality
dia
gnos
ed, s
ee b
elow
.
H
igh-
grad
e ep
ithel
ial a
bnor
mal
ities
Pa
p sm
ear r
epor
t In
vest
igat
ion
Man
agem
ent
CIN
2 ±
HP
V/m
oder
ate
dysp
lasi
a R
efer
for c
olpo
scop
y an
d di
rect
ed b
iops
y.
If C
IN 2
con
firm
ed, t
reat
men
t by
gyna
ecol
ogis
t with
app
ropr
iate
ex
perti
se is
requ
ired.
CIN
3 ±
HP
V/s
ever
e dy
spla
sia
Ref
er fo
r col
posc
opy
and
dire
cted
bio
psy.
If
CIN
3 c
onfir
med
, tre
atm
ent b
y gy
naec
olog
ist w
ith a
ppro
pria
te
expe
rtise
is re
quire
d.
CIN
3 ±
HP
V w
ith p
ossi
ble
inva
sion
; en
doce
rvic
al g
land
ular
dys
plas
ia; o
r ad
enoc
arci
nom
a in
situ
Ref
er to
gyn
aeco
logi
st w
ith e
xper
tise
in c
olpo
scop
ic e
valu
atio
n of
m
alig
nanc
ies.
Tr
eatm
ent b
y gy
naec
olog
ist w
ith a
ppro
pria
te e
xper
tise
is re
quire
d.
Inva
sive
squ
amou
s ce
ll ca
rcin
oma
(SC
C) o
r A
deno
carc
inom
a R
efer
to g
ynae
colo
gist
ski
lled
in th
e m
anag
emen
t of m
alig
nanc
ies,
or
a s
peci
alis
t uni
t, fo
r urg
ent e
valu
atio
n an
d m
anag
emen
t. Tr
eatm
ent b
y gy
naec
olog
ist w
ith a
ppro
pria
te e
xper
tise
is re
quire
d.
Inco
nclu
sive
—ab
norm
al c
ells
hig
hly
sugg
estiv
e bu
t not
dia
gnos
tic o
f a h
igh-
grad
e ab
norm
ality
Ref
er fo
r col
posc
opy
and
poss
ible
bio
psy,
unl
ess
ther
e is
an
obvi
ous
diag
nost
ic d
iffic
ulty
, e.g
. epi
thel
ial a
troph
y or
infe
ctio
n. In
th
is c
ase,
trea
t the
pro
blem
and
repe
at th
e sm
ear.
If hi
gh-g
rade
lesi
on c
onfir
med
, tre
atm
ent b
y gy
naec
olog
ist w
ith
appr
opria
te e
xper
tise
is re
quire
d.
10183
Man
agem
ent o
f wom
en w
ith lo
w-g
rade
epi
thel
ial a
bnor
mal
ities
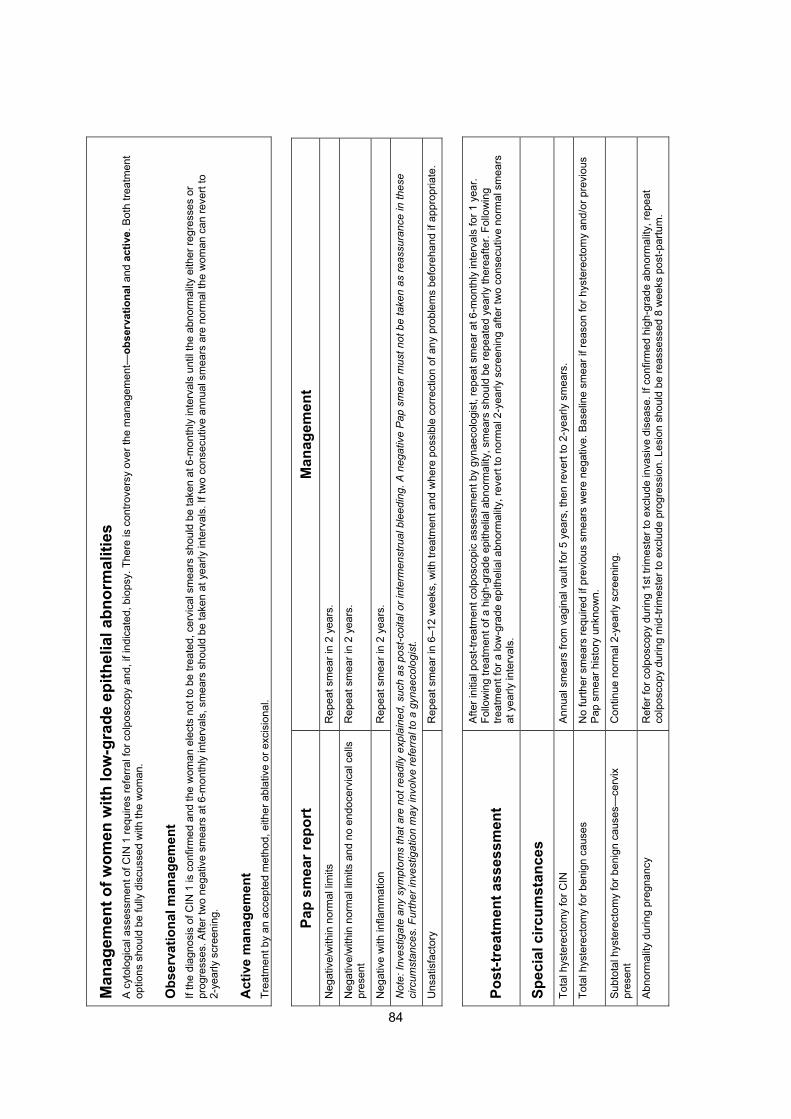
A
cyt
olog
ical
ass
essm
ent o
f CIN
1 re
quire
s re
ferra
l for
col
posc
opy
and,
if in
dica
ted,
bio
psy.
The
re is
con
trove
rsy
over
the
man
agem
ent—
obse
rvat
iona
l and
act
ive.
Bot
h tre
atm
ent
optio
ns s
houl
d be
fully
dis
cuss
ed w
ith th
e w
oman
.
Obs
erva
tiona
l man
agem
ent
If th
e di
agno
sis
of C
IN 1
is c
onfir
med
and
the
wom
an e
lect
s no
t to
be tr
eate
d, c
ervi
cal s
mea
rs s
houl
d be
take
n at
6-m
onth
ly in
terv
als
until
the
abno
rmal
ity e
ither
regr
esse
s or
pr
ogre
sses
. Afte
r tw
o ne
gativ
e sm
ears
at 6
-mon
thly
inte
rval
s, s
mea
rs s
houl
d be
take
n at
yea
rly in
terv
als.
If tw
o co
nsec
utiv
e an
nual
sm
ears
are
nor
mal
the
wom
an c
an re
vert
to
2-ye
arly
scr
eeni
ng.
Act
ive
man
agem
ent
Trea
tmen
t by
an a
ccep
ted
met
hod,
eith
er a
blat
ive
or e
xcis
iona
l.
Pa
p sm
ear r
epor
t M
anag
emen
t N
egat
ive/
with
in n
orm
al li
mits
R
epea
t sm
ear i
n 2
year
s.
Neg
ativ
e/w
ithin
nor
mal
lim
its a
nd n
o en
doce
rvic
al c
ells
pr
esen
t R
epea
t sm
ear i
n 2
year
s.
Neg
ativ
e w
ith in
flam
mat
ion
Rep
eat s
mea
r in
2 ye
ars.
Not
e: In
vest
igat
e an
y sy
mpt
oms
that
are
not
read
ily e
xpla
ined
, suc
h as
pos
t-coi
tal o
r int
erm
enst
rual
ble
edin
g. A
neg
ativ
e P
ap s
mea
r mus
t not
be
take
n as
reas
sura
nce
in th
ese
circ
umst
ance
s. F
urth
er in
vest
igat
ion
may
invo
lve
refe
rral
to a
gyn
aeco
logi
st.
Uns
atis
fact
ory
Rep
eat s
mea
r in
6–12
wee
ks, w
ith tr
eatm
ent a
nd w
here
pos
sibl
e co
rrect
ion
of a
ny p
robl
ems
befo
reha
nd if
app
ropr
iate
.
Post
-trea
tmen
t ass
essm
ent
Afte
r ini
tial p
ost-t
reat
men
t col
posc
opic
ass
essm
ent b
y gy
naec
olog
ist,
repe
at s
mea
r at 6
-mon
thly
inte
rval
s fo
r 1 y
ear.
Follo
win
g tre
atm
ent o
f a h
igh-
grad
e ep
ithel
ial a
bnor
mal
ity, s
mea
rs s
houl
d be
repe
ated
yea
rly th
erea
fter.
Follo
win
g tre
atm
ent f
or a
low
-gra
de e
pith
elia
l abn
orm
ality
, rev
ert t
o no
rmal
2-y
early
scr
eeni
ng a
fter t
wo
cons
ecut
ive
norm
al s
mea
rs
at y
early
inte
rval
s.
Spec
ial c
ircum
stan
ces
Tota
l hys
tere
ctom
y fo
r CIN
A
nnua
l sm
ears
from
vag
inal
vau
lt fo
r 5 y
ears
, the
n re
vert
to 2
-yea
rly s
mea
rs.
Tota
l hys
tere
ctom
y fo
r ben
ign
caus
es
No
furth
er s
mea
rs re
quire
d if
prev
ious
sm
ears
wer
e ne
gativ
e. B
asel
ine
smea
r if r
easo
n fo
r hys
tere
ctom
y an
d/or
pre
viou
s P
ap s
mea
r his
tory
unk
now
n.
Sub
tota
l hys
tere
ctom
y fo
r ben
ign
caus
es—
cerv
ix
pres
ent
Con
tinue
nor
mal
2-y
early
scr
eeni
ng.
Abn
orm
ality
dur
ing
preg
nanc
y R
efer
for c
olpo
scop
y du
ring
1st t
rimes
ter t
o ex
clud
e in
vasi
ve d
isea
se. I
f con
firm
ed h
igh-
grad
e ab
norm
ality
, rep
eat
colp
osco
py d
urin
g m
id-tr
imes
ter t
o ex
clud
e pr
ogre
ssio
n. L
esio
n sh
ould
be
reas
sess
ed 8
wee
ks p
ost-p
artu
m.
10284

85
Changes in 2005 to NHMRC guidelines for the management of asymptomatic women with screen-detected abnormalities Data in this report on cervical screening in Australia to 2004–2005 are based on the NHMRC guidelines which were in place to 2005. In 2005 the NHMRC approved revised guidelines as a result of an improved understanding of the natural history of the human papillomavirus (HPV) and its link to cervical cancer. Most particularly, this involves evidence of the pivotal role of persistent infection with high-risk HPV subtypes as a necessary, but not sufficient, cause for cervical malignancy to occur (NCSP 2005).
The new management approach for women with possible or definite low-grade cervical cytology is based on the acceptance that low-grade squamous intraepithelial abnormalities represent acute HPV infection with one of the over 100 known types of HPV. These HPV viruses are classified according to their status as low or high risk of progression to cancer; only four types have been associated with cervical cancer in Australia. Recent work in molecular biology and epidemiology suggests most HPV infections acquired by women resolve without medical intervention (NCSP 2005).
The major changes in the revised guidelines include: • the use of a new terminology for the classification of cervical cytology reporting—the
Australian Modified Bethesda System 2004 (AMBS 2004); • repeat Pap smears for most women with low-grade squamous change; • more conservative management of women with biopsy proven CIN 1; • colposcopy for all women with atypical glandular cell reports; and • the use of HPV testing as test of cure following treatment for high-grade abnormalities
(CIN 2 and 3) (Professor Ian Hammond, 14 March 2005).
These guidelines are based on revised terminology which will be used for the classification of cervical cytology reporting, the AMBS 2004. The AMBS 2004 classification system will be used to classify data collected for Cervical screening in Australia 2005–2006.
Further information on the new guidelines can be found on the Australian Government Department of Health and Ageing website <www.cervicalscreen.health.gov.au> and in Screening to prevent cervical cancer: guidelines for the management of asymptomatic women with screen-detected abnormalities <www.nhmrc.gov.au/publications>.

86
Glossary
Ablative therapy: the destruction of cells on the surface of the cervix using laser therapy, chemicals or diathermy.
Adenocarcinoma: a cancer formed from the cells of a gland.
Adenosquamous: a mix of adenocarcinoma and squamous cells in the same sample.
Adjuvant: enhancing or administered to enhance the effectiveness of a treatment or substance.
AS rate: age-standardised rate. A method of removing the influence of age when comparing populations with difference age structures. This is usually necessary because the rates of many diseases vary strongly (usually increasing) with age. The age structures of the different populations are converted to the same ‘standard’ structure; then the disease rates that would have occurred with that structure are calculated and compared (AIHW 2006).
Atypia: the condition of being irregular.
Basement membrane: the delicate, non-cellular layer on which an epithelium is seated. The epithelium forms the surface portion of the skin and lines hollow organs and all passages of the respiratory, digestive and genito-urinary systems.
Benign: not malignant.
Cancer death: a death where the underlying cause (see underlying cause of death) is indicated as cancer. Persons with cancer who die of other causes are not counted in the death statistics in this publication.
Cancer (malignant neoplasm): a large range of diseases, in which some of the body’s cells become defective, begin to multiply out of control, can invade and damage the area around them, and can also spread to other parts of the body to cause further damage (AIHW 2006).
Cervical cancer: this term covers all cancers specific to the uterine cervix, including micro-invasive cervical cancer. Types of cervical cancers include squamous cell carcinoma, adenocarcinoma (including mucoepidermoid and adenoid carcinomas), adenosquamous, and other and unspecified carcinomas. The term ‘all cervical cancers’ denotes all these types of cervical cancer, unless otherwise specified.
CIN (cervical intraepithelial neoplasia): squamous cell carcinoma of the cervix is mostly preceded, over a period of years, by a spectrum of asymptomatic abnormalities known as cervical intraepithelial neoplasia (CIN) graded as CIN I (mild dysplasia), CIN II (moderate dysplasia) and CIN III (severe dysplasia and carcinoma in situ). CIN usually occurs at least a decade before cervical cancer. If CIN remains untreated, some women will develop cervical cancer and others will progress to invasive cervical cancer, despite treatment (AIHW: Jelfs 1995). Colposcopy: a microscopic examination of the lower genital tract with a magnifying instrument called colposcope. This method of conservative evaluation allows the clinician to more accurately assess the cytologic abnormality by focusing on the areas of greatest cellular abnormality and by sampling them with a biopsy to attain diagnosis (NCSP 2004).
Cone biopsy: biopsy in which an inverted cone of tissue is excised, as from the uterine cervix.

87
Cryosurgery: the destruction of tissue using extreme cold.
Dysplasia: abnormal development or growth patterns of cells (NCSP 2004).
Endocervical: the inside of the uterine cervix or the mucous membrane lining of the cervix.
Epidemiology: the study of the patterns and causes of health and disease in populations, and the application of this study to improve health (AIHW 2006).
Epithelium: tissue lining the outer layer of a body or lining a cavity (e.g. vagina or mouth) (NCSP 2004).
Exfoliate: to break away or remove (shed) cells. In the context of this report it refers to the removal of cells from a person for the purpose of a Pap smear test.
HGA: high-grade abnormalities as defined for this report include CIN 1/2, CIN 2, CIN 3 or adenocarcinoma in situ.
Histology: the microscopic study of the minute structure and composition of tissues.
Hysterectomy: refers to the surgical procedure whereby all or part of the uterus is removed.
HPV: Human papillomavirus. The virus that causes genital warts and which is linked in some cases to the development of more serious cervical cell abnormalities (NCSP 2004).
Hysterectomy fractions: the proportion of women who have had their uterus removed by hysterectomy.
ICD-10: International Classification of Diseases—a coding system used to identify the primary site of the malignancy. This classification is in its 10th revision.
Incidence: the number of new cases (of an illness or event, and so forth) occurring during a given period (AIHW 2006).
Indigenous Australian: A person of Aboriginal and/or Torres Strait Islander descent who identifies as an Aboriginal and/or Torres Strait Islander and is accepted as such by the community with which he or she is associated (AIHW 2006). Intraepithelial: the area within the layer of cell tissues forming the epidermis of a body cavity. These cells comprise contiguous cells having minimum intercellular substance (NCSP 2004).
Invasive cancer: a tumour whose cells have a tendency to invade healthy or normal tissues.
LGA: low-grade abnormalities include atypia, warty atypia (human papillomavirus (HPV) effect), possible CIN, equivocal CIN, CIN 1 or endocervical dysplasia not otherwise specified.
Lymph node: masses of lymphatic tissue, often bean-shaped, that produce lymphocytes and through which lymph filters. These are located throughout the body.
Malignant: abnormal changes consistent with cancer.
Metastasis: the process by which cancerous cells are transferred from one part of the body to another, for example, via the lymphatic system or the bloodstream.
Micro-invasive squamous cell carcinoma (micro-invasive cancer): a lesion in which the cancer cells have invaded just below the surface of the cervix, but have not developed any potential to spread to other tissues.
Mortality: see cancer death.

88
Neoplasia: the new and abnormal development of cells that may be harmless or cancerous (malignant) (NCSP 2004). New cancer case: a person who has a new cancer diagnosed for the first time. One person may have more than one cancer and therefore may be counted twice in incidence statistics if it is decided that the two cancers are not of the same origin. This decision is based on a series of principles set out in more detail in a publication by Jensen et al. (1991).
Pap smear: a test prepared for the study of exfoliated cells from the cervix (refer to Appendix A).
Post-partum: following childbirth.
Radiation therapy: the treatment of disease with any type of radiation, most commonly with ionising radiation, such as X-rays, beta rays and gamma rays.
Screening: the performance of tests on apparently well people in order to detect a medical condition at an earlier stage than would otherwise be the case.
Squamous malignancy: thin and flat cells, shaped like soft fish scales. They line the outer surface of the cervix (ectocervix). They meet with columnar cells in the squamo-columnar junction. Eighty–eighty-five per cent of cancers of the cervix arise from squamous cells. Abnormalities associated with squamous cells are most likely abnormalities to be picked up by Pap smears (NCSP 2004).
Stroma: the supporting framework of an organ.
The Institute: the Australian Institute of Health and Welfare.
Tumour: an abnormal growth of tissue. Can be ‘benign’ (not a cancer) or ‘malignant’ (a cancer) (AIHW 2006).
Underlying cause of death: the condition, disease or injury initiating the sequence of events leading directly to death; that is, the primary, chief, main or principal cause (AIHW 2006).
89
References
ABS (Australian Bureau of Statistics) 1993. Estimated resident population by age and sex: Australian states and territories, June 1987 to June 1992. ABS cat. no. 3201.0. Canberra: ABS.
ABS (Australian Bureau of Statistics) 1999. Deaths Australia 1998. ABS cat. no. 3302.0. Canberra: ABS.
ABS (Australian Bureau of Statistics) 2000. Causes of death 1999. ABS cat. no. 3303.0. Canberra: ABS.
ABS (Australian Bureau of Statistics) 2001. Information paper: outcomes of ABS views on remoteness consultation, Australia 2001. ABS cat. no. 1244.0.00.001. Canberra: ABS.
ABS (Australian Bureau of Statistics) 2002. National Health Survey: summary of results, Australia 2001. ABS cat. no. 4364.0. Canberra: ABS.
ABS & AIHW (Australian Bureau of Statistics and Australian Institute of Health and Welfare) 2005. The health and welfare of Australia’s Aboriginal and Torres Strait Islander peoples, 2005. ABS cat. no. 4704.0. AIHW cat. no. IHW 14. Canberra: ABS.
Ahmad OB, Boschi-Pinto C, Lopez AD, Murray CJL, Lozano R & Inoue M 2002. Age standardization of rates: a new WHO standard. GPE Discussion Paper Series No. 31. Geneva: World Health Organization, <http://www3/whi.int/whosis/ discussion_papers/discussion_papers.cfm>.
AIHW & AACR (Australian Institute of Health and Welfare and Australasian Association of Cancer Registries) 2002. Cancer in Australia 1999. Cancer Series no. 20. AIHW cat. no. CAN 15. Canberra: AIHW.
AIHW: Jelfs PL 1995. Cervical cancer in Australia. Cancer Series no. 3. Canberra: AIHW.
AIHW (Australian Institute of Health and Welfare) 2006. Australia’s health 2006. AIHW cat. no. AUS 73. Canberra: AIHW.
DHSH (Department of Human Services and Health) 1994. Summary of NHMRC guidelines for the management of women with screen-detected abnormalities. Canberra: AGPS.
DHSH (Commonwealth Department of Human Services and Health) 1994b. Screening to prevent cervical cancer: guidelines for the management of women with screen detected abnormalities. Canberra: AGPS (Australian Government Publishing Service).
Dobson A, Kuulasmaa K, Eberle E & Scherer J 1991. Confidence intervals for weighted sums of Poisson parameters. Statistics in Medicine 10:457–62.
Doll R & Smith PG 1982. Comparison between cancer registries: age-standardised rates. In: Waterhouse J, Shanmugaratnam K, Muir C & Powell J (eds). Cancer incidence in five continents, vol. IV. Lyons: International Agency for Research on Cancer.
DPIE & DHSH (Department of Primary Industries and Energy and Department of Human Services and Health) 1994. Rural, remote and metropolitan areas classification. 1991 Census edition. Canberra: AGPS.
Hammond, Professor Ian. Presentation to consumers on ‘Screening to prevent cervical cancer: guidelines for the management of asymptomatic women with screen-detected abnormalities’, March 2005
Heley S 2007. Pap test update. Australian Family Physician 36(3):112–115.

90
National Cervical Screening Program (NCSP) 2004. Research report: survey and analysis of current practice in cervical histopathology. Screening Monograph No. 2/2004.
Jensen OM, Parkin DM, Machennan R & Muir C (eds) 1991. Cancer registration: principles and methods. Lyons: International Agency for Research on Cancer.
Marcus AC & Crane LA 1998. A review of cervical cancer screening intervention research: implications for public health programs and future research. Preventive Medicine 27:13–31.
Ostor AG & Mulvany N 1996. The pathology of cervical neoplasia. Current Opinion in Obstetrics and Gynecology 8:69–73.
Snider JA & Beauvais JE 1998. Pap smear utilization in Canada: estimates after adjusting the eligible population for hysterectomy status. Chronic Diseases in Canada 19(1):19–24.

91
List of tables
Table 1: Proportion of women participating in the National Cervical Screening Program in Australia by age, 1996–1997 to 2004–2005....................................................................................35
Table 2: Proportion of women participating in the National Cervical Screening Program by age, states and territories, 1996–1997 to 2004–2005.............................................................................36
Table 3: Number of women participating in the National Cervical Screening Program by age, states and territories, 2004–2005 ....................................................................................................37
Table 4: Proportion of women participating in the National Cervical Screening Program by age, states and territories, 2004–2005 ....................................................................................................38
Table 5: Number of women with repeat screenings following a normal Pap smear in Australian cohorts from 1996 to 2004...............................................................................................................39
Table 6: Percentage of women with repeat screenings following a normal Pap smear in Australian cohorts from 1996 to 2004 ...........................................................................................39
Table 7: Number of women with repeat screenings in the 21 months following a normal Pap smear in the 2004 cohort, by states and territories and Australia.............................................40
Table 8: Percentage of women with repeat screenings in the 21 months following a normal Pap smear in the 2004 cohort, by states and territories and Australia.............................................40
Table 9: Number of low- and high-grade abnormalities on histology for women aged 20–69 years, Australia, 1997–2005 .................................................................................................41
Table 10: Number of low- and high-grade abnormalities on histology for women aged 20–69 years, states and territories, 2005........................................................................................41
Table 11: Rate of histologically confirmed high-grade abnormalities per 1,000 women screened in Australia by age, 1997–2005 ...........................................................................................................42
Table 12: Rate of histologically confirmed high-grade abnormalities per 1,000 women screened by age, states and territories, 2005 ................................................................................................43
Table 13: Number of histologically confirmed high-grade abnormalities in Australia by age, 1997–2005..........................................................................................................................................44
Table 14: Number of histologically confirmed high-grade abnormalities by age, states and territories, 2005..............................................................................................................45
Table 15: Number of women screened, by age, 1997–2005 ........................................................................46 Table 16: Number of women screened, by age, states and territories, 2005.............................................47 Table 17: New cases of micro-invasive cervical cancer, by age, 1992–2003 .............................................48 Table 18: Age-specific and age-standardised incidence rates of micro-invasive cervical cancer, by
age, 1992–2003..................................................................................................................................49 Table 19: New cases of cervical cancer by age, 1992–2003..........................................................................50 Table 20: Age-specific and age-standardised incidence rates of cervical cancer, by age, 1992–2003 ...51 Table 21: New cases of cervical cancer by age, states and territories, 1996–1999....................................52 Table 22: Age-specific and age-standardised incidence rates of cervical cancer, states and
territories, 1996–1999.......................................................................................................................53 Table 23: Number of new cases of cervical cancer, by age, states and territories, 2000–2003 ...............54 Table 24: Age-specific and age-standardised incidence rates of cervical cancer, states and
territories, 1999–2002.......................................................................................................................55

92
Table 25: New cases of cervical cancer, by histological type for women aged 20–69 years, 1992–2003..........................................................................................................................................56
Table 26: Age-standardised incidence rates for cervical cancer, by histological type for women aged 20–69 years, 1992–2003 ..........................................................................................................56
Table 27: New cases of cervical cancer, by histological type for females, all ages, 1992–2003 ..............57 Table 28: Age-standardised incidence rates for cervical cancer, by histological type for females,
all ages, 1992–2003...........................................................................................................................57 Table 29: New cases of cervical cancer, by age and location, 1996–1999 and 1999–2003 .......................58 Table 30: Age-specific and age-standardised incidence rates for cervical cancer, by age and
location, 1995–1998 and 1999–2002 ...............................................................................................59 Table 31: Deaths from cervical cancer, by age, 1984–2004..........................................................................60 Table 32: Age-specific and age-standardised death rates for cervical cancer, by age, Australia,
1984–2004..........................................................................................................................................61 Table 33: Deaths from cervical cancer, by age, states and territories, 1997–2000 ....................................62 Table 34: Age-specific and age-standardised death rates for cervical cancer, by age, states and
territories, 1997–2000.......................................................................................................................63 Table 35: Deaths from cervical cancer, by age, states and territories, 2001–2004 ....................................64 Table 36: Age-specific and age-standardised death rates for cervical cancer, by age, states and
territories, 2001–2004.......................................................................................................................65 Table 37: Deaths from cervical cancer, by age and location, 1997–2000 and 2001–2004.........................66 Table 38: Age-specific and age-standardised death rates for cervical cancer, by age and location,
1997–2000 and 2001–2004 ...............................................................................................................67 Table 39: Number of deaths and age-specific and age-standardised death rates for cervical cancer,
by age and Indigenous status, Queensland, South Australia, Western Australia and Northern Territory, 2001–2004.......................................................................................................68
Table B1: Cervical cancer screening indicators data sources......................................................................71 Table D1: Australian Standard Population and WHO World Standard Population ..............................75 Table D2: Hysterectomy fractions for women aged 15–80+ years, Australia, 2001 ................................76

93
List of figures
Figure 1: Participation of women aged 20–69 years in the National Cervical Screening Program by 5-year age groups, 1996–1997 and 2004–2005 ..........................................................................3
Figure 2: Participation of women aged 20–69 years in the National Cervical Screening Program, 1996–1997, 2002–2003 and 2004–2005 .............................................................................................4
Figure 3: Proportion of women re-screening early following a normal Pap smear in Australian cohorts 1996–2004..............................................................................................................................7
Figure 4: Proportion of women who have screened again within 21 months following a normal Pap smear in the 2004 cohort, states and territories .....................................................................8
Figure 5: Ratio of histologically verified low-grade to high-grade abnormalities in women aged 20–69 years, 1997–2005....................................................................................................................12
Figure 6: Percentage of all screens by low- and high-grade status, 1997–2005 .......................................13 Figure 7: Ratio of low-grade to high-grade abnormalities in women aged 20–69 years, states and
territories, 1997, 2004 and 2005......................................................................................................14 Figure 8: Age-standardised numbers of histologically verified high-grade abnormalities detected
per 1,000 women screened aged 20–69, 1997–2005 .....................................................................16 Figure 9: Rate of histologically verified high-grade abnormalities detected per 1,000 women
screened, by age group, 1997 and 2005 ........................................................................................17 Figure 10: Age-standardised incidence rates for micro-invasive squamous cell cancer, women
aged 20–69 years, 1992–2003 ..........................................................................................................21 Figure 11: Age-specific incidence rates of micro-invasive squamous cell cancer, women aged
20–69 years, 2002 and 2003.............................................................................................................22 Figure 12: Age-standardised incidence rates of all cervical cancer (invasive squamous,
adenocarcinoma, adenosquamous and other cervical cancer), 1992–2003..............................23 Figure 13: Age-specific incidence rates of cervical cancer in women aged 20–69 years,
2002 and 2003 ...................................................................................................................................24 Figure 14: Age-standardised cervical cancer incidence rates in women aged 20–69 years, states
and territories, 1996–1999 and 2000–2003 ....................................................................................25 Figure 15: Age-standardised incidence rates of cervical cancer, by histological type, women aged
20–69 years, 1992 to 2003 ................................................................................................................26 Figure 16: Age-standardised incidence rates of cervical cancer in women aged 20–69 years, by
location, 1996–1999 and 2000–2003 ...............................................................................................27 Figure 17: Age-standardised death rates from cervical cancer, 1984–2004................................................29 Figure 18: Age-specific cervical cancer death rates by age group, 1991–1994 and 2001–2004 ...............30 Figure 19: Age-standardised cervical cancer death rates in women aged 20–69 years, states and
territories, 1997–2000 and 2001–2004 ............................................................................................31 Figure 20: Age-standardised cervical cancer death rates, by location, women aged 20–69 years,
1997–2000 and 2001–2004 ...............................................................................................................32 Figure 21: Age-standardised cervical cancer mortality rates by Indigenous status, women aged
20–69 years (Queensland, Western Australia, South Australia and Northern Territory), 2001–2004..........................................................................................................................................33