APPENDIX A –4 - Metropolitan Transportation … · Equity Analysis Report . Strategy for a...
119
2015 TIP September 24, 2014 APPENDIX A – 4 Regional Policies: Long-Range Planning / Plan Bay Area Equity Analysis Report
Transcript of APPENDIX A –4 - Metropolitan Transportation … · Equity Analysis Report . Strategy for a...

2015 TIP September 24, 2014
APPENDIX A – 4
R e g i o n a l P o l i c i e s : L o n g - R a n g e P l a n n i n g / P l a n B a y A r e a
Equity Analysis Report

Strategy for a Sustainable
Region
Equity Analysis Report Including Title VI, Environmental Justice
and Equity Analysis for Plan Bay Area
July 2013
Association of Bay Area Governments
Metropolitan Transportation Commission

Metropolitan Transportation CommissionAmy Rein Worth, ChairCities of Contra Costa County
Dave Cortese, Vice ChairSanta Clara County
Alicia C. AguirreCities of San Mateo County
Tom AzumbradoU.S. Department of Housing and Urban Development
Tom BatesCities of Alameda County
David CamposCity and County of San Francisco
Bill DoddNapa County and Cities
Dorene M. GiacopiniU.S. Department of Transportation
Federal D. GloverContra Costa County
Scott HaggertyAlameda County
Anne W. HalstedSan Francisco Bay Conservation and Development Commission
Steve KinseyMarin County and Cities
Sam LiccardoSan Jose Mayor’s Appointee
Mark LuceAssociation of Bay Area Governments
Jake MackenzieSonoma County and Cities
Joe Pirzynski Cities of Santa Clara County
Jean QuanOakland Mayor’s Appointee
Bijan SartipiState Business, Transportation and Housing Agency
James P. SperingSolano County and Cities
Adrienne J. TissierSan Mateo County
Scott WienerSan Francisco Mayor’s Appointee
Association of Bay Area GovernmentsSupervisor Mark Luce, County of NapaPresident
Mayor Julie Pierce, City of ClaytonVice President
Representatives From Each CountySupervisor Richard ValleAlameda
Supervisor Scott HaggertyAlameda
Supervisor Karen MitchoffContra Costa
Supervisor John GioiaContra Costa
Supervisor Katie RiceMarin
Supervisor Mark LuceNapa
Supervisor Eric MarSan Francisco
Supervisor Warren SlocumSan Mateo
Supervisor Dave PineSan Mateo
Supervisor Mike WassermanSanta Clara
Supervisor David CorteseSanta Clara
Supervisor Linda SeifertSolano
Supervisor David RabbittSonoma
Representatives From Cities In Each CountyMayor Bill Harrison, City of FremontAlameda
Mayor Tim Sbranti, City of DublinAlameda
Mayor Julie Pierce, City of ClaytonContra Costa
Councilmember Dave Hudson, City of San RamonContra Costa
Mayor Pat Eklund, City of NovatoMarin
Mayor Leon Garcia, City of American CanyonNapa
Mayor Edwin LeeCity And County of San Francisco
Jason Elliott, Director, Legislative/Government Affairs, Office of the MayorCity And County of San Francisco
Joaquin Torres, Office of the MayorCity And County of San Francisco
Councilmember Pedro Gonzalez, City of South San FranciscoSan Mateo
Vice Mayor Richard Garbarino, City of South San FranciscoSan Mateo
Councilmember Joe Pirzynski, City of Los GatosSanta Clara
Councilmember Ronit Bryant, City of Mountain ViewSanta Clara
Mayor Harry Price, City of FairfieldSolano
Mayor Jean QuanCity of Oakland
Councilmember Libby SchaafCity of Oakland
Councilmember Desley BrooksCity of Oakland
Councilmember Sam LiccardoCity of San Jose
Councilmember Kansen ChuCity of San Jose
Councilmember Ash KalraCity of San Jose
Advisory MembersWilliam KissingerRegional Water Quality Control Board
Plan Bay Area Equity Analysis Report Including Title VI, Environmental Justice, and Equity Analysis Results for Plan Bay Area
Metropolitan Transportation Commission Association of Bay Area Governments July 2013

PROJECT STAFF Ken Kirkey Director, MTC Planning
Miriam Chion Director, ABAG Planning and Research
Jennifer Yeamans MTC Project Manager and Primary Author
Marisa Raya ABAG Project Manager
Doug Johnson Principal Planner
Harold Brazil, Shimon Israel, David Ory Demographic Analysis, Travel and Air Quality Forecasting
Johnny Jaramaillo, Jason Munkres Housing, Economic, and Land Use Forecasting
Kearey Smith, Stella Wotherspoon, Michael Ziyambi GIS Analysis and Mapping
ACKNOWLEDGEMENT Special thanks to the Regional Equity Working Group for their careful review of the equity analysis methodology and valuable suggestions for improvements and refinements throughout the development of Plan Bay Area.

P L A N B A Y A R E A E Q U I T Y A N A L Y S I S R E P O R T i
Table of Contents
EXECUTIVE SUMMARY ................................................................................. ES-1
CHAPTER 1. INTRODUCTION ......................................................................... 1-1
1.1 Background and Purpose of This Report..................................................................................1-1
1.2 Legal, Regulatory, and Policy Context .....................................................................................1-2
1.3 Incorporating Equity Considerations Throughout the Plan Bay Area Process ..............................1-8
1.4 Contents of This Report ....................................................................................................... 1-11
CHAPTER 2. METHODOLOGY ......................................................................... 2-1
2.1 Definitions.............................................................................................................................2-2
2.2 Data Sources .........................................................................................................................2-7
2.3 EIR Alternatives ................................................................................................................... 2-11
2.4 Transportation Investment Analysis ...................................................................................... 2-16
2.5 Technical Performance Measures .......................................................................................... 2-22
CHAPTER 3. REGIONAL TRENDS ................................................................... 3-1
3.1 Communities of Concern Have Distinct Demographic and Socioeconomic Characteristics Compared to the Rest of the Region .......................................................................................3-1
3.2 The Region’s Demographics Continue to Diversify ...................................................................3-3
3.3 The Region’s Low-Income Population Continues to Grow and Decentralize; Income Trends Differ Across Age Groups .......................................................................................................3-5
3.4 Low Income Workers are More Likely to Commute by Transit and Work within Their County of Residence, but Auto Trips still Dominate Mode Share ...............................................................3-7
3.5 Housing and Transportation Costs Are Rising Faster Than Incomes ........................................ 3-10

i i T A B L E O F C O N T E N T S
CHAPTER 4. ANALYSIS RESULTS ................................................................... 4-1
4.1 Transportation Investment Analysis ........................................................................................4-3
4.2 Housing and Transportation Affordability .............................................................................. 4-15
4.3 Potential for Displacement ................................................................................................... 4-18
4.4 VMT and Emissions Density .................................................................................................. 4-21
4.5 Commute Time .................................................................................................................... 4-29
4.6 Non-Commute Time ............................................................................................................ 4-32
CHAPTER 5. SUMMARY AND CONCLUSIONS ................................................. 5-1
5.1 Title VI Analysis Results .........................................................................................................5-1
5.2 Environmental Justice Analysis Results ....................................................................................5-2
5.3 Overall Equity Analysis Results: EIR Alternatives ......................................................................5-3
5.4 Stakeholder Feedback ............................................................................................................5-6
CHAPTER 6. NEXT STEPS ............................................................................... 6-1
6.1 Complete Bay Area Regional Prosperity Plan to Help Guide Implementation of Plan Bay Area .....6-1
6.2 Implement Regional Programs That Invest Strategically to Enhance Mobility for Communities of Concern and Transportation-Disadvantaged Populations ......................................................6-2
6.3 Pursue State and Federal Advocacy Initiatives .........................................................................6-3
6.4 Update Key Regional Indicators Related to Equity to Aid in Monitoring Plan Bay Area Implementation .....................................................................................................................6-4
6.5 Continue to Refine Equity Analysis Methodologies....................................................................6-5

P L A N B A Y A R E A E Q U I T Y A N A L Y S I S R E P O R T i i i
LIST OF TABLES
Table 2-1. Target Populations and Thresholds Used in Overlapping-Factor Analysis ............................................. 2-5 Table 2-2. Population in Communities of Concern and Remainder of Region, 2010 and 2040 ................................ 2-7 Table 3-1. Demographic and Socioeconomic Profile of Communities of Concern .................................................. 3-2 Table 3-2. Bay Area Population by Race/Ethnicity, 2010 and 2040 ..................................................................... 3-3 Table 3-3. Bay Area Poverty Population, 2000 and 2010 ................................................................................... 3-5 Table 4-1. Regional System Usage and Population by Subgroup ........................................................................ 4-4 Table 4-2. Share of System Use by Mode by Subgroup (Regional Summary) ....................................................... 4-6 Table 4-3. Plan Bay Area Transit Investments by Population Subgroup ............................................................... 4-7 Table 4-4. Plan Bay Area Road, Highway, and Bridge Investments by Population Subgroup .................................. 4-7 Table 4-5. Plan Bay Area Transportation Investment Analysis Results by Population Subgroup, All Modes............. 4-8 Table 4-6. Plan Bay Area Federal and State Transit Investments by Minority Status ........................................... 4-14 Table 4-7. Disparate Impact Analysis Federal and State Transit Investments: Population Analysis ....................... 4-14 Table 4-8. Disparate Impact Analysis of Federal and State Transit Investments: Ridership Analysis ..................... 4-14 Table 4-9. Housing and Transportation Affordability Results for EIR Scenarios .................................................. 4-16 Table 4-10. Potential for Displacement: EIR Scenarios. ................................................................................... 4-19 Table 4-11. VMT Density Results by Community Type: EIR Scenarios ............................................................... 4-23 Table 4-12. Emissions Density Results by Pollutant by Community Type: EIR Scenarios ..................................... 4-25 Table 4-13. VMT Distribution Index Results by Community Type: EIR Scenarios ................................................ 4-26 Table 4-14. Emissions Distribution Index Results by Pollutant by Community Type: EIR Scenarios ...................... 4-26 Table 4-15. Average Commute Time Results in Minutes by Community Type: EIR Scenarios .............................. 4-29 Table 4-16. Commute Time Results by Community Type by Density Level: EIR Scenarios .................................. 4-31 Table 4-17. Average Non-commute Time Results in Minutes by Community Type: EIR Scenarios ........................ 4-32 Table 5-1. Summary of Environmental Justice Analysis Results for Plan Bay Area ................................................ 5-3 Table 5-2. Equity Analysis Results Summary for Plan Bay Area and EIR Alternatives ............................................ 5-4
LIST OF FIGURES
Figure 2-1. Location of Communities of Concern within the Region .................................................................... 2-6 Figure 3-1. Bay Area Population by Race/Ethnicity by Age Group, 2010 .............................................................. 3-4 Figure 3-2. Share of Bay Area Population by Poverty Ratio, 1990–2011 .............................................................. 3-6 Figure 3-3. Share of Total Population Under 200% of Poverty Level by Age Group, 2000 and 2010 ....................... 3-7 Figure 3-4. Commute Mode Share by Population or Community Type, 2010 ........................................................ 3-8 Figure 3-5. Work Location for Workers by Poverty Ratio, 2006–2010 .................................................................. 3-9 Figure 3-6. Share of Bay Area Households Spending More Than 30% of Income on Housing Costs, 1990–2011 ... 3-11 Figure 3-7. Inflation-Adjusted Bay Area Gas Prices, Transit Fares, and Per-Capita Income, 2000–2010 ................ 3-12 Figure 4-1. Plan Bay Area Investments by Mode, in Millions of Year-of-Expenditure Dollars ................................. 4-5 Figure 4-2. Plan Bay Area Projects Overlaid with Communities of Concern ........................................................ 4-11 Figure 4-3. Plan Bay Area Projects Overlaid with Above-Average-Minority Communities ..................................... 4-12 Figure 4-4. Public Transportation Investments from Federal and State Sources ............................................... 4-13

i v T A B L E O F C O N T E N T S
LIST OF APPENDICES
Appendix A. Detailed Methodology ................................................................................................... A-1
Appendix B. Demographic and Socioeconomic Data by County ......................................................... B-1
Appendix C. Project Mapping Results by County ................................................................................ C-1
Appendix D. Detailed Analysis Results .............................................................................................. D-1
P L A N B A Y A R E A E Q U I T Y A N A L Y S I S R E P O R T v
ABBREVIATIONS USED IN THIS REPORT
ABAG Association of Bay Area Governments
ACS American Community Survey
BAAQMD Bay Area Air Quality Management District
CARB California Air Resources Board
CARE Community Air Risk Evaluation Program
CEQA California Environmental Quality Act
CFR Code of Federal Regulations
CMA Congestion Management Agency
CMAQ Congestion Mitigation and Air Quality Improvement Program
DOF California Department of Finance
DOT United States Department of Transportation
EIR Environmental Impact Report
EJ Environmental justice
EO 12898 Executive Order 12898
FHEA Fair Housing Equity Assessment
FHWA Federal Highway Administration
FTA Federal Transit Administration
GHG Greenhouse gas
H+T Housing + Transportation (Costs/Affordability as a % of Income)
HUD United States Department of Housing and Urban Development
MAP-21 Moving Ahead for Progress in the 21st Century

v i T A B L E O F C O N T E N T S
MPO Metropolitan Planning Organization
MTC Metropolitan Transportation Commission
NEPA National Environmental Policy Act
OBAG OneBayArea Grant program
PDA Priority Development Area
PM Particulate matter
RHNA Regional Housing Needs Allocation
RTP Regional Transportation Plan
SAFETEA Safe, Accountable, Flexible, Efficient Transportation Equity Act
SB 375 Senate Bill 375 (Steinberg), Sustainable Communities and Climate Protection Act of 2008
SCS Sustainable Communities Strategy
STP Surface Transportation Program
TAC Toxic air contaminant
TAZ Travel analysis zone
TIP Transportation Improvement Program
Title VI Title VI of the Civil Rights Act of 1964
TOAH Bay Area Transit Oriented Affordable Housing Fund
TPP Transit Priority Project
USC United States Code
USDOT United States Department of Transportation
VMT Vehicle-miles of travel
YOE Year-of-expenditure (dollars)

P L A N B A Y A R E A E Q U I T Y A N A L Y S I S R E P O R T E S - 1
Executive Summary
INTRODUCTION AND BACKGROUND
This report documents the Equity Analysis results for Plan Bay Area, which includes both federally required nondiscrimination (Title VI) and environmental justice analyses, as well as analysis of the overall performance of the Draft Plan related to regional equity policy priorities identified by the Metropolitan Transportation Commission (MTC), the Association of Bay Area Governments (ABAG), and regional stakeholders. The ultimate goals of this report are to demonstrate MTC’s compliance as a metropolitan planning organization (MPO) with federal requirements related to Title VI and environmental justice in the Regional Transportation Plan (RTP) development process, and to help regional policymakers, local partners, and the general public understand the regional equity implications of implementing Plan Bay Area for the region’s disadvantaged communities of concern (as they are defined in this report), by examining the distribution of benefits and burdens between communities of concern and the rest of the region under the Plan.
This report is one of several activities supporting regional equity objectives that MTC and ABAG carry out in their regional planning efforts, ranging from public outreach to technical analysis, policy and program development, and implementation and monitoring activities.
METHODOLOGY
This report includes a combination of modeled technical performance measures and off-model analysis to carry out three distinct but related analyses of the draft Plan Bay Area. The methodologies used were designed with extensive input from the Regional Equity

E S - 2 E X E C U T I V E S U M M A R Y
Working Group and other interested stakeholders. These analyses, all of which are carried out at a regional, programmatic level, include:
• A Title VI analysis of the Plan’s investments in public transportation using federal and state funding sources, to determine whether there are any disparate impacts of the distribution of these funds on the basis of race, color, or national origin;
• An environmental justice analysis that uses both an off-model investment analysis and modeled performance measures to determine whether the draft Plan has disproportionately high and adverse effects on low-income and minority populations and/or communities of concern; and
• An equity analysis examining the distribution of benefits and burdens of the Draft Plan between communities of concern and the remainder of the region, with special emphasis on comparing the distribution of impacts between the Draft Plan and the No Project (business-as-usual) alternatives of the Plan Bay Area Draft Environmental Impact Report to characterize the specific impacts of adopting the Plan versus what is forecast to occur in the future if the Plan is not adopted.
Defining Communities of Concern Based on input from the Regional Equity Working Group, this report defines “communities of concern” as census tracts having either 1) significant concentrations of both low-income and minority residents, or 2) significant concentrations of any four or more of the following: minority persons, low-income persons below 200% of the federal poverty level (about $44,000 per year for a family of four), persons with Limited English Proficiency, zero-vehicle households, seniors aged 75 and over, persons with a disability, single-parent families, and housing units occupied by renters paying more than 50% of household income on rent. Based on this definition, 20% of the region’s population is characterized as living in communities of concern, and 80% live in the remainder of the region.
Transportation Investment Analysis To inform MTC’s Title VI and environmental justice requirements and policies, this report includes an analysis of the distribution of the proposed RTP investments relative to the region’s low-income and minority populations and communities of concern. These include:
• A population/use-based analysis, which compares the estimated share of regional investments benefiting low-income and minority populations to these populations’ respective shares of the region’s population as a whole, and these

P L A N B A Y A R E A E Q U I T Y A N A L Y S I S R E P O R T E S - 3
populations’ relative usage of the regional transportation system (both roadways and transit).
• A project mapping analysis, which overlays mappable RTP projects against communities of concern as well as census tracts with concentrations of minority populations that are above the regional average.
Technical Performance Measures To compare potential outcomes across the various planning scenarios analyzed in this report, a set of five technical performance measures were recommended by Regional Equity Working Group members for inclusion in the equity analysis, based on their relevance to priority equity concerns identified by Working Group members. These measures are:
• Housing and Transportation Affordability • Potential for Displacement • Density of Vehicle Travel (VMT Density) • Average Commute Time • Average Non-Commute Time
The basic methodology for assessing the equity impacts of Plan Bay Area in terms of outcomes is:
1. Identify each of the region’s 1,454 traffic analysis zones as either being in a community of concern or the remainder of the region.
2. Extract indicator variables for both communities of concern and the remainder of the region for each alternative analyzed (this report focuses on analyzing the alternatives studied in the Plan Bay Area Draft Environmental Impact Report).
3. Evaluate results to assess (among other questions): • whether the Project has a beneficial impact on communities of concern; and • whether communities of concern receive similar or greater benefit compared
to the remainder of the region under the proposed Plan (the Project), relative to the No Project alternative.
REGIONAL TRENDS
To provide more in-depth context for analyzing long-range outcomes for minority and low-income populations and communities of concern, this report also summarizes key regional demographic and socioeconomic trends, with particular emphasis on commuting and travel habits of these populations, and recent trends in housing and transportation affordability.

E S - 4 E X E C U T I V E S U M M A R Y
Key findings include:
• Communities of concern have distinct demographic and socioeconomic characteristics compared to the rest of the region. In particular, low-income persons, Limited English Proficiency persons, and zero-vehicle households are twice as likely to live in communities of concern compared to the population in general.
• The region’s demographics continue to diversify. In 2010, 58% of the region’s population was a member of one or more minority groups, a share that is forecast to rise to 66% by 2040. Demographics also vary substantially across age groups. Bay Area residents 65 and over are twice as likely to be white and non-Hispanic than those under 18, while a Bay Area resident under 18 is more than three times more likely than a resident 65 or over to be of Hispanic or Latino origin.
• The region’s low-income population continues to grow and decentralize; income trends differ across age groups. Between 2000 and 2010, the region’s low-income population (below 200% of the poverty level) grew by more than 430,000, an increase of 32%. During this same period, the region’s non-low-income population (above 200% of poverty) fell in absolute terms by nearly 30,000 residents. Suburbanization of the region’s low-income population also continues: in 2011, 36%of the region’s low-income population lived in the region’s three largest cities of San Jose, San Francisco, and Oakland, down from 43% in 1990. Across various age groups, youth under 18 were most likely to be low-income (31% compared to the regional average of 26%).
• Low-income workers are more likely to commute by transit and work within their county of residence, but auto trips still dominate mode share. Despite variations in non-automobile commute modes such as transit, walking, and biking between different demographic and socioeconomic groups, more than two thirds of workers across all populations and community types commute by car. Low-income workers are also more likely than higher-income workers to commute within their county of residence, and less likely to have Transbay commutes.
• Housing and transportation costs are rising faster than incomes. The share of households paying more than 30% of income on housing costs has risen from 34% in 2000 to 43% in 2011. For renters, the share is slightly greater; in 2011, nearly half of the region’s renters (49%) paid more than 30% of their income on rent. At the same time, day-to-day transportation costs have risen relative to incomes since 2000. After adjusting for inflation between 2000 and 2010, the average transit fare paid in the region rose 34%, the average retail price of a gallon of gas rose 30%, while per-capita income in the region fell by 12%.

P L A N B A Y A R E A E Q U I T Y A N A L Y S I S R E P O R T E S - 5
ANALYSIS RESULTS
Transportation Investment Analysis: Key Findings The population/use-based analysis of the overall RTP investment strategy found that in most cases, low-income and minority populations are receiving a similar or greater share of Plan investments relative to their overall share of the region’s population and trips, as shown in Table ES-1.
Table ES-1. Plan Bay Area Transportation Investment Analysis Results by Population Subgroup,
All Modes
Subgroup
Total Plan Bay Area Funding
(Millions of YOE $)
% of Total Funding
% of Average
Daily Regional
Trips
% of Total Regional
Population Minority Minority $149,119 54% 43% 58% Status Non-minority $128,580 46% 57% 42% Total $277,699 100% 100% 100% Low-Income Low-Income $109,445 39% 18% 31% Status Not Low-Income $168,254 61% 82% 69% Total $277,699 100% 100% 100%
Source: MTC analysis of Plan Bay Area investments, 2000 Bay Area Travel Survey, 2010 Census SF1, 2010 American Community Survey Public Use Microdata Sample 1-Year Estimates.
Only in the case of the region’s minority population as a whole does a target group receive a slightly smaller share of regional funding (54%) relative to population as a whole (58%). This result appears to be due mainly to differences in overall regional demographics captured between the 2000 Bay Area Travel Survey (which was weighted according to the region’s 2000 Census population, which was then 50% minority) used to allocate funding on the basis of usage, and the 2010 Census (58% minority) used for the overall regional population comparison.
Similarly, the project mapping analysis did not reveal any systematic exclusion of communities of concern or minority communities or imbalance in the spatial distribution of projects throughout the region.
Finally, the Title VI disparate-impact analysis revealed that on a per-capita population basis, minority persons in the region are receiving 120% of the benefit of Plan Bay Area’s investments in public transportation from Federal and State sources compared to non-minority persons. On a ridership basis, minority riders are receiving 99% of the benefit of Federal- and State-funded transit investments in Plan Bay Area compared to non-minority

E S - 6 E X E C U T I V E S U M M A R Y
riders. This 1% difference between minority and non-minority per-rider benefits is not considered statistically significant, and therefore this analysis found no disparate impact in the distribution of Federal and State funding for public transportation purposes between minority and non-minority populations or riders in the draft Plan investment strategy.
Technical Performance Measures: Key Findings Results of the analysis of five technical performance measures were intended to compare outcomes under different planning scenarios, including the Draft Plan, for communities of concern (or low-income households) compared to the rest of the region. A comparison of the distribution of impacts between the Draft Plan and the No Project (business-as-usual) alternatives characterize the specific impacts of adopting the Plan versus what is forecast to occur in the future if the Plan is not adopted.
Table ES-2 summarizes the results of the five technical performance measures for the EIR alternatives studied, with key findings from each noted below.
Table ES-2. Summary of Equity Analysis Technical Performance Measures: EIR Scenarios
2010 1 2 3 4 5 % Change
Measure Target Population Base Year
No Project
Draft Plan
(Project)
Transit Priority Focus
Network of Comm.
Env., Equity & Jobs
Base Year to Project
No Project
to Project
Housing + Transportation Affordability
Households <$38,000/yr 72% 80% 74% 77% 74% 73% 3% -7%
Households >$38,000/yr 41% 44% 43% 43% 42% 43% 4% -4%
Potential for Displacement
Communities of Concern n/a 21% 36% 25% 31% 21% n/a 68%
Remainder of Region n/a 5% 8% 7% 9% 6% n/a 67%
VMT Density Communities of Concern 9,737 11,447 11,693 11,536 12,123 11,259 20% 2%
Remainder of Region 9,861 11,717 11,895 11,804 12,261 11,626 21% 2%
Average Commute Time
Communities of Concern 25 26 26 25 26 25 5% -1%
Remainder of Region 27 29 27 26 27 27 2% -6%
Average Non-Commute Time
Communities of Concern 12 13 13 13 13 13 5% 0%
Remainder of Region 13 13 13 13 13 13 1% 0%
Source: MTC and ABAG estimates.
Housing and Transportation Affordability This measure estimates current and future combined housing and transportation costs as a share of household income for the region’s low-income households (earning less than $38,000 a year in 2010 dollars) compared to non-low-income households (earning more than $38,000 a year). These costs vary by alternative depending on future locations of households and employment, and availability of transportation options by location. All future-year scenarios forecast an increase in the combined share of income spent by
P L A N B A Y A R E A E Q U I T Y A N A L Y S I S R E P O R T E S - 7
households on housing and transportation relative to the base year, due especially to assumptions about increases in the cost of fuel in the future, since housing costs as a share of income are assumed to remain similar to today based on a variety of policy and planning assumptions included in the analysis.
In comparison to the No Project alternative, low-income households see a proportionally greater improvement in affordability under the Project (a 7% reduction in housing and transportation costs as a share of income) than non-low-income households (a 4% reduction in percent of income spent on housing and transportation).
Potential for Displacement The Potential for Displacement measure estimates what percentage of today’s overburdened renters (those households spending more than half their incomes on rent) currently live in communities where more intensive planned housing growth is forecast by 2040 (defined as an 30% or greater increase in housing units relative to today, or slightly above the regional average of 27% growth). It is intended to capture, at a neighborhood level, where clusters of vulnerable renters live today in relation to neighborhoods that may face upward market pressures in the future based on planned growth patterns. However, it is not a prediction that displacement will actually occur.
For communities of concern, the No Project and the Environment, Equity, and Jobs Scenarios have the least overlap between planned high-growth tracts and existing concentrations of overburdened renters. The Enhanced Network of Communities alternative and the Project have the greatest share of today’s overburdened renters included in tracts where these characteristics overlap. This measure’s calculation relies on a measure of future growth and there is no relevant comparison measure for the base year.
Comparing the Project to the No Project alternative, the focused-growth approach of the Project increases the displacement potential by approximately two-thirds, however this effect, while adverse, is not disproportionately high for communities of concern (68%) when compared to the remainder of the region (67%).
VMT and Emissions Density The VMT Density measure is intended to quantify the effects of vehicle-miles of travel (VMT) in and near communities. It is a measure of the total VMT on major roadways located in or near residential and commercial areas; the result is expressed as an average VMT per square kilometer of developed land within 1,000 feet of major roadways. As a related measure, vehicle emissions were also estimated and analyzed.

E S - 8 E X E C U T I V E S U M M A R Y
Generally, all future-year scenarios have higher VMT Density compared to the base year, mainly owing to the increased population in 2040.
The Draft Plan has slightly greater VMT Density results than the No Project, both in communities of concern as well as the remainder of the region. This result may be due to the more focused growth pattern of the Plan putting more travel demand on already heavily used roadways that are near populated areas, whereas the No Project scenario would shift more of this demand to more dispersed parts of the region.
Comparing the distribution of impacts of the Draft Plan between communities of concern and the remainder of the region, relative to the No Project scenario the Plan has a similar impact on both communities of concern and the remainder of the region. VMT Density increases by 2% for all communities of concern as well as for the remainder of the region.
Average Commute Time This measure provides average travel time in minutes per commute trip for all modes, based primarily on the locations of a worker’s residence and place of work and choice of travel mode. Generally, comparing travel time between home and work provides an indication of the proximity of jobs and housing and transportation options available for different groups under the various alternatives studied.
Generally, there is not much variation between scenarios overall, and all future-year scenarios have increased travel times relative to the base year. Most of the variations in commute time are likely related to two factors: (1) increased population overall increases congestion overall in the future (especially in the urban core), slowing travel speeds and hence increasing travel times for most modes; and (2) some automobile trips shift to non-auto modes that are generally slower on average than auto travel.
Comparing the Draft Plan to the No Project, communities of concern see a slightly smaller reduction in commute time relative to the remainder of the region, mainly due to the overall focused-growth emphasis of the Plan impacting both travel speeds and mode choice as described above. However, to the extent that under the Draft Plan more trips shift from autos to less-expensive transit, walking, and biking modes, the cost-savings benefits of those mode shifts may outweigh the otherwise negligible increase in travel time for residents of communities of concern.
Average Non-Commute Time The measure of average travel time in minutes for non-commute trips is intended to be a measure of overall equitable mobility. Although commute trips are generally longer in time and length, more trips taken overall are non-commute trips, and include activities such as

P L A N B A Y A R E A E Q U I T Y A N A L Y S I S R E P O R T E S - 9
shopping, going to medical appointments, social and recreational trips, and other kinds of personal business that does not start or end at one’s place of work or school, such as leaving one’s house, going to the grocery store, and returning home.
Across the scenarios, there is even less variation than was seen in the Commute Time results. Although a slight increase is noted in average travel times for communities of concern relative to the base year, there is a negligible difference between communities of concern and the remainder of the region in comparing the Draft Plan to the No Project.
SUMMARY AND CONCLUSIONS
As described in the Methodology section, this report includes three distinct but related analyses: a Title VI analysis, an environmental justice analysis, and an overall equity analysis. Results and conclusions of each analysis are summarized below.
Title VI Analysis Results Following FTA guidance, MTC’s disparate impact analysis of the Plan Bay Area draft investment strategy revealed that on a per-capita population basis, minority persons in the region are receiving 120% of the benefit of the Draft Plan’s investments in public transportation from Federal and State sources compared to non-minority persons. On a transit-ridership basis, minority transit riders receive 99% of the benefit of Federal- and State-funded transit investments compared to non-minority transit riders. This 1% difference between minority and non-minority per-rider benefits is not considered statistically significant, and therefore this analysis found no disparate impact in the distribution of Federal and State funding for public transportation purposes between minority and non-minority populations or riders in the draft Plan’s investment strategy.
Environmental Justice Analysis Results Under Executive Order 12898 and the associated DOT Order on Environmental Justice, MTC’s responsibility is to assist DOT, FHWA, and FTA in their mission “to avoid, minimize, or mitigate disproportionately high and adverse human health and environmental effects, including social and economic effects,” on EJ populations.
To summarize the environmental justice analysis, therefore, Table ES-3 presents the results of each of the performance measures analyzed in relation to whether the Draft Plan (a) poses adverse effects to EJ populations relative to the No Project scenario and (b) if so, whether the effect is disproportionately high.

E S - 1 0 E X E C U T I V E S U M M A R Y
Table ES-3. Summary of Environmental Justice Analysis Results for Plan Bay Area.
Performance Measure
Does the Project Have an Adverse Effect on EJ
Populations?
Is Any Adverse Effect on EJ Populations Disproportionately
High?
Comple-mentary
Policies or Actions
Transportation Investment Analysis No No None
Housing and Transportation Affordability No No None
Potential for Displacement Yes No See Section 4.3
VMT Density Yes No See Section 4.4
PM10 Density Yes No "
PM2.5 Density No No "
Diesel PM Density No No "
Commute Time No No None
Non-commute Time No No None
Although none of the measures analyzed found a disproportionately high and adverse effect on EJ populations, in cases where the analysis found there was an adverse effect (even if not a disproportionately high one), mitigation measures or regional policies are nevertheless identified in this report as proposed actions to address two measures in particular where EJ populations already bear high burdens, notably the Potential for Displacement Measure (see Chapter 4, Section 4.3) and the VMT and Emissions Density measures (see Chapter 4, Section 4.4).
Overall Equity Analysis Results Beyond federal nondiscrimination and environmental-justice requirements discussed in the previous sections, Regional Equity Working Group members and other stakeholders felt strongly that Plan Bay Area should aim to reduce any existing disparities between communities of concern and the remainder of the region.
In order to summarize the analysis results in these terms, Table ES-4 lists each performance measure that was analyzed for all EIR alternatives and determines:
1. Whether a disparity currently exists at the regional level between communities of concern and the remainder of the region;
2. Whether the Draft Plan reduces any existing disparity; and

P L A N B A Y A R E A E Q U I T Y A N A L Y S I S R E P O R T E S - 1 1
3. Whether the Draft Plan performs better than the other alternatives studied. Table ES-4. Equity Analysis Results Summary for Plan Bay Area and EIR Alternatives
Performance Measure
Is There an Existing Regional Disparity
Between Communities of Concern and the Remainder of the
Region?
Does the Draft Plan Reduce Any Existing
Regional Disparity?
Does the Draft Plan Perform
Better Than Other Alternatives?
Housing and Transportation Affordability Yes* Yes No
Potential for Displacement Yes** No No
VMT Density No No No
Commute Time No No No
Non-commute Time No No No
* Low-income vs. non-low-income households analyzed rather than communities of concern for this measure. ** The existing disparity is characterized here as communities of concern currently having a higher share of overburdened-renter households than the remainder of the region.
Stakeholder Feedback The Regional Equity Working Group, along with other stakeholder groups, noted that the Environment, Equity, and Jobs scenario appeared to outperform the other scenarios, including the Draft Plan, across the Equity Analysis measures. Still, the Equity Working Group’s feedback also focused on overarching concerns about challenges to the provision of affordable housing in the region and displacement pressures that were found to be present to some degree in all scenarios analyzed.
NEXT STEPS
Some of the next steps that MTC and ABAG may take or consider taking to build upon the findings and conclusions of the Plan Bay Area equity analysis include:
• Complete Bay Area Regional Prosperity Plan to help guide implementation of Plan Bay Area.
• Implement regional programs that invest strategically to enhance mobility for communities of concern and transportation-disadvantaged populations.
• Pursue state and federal advocacy initiatives related to supporting and improving the region’s affordable housing and transportation options.
• Update key regional indicators related to equity to aid in monitoring Plan Bay Area implementation.

E S - 1 2 E X E C U T I V E S U M M A R Y
• Continue to refine equity analysis methodologies.

P L A N B A Y A R E A E Q U I T Y A N A L Y S I S R E P O R T 1 - 1
Chapter 1. Introduction
1.1 BACKGROUND AND PURPOSE OF THIS REPORT
This report documents the Equity Analysis results for Plan Bay Area, which includes both federally required nondiscrimination (Title VI) and environmental justice analyses, as well as analysis of the overall performance of the Draft Plan related to regional equity policy priorities identified by the Metropolitan Transportation Commission (MTC), the Association of Bay Area Governments (ABAG), and regional stakeholders. The ultimate goals of this report are to demonstrate MTC’s compliance as a metropolitan planning organization (MPO) with federal requirements related to Title VI and environmental justice in the Regional Transportation Plan (RTP) development process, and to help regional policymakers, local partners, and the general public understand the regional equity implications of implementing Plan Bay Area for the region’s disadvantaged communities of concern (as they are defined in this report), by examining the distribution of benefits and burdens between communities of concern and the rest of the region under the Plan.
SB 375 Links Regional Housing and Land Use Planning with Transportation Investments Although MTC has performed federally required environmental justice and/or equity analyses of past RTPs since 2001, Plan Bay Area is the first RTP to be developed with a Sustainable Communities Strategy (SCS) under California State Senate Bill (SB) 375. SB375 went into effect in 2009 to help achieve the goal of reducing greenhouse gas (GHG) emissions to levels established by the California Air Resources Board and mandated under

1 - 2 C H A P T E R 1 | I N T R O D U C T I O N
AB 32. The Bay Area’s per-capita GHG emission reduction targets are –7 percent in 2020 and –15 percent in 2035 from 2005 levels.
The primary purpose of SB 375 is to integrate land-use and transportation planning to help lower GHG emissions and vehicle-miles traveled through the development of an SCS that links future development, including housing for all income categories, with investments in the regional transportation network.
1.2 LEGAL, REGULATORY, AND POLICY CONTEXT
The contents of this report are intended to satisfy several federal requirements as well as regional policy objectives outlined in this section. At the federal level are civil rights protections afforded to persons against discrimination in federal programs on the basis of race, color, or national origin; and federal environmental justice objectives aimed at avoiding disproportionately high and adverse effects on minority and low-income populations. At the regional level are MTC’s own adopted environmental justice principles in addition to numerous other, ongoing efforts by MTC and ABAG to incorporate social equity throughout the agencies’ regional planning efforts, including Plan Bay Area. This section describes each set of requirements and summarizes MTC’s specific responsibilities and commitments in each area.
Title VI of the Civil Rights Act of 1964: The Right of Non-discrimination in Federally Funded Programs on the Basis of Race, Color, or National Origin This section discusses the relationship between Title VI, its requirements, and the development of the RTP.
What Is Covered under Title VI? Title VI of the Civil Rights Act of 1964 states that “[n]o person in the United States shall, on the ground of race, color, or national origin, be excluded from participation in, be denied the benefits of, or be subjected to discrimination under any program or activity receiving Federal financial assistance.”1 Title VI further authorizes Federal agencies that make grants (for example, the U.S. Department of Transportation) to promulgate regulations to effectuate compliance with the law’s provisions.
1 42 U.S.C. §2000d.

P L A N B A Y A R E A E Q U I T Y A N A L Y S I S R E P O R T 1 - 3
What Are MTC’s Responsibilit ies? As a recipient of U.S. Department of Transportation (DOT) funds, MTC is responsible for complying with DOT regulations related to Title VI2 (see sidebar). In October 2012, the Federal Transit Administration (FTA) issued a new Circular with guidance to its recipients for compliance with federal Title VI requirements.3 This guidance lays out requirements for FTA’s recipients, including metropolitan planning organizations (MPOs) such as MTC, to ensure that their programs, policies, and activities comply with DOT’s Title VI regulations. The guidance offers several specific requirements that MPOs must submit to the State and to FTA as part of their overall Title VI Programs, including:
1. “All general requirements set out in [the General Requirements section of the] Circular.
2. “A demographic profile of the metropolitan area that includes identification of the locations of minority
2 49 CFR part 21. 3 Federal Transit Administration Circular 4702.1B, Title VI Requirements and Guidelines for Federal Transit Administration Recipients: http://www.fta.dot.gov/documents/FTA_Title_VI_FINAL.pdf.
U.S. Department of Transportation Title VI Regulations
Specific discriminatory actions prohibited under DOT Title VI regulations include:
(1) A recipient under any program to which this part applies may not, directly or through contractual or other arrangements, on the grounds of race, color, or national origin.
(a) Deny a person any service, financial aid, or other benefit provided under the program;
Provide any service, financial aid, or other benefit to a person which is different, or is provided in a different manner, from that provided to others under the program;
(b) Subject a person to segregation or separate treatment in any matter related to his receipt of any service, financial aid, or other benefit under the program;
(c) Restrict a person in any way in the enjoyment of any advantage or privilege enjoyed by others receiving any service, financial aid, or other benefit under the program;
(d) Treat a person differently from others in determining whether he satisfies any admission, enrollment, quota, eligibility, membership, or other requirement or condition which persons must meet in order to be provided any service, financial aid, or other benefit provided under the program;
(e) Deny a person an opportunity to participate in the program through the provision of services or otherwise or afford him an opportunity to do so which is different from that afforded others under the program; or
(f) Deny a person the opportunity to participate as a member of a planning, advisory, or similar body which is an integral part of the program.
(2) A recipient, in determining the types of services, financial aid, or other benefits, or facilities which will be provided under any such program, or the class of person to whom, or the situations in which, such services, financial aid, other benefits, or facilities will be provided under any such program, or the class of persons to be afforded an opportunity to participate in any such program; may not, directly or through contractual or other arrangements, utilize criteria or methods of administration which have the effect of subjecting persons to discrimination because of their race, color, or national origin, or have the effect of defeating or substantially impairing accomplishment of the objectives of the program with respect to individuals of a particular race, color, or national origin.

1 - 4 C H A P T E R 1 | I N T R O D U C T I O N
populations in the aggregate;… 3. “A description of the procedures by which the mobility needs of minority populations
are identified and considered within the planning process; 4. “Demographic maps that overlay the percent minority and non-minority populations
as identified by Census or ACS data … and charts that analyze the impacts of the distribution of State and Federal funds in the aggregate for public transportation purposes…;
5. “An analysis of impacts identified in paragraph (4) that identifies any disparate impacts on the basis of race, color, or national origin, and, if so, determines whether there is a substantial legitimate justification for the policy that resulted in the disparate impacts, and if there are alternatives that could be employed that would have a less discriminatory impact.”4
Specific methods MTC uses in addressing these requirements for the RTP are included in Chapter 2, Methodology, under Section 2.4, Transportation Investment Analysis. In addition to analyzing the long-range Plan as described in this report, MTC’s Title VI program includes a variety of commitments to ensure nondiscrimination on the basis of race, color, or national origin in its programs and activities.5
Environmental Justice: Avoiding, Minimizing, or Mitigating Disproportionately High and Adverse Effects on Low-Income and Minority Populations Environmental justice is a concept related to civil rights but distinct from Title VI. Whereas Title VI provides legal protection from discrimination in Federal programs on the basis of race, color, or national origin, environmental justice in the context of this Plan relates to an administrative framework for Federal agencies to ensure their programs and activities incorporate environmental justice principles and do not disproportionately burden low-income and minority populations.
The environmental justice movement emerged following the broader environmental movement of the 1960s and 1970s, out of concern that predominantly minority and low-income communities were bearing disproportionate environmental burdens relative to their non-minority and non-low-income counterparts. In this sense, the “justice” aspect of environmental justice is rooted in the basic concept of fairness in terms of the distribution
4 FTA Circular 4702.1B, page VI-1f. 5 For more information, see MTC’s Title VI page at: http://www.mtc.ca.gov/get_involved/rights/title_VI.htm.

P L A N B A Y A R E A E Q U I T Y A N A L Y S I S R E P O R T 1 - 5
of environmental benefits and burdens, and seeks to promote participation of community members in the decision-making processes that affect them.
What Is Covered under Environmental Justice? In an effort to address environmental justice concerns mounting across the country during the 1980s and early 1990s, President Clinton signed Executive Order 12898, Federal Actions To Address Environmental Justice in Minority Populations and Low-Income Populations, in 1994. This Order directed each Federal agency to “make achieving environmental justice part of its mission by identifying and addressing, as appropriate, disproportionately high and adverse human health or environmental effects of its programs, policies, and activities on minority populations and low-income populations…”6 Furthermore, the Executive Order directed each Federal agency to develop an agency-wide environmental justice strategy.
Accordingly, the U.S. DOT issued its original Environmental Justice Order in April 1997, establishing its overall strategy and procedures to comply with EO 12898. In response to the August 4, 2011, Memorandum of Understanding on Environmental Justice signed by heads of Federal agencies, DOT issued its revised environmental justice strategy, DOT Order 5610.2(a), in March 2012, in an effort to (as described in the MOU) “renew the process under Executive Order 12898 for agencies to provide environmental justice strategies and implementation progress reports…”7 This updated DOT Order places responsibility on the head of each Operating Administration within DOT to determine whether programs, policies, or activities for which they are responsible will have an adverse human health or environmental effect on minority and low-income populations and whether that adverse effect will be disproportionately high.
As operating administrations within DOT, the Federal Highway Administration (FHWA) and Federal Transit Administration (FTA) both define three fundamental environmental justice principles consistent with the Executive and DOT Orders as follows:8
• To avoid, minimize, or mitigate disproportionately high and adverse human health and environmental effects, including social and economic effects, on minority populations and low-income populations.
6 Executive Order 12898 (1994, Clinton). 7 Memorandum of Understanding on Environmental Justice and Executive Order 12898, available at: http://www.epa.gov/compliance/ej/resources/publications/interagency/ej-mou-2011-08.pdf. 8 See http://www.fhwa.dot.gov/environment/environmental_justice/ej_at_dot/.

1 - 6 C H A P T E R 1 | I N T R O D U C T I O N
• To ensure the full and fair participation by all potentially affected communities in the transportation decision-making process.
• To prevent the denial of, reduction in, or significant delay in the receipt of benefits by minority and low-income populations.
The DOT Order further defines “disproportionately high and adverse effect on minority and low-income populations” as an adverse effect that:
1. is predominately borne by a minority population and/or a low-income population, or 2. will be suffered by the minority population and/or low-income population and is
appreciably more severe or greater in magnitude than the adverse effect that will be suffered by the non-minority population and/or non-low-income population.
In June 2012, FHWA released a new and updated Order 6640.23A, FHWA Actions to Address Environmental Justice in Minority Populations and Low-Income Populations.9 This Order clarifies FHWA’s environmental justice policies, guidance, and responsibilities consistent with the updated DOT Order.
In August 2012, FTA released final guidance in the form of a Circular on incorporating environmental justice principles into plans, projects, and activities that receive funding from FTA.10 This final guidance provides recommendations to recipients of FTA funds, including metropolitan planning organizations, on how to fully engage environmental justice populations in the public transportation decision-making process; how to determine whether environmental justice populations would be subjected to disproportionately high and adverse human health or environmental effects as a result of a transportation plan, project, or activity; and how to avoid, minimize, or mitigate these effects.
MTC’s Environmental Justice Principles In addition to MTC’s long-standing commitment to supporting DOT, FHWA, and FTA in fulfilling their environmental justice mission under the Executive Order, MTC’s commitment to environmental justice is embodied in two Environmental Justice Principles adopted by the Commission in 2007. Developed in a collaborative process involving
9 FHWA Order 6640.23A, available at: http://www.fhwa.dot.gov/legsregs/directives/orders/664023a.htm. 10 FTA Circular 4703.1,Environmental Justice Policy Guidance for Federal Transit Administration Recipients, available at: http://www.fta.dot.gov/legislation_law/12349_14740.html.

P L A N B A Y A R E A E Q U I T Y A N A L Y S I S R E P O R T 1 - 7
regional environmental-justice stakeholders and transportation agencies, the adopted principles affirm MTC’s ongoing commitments to:
1. Create an open and transparent public participation process that empowers low-income communities and communities of color to participate in decision making that affects them.
2. Collect accurate and current data essential to defining and understanding the presence and extent of inequities, if any, in transportation funding based on race and income.
What Are MTC’s Responsibilit ies? Recipients’ responsibilities related to environmental justice are part of FTA’s annual Master Agreement, which requires recipients, including MTC, to promote environmental justice by following and facilitating FTA’s compliance with EO 12898, and following DOT’s Order on environmental justice. MTC fulfills these responsibilities through a range of programs and activities that support environmental justice principles, including:
• Identifying mobility needs of low-income and minority communities through MTC’s Community Based Transportation Planning Program.
• Developing and implementing MTC’s Public Participation Plan, which lays out specific strategies for engaging low-income and minority populations and other traditionally underrepresented stakeholders throughout the metropolitan planning process.
• Conducting an environmental justice analysis of the RTP (as summarized in this report), including an analysis of the distribution of regional transportation investments for low-income and minority populations, and analysis of benefits and burdens using technical performance measures to determine whether the proposed investment strategy may present any disproportionately high and adverse human health and environmental effects on environmental justice populations.
• Continually refining and updating the data and analytical methods required to carry out environmental justice analysis at the regional, programmatic level, incorporating both stakeholder feedback and ongoing improvements in analytical technologies and data collection.
Additional information on these and other activities as they relate specifically to Plan Bay Area is provided in the following section.

1 - 8 C H A P T E R 1 | I N T R O D U C T I O N
1.3 INCORPORATING EQUITY CONSIDERATIONS THROUGHOUT THE PLAN BAY AREA PROCESS
Equity has been a recurring theme throughout the development of Plan Bay Area, starting with the overarching framework of the “3 Es” of sustainability, which aim to balance environmental, equity, and economic needs and concerns to guide the region’s overarching policy goals for the Plan. This section describes specific areas of policy development and stakeholder involvement related to equity in Plan Bay Area.
Performance Targets: Setting the Region’s Priorities with Equity in Mind MTC and ABAG each have a long-established practice of applying performance-based approach to long-range planning and forecasting activities. The starting vision for the performance of Plan Bay Area was to reduce greenhouse gas emissions from passenger vehicles while supporting a prosperous and globally competitive economy, providing for a healthy and safe environment, and producing equitable opportunities for all Bay Area residents to share in the benefits of a well-maintained, efficient regional transportation system. The adopted Plan Bay Area performance targets, therefore, give more specific, measurable expression to MTC and ABAG’s commitment to the “3 Es” principles. Each of the adopted targets was selected based on its ability to inform one or more of the 3 Es, including equity.11
In addition, as part of the Project Performance Assessment process, special consideration was given to the equity-related impacts of specific projects evaluated. This effort is described further in Chapter 4, under Project Mapping, and fully documented in the Plan Bay Area Performance Assessment Report.
Stakeholder Involvement: Identifying Needs and Soliciting Input through Full and Fair Participation MTC and ABAG have a variety of practices and policies in place to ensure full and fair participation of all regional residents in the Plan Bay Area process, and specifically to identify needs and priorities of low-income, minority, and underserved communities.
11 For more information on the performance targets and the overall Plan Bay Area performance assessment, see the Plan Bay Area Performance Assessment report, at the OneBayArea website (http://www.onebayarea.org/)

P L A N B A Y A R E A E Q U I T Y A N A L Y S I S R E P O R T 1 - 9
MTC’s Public Participation Plan Guides Outreach for Plan Bay Area In December 2010, MTC adopted an update to the region’s Public Participation Plan, to guide agency outreach and public involvement efforts throughout the development of Plan Bay Area.12 This Plan outlined several initiatives to support engagement with low-income and minority communities, including:
• Three rounds of equity analysis to incorporate equity considerations throughout development of Plan Bay Area, including an Initial Vision Scenario analysis, Alternative Scenarios analysis, and finally an analysis of the Draft Plan plus alternatives studied in the EIR.13
• Two rounds of outreach to low-income, minority, and traditionally underrepresented communities via partnerships with community-based organizations to solicit input from these communities early in the Plan’s development process and again prior to adoption.14
Regional Equity Working Group In December 2010, MTC and ABAG staff solicited participation by members of MTC’s Policy Advisory Council and the MTC/ABAG Regional Advisory Working Group in the formation of a Regional Equity Working Group, which convened in February 2011 and met frequently throughout development of Plan Bay Area. The primary purpose of the Regional Equity Working Group was to advise MTC and ABAG staff on the development of the equity analysis methodology, including defining communities of concern and identifying performance measures to analyze for each round of scenario analysis. Drawing from these two MTC and ABAG advisory bodies brought together stakeholders from around the region representing low-income and minority communities; seniors and persons with disabilities; staff representing local jurisdictions, local public health departments, county congestion management agencies, and transit agencies; and community-based organizations and advocacy groups. All Regional Equity Working Group meetings were open to the public and members of the public were encouraged to participate in the group’s discussions.
Community Based Transportation Planning With its Community-Based Transportation Planning Program, MTC created a collaborative planning process that involves residents in low-income Bay Area communities, community-
12 For more information on MTC’s Public Participation Plan, see http://www.mtc.ca.gov/get_involved/participation_plan.htm. 13 Discussion of results from each round of scenarios can be found in Chapter 4, Analysis Results. 14 A summary of input received during the winter 2012 community-based-organization outreach efforts can be found at: http://www.onebayarea.org/pdf/winter_2012_summary/Plan_Bay_Area_Winter_2012_Public_Outreach_and_Involvement.pdf.

1 - 1 0 C H A P T E R 1 | I N T R O D U C T I O N
and faith-based organizations that serve them, transit operators, county congestion management agencies, and MTC. Launched in 2002, the program evolved out of two reports completed in 2001, the Lifeline Transportation Network Report and the 2001 Regional Transportation Plan Environmental Justice Report. The Lifeline Report identified basic travel needs in low-income Bay Area communities and recommended community-based transportation planning as a way for communities to set priorities and evaluate options for filling transportation gaps. Likewise, the Environmental Justice Report identified the need for MTC to support local planning efforts in low-income communities throughout the region.15
Coordinated Public Transit–Human Services Transportation Plan MTC’s Coordinated Public Transit–Human Services Transportation Plan seeks to improve transportation coordination in the region to address the transportation needs of older adults, persons with disabilities, and low-income individuals. The Plan also establishes priorities to inform certain funding decisions for specialized transportation services in the Bay Area. Consistent with requirements established under the Safe, Accountable, Flexible, Efficient Transportation Equity Act (SAFETEA), MTC adopted the region’s first Coordinated Plan in 2007, during the development of the previous Regional Transportation Plan, and in March 2013, adopted an update to the Coordinated Plan to coincide with the development of Plan Bay Area. 16
Snapshot Analysis and SCS Indicators: Monitoring the Region’s Progress Based on a recommendation in the Transportation 2035 Equity Analysis Report, MTC’s Snapshot Analysis was developed in 2010 in partnership with advisors and stakeholders to evaluate key transportation-related indicators in order to assess transportation differences between communities of concern today and ultimately to be able to track changes over time.17
In 2011, MTC and ABAG staff jointly developed a set of Regional Indicators related to the Sustainable Communities Strategy. Related to the Plan Bay Area performance targets, which focused on long-term policy goals and objectives, the SCS Indicators were framed as metrics that, when measured over time, could demonstrate whether the region is maximizing the potential benefits of new transportation investments and land use development identified in
15 A list of all completed Community Based Transportation Plans can be found at http://www.mtc.ca.gov/planning/cbtp/. 16 For more information about the Coordinated Plan, see http://www.mtc.ca.gov/planning/pths/. 17 For more information about MTC’s Snapshot Analysis, see http://www.mtc.ca.gov/planning/snapshot/.

P L A N B A Y A R E A E Q U I T Y A N A L Y S I S R E P O R T 1 - 1 1
the SCS.18 Several of the Indicators address issues identified by the Equity Working Group as key equity priorities, including reducing auto-related injuries and increasing walkability, preserving and increasing affordable housing in growth areas, and improving school performance in growth areas.
1.4 CONTENTS OF THIS REPORT
The remainder of this report is divided into the following subjects by chapter:
• Chapter 2 describes the methodology used to carry out the equity analysis and other associated analyses included in this report.
• Chapter 3 summarizes regional demographic an socioeconomic trends relevant to regional equity issues, particularly focused on communities of concern, minority populations, and low-income populations; travel behaviors of these populations; and regional housing and transportation affordability trends over time.
• Chapter 4 presents the results of all analyses and performance measures included in this report.
• Chapter 5 provides an overall summary of the analysis results and findings, including Title VI analysis, environmental justice analysis, and overall equity analysis.
• Chapter 6 outlines next steps that the regional agencies can take or consider taking to advance the findings of this analysis and continue to incentivize more equitable outcomes for the region’s communities of concern as the region develops.
18 For a summary of Regional Indicators developed during the Alternative Scenarios analysis, see http://www.onebayarea.org/pdf/SCS_Indicators_v3.pdf.

1 - 1 2 C H A P T E R 1 | I N T R O D U C T I O N
This page left blank intentionally.

P L A N B A Y A R E A E Q U I T Y A N A L Y S I S R E P O R T 2 - 1
Chapter 2. Methodology
This chapter summarizes the various methodologies used by MTC and ABAG to define target populations and performance measures for the purposes of analyzing equity for the various Plan Bay Area scenarios studied.
The primary goal of the Plan Bay Area Equity Analysis is to analyze at a regional, programmatic level the distribution of benefits and burdens of the Draft Plan between communities of concern and the remainder of the region. To emphasize the impacts of the Draft Plan in particular, special emphasis is placed on comparing the distribution of impacts between the Project and No Project alternatives using a set of five technical performance measures, as described further in this chapter. This comparison between the Project and No Project is intended to characterize the specific impacts of adopting the Plan versus what is forecast to occur in the future if the Plan is not adopted.
The methodology presented in this chapter stems from more than a year’s worth of development work by MTC and ABAG staff, including extensive input from the Regional Equity Working Group and other interested stakeholders, on both the identification of target populations (low-income households and communities of concern) as well as the set of performance measures to be analyzed for all scenarios. Because multiple rounds of scenarios were analyzed prior to this final round of Environmental Impact Report (EIR) alternatives analysis, staff was able to incorporate feedback from stakeholders on the methodology iteratively as Plan Bay Area was developed over the past two years. Staff is extremely grateful for the time and efforts put forth by Equity Working Group members and other interested stakeholders to improve the equity analysis methodology.
In addition to the five technical performance measures, this chapter also describes the methodology used for the programmatic financial analysis of the RTP transportation
2 - 2 C H A P T E R 2 | M E T H O D O L O G Y
investments. The Transportation Investment Analysis examines the distribution of Plan benefits to low-income and minority populations based on their respective shares of the region’s population and overall transportation system usage.
Additional details on the specific methodology for each performance measure and underlying data and assumptions are provided in Appendix A. Results of the performance measures described here are presented in Chapter 4, Analysis Results.
2.1 DEFINITIONS
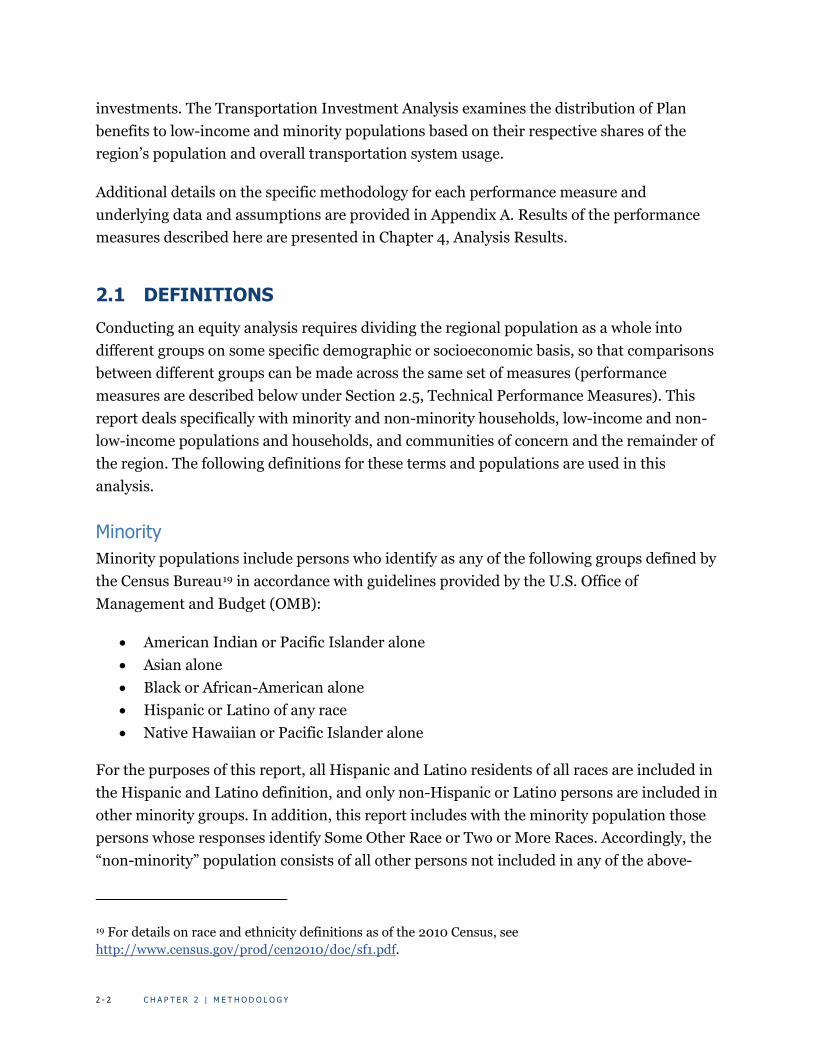
Conducting an equity analysis requires dividing the regional population as a whole into different groups on some specific demographic or socioeconomic basis, so that comparisons between different groups can be made across the same set of measures (performance measures are described below under Section 2.5, Technical Performance Measures). This report deals specifically with minority and non-minority households, low-income and non-low-income populations and households, and communities of concern and the remainder of the region. The following definitions for these terms and populations are used in this analysis.
Minority Minority populations include persons who identify as any of the following groups defined by the Census Bureau19 in accordance with guidelines provided by the U.S. Office of Management and Budget (OMB):
• American Indian or Pacific Islander alone • Asian alone • Black or African-American alone • Hispanic or Latino of any race • Native Hawaiian or Pacific Islander alone
For the purposes of this report, all Hispanic and Latino residents of all races are included in the Hispanic and Latino definition, and only non-Hispanic or Latino persons are included in other minority groups. In addition, this report includes with the minority population those persons whose responses identify Some Other Race or Two or More Races. Accordingly, the “non-minority” population consists of all other persons not included in any of the above-
19 For details on race and ethnicity definitions as of the 2010 Census, see http://www.census.gov/prod/cen2010/doc/sf1.pdf.

P L A N B A Y A R E A E Q U I T Y A N A L Y S I S R E P O R T 2 - 3
named groups, namely those identifying as non-Hispanic white alone. Because the Bay Area is a “majority minority” region, the designation of non-Hispanic white persons as “non-minority” is not intended to be misleading, as this population still represents a relative majority (a plurality) in the region but not an absolute majority. Nevertheless, the term “non-minority” is used here to provide consistency and clarity with regard to federal guidance.
Low-Income Persons A low income person is defined by MTC as persons identified by the Census Bureau as below 200% of the federal poverty level. MTC established the 200% of poverty threshold in 2001 to account for the Bay Area’s high cost of living relative to nationally defined poverty thresholds; the Census Bureau does not adjust the poverty level for different parts of the continental U.S. where different costs of living to factor into the varying affordability of basic necessities.20
The Census Bureau establishes poverty status for individuals based on a combination of an individual’s household composition, size, and income. As of 2010, the 200% threshold represented a household income of approximately $23,000 a year for a single person living alone, and approximately $47,000 a year for a family of four.21
The federal poverty level provides a reasonable benchmark to understand trends over time related to many people and what proportion of the population may be considered low-income. However, because the actual income thresholds that define the federal poverty level change from year to year, the poverty population is not forecast. Therefore, for modeling and forecasting applications, a separate definition of low-income households is used as described below.
Low-Income Households Many of the measures analyzed using the regional travel model are able to produce results for all low-income households, or persons living in low-income households, throughout the
20 The Census Bureau has been working with other Federal agencies toward development of a new Supplemental Poverty Measure (SPM). The SPM extends the information provided by the official poverty measure by including many of the government programs designed to assist low-income families and individuals that are not included in the current official poverty measure, and to account for other identified shortcomings of the current “official” poverty measure. See https://www.census.gov/hhes/povmeas/methodology/supplemental/overview.html. 21 For a complete listing of poverty guidelines used by the Census Bureau, see http://www.census.gov/hhes/www/poverty/data/threshld/index.html.

2 - 4 C H A P T E R 2 | M E T H O D O L O G Y
region, regardless of their residential location. Low-income households are defined in MTC’s travel model as having incomes of less than $30,000 a year 2000 dollars (approximately $38,000 in 2010 dollars), which represent the lowest 28% of households in 2010. Non-low-income households, as a basis for comparison, are defined as having incomes of $30,000 or more per year in 2000 dollars, and represent the upper 72% of households.
Due to limitations of other regional data sources, the Plan Bay Area Transportation Investment Analysis defines low-income households as those earning $50,000 per year or less (in 2006 dollars).22 Because of differences in how household income data was collected across the multiple data sources used in the analysis, this $50,000 threshold was the only available income breakpoint that could be applied consistently across the multiple data sources that are used in this analysis.
Communities of Concern In discussing how to define target populations for equity analysis, Equity Working Group members emphasized the importance of spatial location within the region with respect to the impacts of future development patterns and transportation investments. Thus, staff worked with Working Group members to develop a spatial definition of communities of concern, against which performance measure results could be compared with non-communities of concern (typically referred to in the analysis as the “remainder of region”). Except where noted, data used to define communities of concern is from the Census Bureau’s 2005–09 American Community Survey, the most recent data set available for this analysis that is readily compatible with MTC’s existing travel-analysis-zone definitions used for spatial analysis, which are based on 2000 Census geography.
In response to feedback that the analysis would be more informative with a more focused definition of communities of concern than was used in past RTP Equity Analyses, and a recommendation from MTC’s Policy Advisory Council to consider seniors and persons with disabilities in addition to low-income and minority populations, staff proposed a revised community-of-concern definition which identifies communities with multiple overlapping potential disadvantage factors relevant to the Plan Bay Area planning process.
22 2006 dollars are in reference to the year in which income data was collected for the regional Transit Passenger Demographic Survey, which is one several data sets used in the Transportation Investment Analysis and described further below on page 2-10.

P L A N B A Y A R E A E Q U I T Y A N A L Y S I S R E P O R T 2 - 5
Thresholds were proposed to incorporate the most significant concentrations23 of eight different target populations while minimizing inclusion of non-target population members. The list of factors, reviewed by the Equity Working Group and approved by MTC’s Planning Committee in October 2011, are summarized in Table 2-1 and described in further detail in Appendix A.
Table 2-1. Target Populations and Thresholds Used in Overlapping-Factor Analysis
Disadvantage Factor % of Regional
Population Concentration
Threshold
1. Minority Population 54% 70%
2. Low Income (<200% of Poverty) Population 23% 30%
3. Limited English Proficiency Population 9% 20%
4. Zero-Vehicle Households 9% 10%
5. Seniors Aged 75 and Over 6% 10%
6. Population with a Disability 18% 25%
7. Single-Parent Families 14% 20%
8. Rent-Burdened Households 10% 15%
Source: 2005–09 American Community Survey and 2000 Census (#6).
Communities of concern were then defined as recommended by Equity Working Group members as those tracts having concentrations of 4 or more factors listed above, or having concentrations of both low-income and minority populations.
Based on this definition, a total of 305 out of 1,405 Census tracts in the region were identified as communities of concern. These locations, shown in Figure 2-1 on page 2-6, were then corresponded to 323 out of the region’s 1,454 travel analysis zones (TAZs)24 for the purpose of extracting and tabulating travel model output on a geographic basis in order to summarize regional results for communities of concern and the remainder of the region.
23 Using the previous community of concern thresholds established by stakeholders of either 70% minority or 30% low-income populations as a starting point, proposed concentration thresholds for other populations generally followed a similar pattern of falling between the regional average (mean) and one standard deviation above the mean. 24 Most TAZs in the region correspond to census tract boundaries, except for some locations in the region’s densest areas where more than one TAZ may “nest” within a single census tract.

2 - 6 C H A P T E R 2 | M E T H O D O L O G Y
Figure 2-1. Location of Communities of Concern within the Region

P L A N B A Y A R E A E Q U I T Y A N A L Y S I S R E P O R T 2 - 7
Table 2-2 shows the total populations captured within areas of communities of concern and the remainder of the region in 2010 and forecast in 2040. Approximately 1.4 million residents currently reside in communities of concern, or 20% of the region’s total population. Population growth in communities of concern is forecast to outpace growth in the remainder of the region between 2010 and 2040, with the population of communities of concern increasing by 43% compared to 26% in the remainder of the region.
Table 2-2. Population in Communities of Concern and Remainder of Region, 2010 and 2040
2010 Population 2040 Population Change 2010–2040
# % of Total #
% of Total # %
Communities of Concern 1,433,148 20% 2,054,137 22% 620,989 43% Remainder of Region 5,658,097 80% 7,141,432 78% 1,483,335 26% Bay Area Total 7,091,245 100% 9,195,569 100% 2,104,324 30%
Source: ABAG forecasts
Appendix A provides greater detail on the potential disadvantage factors contributing to the community-of-concern definition. Chapter 3 and Appendix B provide greater detail on the populations currently living in communities of concern.
2.2 DATA SOURCES
This section describes the various data sources used to conduct the analyses in this report. They range from large, multi-purpose public data products such as those provided nationally by the Census Bureau, to smaller, more specialized regional data sources collected and maintained by MTC and ABAG for regional planning purposes.
Decennial Census and American Community Survey The Census Bureau provides two key data sets used in this report. One, the decennial Census, was most recently completed in 2010 and is a 100% count of all persons in the United States as mandated in the U.S. Constitution. The decennial Census includes complete data on all persons’ race and ethnicity as well as age and certain household and family characteristics.
The second Census Bureau data product used is the American Community Survey (ACS). The ACS is an ongoing annual sample-based survey of the U.S. population and provides basic demographic information similar to the decennial Census but also provides far greater detail on various socioeconomic characteristics, including such data relevant to this analysis as household income, poverty status, level of proficiency with English, household vehicle

2 - 8 C H A P T E R 2 | M E T H O D O L O G Y
ownership, disability status, housing costs, and information about workers’ typical commuting habits. Because the ACS is based on sample data collected by the Census Bureau (as opposed to 100% counts of the population like the decennial Census), situations calling for very detailed socioeconomic data require using larger samples. Sample sizes can be increased by looking at either larger geographic areas or else multiple years’ worth of data for smaller areas. Hence, looking at just one year’s worth of data to get a single “snapshot” in time may require looking only at larger geographies such as counties, while looking at very detailed geographies at a neighborhood level may require examining up to five continuous years’ worth of sample data collected from the same relatively small area.
In this report, data from the 2010 Census is used primarily in the regional demographic profile summarized in Chapter 3, Regional Trends, and to characterize the regional minority population for the Transportation Investment Analysis described below in Section 2.4. Data from the American Community Survey is used in the definition of communities of concern as described above in Section 2.1, to summarize regional socioeconomic characteristics in Chapter 3, and to characterize the regional low-income population for the Transportation Investment Analysis.
Data from the 2000 Census, which predates the American Community Survey and provides a combination of 100% count and sample data, is also used in this report, mainly for historical comparisons to more current data, and in one other case in the definition of communities of concern where it is the most recent data available on disability at the census tract level.
California Department of Finance Forecasts The California Department of Finance (DOF) provides statewide population projections by county by age, gender, and race/ethnicity. The 2040 DOF forecasts for race/ethnicity for the nine Bay Area counties were used in the forecast of population by race/ethnicity in Chapter 3, Regional Trends, because ABAG does not produce more detailed population forecasts for the region by race/ethnicity.
ABAG Forecasts The Association of Bay Area Governments maintains the regional population, household, and employment forecasts for the nine-county Bay Area, which reflect the most up-to-date assumptions about the location and density of future growth.
Plan Bay Area utilizes ABAG housing and land use forecasts as the basis for estimating future housing costs and incomes for the Housing and Transportation Affordability

P L A N B A Y A R E A E Q U I T Y A N A L Y S I S R E P O R T 2 - 9
measure, and for modeling future travel demand and activities in the horizon year 2040 in the Jobs-Housing Connection and Enhanced Network of Communities scenarios (described below in Section 2.3, EIR Alternatives).
MTC Travel Model One MTC’s Travel Model One is a disaggregate, activity-based travel demand forecasting model that replaced MTC’s legacy aggregate, trip-based model in early 2011. It is used to simulate future-year travel patterns for the year 2040 and to forecast future-year automobile ownership by income group. MTC’s travel model uses an advanced population synthesizer to support more sophisticated travel behavior simulation compared to MTC’s previous travel model, such as coordinated travel among household members and the availability of time windows in activity scheduling. Results for four of the five technical performance measures analyzed in Chapter 4 are generated all or in part by MTC’s travel model, including the transportation component of the Housing and Transportation Affordability measure, VMT Density and associated emissions measures, Commute Time, and Non-commute Time.
UrbanSim In 2011, ABAG and MTC staff began working with researchers at the University of California, Berkeley, to develop and refine a spatially explicit economic and land use model known as UrbanSim. In combination with MTC’s Travel Model One, UrbanSim was designed to produce detailed results for several of the Plan Bay Area Environmental Impact Report (EIR) alternatives analyzed in this report.
The UrbanSim model was developed to predict economic behavior based on detailed market and regulatory information stored at a parcel level and subsequently simulate economic behavior of developers and development patterns.25 This modeling approach is analogous to Travel Model One’s simulation of household travel behavior, allowing for the development of regional travel forecasts. UrbanSim and Travel Model One work in an integrated manner to help regional planners examine the connections between transportation investments and land use patterns.
Plan Bay Area utilizes UrbanSim in conjunction with Travel Model One forecasts as the basis for land use and transportation demand in the horizon year 2040 in the No Project; Transit Priority Focus; and Environment, Equity, and Jobs scenarios (described further below in Section 2.3, EIR Alternatives).
25 For more information, see http://www.urbansim.org/.

2 - 1 0 C H A P T E R 2 | M E T H O D O L O G Y
Bay Area Travel Survey 2000 The Bay Area Travel Survey (BATS) is MTC’s periodic regional household travel survey, the most recent of which was completed in 2000. BATS2000 is an activity-based travel survey that collected information on all in-home and out-of-home activities, including all trips, over a two-day period for more than 15,000 Bay Area households. The survey provides detailed information on many trip characteristics such as trip purpose, mode, origins and destinations, as well as household demographic and socioeconomic characteristics, and informs development of the regional travel model. In this report, BATS is used to primarily to provide data on usage of the regional transportation system, and in particular the share of trip-making and vehicle-miles of travel (VMT) on the region’s road and highway system, for different demographic and socioeconomic groups in the Transportation Investment Analysis.
The region’s household travel survey is currently in the process of being updated as part of a broader statewide travel survey project. Data collection and analysis efforts are currently under way, and new data from the updated regional travel survey is expected to be available sometime in 2014.
Bay Area Transit Passenger Demographic Survey In 2006 MTC conducted a comprehensive survey of all Bay Area transit operators to collect consistent demographic and socioeconomic data for all the region’s transit riders. Data collected included race/ethnicity, age, fare payment information, household income, and vehicle availability. Results for this survey are used in the Transportation Investment Analysis to determine transit-investment benefits to low-income and minority populations based on these groups’ share of transit use on individual systems and across the region as a whole. The Transit Passenger Demographic Survey also informs the Title VI Analysis of Plan Bay Area by establishing a consistent demographic profile of the region’s overall transit ridership across all systems by minority and non-minority status.
To update this data on an ongoing basis, MTC is now working with transit operators on ridership surveys that will collect a variety of consistent demographic and travel-activity data across all transit systems surveyed.26 In order to make best use of available funding and resources to support these extensive survey efforts, surveys are being conducted on
26 Surveys are being conducted on all transit systems claiming funds under the Transportation Development Act (TDA), consistent with those included in MTC’s annual Statistical Summary of Bay Area Transit Operators.

P L A N B A Y A R E A E Q U I T Y A N A L Y S I S R E P O R T 2 - 1 1
different systems on a serial basis over time. Surveys are anticipated to be complete for all systems and updated regional data available in 2015.
2.3 EIR ALTERNATIVES
In addition to a 2010 base year, the technical performance measures analyzed in this report compare five different planning alternatives developed for study in the Draft Environmental Impact Report (DEIR) for 2040. Each scenario has different assumptions and policies concerning regional growth and associated transportation investments and policies to support different growth patterns. With the exception of the No Project scenario, all were developed in an effort to achieve the region’s 15% reduction in per-capita greenhouse-gas emissions mandated by the California Air Resources Board under SB 375. More information and details about the alternatives can be found in the Plan Bay Area Draft Environmental Impact Report.
Alternative 1: No Project The No Project alternative represents the potential scenario if Plan Bay Area is not implemented. Under this alternative, no new regional policies would be implemented in order to influence local land use patterns and no uncommitted transportation investments would be made. The key elements of the No Project alternative that vary from the proposed Plan include the following:
• Land Use Policies: No new regional land use plan would be developed and no new policies would be implemented to influence the locations of housing and employment centers in the region. No new fees, subsidies, or land development incentives would be provided on the regional level. Urban growth boundaries would be assumed to expand at historical rates, allowing for additional development potential in greenfield locations.
• Transportation Investments: Projects and programs that are identified as “committed” in MTC Resolution 4006 Committed Projects and Programs Policy are included in this alternative; this is similar but not identical to the list of projects in Transportation 2035. The transportation network in this alternative would therefore not be equivalent to existing conditions. The committed projects and programs include transportation projects/programs that were sufficiently through the environmental review process as of May 2011 and had full funding plans in place. In addition, regional programs with executed contracts or funding already secured are considered committed and included in the No Project alternative, through the existing contract period for each program. However, Express Lane projects in MTC’s

2 - 1 2 C H A P T E R 2 | M E T H O D O L O G Y
regional network are listed as committed but technically are uncommitted;27 all of the MTC Network Express Lane projects are therefore excluded from the No Project alternative (VTA's Express Lane Network is a fully committed project and included in every alternative).
• Transportation Policies: Tolls would remain the same as measured in constant year dollars. Parking prices would remain the same as measured in constant year dollars, and localized parking minimums would remain the same for new development.
Alternative 2: Jobs-Housing Connection Scenario (Project) Alternative 2, proposed as the Jobs-Housing Connection Scenario, was selected by MTC and ABAG as the preferred plan option for Plan Bay Area, and is the proposed Plan evaluated throughout this report. Plan Bay Area accommodates the region’s future growth by focusing housing and job growth around high-quality transit corridors, particularly within areas identified by local jurisdictions as Priority Development Areas (PDAs). This land use strategy enhances mobility and economic growth by linking housing and jobs with transit to create a more efficient land use pattern around transit and help achieve a greater return on existing and planned transit investments. Ultimately, local planning efforts and government policies as well as decisions made by private business and residents will create the region’s future development pattern.
The proposed Plan’s growth pattern is shaped around:
• Priority Development Areas • The region’s core transit network • The Bay Area’s network of open spaces and conservation land including Priority
Conservation Areas • Opportunities to increase access to job centers
Priority Development Areas are nominated by local jurisdictions as appropriate places to concentrate future growth. PDAs are existing neighborhoods served by transit and supported by local plans (both existing and to-be-completed) to provide a wider range of housing options along with amenities and services to meet the day-to-day needs of residents in a pedestrian-friendly environment. Under the proposed Plan, PDAs would absorb about
27 The region's two Express Lane networks, MTC's regional network and VTA's network, are each viewed as a project made up of individual project segments. Unless the entire network is fully funded and committed, the entire network, or “project,” is uncommitted. As a result, MTC's Express Lane Network is an uncommitted project; VTA's Express Lane Network is a fully committed project.
P L A N B A Y A R E A E Q U I T Y A N A L Y S I S R E P O R T 2 - 1 3
80 percent of new housing and 66 percent of new jobs on about 5 percent of the Bay Area’s total land area. Regional centers in Oakland, San Francisco, and San Jose will account for about 14 percent of new housing and 17 percent of job growth. Medium-size cities will also play an important role by adding a mix of new housing, employment, and services in strategic locations. As a result of this focused growth, under the proposed Plan about 99 percent of new housing would be within the region’s existing urban footprint, helping retain open space and agricultural land. North Bay counties would also take a very small share of growth — Napa and Marin counties will account for about 1 percent each of the total regional housing growth and Sonoma and Solano counties will account for 5 and 3 percent, respectively.
The region’s core transit network (existing and planned) and the related services will provide a strong foundation upon which to distribute future growth. Many PDAs include at least one station served by the region’s major heavy- and light-rail systems and will be nodes connecting the majority of the region’s housing and jobs by 2040. For example, three planned heavy rail expansion projects — BART to Silicon Valley, BART to Antioch (“eBART”), and Sonoma-Marin Area Rail Transit (SMART) — provide an opportunity to link residents more efficiently to the region’s major job centers. Targeted residential and commercial development around stations along these new corridors (reflecting local plans) can help ease the Bay Area’s chronic housing shortage, improve the cost-effectiveness of new service, and preserve regional open space.
Alternative 3: Transit Priority Focus The Transit Priority Focus alternative seeks to develop a focused growth pattern primarily in the region’s urban core by relying on Transit Priority Project eligible areas (TPPs), which are areas with high-frequency transit service that are eligible for higher-density development streamlining, as per SB 375. The TPP framework is meant to leverage the significant investment the region has made and continues to make in transit service. Key components of this alternative that vary from the proposed Plan include the following:
• Land Use Policies: Rather than the Priority Development Area (PDA)-based framework of the proposed Plan, this alternative would emphasize future development in TPPs. Defined by SB 375 as growth emphasis areas, local jurisdictions would be encouraged to up-zone these areas in order to encourage growth around high-frequency transit services (especially fixed-guideway assets). Additionally, a regional development fee based on vehicle miles traveled would be implemented to discourage low-density suburban and rural development, with proceeds used to subsidize urban infill development areas.

2 - 1 4 C H A P T E R 2 | M E T H O D O L O G Y
• Transportation Investments: The transportation network for Alternative 3 revises the Transportation Investment Strategy identified in the proposed Plan to place a greater emphasis on supporting the urban core. This alternative slightly scales back the Regional Express Lane Network by removing proposed express lanes at the fringe of the region. In addition, funding is shifted from other priorities (the Freeway Performance Initiative and OneBayArea grants) to support additional investment in BART service in the core of the region (the BART Metro project) and increased AC Transit bus service in the urban core.
• Transportation Policies: This alternative would increase the San Francisco–Oakland Bay Bridge toll to $8 at peak hours. The higher bridge toll is intended to reduce congestion and encourage transit ridership in the bridge corridor and support investment in transit service on the Bay Bridge corridor.
Alternative 4: Enhanced Network of Communities This alternative seeks to provide sufficient housing for all people employed in the San Francisco Bay Area and allows for more dispersed growth patterns than the proposed Plan. This alternative reflects input from the region’s business community, which requested an alternative that mirrors the land use pattern previously identified in Current Regional Plans/Projections 2011 (CRP).28 Key components of this alternative that vary from the proposed Plan include the following:
• Demographics: This is the only alternative that includes different and higher population and employment projections within the region, which reflect an elimination of in-commuting from neighboring regions. All other alternatives assume that the Bay Area will continue to import workers from adjacent counties at the current rate of in-commuting. This higher regional population will lead to a higher number of jobs in the region, as more residents consume services which require employees. As a result, this alternative also has a higher number of jobs than the proposed Plan.
• Land Use Policies: The land use is based on CRP, which focuses growth around PDAs, but at a lower level than in the proposed Plan. The distribution of future housing and jobs is based on Projections 2009, adjusted to reflect local jurisdiction input and to extend the forecast from 2035 to 2040. When developing CRP, CMAs and local jurisdictions were asked to review and provide comments on Projections 2009 to improve the spatial distribution of housing and job growth. In some cases,
28 See Supplemental Report, Current Regional Plans Technical Report, on onebayarea.org.
P L A N B A Y A R E A E Q U I T Y A N A L Y S I S R E P O R T 2 - 1 5
local feedback included updates to forecasts at the census tract level, while in other cases local planners identified allocations of future growth at the neighborhood or city level. Responses were not comprehensive across all jurisdictions. Growth levels in CRP were adjusted proportionally to achieve consistency with the regional projections for housing and jobs assumed in this alternative. Subsidies were applied as necessary to achieve the growth distribution desired in this alternative. This alternative will include OBAG incentives for development in targeted locations, but unlike the proposed Plan would not include incentives for redevelopment.
• Transportation Investments: The transportation investments for both road and transit networks would remain consistent with the proposed Plan with the exception of shifting $70 million from the Climate Initiatives Policies to local road and state highway maintenance and dedicating revenues from the bridge toll increase (see below) to state highway maintenance.
• Transportation Policies: Like Alternatives 3 and 5, this alternative will increase the San Francisco–Oakland Bay Bridge toll to $8 at peak hours.
Alternative 5: Environment, Equity, and Jobs This alternative reflects the development proposal presented by Public Advocates, Urban Habitat, and TransForm during the scoping period. This alternative seeks to maximize affordable housing in high-opportunity urban and suburban areas through incentives and housing subsidies. The suburban growth is supported by increased transit service to historically disadvantaged communities through a Vehicle Miles Traveled (VMT) tax and higher bridge tolls. Key components of this alternative that vary from the proposed Plan include the following:
• Land Use Policies: The intent of this alternative is to reduce residential displacement and support affordable housing in both PDAs and “high-opportunity” suburban locations. This alternative would encourage intensification of land use beyond PDAs to include jobs-rich, high-opportunity TPPs not currently identified as PDAs. Based on criteria specified by the equity stakeholders, these additional areas would include locations that are generally rich in employment and good schools but lack affordable housing. Select PDAs in rural or exurban areas would also be disqualified for upzoning or OBAG funding, as identified by equity stakeholders, in order to discourage growth far away from existing job centers. This alternative would also include a modified OneBayArea grant program focused on affordable housing and anti-displacement policies as pre-conditions for subsidies and incentives (due to modeling limitations, these incentives did not impact modeling outputs). The reinstatement of some form of redevelopment financing would help support infill
2 - 1 6 C H A P T E R 2 | M E T H O D O L O G Y
development in this alternative, while subsidies would be used to support programs that minimize displacement. Unlike Alternatives 3 and 4, this alternative would discourage CEQA streamlining for TPP-eligible areas. While streamlining would still be legal, as per SB 375, based on the input provide by the EEJ stakeholders, the Plan would not reference TPPs, thus making it impossible for project sponsors to streamline. The modeling analysis for this alternative therefore did not include any benefits from CEQA streamlining to encourage development.
• Transportation Investments: This alternative seeks to strengthen public transit by significantly boosting service frequencies in most suburban and urban areas, other than on Muni, BART or Caltrain, and providing free transit passes to youth throughout the region. This alternative includes a reduced scope highway network which excludes all uncommitted road projects, other than maintenance projects, from the Transportation Investment Strategy. As with Alternative 1, the No Project alternative, all of the MTC Network Express Lane projects are excluded as they are considered uncommitted (VTA's Express Lane Network is a fully committed project and included in every alternative). As such, this alternative does not include the Regional Express Lanes Network, with the exception of committed projects.
• Transportation Policies: Most notably, this alternative would require the implementation of a vehicle-miles traveled (VMT) tax to fund the expanded investments in public transit. This tax, assumed at a rate of 1 cent per mile on annual vehicle miles traveled within the region, would provide a substantial revenue source, while also discouraging residents from driving; exemptions from the tax would be provided for low-income households. Furthermore, the San Francisco–Oakland Bay Bridge would have an increased peak-period toll of $8, consistent with Alternatives 3 and 4, providing additional revenue in the Transbay corridor.
2.4 TRANSPORTATION INVESTMENT ANALYSIS
In addition to modeling travel and socioeconomic outcomes based on various regional development and transportation investment scenarios using technical performance measures described later in this chapter, MTC carried out an off-model analysis of the Draft Plan’s overall transportation investment strategy to illustrate the distribution of the proposed Regional Transportation Plan investments relative to different populations and communities in the region. In an ongoing effort to ensure equity in the metropolitan transportation planning process, MTC has previously carried out similar analyses of the 2009 RTP (Transportation 2035), the 2011 Transportation Improvement Program (TIP), and the Draft 2013 TIP, using methodologies developed and continually refined over time in consultation with MTC advisors and stakeholders.

P L A N B A Y A R E A E Q U I T Y A N A L Y S I S R E P O R T 2 - 1 7
The RTP Transportation Investment Analysis serves two key functions as MTC fulfills its Title VI and environmental justice responsibilities (described further in Chapter 1). To do so, this analysis addresses:
4. MTC’s environmental justice responsibilities as an FTA/FHWA grantee as well as MTC’s own adopted Environmental Justice Principles.
5. FTA’s analytical requirements of MPOs to certify compliance with FTA’s Title VI regulations (per FTA Circular 4702.1B, issued in October 2012) with “charts that analyze the impacts of the distribution of State and Federal funds in the aggregate for public transportation purposes…” and “an analysis of impacts … that identifies any disparate impacts on the basis of race, color, or national origin…”;
To carry out these functions, the Transportation Investment Analysis relies on three different methodologies described in this section to determine whether the Plan’s investments are shared equitably among low-income and minority populations, and to determine whether there is any disparate impact at the regional level of the programmatic investment strategy on the basis of race, color, or national origin. No specific federal standard exists for conducting an environmental justice assessment. Similarly, FTA’s new Title VI requirements for MPOs do not provide any specific guidelines or benchmarks for MPO Title VI analyses, and because these requirements are new as of October 2012, there are not yet established best practices or approved comparative analyses against which MTC can measure its findings. Therefore, for this analysis MTC is building on its prior work undertaken in the Transportation 2035 investment analysis and the 2011 TIP Investment Analysis, with enhancements based on feedback from stakeholders on these prior analyses and from the Regional Equity Working Group and MTC Policy Advisory Council Equity & Access Subcommittee during development of Plan Bay Area and the 2013 TIP. MTC will continue to seek feedback on these methodologies and future enhancements to the methodologies, each of which is described further below.
Population/Use-Based Analysis The population/use-based investment analysis is based on how different populations within the region use the regional transportation system. It compares the estimated percent of investment for low-income and minority populations to the percent of use of the transportation system (both roadways and transit) by low-income and minority populations, and also to low-income and minority populations’ share of the regional population as a whole. Generally, if Plan investments are greater in a mode or system used more by one population group, a greater share of benefit will accrue to that group in the analysis, and likewise if financial investments are less in a particular mode or system used

2 - 1 8 C H A P T E R 2 | M E T H O D O L O G Y
disproportionately by one population group, a smaller share of benefit will accrue to that group.
In the aggregate, the analysis measures transit and motor vehicle trips using the 2000 Bay Area Travel Survey (BATS 2000). In focusing on roadway investment alone, the analysis uses vehicle-miles traveled (VMT) as the measure of system use from BATS 2000. Similarly, for a more refined look at transit investment alone, transit trips are measured using data from MTC’s 2006 Transit Passenger Demographic Survey. Consistent with the available data sources, the analysis uses definitions for low-income and minority populations as described above in Section 2.1, Definitions.
The population/use-based analysis proceeds as follows:
1. First, the region’s total population and total trips are divided into two sets of subgroups: minority/non-minority and low-income/non-low-income.
2. Next, Plan investments are separated into two modes: transit and road/highway/bridge.
3. Plan investments are then assigned by mode to population subgroups — either minority/non-minority or low-income/non-low-income — by multiplying the share of each regional sub-population’s use of each mode by the total investment in that particular mode. This analysis was conducted at the county level for highway and roadway investments and at the transit-operator level for transit investments.
4. Finally, Plan investments by mode (from county or transit operator data) are summed for low-income and non-low-income populations, and for minority populations and non-minority populations, based on each group’s usage share of each mode. The percent of investment for systems supporting each population subgroup is compared to the percent of usage of the system by each population subgroup as well as each subgroup’s share of the region’s population as a whole.
As a regional-level, programmatic analysis, this assessment is fairly coarse, and has several limitations. The most significant shortcoming is that the analysis does not directly assess benefits and burdens related to outcomes of specific projects or programs beyond a regional measure of benefit in terms of investment per capita. With respect to assigning investment benefit from expansion projects to certain population subgroups, this analysis is also limited to assuming that existing usage demographics apply, since current demographic and travel surveys do not include future riders or drivers who will be attracted to the areas served by

P L A N B A Y A R E A E Q U I T Y A N A L Y S I S R E P O R T 2 - 1 9
these expansions as either origins or destinations.29 Moreover, the roadway-usage share does not account for the benefit to the region’s transit passengers who travel in vehicles that share the region’s roadways, highways, and bridges with private automobiles. Also, for simplicity and due to limitations in how certain programmatic categories are characterized in Plan Bay Area, pedestrian and bicycle projects are assigned to local streets and roads and not specifically assigned based on usage by low-income or minority populations’ use of these facilities, or their walk/bike mode share.
A portion of this analysis focusing only on Federal and State funding sources for public transportation purposes forms the basis of the Title VI Analysis for Plan Bay Area, which is described further beginning on page 2-20.
Project Mapping Analysis To supplement the population/use-based analysis described above, and to reflect stakeholder feedback that the overall spatial distribution of projects is also important to analyze to ensure equitable access to Plan investments, MTC also mapped all the RTP projects that are mappable and overlaid them against communities of concern as well as census tracts with concentrations of minority populations that are above the regional average.
The project mapping analysis also has some limitations. First, not all significant regional investments are mappable. For example, a substantial share of total funding in the Plan is dedicated to transit operators for ongoing operations and maintenance of their entire system, which cannot be represented as a simple point or line on a map in relation to a specific community. Second, despite previous attempts by MTC to quantify the spatial distribution of regional investments in response to stakeholder requests (as in the 2011 TIP Investment Analysis), stakeholders have not agreed on how and whether investments can be appropriately accounted for in terms of whether a specific project or investment truly benefits a specific community and to what degree.
Given these limitations, the Regional Equity Working Group, which reviewed and provided input on the Transportation Investment Analysis methodology for Plan Bay Area, recommended a more straightforward qualitative, rather than quantitative assessment of the spatial distribution of mappable projects included in the Plan. This qualitative
29 In cases where current demographic data did not exist for a future transit operator (for example, Sonoma-Marin Area Rail Transit), basic assumptions were applied based on demographics of current systems of the same mode, or in cases where no specific demographics by mode or operator could be assumed (for example, Lifeline Transportation Program funds), regional averages were assumed to apply.

2 - 2 0 C H A P T E R 2 | M E T H O D O L O G Y
assessment mainly involves examining the distribution of projects for any apparent systematic exclusion of communities of concern or minority communities in the spatial distribution of benefits, or any apparent systematic imbalances between the distribution of projects between communities of concern and the remainder of the region, or between minority and non-minority communities.
The component of this analysis overlaying Plan investments against communities with above-average minority populations also constitutes part of the Title VI Analysis of Plan Bay Area, described further below.
Title VI Analysis As described in Chapter 1 (Section 1.2, Legal, Regulatory, and Policy Context), the Federal Transit Administration released new guidance in October 2012 specifying how MPOs such as MTC are to certify compliance with the provisions of Title VI of the Civil Rights Act of 1964 in the metropolitan planning process. This section describes the methodology that MTC is using to meet these requirements within the broader Transportation Investment Analysis framework for the Regional Transportation Plan, including the methodology for conducting a disparate impact analysis of the Transportation Investment Analysis results.
The key FTA requirements the Transportation Investment Analysis addresses in terms of Title VI are:
FTA Requirement Related Plan Bay Area Analysis
“Demographic maps that overlay the percent minority and non-minority populations as identified by Census or ACS data …”
(1) Project mapping analysis overlaying mappable Plan Bay Area projects against 2010 Census tracts with above-average concentrations of minority residents.
“[C]harts that analyze the impacts of the distribution of State and Federal funds in the aggregate for public transportation purposes…”
(2) Population/use-based analysis of only public transit investments using State and Federal funding sources.
“An analysis of impacts identified in paragraph [above] that identifies any disparate impacts on the basis of race, color, or national origin”30
(3) Disparate impact analysis comparing Plan Bay Area investments per capita for minority populations identified under (2) above as a percentage of per-capita investments identified for non-minority populations.
Because MTC does not currently have the ability to map only Plan Bay Area public transportation projects using State and Federal funds under (1) above, the disparate impact
30 FTA Circular 4702.1B, page VI-2.

P L A N B A Y A R E A E Q U I T Y A N A L Y S I S R E P O R T 2 - 2 1
analysis under (3) incorporates only the quantitative results produced by the population/use-based analysis under (2) to make a determination of any disparate impact. The mapping analysis under (1) therefore shows all transit investments overlaid against minority tracts, regardless of fund source, and is a qualitative analysis only. Similarly, MTC currently lacks the ability to represent only public transit projects funded by Federal and State sources in the regional travel model, making any kind of technical analysis using performance measures to forecast potential future-year outcomes between different groups or communities based on these investments specific impossible. MTC will investigate the feasibility of updating future RTP project databases and/or travel model parameters to include more specific fund source information in the future in light of these new FTA requirements.31
MTC does have the ability to specify public transportation investments using State and Federal funds in the population/use-based analysis under (2) above. The State and Federal fund sources therefore included in the Title VI analysis of Plan Bay Area are:
• Operating: State Transit Assistance (revenue- and population-based), FTA 5307 Urbanized Area, Anticipated unspecified32
• Capital: STP/CMAQ, Proposition 1B (revenue- and population-based), FTA 5307 Urbanized Area + 5309 Fixed Guideway, FTA 5311 Non-urbanized, Anticipated unspecified.
To conduct the disparate impact analysis under (3) above, the results of the population/use-based analysis of public transportation investments using State and Federal funds under (2) are first expressed in terms of investments per capita for both minority and non-minority transit riders (or total population) in the region as follows:
Minority benefit per capita = Total transit investments allocated to minority riders
Total regional minority transit ridership (or population)
31 Because development of the Regional Transportation Plan is a multi-year process, the Plan Bay Area project database was developed in early 2011, whereas FTA’s new Title VI requirements were finalized in October 2012. Similarly, development of MTC’s current travel model, Travel Model One, began in 2005, and was initially deployed for use in development of the long-range transportation plan in early 2011. 32 “Anticipated unspecified” funding sources for transit purposes in Plan Bay Area are included with other State and Federal sources, since the State and Federal governments have historically been the sources of such funds if and when they are made available to the region. Recent examples of situations where previously unanticipated funds have become available to MTC for programming for transit purposes include State Proposition 1B Transit funds in 2007 and Federal American Recovery and Reinvestment Act (ARRA) funds in 2009.
2 - 2 2 C H A P T E R 2 | M E T H O D O L O G Y
Non-minority benefit per capita = Total transit investments allocated to non-minority riders
Total regional non-minority transit ridership (or population)
Next, the minority and non-minority per-capita benefit results are compared, expressing the minority benefit per capita as a percentage of the non-minority benefit per capita:
Result (%) = Minority benefit per capita
Non-minority benefit per capita
Although FTA does not provide specific guidance or standard benchmarks for MPOs to use in the metropolitan planning process to determine whether any given result represents a disparate impact, a general practice in disparate impact analysis is to use the percentage result to determine whether any differences between benefits for minority or non-minority populations may be considered statistically significant. If a disparate impact is found to be statistically significant, consideration must then be given to “whether there is a substantial legitimate justification for the policy that resulted in the disparate impacts, and if there are alternatives that could be employed that would have a less discriminatory impact.”33
2.5 TECHNICAL PERFORMANCE MEASURES
In addition to an off-model analysis of the proposed Plan Bay Area investment program in terms of low-income and minority populations and travelers benefit from the Plan’s investment strategy, five technical performance measures were also selected for analysis in order to forecast specific outcomes identified as priorities by the Regional Equity Working Group. For most of the technical performance measures, estimates are produced at the neighborhood (TAZ) level of certain socioeconomic and travel characteristics for both a base year (2010) as well as different 2040 forecasts for the scenarios described in Section 2.3. The exception is the Housing and Transportation Affordability measure, which is calculated regionally by household income group for the purposes of comparing low-income households to non-low-income households.
The basic methodology for assessing the equity impacts of Plan Bay Area in terms of outcomes is:
1. Identify each of the region’s 1,454 TAZs as being either one of 323 TAZs meeting the community-of-concern definition, or else one of 1,131 TAZs characterized as being in the remainder of the region.
33 FTA Circular 4702.1B, page VI-2.

P L A N B A Y A R E A E Q U I T Y A N A L Y S I S R E P O R T 2 - 2 3
2. Extract indicator variables for both communities of concern and the remainder of the region for each alternative described in the preceding section.
3. Evaluate results to assess (among other questions): • whether the Project has a beneficial impact on communities of concern; and • whether communities of concern receive similar or greater benefit compared
to the remainder of the region under the proposed Plan (the Project), relative to the No Project alternative.
The five technical performance measures evaluated in this analysis are shown on the following page with the associated priority equity concern identified for Plan Bay Area by Equity Working Group members.
Priority Equity Theme Associated Performance Measure
Affordable Housing and Transportation Choices Housing and Transportation Affordability
Equitable Growth Potential for Displacement
Healthy Communities Vehicle-Miles of Travel (VMT) Density (including related emissions density measures)
Making the Jobs-Housing Connection Average Commute Time
Equitable Mobility Average Non-commute Travel Time
There are many potential measures by which equity can be evaluated. These five represent the combined effort of MTC and ABAG staff, the Regional Equity Working Group, and other interested stakeholders to identify which measures had greatest relevance to the region’s communities of concern in the context of the regional development and investment decisions relevant to Plan Bay Area. Details about how results for each measure are estimated is provided in Chapter 4, Analysis Results, with more thorough explanation of the methodology and assumptions behind each measure provided in Appendix A.

2 - 2 4 C H A P T E R 2 | M E T H O D O L O G Y
This page left blank intentionally.

P L A N B A Y A R E A E Q U I T Y A N A L Y S I S R E P O R T 3 - 1
Chapter 3. Regional Trends
This chapter provides a regional demographic profile for minority populations, low-income populations, and communities of concern in the nine-county San Francisco Bay Area and also summarizes key demographic and socioeconomic trends relevant to the Plan Bay Area planning process. The chapter is organized around five key findings regarding demographic and socioeconomic characteristics of communities of concern, minority populations, and low-income populations, with particular emphasis on commuting and travel habits of these populations, and recent trends in housing and transportation affordability.
3.1 COMMUNITIES OF CONCERN HAVE DISTINCT DEMOGRAPHIC AND SOCIOECONOMIC CHARACTERISTICS COMPARED TO THE REST OF THE REGION
Because MTC defines communities of concern largely on the basis of having four or more overlapping concentrations of specific populations of concern relative to the metropolitan planning process, or which have concentrations of both minority and low-income residents (as described further in Chapter 2, Methodology, beginning on page 2-4), it follows that as a whole their demographic and socioeconomic profile is distinct from the remainder of the region. Because different populations of concern are distributed differently throughout the region (some, such as zero-vehicle households, concentrate more heavily in relatively fewer areas than others, such as seniors 75 and older), the extent of these differences between communities of concern and the remainder of the region varies by population subgroup, as shown in Table 3-1.

3 - 2 C H A P T E R 3 | R E G I O N A L T R E N D S
Table 3-1. Demographic and Socioeconomic Profile of Communities of Concern and the
Remainder of the Region, 2005–09
Communities of Concern Remainder of Region Regional Totals
Population Subgroup # CoC %
% of Regional Total in CoCs #
Remainder of Region
%
% of Regional Total in
Remainder of Region # %
Minority Population 1,124,851 81% 30% 2,660,518 48% 70% 3,785,369 54%
Low-Income Population 611,176 45% 40% 933,176 17% 60% 1,544,352 23%
Limited English Proficiency Population 269,569 21% 44% 344,137 7% 56% 613,706 9%
Zero-Vehicle Households 94,774 21% 40% 139,300 7% 60% 234,074 9%
Population 75+ 71,709 5% 18% 337,516 6% 82% 409,225 6%
Population with a Disability 318,406 24% 29% 788,427 16% 71% 1,106,833 18%
Single-Parent Families 70,095 25% 31% 155,164 12% 69% 225,259 14%
Rent-Burdened Households 84,637 19% 35% 155,826 8% 65% 240,463 10%
All Persons 1,380,393 -- 20% 5,570,371 -- 80% 6,950,764 100%
Source: MTC analysis of American Community Survey 2005-09 5-Year Sample Tables B03002, C17002, B16004, B25044, B01001, B11004, B25070, and B25003. Data on population with a disability is from Census 2000 SF3 Table P42.
While 20% of the region’s total population resides in communities of concern (nearly 1.4 million out of 7 million residents), this definition captures meaningful concentrations and shares of most population subgroups within them, most notably Limited English Proficiency persons (44% of the region’s total LEP population resides within communities of concern), zero-vehicle households (40%), and low-income persons (40%). Most population subgroups are around two to three times more likely to live in communities of concern than in the remainder of the region, based on the population averages of each subgroup represented in each part of the region. Only one population subgroup, seniors aged 75 and over, has a slightly greater likelihood of living outside of communities of concern than the population as a whole, since the definition captures only 18% of the region’s total population aged 75 and over, which is slightly less than the 20% of the total population captured.
While the definition of communities of concern attempts to identify the most meaningful concentrations of all population subgroups in the locations where they overlap spatially, it is important to keep in mind that most members of each population group live outside of communities of concern, where they are either more dispersed spatially or do not overlap

P L A N B A Y A R E A E Q U I T Y A N A L Y S I S R E P O R T 3 - 3
with as many other population subgroups. More details on the distribution and overlap of population subgroups within the region and the nine counties can be found in Appendix B.
3.2 THE REGION’S DEMOGRAPHICS CONTINUE TO DIVERSIFY
The Bay Area officially became a “majority minority” region with the 2000 Census, and, like the rest of California and the United States as a whole, its demographics are becoming increasingly diverse over time. As of the most recent 2010 Census, white, non-Hispanic persons were still the largest single racial/ethnic group (more information on how these groups are defined is provided in Chapter 2, under Section 2.1, Definitions), with 42% of the region’s population, as shown in Table 3-2. The next largest groups are persons of any race who identify as being of Hispanic or Latino origin, followed closely by persons who identify as Asian, each at around 23% of the region’s population. Persons identifying as Black or African American totaled 6% of the region’s population. Together with persons identifying as Native Hawaiian or Pacific Islander (0.6%), American Indian or Alaska Native (0.3%), and some other race or two or more races (4%), all persons identifying as a member of one or more minority groups totaled about 58% of the region’s population in 2010.34
Table 3-2. Bay Area Population by Race/Ethnicity, 2010 and 2040
2010 2040
Population % of Total
% of Total
American Indian/Alaska Native 20,691 <1% <1% Asian 1,645,872 23% 25% Black or African-American 460,178 6% 5% Hispanic/Latino (of any race) 1,681,800 24% 30% Native Hawaiian or Pacific Islander 41,003 <1% <1% Some Other Race/Two or More Races 268,292 4% 5% Minority Persons Subtotal 4,117,836 58% 66% White, non-Hispanic (Non-minority) 3,032,903 42% 34% Total Population 7,150,739 100% 100%
Source: 2010 Census SF1 Table P9; California Dept. of Finance Population Projections Table P-1 (January 2013).
As these demographic trends continue into the future, Table 3-2 shows the population of minority residents is projected to increase from 58% of today’s population to 66% by 2040. Still, by 2040, non-Hispanics white persons are forecast to remain the single largest
34 Note this share differs from that shown in Table 3-1 due to differences in Census Bureau data products used to analyze populations. Because geographical correspondence with MTC’s travel model requires using Year 2000 Census geographies, data from the 2005-09 American Community Survey was the most recent available to use to define communities of concern, and represents a population sample. Data from the 2010 Census is slightly more recent and represents a 100% population count rather than a sample.

3 - 4 C H A P T E R 3 | R E G I O N A L T R E N D S
racial/ethnic group in the region, with 34% of the population, followed closely by Hispanic and Latino residents, whose share of the region’s population is forecast to rise from 24% today to 30% in 2040, the largest increase of any single racial or ethnic group in the region. The Asian population will also increase from 23% today to roughly a quarter of the region’s residents by 2040.
Regional Demographics Differ by Age Group Because of the nature of how the Bay Area’s demographic makeup has been changing over time, driven largely by births and immigration of residents represented in younger age groups, demographic characteristics of various age groups within the region differ substantially, as shown in Figure 3-1. The biggest demographic differences are between the 65-and-over and under-18 age groups. In 2010, a Bay Area resident age 65 or over was twice as likely to be non-Hispanic white than a resident under 18, as white non-Hispanics made up 60 percent of the older population compared to 30 percent of the youth population. On the other hand, a Bay Area resident under 18 was more than three times more likely than a resident 65 or older to be of Hispanic or Latino origin (which is now the single largest racial/ethnic group represented among persons under 18), and about five times more likely to identify as a member of some other race or two or more races.
Figure 3-1. Bay Area Population by Race/Ethnicity by Age Group, 2010
Source: 2010 Census SF1, Tables PCT12A–O.
30% 43%
60%
34% 22%
10%
21% 24% 22%
6% 7% 6% 7%
0%
10%
20%
30%
40%
50%
60%
70%
80%
90%
100%
Under 18 18 to 64 65 and Over
Other/ Multiple
American Indian/Alaska Native
Native Hawaiian/Other Pac. Islander
Black/ AfricanAmerican
Asian
Hispanic/ Latino
White, non-Hispanic/ Latino

P L A N B A Y A R E A E Q U I T Y A N A L Y S I S R E P O R T 3 - 5
3.3 THE REGION’S LOW-INCOME POPULATION CONTINUES TO GROW AND DECENTRALIZE; INCOME TRENDS DIFFER ACROSS AGE GROUPS
The effects of the Great Recession in the late 2000s appear to have supported an existing trend of rising numbers and shares of low-income populations in the Bay Area already underway since 2000, a year which in hindsight appears to have been a “low water mark” for poverty in the region within the last 20 years. Looking at income trends within different population groups, it is apparent that the implications of these trends vary for different populations, notably by age.
The Region’s Low-Income Population Is Growing in Both Number and Relative Share The 2000s saw a notable increase in both the number and share of Bay Area populations in poverty (below 100% of the federal poverty level) and those defined by MTC as “low-income” (below 200% of the federal poverty level). Table 3-3 shows that between 2000 and 2010, the region saw a net increase in population below 200% of poverty of over 430,000 persons (a 32% increase from 2000), compared to a net decrease of nearly 30,000 residents above 200% of poverty, so that by 2010 over 780,000 persons in the Bay Area were living below 100% of poverty, and more than 1.8 million were considered low-income at below 200% of poverty.
Table 3-3. Bay Area Poverty Population, 2000 and 2010
Ratio of Income to Poverty Level 2000 2010
# Change
% Change
Below 100% 573,333 781,336 208,003 36% Below 200% 1,374,211 1,807,229 433,018 32% Above 200% 5,287,329 5,258,776 -28,553 -1% Total Population 6,661,540 7,066,005 404,465 6%
Source: 2000 Census SF3 Table P88; American Community Survey 2010 1-Year Estimates Table B17002.
Figure 3-2 illustrates these trends in terms of the shares of poverty and low-income populations as a share of the total population over time. The effects of the Great Recession are presumably seen beginning in 2009, with steep increases in the rates of both poverty and low-income populations.

3 - 6 C H A P T E R 3 | R E G I O N A L T R E N D S
Figure 3-2. Share of Bay Area Population by Poverty Ratio, 1990–2011
Source: 1990 Census STF3 Table P117, 2000 Census SF3 Table P88, American Community Survey 1-Year Estimates Table B17002.
The suburbanization of the region’s low-income population is another long-term, continuing trend. In 1990, 43% of the region’s population below 200% of the poverty level lived in the three central cities of San Francisco, Oakland, and San Jose, which offer relatively high levels of access to public transit and other services compared to the region’s more suburban and rural areas. By 2000, that share had fallen to 39%, and had continued to fall to 36% as of 2011.35
Income Trends Vary By Age Group, with Youth Under 18 Most Likely to Be Low-Income Looking at the breakdown of low-income populations by age group, Figure 3-3 shows that persons under the age of 18 are most likely to be identified as being below 200% of Census Bureau poverty guidelines. In 2010, 31% were considered “low-income” by MTC’s definition, up substantially from 25% in 2000. Working-age persons between 18 and 64 were least likely among the age groups to be low-income, at 24% of the population in 2010, but also saw the largest relative increase since 2000 (up 37% from this age group’s 18% share of the population in 2000), perhaps due to the effects of prolonged unemployment trends following the Great Recession.
35 Source: MTC staff analysis of 1990 Census STF3 Table P117, 2000 Census SF3 Table B88, American Community Survey 2011 1-Year Estimates Table B17002.
0%
5%
10%
15%
20%
25%
30%
1990 2000 2006 2007 2008 2009 2010 2011
% o
f R
egio
nal P
opul
atio
n 2011: 28.5%
2011: 12.6%
1990: 21.0%
1990: 8.5%
Population below 200% of Poverty
Population below 100% of Poverty

P L A N B A Y A R E A E Q U I T Y A N A L Y S I S R E P O R T 3 - 7
Figure 3-3. Share of Total Population Under 200% of Poverty Level by Age Group, 2000 and 2010
Source: Census 2000; Table PCT050; American Community Survey 2010 1-Year Estimate Table C17024.
Seniors 65 and over saw their low-income share hold relatively steady from 2000 to 2010, from 24% to 25%. One notable change in the share of low-income seniors between 2000 and 2010 is that in 2000, seniors were slightly more likely to be low-income than the regional average (24% compared to the regional average of 21%), and by 2010 were slightly less likely to be low-income relative to the regional average (25% compared to 26%).
3.4 LOW INCOME WORKERS ARE MORE LIKELY TO COMMUTE BY TRANSIT AND WORK WITHIN THEIR COUNTY OF RESIDENCE, BUT AUTO TRIPS STILL DOMINATE MODE SHARE
This section examines commute behavior for low-income and minority workers, and workers living in communities of concern, specifically the typical commute mode reported to the Census Bureau and locations of work and home for low-income workers.
More Than Two-Thirds of Workers Across All Populations and Community Types Commute by Car Figure 3-4 shows the breakdown of typical commute mode in terms of overall mode share for workers in communities of concern and the remainder of the region, for different racial and ethnic minority populations, and for low-income workers below 200% of federal poverty versus non-low-income workers.
25%
18%
24%
21%
31%
24% 25% 26%
0%
5%
10%
15%
20%
25%
30%
35%
Under 18 18 to 64 65 and Over Bay Area Total
2000
2010

3 - 8 C H A P T E R 3 | R E G I O N A L T R E N D S
Figure 3-4. Commute Mode Share by Population or Community Type, 2010
Source: (a) American Community Survey 2005-09 Table B08122; (b) American Community Survey 2006-10 Tables B08122B, C, D, E, F, G, H, and I. (c) American Community Survey 2006-10 Public Use Microdata Sample.
Driving alone continues to be far and away the most prevalent means of getting to work for all workers, both minority and non-minority, with non-minority workers only slightly more likely than minority workers to choose this mode (70% of non-minority workers vs. 65% of minority workers). The biggest differences between the groups were in carpooling, with minority workers nearly twice as likely to carpool as non-minority workers (13% vs. 8%, respectively), and working at home, with non-minority workers nearly twice as likely as minority workers to not commute at all (7% vs. 4%). Even though minority workers are slightly more likely than non-minority workers to commute by public transit (11% vs. 9%), taking into account both carpooling and solo-driving minority workers are slightly more likely to commute by car (81%) than non-minority workers (78%). Further study of this
70
55
70
65
64
64
70
66
66
66
70
57
10
14
8
13
16
15
15
13
14
9
10
13
9
14
9
11
10
10
5
12
9
15
9
16
3
7
4
4
4
4
3
3
5
4
3
6
2
4
3
2
4
3
4
2
3
2
3
4
5
6
7
4
3
3
3
4
3
4
6
4
0% 20% 40% 60% 80% 100%
Above 200% of Poverty
Below 200% of Poverty
Non-minority (white, non-Hispanic)
All Minorities
Hispanic/Latino
Some Other Race/Two or More Races
Native Hawaiian/Pacific Islander
Asian
American Indian/Alaska Native
Black/African-American
Remainder of Region
Communities of Concern
Inco
me
Leve
l(c
)R
ace/
Eth
nici
ty (
b)Co
mm
unity
Type
(a)
Drive Alone Carpool Public Transit Walk Bicycle/Motorcyle/Other Work at Home

P L A N B A Y A R E A E Q U I T Y A N A L Y S I S R E P O R T 3 - 9
trend would be worthwhile to examine availability and practicality of transit and cultural attitudes about using it for different racial and ethnic populations, suburbanization of employment in general and minority populations in particular, and the differences in work-at-home trends between minority and non-minority workers.
While trends are overall fairly similar between individual racial and ethnic minority groups, there are some notable differences. Black/African-American workers are most likely to commute by public transit (15%), while Native Hawaiian/Pacific islanders are least likely (5%). Hispanic/Latino workers are most likely to carpool (16%) while Black/African-American workers are least likely to do so (9%).
Although low-income commuters below 200% of poverty were most likely to commute by car like other groups (69%), they are the most likely of any group to commute by walking (7%). Similarly, commuters living in communities of concern were also most likely to commute by car (70%), but most likely of any group to commute by public transit (16%).
Low-Income Workers Are More Likely to Commute Within County of Residence, Less Likely to Commute Transbay Turning to where low-income commuters work, Figure 3-5 illustrates where workers commute to relative to their county of residence, broken out by income level.
Figure 3-5. Work Location for Workers by Poverty Ratio, 2006–2010
Source: Tabulation prepared by MTC staff based on data from the American Community Survey 2006-2010 Public Use Microdata Sample (PUMS).
83% 72%
11% 17%
6% 11%
0%
10%
20%
30%
40%
50%
60%
70%
80%
90%
100%
Below 200% Above 200%
Ratio of Income to Poverty Level
Worked inDifferentCounty,Transbay
Worked inDifferentCounty, NotTransbay
Worked inSame County

3 - 1 0 C H A P T E R 3 | R E G I O N A L T R E N D S
While the vast majority of workers across both income groups work in the same county as their county of residence (83% of low-income workers and 72% of non-low-income workers), low-income workers are substantially less likely than non-low-income workers to work outside their county of residence (17% of low-income workers compared to 28% of non-low-income workers). Out-of-county commuters were further broken down into Transbay and non-Transbay commuters, revealing that low-income workers were even less likely compared to non-low-income workers to have Transbay commutes than non-Transbay out-of-county commutes. This may be due to the extra time and costs associated with longer commutes in general and especially Transbay commutes in particular.
That low-income workers appear to commute closer to home than non-low-income workers may reflect a variety of factors: the locations of low-income jobs relative to low-income households; having less time available during the day to devote to commuting (such in cases where low-income workers may work more than one job or have sole childcare responsibilities at home); extra costs associated with long commutes, especially for transit trips that cross county lines and/or involve multiple operators requiring multiple fare payments; high fuel costs associated with long car commutes’ and both tolls and higher fares/fees associated specifically with Transbay trips by both auto and transit.
3.5 HOUSING AND TRANSPORTATION COSTS ARE RISING FASTER THAN INCOMES
This section examines regional trends related to housing and transportation costs relative to incomes over the past 10 to 20 years. To the extent that housing and transportation affordability has been a key theme throughout development of Plan Bay Area, the data presented here show how Bay Area households have generally been losing ground in recent years as increases in both housing and transportation costs have outpaced incomes, leading most households in the region to spend an increasing share of income on both compared to 10 or 20 years ago.
Nearly Half of Region’s Renters Are Paying More Than 30 Percent of Income for Housing The housing boom of the early 2000s saw a run-up in the share of households in which housing costs consumed more than 30% of household income, which is a standard affordability benchmark for housing used by the U.S. Department of Housing and Urban Development and others. Figure 3-6 shows that this gradual upward trend in cost-burdened households appeared to affect both renter-households as well as owner-occupied

P L A N B A Y A R E A E Q U I T Y A N A L Y S I S R E P O R T 3 - 1 1
households similarly up until the housing crash of 2007, when the share of all households burdened by housing costs began to level off for several years. As the housing market corrected in the late 2000s, many former homeowners became renters again, and those prospective homeowners who may have bought homes in years prior continued renting due to either reluctance or inability to buy, pressure began to mount on the rental-home market, driving up rents in many areas of the region, especially the largest cities of San Francisco, Oakland, and San Jose.
Figure 3-6. Share of Bay Area Households Spending More Than 30% of Income on Housing Costs,
1990–2011
Source: Tabulation prepared by MTC staff based on data from the 1990 Census Summary Tape File 3 (Tables H051 and H058), Census 2000 Summary File 3 (Tables H69 and H94), and the American Community Survey 2006-2011 (Tables B25070 and B25091).
The result in recent terms appears to have been a slight upward trend for renter-households burdened by housing costs starting in 2011, which now totals 49% of all renter households in the region, the highest level seen during the time period analyzed, and a slight downward trend for the share of cost-burdened owner-occupied households, which dropped in 2011 to 39%, a level last seen around 2004, just prior to the peak of the housing boom. Nevertheless, levels across the board remain notably higher than they were in either 1990 or 2000, suggesting there may be a longer-term trend of regional housing costs rising faster than household incomes have been able to keep up.
Day-to-Day Transportation Costs Have Risen Relative to Incomes In addition to the pressures of high housing costs on household incomes, costs associated with day-to-day transportation have also risen relative to incomes since 2000. Figure 3-7
0%
10%
20%
30%
40%
50%
60%
1990 2000 2001 2002 2003 2004 2005 2006 2007 2008 2009 2010 2011
Renter Households
Owner-Occupied Households
All Households

3 - 1 2 C H A P T E R 3 | R E G I O N A L T R E N D S
shows the relationship between inflation-adjusted gas prices per gallon, average transit fares paid, and per-capita income in the Bay Area.
Figure 3-7. Inflation-Adjusted Bay Area Gas Prices, Transit Fares, and Per-Capita Income, 2000–2010
Source: MTC staff analysis of Statistical Summary of Bay Area Transit Operators; U.S. Dept. of Energy , Energy Information Administration; Census 2000 SF3 Tables P9 and P54; American Community Survey 1-Year Sample Data, 2005 through 2010, Tables B19025 and B11002. Note: All values in 2010 dollars.
The average transit fare paid per trip in the region rose 34% between 2000 and 2010, from an inflation-adjusted $1.13 to $1.52. During this same period, the average price for a gallon of gasoline in the Bay Area rose 30%, from $2.43 to $3.17, although with notably more fluctuation during this period than transit fares. Meanwhile, per-capita income in the region fell in real terms by 12%, from $41,138 in 2000 to $36,012 in 2010.
Because the vast majority of the region’s workers commute by either automobile or transit (as seen in Figure 3-4 on page 3-8), these rising costs are likely to be putting increasing pressure on personal incomes that are not keeping up.
$0
$5,000
$10,000
$15,000
$20,000
$25,000
$30,000
$35,000
$40,000
$45,000
$50,000
$0.00
$0.50
$1.00
$1.50
$2.00
$2.50
$3.00
$3.50
$4.00
2000 2001 2002 2003 2004 2005 2006 2007 2008 2009 2010
Average transit fare paid per trip (left axis)Retail gas price per gallon (left axis)Annual income per capita (right axis)

P L A N B A Y A R E A E Q U I T Y A N A L Y S I S R E P O R T 4 - 1
Chapter 4. Analysis Results
This chapter summarizes the equity analysis results, incorporating where relevant findings from related Title VI analyses (in the distribution of certain investment benefits and the spatial distribution of projects included in the Plan) intended to satisfy federal nondiscrimination requirements and environmental justice analyses intended to address whether communities of concern are subject to disproportionately high and adverse effects of the Plan’s overall development and investment strategy.
Summary of Previous Scenario Analyses The analysis of the Plan Bay Area EIR Scenarios is actually the fourth round of equity analysis completed for Plan Bay Area. Consistent with MTC’s adopted Public Participation Plan, equity analysis results were produced with every round of scenarios analyzed throughout the Plan Bay Area process, to provide the Regional Equity Working Group and other stakeholders the opportunity to provide feedback on both methods and results along the way, and to help inform each subsequent round of scenarios as they were refined. This section summarizes the results of prior rounds of Plan Bay Area equity analyses carried out during development of.
Initial Vision Scenario In March 2011, MTC and ABAG conducted a preliminary equity analysis of the Initial Vision Scenario, which was an initial, unconstrained visioning exercise intended to be a starting point in developing the Sustainable Communities Strategy. Building off of the ten performance targets adopted by MTC and ABAG in January 2011,36 this initial round of
36 For details on the adopted Performance Targets for Plan Bay Area, see MTC Resolution 3987: http://apps.mtc.ca.gov/meeting_packet_documents/agenda_1599/Revised_-_tmp-3987.pdf.

4 - 2 C H A P T E R 4 | A N A L Y S I S R E S U L T S
equity analysis presented results for the performance targets broken out by income level where possible in an effort to reveal whether the benefits and burdens forecast by the performance targets were equally distributed between low-income and non-low-income households.37 Where possible, these outcomes were also compared with current conditions. The intent of this preliminary analysis was to identify potential negative regional equity results at the beginning of the planning process and to provide a starting point for refining the equity analysis methodology to be used in subsequent rounds of analysis.
Key feedback received from stakeholders on the results of the Initial Vision Scenario equity analysis were that a more targeted definition of communities of concern should be developed for subsequent analysis, and that different performance measures should be developed to more directly address priority equity issues for communities of concern.
Alternative Scenarios Based on stakeholder feedback on the Initial Vision Scenario equity analysis, MTC and ABAG staff developed a substantially revised methodology and new performance measures to analyze the Alternative Scenarios for equity, as summarized in Chapter 2, Methodology, which was presented to MTC’s Planning Committee in October 2011. MTC and ABAG developed the five Alternative Scenarios to explore different land use and transportation investment strategies that might meet the region’s long-range goals, including the CARB-mandated greenhouse-gas reduction target.
In December 2011, MTC and ABAG released a second round of equity analysis results for the Alternative Scenarios.38 These results revealed substantial future challenges facing low-income households and communities of concern with regards to housing and transportation affordability and displacement potential, and led to some methodology refinements to the Housing and Transportation Affordability measure based on stakeholder feedback received and some technical modifications to the VMT Density measure.
Of the Alternative Scenarios analyzed, the Priority Development Area–oriented “Focused Growth” scenario that most closely resembled what became the Draft Preferred Scenario offered “middle of the road” performance across all equity measures. Findings from the Alternative Scenarios equity analysis also helped inform subsequent discussions to frame policy for the region’s OneBayArea Grant program, which was adopted in May 2012,
37 For additional information on methodology and results from this round of equity analysis, see the Initial Vision Scenario Report at http://www.onebayarea.org/pdf/Initial_Vision_Scenario_Report.pdf. 38 For a summary of the Alternative Scenarios equity analysis results, see: http://onebayarea.org/pdf/EquityAnalysisOverview.pdf.
P L A N B A Y A R E A E Q U I T Y A N A L Y S I S R E P O R T 4 - 3
especially with regards to incorporating low-income housing and anti-displacement incentives into the OBAG program guidelines.39
Draft Preferred Scenario In May 2012, MTC and ABAG released preliminary equity analysis results for 2005 and 2035 under the Draft Preferred Scenario using the methodology initially developed and subsequently refined with the Alternative Scenarios equity analysis.40 These results continued to emphasize overarching regional challenges related to Housing and Transportation Affordability for low-income households and Potential for Displacement in communities of concern under the Draft Preferred Scenario, both of which were addressed in the OBAG program guidelines adopted by MTC at the same time that MTC and ABAG approved the Draft Preferred Scenario.
The remainder of this chapter covers analysis results for the draft Plan Bay Area Transportation Investment Analysis as well as technical performance measures for the final draft Preferred Scenario (the EIR-defined Project), as well as the other EIR alternatives described in Chapter 2, Section 2.3.
4.1 TRANSPORTATION INVESTMENT ANALYSIS
Analyses of the distribution of transportation funding included in this section serve two main purposes, which are described in greater detail in Chapter 1 (Section 1.2, Legal, Regulatory, and Policy Context):
1. A general analysis of all transportation funding sources and purposes provided as part of MTC’s commitment to environmental justice, and in particular MTC Environmental Justice Principle #2.
2. A more targeted analysis of particular funding sources and purposes that serves to address specific federal requirements for metropolitan planning organizations like MTC to ensure nondiscrimination in the metropolitan planning process41 under Title VI of the Civil Rights Act of 1964.
39 These are discussed further below in Section 4.3, under “Complementary Regional Policies and Planning Efforts” (see page 4-20). 40 For a summary of Draft Preferred Scenario equity analysis results, see http://apps.mtc.ca.gov/meeting_packet_documents/agenda_1875/Item_4a_Pref._Land_Use_Scenario_Transp._Invest._Strategy.pdf. 41 As part of the overall metropolitan planning process, MTC also conducts a similar analysis of the short-range Transportation Improvement Program (TIP). See http://www.mtc.ca.gov/funding/tip/ for more.

4 - 4 C H A P T E R 4 | A N A L Y S I S R E S U L T S
Both analyses are described below, and include two different analytical approaches described further in Chapter 2, Section 2.4. The population/use-based analysis characterizes the quantitative distribution of transportation investments in the Plan based on the region’s share of low-income and minority populations, as well as each group’s relative share of system usage for both roadways and transit. The mapping analysis is a qualitative assessment of the spatial location of major projects included in the Plan’s investment strategy relative to the locations of minority communities and communities of concern within the region.
Population/Use-Based Analysis This section presents the results of the population/use-based investment analysis. The analysis follows the four-step methodology described in Chapter 2, Section 2.4, beginning on page 2-15.
1. Establish Regional Population and System Usage Demographics The population/use-based analysis requires first dividing both the region’s total population and total trips into two population subgroups by minority status and low-income status, as shown in Table 4-1. Note both the minority and low-income subgroups’ trip-making represents a smaller share of the regional total relative to their respective populations. Some of this difference is attributable to slight differences in overall regional demographics between the two datasets used (2010 Census Bureau data for populations, 2000 Bay Area Travel Survey data for trips), but particularly for the population in low-income households it is clear that their share of trip-making (18%) is substantially smaller than their share of the region’s population (31%).
Table 4-1. Regional System Usage and Population by Subgroup
Average Daily Trips Population
Subgroup # % # % Minority Minority 9,147,768 43% 4,117,836 58% Status Non-minority 12,200,114 57% 3,032,903 42% Total 21,347,882 100% 7,150,739 100%
Low-Income Low-Income 3,392,623 18% 2,211,080 31% Status Not Low-Income 15,888,378 82% 4,843,266 69% Total 19,281,001 100% 7,054,346 100%
Sources: 2010 Census SF1 ; 2010 American Community Survey Public Use Microdata Sample 1-Year Estimates; Bay Area Travel Survey 2000. Notes: Low-income universe is population in households, excluding persons living in group quarters. Low-income households adjusted for inflation across different data sources/years to capture households with incomes below $50,000 per year in 2006 dollars.

P L A N B A Y A R E A E Q U I T Y A N A L Y S I S R E P O R T 4 - 5
2. Split P lan Investments by Mode To begin allocating investment benefits to different subgroups based on usage, first the total Plan Bay Area investments are separated out into two modal categories, funding for transit projects and funding for road, highway, and bridge projects, as shown in Figure 4-1.
Figure 4-1. Plan Bay Area Investments by Mode,
in Millions of Year-of-Expenditure Dollars
Source: MTC
This analysis represents roughly $278 billion of investments over the Plan’s 28-year horizon that could be broken out into either primarily transit or roadway investment categories. A small amount of the Plan’s investments were excluded from the analysis in cases where investments had no modal component (such as regional planning funds, Climate Program funds, etc.) or otherwise could not be assigned primarily to the benefit of either roadway or transit users. More information about the overall Plan Bay Area investment strategy can be found in the Draft Plan Bay Area document (Chapter 4, Investments).
3. Assign Investment by Mode to Population Subgroups Next, investments within each category are allocated to either minority or non-minority, or low-income or non-low-income populations, based on each subgroup’s share of usage of each modal system. For transit investments, assignments were based on each individual transit operator’s share of minority and low-income riders, or, for regional investments, to a regional average. For road and highway investments, assignments were based on the share by county of vehicle-miles of travel (VMT) by minority and low-income drivers. For simplicity, only the regional average usage shares for each mode are shown in Table 4-2;
Transit $172,515
62%
Road/ Highway/
Bridge $105,184
38%
Total = $277,699

4 - 6 C H A P T E R 4 | A N A L Y S I S R E S U L T S
actual investment allocations to specific counties and transit operators varied based on the specific demographic characteristics of each county/transit operator.42
Table 4-2. Share of System Use by Mode by Subgroup (Regional Summary)
Subgroup
Transit System
Use (Ridership)
Roadway System Use
(Vehicle-Miles of Travel)
Minority Minority 62% 38% Status Non-minority 38% 62% Total 100% 100%
Low-Income Low-Income 55% 13% Status Not Low-Income 45% 87% Total 100% 100%
Sources: 2006 Transit Passenger Demographic Survey, 2000 Bay Area Travel Survey.
Relative to the comparison of regional population characteristics to regional trip-making by all modes shown in Table 4-1, the distribution of system usage in terms of transit ridership and VMT in Table 4-2 shows even greater differences between the population subgroups by mode. Relative to their 58% share of the total population and 43% of all trips shown in Table 4-1, minority persons are more likely to be represented among transit ridership (62%), and less likely to be contributing to total roadway usage in terms of VMT (38%). Differences between population representation and system usage are even more pronounced for persons in low-income households. Compared to low-income persons’ 31% share of the total population and 18% of trips, low-income persons are far more likely to be represented in the share of regional transit ridership (55%), and far less likely to contribute to total regional VMT (13%).
4. Analysis Results: Sum All Investments by Population Subgroup and Compare Each Group’s Share of Investments to Shares of Regional System Usage and Population To complete the analysis, investments are summed for each population subgroup, first separately by mode (all transit funding and all road/highway/bridge funding), then finally as a grand total for all investments combined.
Results: Funding Allocation by Mode. Based on each population subgroup’s share of system usage by county and transit operator, Plan Bay Area investments were allocated by mode to each subgroup. Table 4-3 shows the results for transit investments, allocated in terms of usage by individual transit operator demographics. Table 4-4 shows the results for road,
42 For more details on demographics by specific Bay Area transit operators, see under “Chapter 4: System-Level Key Findings” at http://dataportal.mtc.ca.gov/2006-transit-passenger-demographic-survey.aspx.

P L A N B A Y A R E A E Q U I T Y A N A L Y S I S R E P O R T 4 - 7
highway, and bridge investments, allocated in terms of usage by individual county-usage demographics.
Table 4-3. Plan Bay Area Transit Investments by Population Subgroup
Subgroup
Total Plan Bay Area Transit
Funding (Millions of
YOE $)
% of Total
Transit Funding
% of Regional Transit
Ridership
% of Total Regional
Population Minority Minority $107,950 63% 62% 58% Status Non-minority $64,564 37% 38% 42% Total $172,515 100% 100% 100%
Low-Income Low-Income $95,663 55% 55% 31% Status Not Low-Income $76,852 45% 45% 69% Total $172,515 100% 100% 100%
Source: MTC analysis of Plan Bay Area investments, 2006 Transit Passenger Demographic Survey, 2010 Census SF1, 2010 American Community Survey Public Use Microdata Sample 1-Year Estimates. Note: Totals may not sum due to rounding.
Table 4-4. Plan Bay Area Road, Highway, and Bridge Investments by Population Subgroup
Subgroup
Total Plan Bay Area Road/
Highway/ Bridge Funding (Millions
of YOE $)
% of Total Road/
Highway/ Bridge
Funding
% of Regional
VMT
% of Total Regional
Population Minority Minority $41,169 39% 38% 58% Status Non-minority $64,015 61% 62% 42% Total $105,184 100% 100% 100%
Low-Income Low-Income $13,782 13% 13% 31% Status Not Low-Income $91,402 87% 87% 69% Total $105,184 100% 100% 100%
Source: MTC analysis of Plan Bay Area investments, 2000 Bay Area Travel Survey, 2010 Census SF1, 2010 American Community Survey Public Use Microdata Sample 1-Year Estimates.
Looking at the investments broken out by mode based on usage reveals how regional investments in transit generally have a disproportionate benefit to both minority and low-income users compared to their share of the regional population, as both minority and low-income persons have a greater propensity to use transit relative to their overall share of the regional population. Conversely, because minority and low-income populations are relatively underrepresented in the share of regional roadway usage relative to their share of the region’s population, regional investments in roads, highways, and bridges generally tend to disproportionately benefit the region’s non-minority and non-low-income populations.
Furthermore, because investments by mode were suballocated to account for demographic differences between counties (for road/highway usage) and transit operators (for transit
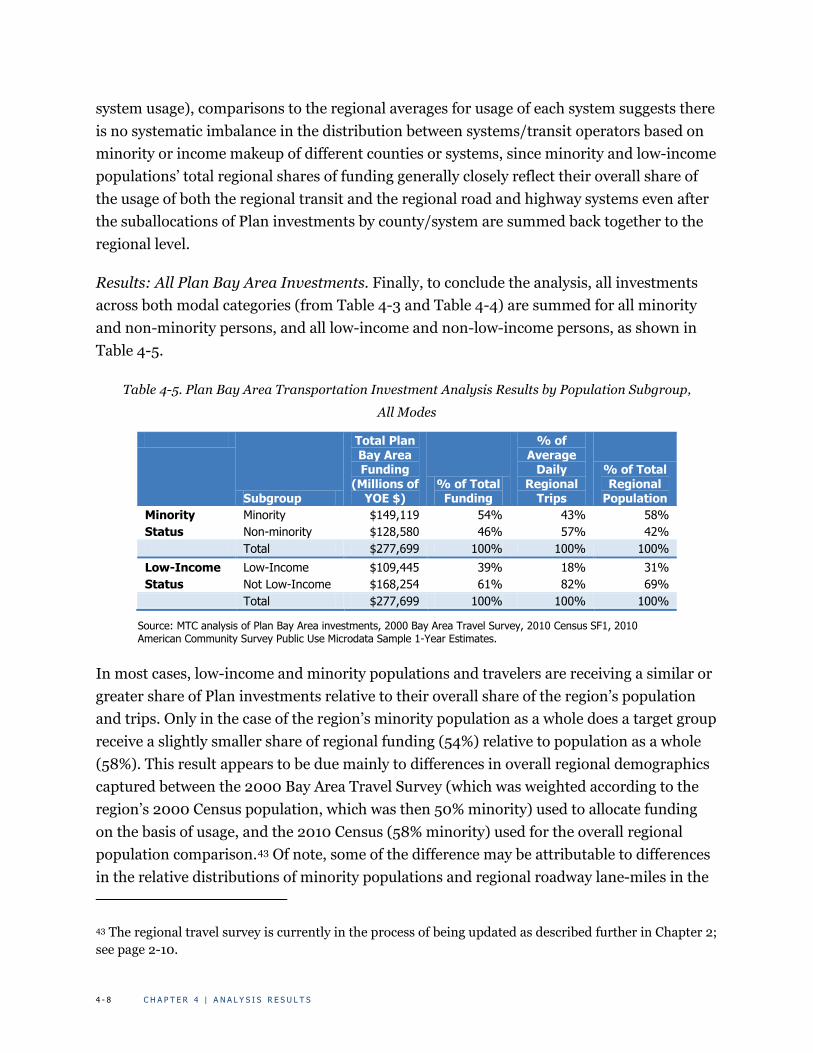
4 - 8 C H A P T E R 4 | A N A L Y S I S R E S U L T S
system usage), comparisons to the regional averages for usage of each system suggests there is no systematic imbalance in the distribution between systems/transit operators based on minority or income makeup of different counties or systems, since minority and low-income populations’ total regional shares of funding generally closely reflect their overall share of the usage of both the regional transit and the regional road and highway systems even after the suballocations of Plan investments by county/system are summed back together to the regional level.
Results: All Plan Bay Area Investments. Finally, to conclude the analysis, all investments across both modal categories (from Table 4-3 and Table 4-4) are summed for all minority and non-minority persons, and all low-income and non-low-income persons, as shown in Table 4-5.
Table 4-5. Plan Bay Area Transportation Investment Analysis Results by Population Subgroup,
All Modes
Subgroup
Total Plan Bay Area Funding
(Millions of YOE $)
% of Total Funding
% of Average
Daily Regional
Trips
% of Total Regional
Population Minority Minority $149,119 54% 43% 58% Status Non-minority $128,580 46% 57% 42% Total $277,699 100% 100% 100%
Low-Income Low-Income $109,445 39% 18% 31% Status Not Low-Income $168,254 61% 82% 69% Total $277,699 100% 100% 100%
Source: MTC analysis of Plan Bay Area investments, 2000 Bay Area Travel Survey, 2010 Census SF1, 2010 American Community Survey Public Use Microdata Sample 1-Year Estimates.
In most cases, low-income and minority populations and travelers are receiving a similar or greater share of Plan investments relative to their overall share of the region’s population and trips. Only in the case of the region’s minority population as a whole does a target group receive a slightly smaller share of regional funding (54%) relative to population as a whole (58%). This result appears to be due mainly to differences in overall regional demographics captured between the 2000 Bay Area Travel Survey (which was weighted according to the region’s 2000 Census population, which was then 50% minority) used to allocate funding on the basis of usage, and the 2010 Census (58% minority) used for the overall regional population comparison.43 Of note, some of the difference may be attributable to differences in the relative distributions of minority populations and regional roadway lane-miles in the
43 The regional travel survey is currently in the process of being updated as described further in Chapter 2; see page 2-10.
P L A N B A Y A R E A E Q U I T Y A N A L Y S I S R E P O R T 4 - 9
region. A sizeable share of funding in the Plan is dedicated to maintaining the region’s existing roadways, and some counties have disproportionate shares of the region’s road and highway network relative to their respective shares of the region’s total minority population. Nevertheless, some fund sources dedicated to maintaining the region’s roadways, such as the state excise gas tax, are statutorily dedicated to jurisdictions based in part on lane-mileage.
Project Mapping Another component of the Transportation Investment Analysis is mapping the locations of Plan Bay Area projects overlaid with communities of concern and minority communities, as described further in Chapter 2, Section 2.4. The goals of this analysis are to qualitatively assess the spatial distribution of Plan Bay Area investments, examining the distribution of projects for any apparent systematic exclusion of communities of concern or minority communities at the regional level, or any apparent systematic imbalances between the distribution of projects between communities of concern and the remainder of the region, or between minority and non-minority communities. This assessment is intended to provide a regional overview of Plan Bay Area’s investment program as a whole; individual projects will be subject to their own Title VI and environmental justice requirements during implementation as required under NEPA/CEQA and relevant regulations.
Mapping Results: Communities of Concern Figure 4-2 on page 4-11 shows mappable Plan Bay Area projects overlaid with communities of concern, in terms of both transit projects shown in blue and roadway projects in red, represented as either points (for projects with a specific location, such as an interchange or transit station) or lines (for projects involving an entire corridor). Because Plan Bay Area emphasizes a focused-growth strategy overall, and most communities of concern are located in the region’s urban core, there is a fairly strong relationship overall between investments in the Draft Plan and communities of concern. More detailed maps of individual counties can be found in Appendix C (note Napa County has no communities of concern).
Based on this assessment, there does not appear to be any systematic exclusion of communities of concern or imbalance in spatial distribution of projects throughout the region. Furthermore, the projects as represented only show spatial location of mappable projects; they do not account for large amounts of funding in the Plan dedicated to maintaining the region’s transportation system overall or the relative magnitude of investments in terms of project cost.

4 - 1 0 C H A P T E R 4 | A N A L Y S I S R E S U L T S
Mapping Results: M inority Communities Next, the same Plan Bay Area projects were overlaid against census tracts with shares of minority populations above the regional average (58%), as shown in Figure 4-3 (see page 4-12). As with the communities-of-concern analysis, there is a strong relationship between the spatial distribution of Plan investments and minority communities. More detailed maps of individual counties can be found in Appendix C.
Based on this assessment, there does not appear to be any systematic exclusion of communities from Plan investments on the basis of minority status, or imbalances in the distribution of projects between minority and non-minority communities.
Other Equity-Related Project Mapping Efforts In addition to the specific overlays of Plan Bay Area project locations relative to communities of concern and minority communities included here, equity-related mapping was also incorporated into the Plan Bay Area Project Performance Assessment. To supplement the performance assessment of projects with respect to MTC’s and ABAG’s adopted performance targets, each major transportation project was mapped in order to determine whether it is located within a Community of Concern (CoC) or Community Air Risk Evaluation (CARE). Next, each project located in a Community of Concern was evaluated to determine whether it truly served that community, which was defined as providing access to the residents of that neighborhood (e.g. bus stop, rail station, interchange ramp, arterial intersections, etc.). Finally, three of the target scores most focused on equity issues — adequate housing, particulate matter emissions in CARE communities, and low-income H+T affordability — were summed to calculate an equity targets score ranging from +3 to –3, analogous to the overall target score. Further information on this equity review can be found in Appendix E of the Plan Bay Area Draft Performance Assessment Report; the equity target scores and corresponding equity maps can be found in Appendices J and K of the Performance Assessment report.
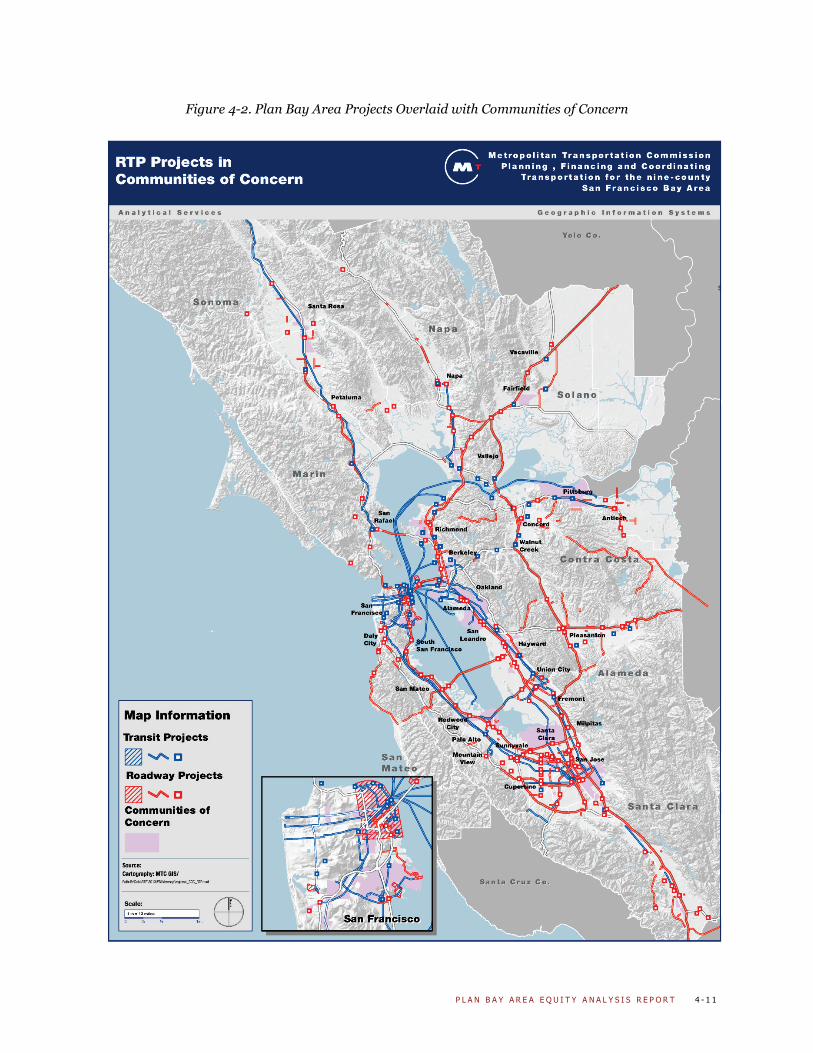
P L A N B A Y A R E A E Q U I T Y A N A L Y S I S R E P O R T 4 - 1 1
Figure 4-2. Plan Bay Area Projects Overlaid with Communities of Concern

4 - 1 2 C H A P T E R 4 | A N A L Y S I S R E S U L T S
Figure 4-3. Plan Bay Area Projects Overlaid with Above-Average-Minority Communities

P L A N B A Y A R E A E Q U I T Y A N A L Y S I S R E P O R T 4 - 1 3
Title VI Analysis The final component of the Plan Bay Area Transportation Investment Analysis is the Title VI analysis to evaluate the draft Plan’s investment strategy for any disparate impact on the basis of race, color, or national origin. The methodology for conducting this analysis is described in Chapter 2, in Section 2.4.
First, to address FTA’s MPO-specific requirements for Title VI disparate-impact analysis, Federal and State funding sources for public transportation are separated out from the whole of the Plan Bay Area investment program according to the fund sources described in Chapter 2, Section 2.4, and as illustrated in Figure 4-4.
Figure 4-4. Public Transportation Investments from Federal and State Sources
As a Share of All Plan Bay Area Investments
Source: MTC
Next, using the same methodology as the population/use based investment analysis presented above, the $39 billion in Plan Bay Area’s public transportation investments using Federal and State sources is distributed to minority and non-minority transit riders based on their respective shares of ridership among the various Bay Area transit agencies, and total investment shares are compared to the region’s overall transit ridership and populations as a whole, as shown in Table 4-6.
Transit - Federal
and State Sources $39,025
14%
Transit - Regional and Local Sources
$133,490 48%
Road/ Highway/ Bridge -
All Sources
$105,184 38%

4 - 1 4 C H A P T E R 4 | A N A L Y S I S R E S U L T S
Table 4-6. Plan Bay Area Federal and State Transit Investments by Minority Status
Subgroup
Total Federal/ State Transit
Funding (Millions of
YOE $)
% of Total Federal/
State Transit Funding
% of Regional Transit
Ridership
% of Total Regional
Population Minority $24,147 62% 62% 58% Non-minority $14,877 38% 38% 42% Total $39,025 100% 100% 100%
Source: MTC analysis of Plan Bay Area investments, 2006 Transit Passenger Demographic Survey, 2010 Census SF1. Note: Totals may not sum due to rounding.
Finally, investments are distributed on a per-capita and per-rider basis so that investment benefits accruing to the region’s minority riders and populations can be compared as a percentage to investment benefits accruing to the region’s non-minority populations and riders, as shown in Table 4-7 and Table 4-8, respectively.
Table 4-7. Disparate Impact Analysis of Plan Bay Area Federal and State Transit Investments:
Population Analysis
Subgroup
Total Federal/ State Transit
Funding (Millions of YOE $)
Regional Population
(2010) Per-Capita
Benefit
Minority Per-Capita Benefit as % of
Non-minority Per-Capita Benefit
Minority $24,147 4,117,836 $5.86 120% Non-minority $14,877 3,032,903 $4.91 -- Total $39,025 7,150,739 --
Source: MTC analysis of Plan Bay Area investments, 2006 Transit Passenger Demographic Survey, 2010 Census SF1. Note: Totals may not sum due to rounding.
Table 4-8. Disparate Impact Analysis of Plan Bay Area Federal and State Transit Investments:
Ridership Analysis
Subgroup
Total Federal/ State Transit
Funding (Millions of YOE $)
Avg. Daily Transit
Ridership (2006)
Per-Rider Benefit
Minority Per-Rider Benefit as % of
Non-minority Per-Rider Benefit
Minority $24,147 816,059 $29.59 99% Non-minority $14,877 498,303 $29.86 -- Total $39,025 1,314,362 --
Source: MTC analysis of Plan Bay Area investments, 2006 Transit Passenger Demographic Survey, MTC Statistical Summary for Bay Area Transit Operators. Note: Totals may not sum due to rounding.
On a per-capita population basis, Table 4-7 shows minority persons in the region are receiving 120% of the benefit of Plan Bay Area’s investments in public transportation from Federal and State sources compared to non-minority persons. On a ridership basis, Table

P L A N B A Y A R E A E Q U I T Y A N A L Y S I S R E P O R T 4 - 1 5
4-8 shows that minority riders are receiving 99% of the benefit of Federal- and State-funded transit investments in Plan Bay Area compared to non-minority riders. This 1% difference between minority and non-minority per-rider benefits is not considered statistically significant, and therefore this analysis finds no disparate impact in the distribution of Federal and State funding for public transportation purposes between minority and non-minority populations or riders in the draft Plan Bay Area investment strategy.
4.2 HOUSING AND TRANSPORTATION AFFORDABILITY
The Housing and Transportation Affordability measure is a key indicator of whether and to what degree the Draft Plan or any alternatives improve upon the steep housing and transportation affordability challenges facing the region’s low-income households. The idea of looking at housing and transportation as a combined metric was initially conceived by the Center for Neighborhood Technology (CNT) to capture the trade-offs many households make in choosing locations that may have cheaper housing but more expensive associated transportation costs (such as in auto-oriented suburban areas) versus locations that may have more expensive housing but which offer more transportation options that are less expensive than driving (such as walkable urban locations served by public transit).
The basic measure expresses H+T affordability as a percentage of household income as follows:
H + T % = Average household housing costs + Average household transportation costs
Average household income
Based on past H+T Affordability findings from the previous Regional Transportation Plan, Transportation 2035, MTC commissioned CNT to study of the current landscape of housing and transportation trade-offs made by the Bay Area’s low- and moderate-income households in depth.44 This study recommended regional investments to incentivize compact, mixed-use development in areas with transit as the best way for the region to address the long-germ H+T challenge for low- and moderate-income households.45
For Plan Bay Area, this measure builds on past MTC and ABAG efforts to forecast H+T affordability in the Transportation 2035 Plan by applying MTC’s more-advanced travel model to microsimulating household travel behavior for different household income groups,
44 See Bay Area Housing and Transportation Affordability: A Closer Look, at http://www.mtc.ca.gov/planning/smart_growth/housing/. 45 For more on the related Plan Bay Area performance target, see Chapter 5, Performance, in the Draft Plan Bay Area document.

4 - 1 6 C H A P T E R 4 | A N A L Y S I S R E S U L T S
and by ABAG applying different assumptions about housing costs for different scenarios by accounting for varying policies and subsidies that support development of affordable housing in the region.46 Nevertheless, the housing-and-transportation affordability trade-off remains a complex one, especially for low-income households most burdened by both high housing and high transportation costs, and as a single performance measure remains very challenging to forecast regionally over the long run. MTC and ABAG will continue to review and refine the methods used to develop these forecasts, while also pursuing regional initiatives to develop and preserve affordable housing near transit now and in the future.47
Results: Low-Income Households vs. Non-Low-Income Households Table 4-9 shows the housing and transportation affordability results for each scenario. Because each of the five scenarios combines different housing, land use, and transportation policies and assumptions, the estimated average monthly housing and transportation costs under each scenario are broken out separately for each income group, in addition to the “bottom line” total of combined housing and transportation costs (“H+T”) as a share of household income.
Table 4-9. Housing and Transportation Affordability Results for EIR Scenarios
2010 1 2 3 4 5 % Change
Base Year
No Project Project
Transit Priority
Network of Comm.
Env., Equity &
Jobs
Base Year to Project
No Project
to Project
Households <$38,000/
year
Housing % 46% 49% 46% 46% 46% 42% 0% -6% Transp % 26% 31% 28% 31% 28% 31% 7% -9%
H+T % 72% 80% 74% 77% 74% 73% 3% -7%
Households >$38,000/
year
Housing % 28% 29% 28% 28% 28% 28% 1% -3% Transp % 13% 15% 15% 15% 14% 15% 10% -4%
H+T % 41% 44% 43% 43% 42% 43% 4% -4%
Source: MTC and ABAG estimates. Note: Household income figures provided are in 2010 dollars.
Looking at all scenarios, the Environment, Equity, and Jobs Scenario (Alternative 5) has the lowest combined housing and transportation costs as a share of income for low-income households, due to inclusion of subsidies intended to fund affordable housing lowering the share of income spent on housing to 42% for low-income households, which offset this
46 A detailed summary of the methodology and assumptions used to generate this measure is provided in Appendix A. 47 Some of these are discussed in the following Section 4.3, under “Complementary Regional Policies and Planning Efforts” (page 4-20).

P L A N B A Y A R E A E Q U I T Y A N A L Y S I S R E P O R T 4 - 1 7
scenario’s relatively high transportation costs (31%) for a total H+T of 73%. The Project and the Enhanced Network of Communities Scenarios (Alternative 4) have the next-lowest combined housing and transportation costs relative to income for low-income households at 74%, by combining average housing costs per household similar to today’s levels (46%) with the second-lowest average transportation costs (28%). The No Project alternative has both the highest housing and transportation costs of any alternative (49% and 31%, respectively), and accordingly the highest combined housing and transportation costs as a share of income, at 80%. Scenario results for all income groups are also provided in Appendix D.
Variations in housing costs across the scenarios are based on different assumptions about housing policies and subsidies to support the development of affordable housing in the region, both in terms of continuing existing subsidies and creating new ones. As a result of continuing existing and applying new policies and subsidies, the share of income spent on housing for Alternatives 2, 3, and 4 remains the same as the base year after assuming that housing cost as a percentage of income follows recent trends and increases 1% per decade (or 3% overall), for low- and moderately-low-income households. For Alternative 5, it is assumed that a higher subsidy level would provide for double the level of affordable housing produced for low-income households, relative to Alternatives 2, 3 and 4.
Differences in transportation costs for low-income households across the scenarios are due primarily to varying levels of auto ownership assumed based on low-income households’ residential and employment locations (low-income households tend to own more cars in scenarios where these households are more dispersed such as 1, 4 and 5, and may drive them farther to jobs in more-concentrated employment-growth scenarios such as 3). In addition, in scenarios 1, 4 and 5, more low-income households and jobs are located in suburban areas, meaning more low-income households may commute by driving rather than by less-expensive transit, walking, or biking modes, which are less likely to be available or competitive with driving in terms of commute time.
All future-year scenarios increase the combined share of income spent by households on housing and transportation relative to the base year. While most scenarios besides the No Project assume housing costs stay similar or even lower relative to today, all scenarios see the impacts of higher transportation costs in the future due primarily to assumptions about higher fuel costs. Because low-income households are still most likely to travel by car than by any other mode (currently, 69% of workers below 200% of poverty commute by either driving alone or in carpools, as shown in Figure 3-4 on page 3-8), assumed higher fuel costs would certainly impact these households, and especially the many low-income households in more suburban and rural areas that lack affordable transportation alternatives where they live.

4 - 1 8 C H A P T E R 4 | A N A L Y S I S R E S U L T S
In comparison to the No Project alternative, low-income households see a proportionally greater improvement in affordability under the Project (a 7% reduction in housing and transportation costs as a share of income) than non-low-income households (a 4% reduction in percent of income spent on housing and transportation). So while housing and transportation costs as a share of income go up for all households compared to the base year, compared to the No Project, the Project does help reduce an existing disparity relative to the regional trend without implementing the Plan.
4.3 POTENTIAL FOR DISPLACEMENT
The Potential for Displacement measure is an analysis that overlays concentrations of today’s households spending more than half their incomes on rent (and who are thus considered already overburdened by housing costs considered high relative to their household incomes) with locations of more intensive planned housing growth by 2040 (defined as an 30% or greater increase in housing units relative to today, slightly above the regional average of 27% growth). It is intended to capture, at a neighborhood level, where clusters of vulnerable renters live today in relationship to neighborhoods that may face upward market pressures in the future based on planned growth patterns, revealing a potential for displacement in these neighborhoods strictly on the basis of the locations of future growth relative to the current circumstances of existing residents.
Specifically, the result for this measure is expressed as a share of total overburdened-renter households in either communities of concern or the remainder of the region that currently live in communities with both (1) concentrations of these households (more than 15% of all households) and (2) relatively high growth planned in the future. As was seen in Table 3-1 (page 3-2), there are about 85,000 overburdened-renter households living in communities of concern today (35% of the region’s total), and about 156,000 living in the remainder of the region (65% of the region’s total). Overburdened-renter households who live in neighborhoods that are below the concentration threshold or which are not planned for high growth in the future are thus not captured as having potential for displacement under this analysis.
Results: Communities of Concern vs. Remainder of Region Table 4-10 shows the analysis results for both communities of concern and the remainder of the region, as well as regionwide averages for each scenario. For communities of concern, the No Project and the Environment, Equity, and Jobs Scenarios have the least overlap between planned high-growth tracts and existing concentrations of overburdened renters. Tracts with these overlapping characteristics capture 21% of today’s overburdened renters

P L A N B A Y A R E A E Q U I T Y A N A L Y S I S R E P O R T 4 - 1 9
who live in communities of concern overall, mainly due to the fact that these scenarios assume more growth in suburban areas (generally outside of communities of concern) and/or in areas where there are not currently concentrations of overburdened renters. The Enhanced Network of Communities alternative and the Project have the greatest share of today’s overburdened renters included in tracts where these characteristics overlap, with 31% and 36%, respectively. Because this measure relies on a measure of future growth to calculate, there is not relevant comparison measure for the base year.
Table 4-10. Potential for Displacement As a Share of Today’s Overburdened-Renter Households Located
in Future High-Growth Areas: EIR Scenarios.
2010 1 2 3 4 5 % Change
Base Year
No Project Project
Transit Priority
Network of Comm.
Env., Equity &
Jobs
Base Year to Project
No Project to
Project
Communities of Concern n/a 21% 36% 25% 31% 21% n/a 68%
Remainder of Region n/a 5% 8% 7% 9% 6% n/a 67%
Regional Average n/a 12% 18% 13% 17% 12% n/a 46%
Source: ABAG calculations based on 2005-09 American Community Survey and ABAG forecasts.
Because having concentrations of overburdened-renter households was one of the criteria used in defining communities of concern (as described in Chapter 2, Section 2.1), it is not surprising that communities of concern have a higher overall share of households identified as having potential for displacement than the remainder of the region, since concentrations of overburdened renters was also one of the factors used in this analysis. The distinction is still relevant, however, because the communities of concern represent concentrations of low-income residents living where the draft Plan anticipates a large scale of public and private investment. The results suggest that these investments must be conscientiously designed to benefit existing residents and minimize the loss of existing, non-deed-restricted affordable housing.
Appendix D provides a more detailed breakdown of results by county, revealing that most overburdened-renter households in communities of concern identified as being in communities with future displacement potential under the Project are located in San Francisco, Alameda, and Santa Clara Counties. Notably, San Francisco as well as Alameda County’s major cities of Oakland and Berkeley, and San Jose in Santa Clara County, already have some of the strongest anti-displacement policies and regulations in the region (including eviction protections and/or rent control). However, these policies and regulations could not be accounted for in this analysis.

4 - 2 0 C H A P T E R 4 | A N A L Y S I S R E S U L T S
Comparing the Project to the No Project alternative, the focused-growth approach of the Project increases the displacement potential by approximately two-thirds, however this effect, while adverse, is not disproportionately high for communities of concern (68%) when compared to the remainder of the region (67%).
Complementary Regional Policies and Planning Efforts Because of the potential for adverse effects identified in this analysis under the Project for communities of concern, several regional initiatives have been identified that are either already in place or are in progress at the regional level to incentivize community stabilization and minimize existing and future displacement pressures on low-income households, although their potential effects could not readily be represented in this analysis. These initiatives include:
• OneBayArea Grant program guidelines.48 Using regional discretionary transportation funding available to MTC, OBAG incentivizes local community stabilization efforts to combat displacement pressures in two ways: (1) local jurisdictions will be required to have a general plan housing element adopted and certified by the California Department of Housing and Community Development (HCD) for the 2007–14 Regional Housing Needs Allocation (RHNA) for their general plans to be eligible for OBAG funds, which is expected to increase the availability of affordable housing in the future; and (2) the OBAG distribution formula rewards jurisdictions based on the construction of housing for very low- and low-income households as well as the current RHNA distribution of very low- and low-income units.
• Bay Area Transit Oriented Affordable Housing (TOAH) Fund.49 In 2010, MTC launched the Bay Area Transit Oriented Affordable Housing Fund with a $10 million commitment to establish a revolving loan fund to finance land acquisition for affordable housing development in select locations near rail and bus lines throughout the Bay Area, creating a $50 million fund total. Other investors include major banking institutions, national and regional foundations, and six community development financial institutions. In December 2012, the U.S. Environmental Protection Agency awarded MTC a 2012 National Award for Smart Growth Achievement for using creative approaches to build strong, sustainable communities while protecting human health. In February 2013, MTC approved an additional $10
48 For more information about OBAG and MTC Resolution 4035, see http://www.mtc.ca.gov/funding/onebayarea/. 49 For more information about TOAH, see http://bayareatod.com/.

P L A N B A Y A R E A E Q U I T Y A N A L Y S I S R E P O R T 4 - 2 1
million to support TOAH through the regional PDA Planning Grant program as part of the OneBayArea Grant program,50 which combined with matching funds will grow this fund to at least $90 million.
• Bay Area Regional Prosperity Plan. In recognition of ongoing concerns about current and future displacement pressures in the region, in 2011 MTC and ABAG sought and received funding from the U.S. Department of Housing and Urban Development Sustainable Communities Program to develop a Regional Prosperity Plan. The main goal of the Plan is to refine and implement the elements of the overall regional growth strategy (including Plan Bay Area) to help create middle-income jobs and develop and preserve affordable housing in transit-served communities. Among a variety of other activities (described further in Chapter 6, Next Steps), the Plan will build on past equitable-development work conducted by ABAG as part of the FOCUS program51 specifically to address risks of displacement for low-income communities and small business by: (1) providing community-response grants to grass-roots organizations; (2) developing a regional displacement “early warning system”; and (3) identifying strategies that can prevent displacement in at-risk communities.
4.4 VMT AND EMISSIONS DENSITY
The VMT Density measure is intended to quantify the effects of vehicle traffic in and near populated areas. It is a measure of the total vehicle-miles of travel on major roadways (defined as carrying 10,000 or more vehicles per day) within 1,000 feet of residential and commercial areas. VMT Density was selected for inclusion in the analysis on the recommendation of Equity Working Group members to serve as a proxy for the multiple adverse environmental exposures and hazards of traffic. The intensity of vehicle air pollution emissions, traffic noise, and safety hazards to non-motorized users are all generally proportional to the density and proximity of vehicles in an area. A number of scientific studies have demonstrated that areas with higher traffic density have poorer health outcomes and poorer quality of life.52
50 See MTC Resolution 4035, Revised: http://apps.mtc.ca.gov/meeting_packet_documents/agenda_2010/Item13_a_tmp-4035.pdf. 51 For more information on ABAG’s Development without Displacement initiative, see http://www.bayareavision.org/initiatives/equitabledevelopment.html. 52 For examples, see: Rioux et al. (2010). Characterizing Urban Traffic Exposures Using Transportation Planning Tools: An Illustrated Methodology for Health Researchers. Journal of Urban Health: Bulletin of the New York Academy of Medicine, Vol. 87, No. 2: 167–188; Gunier et al. (2003). Traffic Density in California: Socioeconomic and Ethnic Differences among Potentially Exposed Children. Journal of Exposure Analysis and Environmental Epidemiology 13: 240–246; Botteldooren et al. (2011). The

4 - 2 2 C H A P T E R 4 | A N A L Y S I S R E S U L T S
To supplement the more generic measure of VMT density, complementary measures of specific types of emissions are also presented, including coarse particulate matter (PM10), fine particulate matter (PM2.5), and particulates from diesel exhaust (diesel PM). Unlike smog-forming pollutants which have regional effects on air quality (and which are analyzed regionally in the Plan Bay Area Environmental Impact Report), each of these forms of emissions can have or are suspected of having localized effects on those exposed to roadways carrying high volumes of vehicles emitting them. Exposure to fine particulate matter and diesel particulates (a specific kind of pollutant known as a toxic air contaminant, or TAC) at sufficient concentrations is believed to increase people’s risk of getting cancer or experiencing other serious adverse health effects.53
How much of what kinds of pollutants are emitted from on-road vehicles depends on a variety of factors in addition to how many vehicles are traveling on the region’s major roadways (measured in vehicle-miles traveled, or VMT): how fast the vehicle is traveling (either in terms of free-flowing average speeds or based on the effects of congestion), whether the vehicle’s engine is warmed up, the vehicle’s fuel economy and weight class, and the type of engine fuel used. In addition, brake and tire wear are included as on-road mobile sources of PM10 and PM2.5 in this analysis.
To approximate the potential of risk from exposure to PM10, PM2.5, and diesel particulates, from on-road mobile sources, this analysis uses a localized emissions inventory as a proxy for exposure risk.54 MTC uses a California-specific transportation emission-factor analysis tool, EMFAC2011, to model these emissions based on estimated VMT and vehicle speeds in each planning alternative. Vehicle travel and associated emissions are assigned either to communities of concern or the remainder of the region, depending on where the travel takes place on the region’s network of freeways, expressways, and major arterials.
To control for the differing geographical extents of impacted areas in communities of concern (around 20% of the region’s developed land area near major roadways) and the
Influence of Traffic Noise on Appreciation of the Living Quality of a Neighborhood. International Journal of Environmental Research and Public Health 8: 777–798. 53 For more information specifically on mobile-source air toxics, see the U.S. Environmental Protection Agency’s web page on Mobile Source Air Toxics at http://www.epa.gov/otaq/toxics.htm. 54 Typically, exposure risk is estimated from a variety of factors including total emissions inventory (on-road mobile, other mobile, and stationary sources), distance from source, prevailing wind direction, and other socioeconomic and demographic risk factors. The Bay Area Air Quality Management District, through its Community Air Risk Evaluation (CARE) Program, evaluates localized exposure risks to air toxics based on air quality models that more accurately predict the location and extent of concentrations, but these models do not produce estimates for the Plan Bay Area forecast year of 2040. For more information on the CARE Program, see http://www.baaqmd.gov/CARE/index.htm.

P L A N B A Y A R E A E Q U I T Y A N A L Y S I S R E P O R T 4 - 2 3
remainder of the region (around 80%), the average weekday emissions inventory is divided by the area of developed land within 1,000 feet of major roadways in both communities of concern and the remainder of the region: this area is the sum of all residential, commercial, and industrial land, representing areas where people and activities are typically located.
In addition to the overall density measures produced for both VMT and emissions, a measure of the distribution of VMT and emissions relative to the distribution of the region’s population within the region is also presented. This VMT Distribution Index is intended to characterize the extent to which communities of concern or the remainder of the region may be bearing disproportionate shares of regional vehicle travel/emissions relative to their respective population shares. The index is presented as a ratio of the percentage of regional VMT/emissions divided by the percentage of regional population occurring in either communities of concern or the remainder of the region. A result of 1 represents equal shares of VMT/emissions and population, a result less than 1 represents a smaller share of regional VMT/emissions relative to population, and a result greater than 1 represents a greater share of regional VMT/emissions relative to population.
Results: Communities of Concern vs. Remainder of Region
VMT Density Table 4-11 shows the results for the VMT Density measure for communities of concern and the remainder of the region. Generally, all future-year scenarios have higher VMT per square kilometer of impacted areas compared to the base year, mainly owing to the increased population in 2040.
Table 4-11. VMT Density Results by Community Type: Average Daily Vehicle-Miles of Travel per Square
Kilometer of Developed Area Within 1,000 Feet of Major Roadways for EIR Scenarios
2010 1 2 3 4 5 % Change
Base Year
No Project Project
Transit Priority
Network of Comm.
Env., Equity &
Jobs
Base Year to Project
No Project to
Project
Communities of Concern 9,737 11,447 11,693 11,536 12,123 11,259 20% 2%
Remainder of Region 9,861 11,717 11,895 11,804 12,261 11,626 21% 2%
Regional Average 9,836 11,664 11,855 11,751 12,234 11,554 21% 2%
Source: MTC estimates.
The alternative with the highest VMT density, Scenario 4, also has the highest regional population included in any of the scenarios. Scenario 5 has the lowest VMT density overall and for communities of concern in particular, likely owing to the combination of a relatively

4 - 2 4 C H A P T E R 4 | A N A L Y S I S R E S U L T S
dispersed regional growth pattern shifting some vehicle travel to non-communities of concern, combined with greater emphasis on transit service lowering VMT overall (and within communities of concern) relative to the other alternatives.
More detailed results for this measure, including results by community type by county, can be found in Appendix D. The county-level results reveal that areas with the highest relative VMT density, in both the base year and the forecast scenarios, include Marin County’s communities of concern, San Mateo County’s communities of concern, and the remainder of Alameda County. Areas with the lowest VMT density relative to the region overall include Napa County, San Francisco’s communities of concern, and the remainder of San Francisco County. San Francisco appears as having lower VMT density throughout using this methodology, because it is both a small county and has the highest transit use in the region. In addition, it generates a relatively small share of the region’s vehicle travel overall.
Looking at the comparison between the Project and the No Project, the Project has slightly greater VMT Density results than the No Project, both in communities of concern as well as the remainder of the region. This result may be due to the more focused growth pattern of the Project putting more vehicle-travel demand on already heavily-used roadways that are near populated areas, whereas the No Project scenario would shift more of this demand to more dispersed parts of the region and distribute more demand to less-heavily used roadways and/or those not proximate to developed areas. Similar to the Project, Scenario 3, the Transit Priority Focus, also has greater VMT Density results than the No Project, which may seem counterintuitive given the greater emphasis on non-auto travel modes. However Scenario 3’s more-concentrated growth pattern appears to counteract gains made by shifting more trips to transit by putting more additional demand on already heavily-used roadways near developed areas.
Comparing the distribution of impacts of the Project between communities of concern and the remainder of the region, compared to the No Project scenario, the Project has a similar impact on both communities of concern and the remainder of the region. VMT Density increases by 2% for all communities of concern as well as for the remainder of the region.
Emissions Density Table 4-12 shows the results for the Emissions Density measure, which corresponds closely to the VMT Density results across scenarios insofar as total emissions are closely tied to total vehicle travel. The main difference in looking at emissions in comparison to VMT is that emissions either hold relatively steady or else decline in the future-year scenarios relative to the base year, even while VMT Density was shown to increase in Table 4-11. This is due primarily to assumptions about technological improvements on vehicles lowering the

P L A N B A Y A R E A E Q U I T Y A N A L Y S I S R E P O R T 4 - 2 5
emissions of diesel PM and PM2.5 in all scenarios compared to the base year, specifically from the implementation of the California Air Resources Board’s On-Road Heavy-Duty Diesel Vehicle Regulations, which aim to achieve an 85 percent reduction in diesel PM by 2023.
Table 4-12. Emissions Density Results by Pollutant by Community Type: Average Daily Kilograms of
Emissions per Square Kilometer of Developed Area Within 1,000 Feet of Major Roadways for EIR
Scenarios
2010 1 2 3 4 5 % Change
Base Year
No Project Project
Transit Priority
Network of Comm.
Env., Equity & Jobs
Base Year to Project
No Project
to Project
PM10 Communities of Concern 0.43 0.43 0.44 0.44 0.46 0.43 3% 2%
Remainder of Region 0.52 0.52 0.53 0.53 0.55 0.52 3% 1%
Regional Average 0.50 0.50 0.51 0.51 0.53 0.50 3% 1%
PM2.5 Communities of Concern 0.22 0.20 0.20 0.20 0.21 0.19 -11% 2%
Remainder of Region 0.27 0.24 0.24 0.24 0.25 0.23 -11% 1%
Regional Average 0.26 0.23 0.23 0.23 0.24 0.22 -11% 1%
Diesel PM
Communities of Concern 0.07 0.02 0.02 0.02 0.02 0.02 -69% 0%
Remainder of Region 0.09 0.03 0.03 0.03 0.03 0.03 -68% 2%
Regional Average 0.09 0.03 0.03 0.03 0.03 0.03 -68% 1%
Source: MTC estimates.
The exception to this trend is for PM10, which shows a slight increase between the base year and most alternatives. This is due to the relatively high proportion of dust from brake and tire wear included with PM10 emissions overall compared to PM2.5. Because dust from brake and tire wear is tied to overall VMT rather than other emissions factors (which vary based on assumptions about fleet makeup, fuel economy, and average speeds), the PM10 measure is more closely tied to VMT overall than the PM2.5 and Diesel PM measures, both of which reflect targeted policies and regulations to reduce these types of emissions specifically despite overall increases in regional VMT.
Given the focused-growth emphasis of the Project, there is a slight increase in emissions density under the Project compared to the No Project of around 1% overall. The differences in the distribution of this increase between communities of concern and the remainder of the region is minimal, but slightly greater for communities of concern in the case of PM10 and PM2.5, and less in the case of diesel PM.

4 - 2 6 C H A P T E R 4 | A N A L Y S I S R E S U L T S
VMT and Emissions Distribution Index Relative to Population The overall distribution of regional VMT relative to regional population in the various scenarios is shown in Table 4-13. This distribution index is another way to understand the differences between scenarios in terms of the relative distribution of population (including future growth) and vehicle travel (including future demand), which is represented as a ratio between each community type’s share of total regional VMT to each community type’s share of total regional population. Table 4-14 shows the same distribution results for emissions.
Table 4-13. VMT Distribution Index Results by Community Type: EIR Scenarios
2010 1 2 3 4 5 % Change
Base Year
No Project Project
Transit Priority
Network of Comm.
Env., Equity &
Jobs
Base Year to Project
No Project to
Project
Communities of Concern 0.96 0.99 0.87 0.96 0.90 0.99 -10% -13%
Remainder of Region 1.01 1.00 1.04 1.01 1.03 1.00 3% 4%
Source: MTC estimates.
Table 4-14. Emissions Distribution Index Results by Pollutant by Community Type: EIR Scenarios
2010 1 2 3 4 5 % Change
Base Year
No Project Project
Transit Priority
Network of Comm.
Env., Equity & Jobs
Base Year to Project
No Project
to Project
PM10 Communities of Concern 0.95 0.99 0.86 0.96 0.89 0.99 -10% -13%
Remainder of Region 1.01 1.00 1.04 1.01 1.03 1.00 3% 4%
PM2.5 Communities of Concern 0.95 0.98 0.86 0.96 0.89 0.99 -9% -13%
Remainder of Region 1.01 1.00 1.04 1.01 1.03 1.00 3% 4%
Diesel PM
Communities of Concern 0.89 0.83 0.77 0.81 0.83 0.84 -12% -14%
Remainder of Region 1.02 1.02 1.06 1.03 1.05 1.02 3% 4%
Source: MTC estimates.
Overall, communities of concern have a relatively smaller share of VMT and emissions compared to their shares of population (expressed as a distribution index of less than 1), due in part to the fact that more people in communities of concern walk, bike, or take transit, own fewer vehicles per household, and generally travel less overall compared to residents in the remainder of the region. However, it is important to note that this measure only captures the VMT and emissions that occur in a given community, not whether that community itself generated it. Comparing across scenarios, the Project has the lowest share of VMT and emissions relative to population in communities of concern (lower even than

P L A N B A Y A R E A E Q U I T Y A N A L Y S I S R E P O R T 4 - 2 7
the base year), presumably due to the increased population growth in communities of concern in the Project relative to other scenarios.
Appendix D provides a more detailed breakdown of these results by county by community type, showing that the areas of the region with the greatest shares of VMT relative to their populations include Sonoma County’s communities of concern (centered around the downtown and Roseland areas of Santa Rosa), Santa Clara County’s communities of concern (mainly comprising East San Jose), and the remainder of Alameda County. All of these areas feature major highway corridors and/or interchanges carrying large traffic volumes, such as Highway 101 in Sonoma County; numerous interchanges joining Interstates 680, 880, 280, and Highway 101 in Santa Clara County; and the Interstate 880/238/580 corridors in Alameda County.
Summary of Results and Potential Mitigation Measures To the extent that the Project relies on a focused-growth approach to meet the region’s greenhouse-gas reduction target mandated under SB375, there is a slight increase in both VMT and emissions density in the Project compared to the No Project alternative, which has a more dispersed growth pattern than the Project. For VMT density, that increase is distributed equally between communities of concern and the remainder of the region. For emissions density, communities of concern have a very slightly higher share of the increase than the reminder of the region for both PM10 and PM2.5, but (at 2% vs. 1%) this effect is not considered disproportionately high for communities of concern.
The Plan Bay Area Draft Environmental Impact Report analyzed TAC/PM2.5 emissions for CARE communities (those identified by the Bay Area Air Quality Management district as currently impacted and having vulnerable populations), with similar findings to the analysis for communities of concern presented above. Examples of mitigation measures proposed in the Draft EIR to be implemented by MTC/ABAG and BAAQMD to reduce PM2.5 and TAC emissions from on-road trucks and locomotives identified in the Draft EIR include:55
• MTC/ABAG shall partner with BAAQMD to develop a program to install air filtration devices in existing residential buildings, and other buildings with sensitive receptors, located near freeways or sources of TACs and PM2.5.
• MTC/ABAG shall partner with BAAQMD to develop a program to provide incentives to replace older locomotives and trucks in the region to reduce TACs and PM2.5.
55 For more information, see Chapter 2.2 of the Plan Bay Area Draft Environmental Impact Report.

4 - 2 8 C H A P T E R 4 | A N A L Y S I S R E S U L T S
Limitations of Regional VMT and Emissions Density Measures These results in the aggregate appear as if communities of concern are less burdened by vehicle travel and its impacts than the remainder of the region based on the specific methodology selected, which appears through MTC’s travel demand model mainly to reflect lower overall automobile travel demand of residents in communities of concern56. Nevertheless, numerous local planning efforts and studies undertaken by MTC and others have revealed that on-road vehicle travel — particularly for trips neither originating in or ending in an affected community — is a major concern for many community-of-concern residents.
These concerns reflect both hazards posed to pedestrians and bicyclists from vehicles on heavily traveled streets as well as health concerns for residents of communities overburdened by pollution from multiple sources, including on-road mobile sources such as freeways and other heavily used corridors. Indeed, the county-level breakdown of results revealed several localized areas within the region where the VMT Density results do appear to reflect these concerns, including communities of concern in Marin, Sonoma, and San Mateo Counties, and the remainder of Alameda County. All of these locations have high VMT Density relative to other parts of the region and/or disproportionately high results relative to the rest of their respective counties. Still, MTC’s model is not able to reflect or quantify how much of total vehicle travel or emissions assigned to any given road segment in a community of concern may have originated within or out of a community of concern, only the aggregate total vehicle travel assigned to that segment in general.
Ultimately the question of whether the region is making progress toward the goal of making all communities healthy and safe places to live may be better addressed through regional monitoring efforts that can use past and current observed data at the neighborhood scale, rather than relying on regional-level forecasting methods, to determine whether metrics such as bicycle and pedestrian collisions and air quality are improving in the communities where these concerns are greatest. MTC and ABAG will continue to work with stakeholders and the Bay Area Air Quality Management District to refine the methodology to analyze these emissions relative to potential impact over the entire region for the purposes of long-range planning, and also in developing and maintaining regional monitoring efforts.
56 This lower overall demand for (and resulting propensity to generate) automobile travel is likely due to a variety of factors, including higher proportions of low-income households and zero-vehicle households in communities of concern, and lower relative VMT generation overall for low-income travelers (as presented in Table 4-2 on page 4-6, which showed that persons in household incomes below $50,000 per year generated only 13% of regional VMT compared to their 31% share of the population).

P L A N B A Y A R E A E Q U I T Y A N A L Y S I S R E P O R T 4 - 2 9
4.5 COMMUTE TIME
This measure provides average travel time per commute trip for all modes, based primarily on the locations of a worker’s residence and place of work and choice of travel mode. Under different transportation and land use scenarios, residential and employment location patterns vary, as do the modes of transportation available to workers by which to make their commutes, all of which influence commute time as an overall average. Generally, comparing travel time between home and work provides an indication of the proximity of jobs and housing for different groups.
Results: Communities of Concern vs. Remainder of Region Table 4-15 shows the Commute Time results for all scenarios for both communities of concern and the remainder of the region.
Table 4-15. Average Commute Time Results in Minutes by Community Type: EIR Scenarios
2010 1 2 3 4 5 % Change
Base Year
No Project Project
Transit Priority
Network of Comm.
Env., Equity &
Jobs
Base Year to Project
No Project to
Project
Communities of Concern 25 26 26 25 26 25 5% -1%
Remainder of Region 27 29 27 26 27 27 2% -6%
Regional Average 26 28 27 26 27 27 2% -5%
Source: MTC estimates.
Generally, there is not much variation between scenarios overall, and all future-year scenarios have increased travel times relative to the base year. Most of the variations in travel time are likely related to two factors: (1) increased population overall increases congestion, slowing travel speeds and hence increasing travel times for most modes; and (2) some automobile trips shift to non-auto modes that are generally slower on average than auto travel.57
57 In the case of average transit travel times, MTC’s model specifically assumes, for example, that part of any given transit trip has a built-in wait time of half the average headway (wait time between vehicles) for the given transit trip selected. So for a 20-minute in-vehicle ride on a bus that comes every 10 minutes the model assumes will total 25 minutes when an “average” wait time of 5 minutes is factored in, plus whatever time it takes the traveler to arrive at the transit stop based on how far it is from the traveler’s point of origin. Hence, differences between scenarios in wait times between transit vehicles will have an automatic impact on average commute time even before any other planning-related considerations such as residential/employment location patterns or varying levels of congestion are accounted for.

4 - 3 0 C H A P T E R 4 | A N A L Y S I S R E S U L T S
Appendix D provides more detailed results for this measure by income level, by mode, by county, and other characteristics, and also provides mode splits across scenarios for commuters by income level and community type. These more detailed results reveal that within the region, residents of Santa Clara, San Mateo, and San Francisco Counties’ communities of concern currently have the shortest commutes in the region, due mainly to proximity to major employment centers in San Jose and San Francisco. Areas with the longest average commutes include all residents of Contra Costa County (both communities of concern and the remainder of the county), and residents of the remainder of Marin County and remainder of Sonoma County, all of which have relatively few employment centers close to residents.
Comparing the Project to the No Project, communities of concern see a slightly smaller reduction in commute time relative to the remainder of the region. As noted above, this could be due either to increasing congestion in the urban core (where most communities of concern are located) under a focused-growth development pattern, and may also reflect some trips shifting from autos to generally slower modes with changes in land use patterns and supportive transit service improvements under the Project.
However, to the extent that trips shifted from autos to transit, walking, and biking are less expensive, cost-savings benefits of those trips shifted may outweigh the negligible increase in travel time for residents of communities of concern. This potential benefit was previously illustrated in Table 4-9 (see page 4-16), which showed an average reduction in transportation costs as a share of income of 7% for low-income households under the Project compared to the No Project. By comparison, even though the Transit Priority Focus and Environment, Equity, and Jobs Scenarios had very slightly shorter average commute times for communities of concern, both had higher transportation costs as a share of income than the Project for low-income households, as was seen in Table 4-9. These alternatives’ higher costs may be due in part to the greater emphasis on centralized employment growth in the Transit Priority Focus alternative creating longer commutes for low-income households elsewhere in the region, and the location of low-income households in more suburban areas in the Environment, Equity, and Jobs scenario, where they may need to own more cars per household to meet day-to-day transportation needs.
Appendix D has additional, more detailed commute-mode-share results for communities of concern, showing that, the share of commuters in communities of concern driving alone falls from 46% in the No Project scenario to 44% under the Project, while the share walking to transit increases from 9% to 10%, and the share walking or biking increases from 8% to 9%. To any extent low-income households and communities of concern are able to own fewer vehicles and be less dependent on driving for day-to-day commuting, these residents

P L A N B A Y A R E A E Q U I T Y A N A L Y S I S R E P O R T 4 - 3 1
will benefit under the Project in terms of lessening the overall burden of commuting costs on their household budgets.
Commute Time by Density Level: Urban vs. Suburban/ Rural Communities Because some members of the Equity Working Group raised concerns that planned investments following a regional focused-growth strategy would disadvantage communities of concern currently located in suburban and rural areas, commute times by community type were also broken out for urban communities versus suburban and rural communities,58 as shown in Table 4-16.
Table 4-16. Commute Time Results by Community Type by Density Level: EIR Scenarios
2010 1 2 3 4 5 % Change
Base Year
No Project Project
Transit Priority
Network of Comm.
Env., Equity & Jobs
Base Year to Project
No Project
to Project
Urban Communities of Concern 25 26 26 25 26 25 6% 1%
Remainder of Region 24 26 26 26 26 26 5% -1%
Sub-urban/ Communities of Concern 26 28 27 26 26 26 4% -4%
Rural Remainder of Region 28 30 28 27 28 28 1% -7%
Source: MTC estimates.
Under the Project, suburban and rural communities of concern actually see a slight reduction in average commute time relative to urban communities compared to the No Project scenario. This may be due to the Project’s focused-growth strategy encouraging more balanced employment growth throughout the region, including in accessible locations in and around suburban town centers, compared to the No Project scenario, which continues existing patterns of employment growth either in large established, urban centers far from suburban and rural communities of concern or else in more dispersed, auto-oriented suburban employment locations that may be less accessible to households in suburban communities of concern with fewer automobiles than workers.
58 For the purposes of this analysis, “urban” communities are defined as TAZs with an average gross density of 10,000 or more residents or jobs per acre; “suburban/rural” communities are defined as TAZs with an average gross density of less than 10,000 residents or jobs per acre.

4 - 3 2 C H A P T E R 4 | A N A L Y S I S R E S U L T S
4.6 NON-COMMUTE TIME
The measure of average travel time for non-commute trips is intended to be a measure of overall equitable mobility. Although commute trips are generally longer in time and length, more trips taken overall are non-commute trips, and include activities such as shopping, going to medical appointments, social and recreational trips, and other kinds of personal business that does not start or end at one’s place of work or school, such as leaving one’s house, going to the grocery store, and returning home. In addition, because many of the region’s low-income residents and residents of communities of concern are not workers (for example if they are students, retirees, unemployed, or not working for other reasons), focusing on these trips helps capture these residents’ travel habits in a way that focusing on commute trips does not.
Results: Communities of Concern vs. Remainder of Region Table 4-17 shows the average non-commute travel time results by community type. Across the scenarios, there is even less variation than was seen in the Commute Time results in Table 4-15. For discretionary travel, travelers may be even more sensitive to travel time overall in terms of where and whether they choose to go than they are for less-discretionary work and school trips, which generally occur for the same purpose in the same location and at the same times every day.
Table 4-17. Average Non-commute Time Results in Minutes by Community Type: EIR Scenarios
2010 1 2 3 4 5 % Change
Base Year
No Project Project
Transit Priority
Network of Comm.
Env., Equity &
Jobs
Base Year to Project
No Project to
Project
Communities of Concern 12 13 13 13 13 13 5% 0%
Remainder of Region 13 13 13 13 13 13 1% 0%
Regional Average 13 13 13 13 13 13 2% 0%
Source: MTC estimates.
Although a slight increase is noted in average travel times for communities of concern relative to the base year, there is a negligible difference between communities of concern and the remainder of the region in comparing the Project to the No Project.

P L A N B A Y A R E A E Q U I T Y A N A L Y S I S R E P O R T 5 - 1
Chapter 5. Summary and Conclusions
This chapter summarizes the results of all analyses presented in this report. Because this report is intended to satisfy both federal requirements related to nondiscrimination and ensuring environmental justice in the metropolitan planning process, as well as report on how well Plan Bay Area meets regional policy priorities concerning equity, three summaries are provided, one for each type of analysis conducted.
More information on the legal, regulatory, and policy framework underlying these analyses and conclusions can be found in Chapter 1, Section 1.2, Legal, Regulatory, and Policy Context.
5.1 TITLE VI ANALYSIS RESULTS
The purpose of the Title VI analysis is for MTC to demonstrate compliance with federal laws and regulations related to Title VI of the Civil Rights Act of 1964. DOT Title VI regulations prohibit recipients from utilizing criteria or methods of administration which have the effect of subjecting persons to discrimination because of their race, color or national origin. As an operating administration within DOT, FTA provides more specific guidance to metropolitan planning organizations on how to demonstrate compliance with Title VI.
Following FTA guidance, MTC’s disparate impact analysis of Plan Bay Area revealed that on a per-capita population basis, minority persons in the region are receiving 120% of the benefit of the Draft Plan’s investments in public transportation from Federal and State sources compared to non-minority persons. On a transit-ridership basis, minority transit

5 - 2 C H A P T E R 5 | S U M M A R Y A N D C O N C L U S I O N S
riders are receiving 99% of the benefit of Federal- and State-funded transit investments compared to non-minority transit riders. This 1% difference between minority and non-minority per-rider benefits is not considered statistically significant, and therefore this analysis found no disparate impact in the distribution of Federal and State funding for public transportation purposes between minority and non-minority populations or riders in the draft Plan Bay Area investment strategy.
5.2 ENVIRONMENTAL JUSTICE ANALYSIS RESULTS
As an environmental justice analysis, this report uses a set of performance measures to determine whether environmental-justice (EJ) populations are sharing equitably in the benefits of the Draft Plan’s investments without bearing a disproportionate share of the burdens. Specifically, under Executive Order 12898 and the associated DOT Order on Environmental Justice, MTC’s responsibility is to assist DOT, FHWA, and FTA in their mission “to avoid, minimize, or mitigate disproportionately high and adverse human health and environmental effects, including social and economic effects,” on EJ populations.
DOT defines a “disproportionately high and adverse effect” as an adverse effect that:
1. is predominately borne by a minority population and/or a low-income population, or 2. will be suffered by the minority population and/or low-income population and is
appreciably more severe or greater in magnitude than the adverse effect that will be suffered by the non-minority population and/or non-low-income population.
To summarize the environmental justice analysis, therefore, Table 5-1 presents the results of each of the measures analyzed in Chapter 4 in relation to whether the Draft Plan (a) poses adverse effects to EJ populations relative to the No Project scenario and (b) if so, whether the effect is disproportionately high.
Although none of the measures analyzed found a disproportionately high and adverse effect on EJ populations, in cases where the analysis found there was an adverse effect (even if not a disproportionately high one), mitigation measures or regional policies were nevertheless identified as proposed actions to address two measures in particular where EJ populations already bear high burdens to some degree, notably the Potential for Displacement Measure (see Chapter 4, Section 4.3) and the VMT and Emissions Density measures (see Chapter 4, Section 4.4).

P L A N B A Y A R E A E Q U I T Y A N A L Y S I S R E P O R T 5 - 3
Table 5-1. Summary of Environmental Justice Analysis Results for Plan Bay Area
Performance Measure
Does the Project Have an Adverse Effect on EJ
Populations?
Is Any Adverse Effect on EJ Populations Disproportionately
High?
Comple-mentary
Policies or Actions
Transportation Investment Analysis No No None
Housing and Transportation Affordability No No None
Potential for Displacement Yes No See Section 4.3
VMT Density Yes No See Section 4.4
PM10 Density Yes No "
PM2.5 Density No No "
Diesel PM Density No No "
Commute Time No No None
Non-commute Time No No None
5.3 OVERALL EQUITY ANALYSIS RESULTS: EIR ALTERNATIVES
Beyond federal requirements for nondiscrimination on the basis of race, color, and national origin and avoiding disproportionately high and adverse effects on EJ populations discussed in the previous sections, Regional Equity Working Group members and other stakeholders felt strongly that Plan Bay Area should aim to reduce existing disparities between communities of concern and the remainder of the region.
In order to summarize the analysis results in these terms, Table 5-2 presents each performance measure that was analyzed for all EIR alternatives and determines:
1. Whether a disparity currently exists at the regional level between communities of concern and the remainder of the region;
2. Whether the Draft Plan reduces any existing disparity; and 3. Whether the Draft Plan performs better than the other alternatives studied.
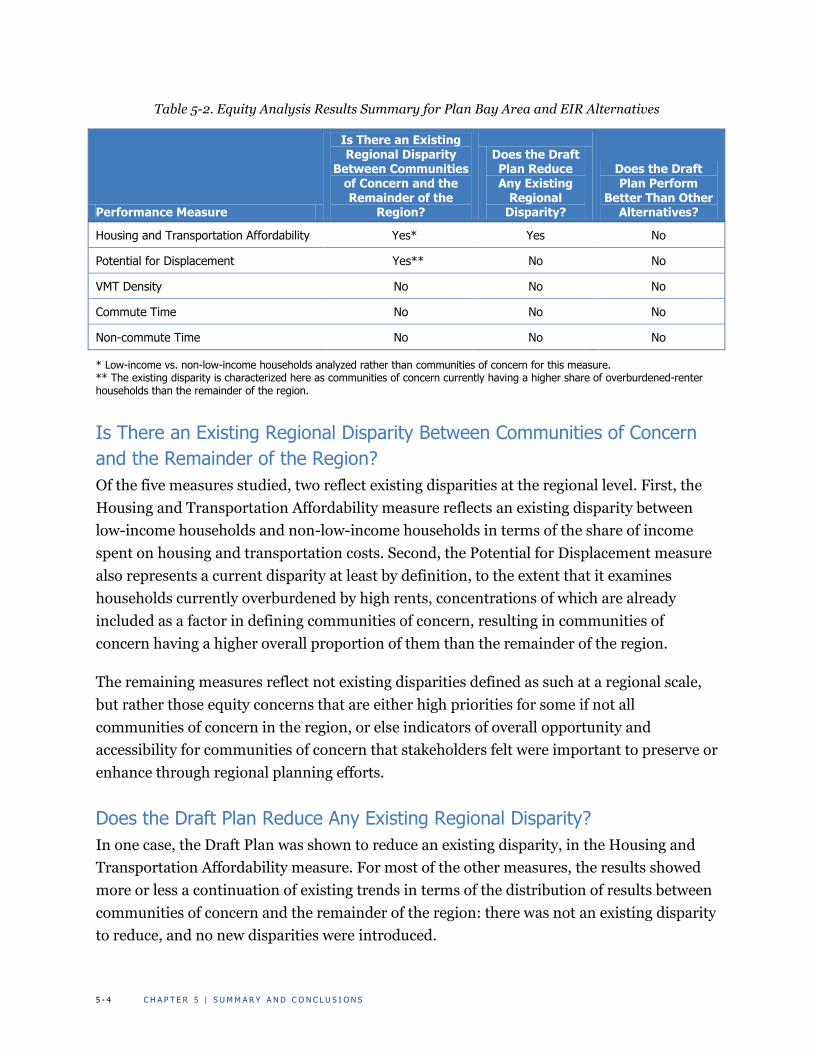
5 - 4 C H A P T E R 5 | S U M M A R Y A N D C O N C L U S I O N S
Table 5-2. Equity Analysis Results Summary for Plan Bay Area and EIR Alternatives
Performance Measure
Is There an Existing Regional Disparity
Between Communities of Concern and the Remainder of the
Region?
Does the Draft Plan Reduce Any Existing
Regional Disparity?
Does the Draft Plan Perform
Better Than Other Alternatives?
Housing and Transportation Affordability Yes* Yes No
Potential for Displacement Yes** No No
VMT Density No No No
Commute Time No No No
Non-commute Time No No No
* Low-income vs. non-low-income households analyzed rather than communities of concern for this measure. ** The existing disparity is characterized here as communities of concern currently having a higher share of overburdened-renter households than the remainder of the region.
Is There an Existing Regional Disparity Between Communities of Concern and the Remainder of the Region? Of the five measures studied, two reflect existing disparities at the regional level. First, the Housing and Transportation Affordability measure reflects an existing disparity between low-income households and non-low-income households in terms of the share of income spent on housing and transportation costs. Second, the Potential for Displacement measure also represents a current disparity at least by definition, to the extent that it examines households currently overburdened by high rents, concentrations of which are already included as a factor in defining communities of concern, resulting in communities of concern having a higher overall proportion of them than the remainder of the region.
The remaining measures reflect not existing disparities defined as such at a regional scale, but rather those equity concerns that are either high priorities for some if not all communities of concern in the region, or else indicators of overall opportunity and accessibility for communities of concern that stakeholders felt were important to preserve or enhance through regional planning efforts.
Does the Draft Plan Reduce Any Existing Regional Disparity? In one case, the Draft Plan was shown to reduce an existing disparity, in the Housing and Transportation Affordability measure. For most of the other measures, the results showed more or less a continuation of existing trends in terms of the distribution of results between communities of concern and the remainder of the region: there was not an existing disparity to reduce, and no new disparities were introduced.

P L A N B A Y A R E A E Q U I T Y A N A L Y S I S R E P O R T 5 - 5
In the case of one measure, Potential for Displacement, results suggested the Plan could have a potential adverse impact on communities of concern, which today have disproportionate representation of households considered vulnerable to displacement due to the high burden rent costs are placing on household incomes. Analytical limitations of this measure mean that the results did not reflect anti-displacement policies and regulations such as rent control already in place in local jurisdictions that currently house a large share of the region’s low-income households (such as San Francisco, San Jose, Oakland, Berkeley), nor can the analysis address the question of whether such measures are or will be adequate to stabilize communities as the region grows. Regardless of these analytical limitations, several regional initiatives have already been committed to incentivize local jurisdictions to provide housing for very-low and low-income households and have up-to-date housing elements consistent with the Regional Housing Needs Allocation, to finance land acquisition for affordable housing development in select locations near transit, and to provide community-response grants to grass-roots organizations to engage in activities related to implementing Plan Bay Area, including addressing potential displacement issues. This measure reflects the intent of the Draft Plan to focus growth in many areas where both local jurisdictions and residents have identified a need for public and private investment, while highlighting the need to emphasize community engagement in planning, preservation of current affordable housing, and investments in the local workforce and local businesses to promote community stabilization alongside investment programs."
Does the Draft Plan Perform Better Than Other Alternatives? Finally, in comparing the Plan’s overall performance to that of the other EIR alternatives studied, the Plan did not outperform all other alternatives in any of the measures analyzed, but its results generally fell somewhere in the middle of all the alternatives. For three of the measures (Housing and Transportation Affordability, Potential for Displacement, and VMT Density), Alternative 5, the Environment, Equity, and Jobs scenario, performed the best. For Commute Time, Alternative 3, the Transit Priority Focus scenario, performed best. For Non-commute Time, there were no notable differences across alternatives to make any meaningful distinction between them.
To the extent that Plan Bay Area was designed and developed to meet a wide range of regional policy objectives, from meeting CARB’s mandated 15% per-capita greenhouse-gas-reduction target by 2035, to balancing the three “E”s of sustainable development

5 - 6 C H A P T E R 5 | S U M M A R Y A N D C O N C L U S I O N S
(environment, equity, and economy),59 these results overall are consistent with this multi-faceted approach.
The small differences across the alternatives for many of the performance measures should be interpreted carefully. The forecast estimates are derived from analytical tools that attempt to represent very complex patterns of travel and land development behavior. Further, these representations of behavior rely on a host of assumptions about the prevailing economic, political, and technological conditions expected in 2040. When these factors are combined, the resulting uncertainty prevents identifying clear-cut differences across the range of alternatives presented here. However, these tools do provide a consistent framework in which expected (and rational) responses to policies can be assessed and the careful interpretation of results can lead to the insights noted above.
5.4 STAKEHOLDER FEEDBACK
In March and April 2013, MTC and ABAG staff reviewed the draft equity analysis results and a draft version of this report with the Regional Equity Working Group. In addition, the draft results were shared with the Joint MTC Planning/ABAG Administrative Committee, the Regional Advisory Working Group, and MTC’s Policy Advisory Council. Representatives of the Regional Equity Working Group who serve on MTC’s Policy Advisory Council also reported back to the Council on their work reviewing the draft results and findings for discussion as part of the Council’s overall review of the Draft Plan and Draft EIR during the public comment period for both documents.
The Regional Equity Working Group, along with other stakeholder groups, noted that the Environment, Equity, and Jobs scenario appeared to outperform the other scenarios, including the Draft Plan, across the Equity Analysis measures. Still, the Equity Working Group’s feedback also focused on overarching concerns about challenges to the provision of affordable housing in the region and displacement pressures that were found to be present to some degree in all scenarios analyzed.
Affordable Housing Challenges Throughout the Plan Bay Area process, Regional Equity Working Group members identified the need for new affordable housing and preservation strategies to combat or balance potential displacement pressures related to focusing future growth in transit-oriented
59 The GHG reduction target and other MTC/ABAG-adopted performance targets for Plan Bay Area were designed around the 3 “E”s accordingly. For more information, see Chapter 5 of the Draft Plan Bay Area document, Performance.
P L A N B A Y A R E A E Q U I T Y A N A L Y S I S R E P O R T 5 - 7
neighborhoods. At the same time, many Equity Working Group members and others advocated for more affordable housing in areas of opportunity that were not necessarily well served by transit, but had access to high-performing local schools and regional employment clusters. These goals present substantial implementation challenges to the regional agencies and local jurisdictions, and the loss of redevelopment agencies in California generated even greater concern among many Equity Working Group members that an uncertain funding environment would only amplify such implementation challenges for Plan Bay Area.
Displacement and the Suburbanization of Poverty Alongside the affordable housing challenges highlighted by Equity Working Group members were concerns related to current and future displacement pressures on vulnerable renters as the region grows and investment patterns shift toward transit-oriented neighborhoods. These trends have potential to put upward pressure on housing costs in areas with relatively good transit access, where many of the region’s low-income renters currently live. Equity Working Group members suggested the PDA Investment and Growth Strategies required under the OneBayArea Grant program should address community stabilization issues unique to each county and its jurisdictions, with the idea that these locally defined strategies may continue to evolve beyond the immediate short-term horizon of the current OBAG funding cycles.
Equity Working Group members also noted that the trend in recent years of the suburbanization of poverty should be viewed as a complementary trend to displacement of low-income residents from more accessible urban neighborhoods. MTC’s and ABAG’s own research in recent years has touched on these trends, including ABAG’s findings that during the 1990s and 2000s, a significant number of low-income households left San Francisco and Alameda Counties for other locations in the Bay Area and California, and many of those locations have worse transit service than the areas from which these households moved (although the data analyzed could not demonstrate which households may have been displaced and which moved voluntarily for other reasons).60
Given these shifting residential patterns of low-income households in the region, working group members also suggested refining future equity analysis work to emphasize economic opportunity for disadvantaged communities, especially rural and suburban areas of poverty and/or communities with limited fiscal capacity.
60 Association of Bay Area Governments. 2009. Development without Displacement: Development with Diversity. See http://www.bayareavision.org/initiatives/dwd-final.pdf.

5 - 8 C H A P T E R 5 | S U M M A R Y A N D C O N C L U S I O N S
The following chapter outlines Next Steps that regional agencies can take to advance the findings of this analysis, address concerns and suggestions identified by the Equity Working Group, and continue to incentivize more equitable outcomes for the region’s communities of concern as the region develops.

P L A N B A Y A R E A E Q U I T Y A N A L Y S I S R E P O R T 6 - 1
Chapter 6. Next Steps
This chapter summarizes some of the next steps that MTC and ABAG may take or consider taking to build upon the findings and conclusions of the Plan Bay Area equity analysis. While not an exhaustive list of potentially beneficial actions, it indicates some of the priority steps that may ultimately guide or influence implementation of Plan Bay Area, and improve upon future analysis efforts.
6.1 COMPLETE BAY AREA REGIONAL PROSPERITY PLAN TO HELP GUIDE IMPLEMENTATION OF PLAN BAY AREA
As a regional planning effort, the HUD-funded Regional Prosperity Plan aims to invert the priorities that often drive such plans. The Plan is to be developed with and by underserved communities to address underlying issues of inequality and disparities in the region.
The Regional Prosperity Plan will integrate equity principles throughout the work plan; meaningfully engage under-represented communities in identifying needs, developing recommendations, and implementing projects to improve access to affordable housing and economic opportunities; and build organizational and leadership capacity among under-represented communities and community-based organizations to sustain the work beyond the term of the project.
The Plan will also specifically address risks of displacement for low-income communities and small business by providing community-response grants to grass-roots organizations; developing a regional “early warning system”; and identifying strategies that can prevent displacement in at-risk communities.

6 - 2 C H A P T E R 6 | N E X T S T E P S
Another key work area of the Regional Prosperity Plan is the Fair Housing Equity Assessment (FHEA), which ABAG will be conducting from spring 2013 through early 2014. The aim of this assessment is to examine in greater detail data related to fair housing, segregation patterns, and access to opportunity across the region. The FHEA will be reviewed by a broad range of community-based organizations who will have an opportunity to critique and improve regional equity analysis methodologies. Findings from the FHEA also have the potential to inform future housing and/or land use performance measures for the next SCS Equity Analysis.
6.2 IMPLEMENT REGIONAL PROGRAMS THAT INVEST STRATEGICALLY TO ENHANCE MOBILITY FOR COMMUNITIES OF CONCERN AND TRANSPORTATION-DISADVANTAGED POPULATIONS
MTC already has several planning and programming initiatives in place to support mobility in low-income communities, communities of concern, and other transportation-disadvantaged populations.61 Continued implementation and monitoring of MTC’s Lifeline Transportation Program will support maintaining critical transit service in communities of concern while also advancing other community-prioritized transportation needs, and Plan Bay Area continues the region’s existing commitment to funding these needs. The Third Cycle of Lifeline Transportation Program guidelines, approved in December 2011, also allowed for the use of funds to update Community Based Transportation Plans for areas where older plans were becoming outdated, to ensure community priorities continue to inform regional and local programming decisions.
MTC’s Coordinated Public Transit–Human Services Transportation Plan update (adopted in March 2013) identified two major regional strategies for enhancing coordination efforts to improve service delivery for seniors, persons with disabilities, and low-income populations. These cross-cutting strategies, intended to make best use of limited funding available to the region to improve mobility for these populations over the longer term, are:
1. Strengthen mobility management in the Bay Area (including identifying ongoing funding to support both local coordination efforts and operations of community-based services); and
61 For information on these planning and programming efforts, see Chapter 1, Section 1.3.

P L A N B A Y A R E A E Q U I T Y A N A L Y S I S R E P O R T 6 - 3
2. Promote walkable communities, complete streets, and integration of transportation and land use decisions.
Next steps outlined in the region’s Coordinated Plan update include developing a regionwide implementation plan for mobility management in consultation with local stakeholders, and informing future regional funding decisions based on the above strategies, including remaining funding available to the region under SAFETEA and for funds that become available to the region under the new federal authorization, MAP-21.
In a broad sense, Plan Bay Area’s overall “Fix It First” investment strategy will ensure that the region directs a majority of funding to maintain existing transportation assets, while also supporting focused growth in areas served by the transportation system over the life of the plan. Plan Bay Area fully funds operating needs for existing transit services and timely transit vehicle replacement while funding 76 percent of remaining high-priority transit capital needs, all of which will benefit communities of concern, where residents rely more heavily on the transit system for basic mobility needs. Overall, Roughly three-quarters of the draft plan’s discretionary funds and 90 percent of the committed funds are dedicated to funding transit operations, maintaining transit capital assets, repairing and replacing bridges, and maintaining complete streets.
6.3 PURSUE STATE AND FEDERAL ADVOCACY INITIATIVES
In order to make progress toward the region’s 2040 Plan Bay Area performance targets and address equity issues highlighted by the Equity Analysis, ABAG and MTC have identified several legislative advocacy objectives to secure needed changes in both federal and state law. These initiatives are detailed further in the Draft Plan Bay Area document, but the key efforts related to supporting and improving the region’s affordable housing and transportation options include:
• Replace locally controlled funding to support PDA development, including $1 billion in annual tax-increment financing that was previously available through redevelopment to support affordable housing projects, critical infrastructure improvements, and economic development projects in designated areas of many Bay Area cities and counties.
• Stabilize Federal funding levels for housing and community development programs, including the HOME Investment Partnership Program and Community Development Block Grants. Funding from both of these programs help local jurisdictions increase the supply of a variety of workforce housing options, but has

6 - 4 C H A P T E R 6 | N E X T S T E P S
fallen significantly in recent years, reducing financial certainty needed by local jurisdictions and developers to deliver these projects. Incentives in the tax code for multi-family development should also be established for the long run so cities and developers can plan with certainty.
• Support local self-help for transportation funding by lowering the vote threshold for local and regional tax measures from two-thirds to 55 percent. Local funds are a vital source of transit operating revenues in particular, which help sustain basic mobility for users of public transit and ADA paratransit.
• Seek Federal transportation policy and funding levels that support Plan Bay Area. MTC and ABAG will work with local, state, and national partners to urge Congress to identify a long-term, reliable funding source for transportation in the next authorization, while providing flexibility for the region to respond to its diverse transportation needs, including sustaining our existing transit network.
• Grow State funding for transportation. MTC and ABAG will urge the Bay Area’s State delegation to create a new permanent revenue source for transportation (such as cap and trade) to achieve the Plan’s financial assumptions, increase funding to sustain transit service, and increase the efficiency of the existing network.
6.4 UPDATE KEY REGIONAL INDICATORS RELATED TO EQUITY TO AID IN MONITORING PLAN BAY AREA IMPLEMENTATION
Because the Plan Bay Area Equity Analysis emphasizes comparison of future outcomes over a long-range horizon, its performance measures are limited to data that can be reasonably forecast 25 to 30 years into the future. This limitation omits from the long-range Equity Analysis many other potential sources of information that could inform key equity considerations that arise during outreach efforts during the early stages of developing the long-range plan.
MTC first addressed this limitation following a recommendation in the 2009 Transportation 2035 Equity Analysis by developing a set of Snapshot Analysis measures in close consultation with regional stakeholders. These measures used current (and mostly observed, rather than modeled) data to highlight differences throughout the region related to a variety of transportation-related metrics, including transportation availability, accessibility, affordability, safety, and the environment. The first regional Snapshot Analysis data were produced in 2010.62
62 See http://www.mtc.ca.gov/planning/snapshot/.

P L A N B A Y A R E A E Q U I T Y A N A L Y S I S R E P O R T 6 - 5
Later in 2010, to help lay technical and policy groundwork for Plan Bay Area, MTC and ABAG staff and interested stakeholders began developing a set of possible indicators to track over time. These indicators provide a snapshot of current regional “quality of life” characteristics not previously described by MTC’s transportation-oriented Snapshot Analysis, including housing, jobs, farmland, school quality, parks, and crime, among others. The first complete set of these indicators was released in late 2011,63 and initial analysis and discussions of the results with Regional Equity Working Group members revealed the following high priority issues:
1. Reducing auto-related injuries and increasing walkability. 2. Preserving and increasing affordable housing in growth areas. 3. Improving school performance in growth areas.
To support development of the Bay Area’s next RTP/SCS (anticipated to be adopted in 2017), MTC and ABAG will update relevant Snapshot and indicator data as available within next two years of adoption of Plan Bay Area, recognizing that the agencies have no influence over local school funding, quality, or performance despite the Regional Equity Working Group members’ interest in the issue.
6.5 CONTINUE TO REFINE EQUITY ANALYSIS METHODOLOGIES
Consistent with the equity analysis findings and input received from the Equity Working Group, MTC and ABAG will continue refining and improving the usefulness and relevance of equity performance measures relative to key equity concerns in future RTP and SCS development processes. Specific areas identified for further examination in future analysis include assumptions and methods underlying the Housing and Transportation Affordability measure, and refinements to the Commute Time measure to more directly characterize jobs-housing fit. Other future analysis work may emphasize economic opportunity for disadvantaged communities, especially rural and suburban areas of poverty and/or communities with limited fiscal capacity.
Specific to new FTA requirements for Title VI analysis as of October 2012, MTC will assess the feasibility of upgrading future RTP project databases to be able to map only transit projects receiving State or Federal funds, and potentially developing modeling subnetworks of public transit projects receiving Federal or State funds in order to be able to use the
63 See http://www.onebayarea.org/pdf/SCS_Indicators_v3.pdf for a summary, and view maps of the SCS Indicators at http://www.onebayarea.org/pdf/SCS_Indicators-Combined_Map_Packet.pdf.

6 - 6 C H A P T E R 6 | N E X T S T E P S
regional travel model for Title VI analysis efforts to further enhance regional analysis capabilities under the new FTA circular.

Metropolitan Transportation CommissionManagement StaffSteve HemingerExecutive Director
Ann FlemerDeputy Executive Director, Policy
Andrew B. FremierDeputy Executive Director, Operations
Adrienne D. WeilGeneral Counsel
Brian MayhewChief Financial Officer
Ken KirkeyDirector, Planning
Alix BockelmanDirector, Programming and Allocations
Association of Bay Area GovernmentsManagement StaffEzra RapportExecutive Director
Patricia JonesAssistant Executive Director
Kenneth K. MoyLegal Counsel
Miriam ChionPlanning and Research Director
Metropolitan Transportation Commission
Joseph P. Bort MetroCenter
101 Eighth Street
Oakland, CA 94607-4700
510.817.5700 PHONE
510.817.5769 TDD/TTY
[email protected] EMAIL
www.mtc.ca.gov WEB
Association of Bay Area Governments
Joseph P. Bort MetroCenter
101 Eighth Street
Oakland, CA 94607-4707
510.464.7900 PHONE
[email protected] EMAIL
www.abag.ca.gov WEB