
Appendix 7.7 - 2017 Residential Energy Use Survey · 2017 Residential Energy Use Survey Weighted...
228
2017 Residential Energy Use Survey Weighted Population & Saturation Results Market Forecast and Load Research January 2019 Centra Gas Manitoba Inc. 2019/20 General Rate Application Appendix 7.7 March 22, 2019 Page 1 of 228
Transcript of Appendix 7.7 - 2017 Residential Energy Use Survey · 2017 Residential Energy Use Survey Weighted...
2017
Residential
Energy Use
Survey
Weighted Population
& Saturation Results
Market Forecast and Load Research
January 2019
Centra Gas Manitoba Inc. 2019/20 General Rate Application Appendix 7.7
March 22, 2019 Page 1 of 228

IMPORTANT:
THIS MATERIAL IS THE EXCLUSIVE PROPERTY OF MANITOBA HYDRO AND
ALL RIGHTS ARE RESERVED. ANY RELEASE, REPRODUCTION OR OTHER
USE THEREOF WITHOUT THE EXPRESS WRITTEN CONSENT OFMANITOBA
HYDRO IS STRICTLY PROHIBITED.
Centra Gas Manitoba Inc. 2019/20 General Rate Application Appendix 7.7
March 22, 2019 Page 2 of 228

i
TABLE OF CONTENTS
INTRODUCTION .......................................................................................................................................................... 1
SURVEY METHODOLOGY ............................................................................................................................................ 2
2.01 Sample Design Objectives ..................................................................................................................... 2
2.02 Sample Selection ................................................................................................................................... 2
2.03 Survey Returns ....................................................................................................................................... 2
2.04 Weightings ............................................................................................................................................. 3
2.05 Survey Results ........................................................................................................................................ 3
SECTION 1 DWELLING CHARACTERTISTICS ................................................................................................................ 5
1.01 Natural Gas Available Areas .................................................................................................................. 6
1.02 Dwelling Types ....................................................................................................................................... 7
1.03 Dwelling Ownership .............................................................................................................................. 8
1.04 Dwelling Storey Types ........................................................................................................................... 9
1.05 Building Code Construction Era ........................................................................................................... 10
1.06 Dwelling Square Footage ..................................................................................................................... 11
1.07a Single Pane Windows .......................................................................................................................... 12
1.07b Dual Pane Windows ............................................................................................................................. 13
1.07c Triple Pane Windows ........................................................................................................................... 14
1.07d Storm Pane Windows .......................................................................................................................... 15
1.08 Level of Insulation in Attic ................................................................................................................... 16
1.09 Level of Insulation in Exterior Walls .................................................................................................... 17
1.10 Basement Types .................................................................................................................................. 18
1.11 Basement Wall Insulation .................................................................................................................... 19
1.12 Type of Insulation in Basement ........................................................................................................... 20
1.13 Residential Basement Finish ................................................................................................................ 21
1.14 Most Common Dwelling Problems ...................................................................................................... 22
1.15 Dwelling Projects Undertaken in the Last Three Years ....................................................................... 23
SECTION 2 SPACE HEATING ...................................................................................................................................... 25
2.01 Space Heating Fuel ............................................................................................................................... 26
2.02 Average Annual Kilowatt Hours – Weather Adjusted .......................................................................... 27
2.03 Average Annual Kilowatt Hours per Square Foot – Weather Adjusted ............................................... 28
2.04 Average Annual Cubic Meters Natural Gas Weather Adjusted ............................................................ 29
2.05a Residential Primary Space Heating Systems ........................................................................................ 30
2.05b Residential Primary Space Heating Systems (continued) ..................................................................... 31
2.06 Age (Years) of Residential Primary Space Heating Systems ................................................................. 32
2.07 Customers Changing Space Heating Fuel Types ................................................................................... 33
2.08 Residential Supplemental Space Heating Systems ............................................................................... 34
2.09 Thermostat Control for the Main Heating System ............................................................................... 35
2.10 Nightly Thermostat Settings ................................................................................................................. 36
2.11 Programmable Thermostat .................................................................................................................. 37
2.12 Wi‐Fi Enabled Remote Thermostat Options ........................................................................................ 38
2.13 Plans to Install a Wi‐Fi Thermostat ...................................................................................................... 39
2.14 Dehumidifier ......................................................................................................................................... 40
2.15 Humidifier ............................................................................................................................................. 41
2.16 Heat Recovery Ventilation System (HRV) ............................................................................................. 42
Centra Gas Manitoba Inc. 2019/20 General Rate Application Appendix 7.7
March 22, 2019 Page 3 of 228

ii
SECTION 3 COOLING SYSTEM ................................................................................................................................... 43
3.01 Air Conditioning System ....................................................................................................................... 44
3.02 Age (Years) of the Air Conditioning Unit .............................................................................................. 45
3.03 Cooling System Original/Replacement ................................................................................................. 46
3.04 Thermostat Turned Down At Night ...................................................................................................... 47
SECTION 4 RESIDENTIAL HOT WATER ...................................................................................................................... 49
4.01 Hot Water Tank Types .......................................................................................................................... 50
4.02 Hot Water Heater Fuels ........................................................................................................................ 51
4.03 Age (Years) of Water Heater ................................................................................................................ 52
4.04 Water Heater Fuel Switching ............................................................................................................... 53
4.05 Total Number of Showers Taken per Day ............................................................................................ 54
4.06 Water Conservation Methods Undertaken .......................................................................................... 55
SECTION 5 MAJOR APPLIANCES ............................................................................................................................... 57
5.01 Fuel Used to Cook Food ........................................................................................................................ 58
5.02 Average Number of Cooked Meals per Day ......................................................................................... 59
5.03 Age (Years) of Main Cooking Appliance ............................................................................................... 60
5.04 Total Number of Refrigerators ............................................................................................................. 61
5.05a Size (Cubic Feet) of Main Refrigerator ................................................................................................. 62
5.05b Age (Years) of Main Refrigerator .......................................................................................................... 63
5.06a Size (Cubic Feet) of Secondary Refrigerator ......................................................................................... 64
5.06b Age (Years) of Secondary Refrigerator ................................................................................................. 65
5.07 Total Number of Freezers ..................................................................................................................... 66
5.08a Size (Cubic Feet) of Main Freezer ......................................................................................................... 67
5.08b Age (Years) of Main Freezer ................................................................................................................. 68
5.09a Size (Cubic Feet) of Secondary Freezer ................................................................................................ 69
5.09b Age (Years) of Secondary Freezer ......................................................................................................... 70
5.10a Age (Years) of Dishwasher .................................................................................................................... 71
5.10b Average Number of Dishwasher Loads per Week ................................................................................ 72
5.11a Type of Clothes Washing Machine ....................................................................................................... 73
5.11b Average Number of Clothes Washer Loads per Week ......................................................................... 74
5.11c Age (Years) of Clothes Washing Machine ............................................................................................ 75
5.12a Type of Fuel Used for Clothes Dryer .................................................................................................... 76
5.12b Average Number of Clothes Dryer Loads per Week ............................................................................ 77
5.12c Age (Years) of Clothes Dryer ................................................................................................................ 78
SECTION 6 ELECTRONICS AND LIGHTING ................................................................................................................. 79
6.01a Number of Televisions in Use ............................................................................................................... 80
6.01b Number of Set‐Top Boxes in Use .......................................................................................................... 81
6.01c Number of DVD/Blu‐Ray Units in Use .................................................................................................. 82
6.01d Number of Gaming Consoles in Use ..................................................................................................... 83
6.01e Number of Desktop Computers in Use ................................................................................................ 84
6.01f Number of Laptop Computers in Use ................................................................................................... 85
6.01g Number of Tablets in Use ..................................................................................................................... 86
6.01h Number of Cell Phone Chargers in Use ................................................................................................ 87
6.02 Home Internet Access .......................................................................................................................... 88
6.03 Types of Telephone Services ................................................................................................................ 89
6.04a Count of Incandescent Lights in Residence .......................................................................................... 90
Centra Gas Manitoba Inc. 2019/20 General Rate Application Appendix 7.7
March 22, 2019 Page 4 of 228

iii
6.04b Count of Halogen Lights in Residence .................................................................................................. 91
6.04c Count of Compact Fluorescents Lights (CFL) in Residence ................................................................... 92
6.04d Count of Light Emitting Diode (LED) Lights in Residence ..................................................................... 93
6.04e Count of Tube Fluorescent Lights in Residence ................................................................................... 94
6.05 LED Lights Purchased Through Manitoba Hydro’s Instant Rebate Promotion .................................... 95
6.06 LED Lights Purchased Not During Manitoba Hydro’s Instant Rebate Promotion ................................ 96
6.07 Influence of Manitoba Hydro’s Instant Rebate Promotion to Buy LED Lights ..................................... 97
6.08 If There Wasn’t a Promotion, Would You Have Purchased LED Lights ................................................ 98
6.09 Use of Outdoor Seasonal Lights ........................................................................................................... 99
SECTION 7 POOLS AND VEHICLES .......................................................................................................................... 101
7.01a Pool Type ............................................................................................................................................ 102
7.01b Pool Fuel ............................................................................................................................................. 103
7.02 Number of Vehicles Plugged In .......................................................................................................... 104
7.03a Parking Location ................................................................................................................................. 105
7.03b Car Timer for Block Heater ................................................................................................................. 106
7.03c Interior Car Warmer ........................................................................................................................... 107
SECTION 8 DEMAND SIDE MANAGEMENT (DSM) PROGRAMS ............................................................................. 109
8.01a Participation in Affordable Energy Program ...................................................................................... 110
8.01b Participation in Appliance Rebate Program ....................................................................................... 111
8.01c Participation in Earth Power (Geothermal) Loan Program ................................................................ 112
8.01d Participation in Home Insulation Program ......................................................................................... 113
8.01e Participation in LED Light Bulb In‐Store Rebate Promotion ............................................................... 114
8.01f Participation in LED Light Fixture or Lighting Controls In‐Store Promotion ....................................... 115
8.01g Participation in Plug‐In Timers, Power Bars, or Showerheads In‐Store Rebate Promotion .............. 116
8.01h Participation in Weather Stripping or Window Kits In‐Store Rebate Promotion ............................... 117
8.01i Participation in the New Home Program ........................................................................................... 118
8.01j Participation in Pay As You Save (PAYS) Financing Program .............................................................. 119
8.01k Participation in Refrigerator Retirement Program ............................................................................. 120
8.01l Participation in Residential Loan Program ......................................................................................... 121
8.01m Participation in Smart Thermostat Rebate Program .......................................................................... 122
8.01n Participation in Weather and Energy Saver Program ......................................................................... 123
8.01o Participation in Solar Energy Program ............................................................................................... 124
8.02a Influence of Manitoba Hydro’s DSM Program to Upgrade Your Home Insulation ............................ 125
8.02b Influence of Manitoba Hydro’s DSM Program to Install New Heating System .................................. 126
8.02c Influence of Manitoba Hydro’s DSM Program to Buy a New Refrigerator ........................................ 127
8.02d Influence of Manitoba Hydro’s DSM Program to Buy a New Freezer ................................................ 128
8.02e Influence of Manitoba Hydro’s DSM Program to Buy a New Clothes Washer .................................. 129
8.02f Influence of Manitoba Hydro’s DSM Program to Buy a Wi‐fi Thermostat ......................................... 130
8.03 What Has Been Done to Your Home to Reduce Energy Use .............................................................. 131
SECTION 9 BILLS AND RATES .................................................................................................................................. 133
9.01 How Do You Usually Pay Your Manitoba Hydro Bill ........................................................................... 134
9.02 How Often Do You Check Your Energy Bill ......................................................................................... 135
9.03 Awareness of Manitoba Hydro's My Bill ............................................................................................ 136
9.04 Interest in Receiving Your Hydro Bill by Email ................................................................................... 137
9.05 How Many Times Did You Access Manitoba Hydro’s Website in the Last Year ................................. 138
9.06a When You Check Your Bill, Do You Mainly Look at Due Date ............................................................ 139
9.06b When You Check Your Bill, Do You Mainly Look at Dollar Amount Owing ........................................ 140
Centra Gas Manitoba Inc. 2019/20 General Rate Application Appendix 7.7
March 22, 2019 Page 5 of 228

iv
9.06c When You Check Your Bill, Do You Mainly Look at Current Usage Amount ...................................... 141
9.06d When You Check Your Bill, Do You Mainly Look at Usage History ..................................................... 142
9.06e When You Check Your Bill, Do You Mainly Look at Specific Charges Such as Taxes and Rates ......... 143
9.06f When You Check Your Bill, Do You Mainly Look at Equal Payment Plan Amount ............................. 144
9.06g When You Check Your Bill, Do You Mainly Look at Meter Readings .................................................. 145
9.06h Never Check Your Bill ......................................................................................................................... 146
9.07a Reduced Spending on Food in the past Two Years to Pay Your Manitoba Hydro Bill ........................ 147
9.07b Reduced Spending on Rent in the past Two Years to Pay Your Manitoba Hydro Bill ........................ 148
9.07c Reduced Spending on Loans in the past Two Years to Pay Your Manitoba Hydro Bill ...................... 149
9.07d Reduced Spending on Insurance in the past Two Years to Pay Your Manitoba Hydro Bill ................ 150
9.07e Reduced Spending on Clothing in the past Two Years to Pay Your Manitoba Hydro Bill .................. 151
9.07f Reduced Spending on Entertainment in the past Two Years to Pay Your Manitoba Hydro Bill ........ 152
9.07g Reduced Spending on Travel in the past Two Years to Pay Your Manitoba Hydro Bill ...................... 153
9.07h Reduced Spending on Cell Phones in the past Two Years to Pay Your Manitoba Hydro Bill ............. 154
9.07i Reduced Spending on Cable TV in the past Two Years to Pay Your Manitoba Hydro Bill .................. 155
9.07j Reduced Spending on Transportation in the past Two Years to Pay Your Manitoba Hydro Bill ........ 156
9.07k Reduced Spending on Gifts in the past Two Years to Pay Your Manitoba Hydro Bill ........................ 157
9.07l Reduced Spending on Medical Expenses in the past Two Years to Pay Your Manitoba Hydro Bill ... 158
9.08 Number of Times in the past Two Years Missed A Payment Due to Financial Difficulties ................ 159
9.09 Missed Payment in the Last Two Years Due to .................................................................................. 160
9.10 How Do You Think You Compare to Similar Households That Heat with the Same Commodity ....... 161
9.11 How Do You Think Manitoba Hydro’s Rates Compare to Other Provinces or States ........................ 162
9.12 What Do You Think Manitoba Hydro’s Residential Electric Rate per Kilo‐Watt Hour Is .................... 163
9.13 What Do You Think About Increasing Rates After a Certain Level Of Usage ..................................... 164
SECTION 10 HOUSEHOLD DEMOGRAPHICS ........................................................................................................... 165
10.01 People per Household ........................................................................................................................ 166
10.02 Do You Identify as an Indigenous Person ........................................................................................... 167
10.03a Language Other Than English Spoken in Your Household ................................................................. 168
10.03b Language Other Than English Spoken in Your Household Continued ................................................ 169
10.03c Language Other Than English Spoken in Your Household Continued ................................................ 170
10.04 Total Annual Household Income ........................................................................................................ 171
10.05 Highest Education Level Attended by Head(s) of Household ............................................................ 172
10.06 Winnipeg LICO‐125 Classification ....................................................................................................... 173
10.07 Bill Payment Rating ............................................................................................................................ 174
10.08 Weather Adjusted Annual Total Energy Bill (Taxes Included) ............................................................ 175
10.09 Energy Burden .................................................................................................................................... 176
10.10 Weather Adjusted Percent Energy Income Burden ........................................................................... 177
10.11 Residential Rate Class Population Age Distribution ........................................................................... 178
SECTION 11 APPENDIX QUESTIONNARE BOOKLET ................................................................................................ 179
Centra Gas Manitoba Inc. 2019/20 General Rate Application Appendix 7.7
March 22, 2019 Page 6 of 228

Centra Gas Manitoba Inc. 2019/20 General Rate Application Appendix 7.7
March 22, 2019 Page 7 of 228

Centra Gas Manitoba Inc. 2019/20 General Rate Application Appendix 7.7
March 22, 2019 Page 8 of 228

1
INTRODUCTION
The Market Forecast and Load Research Department regularly conducts a large scale mail‐out survey to determine the most current energy use characteristics of Manitoba Hydro’s residential customers. In November 2017, the 2017 Residential Energy Use Survey was mailed to a total of 35,372 residential rate customers. The 20‐page survey collected detailed information from residential customers regarding their dwelling characteristics, heating and cooling systems, end use appliance saturations, energy use behavior, residential program participation rates, as well as certain pieces of demographic information as they relate to energy use. The main objective of collecting survey data is to incorporate the findings into the annual Manitoba Hydro Load Forecast. The information collected also serves as a basis in designing programs and services to assist customers. The survey results are also used to meet the information needs of other areas throughout the corporation regarding the residential sector.
Centra Gas Manitoba Inc. 2019/20 General Rate Application Appendix 7.7
March 22, 2019 Page 9 of 228
2
SURVEY METHODOLOGY The main survey design objectives and procedures taken to implement the 2017 Residential Energy Use Survey are presented in the following sections.
2.01 Sample Design Objectives
The main objective of the sample design was to ensure a sufficient number of completed surveys were returned for analysis of key categories such as dwelling type, fuel area location, and heating fuel source.
2.02 Sample Selection
As of November 1, 2017, there were a total of 484,811 premises under the residential rate class. From this group, 15,375 surveys were mailed to residential customers residing on First Nation reserve land in order to increase the representation of this customer segment within the analysis. 19,997 surveys were mailed to residential customers not residing on First Nation reserve land and were selected using a random generation process. Survey packages were mailed in November 2017 and included the 20‐page questionnaire booklet and a stamped self‐addressed return envelope. No incentive was given to complete the survey and no attempt was made to contact non‐respondents. The 484,811 dwellings correspond to 487,378 total Residential billing customers that existed during that month. The difference of 2,567 is due to dwellings with two or more Residential services.
2.03 Survey Returns
In total 35,372 residential customers were reached and 4,320 surveys were completed and returned. A survey response rate of 12.3% was achieved. The overall survey results are accurate within 1.48%, 19 times out of 20. Of the 19,997 residential customers reached who were not residing on First Nation reserve land, 3,799 surveys were completed and returned. A survey response rate of 19.1% was achieved. The overall survey results are accurate within 1.58%, 19 times out of 20. Of the 15,375 residential customers reached who were residing on First Nation reserve land, 521 surveys were completed and returned. A survey response rate of 3.4% was achieved. The overall survey results are accurate within 4.23%, 19 times out of 20.
Centra Gas Manitoba Inc. 2019/20 General Rate Application Appendix 7.7
March 22, 2019 Page 10 of 228
3
2.04 Weightings
Each response was assigned a weighting factor. The weighting variables are part of every residential customer record. Weights are calculated using the ratio between the population cells and the number of returned records in that case. Survey responses were weighted back to the electric population base of 484,811 and the natural gas population base of 249,938, as recorded in Banner, Manitoba Hydro’s billing system. Weighting criteria used was as follows:
Billing Class: 1. Electric Heat with no natural gas service. 2. Electric Heat with natural gas service. 3. Standard Heat with natural gas service. 4. Standard Heat with no natural gas service.
Dwelling Type: 1. Single Detached 2. Individual Multi Detached 3. Shared Service Multi Attached 4. Town/Row House 5. Mobile Home 6. Apartment Suite
Fuel Area: 1. Winnipeg City (Natural Gas Available) 2. Manitoba Hydro Natural Gas Available (excluding Winnipeg City) 3. Manitoba Hydro No Natural Gas Available (Northern Area included)
On Reserve: 1. Reside on First Nation reserve land. 2. Do not reside on First Nation reserve land.
2.05 Survey Results
The survey results provide up‐to‐date profiles of Manitoba Hydro’s residential customers. The discussion of survey results follows the order of the sections in the questionnaire booklet (Appendix). In addition to overall saturations, all results in this report are summarized in table form and are cross‐tabulated by eleven major groupings. These groups are:
1. Fuel Area ‐ There are three service areas especially defined for the analysis of results. The areas are Winnipeg City, Manitoba Hydro Natural Gas Available, and Manitoba Hydro No Gas Available (Northern Manitoba areas included).
2. Dwelling Type ‐ These are the three key residential dwelling types used for load forecasting and marketing purposes: single detached dwellings, multi‐family attached (duplexes, town and row houses); and individually metered apartment suites. Survey results were used to correct Banner billing data as well as Banner billing data was used to fill in any missing responses pertaining to dwelling type.
3. Building Code Era ‐ This refers to the periods when significant dwelling construction codes were introduced. Available tax assessment data was used to verify responses and to fill in any missing responses pertaining to year built.
Centra Gas Manitoba Inc. 2019/20 General Rate Application Appendix 7.7
March 22, 2019 Page 11 of 228

4
4. Space Heating Fuel ‐ The heating fuel categories are Electric Heat, Natural Gas Heat, Other Fuel and Shared (No Heat on Bill). “Other” includes fuels such as propane, oil, coal and wood. “Shared” refers to customers that do not pay Manitoba Hydro directly for any heating fuel consumption. The Banner billing system classifies residential customers as All‐Electric and Standard (non‐electric heat) based on the application of the Provincial Reduced Revenue Tax Code. To be classified as All‐Electric, the customer must reside in a dwelling unit where the permanently installed electric heating system is capable of heating 80% or more of the dwelling space. All other customers are classified as Standard.
5. People Per Household ‐ Based on how respondents answered the number of people per household question, their answers were grouped into five categories of either one, two, three, four or five plus people.
6. Annual Household Income ‐ Based on how respondents answered the household income question, their answers were grouped into five categories: $25,000, $25‐49,999, $50‐74,999, $75‐99,999 or $100,000 plus.
7. Winnipeg LICO‐125 Class ‐ Customers were also classified using Statistics Canada’s Low Income Cut‐Off (LICO) definitions but only using the person and income combination for centers of 500,000 or more and applying the criteria province‐wide. This resulted in a weighted population of 159,987 Winnipeg LICO‐125 customers. The chart below was used to classify customers into the Winnipeg Low Income Cut‐Off Plus 25% (LICO‐125) and Non‐LICO‐125 groups.
8. Indigenous Self‐Declared Ancestry ‐ Based on how respondents answered the question pertaining to Indigenous ancestry, their answers were grouped into three categories of “Yes”, “No”, and “Undeclared”.
9. First Nation On Reserve – Based on if the respondents reside on First Nation reserve land and have provided Manitoba Hydro with a Band Treaty Number. 10. Bill Payment Rating – Based on historical payment experience. The answers were grouped into three categories of “Excellent”, “Satisfactory”, or “Poor”.
11. Dwelling Ownership ‐ Based on how respondents answered the question pertaining to dwelling ownership, their answers were grouped into two categories of “Owners” and “Renters”.
NUMBER OF PERSONS PER HOUSEHOLD ANNUAL HOUSEHOLD INCOME
1 PERSON $31,186
2 PERSONS $38,826
3 PERSONS $47,731
4 PERSONS $57,952
5 PERSONS $65,729
6 PERSONS $74,130
7 OR MORE PERSONS $82,534
Centra Gas Manitoba Inc. 2019/20 General Rate Application Appendix 7.7
March 22, 2019 Page 12 of 228

5
SECTION 1 DWELLING CHARACTERTISTICS
SECTION 1 DWELLING
CHARACTERISTICS
Centra Gas Manitoba Inc. 2019/20 General Rate Application Appendix 7.7
March 22, 2019 Page 13 of 228

6
1.01 Natural Gas Available Areas
TOTAL WINNIPEG CITY % GAS AVAILABLE % NO GAS AVAILABLE %
OVERALL 484,811 261,760 54.0% 140,021 28.9% 83,030 17.1%
FUEL AREA
Winnipeg City 261,760 261,760 100.0% 0 0.0% 0 0.0%
Gas Avai lable 140,021 0 0.0% 140,021 100.0% 0 0.0%
No Gas Avai lable 83,030 0 0.0% 0 0.0% 83,030 100.0%
DWELLING TYPE
Single Detached 373,568 173,728 46.5% 120,943 32.4% 78,897 21.1%
Multi Attached 46,834 32,869 70.2% 11,038 23.6% 2,927 6.2%
Apartment Sui te 64,409 55,163 85.6% 8,040 12.5% 1,206 1.9%
BUILDING CODE ERA
2010‐2017 37,645 16,471 43.8% 15,910 42.3% 5,265 14.0%
1990‐2009 89,181 33,079 37.1% 34,039 38.2% 22,063 24.7%
1970‐1989 161,749 86,548 53.5% 48,720 30.1% 26,481 16.4%
1950‐1969 110,314 72,197 65.4% 22,595 20.5% 15,523 14.1%
Pre 1950 85,922 53,466 62.2% 18,757 21.8% 13,699 15.9%
SPACE HEAT FUEL
Electric Heat 191,639 40,915 21.4% 72,952 38.1% 77,772 40.6%
Natura l Gas Heat 249,938 187,891 75.2% 62,047 24.8% 0 0.0%
Other Fuel 6,945 530 7.6% 2,123 30.6% 4,292 61.8%
Shared (No Heat on Bi l l ) 36,289 32,424 89.3% 2,899 8.0% 966 2.7%
PEOPLE PER HOUSEHOLD
One 124,779 74,051 59.3% 30,909 24.8% 19,819 15.9%
Two 221,729 109,356 49.3% 71,935 32.4% 40,438 18.2%
Three 60,069 36,643 61.0% 15,303 25.5% 8,123 13.5%
Four 48,897 28,445 58.2% 13,224 27.0% 7,228 14.8%
Five + 29,337 13,265 45.2% 8,649 29.5% 7,422 25.3%
HOUSEHOLD INCOME
Less Than $25,000 59,481 23,913 40.2% 17,367 29.2% 18,201 30.6%
$25,000 ‐ $49,999 137,082 71,825 52.4% 38,590 28.2% 26,667 19.5%
$50,000 ‐ $74,999 123,824 67,658 54.6% 37,608 30.4% 18,558 15.0%
$75,000 ‐ $99,999 66,780 35,872 53.7% 20,559 30.8% 10,349 15.5%
$100,000 + 97,644 62,492 64.0% 25,898 26.5% 9,254 9.5%
WINNIPEG LICO‐125 CLASS
Yes 158,987 73,323 46.1% 45,966 28.9% 39,698 25.0%
No 325,824 188,437 57.8% 94,055 28.9% 43,332 13.3%
INDIGENOUS SELF‐DECLARED ANCESTRY
Yes 51,429 17,121 33.3% 9,840 19.1% 24,468 47.6%
No 409,630 231,125 56.4% 123,161 30.1% 55,344 13.5%
Undeclared 23,751 13,514 56.9% 7,020 29.6% 3,218 13.5%
FIRST NATION ON RESERVE
FIRST NATION ON RESERVE 15,456 0 0.0% 0 0.0% 15,456 100.0%
BILL PAYMENT RATING
Excel lent 439,339 242,708 55.2% 129,289 29.4% 67,341 15.3%
Satis factory 22,395 10,327 46.1% 6,000 26.8% 6,068 27.1%
Poor 23,077 8,725 37.8% 4,731 20.5% 9,621 41.7%
DWELLING OWNERSHIP
Own 404,316 211,319 52.3% 125,557 31.1% 67,440 16.7%
Rent / Other 80,495 50,441 62.7% 14,464 18.0% 15,590 19.4%
2017 RESIDENTIAL SURVEY SECTION 1 ‐ DWELLING CHARACTERISTICS ‐ REFERENCE TABLE 1.01
NATURAL GAS AVAILABLE AREAS
Centra Gas Manitoba Inc. 2019/20 General Rate Application Appendix 7.7
March 22, 2019 Page 14 of 228

7
1.02 Dwelling Types
TOTAL
SINGLE
DETACHED %
MULTI
ATTACHED %
APARTMENT
SUITE %
OVERALL 484,811 373,568 77.1% 46,834 9.7% 64,409 13.3%
FUEL AREA
Winnipeg City 261,760 173,728 66.4% 32,869 12.6% 55,163 21.1%
Gas Avai lable 140,021 120,943 86.4% 11,038 7.9% 8,040 5.7%
No Gas Avai lable 83,030 78,897 95.0% 2,927 3.5% 1,206 1.5%
DWELLING TYPE
Single Detached 373,568 373,568 100.0% 0 0.0% 0 0.0%
Multi Attached 46,834 0 0.0% 46,834 100.0% 0 0.0%
Apartment Sui te 64,409 0 0.0% 0 0.0% 64,409 100.0%
BUILDING CODE ERA
2010‐2017 37,645 22,527 59.8% 8,275 22.0% 6,843 18.2%
1990‐2009 89,181 72,352 81.1% 7,720 8.7% 9,110 10.2%
1970‐1989 161,749 120,242 74.3% 17,977 11.1% 23,529 14.5%
1950‐1969 110,314 86,161 78.1% 7,508 6.8% 16,646 15.1%
Pre 1950 85,922 72,286 84.1% 5,355 6.2% 8,281 9.6%
SPACE HEAT FUEL
Electric Heat 191,639 142,312 74.3% 18,309 9.6% 31,018 16.2%
Natura l Gas Heat 249,938 224,311 89.7% 23,378 9.4% 2,249 0.9%
Other Fuel 6,945 6,945 100.0% 0 0.0% 0 0.0%
Shared (No Heat on Bi l l ) 36,289 0 0.0% 5,147 14.2% 31,142 85.8%
PEOPLE PER HOUSEHOLD
One 124,779 76,744 61.5% 14,238 11.4% 33,798 27.1%
Two 221,729 175,943 79.4% 20,073 9.1% 25,714 11.6%
Three 60,069 49,546 82.5% 6,876 11.4% 3,647 6.1%
Four 48,897 44,378 90.8% 3,701 7.6% 817 1.7%
Five + 29,337 26,956 91.9% 1,947 6.6% 434 1.5%
HOUSEHOLD INCOME
Less Than $25,000 59,481 37,111 62.4% 8,235 13.8% 14,134 23.8%
$25,000 ‐ $49,999 137,082 98,611 71.9% 13,926 10.2% 24,545 17.9%
$50,000 ‐ $74,999 123,824 94,735 76.5% 14,544 11.7% 14,545 11.7%
$75,000 ‐ $99,999 66,780 57,836 86.6% 3,401 5.1% 5,543 8.3%
$100,000 + 97,644 85,274 87.3% 6,728 6.9% 5,641 5.8%
WINNIPEG LICO‐125 CLASS
Yes 158,987 112,000 70.4% 18,431 11.6% 28,555 18.0%
No 325,824 261,568 80.3% 28,403 8.7% 35,854 11.0%
INDIGENOUS SELF‐DECLARED ANCESTRY
Yes 51,429 41,753 81.2% 5,424 10.5% 4,252 8.3%
No 409,630 311,303 76.0% 39,674 9.7% 58,653 14.3%
Undeclared 23,751 20,512 86.4% 1,736 7.3% 1,504 6.3%
FIRST NATION ON RESERVE
FIRST NATION ON RESERVE 15,456 14,578 94.3% 815 5.3% 63 0.4%
BILL PAYMENT RATING
Excel lent 439,339 338,926 77.1% 42,306 9.6% 58,107 13.2%
Sati s factory 22,395 17,808 79.5% 2,212 9.9% 2,375 10.6%
Poor 23,077 16,834 72.9% 2,317 10.0% 3,927 17.0%
DWELLING OWNERSHIP
Own 404,316 354,031 87.6% 31,430 7.8% 18,855 4.7%
Rent / Other 80,495 19,537 24.3% 15,404 19.1% 45,554 56.6%
2017 RESIDENTIAL SURVEY SECTION 1 ‐ DWELLING CHARACTERISTICS ‐ REFERENCE TABLE 1.02
DWELLING TYPES
Centra Gas Manitoba Inc. 2019/20 General Rate Application Appendix 7.7
March 22, 2019 Page 15 of 228

8
1.03 Dwelling Ownership
TOTAL OWN % RENT / OTHER %
OVERALL 484,811 404,316 83.4% 80,495 16.6%
FUEL AREA
Winnipeg City 261,760 211,319 80.7% 50,441 19.3%
Gas Avai lable 140,021 125,557 89.7% 14,464 10.3%
No Gas Avai lable 83,030 67,440 81.2% 15,590 18.8%
DWELLING TYPE
Single Detached 373,568 354,031 94.8% 19,537 5.2%
Multi Attached 46,834 31,430 67.1% 15,404 32.9%
Apartment Sui te 64,409 18,855 29.3% 45,554 70.7%
BUILDING CODE ERA
2010‐2017 37,645 29,650 78.8% 7,995 21.2%
1990‐2009 89,181 76,383 85.6% 12,798 14.4%
1970‐1989 161,749 135,094 83.5% 26,654 16.5%
1950‐1969 110,314 91,050 82.5% 19,264 17.5%
Pre 1950 85,922 72,139 84.0% 13,783 16.0%
SPACE HEAT FUEL
Electric Heat 191,639 151,221 78.9% 40,418 21.1%
Natura l Gas Heat 249,938 238,662 95.5% 11,276 4.5%
Other Fuel 6,945 5,821 83.8% 1,124 16.2%
Shared (No Heat on Bi l l ) 36,289 8,612 23.7% 27,677 76.3%
PEOPLE PER HOUSEHOLD
One 124,779 89,992 72.1% 34,787 27.9%
Two 221,729 194,283 87.6% 27,446 12.4%
Three 60,069 53,067 88.3% 7,003 11.7%
Four 48,897 43,591 89.2% 5,305 10.8%
Five + 29,337 23,383 79.7% 5,954 20.3%
HOUSEHOLD INCOME
Less Than $25,000 59,481 33,631 56.5% 25,850 43.5%
$25,000 ‐ $49,999 137,082 110,628 80.7% 26,455 19.3%
$50,000 ‐ $74,999 123,824 107,034 86.4% 16,790 13.6%
$75,000 ‐ $99,999 66,780 61,103 91.5% 5,677 8.5%
$100,000 + 97,644 91,921 94.1% 5,723 5.9%
WINNIPEG LICO‐125 CLASS
Yes 158,987 114,589 72.1% 44,398 27.9%
No 325,824 289,727 88.9% 36,097 11.1%
INDIGENOUS SELF‐DECLARED ANCESTRY
Yes 51,429 32,500 63.2% 18,929 36.8%
No 409,630 350,294 85.5% 59,337 14.5%
Undeclared 23,751 21,522 90.6% 2,229 9.4%
FIRST NATION ON RESERVE
FIRST NATION ON RESERVE 15,456 4,514 29.2% 10,942 70.8%
BILL PAYMENT RATING
Excel lent 439,339 374,841 85.3% 64,498 14.7%
Sati s factory 22,395 16,363 73.1% 6,032 26.9%
Poor 23,077 13,112 56.8% 9,965 43.2%
DWELLING OWNERSHIP
Own 404,316 404,316 100.0% 0 0.0%
Rent / Other 80,495 0 0.0% 80,495 100.0%
2017 RESIDENTIAL SURVEY SECTION 1 ‐ DWELLING CHARACTERISTICS ‐ REFERENCE TABLE 1.03
DWELLING OWNERSHIP
Centra Gas Manitoba Inc. 2019/20 General Rate Application Appendix 7.7
March 22, 2019 Page 16 of 228

9
1.04 Dwelling Storey Types
TOTAL 1 STOREY % 1 & 1/2 % 2 STOREY %
Bi‐Split‐
Cab % SUITE %
OVERALL 484,811 264,871 54.6% 34,589 7.1% 82,524 17.0% 32,436 6.7% 70,390 14.5%
FUEL AREA
Winnipeg City 261,760 112,972 43.2% 17,443 6.7% 54,004 20.6% 17,780 6.8% 59,561 22.8%
Gas Avai lable 140,021 94,470 67.5% 8,375 6.0% 17,373 12.4% 10,809 7.7% 8,994 6.4%
No Gas Avai lable 83,030 57,429 69.2% 8,771 10.6% 11,147 13.4% 3,847 4.6% 1,835 2.2%
DWELLING TYPE
Single Detached 373,568 245,720 65.8% 33,804 9.0% 64,497 17.3% 29,548 7.9% 0 0.0%
Multi Attached 46,834 19,152 40.9% 785 1.7% 18,028 38.5% 2,888 6.2% 5,981 12.8%
Apartment Sui te 64,409 0 0.0% 0 0.0% 0 0.0% 0 0.0% 64,409 100.0%
BUILDING CODE ERA
2010‐2017 37,645 18,090 48.1% 806 2.1% 9,389 24.9% 2,365 6.3% 6,995 18.6%
1990‐2009 89,181 54,164 60.7% 3,620 4.1% 14,270 16.0% 7,491 8.4% 9,637 10.8%
1970‐1989 161,749 90,007 55.6% 4,581 2.8% 26,791 16.6% 16,591 10.3% 23,778 14.7%
1950‐1969 110,314 67,407 61.1% 7,626 6.9% 11,542 10.5% 5,552 5.0% 18,188 16.5%
Pre 1950 85,922 35,204 41.0% 17,956 20.9% 20,532 23.9% 438 0.5% 11,791 13.7%
SPACE HEAT FUEL
Electric Heat 191,639 111,280 58.1% 13,048 6.8% 24,803 12.9% 10,291 5.4% 32,217 16.8%
Natura l Gas Heat 249,938 148,769 59.5% 20,133 8.1% 55,870 22.4% 22,145 8.9% 3,021 1.2%
Other Fuel 6,945 4,379 63.0% 1,408 20.3% 1,158 16.7% 0 0.0% 0 0.0%
Shared (No Heat on Bi l l ) 36,289 444 1.2% 0 0.0% 693 1.9% 0 0.0% 35,152 96.9%
PEOPLE PER HOUSEHOLD
One 124,779 61,773 49.5% 8,638 6.9% 13,611 10.9% 4,959 4.0% 35,799 28.7%
Two 221,729 128,105 57.8% 15,726 7.1% 35,541 16.0% 13,743 6.2% 28,613 12.9%
Three 60,069 34,301 57.1% 3,673 6.1% 12,185 20.3% 5,598 9.3% 4,313 7.2%
Four 48,897 24,853 50.8% 4,498 9.2% 14,050 28.7% 4,679 9.6% 817 1.7%
Five + 29,337 15,840 54.0% 2,054 7.0% 7,137 24.3% 3,458 11.8% 848 2.9%
HOUSEHOLD INCOME
Less Than $25,000 59,481 30,467 51.2% 4,836 8.1% 6,945 11.7% 2,172 3.7% 15,060 25.3%
$25,000 ‐ $49,999 137,082 77,895 56.8% 9,671 7.1% 16,072 11.7% 7,303 5.3% 26,141 19.1%
$50,000 ‐ $74,999 123,824 72,079 58.2% 8,606 7.0% 18,331 14.8% 8,597 6.9% 16,210 13.1%
$75,000 ‐ $99,999 66,780 35,475 53.1% 5,849 8.8% 14,438 21.6% 5,475 8.2% 5,543 8.3%
$100,000 + 97,644 48,955 50.1% 5,626 5.8% 26,738 27.4% 8,889 9.1% 7,436 7.6%
WINNIPEG LICO‐125 CLASS
Yes 158,987 88,541 55.7% 12,268 7.7% 18,787 11.8% 8,758 5.5% 30,632 19.3%
No 325,824 176,330 54.1% 22,321 6.9% 63,737 19.6% 23,678 7.3% 39,758 12.2%
INDIGENOUS SELF‐DECLARED ANCESTRY
Yes 51,429 29,298 57.0% 4,731 9.2% 6,931 13.5% 4,441 8.6% 6,029 11.7%
No 409,630 221,211 54.0% 28,500 7.0% 70,878 17.3% 26,338 6.4% 62,703 15.3%
Undeclared 23,751 14,363 60.5% 1,358 5.7% 4,715 19.9% 1,658 7.0% 1,658 7.0%
FIRST NATION ON RESERVE
FIRST NATION ON RESERVE 15,456 12,042 77.9% 746 4.8% 1,417 9.2% 1,119 7.2% 131 0.8%
BILL PAYMENT RATING
Excel lent 439,339 240,808 54.8% 31,379 7.1% 74,433 16.9% 29,518 6.7% 63,200 14.4%
Sati s factory 22,395 11,976 53.5% 1,638 7.3% 4,067 18.2% 1,895 8.5% 2,819 12.6%
Poor 23,077 12,087 52.4% 1,572 6.8% 4,024 17.4% 1,023 4.4% 4,371 18.9%
DWELLING OWNERSHIP
Own 404,316 246,559 61.0% 32,330 8.0% 72,576 18.0% 30,853 7.6% 21,998 5.4%
Rent / Other 80,495 18,313 22.8% 2,259 2.8% 9,949 12.4% 1,583 2.0% 48,392 60.1%
2017 RESIDENTIAL SURVEY SECTION 1 ‐ DWELLING CHARACTERISTICS ‐ REFERENCE TABLE 1.04
DWELLING STOREY TYPES
Centra Gas Manitoba Inc. 2019/20 General Rate Application Appendix 7.7
March 22, 2019 Page 17 of 228

10
1.05 Building Code Construction Era
TOTAL
Ave.
Year
Built 2010‐2017 % 1990‐2009 % 1970‐1989 % 1950‐1969 % PRE 1950 %
OVERALL 484,811 1972 37,645 7.8% 89,181 18.4% 161,749 33.4% 110,314 22.8% 85,922 17.7%
FUEL AREA
Winnipeg City 261,760 1968 16,471 6.3% 33,079 12.6% 86,548 33.1% 72,197 27.6% 53,466 20.4%
Gas Avai lable 140,021 1978 15,910 11.4% 34,039 24.3% 48,720 34.8% 22,595 16.1% 18,757 13.4%
No Gas Avai lable 83,030 1975 5,265 6.3% 22,063 26.6% 26,481 31.9% 15,523 18.7% 13,699 16.5%
DWELLING TYPE
Single Detached 373,568 1971 22,527 6.0% 72,352 19.4% 120,242 32.2% 86,161 23.1% 72,286 19.4%
Multi Attached 46,834 1978 8,275 17.7% 7,720 16.5% 17,977 38.4% 7,508 16.0% 5,355 11.4%
Apartment Suite 64,409 1975 6,843 10.6% 9,110 14.1% 23,529 36.5% 16,646 25.8% 8,281 12.9%
BUILDING CODE ERA
2010‐2017 37,645 2013 37,645 100.0% 0 0.0% 0 0.0% 0 0.0% 0 0.0%
1990‐2009 89,181 2000 0 0.0% 89,181 100.0% 0 0.0% 0 0.0% 0 0.0%
1970‐1989 161,749 1980 0 0.0% 0 0.0% 161,749 100.0% 0 0.0% 0 0.0%
1950‐1969 110,314 1960 0 0.0% 0 0.0% 0 0.0% 110,314 100.0% 0 0.0%
Pre 1950 85,922 1927 0 0.0% 0 0.0% 0 0.0% 0 0.0% 85,922 100.0%
SPACE HEAT FUEL
Electri c Heat 191,639 1979 22,296 11.6% 45,317 23.6% 71,800 37.5% 26,349 13.7% 25,878 13.5%
Natura l Gas Heat 249,938 1970 14,606 5.8% 41,052 16.4% 80,474 32.2% 65,566 26.2% 48,240 19.3%
Other Fuel 6,945 1967 600 8.6% 1,155 16.6% 1,873 27.0% 1,277 18.4% 2,039 29.4%
Shared (No Heat on Bi l l ) 36,289 1956 143 0.4% 1,657 4.6% 7,601 20.9% 17,122 47.2% 9,765 26.9%
PEOPLE PER HOUSEHOLD
One 124,779 1967 7,200 5.8% 15,114 12.1% 42,430 34.0% 29,579 23.7% 30,457 24.4%
Two 221,729 1974 15,292 6.9% 44,621 20.1% 77,892 35.1% 51,602 23.3% 32,322 14.6%
Three 60,069 1974 4,353 7.2% 12,452 20.7% 19,887 33.1% 13,823 23.0% 9,555 15.9%
Four 48,897 1975 6,358 13.0% 10,332 21.1% 13,715 28.1% 9,747 19.9% 8,744 17.9%
Five + 29,337 1976 4,442 15.1% 6,663 22.7% 7,825 26.7% 5,563 19.0% 4,845 16.5%
HOUSEHOLD INCOME
Less Than $25,000 59,481 1967 3,216 5.4% 9,280 15.6% 19,390 32.6% 12,974 21.8% 14,620 24.6%
$25,000 ‐ $49,999 137,082 1970 7,077 5.2% 20,475 14.9% 50,471 36.8% 33,633 24.5% 25,427 18.5%
$50,000 ‐ $74,999 123,824 1973 9,360 7.6% 22,179 17.9% 41,451 33.5% 31,227 25.2% 19,606 15.8%
$75,000 ‐ $99,999 66,780 1976 7,124 10.7% 14,321 21.4% 22,062 33.0% 13,166 19.7% 10,107 15.1%
$100,000 + 97,644 1976 10,868 11.1% 22,926 23.5% 28,375 29.1% 19,314 19.8% 16,161 16.6%
WINNIPEG LICO‐125 CLASS
Yes 158,987 1969 9,326 5.9% 24,801 15.6% 55,411 34.9% 36,356 22.9% 33,093 20.8%
No 325,824 1974 28,319 8.7% 64,380 19.8% 106,337 32.6% 73,959 22.7% 52,829 16.2%
INDIGENOUS SELF‐DECLARED ANCESTRY
Yes 51,429 1975 3,974 7.7% 13,956 27.1% 15,793 30.7% 9,002 17.5% 8,705 16.9%
No 409,630 1972 31,746 7.7% 71,849 17.5% 137,229 33.5% 96,286 23.5% 72,520 17.7%
Undeclared 23,751 1971 1,926 8.1% 3,376 14.2% 8,727 36.7% 5,027 21.2% 4,697 19.8%
FIRST NATION ON RESERVE
FIRST NATION ON RESERVE 15,456 1995 1,646 10.7% 8,760 56.7% 4,832 31.3% 62 0.4% 155 1.0%
BILL PAYMENT RATING
Excel lent 439,339 1972 33,864 7.7% 79,485 18.1% 148,787 33.9% 101,074 23.0% 76,130 17.3%
Satis factory 22,395 1971 1,897 8.5% 4,645 20.7% 6,560 29.3% 4,441 19.8% 4,853 21.7%
Poor 23,077 1971 1,885 8.2% 5,051 21.9% 6,402 27.7% 4,800 20.8% 4,939 21.4%
DWELLING OWNERSHIP
Own 404,316 1972 29,650 7.3% 76,383 18.9% 135,094 33.4% 91,050 22.5% 72,139 17.8%
Rent / Other 80,495 1972 7,995 9.9% 12,798 15.9% 26,654 33.1% 19,264 23.9% 13,783 17.1%
2017 RESIDENTIAL SURVEY SECTION 1 ‐ DWELLING CHARACTERISTICS ‐ REFERENCE TABLE 1.05
BUILDING CODE CONSTRUCTION ERA
Centra Gas Manitoba Inc. 2019/20 General Rate Application Appendix 7.7
March 22, 2019 Page 18 of 228

11
1.06 Dwelling Square Footage
TOTAL
AVE
SQFT
800 or
Less %
801 ‐
1,100 %
1,101 ‐
1,400 %
1,401 ‐
1,700 %
1,701 ‐
2,000 %
OVER
2,000 %
OVERALL 484,811 1,285 77,790 16.0% 137,956 28.5% 123,344 25.4% 63,282 13.1% 38,645 8.0% 43,794 9.0%
FUEL AREA
Winnipeg City 261,760 1,236 45,090 17.2% 81,584 31.2% 63,972 24.4% 32,364 12.4% 18,774 7.2% 19,977 7.6%
Gas Avai lable 140,021 1,364 17,458 12.5% 34,952 25.0% 38,426 27.4% 20,412 14.6% 13,196 9.4% 15,576 11.1%
No Gas Avai lable 83,030 1,304 15,241 18.4% 21,420 25.8% 20,946 25.2% 10,506 12.7% 6,675 8.0% 8,241 9.9%
DWELLING TYPE
Single Detached 373,568 1,359 40,686 10.9% 97,722 26.2% 102,229 27.4% 57,095 15.3% 35,980 9.6% 39,855 10.7%
Multi Attached 46,834 1,238 5,792 12.4% 17,664 37.7% 14,413 30.8% 4,214 9.0% 1,409 3.0% 3,342 7.1%
Apartment Sui te 64,409 888 31,312 48.6% 22,571 35.0% 6,702 10.4% 1,973 3.1% 1,255 1.9% 596 0.9%
BUILDING CODE ERA
2010‐2017 37,645 1,448 3,031 8.1% 8,592 22.8% 9,992 26.5% 6,585 17.5% 4,805 12.8% 4,640 12.3%
1990‐2009 89,181 1,428 7,985 9.0% 14,298 16.0% 26,917 30.2% 19,935 22.4% 10,211 11.4% 9,835 11.0%
1970‐1989 161,749 1,287 17,721 11.0% 54,216 33.5% 40,633 25.1% 20,244 12.5% 14,291 8.8% 14,643 9.1%
1950‐1969 110,314 1,138 25,013 22.7% 39,244 35.6% 28,960 26.3% 6,859 6.2% 4,212 3.8% 6,026 5.5%
Pre 1950 85,922 1,248 24,039 28.0% 21,605 25.1% 16,842 19.6% 9,658 11.2% 5,126 6.0% 8,650 10.1%
SPACE HEAT FUEL
Electric Heat 191,639 1,270 32,797 17.1% 56,164 29.3% 49,649 25.9% 22,843 11.9% 13,663 7.1% 16,525 8.6%
Natura l Gas Heat 249,938 1,348 21,751 8.7% 70,707 28.3% 69,897 28.0% 38,749 15.5% 23,775 9.5% 25,060 10.0%
Other Fuel 6,945 1,007 1,537 22.1% 3,179 45.8% 1,761 25.3% 131 1.9% 337 4.9% 0 0.0%
Shared (No Heat on Bi l l ) 36,289 981 21,706 59.8% 7,907 21.8% 2,038 5.6% 1,560 4.3% 870 2.4% 2,209 6.1%
PEOPLE PER HOUSEHOLD
One 124,779 1,069 36,341 29.1% 47,373 38.0% 22,927 18.4% 8,697 7.0% 4,793 3.8% 4,649 3.7%
Two 221,729 1,334 26,268 11.8% 60,031 27.1% 61,524 27.7% 33,385 15.1% 18,807 8.5% 21,714 9.8%
Three 60,069 1,344 6,346 10.6% 15,043 25.0% 17,741 29.5% 9,044 15.1% 5,831 9.7% 6,064 10.1%
Four 48,897 1,431 5,300 10.8% 10,254 21.0% 12,545 25.7% 7,986 16.3% 6,317 12.9% 6,494 13.3%
Five + 29,337 1,465 3,536 12.1% 5,255 17.9% 8,607 29.3% 4,170 14.2% 2,896 9.9% 4,872 16.6%
HOUSEHOLD INCOME
Less Than $25,000 59,481 1,007 21,687 36.5% 19,980 33.6% 10,036 16.9% 3,492 5.9% 1,790 3.0% 2,496 4.2%
$25,000 ‐ $49,999 137,082 1,154 28,779 21.0% 48,038 35.0% 34,277 25.0% 12,380 9.0% 6,887 5.0% 6,723 4.9%
$50,000 ‐ $74,999 123,824 1,250 17,255 13.9% 39,686 32.1% 34,097 27.5% 15,678 12.7% 8,162 6.6% 8,945 7.2%
$75,000 ‐ $99,999 66,780 1,410 5,083 7.6% 15,044 22.5% 18,871 28.3% 13,367 20.0% 6,674 10.0% 7,742 11.6%
$100,000 + 97,644 1,596 4,986 5.1% 15,209 15.6% 26,063 26.7% 18,366 18.8% 15,132 15.5% 17,888 18.3%
WINNIPEG LICO‐125 CLASS
Yes 158,987 1,124 41,769 26.3% 51,971 32.7% 36,818 23.2% 12,639 7.9% 6,959 4.4% 8,830 5.6%
No 325,824 1,363 36,021 11.1% 85,985 26.4% 86,526 26.6% 50,643 15.5% 31,686 9.7% 34,964 10.7%
INDIGENOUS SELF‐DECLARED ANCESTRY
Yes 51,429 1,205 12,430 24.2% 15,150 29.5% 11,179 21.7% 4,478 8.7% 3,757 7.3% 4,435 8.6%
No 409,630 1,292 61,965 15.1% 116,252 28.4% 106,641 26.0% 54,631 13.3% 33,054 8.1% 37,088 9.1%
Undeclared 23,751 1,321 3,394 14.3% 6,554 27.6% 5,524 23.3% 4,173 17.6% 1,834 7.7% 2,271 9.6%
FIRST NATION ON RESERVE
FIRST NATION ON RESERVE 15,456 1,072 5,539 35.8% 3,918 25.4% 3,556 23.0% 938 6.1% 659 4.3% 845 5.5%
BILL PAYMENT RATING
Excel lent 439,339 1,288 66,837 15.2% 123,627 28.1% 114,773 26.1% 58,402 13.3% 36,343 8.3% 39,356 9.0%
Satis factory 22,395 1,320 5,067 22.6% 7,784 34.8% 3,039 13.6% 2,604 11.6% 1,531 6.8% 2,371 10.6%
Poor 23,077 1,179 5,886 25.5% 6,545 28.4% 5,532 24.0% 2,277 9.9% 771 3.3% 2,067 9.0%
DWELLING OWNERSHIP
Own 404,316 1,352 41,438 10.2% 110,455 27.3% 113,361 28.0% 60,621 15.0% 37,375 9.2% 41,065 10.2%
Rent / Other 80,495 944 36,352 45.2% 27,501 34.2% 9,983 12.4% 2,661 3.3% 1,270 1.6% 2,729 3.4%
2017 RESIDENTIAL SURVEY SECTION 1 ‐ DWELLING CHARACTERISTICS ‐ REFERENCE TABLE 1.06
DWELLING SQUARE FOOTAGE
Centra Gas Manitoba Inc. 2019/20 General Rate Application Appendix 7.7
March 22, 2019 Page 19 of 228

12
1.07a Single Pane Windows
TOTAL NONE % LESS THAN 10 % MORE THAN 10 %
OVERALL 484,811 407,370 84.0% 68,960 14.2% 8,481 1.7%
FUEL AREA
Winnipeg City 261,760 213,797 81.7% 42,358 16.2% 5,605 2.1%
Gas Avai lable 140,021 123,829 88.4% 14,265 10.2% 1,927 1.4%
No Gas Avai lable 83,030 69,744 84.0% 12,336 14.9% 949 1.1%
DWELLING TYPE
Single Detached 373,568 319,639 85.6% 46,285 12.4% 7,644 2.0%
Multi Attached 46,834 38,207 81.6% 7,953 17.0% 674 1.4%
Apartment Sui te 64,409 49,524 76.9% 14,722 22.9% 163 0.3%
BUILDING CODE ERA
2010‐2017 37,645 34,390 91.4% 2,679 7.1% 576 1.5%
1990‐2009 89,181 81,101 90.9% 7,341 8.2% 739 0.8%
1970‐1989 161,749 140,622 86.9% 19,399 12.0% 1,727 1.1%
1950‐1969 110,314 89,504 81.1% 19,184 17.4% 1,626 1.5%
Pre 1950 85,922 61,753 71.9% 20,356 23.7% 3,813 4.4%
SPACE HEAT FUEL
Electric Heat 191,639 163,762 85.5% 25,063 13.1% 2,814 1.5%
Natura l Gas Heat 249,938 212,701 85.1% 31,569 12.6% 5,668 2.3%
Other Fuel 6,945 4,291 61.8% 2,654 38.2% 0 0.0%
Shared (No Heat on Bi l l ) 36,289 26,616 73.3% 9,673 26.7% 0 0.0%
PEOPLE PER HOUSEHOLD
One 124,779 100,922 80.9% 22,484 18.0% 1,373 1.1%
Two 221,729 193,228 87.1% 24,410 11.0% 4,092 1.8%
Three 60,069 49,829 83.0% 9,681 16.1% 559 0.9%
Four 48,897 39,467 80.7% 7,813 16.0% 1,617 3.3%
Five + 29,337 23,925 81.6% 4,572 15.6% 840 2.9%
HOUSEHOLD INCOME
Less Than $25,000 59,481 42,671 71.7% 15,146 25.5% 1,663 2.8%
$25,000 ‐ $49,999 137,082 115,269 84.1% 19,550 14.3% 2,263 1.7%
$50,000 ‐ $74,999 123,824 105,666 85.3% 16,952 13.7% 1,206 1.0%
$75,000 ‐ $99,999 66,780 58,263 87.2% 6,849 10.3% 1,668 2.5%
$100,000 + 97,644 85,501 87.6% 10,462 10.7% 1,680 1.7%
WINNIPEG LICO‐125 CLASS
Yes 158,987 125,767 79.1% 29,916 18.8% 3,304 2.1%
No 325,824 281,603 86.4% 39,044 12.0% 5,177 1.6%
INDIGENOUS SELF‐DECLARED ANCESTRY
Yes 51,429 39,799 77.4% 10,301 20.0% 1,329 2.6%
No 409,630 347,451 84.8% 55,587 13.6% 6,592 1.6%
Undeclared 23,751 20,120 84.7% 3,072 12.9% 559 2.4%
FIRST NATION ON RESERVE
FIRST NATION ON RESERVE 15,456 11,029 71.4% 4,147 26.8% 280 1.8%
BILL PAYMENT RATING
Excel lent 439,339 372,274 84.7% 59,833 13.6% 7,232 1.6%
Sati s factory 22,395 18,183 81.2% 3,801 17.0% 411 1.8%
Poor 23,077 16,914 73.3% 5,325 23.1% 838 3.6%
DWELLING OWNERSHIP
Own 404,316 350,254 86.6% 46,760 11.6% 7,302 1.8%
Rent / Other 80,495 57,116 71.0% 22,200 27.6% 1,179 1.5%
2017 RESIDENTIAL SURVEY SECTION 1 ‐ DWELLING CHARACTERISTICS ‐ REFERENCE TABLE 1.07a
SINGLE PANE WINDOWS
Centra Gas Manitoba Inc. 2019/20 General Rate Application Appendix 7.7
March 22, 2019 Page 20 of 228

13
1.07b Dual Pane Windows
TOTAL NONE % LESS THAN 10 % MORE THAN 10 %
OVERALL 484,811 215,531 44.5% 209,503 43.2% 59,777 12.3%
FUEL AREA
Winnipeg City 261,760 114,439 43.7% 117,383 44.8% 29,938 11.4%
Gas Avai lable 140,021 65,568 46.8% 56,177 40.1% 18,276 13.1%
No Gas Avai lable 83,030 35,523 42.8% 35,943 43.3% 11,563 13.9%
DWELLING TYPE
Single Detached 373,568 173,941 46.6% 144,956 38.8% 54,670 14.6%
Multi Attached 46,834 19,533 41.7% 24,335 52.0% 2,966 6.3%
Apartment Sui te 64,409 22,056 34.2% 40,212 62.4% 2,141 3.3%
BUILDING CODE ERA
2010‐2017 37,645 20,482 54.4% 13,165 35.0% 3,999 10.6%
1990‐2009 89,181 47,969 53.8% 27,922 31.3% 13,290 14.9%
1970‐1989 161,749 76,160 47.1% 70,250 43.4% 15,338 9.5%
1950‐1969 110,314 43,037 39.0% 57,518 52.1% 9,760 8.8%
Pre 1950 85,922 27,883 32.5% 40,649 47.3% 17,390 20.2%
SPACE HEAT FUEL
Electric Heat 191,639 84,772 44.2% 84,447 44.1% 22,420 11.7%
Natura l Gas Heat 249,938 117,733 47.1% 98,637 39.5% 33,567 13.4%
Other Fuel 6,945 2,226 32.1% 3,267 47.0% 1,452 20.9%
Shared (No Heat on Bi l l ) 36,289 10,799 29.8% 23,152 63.8% 2,338 6.4%
PEOPLE PER HOUSEHOLD
One 124,779 49,834 39.9% 65,301 52.3% 9,644 7.7%
Two 221,729 108,024 48.7% 88,010 39.7% 25,695 11.6%
Three 60,069 24,618 41.0% 26,283 43.8% 9,169 15.3%
Four 48,897 20,260 41.4% 19,631 40.1% 9,005 18.4%
Five + 29,337 12,794 43.6% 10,278 35.0% 6,264 21.4%
HOUSEHOLD INCOME
Less Than $25,000 59,481 24,827 41.7% 30,026 50.5% 4,628 7.8%
$25,000 ‐ $49,999 137,082 58,499 42.7% 65,848 48.0% 12,735 9.3%
$50,000 ‐ $74,999 123,824 56,636 45.7% 53,891 43.5% 13,297 10.7%
$75,000 ‐ $99,999 66,780 30,085 45.1% 25,044 37.5% 11,651 17.4%
$100,000 + 97,644 45,484 46.6% 34,694 35.5% 17,466 17.9%
WINNIPEG LICO‐125 CLASS
Yes 158,987 67,269 42.3% 76,753 48.3% 14,966 9.4%
No 325,824 148,262 45.5% 132,750 40.7% 44,812 13.8%
INDIGENOUS SELF‐DECLARED ANCESTRY
Yes 51,429 20,557 40.0% 23,300 45.3% 7,572 14.7%
No 409,630 184,117 44.9% 175,917 42.9% 49,597 12.1%
Undeclared 23,751 10,856 45.7% 10,286 43.3% 2,609 11.0%
FIRST NATION ON RESERVE
FIRST NATION ON RESERVE 15,456 6,218 40.2% 7,870 50.9% 1,368 8.9%
BILL PAYMENT RATING
Excel lent 439,339 198,063 45.1% 187,029 42.6% 54,247 12.3%
Sati s factory 22,395 9,299 41.5% 10,025 44.8% 3,070 13.7%
Poor 23,077 8,169 35.4% 12,449 53.9% 2,460 10.7%
DWELLING OWNERSHIP
Own 404,316 187,823 46.5% 161,003 39.8% 55,490 13.7%
Rent / Other 80,495 27,708 34.4% 48,500 60.3% 4,287 5.3%
2017 RESIDENTIAL SURVEY SECTION 1 ‐ DWELLING CHARACTERISTICS ‐ REFERENCE TABLE 1.07b
DUAL PANE WINDOWS
Centra Gas Manitoba Inc. 2019/20 General Rate Application Appendix 7.7
March 22, 2019 Page 21 of 228
14
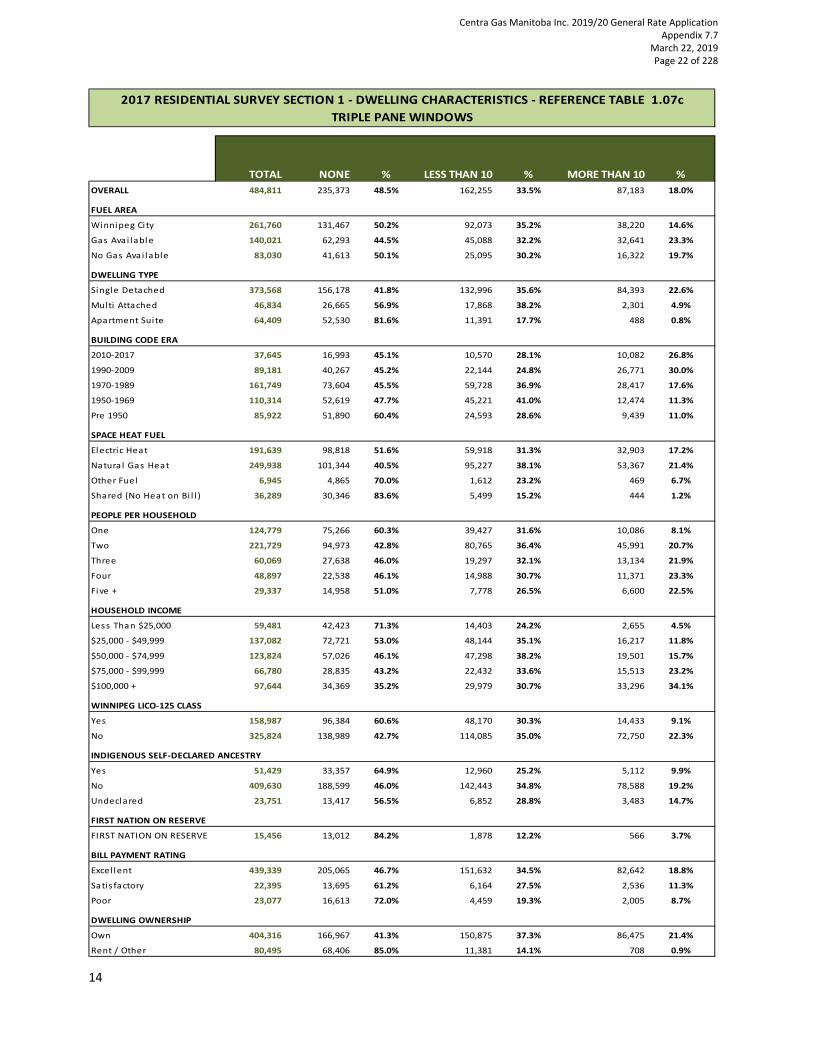
1.07c Triple Pane Windows
TOTAL NONE % LESS THAN 10 % MORE THAN 10 %
OVERALL 484,811 235,373 48.5% 162,255 33.5% 87,183 18.0%
FUEL AREA
Winnipeg City 261,760 131,467 50.2% 92,073 35.2% 38,220 14.6%
Gas Avai lable 140,021 62,293 44.5% 45,088 32.2% 32,641 23.3%
No Gas Avai lable 83,030 41,613 50.1% 25,095 30.2% 16,322 19.7%
DWELLING TYPE
Single Detached 373,568 156,178 41.8% 132,996 35.6% 84,393 22.6%
Multi Attached 46,834 26,665 56.9% 17,868 38.2% 2,301 4.9%
Apartment Sui te 64,409 52,530 81.6% 11,391 17.7% 488 0.8%
BUILDING CODE ERA
2010‐2017 37,645 16,993 45.1% 10,570 28.1% 10,082 26.8%
1990‐2009 89,181 40,267 45.2% 22,144 24.8% 26,771 30.0%
1970‐1989 161,749 73,604 45.5% 59,728 36.9% 28,417 17.6%
1950‐1969 110,314 52,619 47.7% 45,221 41.0% 12,474 11.3%
Pre 1950 85,922 51,890 60.4% 24,593 28.6% 9,439 11.0%
SPACE HEAT FUEL
Electric Heat 191,639 98,818 51.6% 59,918 31.3% 32,903 17.2%
Natura l Gas Heat 249,938 101,344 40.5% 95,227 38.1% 53,367 21.4%
Other Fuel 6,945 4,865 70.0% 1,612 23.2% 469 6.7%
Shared (No Heat on Bi l l ) 36,289 30,346 83.6% 5,499 15.2% 444 1.2%
PEOPLE PER HOUSEHOLD
One 124,779 75,266 60.3% 39,427 31.6% 10,086 8.1%
Two 221,729 94,973 42.8% 80,765 36.4% 45,991 20.7%
Three 60,069 27,638 46.0% 19,297 32.1% 13,134 21.9%
Four 48,897 22,538 46.1% 14,988 30.7% 11,371 23.3%
Five + 29,337 14,958 51.0% 7,778 26.5% 6,600 22.5%
HOUSEHOLD INCOME
Less Than $25,000 59,481 42,423 71.3% 14,403 24.2% 2,655 4.5%
$25,000 ‐ $49,999 137,082 72,721 53.0% 48,144 35.1% 16,217 11.8%
$50,000 ‐ $74,999 123,824 57,026 46.1% 47,298 38.2% 19,501 15.7%
$75,000 ‐ $99,999 66,780 28,835 43.2% 22,432 33.6% 15,513 23.2%
$100,000 + 97,644 34,369 35.2% 29,979 30.7% 33,296 34.1%
WINNIPEG LICO‐125 CLASS
Yes 158,987 96,384 60.6% 48,170 30.3% 14,433 9.1%
No 325,824 138,989 42.7% 114,085 35.0% 72,750 22.3%
INDIGENOUS SELF‐DECLARED ANCESTRY
Yes 51,429 33,357 64.9% 12,960 25.2% 5,112 9.9%
No 409,630 188,599 46.0% 142,443 34.8% 78,588 19.2%
Undeclared 23,751 13,417 56.5% 6,852 28.8% 3,483 14.7%
FIRST NATION ON RESERVE
FIRST NATION ON RESERVE 15,456 13,012 84.2% 1,878 12.2% 566 3.7%
BILL PAYMENT RATING
Excel lent 439,339 205,065 46.7% 151,632 34.5% 82,642 18.8%
Satis factory 22,395 13,695 61.2% 6,164 27.5% 2,536 11.3%
Poor 23,077 16,613 72.0% 4,459 19.3% 2,005 8.7%
DWELLING OWNERSHIP
Own 404,316 166,967 41.3% 150,875 37.3% 86,475 21.4%
Rent / Other 80,495 68,406 85.0% 11,381 14.1% 708 0.9%
2017 RESIDENTIAL SURVEY SECTION 1 ‐ DWELLING CHARACTERISTICS ‐ REFERENCE TABLE 1.07c
TRIPLE PANE WINDOWS
Centra Gas Manitoba Inc. 2019/20 General Rate Application Appendix 7.7
March 22, 2019 Page 22 of 228

15
1.07d Storm Pane Windows
TOTAL NONE % LESS THAN 10 % MORE THAN 10 %
OVERALL 484,811 462,991 95.5% 19,644 4.1% 2,176 0.4%
FUEL AREA
Winnipeg City 261,760 248,330 94.9% 11,709 4.5% 1,721 0.7%
Gas Avai lable 140,021 135,699 96.9% 4,122 2.9% 201 0.1%
No Gas Avai lable 83,030 78,962 95.1% 3,813 4.6% 254 0.3%
DWELLING TYPE
Single Detached 373,568 355,341 95.1% 16,050 4.3% 2,176 0.6%
Multi Attached 46,834 45,179 96.5% 1,655 3.5% 0 0.0%
Apartment Sui te 64,409 62,470 97.0% 1,939 3.0% 0 0.0%
BUILDING CODE ERA
2010‐2017 37,645 37,331 99.2% 315 0.8% 0 0.0%
1990‐2009 89,181 86,771 97.3% 2,180 2.4% 230 0.3%
1970‐1989 161,749 156,387 96.7% 5,115 3.2% 246 0.2%
1950‐1969 110,314 104,077 94.3% 6,011 5.4% 226 0.2%
Pre 1950 85,922 78,425 91.3% 6,023 7.0% 1,474 1.7%
SPACE HEAT FUEL
Electric Heat 191,639 185,237 96.7% 5,947 3.1% 455 0.2%
Natura l Gas Heat 249,938 237,335 95.0% 10,882 4.4% 1,721 0.7%
Other Fuel 6,945 5,581 80.4% 1,364 19.6% 0 0.0%
Shared (No Heat on Bi l l ) 36,289 34,838 96.0% 1,451 4.0% 0 0.0%
PEOPLE PER HOUSEHOLD
One 124,779 118,267 94.8% 6,151 4.9% 361 0.3%
Two 221,729 213,468 96.3% 7,361 3.3% 901 0.4%
Three 60,069 56,134 93.4% 3,250 5.4% 685 1.1%
Four 48,897 46,893 95.9% 1,774 3.6% 230 0.5%
Five + 29,337 28,229 96.2% 1,108 3.8% 0 0.0%
HOUSEHOLD INCOME
Less Than $25,000 59,481 55,936 94.0% 3,284 5.5% 261 0.4%
$25,000 ‐ $49,999 137,082 131,402 95.9% 5,138 3.7% 542 0.4%
$50,000 ‐ $74,999 123,824 117,687 95.0% 5,678 4.6% 459 0.4%
$75,000 ‐ $99,999 66,780 64,517 96.6% 1,807 2.7% 456 0.7%
$100,000 + 97,644 93,448 95.7% 3,737 3.8% 459 0.5%
WINNIPEG LICO‐125 CLASS
Yes 158,987 150,467 94.6% 7,818 4.9% 702 0.4%
No 325,824 312,524 95.9% 11,826 3.6% 1,474 0.5%
INDIGENOUS SELF‐DECLARED ANCESTRY
Yes 51,429 48,917 95.1% 2,367 4.6% 146 0.3%
No 409,630 391,801 95.6% 15,798 3.9% 2,031 0.5%
Undeclared 23,751 22,273 93.8% 1,479 6.2% 0 0.0%
FIRST NATION ON RESERVE
FIRST NATION ON RESERVE 15,456 14,990 97.0% 435 2.8% 31 0.2%
BILL PAYMENT RATING
Excel lent 439,339 419,434 95.5% 17,874 4.1% 2,031 0.5%
Satis factory 22,395 21,291 95.1% 958 4.3% 146 0.7%
Poor 23,077 22,265 96.5% 812 3.5% 0 0.0%
DWELLING OWNERSHIP
Own 404,316 385,924 95.5% 16,247 4.0% 2,145 0.5%
Rent / Other 80,495 77,067 95.7% 3,397 4.2% 31 0.0%
2017 RESIDENTIAL SURVEY SECTION 1 ‐ DWELLING CHARACTERISTICS ‐ REFERENCE TABLE 1.07d
STORM PANE WINDOWS
Centra Gas Manitoba Inc. 2019/20 General Rate Application Appendix 7.7
March 22, 2019 Page 23 of 228

16
1.08 Level of Insulation in Attic
TOTAL EXCELLENT %
VERY
GOOD % AVERAGE % FAIR % POOR %
NO
ATTIC %
OVERALL 484,811 76,852 15.9% 130,229 26.9% 125,656 25.9% 39,568 8.2% 25,698 5.3% 86,809 17.9%
FUEL AREA
Winnipeg City 261,760 30,620 11.7% 61,255 23.4% 70,476 26.9% 18,366 7.0% 15,413 5.9% 65,631 25.1%
Gas Avai lable 140,021 30,837 22.0% 44,562 31.8% 34,834 24.9% 10,250 7.3% 4,406 3.1% 15,133 10.8%
No Gas Avai lable 83,030 15,395 18.5% 24,412 29.4% 20,346 24.5% 10,952 13.2% 5,879 7.1% 6,046 7.3%
DWELLING TYPE
Single Detached 373,568 67,736 18.1% 120,624 32.3% 109,573 29.3% 37,364 10.0% 21,485 5.8% 16,786 4.5%
Multi Attached 46,834 9,116 19.5% 9,605 20.5% 16,083 34.3% 2,204 4.7% 4,212 9.0% 5,614 12.0%
Apartment Suite 64,409 0 0.0% 0 0.0% 0 0.0% 0 0.0% 0 0.0% 64,409 100.0%
BUILDING CODE ERA
2010‐2017 37,645 20,316 54.0% 5,971 15.9% 1,414 3.8% 629 1.7% 31 0.1% 9,284 24.7%
1990‐2009 89,181 24,150 27.1% 36,954 41.4% 8,733 9.8% 2,974 3.3% 1,594 1.8% 14,775 16.6%
1970‐1989 161,749 14,508 9.0% 54,211 33.5% 51,193 31.6% 7,747 4.8% 2,500 1.5% 31,590 19.5%
1950‐1969 110,314 10,037 9.1% 20,643 18.7% 48,277 43.8% 8,383 7.6% 3,874 3.5% 19,101 17.3%
Pre 1950 85,922 7,841 9.1% 12,450 14.5% 16,038 18.7% 19,835 23.1% 17,698 20.6% 12,058 14.0%
SPACE HEAT FUEL
Electric Heat 191,639 33,438 17.4% 50,934 26.6% 40,228 21.0% 15,067 7.9% 8,492 4.4% 43,480 22.7%
Natural Gas Heat 249,938 41,921 16.8% 78,283 31.3% 82,005 32.8% 22,283 8.9% 13,932 5.6% 11,514 4.6%
Other Fuel 6,945 1,493 21.5% 762 11.0% 1,437 20.7% 1,774 25.5% 1,055 15.2% 425 6.1%
Shared (No Heat on Bi l l ) 36,289 0 0.0% 249 0.7% 1,986 5.5% 444 1.2% 2,219 6.1% 31,391 86.5%
PEOPLE PER HOUSEHOLD
One 124,779 13,123 10.5% 24,296 19.5% 29,627 23.7% 10,198 8.2% 6,464 5.2% 41,073 32.9%
Two 221,729 35,000 15.8% 68,992 31.1% 58,565 26.4% 16,841 7.6% 9,666 4.4% 32,666 14.7%
Three 60,069 11,221 18.7% 16,174 26.9% 18,337 30.5% 5,024 8.4% 2,668 4.4% 6,645 11.1%
Four 48,897 10,422 21.3% 14,234 29.1% 11,707 23.9% 4,871 10.0% 4,061 8.3% 3,601 7.4%
Five + 29,337 7,086 24.2% 6,532 22.3% 7,420 25.3% 2,635 9.0% 2,839 9.7% 2,824 9.6%
HOUSEHOLD INCOME
Less Than $25,000 59,481 5,498 9.2% 10,594 17.8% 11,947 20.1% 7,284 12.2% 5,316 8.9% 18,842 31.7%
$25,000 ‐ $49,999 137,082 16,917 12.3% 32,411 23.6% 38,977 28.4% 11,185 8.2% 6,434 4.7% 31,157 22.7%
$50,000 ‐ $74,999 123,824 19,744 15.9% 33,651 27.2% 36,164 29.2% 8,393 6.8% 5,788 4.7% 20,084 16.2%
$75,000 ‐ $99,999 66,780 11,529 17.3% 23,468 35.1% 15,586 23.3% 5,575 8.3% 2,772 4.2% 7,850 11.8%
$100,000 + 97,644 23,164 23.7% 30,105 30.8% 22,982 23.5% 7,130 7.3% 5,386 5.5% 8,877 9.1%
WINNIPEG LICO‐125 CLASS
Yes 158,987 20,498 12.9% 33,693 21.2% 39,721 25.0% 15,573 9.8% 11,114 7.0% 38,389 24.1%
No 325,824 56,354 17.3% 96,536 29.6% 85,934 26.4% 23,995 7.4% 14,584 4.5% 48,420 14.9%
INDIGENOUS SELF‐DECLARED ANCESTRY
Yes 51,429 7,707 15.0% 12,997 25.3% 12,599 24.5% 5,846 11.4% 5,100 9.9% 7,181 14.0%
No 409,630 64,653 15.8% 110,833 27.1% 106,797 26.1% 31,784 7.8% 19,322 4.7% 76,241 18.6%
Undeclared 23,751 4,491 18.9% 6,398 26.9% 6,260 26.4% 1,939 8.2% 1,275 5.4% 3,388 14.3%
FIRST NATION ON RESERVE
FIRST NATION ON RESERVE 15,456 3,027 19.6% 4,458 28.8% 2,338 15.1% 1,996 12.9% 2,015 13.0% 1,623 10.5%
BILL PAYMENT RATING
Excel lent 439,339 70,935 16.1% 122,251 27.8% 113,421 25.8% 34,244 7.8% 20,406 4.6% 78,082 17.8%
Satis factory 22,395 3,160 14.1% 4,632 20.7% 5,908 26.4% 2,272 10.1% 2,862 12.8% 3,561 15.9%
Poor 23,077 2,757 11.9% 3,346 14.5% 6,326 27.4% 3,051 13.2% 2,430 10.5% 5,166 22.4%
DWELLING OWNERSHIP
Own 404,316 71,773 17.8% 123,253 30.5% 116,366 28.8% 36,592 9.1% 19,550 4.8% 36,782 9.1%
Rent / Other 80,495 5,079 6.3% 6,975 8.7% 9,290 11.5% 2,976 3.7% 6,147 7.6% 50,027 62.1%
2017 RESIDENTIAL SURVEY SECTION 1 ‐ DWELLING CHARACTERISTICS ‐ REFERENCE TABLE 1.08
LEVEL OF INSULATON IN ATTIC
Centra Gas Manitoba Inc. 2019/20 General Rate Application Appendix 7.7
March 22, 2019 Page 24 of 228

17
1.09 Level of Insulation in Exterior Walls
TOTAL EXCELLENT %
VERY
GOOD % AVERAGE % FAIR % POOR %
OVERALL 484,811 66,660 13.7% 149,278 30.8% 171,991 35.5% 55,307 11.4% 41,575 8.6%
FUEL AREA
Winnipeg City 261,760 28,930 11.1% 68,781 26.3% 103,966 39.7% 31,437 12.0% 28,646 10.9%
Gas Avai lable 140,021 25,525 18.2% 52,118 37.2% 44,477 31.8% 11,738 8.4% 6,163 4.4%
No Gas Avai lable 83,030 12,206 14.7% 28,378 34.2% 23,548 28.4% 12,132 14.6% 6,766 8.1%
DWELLING TYPE
Single Detached 373,568 47,254 12.6% 120,479 32.3% 128,917 34.5% 48,265 12.9% 28,652 7.7%
Multi Attached 46,834 7,942 17.0% 10,680 22.8% 20,335 43.4% 2,874 6.1% 5,003 10.7%
Apartment Sui te 64,409 11,464 17.8% 18,118 28.1% 22,739 35.3% 4,168 6.5% 7,920 12.3%
BUILDING CODE ERA
2010‐2017 37,645 25,233 67.0% 9,721 25.8% 1,706 4.5% 628 1.7% 357 0.9%
1990‐2009 89,181 27,596 30.9% 49,455 55.5% 7,712 8.6% 2,134 2.4% 2,285 2.6%
1970‐1989 161,749 6,793 4.2% 67,366 41.6% 73,961 45.7% 9,561 5.9% 4,067 2.5%
1950‐1969 110,314 3,545 3.2% 12,637 11.5% 74,346 67.4% 15,081 13.7% 4,706 4.3%
Pre 1950 85,922 3,493 4.1% 10,099 11.8% 14,266 16.6% 27,904 32.5% 30,159 35.1%
SPACE HEAT FUEL
Electric Heat 191,639 37,444 19.5% 68,510 35.7% 54,298 28.3% 18,024 9.4% 13,363 7.0%
Natural Gas Heat 249,938 27,762 11.1% 74,557 29.8% 96,352 38.6% 31,041 12.4% 20,226 8.1%
Other Fuel 6,945 731 10.5% 893 12.9% 3,313 47.7% 1,877 27.0% 131 1.9%
Shared (No Heat on Bi l l ) 36,289 724 2.0% 5,318 14.7% 18,028 49.7% 4,366 12.0% 7,854 21.6%
PEOPLE PER HOUSEHOLD
One 124,779 14,800 11.9% 32,170 25.8% 48,028 38.5% 15,404 12.3% 14,377 11.5%
Two 221,729 30,468 13.7% 75,147 33.9% 78,306 35.3% 23,878 10.8% 13,930 6.3%
Three 60,069 9,059 15.1% 17,723 29.5% 21,659 36.1% 6,427 10.7% 5,201 8.7%
Four 48,897 7,214 14.8% 15,902 32.5% 15,023 30.7% 6,379 13.0% 4,378 9.0%
Five + 29,337 5,119 17.4% 8,335 28.4% 8,975 30.6% 3,219 11.0% 3,689 12.6%
HOUSEHOLD INCOME
Less Than $25,000 59,481 5,931 10.0% 13,065 22.0% 21,210 35.7% 9,235 15.5% 10,040 16.9%
$25,000 ‐ $49,999 137,082 15,553 11.3% 40,270 29.4% 54,178 39.5% 16,572 12.1% 10,509 7.7%
$50,000 ‐ $74,999 123,824 16,960 13.7% 36,791 29.7% 47,979 38.7% 12,025 9.7% 10,070 8.1%
$75,000 ‐ $99,999 66,780 10,829 16.2% 24,612 36.9% 20,028 30.0% 7,843 11.7% 3,468 5.2%
$100,000 + 97,644 17,388 17.8% 34,540 35.4% 28,596 29.3% 9,632 9.9% 7,489 7.7%
WINNIPEG LICO‐125 CLASS
Yes 158,987 17,420 11.0% 41,892 26.3% 59,288 37.3% 21,438 13.5% 18,949 11.9%
No 325,824 49,240 15.1% 107,386 33.0% 112,703 34.6% 33,869 10.4% 22,626 6.9%
INDIGENOUS SELF‐DECLARED ANCESTRY
Yes 51,429 6,187 12.0% 14,880 28.9% 16,660 32.4% 5,896 11.5% 7,806 15.2%
No 409,630 56,342 13.8% 127,918 31.2% 146,452 35.8% 47,004 11.5% 31,915 7.8%
Undeclared 23,751 4,131 17.4% 6,480 27.3% 8,879 37.4% 2,407 10.1% 1,854 7.8%
FIRST NATION ON RESERVE
FIRST NATION ON RESERVE 15,456 2,580 16.7% 5,365 34.7% 2,617 16.9% 2,326 15.0% 2,568 16.6%
BILL PAYMENT RATING
Excel lent 439,339 61,647 14.0% 138,609 31.5% 156,050 35.5% 49,103 11.2% 33,929 7.7%
Satis factory 22,395 2,922 13.0% 5,476 24.5% 8,251 36.8% 2,187 9.8% 3,560 15.9%
Poor 23,077 2,091 9.1% 5,192 22.5% 7,690 33.3% 4,017 17.4% 4,085 17.7%
DWELLING OWNERSHIP
Own 404,316 54,843 13.6% 131,031 32.4% 142,265 35.2% 48,261 11.9% 27,916 6.9%
Rent / Other 80,495 11,817 14.7% 18,247 22.7% 29,726 36.9% 7,046 8.8% 13,659 17.0%
2017 RESIDENTIAL SURVEY SECTION 1 ‐ DWELLING CHARACTERISTICS ‐ REFERENCE TABLE 1.09
LEVEL OF INSULATON IN EXTERIOR WALLS
Centra Gas Manitoba Inc. 2019/20 General Rate Application Appendix 7.7
March 22, 2019 Page 25 of 228

18
1.10 Basement Types
TOTAL
NO
BASEMENT %
FULL
BASEMENT % PARTIAL %
CRAWL
SPACE %
OVERALL 484,811 107,673 22.2% 287,756 59.4% 57,549 11.9% 31,833 6.6%
FUEL AREA
Winnipeg City 261,760 70,126 26.8% 161,076 61.5% 26,517 10.1% 4,041 1.5%
Gas Avai lable 140,021 23,813 17.0% 90,487 64.6% 15,782 11.3% 9,940 7.1%
No Gas Avai lable 83,030 13,734 16.5% 36,193 43.6% 15,250 18.4% 17,852 21.5%
DWELLING TYPE
Single Detached 373,568 29,839 8.0% 260,399 69.7% 55,448 14.8% 27,882 7.5%
Multi Attached 46,834 13,425 28.7% 27,356 58.4% 2,101 4.5% 3,951 8.4%
Apartment Sui te 64,409 64,409 100.0% 0 0.0% 0 0.0% 0 0.0%
BUILDING CODE ERA
2010‐2017 37,645 11,627 30.9% 19,250 51.1% 2,238 5.9% 4,530 12.0%
1990‐2009 89,181 19,397 21.8% 53,636 60.1% 5,136 5.8% 11,012 12.3%
1970‐1989 161,749 36,915 22.8% 95,908 59.3% 18,413 11.4% 10,513 6.5%
1950‐1969 110,314 23,222 21.1% 73,576 66.7% 10,993 10.0% 2,524 2.3%
Pre 1950 85,922 16,512 19.2% 45,386 52.8% 20,770 24.2% 3,254 3.8%
SPACE HEAT FUEL
Electric Heat 191,639 59,838 31.2% 80,989 42.3% 24,670 12.9% 26,141 13.6%
Natura l Gas Heat 249,938 10,970 4.4% 203,544 81.4% 30,843 12.3% 4,581 1.8%
Other Fuel 6,945 1,231 17.7% 2,816 40.5% 2,036 29.3% 862 12.4%
Shared (No Heat on Bi l l ) 36,289 35,634 98.2% 406 1.1% 0 0.0% 249 0.7%
PEOPLE PER HOUSEHOLD
One 124,779 47,464 38.0% 54,879 44.0% 13,334 10.7% 9,103 7.3%
Two 221,729 44,562 20.1% 135,504 61.1% 25,930 11.7% 15,733 7.1%
Three 60,069 8,464 14.1% 41,213 68.6% 7,309 12.2% 3,082 5.1%
Four 48,897 3,944 8.1% 35,704 73.0% 6,920 14.2% 2,329 4.8%
Five + 29,337 3,239 11.0% 20,456 69.7% 4,056 13.8% 1,585 5.4%
HOUSEHOLD INCOME
Less Than $25,000 59,481 22,946 38.6% 23,046 38.7% 6,730 11.3% 6,758 11.4%
$25,000 ‐ $49,999 137,082 38,990 28.4% 72,334 52.8% 17,189 12.5% 8,570 6.3%
$50,000 ‐ $74,999 123,824 24,424 19.7% 77,398 62.5% 13,737 11.1% 8,265 6.7%
$75,000 ‐ $99,999 66,780 9,834 14.7% 44,676 66.9% 8,310 12.4% 3,959 5.9%
$100,000 + 97,644 11,480 11.8% 70,301 72.0% 11,583 11.9% 4,281 4.4%
WINNIPEG LICO‐125 CLASS
Yes 158,987 47,624 30.0% 77,937 49.0% 20,130 12.7% 13,295 8.4%
No 325,824 60,049 18.4% 209,818 64.4% 37,419 11.5% 18,537 5.7%
INDIGENOUS SELF‐DECLARED ANCESTRY
Yes 51,429 12,263 23.8% 22,621 44.0% 7,729 15.0% 8,816 17.1%
No 409,630 91,851 22.4% 248,551 60.7% 47,116 11.5% 22,113 5.4%
Undeclared 23,751 3,560 15.0% 16,583 69.8% 2,705 11.4% 904 3.8%
FIRST NATION ON RESERVE
FIRST NATION ON RESERVE 15,456 4,129 26.7% 3,890 25.2% 2,190 14.2% 5,247 34.0%
BILL PAYMENT RATING
Excel lent 439,339 94,382 21.5% 266,409 60.6% 52,402 11.9% 26,146 6.0%
Satis factory 22,395 5,586 24.9% 12,616 56.3% 2,334 10.4% 1,859 8.3%
Poor 23,077 7,705 33.4% 8,731 37.8% 2,813 12.2% 3,828 16.6%
DWELLING OWNERSHIP
Own 404,316 51,702 12.8% 272,956 67.5% 53,571 13.2% 26,086 6.5%
Rent / Other 80,495 55,971 69.5% 14,799 18.4% 3,978 4.9% 5,746 7.1%
2017 RESIDENTIAL SURVEY SECTION 1 ‐ DWELLING CHARACTERISTICS ‐ REFERENCE TABLE 1.10
BASEMENT TYPES
Centra Gas Manitoba Inc. 2019/20 General Rate Application Appendix 7.7
March 22, 2019 Page 26 of 228

19
1.11 Basement Wall Insulation
TOTAL
NO
BASEMENT %
NO
INSULATION %
PARTIAL
INSULATION %
MOSTLY
INSULATED %FULL
INSULATION %
OVERALL 484,811 107,673 22.2% 40,587 8.4% 40,396 8.3% 83,845 17.3% 212,310 43.8%
FUEL AREA
Winnipeg City 261,760 70,126 26.8% 15,964 6.1% 21,740 8.3% 49,814 19.0% 104,115 39.8%
Gas Avai lable 140,021 23,813 17.0% 12,551 9.0% 9,215 6.6% 21,322 15.2% 73,120 52.2%
No Gas Ava i lable 83,030 13,734 16.5% 12,072 14.5% 9,440 11.4% 12,709 15.3% 35,074 42.2%
DWELLING TYPE
Single Detached 373,568 29,839 8.0% 36,716 9.8% 36,513 9.8% 73,853 19.8% 196,647 52.6%
Multi Attached 46,834 13,425 28.7% 3,871 8.3% 3,883 8.3% 9,993 21.3% 15,663 33.4%
Apartment Suite 64,409 64,409 100.0% 0 0.0% 0 0.0% 0 0.0% 0 0.0%
BUILDING CODE ERA
2010‐2017 37,645 11,627 30.9% 500 1.3% 165 0.4% 504 1.3% 24,849 66.0%
1990‐2009 89,181 19,397 21.8% 3,098 3.5% 2,112 2.4% 4,404 4.9% 60,170 67.5%
1970‐1989 161,749 36,915 22.8% 7,764 4.8% 9,133 5.6% 39,224 24.2% 68,712 42.5%
1950‐1969 110,314 23,222 21.1% 9,142 8.3% 14,500 13.1% 26,990 24.5% 36,460 33.1%
Pre 1950 85,922 16,512 19.2% 20,082 23.4% 14,486 16.9% 12,723 14.8% 22,119 25.7%
SPACE HEAT FUEL
Electric Heat 191,639 59,838 31.2% 18,937 9.9% 13,668 7.1% 26,132 13.6% 73,064 38.1%
Natura l Gas Heat 249,938 10,970 4.4% 19,277 7.7% 25,647 10.3% 56,615 22.7% 137,429 55.0%
Other Fuel 6,945 1,231 17.7% 2,374 34.2% 675 9.7% 849 12.2% 1,817 26.2%
Shared (No Heat on Bi l l ) 36,289 35,634 98.2% 0 0.0% 406 1.1% 249 0.7% 0 0.0%
PEOPLE PER HOUSEHOLD
One 124,779 47,464 38.0% 12,727 10.2% 10,902 8.7% 19,924 16.0% 33,762 27.1%
Two 221,729 44,562 20.1% 17,303 7.8% 17,392 7.8% 35,223 15.9% 107,249 48.4%
Three 60,069 8,464 14.1% 4,291 7.1% 5,488 9.1% 12,482 20.8% 29,343 48.8%
Four 48,897 3,944 8.1% 4,529 9.3% 4,116 8.4% 9,873 20.2% 26,435 54.1%
Five + 29,337 3,239 11.0% 1,737 5.9% 2,497 8.5% 6,343 21.6% 15,519 52.9%
HOUSEHOLD INCOME
Less Than $25,000 59,481 22,946 38.6% 7,682 12.9% 5,848 9.8% 8,992 15.1% 14,013 23.6%
$25,000 ‐ $49,999 137,082 38,990 28.4% 12,743 9.3% 13,188 9.6% 24,387 17.8% 47,774 34.9%
$50,000 ‐ $74,999 123,824 24,424 19.7% 9,927 8.0% 10,320 8.3% 22,422 18.1% 56,730 45.8%
$75,000 ‐ $99,999 66,780 9,834 14.7% 4,559 6.8% 4,940 7.4% 11,346 17.0% 36,101 54.1%
$100,000 + 97,644 11,480 11.8% 5,676 5.8% 6,100 6.2% 16,697 17.1% 57,691 59.1%
WINNIPEG LICO‐125 CLASS
Yes 158,987 47,624 30.0% 16,711 10.5% 14,904 9.4% 28,372 17.8% 51,375 32.3%
No 325,824 60,049 18.4% 23,876 7.3% 25,492 7.8% 55,473 17.0% 160,935 49.4%
INDIGENOUS SELF‐DECLARED ANCESTRY
Yes 51,429 12,263 23.8% 5,371 10.4% 5,872 11.4% 7,700 15.0% 20,223 39.3%
No 409,630 91,851 22.4% 33,264 8.1% 31,832 7.8% 72,046 17.6% 180,637 44.1%
Undeclared 23,751 3,560 15.0% 1,952 8.2% 2,691 11.3% 4,099 17.3% 11,450 48.2%
FIRST NATION ON RESERVE
FIRST NATION ON RESERVE 15,456 4,129 26.7% 2,220 14.4% 1,094 7.1% 2,213 14.3% 5,800 37.5%
BILL PAYMENT RATING
Excel lent 439,339 94,382 21.5% 34,078 7.8% 36,559 8.3% 75,880 17.3% 198,440 45.2%
Sati s factory 22,395 5,586 24.9% 2,808 12.5% 1,696 7.6% 5,027 22.4% 7,278 32.5%
Poor 23,077 7,705 33.4% 3,701 16.0% 2,141 9.3% 2,938 12.7% 6,592 28.6%
DWELLING OWNERSHIP
Own 404,316 51,702 12.8% 33,772 8.4% 36,383 9.0% 79,334 19.6% 203,124 50.2%
Rent / Other 80,495 55,971 69.5% 6,815 8.5% 4,012 5.0% 4,511 5.6% 9,185 11.4%
2017 RESIDENTIAL SURVEY SECTION 1 ‐ DWELLING CHARACTERISTICS ‐ REFERENCE TABLE 1.11
BASEMENT WALL INSULATION
Centra Gas Manitoba Inc. 2019/20 General Rate Application Appendix 7.7
March 22, 2019 Page 27 of 228

20
1.12 Type of Insulation in Basement
TOTAL
NO
BASEMENT % FIBERGLASS %
RIGID
FOAM %
SPRAY
FOAM %
IC‐
FOAM % OTHER %
NO
INSULATION %
OVERALL 484,811 107,673 22.2% 259,750 53.6% 38,252 7.9% 15,290 3.2% 18,746 3.9% 4,512 0.9% 40,587 8.4%
FUEL AREA
Winnipeg City 261,760 70,126 26.8% 148,432 56.7% 13,901 5.3% 8,658 3.3% 2,728 1.0% 1,951 0.7% 15,964 6.1%
Gas Avai lable 140,021 23,813 17.0% 71,772 51.3% 14,821 10.6% 4,427 3.2% 11,423 8.2% 1,213 0.9% 12,551 9.0%
No Gas Avai lable 83,030 13,734 16.5% 39,546 47.6% 9,530 11.5% 2,204 2.7% 4,595 5.5% 1,348 1.6% 12,072 14.5%
DWELLING TYPE
Single Detached 373,568 29,839 8.0% 234,759 62.8% 36,435 9.8% 14,359 3.8% 16,947 4.5% 4,512 1.2% 36,716 9.8%
Multi Attached 46,834 13,425 28.7% 24,991 53.4% 1,817 3.9% 931 2.0% 1,799 3.8% 0 0.0% 3,871 8.3%
Apartment Sui te 64,409 64,409 100.0% 0 0.0% 0 0.0% 0 0.0% 0 0.0% 0 0.0% 0 0.0%
BUILDING CODE ERA
2010‐2017 37,645 11,627 30.9% 13,787 36.6% 1,244 3.3% 2,716 7.2% 7,267 19.3% 503 1.3% 500 1.3%
1990‐2009 89,181 19,397 21.8% 49,302 55.3% 7,576 8.5% 2,642 3.0% 6,302 7.1% 864 1.0% 3,098 3.5%
1970‐1989 161,749 36,915 22.8% 98,228 60.7% 13,666 8.4% 2,360 1.5% 1,673 1.0% 1,142 0.7% 7,764 4.8%
1950‐1969 110,314 23,222 21.1% 64,338 58.3% 8,856 8.0% 2,218 2.0% 1,541 1.4% 997 0.9% 9,142 8.3%
Pre 1950 85,922 16,512 19.2% 34,095 39.7% 6,911 8.0% 5,354 6.2% 1,963 2.3% 1,005 1.2% 20,082 23.4%
SPACE HEAT FUEL
Electric Heat 191,639 59,838 31.2% 74,346 38.8% 20,135 10.5% 4,370 2.3% 11,994 6.3% 2,019 1.1% 18,937 9.9%
Natura l Gas Heat 249,938 10,970 4.4% 182,009 72.8% 18,118 7.2% 10,452 4.2% 6,752 2.7% 2,361 0.9% 19,277 7.7%
Other Fuel 6,945 1,231 17.7% 2,741 39.5% 0 0.0% 469 6.7% 0 0.0% 131 1.9% 2,374 34.2%
Shared (No Heat on Bi l l ) 36,289 35,634 98.2% 655 1.8% 0 0.0% 0 0.0% 0 0.0% 0 0.0% 0 0.0%
PEOPLE PER HOUSEHOLD
One 124,779 47,464 38.0% 52,084 41.7% 7,293 5.8% 3,073 2.5% 1,418 1.1% 721 0.6% 12,727 10.2%
Two 221,729 44,562 20.1% 123,906 55.9% 20,697 9.3% 5,116 2.3% 8,441 3.8% 1,704 0.8% 17,303 7.8%
Three 60,069 8,464 14.1% 36,903 61.4% 3,995 6.7% 2,689 4.5% 2,729 4.5% 998 1.7% 4,291 7.1%
Four 48,897 3,944 8.1% 29,597 60.5% 3,635 7.4% 2,995 6.1% 3,510 7.2% 687 1.4% 4,529 9.3%
Five + 29,337 3,239 11.0% 17,261 58.8% 2,632 9.0% 1,417 4.8% 2,649 9.0% 401 1.4% 1,737 5.9%
HOUSEHOLD INCOME
Less Than $25,000 59,481 22,946 38.6% 22,962 38.6% 3,248 5.5% 929 1.6% 1,100 1.8% 614 1.0% 7,682 12.9%
$25,000 ‐ $49,999 137,082 38,990 28.4% 66,117 48.2% 12,047 8.8% 3,241 2.4% 3,077 2.2% 868 0.6% 12,743 9.3%
$50,000 ‐ $74,999 123,824 24,424 19.7% 68,996 55.7% 10,458 8.4% 2,929 2.4% 5,520 4.5% 1,570 1.3% 9,927 8.0%
$75,000 ‐ $99,999 66,780 9,834 14.7% 40,939 61.3% 5,127 7.7% 2,182 3.3% 3,667 5.5% 473 0.7% 4,559 6.8%
$100,000 + 97,644 11,480 11.8% 60,737 62.2% 7,372 7.6% 6,009 6.2% 5,382 5.5% 988 1.0% 5,676 5.8%
WINNIPEG LICO‐125 CLASS
Yes 158,987 47,624 30.0% 73,536 46.3% 12,105 7.6% 3,490 2.2% 3,997 2.5% 1,524 1.0% 16,711 10.5%
No 325,824 60,049 18.4% 186,215 57.2% 26,148 8.0% 11,800 3.6% 14,750 4.5% 2,988 0.9% 23,876 7.3%
INDIGENOUS SELF‐DECLARED ANCESTRY
Yes 51,429 12,263 23.8% 25,399 49.4% 3,924 7.6% 1,421 2.8% 2,032 4.0% 1,019 2.0% 5,371 10.4%
No 409,630 91,851 22.4% 219,091 53.5% 32,615 8.0% 13,564 3.3% 15,970 3.9% 3,275 0.8% 33,264 8.1%
Undeclared 23,751 3,560 15.0% 15,260 64.2% 1,713 7.2% 305 1.3% 744 3.1% 217 0.9% 1,952 8.2%
FIRST NATION ON RESERVE
FIRST NATION ON RESERVE 15,456 4,129 26.7% 7,701 49.8% 466 3.0% 62 0.4% 311 2.0% 566 3.7% 2,220 14.4%
BILL PAYMENT RATING
Excel lent 439,339 94,382 21.5% 238,940 54.4% 35,734 8.1% 14,638 3.3% 17,710 4.0% 3,858 0.9% 34,078 7.8%
Satis factory 22,395 5,586 24.9% 11,637 52.0% 899 4.0% 521 2.3% 640 2.9% 305 1.4% 2,808 12.5%
Poor 23,077 7,705 33.4% 9,173 39.8% 1,620 7.0% 131 0.6% 397 1.7% 349 1.5% 3,701 16.0%
DWELLING OWNERSHIP
Own 404,316 51,702 12.8% 243,931 60.3% 37,104 9.2% 15,228 3.8% 18,479 4.6% 4,101 1.0% 33,772 8.4%
Rent / Other 80,495 55,971 69.5% 15,820 19.7% 1,149 1.4% 62 0.1% 267 0.3% 411 0.5% 6,815 8.5%
2017 RESIDENTIAL SURVEY SECTION 1 ‐ DWELLING CHARACTERISTICS ‐ REFERENCE TABLE 1.12
TYPE OF INSULATION IN BASEMENT
Centra Gas Manitoba Inc. 2019/20 General Rate Application Appendix 7.7
March 22, 2019 Page 28 of 228
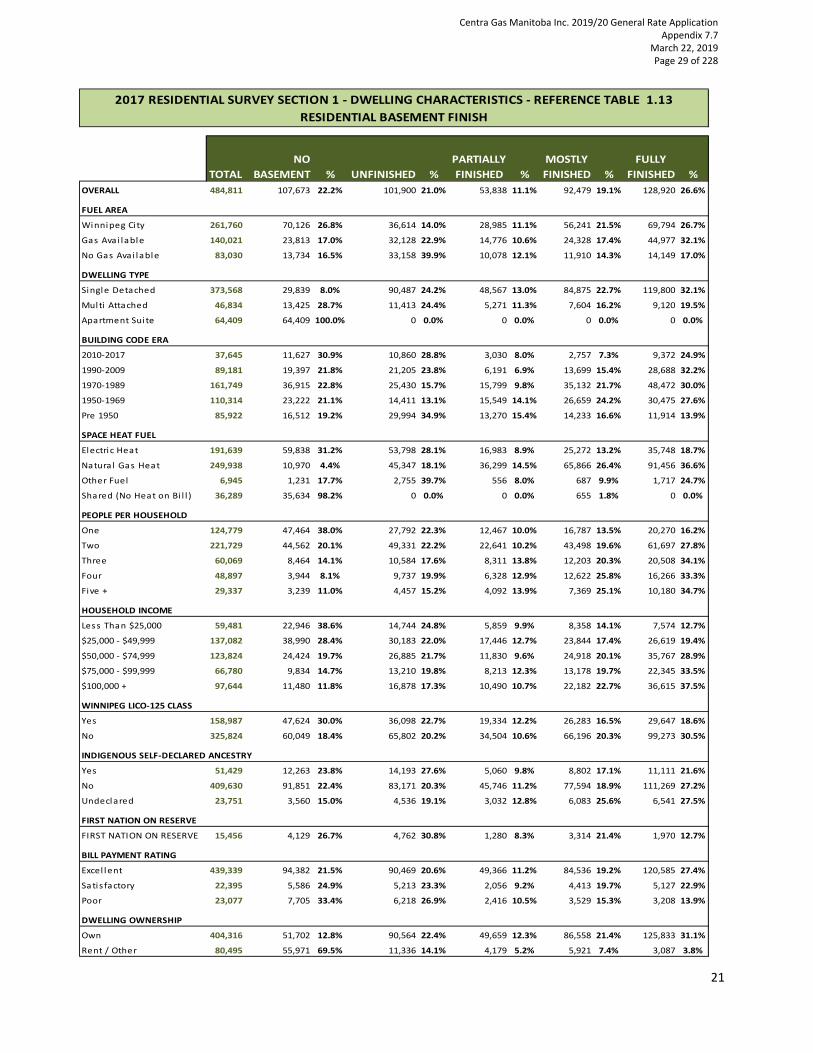
21
1.13 Residential Basement Finish
TOTAL
NO
BASEMENT % UNFINISHED %
PARTIALLY
FINISHED %
MOSTLY
FINISHED %
FULLY
FINISHED %
OVERALL 484,811 107,673 22.2% 101,900 21.0% 53,838 11.1% 92,479 19.1% 128,920 26.6%
FUEL AREA
Winnipeg City 261,760 70,126 26.8% 36,614 14.0% 28,985 11.1% 56,241 21.5% 69,794 26.7%
Gas Avai lable 140,021 23,813 17.0% 32,128 22.9% 14,776 10.6% 24,328 17.4% 44,977 32.1%
No Gas Avai lable 83,030 13,734 16.5% 33,158 39.9% 10,078 12.1% 11,910 14.3% 14,149 17.0%
DWELLING TYPE
Single Detached 373,568 29,839 8.0% 90,487 24.2% 48,567 13.0% 84,875 22.7% 119,800 32.1%
Multi Attached 46,834 13,425 28.7% 11,413 24.4% 5,271 11.3% 7,604 16.2% 9,120 19.5%
Apartment Sui te 64,409 64,409 100.0% 0 0.0% 0 0.0% 0 0.0% 0 0.0%
BUILDING CODE ERA
2010‐2017 37,645 11,627 30.9% 10,860 28.8% 3,030 8.0% 2,757 7.3% 9,372 24.9%
1990‐2009 89,181 19,397 21.8% 21,205 23.8% 6,191 6.9% 13,699 15.4% 28,688 32.2%
1970‐1989 161,749 36,915 22.8% 25,430 15.7% 15,799 9.8% 35,132 21.7% 48,472 30.0%
1950‐1969 110,314 23,222 21.1% 14,411 13.1% 15,549 14.1% 26,659 24.2% 30,475 27.6%
Pre 1950 85,922 16,512 19.2% 29,994 34.9% 13,270 15.4% 14,233 16.6% 11,914 13.9%
SPACE HEAT FUEL
Electric Heat 191,639 59,838 31.2% 53,798 28.1% 16,983 8.9% 25,272 13.2% 35,748 18.7%
Natura l Gas Heat 249,938 10,970 4.4% 45,347 18.1% 36,299 14.5% 65,866 26.4% 91,456 36.6%
Other Fuel 6,945 1,231 17.7% 2,755 39.7% 556 8.0% 687 9.9% 1,717 24.7%
Shared (No Heat on Bi l l ) 36,289 35,634 98.2% 0 0.0% 0 0.0% 655 1.8% 0 0.0%
PEOPLE PER HOUSEHOLD
One 124,779 47,464 38.0% 27,792 22.3% 12,467 10.0% 16,787 13.5% 20,270 16.2%
Two 221,729 44,562 20.1% 49,331 22.2% 22,641 10.2% 43,498 19.6% 61,697 27.8%
Three 60,069 8,464 14.1% 10,584 17.6% 8,311 13.8% 12,203 20.3% 20,508 34.1%
Four 48,897 3,944 8.1% 9,737 19.9% 6,328 12.9% 12,622 25.8% 16,266 33.3%
Five + 29,337 3,239 11.0% 4,457 15.2% 4,092 13.9% 7,369 25.1% 10,180 34.7%
HOUSEHOLD INCOME
Less Than $25,000 59,481 22,946 38.6% 14,744 24.8% 5,859 9.9% 8,358 14.1% 7,574 12.7%
$25,000 ‐ $49,999 137,082 38,990 28.4% 30,183 22.0% 17,446 12.7% 23,844 17.4% 26,619 19.4%
$50,000 ‐ $74,999 123,824 24,424 19.7% 26,885 21.7% 11,830 9.6% 24,918 20.1% 35,767 28.9%
$75,000 ‐ $99,999 66,780 9,834 14.7% 13,210 19.8% 8,213 12.3% 13,178 19.7% 22,345 33.5%
$100,000 + 97,644 11,480 11.8% 16,878 17.3% 10,490 10.7% 22,182 22.7% 36,615 37.5%
WINNIPEG LICO‐125 CLASS
Yes 158,987 47,624 30.0% 36,098 22.7% 19,334 12.2% 26,283 16.5% 29,647 18.6%
No 325,824 60,049 18.4% 65,802 20.2% 34,504 10.6% 66,196 20.3% 99,273 30.5%
INDIGENOUS SELF‐DECLARED ANCESTRY
Yes 51,429 12,263 23.8% 14,193 27.6% 5,060 9.8% 8,802 17.1% 11,111 21.6%
No 409,630 91,851 22.4% 83,171 20.3% 45,746 11.2% 77,594 18.9% 111,269 27.2%
Undeclared 23,751 3,560 15.0% 4,536 19.1% 3,032 12.8% 6,083 25.6% 6,541 27.5%
FIRST NATION ON RESERVE
FIRST NATION ON RESERVE 15,456 4,129 26.7% 4,762 30.8% 1,280 8.3% 3,314 21.4% 1,970 12.7%
BILL PAYMENT RATING
Excel lent 439,339 94,382 21.5% 90,469 20.6% 49,366 11.2% 84,536 19.2% 120,585 27.4%
Sati s factory 22,395 5,586 24.9% 5,213 23.3% 2,056 9.2% 4,413 19.7% 5,127 22.9%
Poor 23,077 7,705 33.4% 6,218 26.9% 2,416 10.5% 3,529 15.3% 3,208 13.9%
DWELLING OWNERSHIP
Own 404,316 51,702 12.8% 90,564 22.4% 49,659 12.3% 86,558 21.4% 125,833 31.1%
Rent / Other 80,495 55,971 69.5% 11,336 14.1% 4,179 5.2% 5,921 7.4% 3,087 3.8%
2017 RESIDENTIAL SURVEY SECTION 1 ‐ DWELLING CHARACTERISTICS ‐ REFERENCE TABLE 1.13
RESIDENTIAL BASEMENT FINISH
Centra Gas Manitoba Inc. 2019/20 General Rate Application Appendix 7.7
March 22, 2019 Page 29 of 228

22
1.14 Most Common Dwelling Problems
TOTAL
WINDOW
CONDENS
ATION %
LOW
HUMID %
ODOUR
AND
SMELLS %
HIGH
HUMID %
ICE
DAMS %
BASE
MENT
LEAKS %
MOLD
AND
MILDEW %
ROOF
CONDENS
ATION %
OVERALL 484,811 123,355 25.4% 110,927 22.9% 65,782 13.6% 43,644 9.0% 32,674 6.7% 41,877 8.6% 34,971 7.2% 11,583 2.4%
FUEL AREA
Winnipeg City 261,760 61,683 23.6% 62,757 24.0% 39,546 15.1% 20,458 7.8% 18,995 7.3% 21,085 8.1% 19,055 7.3% 5,897 2.3%
Gas Ava i lable 140,021 35,572 25.4% 29,739 21.2% 14,074 10.1% 12,767 9.1% 7,357 5.3% 9,662 6.9% 5,704 4.1% 1,902 1.4%
No Gas Avai lable 83,030 26,100 31.4% 18,431 22.2% 12,161 14.6% 10,419 12.5% 6,322 7.6% 11,129 13.4% 10,212 12.3% 3,784 4.6%
DWELLING TYPE
Single Detached 373,568 98,527 26.4% 81,898 21.9% 38,749 10.4% 34,881 9.3% 27,774 7.4% 34,606 9.3% 25,268 6.8% 11,063 3.0%
Multi Attached 46,834 11,332 24.2% 9,210 19.7% 8,727 18.6% 4,055 8.7% 3,476 7.4% 4,816 10.3% 4,003 8.5% 520 1.1%
Apartment Sui te 64,409 13,496 21.0% 19,820 30.8% 18,305 28.4% 4,708 7.3% 1,424 2.2% 2,455 3.8% 5,700 8.8% 0 0.0%
BUILDING CODE ERA
2010‐2017 37,645 7,381 19.6% 4,609 12.2% 3,211 8.5% 2,093 5.6% 427 1.1% 214 0.6% 1,649 4.4% 1,026 2.7%
1990‐2009 89,181 23,775 26.7% 20,129 22.6% 8,568 9.6% 7,898 8.9% 2,748 3.1% 2,902 3.3% 5,186 5.8% 1,246 1.4%
1970‐1989 161,749 43,992 27.2% 34,988 21.6% 21,381 13.2% 16,567 10.2% 7,378 4.6% 8,591 5.3% 10,491 6.5% 2,916 1.8%
1950‐1969 110,314 29,359 26.6% 24,624 22.3% 19,991 18.1% 11,594 10.5% 8,508 7.7% 13,646 12.4% 10,635 9.6% 2,425 2.2%
Pre 1950 85,922 18,848 21.9% 26,576 30.9% 12,631 14.7% 5,491 6.4% 13,614 15.8% 16,524 19.2% 7,010 8.2% 3,970 4.6%
SPACE HEAT FUEL
Electric Heat 191,639 54,691 28.5% 42,444 22.1% 28,133 14.7% 20,473 10.7% 11,217 5.9% 15,811 8.3% 16,952 8.8% 5,271 2.8%
Natural Gas Heat 249,938 59,661 23.9% 54,732 21.9% 24,619 9.8% 18,699 7.5% 18,825 7.5% 21,420 8.6% 12,926 5.2% 5,447 2.2%
Other Fuel 6,945 1,830 26.4% 3,151 45.4% 731 10.5% 1,024 14.7% 1,289 18.6% 1,012 14.6% 818 11.8% 865 12.5%
Shared (No Heat on Bi l l ) 36,289 7,173 19.8% 10,599 29.2% 12,299 33.9% 3,447 9.5% 1,343 3.7% 3,633 10.0% 4,275 11.8% 0 0.0%
PEOPLE PER HOUSEHOLD
One 124,779 24,694 19.8% 30,246 24.2% 19,844 15.9% 10,562 8.5% 6,840 5.5% 11,536 9.2% 7,694 6.2% 1,789 1.4%
Two 221,729 50,376 22.7% 51,320 23.1% 24,544 11.1% 15,116 6.8% 14,550 6.6% 16,578 7.5% 11,161 5.0% 3,540 1.6%
Three 60,069 18,429 30.7% 12,535 20.9% 8,583 14.3% 6,474 10.8% 3,177 5.3% 4,855 8.1% 4,857 8.1% 1,265 2.1%
Four 48,897 17,734 36.3% 10,559 21.6% 6,960 14.2% 6,387 13.1% 4,768 9.8% 5,309 10.9% 4,898 10.0% 3,041 6.2%
Five + 29,337 12,121 41.3% 6,267 21.4% 5,851 19.9% 5,105 17.4% 3,340 11.4% 3,598 12.3% 6,361 21.7% 1,948 6.6%
HOUSEHOLD INCOME
Less Than $25,000 59,481 17,532 29.5% 14,957 25.1% 11,068 18.6% 7,047 11.8% 4,935 8.3% 8,438 14.2% 8,207 13.8% 1,940 3.3%
$25,000 ‐ $49,999 137,082 32,691 23.8% 34,708 25.3% 19,764 14.4% 11,885 8.7% 7,557 5.5% 12,410 9.1% 8,701 6.3% 2,688 2.0%
$50,000 ‐ $74,999 123,824 29,954 24.2% 28,260 22.8% 17,820 14.4% 10,927 8.8% 6,859 5.5% 9,830 7.9% 8,767 7.1% 3,279 2.6%
$75,000 ‐ $99,999 66,780 18,733 28.1% 12,301 18.4% 6,979 10.5% 5,946 8.9% 4,179 6.3% 4,376 6.6% 4,243 6.4% 1,542 2.3%
$100,000 + 97,644 24,445 25.0% 20,701 21.2% 10,150 10.4% 7,839 8.0% 9,145 9.4% 6,823 7.0% 5,053 5.2% 2,135 2.2%
WINNIPEG LICO‐125 CLASS
Yes 158,987 43,723 27.5% 39,930 25.1% 26,364 16.6% 17,122 10.8% 11,171 7.0% 17,456 11.0% 16,956 10.7% 4,877 3.1%
No 325,824 79,632 24.4% 70,997 21.8% 39,418 12.1% 26,522 8.1% 21,503 6.6% 24,420 7.5% 18,015 5.5% 6,706 2.1%
INDIGENOUS SELF‐DECLARED ANCESTRY
Yes 51,429 17,999 35.0% 11,452 22.3% 13,558 26.4% 7,977 15.5% 4,670 9.1% 6,826 13.3% 10,294 20.0% 2,621 5.1%
No 409,630 99,660 24.3% 95,043 23.2% 49,862 12.2% 33,650 8.2% 27,203 6.6% 32,637 8.0% 23,206 5.7% 8,246 2.0%
Undeclared 23,751 5,695 24.0% 4,432 18.7% 2,362 9.9% 2,016 8.5% 801 3.4% 2,413 10.2% 1,471 6.2% 716 3.0%
FIRST NATION ON RESERVE
FIRST NATION ON RESERVE 15,456 7,703 49.8% 2,937 19.0% 5,614 36.3% 3,382 21.9% 1,941 12.6% 2,101 13.6% 6,225 40.3% 1,499 9.7%
BILL PAYMENT RATING
Excel lent 439,339 105,721 24.1% 101,136 23.0% 54,696 12.4% 36,199 8.2% 26,932 6.1% 35,936 8.2% 26,011 5.9% 9,776 2.2%
Sati s factory 22,395 7,786 34.8% 4,880 21.8% 5,718 25.5% 2,990 13.4% 2,647 11.8% 2,926 13.1% 2,848 12.7% 676 3.0%
Poor 23,077 9,848 42.7% 4,911 21.3% 5,368 23.3% 4,455 19.3% 3,095 13.4% 3,015 13.1% 6,112 26.5% 1,131 4.9%
DWELLING OWNERSHIP
Own 404,316 98,925 24.5% 89,889 22.2% 38,823 9.6% 33,856 8.4% 27,051 6.7% 34,046 8.4% 21,795 5.4% 10,121 2.5%
Rent / Other 80,495 24,429 30.3% 21,038 26.1% 26,959 33.5% 9,788 12.2% 5,623 7.0% 7,830 9.7% 13,176 16.4% 1,462 1.8%
2017 RESIDENTIAL SURVEY SECTION 1 ‐ DWELLING CHARACTERISTICS ‐ REFERENCE TABLE 1.14
MOST COMMON DWELLING PROBLEMS
Centra Gas Manitoba Inc. 2019/20 General Rate Application Appendix 7.7
March 22, 2019 Page 30 of 228

23
1.15 Dwelling Projects Undertaken in the Last Three Years
TOTAL
REPLACED
WINDOWS %
INSULATED
BASEMENT %
INSULATED
WALLS %
INSULATED
ATTIC %
REDUCE
AIR LEAK %
OVERALL 484,811 97,744 20.2% 21,802 4.5% 14,437 3.0% 23,342 4.8% 58,091 12.0%
FUEL AREA
Winnipeg City 261,760 54,990 21.0% 11,176 4.3% 5,832 2.2% 10,696 4.1% 32,253 12.3%
Gas Ava i lable 140,021 25,644 18.3% 5,452 3.9% 3,727 2.7% 6,142 4.4% 14,512 10.4%
No Gas Ava i lable 83,030 17,109 20.6% 5,174 6.2% 4,878 5.9% 6,504 7.8% 11,326 13.6%
DWELLING TYPE
Single Detached 373,568 91,873 24.6% 19,980 5.3% 14,177 3.8% 21,588 5.8% 53,145 14.2%
Multi Attached 46,834 5,871 12.5% 1,822 3.9% 260 0.6% 1,754 3.7% 4,946 10.6%
Apartment Sui te 64,409 0 0.0% 0 0.0% 0 0.0% 0 0.0% 0 0.0%
BUILDING CODE ERA
2010‐2017 37,645 754 2.0% 1,379 3.7% 626 1.7% 683 1.8% 1,255 3.3%
1990‐2009 89,181 9,750 10.9% 1,932 2.2% 477 0.5% 2,263 2.5% 4,552 5.1%
1970‐1989 161,749 40,239 24.9% 5,651 3.5% 4,059 2.5% 6,960 4.3% 19,718 12.2%
1950‐1969 110,314 25,964 23.5% 6,654 6.0% 4,702 4.3% 6,586 6.0% 14,747 13.4%
Pre 1950 85,922 21,037 24.5% 6,185 7.2% 4,572 5.3% 6,850 8.0% 17,819 20.7%
SPACE HEAT FUEL
Electric Heat 191,639 32,537 17.0% 8,908 4.6% 6,215 3.2% 9,348 4.9% 21,587 11.3%
Natura l Gas Heat 249,938 63,061 25.2% 12,556 5.0% 7,547 3.0% 13,319 5.3% 33,577 13.4%
Other Fuel 6,945 1,702 24.5% 337 4.9% 675 9.7% 675 9.7% 2,039 29.4%
Shared (No Heat on Bi l l ) 36,289 444 1.2% 0 0.0% 0 0.0% 0 0.0% 888 2.4%
PEOPLE PER HOUSEHOLD
One 124,779 19,315 15.5% 5,450 4.4% 3,985 3.2% 5,044 4.0% 13,062 10.5%
Two 221,729 47,561 21.5% 7,658 3.5% 6,059 2.7% 10,161 4.6% 26,521 12.0%
Three 60,069 14,718 24.5% 2,961 4.9% 1,462 2.4% 3,589 6.0% 7,518 12.5%
Four 48,897 11,320 23.2% 4,099 8.4% 1,964 4.0% 2,379 4.9% 7,518 15.4%
Five + 29,337 4,829 16.5% 1,634 5.6% 967 3.3% 2,170 7.4% 3,471 11.8%
HOUSEHOLD INCOME
Less Than $25,000 59,481 7,366 12.4% 1,762 3.0% 835 1.4% 1,886 3.2% 5,386 9.1%
$25,000 ‐ $49,999 137,082 25,893 18.9% 5,441 4.0% 4,058 3.0% 6,260 4.6% 16,114 11.8%
$50,000 ‐ $74,999 123,824 26,823 21.7% 6,186 5.0% 4,673 3.8% 6,431 5.2% 15,560 12.6%
$75,000 ‐ $99,999 66,780 14,473 21.7% 3,360 5.0% 2,249 3.4% 3,333 5.0% 8,121 12.2%
$100,000 + 97,644 23,189 23.7% 5,051 5.2% 2,623 2.7% 5,433 5.6% 12,910 13.2%
WINNIPEG LICO‐125 CLASS
Yes 158,987 26,018 16.4% 6,549 4.1% 4,687 2.9% 6,938 4.4% 16,975 10.7%
No 325,824 71,726 22.0% 15,253 4.7% 9,749 3.0% 16,404 5.0% 41,116 12.6%
INDIGENOUS SELF‐DECLARED ANCESTRY
Yes 51,429 8,689 16.9% 2,534 4.9% 2,025 3.9% 2,759 5.4% 5,321 10.3%
No 409,630 83,386 20.4% 18,033 4.4% 11,893 2.9% 19,700 4.8% 49,955 12.2%
Undeclared 23,751 5,669 23.9% 1,235 5.2% 519 2.2% 883 3.7% 2,814 11.8%
FIRST NATION ON RESERVE
FIRST NATION ON RESERVE 15,456 1,094 0.0% 534 0.0% 155 0.0% 622 0.0% 529 0.0%
BILL PAYMENT RATING
Excel lent 439,339 92,130 21.0% 19,754 4.5% 12,812 2.9% 21,214 4.8% 52,197 11.9%
Satis factory 22,395 3,477 15.5% 945 4.2% 685 3.1% 899 4.0% 2,609 11.6%
Poor 23,077 2,136 9.3% 1,103 4.8% 940 4.1% 1,229 5.3% 3,285 14.2%
DWELLING OWNERSHIP
Own 404,316 97,744 24.2% 21,802 5.4% 14,437 3.6% 23,342 5.8% 58,091 14.4%
Rent / Other 80,495 0 0.0% 0 0.0% 0 0.0% 0 0.0% 0 0.0%
2017 RESIDENTIAL SURVEY SECTION 1 ‐ DWELLING CHARACTERISTICS ‐ REFERENCE TABLE 1.15
DWELLING PROJECTS UNDERTAKEN IN THE LAST THREE YEARS
Centra Gas Manitoba Inc. 2019/20 General Rate Application Appendix 7.7
March 22, 2019 Page 31 of 228

24
Centra Gas Manitoba Inc. 2019/20 General Rate Application Appendix 7.7
March 22, 2019 Page 32 of 228

25
SECTION 2 SPACE HEATING
SECTION 2 SPACE HEATING
Centra Gas Manitoba Inc. 2019/20 General Rate Application Appendix 7.7
March 22, 2019 Page 33 of 228

26
2.01 Space Heating Fuel
TOTAL
ELECTRIC
HEAT %
NATURAL
GAS HEAT %
OTHER
FUEL %
SHARED (NO
HEAT ON
BILL) %
OVERALL 484,811 191,639 39.5% 249,938 51.6% 6,945 1.4% 36,289 7.5%
FUEL AREA
Winnipeg City 261,760 40,915 15.6% 187,891 71.8% 530 0.2% 32,424 12.4%
Gas Avai lable 140,021 72,952 52.1% 62,047 44.3% 2,123 1.5% 2,899 2.1%
No Gas Avai lable 83,030 77,772 93.7% 0 0.0% 4,292 5.2% 966 1.2%
DWELLING TYPE
Single Detached 373,568 142,312 38.1% 224,311 60.0% 6,945 1.9% 0 0.0%
Multi Attached 46,834 18,309 39.1% 23,378 49.9% 0 0.0% 5,147 11.0%
Apartment Sui te 64,409 31,018 48.2% 2,249 3.5% 0 0.0% 31,142 48.4%
BUILDING CODE ERA
2010‐2017 37,645 22,296 59.2% 14,606 38.8% 600 1.6% 143 0.4%
1990‐2009 89,181 45,317 50.8% 41,052 46.0% 1,155 1.3% 1,657 1.9%
1970‐1989 161,749 71,800 44.4% 80,474 49.8% 1,873 1.2% 7,601 4.7%
1950‐1969 110,314 26,349 23.9% 65,566 59.4% 1,277 1.2% 17,122 15.5%
Pre 1950 85,922 25,878 30.1% 48,240 56.1% 2,039 2.4% 9,765 11.4%
SPACE HEAT FUEL
Electric Heat 191,639 191,639 100.0% 0 0.0% 0 0.0% 0 0.0%
Natura l Gas Heat 249,938 0 0.0% 249,938 100.0% 0 0.0% 0 0.0%
Other Fuel 6,945 0 0.0% 0 0.0% 6,945 100.0% 0 0.0%
Shared (No Heat on Bi l l ) 36,289 0 0.0% 0 0.0% 0 0.0% 36,289 100.0%
PEOPLE PER HOUSEHOLD
One 124,779 52,102 41.8% 49,489 39.7% 2,769 2.2% 20,419 16.4%
Two 221,729 92,279 41.6% 114,446 51.6% 1,905 0.9% 13,099 5.9%
Three 60,069 19,704 32.8% 37,305 62.1% 1,012 1.7% 2,048 3.4%
Four 48,897 13,680 28.0% 33,931 69.4% 996 2.0% 290 0.6%
Five + 29,337 13,873 47.3% 14,768 50.3% 262 0.9% 434 1.5%
HOUSEHOLD INCOME
Less Than $25,000 59,481 31,151 52.4% 15,766 26.5% 3,544 6.0% 9,019 15.2%
$25,000 ‐ $49,999 137,082 64,229 46.9% 61,104 44.6% 469 0.3% 11,281 8.2%
$50,000 ‐ $74,999 123,824 46,938 37.9% 66,076 53.4% 1,524 1.2% 9,286 7.5%
$75,000 ‐ $99,999 66,780 24,794 37.1% 39,427 59.0% 675 1.0% 1,884 2.8%
$100,000 + 97,644 24,527 25.1% 67,564 69.2% 734 0.8% 4,820 4.9%
WINNIPEG LICO‐125 CLASS
Yes 158,987 78,001 49.1% 60,742 38.2% 4,013 2.5% 16,231 10.2%
No 325,824 113,638 34.9% 189,196 58.1% 2,932 0.9% 20,058 6.2%
INDIGENOUS SELF‐DECLARED ANCESTRY
Yes 51,429 31,001 60.3% 15,289 29.7% 1,462 2.8% 3,677 7.2%
No 409,630 151,957 37.1% 220,003 53.7% 5,059 1.2% 32,612 8.0%
Undeclared 23,751 8,681 36.5% 14,646 61.7% 425 1.8% 0 0.0%
FIRST NATION ON RESERVE
FIRST NATION ON RESERVE 15,456 14,869 96.2% 0 0.0% 525 3.4% 63 0.4%
BILL PAYMENT RATING
Excel lent 439,339 167,896 38.2% 234,030 53.3% 5,408 1.2% 32,004 7.3%
Satis factory 22,395 10,533 47.0% 10,012 44.7% 393 1.8% 1,458 6.5%
Poor 23,077 13,210 57.2% 5,896 25.5% 1,143 5.0% 2,828 12.3%
DWELLING OWNERSHIP
Own 404,316 151,221 37.4% 238,662 59.0% 5,821 1.4% 8,612 2.1%
Rent / Other 80,495 40,418 50.2% 11,276 14.0% 1,124 1.4% 27,677 34.4%
2017 RESIDENTIAL SURVEY SECTION 2 ‐ SPACE HEATING ‐ REFERENCE TABLE 2.01
SPACE HEATING FUEL
Centra Gas Manitoba Inc. 2019/20 General Rate Application Appendix 7.7
March 22, 2019 Page 34 of 228

27
2.02 Average Annual Kilowatt Hours – Weather Adjusted
TOTAL OVERALL ELECTRIC HEAT
NATURAL GAS
HEAT OTHER FUEL
SHARED (NO HEAT
ON BILL)
OVERALL 484,811 15,503 23,742 10,976 13,940 3,478
FUEL AREA
Winnipeg City 261,760 9,706 11,960 10,316 11,420 3,295
Gas Ava i lable 140,021 19,813 26,299 12,974 15,740 5,936
No Gas Avai lable 83,030 26,515 27,543 0 13,361 2,225
DWELLING TYPE
Single Detached 373,568 17,859 28,308 11,352 13,940 0
Multi Attached 46,834 10,623 15,734 7,940 0 4,629
Apartment Suite 64,409 5,387 7,523 5,005 0 3,287
BUILDING CODE ERA
2010‐2017 37,645 16,968 17,724 15,919 18,170 1,153
1990‐2009 89,181 18,809 24,740 12,877 16,801 4,940
1970‐1989 161,749 15,424 21,810 10,824 13,669 4,241
1950‐1969 110,314 13,301 28,719 9,756 15,016 3,022
Pre 1950 85,922 14,408 27,474 9,772 10,651 3,468
SPACE HEAT FUEL
Electric Heat 191,639 23,742 23,742 0 0 0
Natura l Gas Heat 249,938 10,976 0 10,976 0 0
Other Fuel 6,945 13,940 0 0 13,940 0
Shared (No Heat on Bi l l ) 36,289 3,478 0 0 0 3,478
PEOPLE PER HOUSEHOLD
One 124,779 10,866 17,156 7,362 13,939 2,895
Two 221,729 15,927 24,136 10,691 13,453 4,212
Three 60,069 16,578 26,256 12,053 18,826 4,784
Four 48,897 18,859 31,868 14,039 9,006 3,126
Five + 29,337 24,227 34,277 15,536 17,367 2,803
HOUSEHOLD INCOME
Less Than $25,000 59,481 14,626 21,375 8,287 14,063 2,614
$25,000 ‐ $49,999 137,082 14,434 21,746 8,910 5,058 3,112
$50,000 ‐ $74,999 123,824 15,139 24,027 10,313 20,280 3,699
$75,000 ‐ $99,999 66,780 16,939 26,164 11,717 13,527 6,060
$100,000 + 97,644 17,021 28,985 13,687 6,227 4,511
WINNIPEG LICO‐125 CLASS
Yes 158,987 15,267 22,622 9,296 13,012 2,826
No 325,824 15,619 24,511 11,515 15,211 4,005
INDIGENOUS SELF‐DECLARED ANCESTRY
Yes 51,429 21,281 28,444 11,661 14,944 3,410
No 409,630 14,737 22,739 10,923 12,738 3,485
Undeclared 23,751 16,215 24,508 11,051 0 0
FIRST NATION ON RESERVE
FIRST NATION ON RESERVE 15,456 30,250 30,982 0 12,003 9,322
BILL PAYMENT RATING
Excel lent 439,339 15,101 23,371 10,811 13,660 3,323
Satis factory 22,395 18,062 24,992 12,785 13,530 5,453
Poor 23,077 20,688 27,467 14,430 15,407 4,204
DWELLING OWNERSHIP
Own 404,316 16,497 25,773 11,119 13,254 4,860
Rent / Other 80,495 10,512 16,146 7,941 17,492 3,047
2017 RESIDENTIAL SURVEY SECTION 2 ‐ SPACE HEATING ‐ REFERENCE TABLE 2.02
AVERAGE ANNUAL KILOWATT HOURS ‐ WEATHER ADJUSTED
Centra Gas Manitoba Inc. 2019/20 General Rate Application Appendix 7.7
March 22, 2019 Page 35 of 228

28
2.03 Average Annual Kilowatt Hours per Square Foot – Weather Adjusted
TOTAL OVERALL ELECTRIC HEAT
NATURAL GAS
HEAT OTHER FUEL
SHARED (NO
HEAT ON BILL)
OVERALL 484,811 12.9 20.3 8.5 14.4 4.0
FUEL AREA
Winnipeg Ci ty 261,760 8.1 11.4 8.1 8.9 3.9
Gas Avai lable 140,021 15.7 21.4 9.6 15.4 5.0
No Gas Avai lable 83,030 23.3 24.0 0.0 14.5 3.1
DWELLING TYPE
Single Detached 373,568 14.4 23.5 8.7 14.4 0.0
Multi Attached 46,834 9.9 15.6 6.9 0.0 3.8
Apartment Sui te 64,409 6.2 8.4 5.2 0.0 4.0
BUILDING CODE ERA
2010‐2017 37,645 12.7 15.0 8.9 25.1 1.9
1990‐2009 89,181 14.6 20.6 8.3 15.4 5.0
1970‐1989 161,749 12.7 18.5 8.2 13.0 4.6
1950‐1969 110,314 11.7 23.9 8.6 15.7 4.3
Pre 1950 85,922 13.2 25.7 8.7 11.0 3.0
SPACE HEAT FUEL
Electri c Heat 191,639 20.3 20.3 0.0 0.0 0.0
Natura l Gas Heat 249,938 8.5 0.0 8.5 0.0 0.0
Other Fuel 6,945 14.4 0.0 0.0 14.4 0.0
Shared (No Heat on Bi l l ) 36,289 4.0 0.0 0.0 0.0 4.0
PEOPLE PER HOUSEHOLD
One 124,779 10.6 17.0 6.6 13.8 3.6
Two 221,729 12.8 19.6 8.2 13.6 4.5
Three 60,069 13.7 23.2 9.0 18.9 4.9
Four 48,897 14.2 24.6 10.3 7.5 5.7
Five + 29,337 19.5 28.7 11.0 35.2 2.5
HOUSEHOLD INCOME
Less Than $25,000 59,481 15.5 22.9 7.6 15.5 4.0
$25,000 ‐ $49,999 137,082 12.9 19.3 8.0 6.8 3.8
$50,000 ‐ $74,999 123,824 12.7 19.9 8.6 20.8 4.1
$75,000 ‐ $99,999 66,780 12.8 19.9 8.8 9.7 4.4
$100,000 + 97,644 11.6 20.8 8.8 4.9 4.2
WINNIPEG LICO‐125 CLASS
Yes 158,987 14.4 21.5 8.2 14.4 3.9
No 325,824 12.1 19.5 8.5 14.3 4.1
INDIGENOUS SELF‐DECLARED ANCESTRY
Yes 51,429 20.0 27.0 9.7 18.5 4.5
No 409,630 12.0 18.9 8.4 12.7 4.0
Undeclared 23,751 13.2 20.4 8.7 0.0 0.0
FIRST NATION ON RESERVE
FIRST NATION ON RESERVE 15,456 33.1 33.5 0.0 22.4 9.1
BILL PAYMENT RATING
Excel lent 439,339 12.4 19.6 8.3 13.3 4.0
Satis factory 22,395 16.0 22.6 10.6 24.3 2.8
Poor 23,077 20.0 27.1 11.9 15.9 5.2
DWELLING OWNERSHIP
Own 404,316 13.2 21.1 8.5 13.3 3.9
Rent / Other 80,495 11.6 17.5 7.9 19.8 4.0
2017 RESIDENTIAL SURVEY SECTION 2 ‐ SPACE HEATING ‐ REFERENCE TABLE 2.03
AVERAGE ANNUAL KILOWATT HOURS PER SQUARE FOOT ‐ WEATHER ADJUSTED
Centra Gas Manitoba Inc. 2019/20 General Rate Application Appendix 7.7
March 22, 2019 Page 36 of 228

29
2.04 Average Annual Cubic Meters Natural Gas Weather Adjusted
# OF GAS
CUSTOMERS CUBIC METERS CUBIC METERS/SQFT
OVERALL 253,922 2,142.8 1.7
FUEL AREA
Winnipeg City 188,765 2,163.4 1.7
Gas Avai lable 65,157 2,083.2 1.6
No Gas Avai lable
DWELLING TYPE
Single Detached 227,980 2,195.8 1.7
Multi Attached 23,510 1,787.1 1.5
Apartment Sui te 2,432 613.8 0.6
BUILDING CODE ERA
2010‐2017 14,858 1,699.5 0.9
1990‐2009 41,557 2,068.7 1.3
1970‐1989 82,621 2,077.4 1.6
1950‐1969 65,902 2,121.7 1.9
Pre 1950 48,983 2,479.1 2.1
SPACE HEAT FUEL
Electric Heat 3,984 777.8 0.8
Natura l Gas Heat 249,938 2,164.6 1.7
Other Fuel 0 0.0 0.0
Shared (No Heat on Bi l l ) 0 0.0 0.0
PEOPLE PER HOUSEHOLD
One 49,938 2,034.9 1.9
Two 116,859 2,131.9 1.6
Three 37,838 2,223.7 1.7
Four 34,099 2,186.9 1.6
Five + 15,188 2,281.7 1.5
HOUSEHOLD INCOME
Less Than $25,000 15,935 1,972.0 1.9
$25,000 ‐ $49,999 62,162 2,036.4 1.9
$50,000 ‐ $74,999 67,198 2,048.9 1.7
$75,000 ‐ $99,999 40,099 2,140.3 1.6
$100,000 + 68,528 2,372.6 1.5
WINNIPEG LICO‐125 CLASS
Yes 61,724 2,045.8 1.9
No 192,198 2,174.0 1.6
INDIGENOUS SELF‐DECLARED ANCESTRY
Yes 15,289 2,094.2 1.8
No 223,622 2,139.8 1.7
Undeclared 15,011 2,238.2 1.8
FIRST NATION ON RESERVE
FIRST NATION ON RESERVE 0 0.0 0.0
BILL PAYMENT RATING
Excel lent 237,663 2,134.7 1.7
Satis factory 10,279 2,073.4 1.8
Poor 5,980 2,584.2 2.0
DWELLING OWNERSHIP
Own 242,646 2,157.4 1.7
Rent / Other 11,276 1,828.7 1.8
2017 RESIDENTIAL SURVEY SECTION 2 ‐ SPACE HEATING ‐ REFERENCE TABLE 2.04
AVERAGE ANNUAL CUBIC METERS NATURAL GAS WEATHER ADJUSTED
Centra Gas Manitoba Inc. 2019/20 General Rate Application Appendix 7.7
March 22, 2019 Page 37 of 228

30
2.05a Residential Primary Space Heating Systems
TOTAL
HI‐EFF
N.GAS
FURN %
MID‐EFF
N.GAS
FURN %
STD‐EFF
N.GAS
FURN %
N.GAS
BOILER %
ELEC BASE‐
BOARD %
ELEC
FURN %
ELEC
BOILER %
OVERALL 484,811 156,016 32.2% 63,070 13.0% 22,167 4.6% 8,684 1.8% 51,150 10.6% 126,463 26.1% 4,728 1.0%
FUEL AREA
Winnipeg Ci ty 261,760 118,516 45.3% 45,820 17.5% 16,207 6.2% 7,349 2.8% 14,713 5.6% 23,655 9.0% 761 0.3%
Gas Ava i lable 140,021 37,501 26.8% 17,250 12.3% 5,960 4.3% 1,336 1.0% 16,245 11.6% 50,766 36.3% 1,891 1.4%
No Gas Avai lable 83,030 0 0.0% 0 0.0% 0 0.0% 0 0.0% 20,192 24.3% 52,043 62.7% 2,076 2.5%
DWELLING TYPE
Single Detached 373,568 142,471 38.1% 56,125 15.0% 17,599 4.7% 8,116 2.2% 33,296 8.9% 96,526 25.8% 4,335 1.2%
Multi Attached 46,834 12,850 27.4% 6,039 12.9% 3,921 8.4% 568 1.2% 6,089 13.0% 11,824 25.2% 68 0.1%
Apartment Suite 64,409 696 1.1% 906 1.4% 647 1.0% 0 0.0% 11,765 18.3% 18,114 28.1% 326 0.5%
BUILDING CODE ERA
2010‐2017 37,645 13,797 36.7% 477 1.3% 0 0.0% 332 0.9% 1,402 3.7% 19,210 51.0% 380 1.0%
1990‐2009 89,181 25,884 29.0% 11,938 13.4% 2,910 3.3% 320 0.4% 7,470 8.4% 32,898 36.9% 1,546 1.7%
1970‐1989 161,749 50,650 31.3% 20,397 12.6% 8,672 5.4% 754 0.5% 27,531 17.0% 41,530 25.7% 408 0.3%
1950‐1969 110,314 39,497 35.8% 20,222 18.3% 4,670 4.2% 1,178 1.1% 6,818 6.2% 17,655 16.0% 1,240 1.1%
Pre 1950 85,922 26,189 30.5% 10,036 11.7% 5,914 6.9% 6,100 7.1% 7,930 9.2% 15,170 17.7% 1,155 1.3%
SPACE HEAT FUEL
Electric Heat 191,639 0 0.0% 0 0.0% 0 0.0% 0 0.0% 51,150 26.7% 126,463 66.0% 4,728 2.5%
Natura l Gas Heat 249,938 156,016 62.4% 63,070 25.2% 22,167 8.9% 8,684 3.5% 0 0.0% 0 0.0% 0 0.0%
Other Fuel 6,945 0 0.0% 0 0.0% 0 0.0% 0 0.0% 0 0.0% 0 0.0% 0 0.0%
Shared (No Heat on Bi l l ) 36,289 0 0.0% 0 0.0% 0 0.0% 0 0.0% 0 0.0% 0 0.0% 0 0.0%
PEOPLE PER HOUSEHOLD
One 124,779 27,934 22.4% 13,373 10.7% 6,495 5.2% 1,687 1.4% 18,670 15.0% 31,790 25.5% 693 0.6%
Two 221,729 71,100 32.1% 31,799 14.3% 8,572 3.9% 2,974 1.3% 23,931 10.8% 60,656 27.4% 2,250 1.0%
Three 60,069 23,241 38.7% 8,681 14.5% 4,082 6.8% 1,302 2.2% 4,132 6.9% 13,365 22.2% 994 1.7%
Four 48,897 23,488 48.0% 6,841 14.0% 1,558 3.2% 2,044 4.2% 2,415 4.9% 9,871 20.2% 212 0.4%
Five + 29,337 10,254 35.0% 2,376 8.1% 1,461 5.0% 676 2.3% 2,002 6.8% 10,781 36.7% 579 2.0%
HOUSEHOLD INCOME
Less Than $25,000 59,481 8,347 14.0% 4,214 7.1% 2,644 4.4% 562 0.9% 10,985 18.5% 18,840 31.7% 454 0.8%
$25,000 ‐ $49,999 137,082 34,421 25.1% 18,559 13.5% 6,832 5.0% 1,292 0.9% 19,076 13.9% 41,805 30.5% 1,037 0.8%
$50,000 ‐ $74,999 123,824 40,887 33.0% 17,276 14.0% 5,679 4.6% 2,234 1.8% 11,744 9.5% 32,285 26.1% 1,264 1.0%
$75,000 ‐ $99,999 66,780 24,745 37.1% 9,655 14.5% 3,596 5.4% 1,431 2.1% 5,108 7.6% 16,859 25.2% 959 1.4%
$100,000 + 97,644 47,617 48.8% 13,366 13.7% 3,416 3.5% 3,165 3.2% 4,237 4.3% 16,674 17.1% 1,015 1.0%
WINNIPEG LICO‐125 CLASS
Yes 158,987 34,667 21.8% 16,414 10.3% 7,692 4.8% 1,969 1.2% 23,391 14.7% 51,027 32.1% 1,268 0.8%
No 325,824 121,349 37.2% 46,656 14.3% 14,475 4.4% 6,715 2.1% 27,759 8.5% 75,436 23.2% 3,461 1.1%
INDIGENOUS SELF‐DECLARED ANCESTRY
Yes 51,429 9,077 17.7% 3,796 7.4% 1,585 3.1% 831 1.6% 8,292 16.1% 20,666 40.2% 659 1.3%
No 409,630 137,537 33.6% 55,999 13.7% 18,728 4.6% 7,739 1.9% 40,398 9.9% 100,309 24.5% 3,746 0.9%
Undeclared 23,751 9,402 39.6% 3,275 13.8% 1,854 7.8% 115 0.5% 2,460 10.4% 5,489 23.1% 324 1.4%
FIRST NATION ON RESERVE
FIRST NATION ON RESERVE 15,456 0 0.0% 0 0.0% 0 0.0% 0 0.0% 4,028 26.1% 9,990 64.6% 68 0.4%
BILL PAYMENT RATING
Excel lent 439,339 147,174 33.5% 58,810 13.4% 20,051 4.6% 7,996 1.8% 44,425 10.1% 110,984 25.3% 4,405 1.0%
Satis factory 22,395 5,558 24.8% 2,802 12.5% 1,537 6.9% 115 0.5% 3,601 16.1% 6,341 28.3% 112 0.5%
Poor 23,077 3,285 14.2% 1,458 6.3% 579 2.5% 574 2.5% 3,124 13.5% 9,139 39.6% 212 0.9%
DWELLING OWNERSHIP
Own 404,316 150,882 37.3% 59,566 14.7% 20,403 5.0% 7,811 1.9% 37,607 9.3% 100,880 25.0% 4,397 1.1%
Rent / Other 80,495 5,135 6.4% 3,504 4.4% 1,764 2.2% 873 1.1% 13,544 16.8% 25,583 31.8% 331 0.4%
2017 RESIDENTIAL SURVEY SECTION 2 ‐ SPACE HEATING ‐ REFERENCE TABLE 2.05a
RESIDENTIAL PRIMARY SPACE HEATING SYSTEMS
Centra Gas Manitoba Inc. 2019/20 General Rate Application Appendix 7.7
March 22, 2019 Page 38 of 228
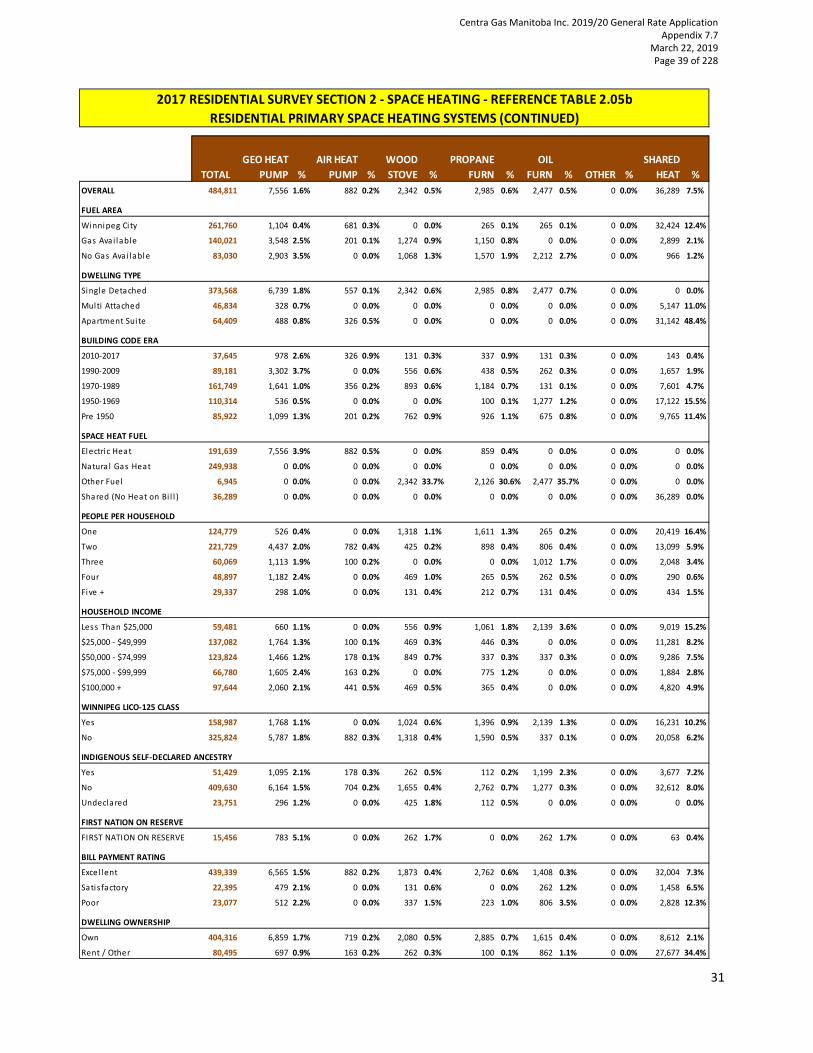
31
2.05b Residential Primary Space Heating Systems (continued)
TOTAL
GEO HEAT
PUMP %
AIR HEAT
PUMP %
WOOD
STOVE %
PROPANE
FURN %
OIL
FURN % OTHER %
SHARED
HEAT %
OVERALL 484,811 7,556 1.6% 882 0.2% 2,342 0.5% 2,985 0.6% 2,477 0.5% 0 0.0% 36,289 7.5%
FUEL AREA
Winnipeg City 261,760 1,104 0.4% 681 0.3% 0 0.0% 265 0.1% 265 0.1% 0 0.0% 32,424 12.4%
Gas Avai lable 140,021 3,548 2.5% 201 0.1% 1,274 0.9% 1,150 0.8% 0 0.0% 0 0.0% 2,899 2.1%
No Gas Avai lable 83,030 2,903 3.5% 0 0.0% 1,068 1.3% 1,570 1.9% 2,212 2.7% 0 0.0% 966 1.2%
DWELLING TYPE
Single Detached 373,568 6,739 1.8% 557 0.1% 2,342 0.6% 2,985 0.8% 2,477 0.7% 0 0.0% 0 0.0%
Multi Attached 46,834 328 0.7% 0 0.0% 0 0.0% 0 0.0% 0 0.0% 0 0.0% 5,147 11.0%
Apartment Sui te 64,409 488 0.8% 326 0.5% 0 0.0% 0 0.0% 0 0.0% 0 0.0% 31,142 48.4%
BUILDING CODE ERA
2010‐2017 37,645 978 2.6% 326 0.9% 131 0.3% 337 0.9% 131 0.3% 0 0.0% 143 0.4%
1990‐2009 89,181 3,302 3.7% 0 0.0% 556 0.6% 438 0.5% 262 0.3% 0 0.0% 1,657 1.9%
1970‐1989 161,749 1,641 1.0% 356 0.2% 893 0.6% 1,184 0.7% 131 0.1% 0 0.0% 7,601 4.7%
1950‐1969 110,314 536 0.5% 0 0.0% 0 0.0% 100 0.1% 1,277 1.2% 0 0.0% 17,122 15.5%
Pre 1950 85,922 1,099 1.3% 201 0.2% 762 0.9% 926 1.1% 675 0.8% 0 0.0% 9,765 11.4%
SPACE HEAT FUEL
Electri c Heat 191,639 7,556 3.9% 882 0.5% 0 0.0% 859 0.4% 0 0.0% 0 0.0% 0 0.0%
Natura l Gas Heat 249,938 0 0.0% 0 0.0% 0 0.0% 0 0.0% 0 0.0% 0 0.0% 0 0.0%
Other Fuel 6,945 0 0.0% 0 0.0% 2,342 33.7% 2,126 30.6% 2,477 35.7% 0 0.0% 0 0.0%
Shared (No Heat on Bi l l ) 36,289 0 0.0% 0 0.0% 0 0.0% 0 0.0% 0 0.0% 0 0.0% 36,289 0.0%
PEOPLE PER HOUSEHOLD
One 124,779 526 0.4% 0 0.0% 1,318 1.1% 1,611 1.3% 265 0.2% 0 0.0% 20,419 16.4%
Two 221,729 4,437 2.0% 782 0.4% 425 0.2% 898 0.4% 806 0.4% 0 0.0% 13,099 5.9%
Three 60,069 1,113 1.9% 100 0.2% 0 0.0% 0 0.0% 1,012 1.7% 0 0.0% 2,048 3.4%
Four 48,897 1,182 2.4% 0 0.0% 469 1.0% 265 0.5% 262 0.5% 0 0.0% 290 0.6%
Five + 29,337 298 1.0% 0 0.0% 131 0.4% 212 0.7% 131 0.4% 0 0.0% 434 1.5%
HOUSEHOLD INCOME
Less Than $25,000 59,481 660 1.1% 0 0.0% 556 0.9% 1,061 1.8% 2,139 3.6% 0 0.0% 9,019 15.2%
$25,000 ‐ $49,999 137,082 1,764 1.3% 100 0.1% 469 0.3% 446 0.3% 0 0.0% 0 0.0% 11,281 8.2%
$50,000 ‐ $74,999 123,824 1,466 1.2% 178 0.1% 849 0.7% 337 0.3% 337 0.3% 0 0.0% 9,286 7.5%
$75,000 ‐ $99,999 66,780 1,605 2.4% 163 0.2% 0 0.0% 775 1.2% 0 0.0% 0 0.0% 1,884 2.8%
$100,000 + 97,644 2,060 2.1% 441 0.5% 469 0.5% 365 0.4% 0 0.0% 0 0.0% 4,820 4.9%
WINNIPEG LICO‐125 CLASS
Yes 158,987 1,768 1.1% 0 0.0% 1,024 0.6% 1,396 0.9% 2,139 1.3% 0 0.0% 16,231 10.2%
No 325,824 5,787 1.8% 882 0.3% 1,318 0.4% 1,590 0.5% 337 0.1% 0 0.0% 20,058 6.2%
INDIGENOUS SELF‐DECLARED ANCESTRY
Yes 51,429 1,095 2.1% 178 0.3% 262 0.5% 112 0.2% 1,199 2.3% 0 0.0% 3,677 7.2%
No 409,630 6,164 1.5% 704 0.2% 1,655 0.4% 2,762 0.7% 1,277 0.3% 0 0.0% 32,612 8.0%
Undeclared 23,751 296 1.2% 0 0.0% 425 1.8% 112 0.5% 0 0.0% 0 0.0% 0 0.0%
FIRST NATION ON RESERVE
FIRST NATION ON RESERVE 15,456 783 5.1% 0 0.0% 262 1.7% 0 0.0% 262 1.7% 0 0.0% 63 0.4%
BILL PAYMENT RATING
Excel lent 439,339 6,565 1.5% 882 0.2% 1,873 0.4% 2,762 0.6% 1,408 0.3% 0 0.0% 32,004 7.3%
Satis factory 22,395 479 2.1% 0 0.0% 131 0.6% 0 0.0% 262 1.2% 0 0.0% 1,458 6.5%
Poor 23,077 512 2.2% 0 0.0% 337 1.5% 223 1.0% 806 3.5% 0 0.0% 2,828 12.3%
DWELLING OWNERSHIP
Own 404,316 6,859 1.7% 719 0.2% 2,080 0.5% 2,885 0.7% 1,615 0.4% 0 0.0% 8,612 2.1%
Rent / Other 80,495 697 0.9% 163 0.2% 262 0.3% 100 0.1% 862 1.1% 0 0.0% 27,677 34.4%
2017 RESIDENTIAL SURVEY SECTION 2 ‐ SPACE HEATING ‐ REFERENCE TABLE 2.05b
RESIDENTIAL PRIMARY SPACE HEATING SYSTEMS (CONTINUED)
Centra Gas Manitoba Inc. 2019/20 General Rate Application Appendix 7.7
March 22, 2019 Page 39 of 228
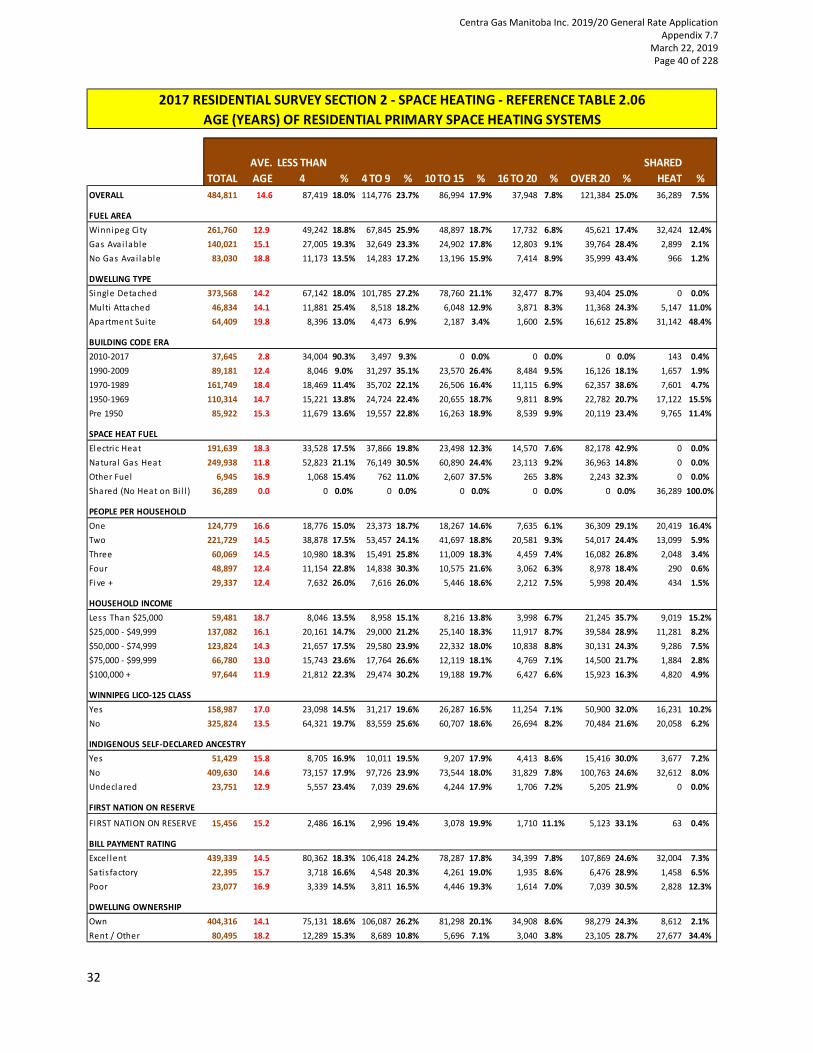
32
2.06 Age (Years) of Residential Primary Space Heating Systems
TOTAL
AVE.
AGE
LESS THAN
4 % 4 TO 9 % 10 TO 15 % 16 TO 20 % OVER 20 %
SHARED
HEAT %
OVERALL 484,811 14.6 87,419 18.0% 114,776 23.7% 86,994 17.9% 37,948 7.8% 121,384 25.0% 36,289 7.5%
FUEL AREA
Winnipeg City 261,760 12.9 49,242 18.8% 67,845 25.9% 48,897 18.7% 17,732 6.8% 45,621 17.4% 32,424 12.4%
Gas Avai lable 140,021 15.1 27,005 19.3% 32,649 23.3% 24,902 17.8% 12,803 9.1% 39,764 28.4% 2,899 2.1%
No Gas Avai lable 83,030 18.8 11,173 13.5% 14,283 17.2% 13,196 15.9% 7,414 8.9% 35,999 43.4% 966 1.2%
DWELLING TYPE
Single Detached 373,568 14.2 67,142 18.0% 101,785 27.2% 78,760 21.1% 32,477 8.7% 93,404 25.0% 0 0.0%
Multi Attached 46,834 14.1 11,881 25.4% 8,518 18.2% 6,048 12.9% 3,871 8.3% 11,368 24.3% 5,147 11.0%
Apartment Suite 64,409 19.8 8,396 13.0% 4,473 6.9% 2,187 3.4% 1,600 2.5% 16,612 25.8% 31,142 48.4%
BUILDING CODE ERA
2010‐2017 37,645 2.8 34,004 90.3% 3,497 9.3% 0 0.0% 0 0.0% 0 0.0% 143 0.4%
1990‐2009 89,181 12.4 8,046 9.0% 31,297 35.1% 23,570 26.4% 8,484 9.5% 16,126 18.1% 1,657 1.9%
1970‐1989 161,749 18.4 18,469 11.4% 35,702 22.1% 26,506 16.4% 11,115 6.9% 62,357 38.6% 7,601 4.7%
1950‐1969 110,314 14.7 15,221 13.8% 24,724 22.4% 20,655 18.7% 9,811 8.9% 22,782 20.7% 17,122 15.5%
Pre 1950 85,922 15.3 11,679 13.6% 19,557 22.8% 16,263 18.9% 8,539 9.9% 20,119 23.4% 9,765 11.4%
SPACE HEAT FUEL
Electric Heat 191,639 18.3 33,528 17.5% 37,866 19.8% 23,498 12.3% 14,570 7.6% 82,178 42.9% 0 0.0%
Natura l Gas Heat 249,938 11.8 52,823 21.1% 76,149 30.5% 60,890 24.4% 23,113 9.2% 36,963 14.8% 0 0.0%
Other Fuel 6,945 16.9 1,068 15.4% 762 11.0% 2,607 37.5% 265 3.8% 2,243 32.3% 0 0.0%
Shared (No Heat on Bi l l ) 36,289 0.0 0 0.0% 0 0.0% 0 0.0% 0 0.0% 0 0.0% 36,289 100.0%
PEOPLE PER HOUSEHOLD
One 124,779 16.6 18,776 15.0% 23,373 18.7% 18,267 14.6% 7,635 6.1% 36,309 29.1% 20,419 16.4%
Two 221,729 14.5 38,878 17.5% 53,457 24.1% 41,697 18.8% 20,581 9.3% 54,017 24.4% 13,099 5.9%
Three 60,069 14.5 10,980 18.3% 15,491 25.8% 11,009 18.3% 4,459 7.4% 16,082 26.8% 2,048 3.4%
Four 48,897 12.4 11,154 22.8% 14,838 30.3% 10,575 21.6% 3,062 6.3% 8,978 18.4% 290 0.6%
Five + 29,337 12.4 7,632 26.0% 7,616 26.0% 5,446 18.6% 2,212 7.5% 5,998 20.4% 434 1.5%
HOUSEHOLD INCOME
Less Than $25,000 59,481 18.7 8,046 13.5% 8,958 15.1% 8,216 13.8% 3,998 6.7% 21,245 35.7% 9,019 15.2%
$25,000 ‐ $49,999 137,082 16.1 20,161 14.7% 29,000 21.2% 25,140 18.3% 11,917 8.7% 39,584 28.9% 11,281 8.2%
$50,000 ‐ $74,999 123,824 14.3 21,657 17.5% 29,580 23.9% 22,332 18.0% 10,838 8.8% 30,131 24.3% 9,286 7.5%
$75,000 ‐ $99,999 66,780 13.0 15,743 23.6% 17,764 26.6% 12,119 18.1% 4,769 7.1% 14,500 21.7% 1,884 2.8%
$100,000 + 97,644 11.9 21,812 22.3% 29,474 30.2% 19,188 19.7% 6,427 6.6% 15,923 16.3% 4,820 4.9%
WINNIPEG LICO‐125 CLASS
Yes 158,987 17.0 23,098 14.5% 31,217 19.6% 26,287 16.5% 11,254 7.1% 50,900 32.0% 16,231 10.2%
No 325,824 13.5 64,321 19.7% 83,559 25.6% 60,707 18.6% 26,694 8.2% 70,484 21.6% 20,058 6.2%
INDIGENOUS SELF‐DECLARED ANCESTRY
Yes 51,429 15.8 8,705 16.9% 10,011 19.5% 9,207 17.9% 4,413 8.6% 15,416 30.0% 3,677 7.2%
No 409,630 14.6 73,157 17.9% 97,726 23.9% 73,544 18.0% 31,829 7.8% 100,763 24.6% 32,612 8.0%
Undeclared 23,751 12.9 5,557 23.4% 7,039 29.6% 4,244 17.9% 1,706 7.2% 5,205 21.9% 0 0.0%
FIRST NATION ON RESERVE
FIRST NATION ON RESERVE 15,456 15.2 2,486 16.1% 2,996 19.4% 3,078 19.9% 1,710 11.1% 5,123 33.1% 63 0.4%
BILL PAYMENT RATING
Excel lent 439,339 14.5 80,362 18.3% 106,418 24.2% 78,287 17.8% 34,399 7.8% 107,869 24.6% 32,004 7.3%
Satis factory 22,395 15.7 3,718 16.6% 4,548 20.3% 4,261 19.0% 1,935 8.6% 6,476 28.9% 1,458 6.5%
Poor 23,077 16.9 3,339 14.5% 3,811 16.5% 4,446 19.3% 1,614 7.0% 7,039 30.5% 2,828 12.3%
DWELLING OWNERSHIP
Own 404,316 14.1 75,131 18.6% 106,087 26.2% 81,298 20.1% 34,908 8.6% 98,279 24.3% 8,612 2.1%
Rent / Other 80,495 18.2 12,289 15.3% 8,689 10.8% 5,696 7.1% 3,040 3.8% 23,105 28.7% 27,677 34.4%
2017 RESIDENTIAL SURVEY SECTION 2 ‐ SPACE HEATING ‐ REFERENCE TABLE 2.06
AGE (YEARS) OF RESIDENTIAL PRIMARY SPACE HEATING SYSTEMS
Centra Gas Manitoba Inc. 2019/20 General Rate Application Appendix 7.7
March 22, 2019 Page 40 of 228
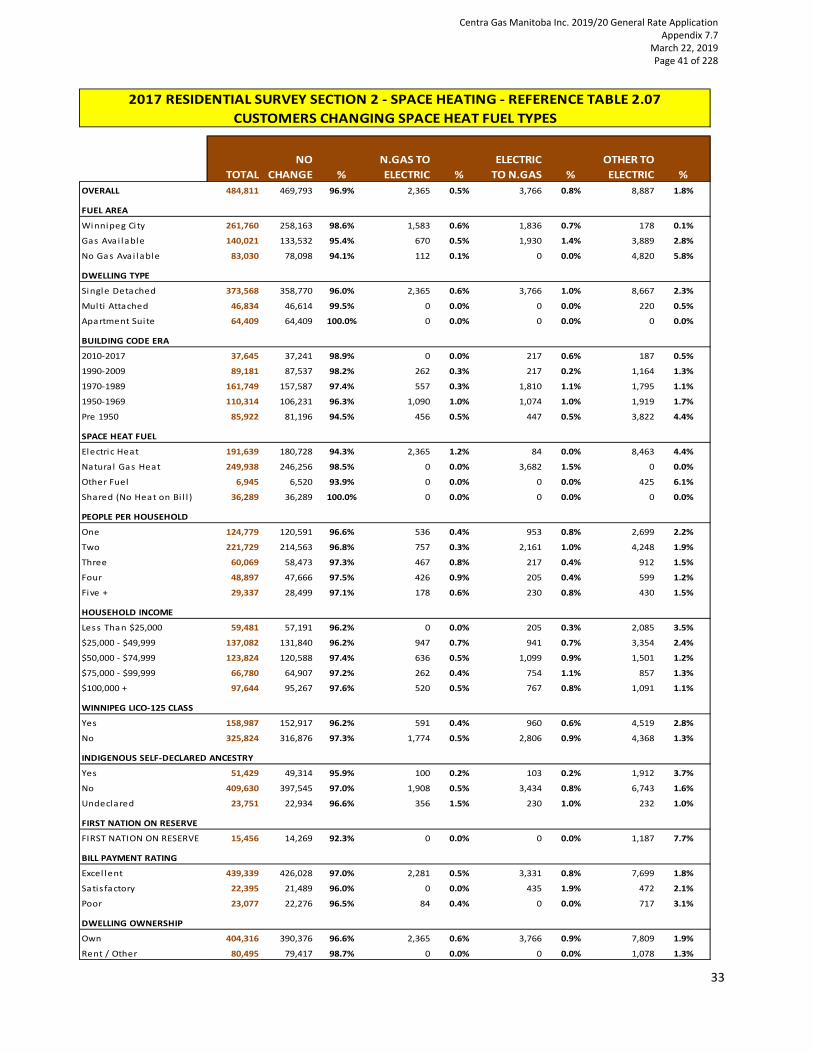
33
2.07 Customers Changing Space Heating Fuel Types
TOTAL
NO
CHANGE %
N.GAS TO
ELECTRIC %
ELECTRIC
TO N.GAS %
OTHER TO
ELECTRIC %
OVERALL 484,811 469,793 96.9% 2,365 0.5% 3,766 0.8% 8,887 1.8%
FUEL AREA
Winnipeg City 261,760 258,163 98.6% 1,583 0.6% 1,836 0.7% 178 0.1%
Gas Avai lable 140,021 133,532 95.4% 670 0.5% 1,930 1.4% 3,889 2.8%
No Gas Avai lable 83,030 78,098 94.1% 112 0.1% 0 0.0% 4,820 5.8%
DWELLING TYPE
Single Detached 373,568 358,770 96.0% 2,365 0.6% 3,766 1.0% 8,667 2.3%
Multi Attached 46,834 46,614 99.5% 0 0.0% 0 0.0% 220 0.5%
Apartment Sui te 64,409 64,409 100.0% 0 0.0% 0 0.0% 0 0.0%
BUILDING CODE ERA
2010‐2017 37,645 37,241 98.9% 0 0.0% 217 0.6% 187 0.5%
1990‐2009 89,181 87,537 98.2% 262 0.3% 217 0.2% 1,164 1.3%
1970‐1989 161,749 157,587 97.4% 557 0.3% 1,810 1.1% 1,795 1.1%
1950‐1969 110,314 106,231 96.3% 1,090 1.0% 1,074 1.0% 1,919 1.7%
Pre 1950 85,922 81,196 94.5% 456 0.5% 447 0.5% 3,822 4.4%
SPACE HEAT FUEL
Electric Heat 191,639 180,728 94.3% 2,365 1.2% 84 0.0% 8,463 4.4%
Natural Gas Heat 249,938 246,256 98.5% 0 0.0% 3,682 1.5% 0 0.0%
Other Fuel 6,945 6,520 93.9% 0 0.0% 0 0.0% 425 6.1%
Shared (No Heat on Bi l l ) 36,289 36,289 100.0% 0 0.0% 0 0.0% 0 0.0%
PEOPLE PER HOUSEHOLD
One 124,779 120,591 96.6% 536 0.4% 953 0.8% 2,699 2.2%
Two 221,729 214,563 96.8% 757 0.3% 2,161 1.0% 4,248 1.9%
Three 60,069 58,473 97.3% 467 0.8% 217 0.4% 912 1.5%
Four 48,897 47,666 97.5% 426 0.9% 205 0.4% 599 1.2%
Five + 29,337 28,499 97.1% 178 0.6% 230 0.8% 430 1.5%
HOUSEHOLD INCOME
Less Than $25,000 59,481 57,191 96.2% 0 0.0% 205 0.3% 2,085 3.5%
$25,000 ‐ $49,999 137,082 131,840 96.2% 947 0.7% 941 0.7% 3,354 2.4%
$50,000 ‐ $74,999 123,824 120,588 97.4% 636 0.5% 1,099 0.9% 1,501 1.2%
$75,000 ‐ $99,999 66,780 64,907 97.2% 262 0.4% 754 1.1% 857 1.3%
$100,000 + 97,644 95,267 97.6% 520 0.5% 767 0.8% 1,091 1.1%
WINNIPEG LICO‐125 CLASS
Yes 158,987 152,917 96.2% 591 0.4% 960 0.6% 4,519 2.8%
No 325,824 316,876 97.3% 1,774 0.5% 2,806 0.9% 4,368 1.3%
INDIGENOUS SELF‐DECLARED ANCESTRY
Yes 51,429 49,314 95.9% 100 0.2% 103 0.2% 1,912 3.7%
No 409,630 397,545 97.0% 1,908 0.5% 3,434 0.8% 6,743 1.6%
Undeclared 23,751 22,934 96.6% 356 1.5% 230 1.0% 232 1.0%
FIRST NATION ON RESERVE
FIRST NATION ON RESERVE 15,456 14,269 92.3% 0 0.0% 0 0.0% 1,187 7.7%
BILL PAYMENT RATING
Excel lent 439,339 426,028 97.0% 2,281 0.5% 3,331 0.8% 7,699 1.8%
Satis factory 22,395 21,489 96.0% 0 0.0% 435 1.9% 472 2.1%
Poor 23,077 22,276 96.5% 84 0.4% 0 0.0% 717 3.1%
DWELLING OWNERSHIP
Own 404,316 390,376 96.6% 2,365 0.6% 3,766 0.9% 7,809 1.9%
Rent / Other 80,495 79,417 98.7% 0 0.0% 0 0.0% 1,078 1.3%
2017 RESIDENTIAL SURVEY SECTION 2 ‐ SPACE HEATING ‐ REFERENCE TABLE 2.07
CUSTOMERS CHANGING SPACE HEAT FUEL TYPES
Centra Gas Manitoba Inc. 2019/20 General Rate Application Appendix 7.7
March 22, 2019 Page 41 of 228
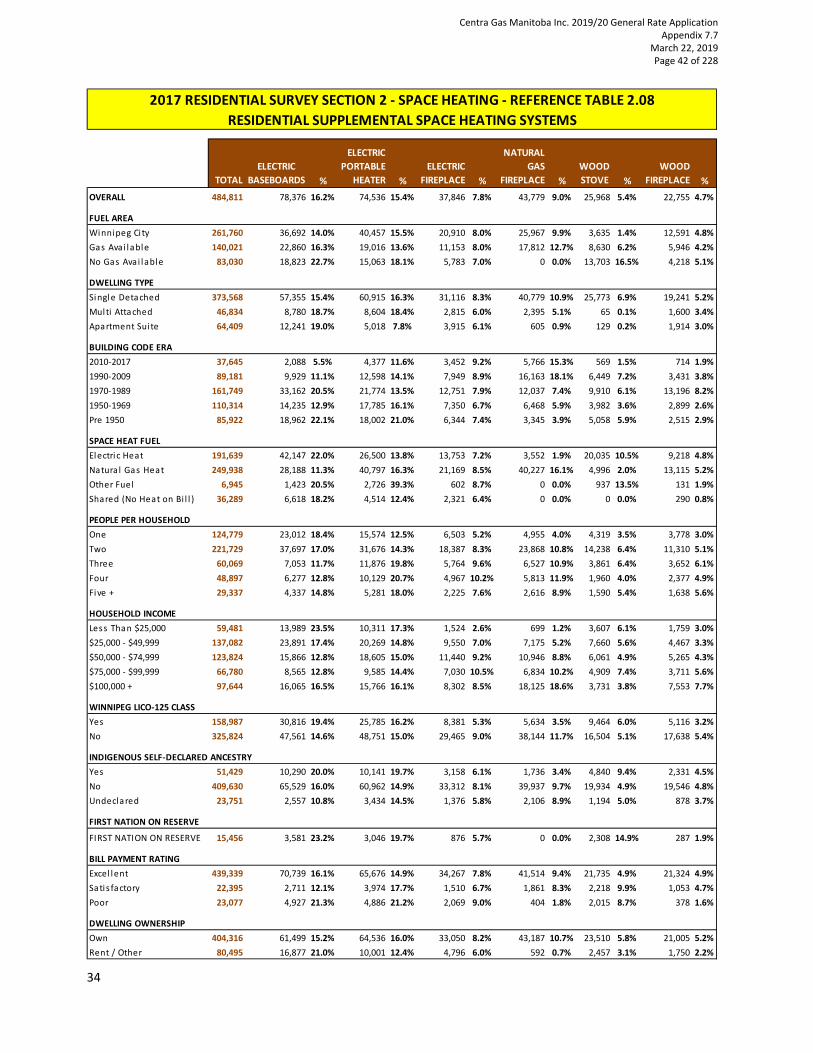
34
2.08 Residential Supplemental Space Heating Systems
TOTAL
ELECTRIC
BASEBOARDS %
ELECTRIC
PORTABLE
HEATER %
ELECTRIC
FIREPLACE %
NATURAL
GAS
FIREPLACE %
WOOD
STOVE %
WOOD
FIREPLACE %
OVERALL 484,811 78,376 16.2% 74,536 15.4% 37,846 7.8% 43,779 9.0% 25,968 5.4% 22,755 4.7%
FUEL AREA
Winnipeg City 261,760 36,692 14.0% 40,457 15.5% 20,910 8.0% 25,967 9.9% 3,635 1.4% 12,591 4.8%
Gas Avai lable 140,021 22,860 16.3% 19,016 13.6% 11,153 8.0% 17,812 12.7% 8,630 6.2% 5,946 4.2%
No Gas Avai lable 83,030 18,823 22.7% 15,063 18.1% 5,783 7.0% 0 0.0% 13,703 16.5% 4,218 5.1%
DWELLING TYPE
Single Detached 373,568 57,355 15.4% 60,915 16.3% 31,116 8.3% 40,779 10.9% 25,773 6.9% 19,241 5.2%
Multi Attached 46,834 8,780 18.7% 8,604 18.4% 2,815 6.0% 2,395 5.1% 65 0.1% 1,600 3.4%
Apartment Sui te 64,409 12,241 19.0% 5,018 7.8% 3,915 6.1% 605 0.9% 129 0.2% 1,914 3.0%
BUILDING CODE ERA
2010‐2017 37,645 2,088 5.5% 4,377 11.6% 3,452 9.2% 5,766 15.3% 569 1.5% 714 1.9%
1990‐2009 89,181 9,929 11.1% 12,598 14.1% 7,949 8.9% 16,163 18.1% 6,449 7.2% 3,431 3.8%
1970‐1989 161,749 33,162 20.5% 21,774 13.5% 12,751 7.9% 12,037 7.4% 9,910 6.1% 13,196 8.2%
1950‐1969 110,314 14,235 12.9% 17,785 16.1% 7,350 6.7% 6,468 5.9% 3,982 3.6% 2,899 2.6%
Pre 1950 85,922 18,962 22.1% 18,002 21.0% 6,344 7.4% 3,345 3.9% 5,058 5.9% 2,515 2.9%
SPACE HEAT FUEL
Electric Heat 191,639 42,147 22.0% 26,500 13.8% 13,753 7.2% 3,552 1.9% 20,035 10.5% 9,218 4.8%
Natura l Gas Heat 249,938 28,188 11.3% 40,797 16.3% 21,169 8.5% 40,227 16.1% 4,996 2.0% 13,115 5.2%
Other Fuel 6,945 1,423 20.5% 2,726 39.3% 602 8.7% 0 0.0% 937 13.5% 131 1.9%
Shared (No Heat on Bi l l ) 36,289 6,618 18.2% 4,514 12.4% 2,321 6.4% 0 0.0% 0 0.0% 290 0.8%
PEOPLE PER HOUSEHOLD
One 124,779 23,012 18.4% 15,574 12.5% 6,503 5.2% 4,955 4.0% 4,319 3.5% 3,778 3.0%
Two 221,729 37,697 17.0% 31,676 14.3% 18,387 8.3% 23,868 10.8% 14,238 6.4% 11,310 5.1%
Three 60,069 7,053 11.7% 11,876 19.8% 5,764 9.6% 6,527 10.9% 3,861 6.4% 3,652 6.1%
Four 48,897 6,277 12.8% 10,129 20.7% 4,967 10.2% 5,813 11.9% 1,960 4.0% 2,377 4.9%
Five + 29,337 4,337 14.8% 5,281 18.0% 2,225 7.6% 2,616 8.9% 1,590 5.4% 1,638 5.6%
HOUSEHOLD INCOME
Less Than $25,000 59,481 13,989 23.5% 10,311 17.3% 1,524 2.6% 699 1.2% 3,607 6.1% 1,759 3.0%
$25,000 ‐ $49,999 137,082 23,891 17.4% 20,269 14.8% 9,550 7.0% 7,175 5.2% 7,660 5.6% 4,467 3.3%
$50,000 ‐ $74,999 123,824 15,866 12.8% 18,605 15.0% 11,440 9.2% 10,946 8.8% 6,061 4.9% 5,265 4.3%
$75,000 ‐ $99,999 66,780 8,565 12.8% 9,585 14.4% 7,030 10.5% 6,834 10.2% 4,909 7.4% 3,711 5.6%
$100,000 + 97,644 16,065 16.5% 15,766 16.1% 8,302 8.5% 18,125 18.6% 3,731 3.8% 7,553 7.7%
WINNIPEG LICO‐125 CLASS
Yes 158,987 30,816 19.4% 25,785 16.2% 8,381 5.3% 5,634 3.5% 9,464 6.0% 5,116 3.2%
No 325,824 47,561 14.6% 48,751 15.0% 29,465 9.0% 38,144 11.7% 16,504 5.1% 17,638 5.4%
INDIGENOUS SELF‐DECLARED ANCESTRY
Yes 51,429 10,290 20.0% 10,141 19.7% 3,158 6.1% 1,736 3.4% 4,840 9.4% 2,331 4.5%
No 409,630 65,529 16.0% 60,962 14.9% 33,312 8.1% 39,937 9.7% 19,934 4.9% 19,546 4.8%
Undeclared 23,751 2,557 10.8% 3,434 14.5% 1,376 5.8% 2,106 8.9% 1,194 5.0% 878 3.7%
FIRST NATION ON RESERVE
FIRST NATION ON RESERVE 15,456 3,581 23.2% 3,046 19.7% 876 5.7% 0 0.0% 2,308 14.9% 287 1.9%
BILL PAYMENT RATING
Excel lent 439,339 70,739 16.1% 65,676 14.9% 34,267 7.8% 41,514 9.4% 21,735 4.9% 21,324 4.9%
Sati s factory 22,395 2,711 12.1% 3,974 17.7% 1,510 6.7% 1,861 8.3% 2,218 9.9% 1,053 4.7%
Poor 23,077 4,927 21.3% 4,886 21.2% 2,069 9.0% 404 1.8% 2,015 8.7% 378 1.6%
DWELLING OWNERSHIP
Own 404,316 61,499 15.2% 64,536 16.0% 33,050 8.2% 43,187 10.7% 23,510 5.8% 21,005 5.2%
Rent / Other 80,495 16,877 21.0% 10,001 12.4% 4,796 6.0% 592 0.7% 2,457 3.1% 1,750 2.2%
2017 RESIDENTIAL SURVEY SECTION 2 ‐ SPACE HEATING ‐ REFERENCE TABLE 2.08
RESIDENTIAL SUPPLEMENTAL SPACE HEATING SYSTEMS
Centra Gas Manitoba Inc. 2019/20 General Rate Application Appendix 7.7
March 22, 2019 Page 42 of 228

35
2.09 Thermostat Control for the Main Heating System
TOTAL
NO
THERMOSTAT %
ROOM
CONTROL %
MANUAL
CONTROL %
PROGRAM
MABLE % SMART %
OVERALL 484,811 15,496 3.2% 54,944 11.3% 173,593 35.8% 219,934 45.4% 20,844 4.3%
FUEL AREA
Winnipeg City 261,760 12,202 4.7% 22,043 8.4% 74,562 28.5% 139,571 53.3% 13,382 5.1%
Gas Avai lable 140,021 1,666 1.2% 15,569 11.1% 56,236 40.2% 61,109 43.6% 5,440 3.9%
No Gas Ava i lable 83,030 1,628 2.0% 17,331 20.9% 42,795 51.5% 19,254 23.2% 2,021 2.4%
DWELLING TYPE
Single Detached 373,568 2,342 0.6% 29,061 7.8% 129,726 34.7% 192,893 51.6% 19,547 5.2%
Multi Attached 46,834 1,137 2.4% 4,842 10.3% 19,323 41.3% 20,398 43.6% 1,134 2.4%
Apartment Sui te 64,409 12,017 18.7% 21,041 32.7% 24,545 38.1% 6,643 10.3% 163 0.3%
BUILDING CODE ERA
2010‐2017 37,645 131 0.3% 685 1.8% 11,769 31.3% 21,058 55.9% 4,002 10.6%
1990‐2009 89,181 619 0.7% 6,473 7.3% 32,239 36.2% 44,060 49.4% 5,790 6.5%
1970‐1989 161,749 2,303 1.4% 27,955 17.3% 58,117 35.9% 69,506 43.0% 3,868 2.4%
1950‐1969 110,314 5,572 5.1% 11,844 10.7% 39,146 35.5% 49,116 44.5% 4,636 4.2%
Pre 1950 85,922 6,871 8.0% 7,986 9.3% 32,322 37.6% 36,194 42.1% 2,549 3.0%
SPACE HEAT FUEL
Electric Heat 191,639 0 0.0% 44,117 23.0% 87,372 45.6% 55,987 29.2% 4,163 2.2%
Natura l Gas Heat 249,938 0 0.0% 0 0.0% 72,644 29.1% 160,614 64.3% 16,681 6.7%
Other Fuel 6,945 2,342 33.7% 0 0.0% 4,338 62.5% 265 3.8% 0 0.0%
Shared (No Heat on Bi l l ) 36,289 13,154 36.2% 10,827 29.8% 9,240 25.5% 3,069 8.5% 0 0.0%
PEOPLE PER HOUSEHOLD
One 124,779 8,889 7.1% 22,672 18.2% 51,901 41.6% 38,682 31.0% 2,634 2.1%
Two 221,729 5,427 2.4% 24,681 11.1% 80,961 36.5% 102,097 46.0% 8,563 3.9%
Three 60,069 580 1.0% 3,507 5.8% 18,361 30.6% 34,024 56.6% 3,597 6.0%
Four 48,897 469 1.0% 2,237 4.6% 11,835 24.2% 29,853 61.1% 4,504 9.2%
Five + 29,337 131 0.4% 1,847 6.3% 10,535 35.9% 15,278 52.1% 1,545 5.3%
HOUSEHOLD INCOME
Less Than $25,000 59,481 6,677 11.2% 11,376 19.1% 30,638 51.5% 10,472 17.6% 318 0.5%
$25,000 ‐ $49,999 137,082 2,499 1.8% 21,486 15.7% 62,434 45.5% 48,024 35.0% 2,639 1.9%
$50,000 ‐ $74,999 123,824 4,111 3.3% 11,637 9.4% 41,783 33.7% 62,694 50.6% 3,599 2.9%
$75,000 ‐ $99,999 66,780 580 0.9% 4,972 7.4% 18,537 27.8% 38,516 57.7% 4,174 6.3%
$100,000 + 97,644 1,629 1.7% 5,472 5.6% 20,201 20.7% 60,227 61.7% 10,114 10.4%
WINNIPEG LICO‐125 CLASS
Yes 158,987 8,016 5.0% 25,329 15.9% 74,433 46.8% 49,279 31.0% 1,930 1.2%
No 325,824 7,480 2.3% 29,614 9.1% 99,160 30.4% 170,656 52.4% 18,914 5.8%
INDIGENOUS SELF‐DECLARED ANCESTRY
Yes 51,429 1,793 3.5% 8,509 16.5% 23,404 45.5% 16,226 31.6% 1,498 2.9%
No 409,630 13,278 3.2% 44,319 10.8% 141,710 34.6% 191,805 46.8% 18,519 4.5%
Undeclared 23,751 425 1.8% 2,116 8.9% 8,480 35.7% 11,903 50.1% 827 3.5%
FIRST NATION ON RESERVE
FIRST NATION ON RESERVE 15,456 325 2.1% 3,251 21.0% 10,190 65.9% 1,659 10.7% 31 0.2%
BILL PAYMENT RATING
Excel lent 439,339 12,790 2.9% 49,154 11.2% 153,816 35.0% 203,399 46.3% 20,180 4.6%
Satis factory 22,395 1,145 5.1% 2,999 13.4% 8,438 37.7% 9,264 41.4% 549 2.5%
Poor 23,077 1,561 6.8% 2,791 12.1% 11,339 49.1% 7,272 31.5% 115 0.5%
DWELLING OWNERSHIP
Own 404,316 2,660 0.7% 33,697 8.3% 138,232 34.2% 209,180 51.7% 20,547 5.1%
Rent / Other 80,495 12,836 15.9% 21,247 26.4% 35,361 43.9% 10,754 13.4% 296 0.4%
2017 RESIDENTIAL SURVEY SECTION 2 ‐ SPACE HEATING ‐ REFERENCE TABLE 2.09
THERMOSTAT CONTROL FOR THE MAIN HEATING SYSTEM
Centra Gas Manitoba Inc. 2019/20 General Rate Application Appendix 7.7
March 22, 2019 Page 43 of 228

36
2.10 Nightly Thermostat Settings
TOTAL
EVERY
NIGHT %
MOST
NIGHTS %
OCCASSI
ONALLY % NEVER %
PROGRAM
MED %
NO
THERMOSTAT %
OVERALL 484,811 154,687 31.9% 40,952 8.4% 78,958 16.3% 119,855 24.7% 74,863 15.4% 15,496 3.2%
FUEL AREA
Winnipeg City 261,760 86,517 33.1% 19,949 7.6% 36,965 14.1% 57,430 21.9% 48,697 18.6% 12,202 4.7%
Gas Avai lable 140,021 47,326 33.8% 11,761 8.4% 22,802 16.3% 37,885 27.1% 18,581 13.3% 1,666 1.2%
No Gas Avai lable 83,030 20,844 25.1% 9,242 11.1% 19,191 23.1% 24,539 29.6% 7,585 9.1% 1,628 2.0%
DWELLING TYPE
Single Detached 373,568 123,961 33.2% 30,175 8.1% 59,179 15.8% 92,803 24.8% 65,109 17.4% 2,342 0.6%
Multi Attached 46,834 13,655 29.2% 3,872 8.3% 9,681 20.7% 12,399 26.5% 6,091 13.0% 1,137 2.4%
Apartment Suite 64,409 17,072 26.5% 6,906 10.7% 10,098 15.7% 14,653 22.8% 3,663 5.7% 12,017 18.7%
BUILDING CODE ERA
2010‐2017 37,645 13,653 36.3% 2,197 5.8% 5,090 13.5% 9,498 25.2% 7,075 18.8% 131 0.3%
1990‐2009 89,181 31,349 35.2% 7,869 8.8% 14,803 16.6% 18,827 21.1% 15,713 17.6% 619 0.7%
1970‐1989 161,749 48,623 30.1% 14,842 9.2% 30,905 19.1% 40,775 25.2% 24,300 15.0% 2,303 1.4%
1950‐1969 110,314 37,178 33.7% 9,242 8.4% 15,861 14.4% 27,173 24.6% 15,288 13.9% 5,572 5.1%
Pre 1950 85,922 23,883 27.8% 6,802 7.9% 12,298 14.3% 23,581 27.4% 12,486 14.5% 6,871 8.0%
SPACE HEAT FUEL
Electric Heat 191,639 59,015 30.8% 20,117 10.5% 38,958 20.3% 52,693 27.5% 20,855 10.9% 0 0.0%
Natura l Gas Heat 249,938 90,534 36.2% 16,810 6.7% 33,781 13.5% 56,263 22.5% 52,550 21.0% 0 0.0%
Other Fuel 6,945 792 11.4% 131 1.9% 1,905 27.4% 1,774 25.5% 0 0.0% 2,342 33.7%
Shared (No Heat on Bi l l ) 36,289 4,345 12.0% 3,894 10.7% 4,314 11.9% 9,124 25.1% 1,458 4.0% 13,154 36.2%
PEOPLE PER HOUSEHOLD
One 124,779 33,423 26.8% 12,424 10.0% 20,289 16.3% 36,137 29.0% 13,616 10.9% 8,889 7.1%
Two 221,729 82,113 37.0% 18,010 8.1% 32,401 14.6% 51,470 23.2% 32,308 14.6% 5,427 2.4%
Three 60,069 18,641 31.0% 4,379 7.3% 10,483 17.5% 13,374 22.3% 12,612 21.0% 580 1.0%
Four 48,897 13,919 28.5% 3,752 7.7% 8,402 17.2% 11,846 24.2% 10,509 21.5% 469 1.0%
Five + 29,337 6,591 22.5% 2,388 8.1% 7,382 25.2% 7,028 24.0% 5,817 19.8% 131 0.4%
HOUSEHOLD INCOME
Less Than $25,000 59,481 14,822 24.9% 6,253 10.5% 12,430 20.9% 15,859 26.7% 3,441 5.8% 6,677 11.2%
$25,000 ‐ $49,999 137,082 40,649 29.7% 13,413 9.8% 23,697 17.3% 39,264 28.6% 17,560 12.8% 2,499 1.8%
$50,000 ‐ $74,999 123,824 41,476 33.5% 9,348 7.5% 18,723 15.1% 29,532 23.9% 20,633 16.7% 4,111 3.3%
$75,000 ‐ $99,999 66,780 23,612 35.4% 5,234 7.8% 10,199 15.3% 15,097 22.6% 12,057 18.1% 580 0.9%
$100,000 + 97,644 34,128 35.0% 6,705 6.9% 13,909 14.2% 20,101 20.6% 21,172 21.7% 1,629 1.7%
WINNIPEG LICO‐125 CLASS
Yes 158,987 44,641 28.1% 14,777 9.3% 30,761 19.3% 43,575 27.4% 17,217 10.8% 8,016 5.0%
No 325,824 110,046 33.8% 26,175 8.0% 48,197 14.8% 76,280 23.4% 57,646 17.7% 7,480 2.3%
INDIGENOUS SELF‐DECLARED ANCESTRY
Yes 51,429 11,845 23.0% 4,828 9.4% 14,459 28.1% 12,292 23.9% 6,211 12.1% 1,793 3.5%
No 409,630 134,816 32.9% 34,746 8.5% 60,887 14.9% 101,058 24.7% 64,844 15.8% 13,278 3.2%
Undeclared 23,751 8,025 33.8% 1,378 5.8% 3,612 15.2% 6,504 27.4% 3,808 16.0% 425 1.8%
FIRST NATION ON RESERVE
FIRST NATION ON RESERVE 15,456 2,555 16.5% 1,902 12.3% 6,371 41.2% 3,369 21.8% 933 6.0% 325 2.1%
BILL PAYMENT RATING
Excel lent 439,339 143,776 32.7% 37,141 8.5% 68,524 15.6% 108,240 24.6% 68,867 15.7% 12,790 2.9%
Satis factory 22,395 5,688 25.4% 1,580 7.1% 4,408 19.7% 5,529 24.7% 4,044 18.1% 1,145 5.1%
Poor 23,077 5,223 22.6% 2,231 9.7% 6,025 26.1% 6,086 26.4% 1,951 8.5% 1,561 6.8%
DWELLING OWNERSHIP
Own 404,316 134,758 33.3% 33,373 8.3% 61,944 15.3% 101,514 25.1% 70,067 17.3% 2,660 0.7%
Rent / Other 80,495 19,929 24.8% 7,579 9.4% 17,014 21.1% 18,341 22.8% 4,796 6.0% 12,836 15.9%
2017 RESIDENTIAL SURVEY SECTION 2 ‐ SPACE HEATING ‐ REFERENCE TABLE 2.10
NIGHTLY THERMOSTAT SETTING ADJUSTMENTS
Centra Gas Manitoba Inc. 2019/20 General Rate Application Appendix 7.7
March 22, 2019 Page 44 of 228

37
2.11 Programmable Thermostat
TOTAL NOT PROGRAMMABLE % YES % NO %
OVERALL 484,811 244,033 50.3% 136,258 28.1% 104,520 21.6%
FUEL AREA
Winnipeg City 261,760 108,807 41.6% 91,654 35.0% 61,299 23.4%
Gas Avai lable 140,021 73,472 52.5% 33,599 24.0% 32,951 23.5%
No Gas Avai lable 83,030 61,755 74.4% 11,006 13.3% 10,270 12.4%
DWELLING TYPE
Single Detached 373,568 161,128 43.1% 123,035 32.9% 89,405 23.9%
Multi Attached 46,834 25,302 54.0% 10,114 21.6% 11,419 24.4%
Apartment Sui te 64,409 57,603 89.4% 3,110 4.8% 3,696 5.7%
BUILDING CODE ERA
2010‐2017 37,645 12,585 33.4% 13,498 35.9% 11,562 30.7%
1990‐2009 89,181 39,331 44.1% 28,746 32.2% 21,104 23.7%
1970‐1989 161,749 88,375 54.6% 42,181 26.1% 31,193 19.3%
1950‐1969 110,314 56,562 51.3% 30,666 27.8% 23,086 20.9%
Pre 1950 85,922 47,179 54.9% 21,168 24.6% 17,575 20.5%
SPACE HEAT FUEL
Electric Heat 191,639 131,489 68.6% 31,514 16.4% 28,636 14.9%
Natura l Gas Heat 249,938 72,644 29.1% 104,479 41.8% 72,815 29.1%
Other Fuel 6,945 6,680 96.2% 265 3.8% 0 0.0%
Shared (No Heat on Bi l l ) 36,289 33,220 91.5% 0 0.0% 3,069 8.5%
PEOPLE PER HOUSEHOLD
One 124,779 83,463 66.9% 20,441 16.4% 20,875 16.7%
Two 221,729 111,069 50.1% 60,341 27.2% 50,319 22.7%
Three 60,069 22,448 37.4% 23,611 39.3% 14,010 23.3%
Four 48,897 14,540 29.7% 22,444 45.9% 11,912 24.4%
Five + 29,337 12,513 42.7% 9,420 32.1% 7,403 25.2%
HOUSEHOLD INCOME
Less Than $25,000 59,481 48,691 81.9% 4,161 7.0% 6,629 11.1%
$25,000 ‐ $49,999 137,082 86,419 63.0% 26,700 19.5% 23,964 17.5%
$50,000 ‐ $74,999 123,824 57,531 46.5% 34,470 27.8% 31,823 25.7%
$75,000 ‐ $99,999 66,780 24,089 36.1% 24,733 37.0% 17,958 26.9%
$100,000 + 97,644 27,302 28.0% 46,195 47.3% 24,147 24.7%
WINNIPEG LICO‐125 CLASS
Yes 158,987 107,778 67.8% 25,850 16.3% 25,358 16.0%
No 325,824 136,255 41.8% 110,408 33.9% 79,161 24.3%
INDIGENOUS SELF‐DECLARED ANCESTRY
Yes 51,429 33,706 65.5% 8,739 17.0% 8,985 17.5%
No 409,630 199,307 48.7% 120,212 29.3% 90,112 22.0%
Undeclared 23,751 11,021 46.4% 7,308 30.8% 5,423 22.8%
FIRST NATION ON RESERVE
FIRST NATION ON RESERVE 15,456 13,766 89.1% 466 3.0% 1,224 7.9%
BILL PAYMENT RATING
Excel lent 439,339 215,760 49.1% 127,340 29.0% 96,239 21.9%
Satis factory 22,395 12,582 56.2% 5,222 23.3% 4,591 20.5%
Poor 23,077 15,691 68.0% 3,696 16.0% 3,690 16.0%
DWELLING OWNERSHIP
Own 404,316 174,589 43.2% 132,041 32.7% 97,686 24.2%
Rent / Other 80,495 69,444 86.3% 4,217 5.2% 6,834 8.5%
2017 RESIDENTIAL SURVEY SECTION 2 ‐ SPACE HEATING ‐ REFERENCE TABLE 2.11
PROGRAMMABLE THERMOSTAT
Centra Gas Manitoba Inc. 2019/20 General Rate Application Appendix 7.7
March 22, 2019 Page 45 of 228
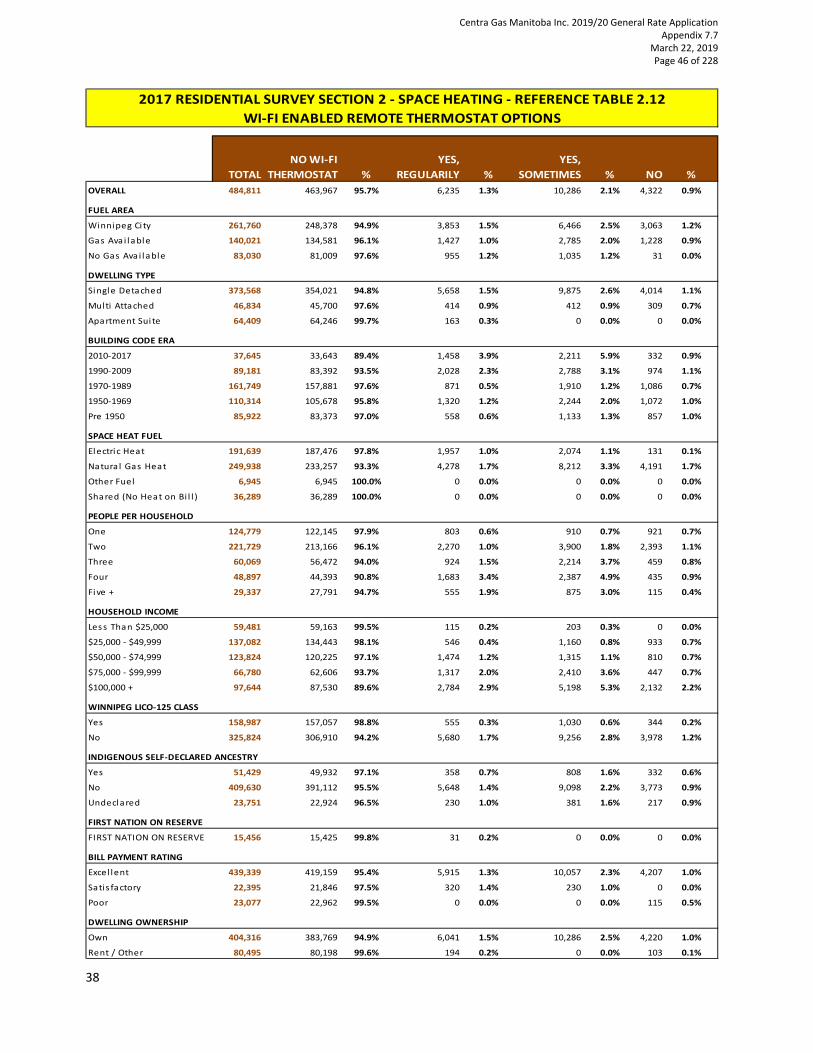
38
2.12 Wi‐Fi Enabled Remote Thermostat Options
TOTAL
NO WI‐FI
THERMOSTAT %
YES,
REGULARILY %
YES,
SOMETIMES % NO %
OVERALL 484,811 463,967 95.7% 6,235 1.3% 10,286 2.1% 4,322 0.9%
FUEL AREA
Winnipeg Ci ty 261,760 248,378 94.9% 3,853 1.5% 6,466 2.5% 3,063 1.2%
Gas Avai lable 140,021 134,581 96.1% 1,427 1.0% 2,785 2.0% 1,228 0.9%
No Gas Avai lable 83,030 81,009 97.6% 955 1.2% 1,035 1.2% 31 0.0%
DWELLING TYPE
Single Detached 373,568 354,021 94.8% 5,658 1.5% 9,875 2.6% 4,014 1.1%
Multi Attached 46,834 45,700 97.6% 414 0.9% 412 0.9% 309 0.7%
Apartment Sui te 64,409 64,246 99.7% 163 0.3% 0 0.0% 0 0.0%
BUILDING CODE ERA
2010‐2017 37,645 33,643 89.4% 1,458 3.9% 2,211 5.9% 332 0.9%
1990‐2009 89,181 83,392 93.5% 2,028 2.3% 2,788 3.1% 974 1.1%
1970‐1989 161,749 157,881 97.6% 871 0.5% 1,910 1.2% 1,086 0.7%
1950‐1969 110,314 105,678 95.8% 1,320 1.2% 2,244 2.0% 1,072 1.0%
Pre 1950 85,922 83,373 97.0% 558 0.6% 1,133 1.3% 857 1.0%
SPACE HEAT FUEL
Electri c Heat 191,639 187,476 97.8% 1,957 1.0% 2,074 1.1% 131 0.1%
Natura l Gas Heat 249,938 233,257 93.3% 4,278 1.7% 8,212 3.3% 4,191 1.7%
Other Fuel 6,945 6,945 100.0% 0 0.0% 0 0.0% 0 0.0%
Shared (No Heat on Bi l l ) 36,289 36,289 100.0% 0 0.0% 0 0.0% 0 0.0%
PEOPLE PER HOUSEHOLD
One 124,779 122,145 97.9% 803 0.6% 910 0.7% 921 0.7%
Two 221,729 213,166 96.1% 2,270 1.0% 3,900 1.8% 2,393 1.1%
Three 60,069 56,472 94.0% 924 1.5% 2,214 3.7% 459 0.8%
Four 48,897 44,393 90.8% 1,683 3.4% 2,387 4.9% 435 0.9%
Five + 29,337 27,791 94.7% 555 1.9% 875 3.0% 115 0.4%
HOUSEHOLD INCOME
Less Than $25,000 59,481 59,163 99.5% 115 0.2% 203 0.3% 0 0.0%
$25,000 ‐ $49,999 137,082 134,443 98.1% 546 0.4% 1,160 0.8% 933 0.7%
$50,000 ‐ $74,999 123,824 120,225 97.1% 1,474 1.2% 1,315 1.1% 810 0.7%
$75,000 ‐ $99,999 66,780 62,606 93.7% 1,317 2.0% 2,410 3.6% 447 0.7%
$100,000 + 97,644 87,530 89.6% 2,784 2.9% 5,198 5.3% 2,132 2.2%
WINNIPEG LICO‐125 CLASS
Yes 158,987 157,057 98.8% 555 0.3% 1,030 0.6% 344 0.2%
No 325,824 306,910 94.2% 5,680 1.7% 9,256 2.8% 3,978 1.2%
INDIGENOUS SELF‐DECLARED ANCESTRY
Yes 51,429 49,932 97.1% 358 0.7% 808 1.6% 332 0.6%
No 409,630 391,112 95.5% 5,648 1.4% 9,098 2.2% 3,773 0.9%
Undeclared 23,751 22,924 96.5% 230 1.0% 381 1.6% 217 0.9%
FIRST NATION ON RESERVE
FIRST NATION ON RESERVE 15,456 15,425 99.8% 31 0.2% 0 0.0% 0 0.0%
BILL PAYMENT RATING
Excel lent 439,339 419,159 95.4% 5,915 1.3% 10,057 2.3% 4,207 1.0%
Satis factory 22,395 21,846 97.5% 320 1.4% 230 1.0% 0 0.0%
Poor 23,077 22,962 99.5% 0 0.0% 0 0.0% 115 0.5%
DWELLING OWNERSHIP
Own 404,316 383,769 94.9% 6,041 1.5% 10,286 2.5% 4,220 1.0%
Rent / Other 80,495 80,198 99.6% 194 0.2% 0 0.0% 103 0.1%
2017 RESIDENTIAL SURVEY SECTION 2 ‐ SPACE HEATING ‐ REFERENCE TABLE 2.12
WI‐FI ENABLED REMOTE THERMOSTAT OPTIONS
Centra Gas Manitoba Inc. 2019/20 General Rate Application Appendix 7.7
March 22, 2019 Page 46 of 228

39
2.13 Plans to Install a Wi‐Fi Thermostat
TOTAL YES, DEFINITELY % YES, MAYBE % ALREADY HAVE % NO %
OVERALL 484,811 4,336 0.9% 49,553 10.2% 27,636 5.7% 403,287 83.2%
FUEL AREA
Winnipeg Ci ty 261,760 2,435 0.9% 28,865 11.0% 17,308 6.6% 213,153 81.4%
Gas Avai lable 140,021 1,510 1.1% 14,011 10.0% 6,741 4.8% 117,760 84.1%
No Gas Avai lable 83,030 391 0.5% 6,677 8.0% 3,587 4.3% 72,375 87.2%
DWELLING TYPE
Single Detached 373,568 3,372 0.9% 41,936 11.2% 24,931 6.7% 303,329 81.2%
Multi Attached 46,834 674 1.4% 4,184 8.9% 1,597 3.4% 40,379 86.2%
Apartment Suite 64,409 290 0.5% 3,433 5.3% 1,108 1.7% 59,579 92.5%
BUILDING CODE ERA
2010‐2017 37,645 523 1.4% 4,599 12.2% 5,214 13.9% 27,309 72.5%
1990‐2009 89,181 617 0.7% 9,525 10.7% 6,557 7.4% 72,482 81.3%
1970‐1989 161,749 1,135 0.7% 14,665 9.1% 5,547 3.4% 140,402 86.8%
1950‐1969 110,314 1,348 1.2% 11,194 10.1% 6,969 6.3% 90,804 82.3%
Pre 1950 85,922 713 0.8% 9,570 11.1% 3,349 3.9% 72,290 84.1%
SPACE HEAT FUEL
Electri c Heat 191,639 1,178 0.6% 15,098 7.9% 6,291 3.3% 169,072 88.2%
Natura l Gas Heat 249,938 2,868 1.1% 32,069 12.8% 20,296 8.1% 194,705 77.9%
Other Fuel 6,945 0 0.0% 337 4.9% 469 6.7% 6,139 88.4%
Shared (No Heat on Bi l l ) 36,289 290 0.8% 2,048 5.6% 580 1.6% 33,371 92.0%
PEOPLE PER HOUSEHOLD
One 124,779 732 0.6% 6,693 5.4% 4,849 3.9% 112,506 90.2%
Two 221,729 1,307 0.6% 23,855 10.8% 11,694 5.3% 184,873 83.4%
Three 60,069 640 1.1% 7,893 13.1% 4,156 6.9% 47,381 78.9%
Four 48,897 1,124 2.3% 7,272 14.9% 4,805 9.8% 35,695 73.0%
Five + 29,337 533 1.8% 3,839 13.1% 2,131 7.3% 22,833 77.8%
HOUSEHOLD INCOME
Less Than $25,000 59,481 297 0.5% 2,192 3.7% 802 1.3% 56,190 94.5%
$25,000 ‐ $49,999 137,082 517 0.4% 9,904 7.2% 4,584 3.3% 122,077 89.1%
$50,000 ‐ $74,999 123,824 1,301 1.1% 14,145 11.4% 5,303 4.3% 103,075 83.2%
$75,000 ‐ $99,999 66,780 516 0.8% 9,128 13.7% 5,016 7.5% 52,119 78.0%
$100,000 + 97,644 1,704 1.7% 14,184 14.5% 11,931 12.2% 69,826 71.5%
WINNIPEG LICO‐125 CLASS
Yes 158,987 712 0.4% 10,766 6.8% 3,455 2.2% 144,053 90.6%
No 325,824 3,624 1.1% 38,786 11.9% 24,180 7.4% 259,234 79.6%
INDIGENOUS SELF‐DECLARED ANCESTRY
Yes 51,429 734 1.4% 4,434 8.6% 2,020 3.9% 44,242 86.0%
No 409,630 3,500 0.9% 42,423 10.4% 24,447 6.0% 339,260 82.8%
Undeclared 23,751 103 0.4% 2,695 11.3% 1,169 4.9% 19,785 83.3%
FIRST NATION ON RESERVE
FIRST NATION ON RESERVE 15,456 124 0.8% 1,057 6.8% 224 1.5% 14,050 90.9%
BILL PAYMENT RATING
Excel lent 439,339 4,142 0.9% 43,342 9.9% 26,492 6.0% 365,363 83.2%
Satis factory 22,395 100 0.4% 3,651 16.3% 781 3.5% 17,863 79.8%
Poor 23,077 93 0.4% 2,560 11.1% 363 1.6% 20,061 86.9%
DWELLING OWNERSHIP
Own 404,316 3,860 1.0% 48,067 11.9% 26,163 6.5% 326,226 80.7%
Rent / Other 80,495 476 0.6% 1,485 1.8% 1,473 1.8% 77,061 95.7%
2017 RESIDENTIAL SURVEY SECTION 2 ‐ SPACE HEATING ‐ REFERENCE TABLE 2.13
PLANS TO INSTALL A WI‐FI THERMOSTAT
Centra Gas Manitoba Inc. 2019/20 General Rate Application Appendix 7.7
March 22, 2019 Page 47 of 228

40
2.14 Dehumidifier
TOTAL YES % NO %
OVERALL 484,811 167,204 34.5% 317,607 65.5%
FUEL AREA
Winnipeg City 261,760 78,005 29.8% 183,755 70.2%
Gas Avai lable 140,021 58,051 41.5% 81,970 58.5%
No Gas Avai lable 83,030 31,148 37.5% 51,882 62.5%
DWELLING TYPE
Single Detached 373,568 148,939 39.9% 224,629 60.1%
Multi Attached 46,834 13,002 27.8% 33,832 72.2%
Apartment Sui te 64,409 5,263 8.2% 59,146 91.8%
BUILDING CODE ERA
2010‐2017 37,645 10,211 27.1% 27,434 72.9%
1990‐2009 89,181 26,407 29.6% 62,774 70.4%
1970‐1989 161,749 55,672 34.4% 106,077 65.6%
1950‐1969 110,314 43,210 39.2% 67,104 60.8%
Pre 1950 85,922 31,704 36.9% 54,217 63.1%
SPACE HEAT FUEL
Electric Heat 191,639 64,691 33.8% 126,948 66.2%
Natural Gas Heat 249,938 94,264 37.7% 155,674 62.3%
Other Fuel 6,945 3,385 48.7% 3,560 51.3%
Shared (No Heat on Bi l l ) 36,289 4,864 13.4% 31,425 86.6%
PEOPLE PER HOUSEHOLD
One 124,779 34,425 27.6% 90,354 72.4%
Two 221,729 81,325 36.7% 140,404 63.3%
Three 60,069 19,680 32.8% 40,390 67.2%
Four 48,897 19,537 40.0% 29,360 60.0%
Five + 29,337 12,237 41.7% 17,099 58.3%
HOUSEHOLD INCOME
Less Than $25,000 59,481 14,863 25.0% 44,617 75.0%
$25,000 ‐ $49,999 137,082 44,785 32.7% 92,297 67.3%
$50,000 ‐ $74,999 123,824 48,547 39.2% 75,277 60.8%
$75,000 ‐ $99,999 66,780 24,274 36.3% 42,505 63.7%
$100,000 + 97,644 34,734 35.6% 62,910 64.4%
WINNIPEG LICO‐125 CLASS
Yes 158,987 49,827 31.3% 109,160 68.7%
No 325,824 117,377 36.0% 208,447 64.0%
INDIGENOUS SELF‐DECLARED ANCESTRY
Yes 51,429 13,673 26.6% 37,757 73.4%
No 409,630 144,687 35.3% 264,944 64.7%
Undeclared 23,751 8,845 37.2% 14,907 62.8%
FIRST NATION ON RESERVE
FIRST NATION ON RESERVE 15,456 2,406 15.6% 13,051 84.4%
BILL PAYMENT RATING
Excel lent 439,339 156,387 35.6% 282,952 64.4%
Satis factory 22,395 5,462 24.4% 16,933 75.6%
Poor 23,077 5,355 23.2% 17,722 76.8%
DWELLING OWNERSHIP
Own 404,316 157,131 38.9% 247,185 61.1%
Rent / Other 80,495 10,073 12.5% 70,422 87.5%
2017 RESIDENTIAL SURVEY SECTION 2 ‐ SPACE HEATING ‐ REFERENCE TABLE 2.14
DO YOU USE A DEHUMIDIFIER
Centra Gas Manitoba Inc. 2019/20 General Rate Application Appendix 7.7
March 22, 2019 Page 48 of 228

41
2.15 Humidifier
TOTAL YES % NO %
OVERALL 484,811 100,223 20.7% 384,588 79.3%
FUEL AREA
Winnipeg City 261,760 62,883 24.0% 198,877 76.0%
Gas Avai lable 140,021 24,803 17.7% 115,218 82.3%
No Gas Avai lable 83,030 12,537 15.1% 70,493 84.9%
DWELLING TYPE
Single Detached 373,568 73,832 19.8% 299,736 80.2%
Multi Attached 46,834 9,153 19.5% 37,681 80.5%
Apartment Sui te 64,409 17,239 26.8% 47,170 73.2%
BUILDING CODE ERA
2010‐2017 37,645 8,534 22.7% 29,111 77.3%
1990‐2009 89,181 19,340 21.7% 69,842 78.3%
1970‐1989 161,749 32,932 20.4% 128,817 79.6%
1950‐1969 110,314 21,390 19.4% 88,924 80.6%
Pre 1950 85,922 18,028 21.0% 67,894 79.0%
SPACE HEAT FUEL
Electric Heat 191,639 34,838 18.2% 156,801 81.8%
Natural Gas Heat 249,938 56,888 22.8% 193,050 77.2%
Other Fuel 6,945 1,027 14.8% 5,918 85.2%
Shared (No Heat on Bi l l ) 36,289 7,470 20.6% 28,819 79.4%
PEOPLE PER HOUSEHOLD
One 124,779 21,165 17.0% 103,614 83.0%
Two 221,729 49,095 22.1% 172,634 77.9%
Three 60,069 11,394 19.0% 48,675 81.0%
Four 48,897 12,525 25.6% 36,372 74.4%
Five + 29,337 6,044 20.6% 23,292 79.4%
HOUSEHOLD INCOME
Less Than $25,000 59,481 8,948 15.0% 50,533 85.0%
$25,000 ‐ $49,999 137,082 26,195 19.1% 110,887 80.9%
$50,000 ‐ $74,999 123,824 25,906 20.9% 97,918 79.1%
$75,000 ‐ $99,999 66,780 13,028 19.5% 53,752 80.5%
$100,000 + 97,644 26,146 26.8% 71,498 73.2%
WINNIPEG LICO‐125 CLASS
Yes 158,987 27,353 17.2% 131,634 82.8%
No 325,824 72,871 22.4% 252,954 77.6%
INDIGENOUS SELF‐DECLARED ANCESTRY
Yes 51,429 8,267 16.1% 43,162 83.9%
No 409,630 87,850 21.4% 321,780 78.6%
Undeclared 23,751 4,106 17.3% 19,645 82.7%
FIRST NATION ON RESERVE
FIRST NATION ON RESERVE 15,456 1,498 9.7% 13,958 90.3%
BILL PAYMENT RATING
Excel lent 439,339 94,256 21.5% 345,083 78.5%
Satis factory 22,395 3,044 13.6% 19,351 86.4%
Poor 23,077 2,923 12.7% 20,154 87.3%
DWELLING OWNERSHIP
Own 404,316 84,396 20.9% 319,920 79.1%
Rent / Other 80,495 15,827 19.7% 64,668 80.3%
2017 RESIDENTIAL SURVEY SECTION 2 ‐ SPACE HEATING ‐ REFERENCE TABLE 2.15
DO YOU USE A HUMIDIFIER
Centra Gas Manitoba Inc. 2019/20 General Rate Application Appendix 7.7
March 22, 2019 Page 49 of 228

42
2.16 Heat Recovery Ventilation System (HRV)
TOTAL YES % YES BUT DON'T USE % NO HRV %
OVERALL 484,811 93,236 19.2% 7,208 1.5% 384,367 79.3%
FUEL AREA
Winnipeg City 261,760 35,403 13.5% 1,984 0.8% 224,373 85.7%
Gas Avai lable 140,021 37,837 27.0% 1,962 1.4% 100,222 71.6%
No Gas Avai lable 83,030 19,996 24.1% 3,262 3.9% 59,772 72.0%
DWELLING TYPE
Single Detached 373,568 72,557 19.4% 6,226 1.7% 294,785 78.9%
Multi Attached 46,834 11,936 25.5% 529 1.1% 34,370 73.4%
Apartment Sui te 64,409 8,743 13.6% 453 0.7% 55,213 85.7%
BUILDING CODE ERA
2010‐2017 37,645 36,277 96.4% 0 0.0% 1,368 3.6%
1990‐2009 89,181 25,899 29.0% 2,955 3.3% 60,327 67.6%
1970‐1989 161,749 15,526 9.6% 2,490 1.5% 143,733 88.9%
1950‐1969 110,314 8,323 7.5% 1,281 1.2% 100,709 91.3%
Pre 1950 85,922 7,211 8.4% 481 0.6% 78,230 91.0%
SPACE HEAT FUEL
Electric Heat 191,639 51,593 26.9% 4,529 2.4% 135,517 70.7%
Natura l Gas Heat 249,938 40,182 16.1% 1,920 0.8% 207,836 83.2%
Other Fuel 6,945 731 10.5% 469 6.7% 5,746 82.7%
Shared (No Heat on Bi l l ) 36,289 731 2.0% 290 0.8% 35,268 97.2%
PEOPLE PER HOUSEHOLD
One 124,779 14,685 11.8% 1,397 1.1% 108,697 87.1%
Two 221,729 44,122 19.9% 3,108 1.4% 174,499 78.7%
Three 60,069 11,890 19.8% 885 1.5% 47,295 78.7%
Four 48,897 14,180 29.0% 995 2.0% 33,721 69.0%
Five + 29,337 8,359 28.5% 822 2.8% 20,155 68.7%
HOUSEHOLD INCOME
Less Than $25,000 59,481 6,755 11.4% 1,437 2.4% 51,289 86.2%
$25,000 ‐ $49,999 137,082 19,322 14.1% 1,182 0.9% 116,578 85.0%
$50,000 ‐ $74,999 123,824 23,368 18.9% 2,498 2.0% 97,958 79.1%
$75,000 ‐ $99,999 66,780 16,388 24.5% 670 1.0% 49,722 74.5%
$100,000 + 97,644 27,403 28.1% 1,421 1.5% 68,820 70.5%
WINNIPEG LICO‐125 CLASS
Yes 158,987 22,242 14.0% 2,402 1.5% 134,343 84.5%
No 325,824 70,994 21.8% 4,806 1.5% 250,024 76.7%
INDIGENOUS SELF‐DECLARED ANCESTRY
Yes 51,429 10,489 20.4% 2,737 5.3% 38,204 74.3%
No 409,630 77,712 19.0% 4,081 1.0% 327,837 80.0%
Undeclared 23,751 5,035 21.2% 390 1.6% 18,326 77.2%
FIRST NATION ON RESERVE
FIRST NATION ON RESERVE 15,456 4,301 27.8% 1,412 9.1% 9,744 63.0%
BILL PAYMENT RATING
Excel lent 439,339 85,630 19.5% 6,172 1.4% 347,537 79.1%
Satis factory 22,395 3,687 16.5% 196 0.9% 18,512 85.9%
Poor 23,077 3,919 17.0% 840 3.6% 18,318 79.4%
DWELLING OWNERSHIP
Own 404,316 81,011 20.0% 5,315 1.3% 317,991 78.6%
Rent / Other 80,495 12,226 15.2% 1,893 2.4% 66,376 82.5%
2017 RESIDENTIAL SURVEY SECTION 2 ‐ SPACE HEATING ‐ REFERENCE TABLE 2.16
IS THERE A HEAT RECOVERY VENTILATION SYSTEM (HRV)
Centra Gas Manitoba Inc. 2019/20 General Rate Application Appendix 7.7
March 22, 2019 Page 50 of 228

43
SECTION 3 COOLING SYSTEM
SECTION 3 COOLING SYSTEM
Centra Gas Manitoba Inc. 2019/20 General Rate Application Appendix 7.7
March 22, 2019 Page 51 of 228

44
3.01 Air Conditioning System
TOTAL NO AIR %
HEAT
PUMP % WINDOW % CENTRAL %
SHARED
AIR CON %
OVERALL 484,811 74,394 15.3% 10,167 2.1% 91,916 19.0% 301,217 62.1% 7,117 1.5%
FUEL AREA
Winnipeg City 261,760 24,898 9.5% 3,109 1.2% 44,112 16.9% 183,242 70.0% 6,399 2.4%
Gas Available 140,021 19,510 13.9% 3,901 2.8% 24,119 17.2% 91,774 65.5% 717 0.5%
No Gas Available 83,030 29,986 36.1% 3,157 3.8% 23,685 28.5% 26,201 31.6% 0 0.0%
DWELLING TYPE
Single Detached 373,568 56,577 15.1% 7,550 2.0% 49,593 13.3% 259,848 69.6% 0 0.0%
Multi Attached 46,834 7,753 16.6% 480 1.0% 10,146 21.7% 27,568 58.9% 888 1.9%
Apartment Suite 64,409 10,063 15.6% 2,137 3.3% 32,178 50.0% 13,802 21.4% 6,229 9.7%
BUILDING CODE ERA
2010‐2017 37,645 2,494 6.6% 1,304 3.5% 4,201 11.2% 29,503 78.4% 143 0.4%
1990‐2009 89,181 9,325 10.5% 3,597 4.0% 11,466 12.9% 64,213 72.0% 580 0.7%
1970‐1989 161,749 19,566 12.1% 2,271 1.4% 36,264 22.4% 101,036 62.5% 2,611 1.6%
1950‐1969 110,314 18,318 16.6% 1,696 1.5% 16,894 15.3% 69,767 63.2% 3,639 3.3%
Pre 1950 85,922 24,690 28.7% 1,300 1.5% 23,091 26.9% 36,697 42.7% 143 0.2%
SPACE HEAT FUEL
Electric Heat 191,639 43,512 22.7% 9,007 4.7% 56,967 29.7% 82,154 42.9% 0 0.0%
Natural Gas Heat 249,938 17,208 6.9% 0 0.0% 14,004 5.6% 218,726 87.5% 0 0.0%
Other Fuel 6,945 2,561 36.9% 0 0.0% 4,047 58.3% 337 4.9% 0 0.0%
Shared (No Heat on Bill) 36,289 11,113 30.6% 1,160 3.2% 16,899 46.6% 0 0.0% 7,117 19.6%
PEOPLE PER HOUSEHOLD
One 124,779 26,471 21.2% 1,849 1.5% 33,674 27.0% 59,161 47.4% 3,625 2.9%
Two 221,729 30,295 13.7% 5,594 2.5% 37,406 16.9% 145,676 65.7% 2,758 1.2%
Three 60,069 6,675 11.1% 1,213 2.0% 9,114 15.2% 42,334 70.5% 734 1.2%
Four 48,897 6,473 13.2% 1,182 2.4% 6,597 13.5% 34,645 70.9% 0 0.0%
Five + 29,337 4,481 15.3% 329 1.1% 5,126 17.5% 19,401 66.1% 0 0.0%
HOUSEHOLD INCOME
Less Than $25,000 59,481 19,781 33.3% 1,133 1.9% 20,492 34.5% 17,640 29.7% 434 0.7%
$25,000 ‐ $49,999 137,082 22,590 16.5% 2,139 1.6% 30,219 22.0% 78,069 57.0% 4,065 3.0%
$50,000 ‐ $74,999 123,824 16,074 13.0% 2,336 1.9% 22,496 18.2% 81,758 66.0% 1,160 0.9%
$75,000 ‐ $99,999 66,780 6,870 10.3% 2,057 3.1% 8,686 13.0% 48,733 73.0% 434 0.6%
$100,000 + 97,644 9,078 9.3% 2,501 2.6% 10,024 10.3% 75,016 76.8% 1,024 1.0%
WINNIPEG LICO‐125 CLASS
Yes 158,987 37,157 23.4% 2,241 1.4% 42,278 26.6% 74,115 46.6% 3,195 2.0%
No 325,824 37,237 11.4% 7,926 2.4% 49,638 15.2% 227,102 69.7% 3,922 1.2%
INDIGENOUS SELF‐DECLARED ANCESTRY
Yes 51,429 12,206 23.7% 1,304 2.5% 16,452 32.0% 21,177 41.2% 290 0.6%
No 409,630 59,223 14.5% 8,567 2.1% 71,635 17.5% 263,378 64.3% 6,827 1.7%
Undeclared 23,751 2,964 12.5% 296 1.2% 3,829 16.1% 16,662 70.2% 0 0.0%
FIRST NATION ON RESERVE
FIRST NATION ON RESERVE 15,456 6,181 40.0% 814 5.3% 6,615 42.8% 1,846 11.9% 0 0.0%
BILL PAYMENT RATING
Excellent 439,339 60,940 13.9% 8,982 2.0% 78,246 17.8% 284,053 64.7% 7,117 1.6%
Satisfactory 22,395 5,672 25.3% 479 2.1% 5,609 25.0% 10,635 47.5% 0 0.0%
Poor 23,077 7,781 33.7% 706 3.1% 8,061 34.9% 6,529 28.3% 0 0.0%
DWELLING OWNERSHIP
Own 404,316 54,238 13.4% 8,381 2.1% 54,840 13.6% 284,088 70.3% 2,768 0.7%
Rent / Other 80,495 20,156 25.0% 1,786 2.2% 37,077 46.1% 17,128 21.3% 4,348 5.4%
2017 RESIDENTIAL SURVEY SECTION 3 ‐ COOLING SYSTEM ‐ REFERENCE TABLE 3.01
AIR CONDITIONING SYSTEMS
Centra Gas Manitoba Inc. 2019/20 General Rate Application Appendix 7.7
March 22, 2019 Page 52 of 228

45
3.02 Age (Years) of the Air Conditioning Unit
TOTAL
AVE
AGE
0‐3
YRS %
4‐6
YRS %
7‐9
YRS %
10‐20
YRS %
OVER
20 YRS %
SHARED
AIR CON % NO AIR %
OVERALL 484,811 14.1 82,232 17.0% 61,264 12.6% 48,119 9.9% 107,112 22.1% 104,574 21.6% 7,117 1.5% 74,394 15.3%
FUEL AREA
Winnipeg City 261,760 15.1 44,917 17.2% 34,861 13.3% 28,050 10.7% 53,482 20.4% 69,154 26.4% 6,399 2.4% 24,898 9.5%
Gas Available 140,021 13.4 24,351 17.4% 16,748 12.0% 14,536 10.4% 38,184 27.3% 25,975 18.6% 717 0.5% 19,510 13.9%
No Gas Available 83,030 11.7 12,964 15.6% 9,655 11.6% 5,533 6.7% 15,446 18.6% 9,446 11.4% 0 0.0% 29,986 36.1%
DWELLING TYPE
Single Detached 373,568 13.7 58,931 15.8% 50,383 13.5% 39,719 10.6% 92,988 24.9% 74,969 20.1% 0 0.0% 56,577 15.1%
Multi Attached 46,834 13.9 10,759 23.0% 4,959 10.6% 4,434 9.5% 7,929 16.9% 10,112 21.6% 888 1.9% 7,753 16.6%
Apartment Suite 64,409 17.2 12,542 19.5% 5,922 9.2% 3,966 6.2% 6,194 9.6% 19,492 30.3% 6,229 9.7% 10,063 15.6%
BUILDING CODE ERA
2010‐2017 37,645 2.7 29,557 78.5% 3,400 9.0% 1,663 4.4% 388 1.0% 0 0.0% 143 0.4% 2,494 6.6%
1990‐2009 89,181 11.4 6,743 7.6% 14,879 16.7% 14,260 16.0% 34,371 38.5% 9,024 10.1% 580 0.7% 9,325 10.5%
1970‐1989 161,749 16.9 21,122 13.1% 20,388 12.6% 15,404 9.5% 31,641 19.6% 51,017 31.5% 2,611 1.6% 19,566 12.1%
1950‐1969 110,314 16.8 13,686 12.4% 12,554 11.4% 8,518 7.7% 23,541 21.3% 30,059 27.2% 3,639 3.3% 18,318 16.6%
Pre 1950 85,922 14.0 11,125 12.9% 10,043 11.7% 8,275 9.6% 17,171 20.0% 14,474 16.8% 143 0.2% 24,690 28.7%
SPACE HEAT FUEL
Electric Heat 191,639 12.5 36,914 19.3% 24,472 12.8% 18,256 9.5% 37,338 19.5% 31,148 16.3% 0 0.0% 43,512 22.7%
Natural Gas Heat 249,938 14.7 40,938 16.4% 33,918 13.6% 27,815 11.1% 67,267 26.9% 62,792 25.1% 0 0.0% 17,208 6.9%
Other Fuel 6,945 8.5 1,231 17.7% 1,717 24.7% 0 0.0% 762 11.0% 675 9.7% 0 0.0% 2,561 36.9%
Shared (No Heat on Bill) 36,289 21.6 3,150 8.7% 1,157 3.2% 2,048 5.6% 1,744 4.8% 9,959 27.4% 7,117 19.6% 11,113 30.6%
PEOPLE PER HOUSEHOLD
One 124,779 16.3 17,398 13.9% 12,167 9.8% 9,821 7.9% 23,306 18.7% 31,992 25.6% 3,625 2.9% 26,471 21.2%
Two 221,729 13.7 36,368 16.4% 29,397 13.3% 22,941 10.3% 55,191 24.9% 44,779 20.2% 2,758 1.2% 30,295 13.7%
Three 60,069 13.9 11,236 18.7% 7,656 12.7% 6,682 11.1% 13,637 22.7% 13,450 22.4% 734 1.2% 6,675 11.1%
Four 48,897 12.9 10,362 21.2% 7,482 15.3% 6,209 12.7% 8,605 17.6% 9,765 20.0% 0 0.0% 6,473 13.2%
Five + 29,337 11.7 6,868 23.4% 4,562 15.6% 2,465 8.4% 6,373 21.7% 4,588 15.6% 0 0.0% 4,481 15.3%
HOUSEHOLD INCOME
Less Than $25,000 59,481 16.3 7,065 11.9% 6,752 11.4% 3,081 5.2% 9,279 15.6% 13,090 22.0% 434 0.7% 19,781 33.3%
$25,000 ‐ $49,999 137,082 14.8 21,928 16.0% 14,581 10.6% 12,121 8.8% 30,537 22.3% 31,259 22.8% 4,065 3.0% 22,590 16.5%
$50,000 ‐ $74,999 123,824 14.4 20,938 16.9% 15,979 12.9% 13,039 10.5% 28,165 22.7% 28,470 23.0% 1,160 0.9% 16,074 13.0%
$75,000 ‐ $99,999 66,780 13.8 13,710 20.5% 8,576 12.8% 7,124 10.7% 14,980 22.4% 15,086 22.6% 434 0.6% 6,870 10.3%
$100,000 + 97,644 12.3 18,592 19.0% 15,376 15.7% 12,754 13.1% 24,151 24.7% 16,668 17.1% 1,024 1.0% 9,078 9.3%
WINNIPEG LICO‐125 CLASS
Yes 158,987 15.2 22,714 14.3% 17,956 11.3% 12,654 8.0% 30,150 19.0% 35,161 22.1% 3,195 2.0% 37,157 23.4%
No 325,824 13.7 59,518 18.3% 43,308 13.3% 35,465 10.9% 76,962 23.6% 69,413 21.3% 3,922 1.2% 37,237 11.4%
INDIGENOUS SELF‐DECLARED ANCESTRY
Yes 51,429 12.5 9,180 17.8% 7,904 15.4% 5,387 10.5% 7,970 15.5% 8,492 16.5% 290 0.6% 12,206 23.7%
No 409,630 14.4 68,040 16.6% 49,761 12.1% 39,749 9.7% 95,446 23.3% 90,585 22.1% 6,827 1.7% 59,223 14.5%
Undeclared 23,751 13.1 5,013 21.1% 3,599 15.2% 2,983 12.6% 3,696 15.6% 5,496 23.1% 0 0.0% 2,964 12.5%
FIRST NATION ON RESERVE
FIRST NATION ON RESERVE 15,456 9.6 2,791 18.1% 2,275 14.7% 777 5.0% 2,244 14.5% 1,187 7.7% 0 0.0% 6,181 40.0%
BILL PAYMENT RATING
Excellent 439,339 14.2 74,539 17.0% 55,737 12.7% 44,711 10.2% 99,412 22.6% 96,882 22.1% 7,117 1.6% 60,940 13.9%
Satisfactory 22,395 13.6 4,042 18.0% 2,858 12.8% 2,140 9.6% 3,741 16.7% 3,942 17.6% 0 0.0% 5,672 25.3%
Poor 23,077 13.8 3,651 15.8% 2,668 11.6% 1,267 5.5% 3,959 17.2% 3,750 16.2% 0 0.0% 7,781 33.7%
DWELLING OWNERSHIP
Own 404,316 13.7 67,001 16.6% 53,687 13.3% 43,673 10.8% 99,989 24.7% 82,960 20.5% 2,768 0.7% 54,238 13.4%
Rent / Other 80,495 16.8 15,231 18.9% 7,577 9.4% 4,446 5.5% 7,123 8.8% 21,614 26.9% 4,348 5.4% 20,156 25.0%
AGE (YEARS) OF THE AIR CONDITIONING UNIT
2017 RESIDENTIAL SURVEY SECTION 3 ‐ COOLING SYSTEM ‐ REFERENCE TABLE 3.02
Centra Gas Manitoba Inc. 2019/20 General Rate Application Appendix 7.7
March 22, 2019 Page 53 of 228

46
3.03 Cooling System Original/Replacement
TOTAL ORIGINAL % REPLACED % SHARED % NO AIR %
OVERALL 484,811 180,301 37.2% 222,999 46.0% 7,117 1.5% 74,394 15.3%
FUEL AREA
Winnipeg City 261,760 99,262 37.9% 131,200 50.1% 6,399 2.4% 24,898 9.5%
Gas Ava i lable 140,021 59,897 42.8% 59,897 42.8% 717 0.5% 19,510 13.9%
No Gas Ava i lable 83,030 21,142 25.5% 31,902 38.4% 0 0.0% 29,986 36.1%
DWELLING TYPE
Single Detached 373,568 125,850 33.7% 191,140 51.2% 0 0.0% 56,577 15.1%
Multi Attached 46,834 21,964 46.9% 16,229 34.7% 888 1.9% 7,753 16.6%
Apartment Sui te 64,409 32,487 50.4% 15,630 24.3% 6,229 9.7% 10,063 15.6%
BUILDING CODE ERA
2010‐2017 37,645 35,007 93.0% 0 0.0% 143 0.4% 2,494 6.6%
1990‐2009 89,181 62,972 70.6% 16,304 18.3% 580 0.7% 9,325 10.5%
1970‐1989 161,749 43,904 27.1% 95,667 59.1% 2,611 1.6% 19,566 12.1%
1950‐1969 110,314 25,831 23.4% 62,527 56.7% 3,639 3.3% 18,318 16.6%
Pre 1950 85,922 12,587 14.6% 48,502 56.4% 143 0.2% 24,690 28.7%
SPACE HEAT FUEL
Electric Heat 191,639 73,280 38.2% 74,847 39.1% 0 0.0% 43,512 22.7%
Natura l Gas Heat 249,938 95,819 38.3% 136,911 54.8% 0 0.0% 17,208 6.9%
Other Fuel 6,945 806 11.6% 3,578 51.5% 0 0.0% 2,561 36.9%
Shared (No Heat on Bi l l ) 36,289 10,396 28.6% 7,663 21.1% 7,117 19.6% 11,113 30.6%
PEOPLE PER HOUSEHOLD
One 124,779 44,402 35.6% 50,282 40.3% 3,625 2.9% 26,471 21.2%
Two 221,729 78,557 35.4% 110,119 49.7% 2,758 1.2% 30,295 13.7%
Three 60,069 23,605 39.3% 29,055 48.4% 734 1.2% 6,675 11.1%
Four 48,897 21,688 44.4% 20,735 42.4% 0 0.0% 6,473 13.2%
Five + 29,337 12,048 41.1% 12,807 43.7% 0 0.0% 4,481 15.3%
HOUSEHOLD INCOME
Less Than $25,000 59,481 18,831 31.7% 20,434 34.4% 434 0.7% 19,781 33.3%
$25,000 ‐ $49,999 137,082 45,078 32.9% 65,349 47.7% 4,065 3.0% 22,590 16.5%
$50,000 ‐ $74,999 123,824 46,746 37.8% 59,844 48.3% 1,160 0.9% 16,074 13.0%
$75,000 ‐ $99,999 66,780 28,847 43.2% 30,630 45.9% 434 0.6% 6,870 10.3%
$100,000 + 97,644 40,800 41.8% 46,742 47.9% 1,024 1.0% 9,078 9.3%
WINNIPEG LICO‐125 CLASS
Yes 158,987 52,671 33.1% 65,964 41.5% 3,195 2.0% 37,157 23.4%
No 325,824 127,631 39.2% 157,035 48.2% 3,922 1.2% 37,237 11.4%
INDIGENOUS SELF‐DECLARED ANCESTRY
Yes 51,429 16,524 32.1% 22,409 43.6% 290 0.6% 12,206 23.7%
No 409,630 154,795 37.8% 188,786 46.1% 6,827 1.7% 59,223 14.5%
Undeclared 23,751 8,983 37.8% 11,804 49.7% 0 0.0% 2,964 12.5%
FIRST NATION ON RESERVE
FIRST NATION ON RESERVE 15,456 4,818 31.2% 4,458 28.8% 0 0.0% 6,181 40.0%
BILL PAYMENT RATING
Excel lent 439,339 165,371 37.6% 205,911 46.9% 7,117 1.6% 60,940 13.9%
Satis factory 22,395 7,707 34.4% 9,015 40.3% 0 0.0% 5,672 25.3%
Poor 23,077 7,223 31.3% 8,072 35.0% 0 0.0% 7,781 33.7%
DWELLING OWNERSHIP
Own 404,316 145,474 36.0% 201,836 49.9% 2,768 0.7% 54,238 13.4%
Rent / Other 80,495 34,828 43.3% 21,163 26.3% 4,348 5.4% 20,156 25.0%
2017 RESIDENTIAL SURVEY SECTION 3 ‐ COOLING SYSTEM ‐ REFERENCE TABLE 3.03
COOLING SYSTEM ORIGINAL/REPLACEMENT
Centra Gas Manitoba Inc. 2019/20 General Rate Application Appendix 7.7
March 22, 2019 Page 54 of 228

47
3.04 Thermostat Turned Down At Night
TOTAL
EVERY
NIGHT % MOST %
OCCASSI
ONALLY % NEVER %
PROGRAM
MED % SHARED %
NO AIR
CONDITIONING %
OVERALL 484,811 77,025 15.9% 42,532 8.8% 101,392 20.9% 110,875 22.9% 71,476 14.7% 7,117 1.5% 74,394 15.3%
FUEL AREA
Winnipeg City 261,760 41,671 15.9% 25,609 9.8% 55,791 21.3% 59,104 22.6% 48,287 18.4% 6,399 2.4% 24,898 9.5%
Gas Ava i lable 140,021 25,628 18.3% 11,347 8.1% 30,970 22.1% 33,927 24.2% 17,922 12.8% 717 0.5% 19,510 13.9%
No Gas Avai lable 83,030 9,726 11.7% 5,576 6.7% 14,630 17.6% 17,844 21.5% 5,267 6.3% 0 0.0% 29,986 36.1%
DWELLING TYPE
Single Detached 373,568 59,095 15.8% 31,101 8.3% 79,174 21.2% 85,097 22.8% 62,524 16.7% 0 0.0% 56,577 15.1%
Multi Attached 46,834 7,426 15.9% 4,626 9.9% 9,037 19.3% 10,932 23.3% 6,172 13.2% 888 1.9% 7,753 16.6%
Apartment Sui te 64,409 10,505 16.3% 6,805 10.6% 13,181 20.5% 14,846 23.0% 2,780 4.3% 6,229 9.7% 10,063 15.6%
BUILDING CODE ERA
2010‐2017 37,645 8,316 22.1% 3,397 9.0% 6,269 16.7% 10,141 26.9% 6,884 18.3% 143 0.4% 2,494 6.6%
1990‐2009 89,181 16,332 18.3% 7,727 8.7% 20,039 22.5% 20,665 23.2% 14,513 16.3% 580 0.7% 9,325 10.5%
1970‐1989 161,749 24,484 15.1% 13,786 8.5% 35,138 21.7% 42,687 26.4% 23,477 14.5% 2,611 1.6% 19,566 12.1%
1950‐1969 110,314 15,735 14.3% 10,648 9.7% 22,971 20.8% 21,446 19.4% 17,558 15.9% 3,639 3.3% 18,318 16.6%
Pre 1950 85,922 12,159 14.2% 6,974 8.1% 16,975 19.8% 15,936 18.5% 9,045 10.5% 143 0.2% 24,690 28.7%
SPACE HEAT FUEL
Electric Heat 191,639 29,830 15.6% 16,689 8.7% 39,316 20.5% 45,109 23.5% 17,184 9.0% 0 0.0% 43,512 22.7%
Natura l Gas Heat 249,938 42,009 16.8% 23,078 9.2% 55,324 22.1% 59,209 23.7% 53,110 21.2% 0 0.0% 17,208 6.9%
Other Fuel 6,945 1,702 24.5% 0 0.0% 556 8.0% 1,524 21.9% 602 8.7% 0 0.0% 2,561 36.9%
Shared (No Heat on Bi l l ) 36,289 3,485 9.6% 2,765 7.6% 6,195 17.1% 5,034 13.9% 580 1.6% 7,117 19.6% 11,113 30.6%
PEOPLE PER HOUSEHOLD
One 124,779 15,858 12.7% 10,202 8.2% 24,941 20.0% 31,805 25.5% 11,878 9.5% 3,625 2.9% 26,471 21.2%
Two 221,729 39,377 17.8% 20,228 9.1% 47,889 21.6% 49,632 22.4% 31,550 14.2% 2,758 1.2% 30,295 13.7%
Three 60,069 9,559 15.9% 5,441 9.1% 12,427 20.7% 14,201 23.6% 11,032 18.4% 734 1.2% 6,675 11.1%
Four 48,897 8,913 18.2% 3,936 8.0% 8,775 17.9% 8,913 18.2% 11,887 24.3% 0 0.0% 6,473 13.2%
Five + 29,337 3,319 11.3% 2,725 9.3% 7,358 25.1% 6,324 21.6% 5,129 17.5% 0 0.0% 4,481 15.3%
HOUSEHOLD INCOME
LESS THAN $25,000 59,481 7,112 12.0% 4,308 7.2% 10,326 17.4% 13,966 23.5% 3,554 6.0% 434 0.7% 19,781 33.3%
$25,000 ‐ $49,999 137,082 21,468 15.7% 11,450 8.4% 29,522 21.5% 33,986 24.8% 14,002 10.2% 4,065 3.0% 22,590 16.5%
$50,000 ‐ $74,999 123,824 18,492 14.9% 11,912 9.6% 28,813 23.3% 28,455 23.0% 18,917 15.3% 1,160 0.9% 16,074 13.0%
$75,000 ‐ $99,999 66,780 10,278 15.4% 5,440 8.1% 14,279 21.4% 15,029 22.5% 14,451 21.6% 434 0.6% 6,870 10.3%
$100,000 + 97,644 19,676 20.2% 9,421 9.6% 18,452 18.9% 19,439 19.9% 20,553 21.0% 1,024 1.0% 9,078 9.3%
WINNIPEG LICO‐125 CLASS
Yes 158,987 20,810 13.1% 13,127 8.3% 31,667 19.9% 37,883 23.8% 15,147 9.5% 3,195 2.0% 37,157 23.4%
No 325,824 56,215 17.3% 29,404 9.0% 69,725 21.4% 72,992 22.4% 56,329 17.3% 3,922 1.2% 37,237 11.4%
INDIGENOUS SELF‐DECLARED ANCESTRY
Yes 51,429 5,820 11.3% 3,775 7.3% 13,551 26.3% 11,233 21.8% 4,554 8.9% 290 0.6% 12,206 23.7%
No 409,630 67,926 16.6% 37,136 9.1% 83,036 20.3% 92,755 22.6% 62,728 15.3% 6,827 1.7% 59,223 14.5%
Undeclared 23,751 3,279 13.8% 1,621 6.8% 4,805 20.2% 6,888 29.0% 4,194 17.7% 0 0.0% 2,964 12.5%
FIRST NATION ON RESERVE
FIRST NATION ON RESERVE 15,456 1,405 9.1% 845 5.5% 3,619 23.4% 3,002 19.4% 404 2.6% 0 0.0% 6,181 40.0%
BILL PAYMENT RATING
Excel lent 439,339 71,330 16.2% 38,746 8.8% 91,136 20.7% 102,265 23.3% 67,804 15.4% 7,117 1.6% 60,940 13.9%
Sati s factory 22,395 2,598 11.6% 1,774 7.9% 5,082 22.7% 4,640 20.7% 2,628 11.7% 0 0.0% 5,672 25.3%
Poor 23,077 3,097 13.4% 2,011 8.7% 5,174 22.4% 3,970 17.2% 1,044 4.5% 0 0.0% 7,781 33.7%
DWELLING OWNERSHIP
Own 404,316 65,548 16.2% 35,215 8.7% 84,619 20.9% 93,833 23.2% 68,094 16.8% 2,768 0.7% 54,238 13.4%
Rent / Other 80,495 11,477 14.3% 7,317 9.1% 16,773 20.8% 17,043 21.2% 3,382 4.2% 4,348 5.4% 20,156 25.0%
2017 RESIDENTIAL SURVEY SECTION 3 ‐ COOLING SYSTEM ‐ REFERENCE TABLE 3.04
IS THE THERMOSTAT TURNED DOWN AT NIGHT
Centra Gas Manitoba Inc. 2019/20 General Rate Application Appendix 7.7
March 22, 2019 Page 55 of 228

48
Centra Gas Manitoba Inc. 2019/20 General Rate Application Appendix 7.7
March 22, 2019 Page 56 of 228

49
SECTION 4 RESIDENTIAL HOT WATER
SECTION 4 RESIDENTIAL HOT WATER
Centra Gas Manitoba Inc. 2019/20 General Rate Application Appendix 7.7
March 22, 2019 Page 57 of 228

50
4.01 Hot Water Tank Types
TOTAL NO TANK %
SHARED
WATER % PRIVATE % TANKLESS %
OVERALL 484,811 753 0.2% 54,567 11.3% 427,210 88.1% 2,282 0.5%
FUEL AREA
Winnipeg City 261,760 0 0.0% 48,550 18.5% 212,120 81.0% 1,090 0.4%
Gas Avai lable 140,021 100 0.1% 4,983 3.6% 134,635 96.2% 302 0.2%
No Gas Avai lable 83,030 652 0.8% 1,034 1.2% 80,454 96.9% 890 1.1%
DWELLING TYPE
Single Detached 373,568 753 0.2% 0 0.0% 371,188 99.4% 1,627 0.4%
Multi Attached 46,834 0 0.0% 2,996 6.4% 43,838 93.6% 0 0.0%
Apartment Sui te 64,409 0 0.0% 51,571 80.1% 12,184 18.9% 655 1.0%
BUILDING CODE ERA
2010‐2017 37,645 0 0.0% 3,545 9.4% 33,648 89.4% 452 1.2%
1990‐2009 89,181 62 0.1% 8,055 9.0% 80,439 90.2% 625 0.7%
1970‐1989 161,749 367 0.2% 17,189 10.6% 143,785 88.9% 407 0.3%
1950‐1969 110,314 112 0.1% 16,673 15.1% 93,124 84.4% 405 0.4%
Pre 1950 85,922 212 0.2% 9,104 10.6% 76,213 88.7% 393 0.5%
SPACE HEAT FUEL
Electric Heat 191,639 622 0.3% 20,049 10.5% 169,773 88.6% 1,195 0.6%
Natural Gas Heat 249,938 0 0.0% 1,602 0.6% 247,877 99.2% 459 0.2%
Other Fuel 6,945 131 1.9% 0 0.0% 6,476 93.3% 337 4.9%
Shared (No Heat on Bi l l ) 36,289 0 0.0% 32,916 90.7% 3,083 8.5% 290 0.8%
PEOPLE PER HOUSEHOLD
One 124,779 691 0.6% 29,150 23.4% 93,619 75.0% 1,320 1.1%
Two 221,729 31 0.0% 20,895 9.4% 200,133 90.3% 670 0.3%
Three 60,069 0 0.0% 3,473 5.8% 56,597 94.2% 0 0.0%
Four 48,897 0 0.0% 616 1.3% 48,020 98.2% 261 0.5%
Five + 29,337 31 0.1% 434 1.5% 28,841 98.3% 31 0.1%
HOUSEHOLD INCOME
Less Than $25,000 59,481 417 0.7% 11,681 19.6% 46,953 78.9% 430 0.7%
$25,000 ‐ $49,999 137,082 162 0.1% 19,784 14.4% 116,188 84.8% 947 0.7%
$50,000 ‐ $74,999 123,824 143 0.1% 13,556 10.9% 109,673 88.6% 452 0.4%
$75,000 ‐ $99,999 66,780 0 0.0% 4,384 6.6% 62,396 93.4% 0 0.0%
$100,000 + 97,644 31 0.0% 5,161 5.3% 91,999 94.2% 453 0.5%
WINNIPEG LICO‐125 CLASS
Yes 158,987 579 0.4% 23,519 14.8% 134,142 84.4% 746 0.5%
No 325,824 174 0.1% 31,047 9.5% 293,067 89.9% 1,536 0.5%
INDIGENOUS SELF‐DECLARED ANCESTRY
Yes 51,429 318 0.6% 4,722 9.2% 46,061 89.6% 329 0.6%
No 409,630 435 0.1% 48,868 11.9% 358,374 87.5% 1,953 0.5%
Undeclared 23,751 0 0.0% 977 4.1% 22,775 95.9% 0 0.0%
FIRST NATION ON RESERVE
FIRST NATION ON RESERVE 15,456 318 2.1% 131 0.8% 14,790 95.7% 218 1.4%
BILL PAYMENT RATING
Excel lent 439,339 435 0.1% 49,319 11.2% 387,489 88.2% 2,095 0.5%
Satis factory 22,395 193 0.9% 2,011 9.0% 20,129 89.9% 62 0.3%
Poor 23,077 124 0.5% 3,237 14.0% 19,592 84.9% 124 0.5%
DWELLING OWNERSHIP
Own 404,316 559 0.1% 15,179 3.8% 387,055 95.7% 1,523 0.4%
Rent / Other 80,495 193 0.2% 39,388 48.9% 40,154 49.9% 759 0.9%
2017 RESIDENTIAL SURVEY SECTION 4 ‐ RESIDENTIAL HOT WATER ‐ REFERENCE TABLE 4.01
HOT WATER TANK TYPES
Centra Gas Manitoba Inc. 2019/20 General Rate Application Appendix 7.7
March 22, 2019 Page 58 of 228

51
4.02 Hot Water Heater Fuels
TOTAL ELECTRIC %
NATURAL
GAS % PROPANE %
FUEL
OIL % WOOD % SOLAR % OTHER %
NO
HEATER %
SHARED
WATER %
OVERALL 484,811 244,689 50.5% 180,327 37.2% 3,908 0.8% 393 0.1% 174 0.0% 0 0.0% 0 0.0% 753 0.2% 54,567 11.3%
FUEL AREA
Winnipeg City 261,760 70,771 27.0% 140,059 53.5% 2,380 0.9% 0 0.0% 0 0.0% 0 0.0% 0 0.0% 0 0.0% 48,550 18.5%
Gas Avai lable 140,021 93,762 67.0% 40,268 28.8% 907 0.6% 0 0.0% 0 0.0% 0 0.0% 0 0.0% 100 0.1% 4,983 3.6%
No Gas Avai lable 83,030 80,156 96.5% 0 0.0% 620 0.7% 393 0.5% 174 0.2% 0 0.0% 0 0.0% 652 0.8% 1,034 1.2%
DWELLING TYPE
Single Detached 373,568 210,374 56.3% 160,852 43.1% 1,022 0.3% 393 0.1% 174 0.0% 0 0.0% 0 0.0% 753 0.2% 0 0.0%
Multi Attached 46,834 22,650 48.4% 18,957 40.5% 2,231 4.8% 0 0.0% 0 0.0% 0 0.0% 0 0.0% 0 0.0% 2,996 6.4%
Apartment Suite 64,409 11,666 18.1% 518 0.8% 655 1.0% 0 0.0% 0 0.0% 0 0.0% 0 0.0% 0 0.0% 51,571 80.1%
BUILDING CODE ERA
2010‐2017 37,645 30,701 81.6% 3,039 8.1% 360 1.0% 0 0.0% 0 0.0% 0 0.0% 0 0.0% 0 0.0% 3,545 9.4%
1990‐2009 89,181 56,607 63.5% 23,354 26.2% 648 0.7% 393 0.4% 62 0.1% 0 0.0% 0 0.0% 62 0.1% 8,055 9.0%
1970‐1989 161,749 76,336 47.2% 66,835 41.3% 1,021 0.6% 0 0.0% 0 0.0% 0 0.0% 0 0.0% 367 0.2% 17,189 10.6%
1950‐1969 110,314 41,019 37.2% 52,298 47.4% 100 0.1% 0 0.0% 112 0.1% 0 0.0% 0 0.0% 112 0.1% 16,673 15.1%
Pre 1950 85,922 40,025 46.6% 34,802 40.5% 1,779 2.1% 0 0.0% 0 0.0% 0 0.0% 0 0.0% 212 0.2% 9,104 10.6%
SPACE HEAT FUEL
Electric Heat 191,639 166,952 87.1% 1,113 0.6% 2,730 1.4% 0 0.0% 174 0.1% 0 0.0% 0 0.0% 622 0.3% 20,049 10.5%
Natural Gas Heat 249,938 69,122 27.7% 179,214 71.7% 0 0.0% 0 0.0% 0 0.0% 0 0.0% 0 0.0% 0 0.0% 1,602 0.6%
Other Fuel 6,945 6,420 92.4% 0 0.0% 0 0.0% 393 5.7% 0 0.0% 0 0.0% 0 0.0% 131 1.9% 0 0.0%
Shared (No Heat on Bi l l ) 36,289 2,195 6.0% 0 0.0% 1,178 3.2% 0 0.0% 0 0.0% 0 0.0% 0 0.0% 0 0.0% 32,916 90.7%
PEOPLE PER HOUSEHOLD
One 124,779 54,583 43.7% 39,117 31.3% 1,178 0.9% 0 0.0% 62 0.0% 0 0.0% 0 0.0% 691 0.6% 29,150 23.4%
Two 221,729 115,765 52.2% 82,557 37.2% 2,238 1.0% 131 0.1% 112 0.1% 0 0.0% 0 0.0% 31 0.0% 20,895 9.4%
Three 60,069 29,266 48.7% 27,199 45.3% 131 0.2% 0 0.0% 0 0.0% 0 0.0% 0 0.0% 0 0.0% 3,473 5.8%
Four 48,897 26,188 53.6% 21,962 44.9% 0 0.0% 131 0.3% 0 0.0% 0 0.0% 0 0.0% 0 0.0% 616 1.3%
Five + 29,337 18,887 64.4% 9,493 32.4% 360 1.2% 131 0.4% 0 0.0% 0 0.0% 0 0.0% 31 0.1% 434 1.5%
HOUSEHOLD INCOME
Less Than $25,000 59,481 34,145 57.4% 12,201 20.5% 581 1.0% 393 0.7% 62 0.1% 0 0.0% 0 0.0% 417 0.7% 11,681 19.6%
$25,000 ‐ $49,999 137,082 68,693 50.1% 46,772 34.1% 1,559 1.1% 0 0.0% 112 0.1% 0 0.0% 0 0.0% 162 0.1% 19,784 14.4%
$50,000 ‐ $74,999 123,824 59,287 47.9% 50,187 40.5% 651 0.5% 0 0.0% 0 0.0% 0 0.0% 0 0.0% 143 0.1% 13,556 10.9%
$75,000 ‐ $99,999 66,780 34,753 52.0% 27,543 41.2% 100 0.2% 0 0.0% 0 0.0% 0 0.0% 0 0.0% 0 0.0% 4,384 6.6%
$100,000 + 97,644 47,811 49.0% 43,625 44.7% 1,016 1.0% 0 0.0% 0 0.0% 0 0.0% 0 0.0% 31 0.0% 5,161 5.3%
WINNIPEG LICO‐125 CLASS
Yes 158,987 86,626 54.5% 46,375 29.2% 1,433 0.9% 393 0.2% 62 0.0% 0 0.0% 0 0.0% 579 0.4% 23,519 14.8%
No 325,824 158,064 48.5% 133,953 41.1% 2,475 0.8% 0 0.0% 112 0.0% 0 0.0% 0 0.0% 174 0.1% 31,047 9.5%
INDIGENOUS SELF‐DECLARED ANCESTRY
Yes 51,429 33,680 65.5% 11,658 22.7% 596 1.2% 393 0.8% 62 0.1% 0 0.0% 0 0.0% 318 0.6% 4,722 9.2%
No 409,630 199,377 48.7% 157,527 38.5% 3,311 0.8% 0 0.0% 112 0.0% 0 0.0% 0 0.0% 435 0.1% 48,868 11.9%
Undeclared 23,751 11,633 49.0% 11,142 46.9% 0 0.0% 0 0.0% 0 0.0% 0 0.0% 0 0.0% 0 0.0% 977 4.1%
FIRST NATION ON RESERVE
FIRST NATION ON RESERVE 15,456 14,621 94.6% 0 0.0% 62 0.4% 262 1.7% 62 0.4% 0 0.0% 0 0.0% 318 2.1% 131 0.8%
BILL PAYMENT RATING
Excel lent 439,339 216,878 49.4% 169,012 38.5% 3,290 0.7% 262 0.1% 143 0.0% 0 0.0% 0 0.0% 435 0.1% 49,319 11.2%
Sati s factory 22,395 12,721 56.8% 7,439 33.2% 31 0.1% 0 0.0% 0 0.0% 0 0.0% 0 0.0% 193 0.9% 2,011 9.0%
Poor 23,077 15,091 65.4% 3,876 16.8% 586 2.5% 131 0.6% 31 0.1% 0 0.0% 0 0.0% 124 0.5% 3,237 14.0%
DWELLING OWNERSHIP
Own 404,316 214,680 53.1% 171,486 42.4% 2,270 0.6% 0 0.0% 143 0.0% 0 0.0% 0 0.0% 559 0.1% 15,179 3.8%
Rent / Other 80,495 30,009 37.3% 8,842 11.0% 1,638 2.0% 393 0.5% 31 0.0% 0 0.0% 0 0.0% 193 0.2% 39,388 48.9%
2017 RESIDENTIAL SURVEY SECTION 4 ‐ RESIDENTIAL HOT WATER ‐ REFERENCE TABLE 4.02
HOT WATER HEATER FUELS
Centra Gas Manitoba Inc. 2019/20 General Rate Application Appendix 7.7
March 22, 2019 Page 59 of 228

52
4.03 Age (Years) of Water Heater
TOTAL
AVE
AGE
0‐3
YRS %
4‐6
YRS %
7‐9
YRS %
10‐15
YRS %
OVER
15 YRS %
NO
HEATER %
SHARED
WATER %
OVERALL 484,811 7.6 128,160 26.4% 98,875 20.4% 76,268 15.7% 90,356 18.6% 35,833 7.4% 753 0.2% 54,567 11.3%
FUEL AREA
Winnipeg City 261,760 6.9 66,177 25.3% 50,411 19.3% 42,345 16.2% 44,394 17.0% 9,883 3.8% 0 0.0% 48,550 18.5%
Gas Ava i lable 140,021 7.8 42,426 30.3% 30,975 22.1% 21,942 15.7% 24,263 17.3% 15,333 11.0% 100 0.1% 4,983 3.6%
No Gas Avai lable 83,030 9.0 19,557 23.6% 17,489 21.1% 11,981 14.4% 21,700 26.1% 10,617 12.8% 652 0.8% 1,034 1.2%
DWELLING TYPE
Single Detached 373,568 7.7 108,298 29.0% 87,772 23.5% 66,555 17.8% 77,595 20.8% 32,595 8.7% 753 0.2% 0 0.0%
Multi Attached 46,834 7.0 14,741 31.5% 9,652 20.6% 8,242 17.6% 8,617 18.4% 2,587 5.5% 0 0.0% 2,996 6.4%
Apartment Sui te 64,409 6.9 5,122 8.0% 1,451 2.3% 1,471 2.3% 4,144 6.4% 651 1.0% 0 0.0% 51,571 80.1%
BUILDING CODE ERA
2010‐2017 37,645 2.8 28,425 75.5% 2,925 7.8% 2,065 5.5% 686 1.8% 0 0.0% 0 0.0% 3,545 9.4%
1990‐2009 89,181 8.2 18,803 21.1% 22,399 25.1% 14,929 16.7% 13,847 15.5% 11,087 12.4% 62 0.1% 8,055 9.0%
1970‐1989 161,749 8.2 35,948 22.2% 34,200 21.1% 25,784 15.9% 35,212 21.8% 13,048 8.1% 367 0.2% 17,189 10.6%
1950‐1969 110,314 7.4 26,562 24.1% 20,892 18.9% 18,136 16.4% 21,774 19.7% 6,166 5.6% 112 0.1% 16,673 15.1%
Pre 1950 85,922 8.0 18,422 21.4% 18,460 21.5% 15,354 17.9% 18,837 21.9% 5,533 6.4% 212 0.2% 9,104 10.6%
SPACE HEAT FUEL
Electric Heat 191,639 8.4 48,344 25.2% 37,084 19.4% 26,652 13.9% 39,248 20.5% 19,641 10.2% 622 0.3% 20,049 10.5%
Natural Gas Heat 249,938 7.0 78,037 31.2% 59,165 23.7% 47,185 18.9% 48,445 19.4% 15,505 6.2% 0 0.0% 1,602 0.6%
Other Fuel 6,945 8.4 1,202 17.3% 2,039 29.4% 1,099 15.8% 1,786 25.7% 687 9.9% 131 1.9% 0 0.0%
Shared (No Heat on Bi l l ) 36,289 7.9 577 1.6% 587 1.6% 1,331 3.7% 877 2.4% 0 0.0% 0 0.0% 32,916 90.7%
PEOPLE PER HOUSEHOLD
One 124,779 8.0 25,892 20.8% 19,837 15.9% 15,966 12.8% 24,475 19.6% 8,769 7.0% 691 0.6% 29,150 23.4%
Two 221,729 7.6 58,665 26.5% 48,496 21.9% 36,529 16.5% 40,171 18.1% 16,941 7.6% 31 0.0% 20,895 9.4%
Three 60,069 7.5 17,274 28.8% 12,506 20.8% 10,888 18.1% 11,410 19.0% 4,518 7.5% 0 0.0% 3,473 5.8%
Four 48,897 6.9 16,083 32.9% 12,236 25.0% 8,241 16.9% 8,418 17.2% 3,303 6.8% 0 0.0% 616 1.3%
Five + 29,337 7.3 10,245 34.9% 5,799 19.8% 4,644 15.8% 5,883 20.1% 2,301 7.8% 31 0.1% 434 1.5%
HOUSEHOLD INCOME
Less Than $25,000 59,481 8.6 11,846 19.9% 9,383 15.8% 7,036 11.8% 13,905 23.4% 5,213 8.8% 417 0.7% 11,681 19.6%
$25,000 ‐ $49,999 137,082 8.1 32,095 23.4% 25,005 18.2% 21,113 15.4% 26,889 19.6% 12,033 8.8% 162 0.1% 19,784 14.4%
$50,000 ‐ $74,999 123,824 7.3 33,166 26.8% 29,705 24.0% 17,930 14.5% 20,697 16.7% 8,628 7.0% 143 0.1% 13,556 10.9%
$75,000 ‐ $99,999 66,780 7.2 21,188 31.7% 13,424 20.1% 10,556 15.8% 12,507 18.7% 4,721 7.1% 0 0.0% 4,384 6.6%
$100,000 + 97,644 6.9 29,865 30.6% 21,358 21.9% 19,633 20.1% 16,358 16.8% 5,237 5.4% 31 0.0% 5,161 5.3%
WINNIPEG LICO‐125 CLASS
Yes 158,987 8.2 36,635 23.0% 28,351 17.8% 22,672 14.3% 34,390 21.6% 12,841 8.1% 579 0.4% 23,519 14.8%
No 325,824 7.3 91,525 28.1% 70,524 21.6% 53,596 16.4% 55,966 17.2% 22,992 7.1% 174 0.1% 31,047 9.5%
INDIGENOUS SELF‐DECLARED ANCESTRY
Yes 51,429 7.7 14,269 27.7% 11,239 21.9% 6,432 12.5% 9,542 18.6% 4,908 9.5% 318 0.6% 4,722 9.2%
No 409,630 7.6 107,096 26.1% 82,348 20.1% 65,488 16.0% 76,135 18.6% 29,260 7.1% 435 0.1% 48,868 11.9%
Undeclared 23,751 7.3 6,794 28.6% 5,289 22.3% 4,348 18.3% 4,679 19.7% 1,665 7.0% 0 0.0% 977 4.1%
FIRST NATION ON RESERVE
FIRST NATION ON RESERVE 15,456 9.1 3,766 24.4% 3,033 19.6% 1,784 11.5% 4,123 26.7% 2,301 14.9% 318 2.1% 131 0.8%
BILL PAYMENT RATING
Excel lent 439,339 7.4 118,521 27.0% 90,163 20.5% 69,140 15.7% 80,812 18.4% 30,949 7.0% 435 0.1% 49,319 11.2%
Sati s factory 22,395 8.5 5,436 24.3% 4,194 18.7% 3,568 15.9% 4,735 21.1% 2,258 10.1% 193 0.9% 2,011 9.0%
Poor 23,077 9.0 4,203 18.2% 4,518 19.6% 3,560 15.4% 4,809 20.8% 2,626 11.4% 124 0.5% 3,237 14.0%
DWELLING OWNERSHIP
Own 404,316 7.5 114,617 28.3% 92,364 22.8% 72,193 17.9% 77,360 19.1% 32,044 7.9% 559 0.1% 15,179 3.8%
Rent / Other 80,495 8.2 13,542 16.8% 6,511 8.1% 4,075 5.1% 12,996 16.1% 3,789 4.7% 193 0.2% 39,388 48.9%
2017 RESIDENTIAL SURVEY SECTION 4 ‐ RESIDENTIAL HOT WATER ‐ REFERENCE TABLE 4.03
AGE (YEARS) OF THE HOT WATER HEATER
Centra Gas Manitoba Inc. 2019/20 General Rate Application Appendix 7.7
March 22, 2019 Page 60 of 228

53
4.04 Water Heater Fuel Switching
TOTAL
SAME
FUEL %
N.GAS
TO
ELECTRIC %
ELECTRIC
TO
N.GAS % OTHER %
NO
HEATER %
SHARED
WATER %
OVERALL 484,811 378,324 78.0% 40,596 8.4% 6,200 1.3% 4,371 0.9% 753 0.2% 54,567 11.3%
FUEL AREA
Winnipeg City 261,760 177,017 67.6% 31,953 12.2% 3,253 1.2% 988 0.4% 0 0.0% 48,550 18.5%
Gas Ava i lable 140,021 122,789 87.7% 8,421 6.0% 2,916 2.1% 812 0.6% 100 0.1% 4,983 3.6%
No Gas Avai lable 83,030 78,518 94.6% 223 0.3% 31 0.0% 2,571 3.1% 652 0.8% 1,034 1.2%
DWELLING TYPE
Single Detached 373,568 326,282 87.3% 36,858 9.9% 6,046 1.6% 3,629 1.0% 753 0.2% 0 0.0%
Multi Attached 46,834 39,509 84.4% 3,432 7.3% 154 0.3% 742 1.6% 0 0.0% 2,996 6.4%
Apartment Sui te 64,409 12,532 19.5% 306 0.5% 0 0.0% 0 0.0% 0 0.0% 51,571 80.1%
BUILDING CODE ERA
2010‐2017 37,645 33,622 89.3% 103 0.3% 0 0.0% 376 1.0% 0 0.0% 3,545 9.4%
1990‐2009 89,181 76,004 85.2% 3,644 4.1% 236 0.3% 1,180 1.3% 62 0.1% 8,055 9.0%
1970‐1989 161,749 126,844 78.4% 14,756 9.1% 1,460 0.9% 1,132 0.7% 367 0.2% 17,189 10.6%
1950‐1969 110,314 76,820 69.6% 13,937 12.6% 2,234 2.0% 538 0.5% 112 0.1% 16,673 15.1%
Pre 1950 85,922 65,034 75.7% 8,157 9.5% 2,269 2.6% 1,146 1.3% 212 0.2% 9,104 10.6%
SPACE HEAT FUEL
Electric Heat 191,639 164,726 86.0% 2,658 1.4% 384 0.2% 3,202 1.7% 622 0.3% 20,049 10.5%
Natura l Gas Heat 249,938 204,130 81.7% 37,352 14.9% 5,816 2.3% 1,038 0.4% 0 0.0% 1,602 0.6%
Other Fuel 6,945 6,683 96.2% 0 0.0% 0 0.0% 131 1.9% 131 1.9% 0 0.0%
Shared (No Heat on Bi l l ) 36,289 2,786 7.7% 587 1.6% 0 0.0% 0 0.0% 0 0.0% 32,916 90.7%
PEOPLE PER HOUSEHOLD
One 124,779 86,280 69.1% 5,974 4.8% 2,171 1.7% 513 0.4% 691 0.6% 29,150 23.4%
Two 221,729 175,082 79.0% 20,882 9.4% 2,975 1.3% 1,864 0.8% 31 0.0% 20,895 9.4%
Three 60,069 48,615 80.9% 6,935 11.5% 619 1.0% 428 0.7% 0 0.0% 3,473 5.8%
Four 48,897 42,338 86.6% 4,818 9.9% 217 0.4% 907 1.9% 0 0.0% 616 1.3%
Five + 29,337 26,009 88.7% 1,987 6.8% 217 0.7% 659 2.2% 31 0.1% 434 1.5%
HOUSEHOLD INCOME
Less Than $25,000 59,481 43,771 73.6% 2,375 4.0% 248 0.4% 989 1.7% 417 0.7% 11,681 19.6%
$25,000 ‐ $49,999 137,082 102,257 74.6% 10,709 7.8% 2,370 1.7% 1,800 1.3% 162 0.1% 19,784 14.4%
$50,000 ‐ $74,999 123,824 97,608 78.8% 9,891 8.0% 1,965 1.6% 662 0.5% 143 0.1% 13,556 10.9%
$75,000 ‐ $99,999 66,780 54,372 81.4% 7,152 10.7% 640 1.0% 232 0.3% 0 0.0% 4,384 6.6%
$100,000 + 97,644 80,316 82.3% 10,470 10.7% 978 1.0% 688 0.7% 31 0.0% 5,161 5.3%
WINNIPEG LICO‐125 CLASS
Yes 158,987 120,453 75.8% 10,340 6.5% 1,435 0.9% 2,661 1.7% 579 0.4% 23,519 14.8%
No 325,824 257,871 79.1% 30,256 9.3% 4,765 1.5% 1,710 0.5% 174 0.1% 31,047 9.5%
INDIGENOUS SELF‐DECLARED ANCESTRY
Yes 51,429 42,132 81.9% 2,117 4.1% 351 0.7% 1,790 3.5% 318 0.6% 4,722 9.2%
No 409,630 316,763 77.3% 35,620 8.7% 5,632 1.4% 2,312 0.6% 435 0.1% 48,868 11.9%
Undeclared 23,751 19,429 81.8% 2,859 12.0% 217 0.9% 269 1.1% 0 0.0% 977 4.1%
FIRST NATION ON RESERVE
FIRST NATION ON RESERVE 15,456 13,565 87.8% 0 0.0% 31 0.2% 1,412 9.1% 318 2.1% 131 0.8%
BILL PAYMENT RATING
Excel lent 439,339 340,807 77.6% 39,156 8.9% 6,200 1.4% 3,422 0.8% 435 0.1% 49,319 11.2%
Sati s factory 22,395 18,768 83.8% 1,097 4.9% 0 0.0% 327 1.5% 193 0.9% 2,011 9.0%
Poor 23,077 18,750 81.2% 344 1.5% 0 0.0% 622 2.7% 124 0.5% 3,237 14.0%
DWELLING OWNERSHIP
Own 404,316 339,089 83.9% 40,319 10.0% 6,015 1.5% 3,156 0.8% 559 0.1% 15,179 3.8%
Rent / Other 80,495 39,235 48.7% 278 0.3% 185 0.2% 1,215 1.5% 193 0.2% 39,388 48.9%
2017 RESIDENTIAL SURVEY SECTION 4 ‐ RESIDENTIAL HOT WATER ‐ REFERENCE TABLE 4.04
WATER HEATER FUEL SWITCHING
Centra Gas Manitoba Inc. 2019/20 General Rate Application Appendix 7.7
March 22, 2019 Page 61 of 228

54
4.05 Total Number of Showers Taken per Day
TOTAL NEVER % RARELY % ONE % TWO %
THREE
OR
MORE %
NO
HEATER %
SHARED
WATER %
OVERALL 484,811 27,413 5.7% 26,169 5.4% 158,117 32.6% 138,587 28.6% 79,205 16.3% 753 0.2% 54,567 11.3%
FUEL AREA
Winnipeg City 261,760 11,982 4.6% 11,980 4.6% 76,893 29.4% 69,513 26.6% 42,842 16.4% 0 0.0% 48,550 18.5%
Gas Avai lable 140,021 9,020 6.4% 7,838 5.6% 49,819 35.6% 45,534 32.5% 22,727 16.2% 100 0.1% 4,983 3.6%
No Gas Avai lable 83,030 6,411 7.7% 6,352 7.6% 31,404 37.8% 23,540 28.4% 13,637 16.4% 652 0.8% 1,034 1.2%
DWELLING TYPE
Single Detached 373,568 21,513 5.8% 22,727 6.1% 135,866 36.4% 122,846 32.9% 69,863 18.7% 753 0.2% 0 0.0%
Multi Attached 46,834 4,199 9.0% 2,786 5.9% 15,360 32.8% 12,860 27.5% 8,633 18.4% 0 0.0% 2,996 6.4%
Apartment Suite 64,409 1,701 2.6% 657 1.0% 6,890 10.7% 2,881 4.5% 710 1.1% 0 0.0% 51,571 80.1%
BUILDING CODE ERA
2010‐2017 37,645 1,308 3.5% 713 1.9% 10,603 28.2% 11,780 31.3% 9,697 25.8% 0 0.0% 3,545 9.4%
1990‐2009 89,181 3,375 3.8% 4,222 4.7% 25,624 28.7% 28,277 31.7% 19,566 21.9% 62 0.1% 8,055 9.0%
1970‐1989 161,749 9,072 5.6% 8,381 5.2% 55,175 34.1% 47,530 29.4% 24,035 14.9% 367 0.2% 17,189 10.6%
1950‐1969 110,314 6,103 5.5% 7,193 6.5% 34,829 31.6% 30,973 28.1% 14,432 13.1% 112 0.1% 16,673 15.1%
Pre 1950 85,922 7,554 8.8% 5,661 6.6% 31,886 37.1% 20,028 23.3% 11,476 13.4% 212 0.2% 9,104 10.6%
SPACE HEAT FUEL
Electric Heat 191,639 13,008 6.8% 10,123 5.3% 69,130 36.1% 51,748 27.0% 26,960 14.1% 622 0.3% 20,049 10.5%
Natura l Gas Heat 249,938 13,069 5.2% 15,034 6.0% 85,165 34.1% 84,697 33.9% 50,372 20.2% 0 0.0% 1,602 0.6%
Other Fuel 6,945 893 12.9% 1,012 14.6% 2,801 40.3% 821 11.8% 1,287 18.5% 131 1.9% 0 0.0%
Shared (No Heat on Bi l l ) 36,289 444 1.2% 0 0.0% 1,021 2.8% 1,321 3.6% 587 1.6% 0 0.0% 32,916 90.7%
PEOPLE PER HOUSEHOLD
One 124,779 13,722 11.0% 9,510 7.6% 62,519 50.1% 5,872 4.7% 3,316 2.7% 691 0.6% 29,150 23.4%
Two 221,729 10,496 4.7% 14,352 6.5% 77,437 34.9% 91,114 41.1% 7,405 3.3% 31 0.0% 20,895 9.4%
Three 60,069 1,354 2.3% 1,507 2.5% 11,256 18.7% 21,313 35.5% 21,167 35.2% 0 0.0% 3,473 5.8%
Four 48,897 1,336 2.7% 626 1.3% 5,057 10.3% 14,220 29.1% 27,042 55.3% 0 0.0% 616 1.3%
Five + 29,337 505 1.7% 174 0.6% 1,849 6.3% 6,069 20.7% 20,276 69.1% 31 0.1% 434 1.5%
HOUSEHOLD INCOME
Less Than $25,000 59,481 6,959 11.7% 4,696 7.9% 20,045 33.7% 8,797 14.8% 6,886 11.6% 417 0.7% 11,681 19.6%
$25,000 ‐ $49,999 137,082 11,156 8.1% 10,603 7.7% 52,526 38.3% 32,278 23.5% 10,573 7.7% 162 0.1% 19,784 14.4%
$50,000 ‐ $74,999 123,824 5,049 4.1% 6,068 4.9% 47,107 38.0% 35,918 29.0% 15,982 12.9% 143 0.1% 13,556 10.9%
$75,000 ‐ $99,999 66,780 1,854 2.8% 1,677 2.5% 18,098 27.1% 25,603 38.3% 15,164 22.7% 0 0.0% 4,384 6.6%
$100,000 + 97,644 2,395 2.5% 3,126 3.2% 20,340 20.8% 35,990 36.9% 30,600 31.3% 31 0.0% 5,161 5.3%
WINNIPEG LICO‐125 CLASS
Yes 158,987 15,023 9.4% 11,762 7.4% 51,526 32.4% 34,083 21.4% 22,495 14.1% 579 0.4% 23,519 14.8%
No 325,824 12,390 3.8% 14,408 4.4% 106,591 32.7% 104,504 32.1% 56,711 17.4% 174 0.1% 31,047 9.5%
INDIGENOUS SELF‐DECLARED ANCESTRY
Yes 51,429 2,698 5.2% 2,183 4.2% 14,008 27.2% 13,915 27.1% 13,585 26.4% 318 0.6% 4,722 9.2%
No 409,630 22,610 5.5% 21,966 5.4% 136,803 33.4% 117,056 28.6% 61,892 15.1% 435 0.1% 48,868 11.9%
Undeclared 23,751 2,105 8.9% 2,021 8.5% 7,305 30.8% 7,616 32.1% 3,728 15.7% 0 0.0% 977 4.1%
FIRST NATION ON RESERVE
FIRST NATION ON RESERVE 15,456 722 4.7% 503 3.3% 3,499 22.6% 3,899 25.2% 6,384 41.3% 318 2.1% 131 0.8%
BILL PAYMENT RATING
Excel lent 439,339 25,129 5.7% 24,530 5.6% 146,099 33.3% 127,615 29.0% 66,212 15.1% 435 0.1% 49,319 11.2%
Sati s factory 22,395 1,029 4.6% 809 3.6% 6,931 30.9% 5,889 26.3% 5,533 24.7% 193 0.9% 2,011 9.0%
Poor 23,077 1,256 5.4% 830 3.6% 5,086 22.0% 5,083 22.0% 7,461 32.3% 124 0.5% 3,237 14.0%
DWELLING OWNERSHIP
Own 404,316 23,367 5.8% 24,150 6.0% 142,773 35.3% 129,114 31.9% 69,173 17.1% 559 0.1% 15,179 3.8%
Rent / Other 80,495 4,046 5.0% 2,019 2.5% 15,343 19.1% 9,473 11.8% 10,032 12.5% 193 0.2% 39,388 48.9%
2017 RESIDENTIAL SURVEY SECTION 4 ‐ RESIDENTIAL HOT WATER ‐ REFERENCE TABLE 4.05
TOTAL NUMBER OF SHOWERS TAKEN PER DAY
Centra Gas Manitoba Inc. 2019/20 General Rate Application Appendix 7.7
March 22, 2019 Page 62 of 228

55
4.06 Water Conservation Methods Undertaken
TOTAL NONE % SOME %
OVERALL 484,811 348,001 71.8% 136,810 28.2%
FUEL AREA
Winnipeg City 261,760 189,562 72.4% 72,198 27.6%
Gas Avai lable 140,021 97,758 69.8% 42,263 30.2%
No Gas Avai lable 83,030 60,681 73.1% 22,349 26.9%
DWELLING TYPE
Single Detached 373,568 293,478 78.6% 80,090 21.4%
Multi Attached 46,834 29,711 63.4% 17,123 36.6%
Apartment Sui te 64,409 24,812 38.5% 39,597 61.5%
BUILDING CODE ERA
2010‐2017 37,645 23,155 61.5% 14,490 38.5%
1990‐2009 89,181 62,491 70.1% 26,690 29.9%
1970‐1989 161,749 119,266 73.7% 42,482 26.3%
1950‐1969 110,314 80,856 73.3% 29,458 26.7%
Pre 1950 85,922 62,232 72.4% 23,690 27.6%
SPACE HEAT FUEL
Electri c Heat 191,639 130,159 67.9% 61,480 32.1%
Natura l Gas Heat 249,938 201,657 80.7% 48,281 19.3%
Other Fuel 6,945 4,765 68.6% 2,180 31.4%
Shared (No Heat on Bi l l ) 36,289 11,420 31.5% 24,869 68.5%
PEOPLE PER HOUSEHOLD
One 124,779 77,292 61.9% 47,488 38.1%
Two 221,729 168,878 76.2% 52,852 23.8%
Three 60,069 43,886 73.1% 16,184 26.9%
Four 48,897 37,099 75.9% 11,798 24.1%
Five + 29,337 20,848 71.1% 8,489 28.9%
HOUSEHOLD INCOME
Less Than $25,000 59,481 35,964 60.5% 23,516 39.5%
$25,000 ‐ $49,999 137,082 95,313 69.5% 41,770 30.5%
$50,000 ‐ $74,999 123,824 90,959 73.5% 32,865 26.5%
$75,000 ‐ $99,999 66,780 50,278 75.3% 16,502 24.7%
$100,000 + 97,644 75,487 77.3% 22,157 22.7%
WINNIPEG LICO‐125 CLASS
Yes 158,987 104,968 66.0% 54,018 34.0%
No 325,824 243,033 74.6% 82,792 25.4%
INDIGENOUS SELF‐DECLARED ANCESTRY
Yes 51,429 32,153 62.5% 19,276 37.5%
No 409,630 298,324 72.8% 111,306 27.2%
Undeclared 23,751 17,523 73.8% 6,228 26.2%
FIRST NATION ON RESERVE
FIRST NATION ON RESERVE 15,456 8,306 53.7% 7,150 46.3%
BILL PAYMENT RATING
Excel lent 439,339 318,799 72.6% 120,540 27.4%
Sati s factory 22,395 15,381 68.7% 7,014 31.3%
Poor 23,077 13,821 59.9% 9,256 40.1%
DWELLING OWNERSHIP
Own 404,316 313,881 77.6% 90,435 22.4%
Rent / Other 80,495 34,120 42.4% 46,375 57.6%
2017 RESIDENTIAL SURVEY SECTION 4 ‐ RESIDENTIAL HOT WATER ‐ REFERENCE TABLE 4.06
WATER CONSERVATION METHODS UNDERTAKEN
Centra Gas Manitoba Inc. 2019/20 General Rate Application Appendix 7.7
March 22, 2019 Page 63 of 228

56
Centra Gas Manitoba Inc. 2019/20 General Rate Application Appendix 7.7
March 22, 2019 Page 64 of 228

57
SECTION 5 MAJOR APPLIANCES
SECTION 5 MAJOR APPLIANCES
Centra Gas Manitoba Inc. 2019/20 General Rate Application Appendix 7.7
March 22, 2019 Page 65 of 228

58
5.01 Fuel Used to Cook Food
TOTAL
NO
COOKING % ELECTRIC % GAS % OTHER %
OVERALL 484,811 799 0.2% 457,358 94.3% 24,096 5.0% 2,558 0.5%
FUEL AREA
Winnipeg City 261,760 269 0.1% 244,104 93.3% 17,013 6.5% 375 0.1%
Gas Ava i lable 140,021 100 0.1% 132,334 94.5% 7,083 5.1% 503 0.4%
No Gas Ava i lable 83,030 429 0.5% 80,920 97.5% 0 0.0% 1,680 2.0%
DWELLING TYPE
Single Detached 373,568 644 0.2% 349,434 93.5% 21,393 5.7% 2,096 0.6%
Multi Attached 46,834 154 0.3% 44,915 95.9% 1,505 3.2% 260 0.6%
Apartment Sui te 64,409 0 0.0% 63,009 97.8% 1,198 1.9% 202 0.3%
BUILDING CODE ERA
2010‐2017 37,645 146 0.4% 35,184 93.5% 2,215 5.9% 100 0.3%
1990‐2009 89,181 256 0.3% 82,178 92.1% 5,725 6.4% 1,023 1.1%
1970‐1989 161,749 185 0.1% 155,449 96.1% 5,243 3.2% 871 0.5%
1950‐1969 110,314 112 0.1% 104,859 95.1% 5,344 4.8% 0 0.0%
Pre 1950 85,922 100 0.1% 79,688 92.7% 5,569 6.5% 564 0.7%
SPACE HEAT FUEL
Electric Heat 191,639 399 0.2% 188,514 98.4% 1,089 0.6% 1,637 0.9%
Natura l Gas Heat 249,938 269 0.1% 228,015 91.2% 21,539 8.6% 115 0.0%
Other Fuel 6,945 131 1.9% 6,008 86.5% 0 0.0% 806 11.6%
Shared (No Heat on Bi l l ) 36,289 0 0.0% 34,821 96.0% 1,468 4.0% 0 0.0%
PEOPLE PER HOUSEHOLD
One 124,779 428 0.3% 119,643 95.9% 3,892 3.1% 816 0.7%
Two 221,729 31 0.0% 210,220 94.8% 10,604 4.8% 873 0.4%
Three 60,069 146 0.2% 54,657 91.0% 4,867 8.1% 400 0.7%
Four 48,897 31 0.1% 44,791 91.6% 3,737 7.6% 337 0.7%
Five + 29,337 162 0.6% 28,047 95.6% 996 3.4% 131 0.4%
HOUSEHOLD INCOME
Less Than $25,000 59,481 467 0.8% 57,325 96.4% 1,096 1.8% 592 1.0%
$25,000 ‐ $49,999 137,082 62 0.0% 131,492 95.9% 4,349 3.2% 1,179 0.9%
$50,000 ‐ $74,999 123,824 0 0.0% 119,435 96.5% 4,274 3.5% 115 0.1%
$75,000 ‐ $99,999 66,780 0 0.0% 62,008 92.9% 4,661 7.0% 112 0.2%
$100,000 + 97,644 269 0.3% 87,098 89.2% 9,716 10.0% 561 0.6%
WINNIPEG LICO‐125 CLASS
Yes 158,987 530 0.3% 152,917 96.2% 4,231 2.7% 1,309 0.8%
No 325,824 269 0.1% 304,441 93.4% 19,865 6.1% 1,249 0.4%
INDIGENOUS SELF‐DECLARED ANCESTRY
Yes 51,429 318 0.6% 49,759 96.8% 791 1.5% 562 1.1%
No 409,630 481 0.1% 384,870 94.0% 22,384 5.5% 1,896 0.5%
Undeclared 23,751 0 0.0% 22,730 95.7% 921 3.9% 100 0.4%
FIRST NATION ON RESERVE
FIRST NATION ON RESERVE 15,456 318 2.1% 14,914 96.5% 0 0.0% 224 1.5%
BILL PAYMENT RATING
Excel lent 439,339 458 0.1% 414,643 94.4% 22,089 5.0% 2,150 0.5%
Satis factory 22,395 185 0.8% 20,605 92.0% 1,373 6.1% 232 1.0%
Poor 23,077 155 0.7% 22,111 95.8% 633 2.7% 177 0.8%
DWELLING OWNERSHIP
Own 404,316 451 0.1% 379,112 93.8% 22,559 5.6% 2,194 0.5%
Rent / Other 80,495 348 0.4% 78,246 97.2% 1,537 1.9% 364 0.5%
2017 RESIDENTIAL SURVEY SECTION 5 ‐ MAJOR APPLIANCES ‐ REFERENCE TABLE 5.01
FUEL USED TO COOK FOOD
Centra Gas Manitoba Inc. 2019/20 General Rate Application Appendix 7.7
March 22, 2019 Page 66 of 228
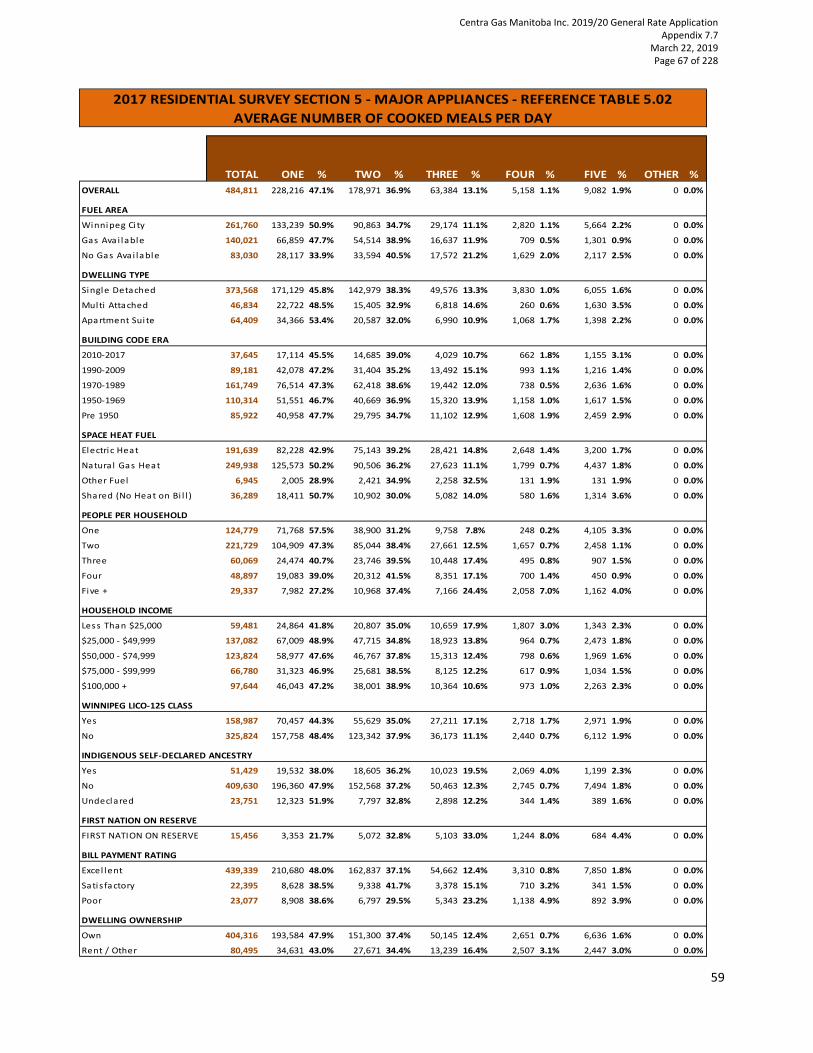
59
5.02 Average Number of Cooked Meals per Day
TOTAL ONE % TWO % THREE % FOUR % FIVE % OTHER %
OVERALL 484,811 228,216 47.1% 178,971 36.9% 63,384 13.1% 5,158 1.1% 9,082 1.9% 0 0.0%
FUEL AREA
Winnipeg City 261,760 133,239 50.9% 90,863 34.7% 29,174 11.1% 2,820 1.1% 5,664 2.2% 0 0.0%
Gas Ava i lable 140,021 66,859 47.7% 54,514 38.9% 16,637 11.9% 709 0.5% 1,301 0.9% 0 0.0%
No Gas Avai lable 83,030 28,117 33.9% 33,594 40.5% 17,572 21.2% 1,629 2.0% 2,117 2.5% 0 0.0%
DWELLING TYPE
Single Detached 373,568 171,129 45.8% 142,979 38.3% 49,576 13.3% 3,830 1.0% 6,055 1.6% 0 0.0%
Multi Attached 46,834 22,722 48.5% 15,405 32.9% 6,818 14.6% 260 0.6% 1,630 3.5% 0 0.0%
Apartment Sui te 64,409 34,366 53.4% 20,587 32.0% 6,990 10.9% 1,068 1.7% 1,398 2.2% 0 0.0%
BUILDING CODE ERA
2010‐2017 37,645 17,114 45.5% 14,685 39.0% 4,029 10.7% 662 1.8% 1,155 3.1% 0 0.0%
1990‐2009 89,181 42,078 47.2% 31,404 35.2% 13,492 15.1% 993 1.1% 1,216 1.4% 0 0.0%
1970‐1989 161,749 76,514 47.3% 62,418 38.6% 19,442 12.0% 738 0.5% 2,636 1.6% 0 0.0%
1950‐1969 110,314 51,551 46.7% 40,669 36.9% 15,320 13.9% 1,158 1.0% 1,617 1.5% 0 0.0%
Pre 1950 85,922 40,958 47.7% 29,795 34.7% 11,102 12.9% 1,608 1.9% 2,459 2.9% 0 0.0%
SPACE HEAT FUEL
Electric Heat 191,639 82,228 42.9% 75,143 39.2% 28,421 14.8% 2,648 1.4% 3,200 1.7% 0 0.0%
Natura l Gas Heat 249,938 125,573 50.2% 90,506 36.2% 27,623 11.1% 1,799 0.7% 4,437 1.8% 0 0.0%
Other Fuel 6,945 2,005 28.9% 2,421 34.9% 2,258 32.5% 131 1.9% 131 1.9% 0 0.0%
Shared (No Heat on Bi l l ) 36,289 18,411 50.7% 10,902 30.0% 5,082 14.0% 580 1.6% 1,314 3.6% 0 0.0%
PEOPLE PER HOUSEHOLD
One 124,779 71,768 57.5% 38,900 31.2% 9,758 7.8% 248 0.2% 4,105 3.3% 0 0.0%
Two 221,729 104,909 47.3% 85,044 38.4% 27,661 12.5% 1,657 0.7% 2,458 1.1% 0 0.0%
Three 60,069 24,474 40.7% 23,746 39.5% 10,448 17.4% 495 0.8% 907 1.5% 0 0.0%
Four 48,897 19,083 39.0% 20,312 41.5% 8,351 17.1% 700 1.4% 450 0.9% 0 0.0%
Five + 29,337 7,982 27.2% 10,968 37.4% 7,166 24.4% 2,058 7.0% 1,162 4.0% 0 0.0%
HOUSEHOLD INCOME
Less Than $25,000 59,481 24,864 41.8% 20,807 35.0% 10,659 17.9% 1,807 3.0% 1,343 2.3% 0 0.0%
$25,000 ‐ $49,999 137,082 67,009 48.9% 47,715 34.8% 18,923 13.8% 964 0.7% 2,473 1.8% 0 0.0%
$50,000 ‐ $74,999 123,824 58,977 47.6% 46,767 37.8% 15,313 12.4% 798 0.6% 1,969 1.6% 0 0.0%
$75,000 ‐ $99,999 66,780 31,323 46.9% 25,681 38.5% 8,125 12.2% 617 0.9% 1,034 1.5% 0 0.0%
$100,000 + 97,644 46,043 47.2% 38,001 38.9% 10,364 10.6% 973 1.0% 2,263 2.3% 0 0.0%
WINNIPEG LICO‐125 CLASS
Yes 158,987 70,457 44.3% 55,629 35.0% 27,211 17.1% 2,718 1.7% 2,971 1.9% 0 0.0%
No 325,824 157,758 48.4% 123,342 37.9% 36,173 11.1% 2,440 0.7% 6,112 1.9% 0 0.0%
INDIGENOUS SELF‐DECLARED ANCESTRY
Yes 51,429 19,532 38.0% 18,605 36.2% 10,023 19.5% 2,069 4.0% 1,199 2.3% 0 0.0%
No 409,630 196,360 47.9% 152,568 37.2% 50,463 12.3% 2,745 0.7% 7,494 1.8% 0 0.0%
Undeclared 23,751 12,323 51.9% 7,797 32.8% 2,898 12.2% 344 1.4% 389 1.6% 0 0.0%
FIRST NATION ON RESERVE
FIRST NATION ON RESERVE 15,456 3,353 21.7% 5,072 32.8% 5,103 33.0% 1,244 8.0% 684 4.4% 0 0.0%
BILL PAYMENT RATING
Excel lent 439,339 210,680 48.0% 162,837 37.1% 54,662 12.4% 3,310 0.8% 7,850 1.8% 0 0.0%
Sati s factory 22,395 8,628 38.5% 9,338 41.7% 3,378 15.1% 710 3.2% 341 1.5% 0 0.0%
Poor 23,077 8,908 38.6% 6,797 29.5% 5,343 23.2% 1,138 4.9% 892 3.9% 0 0.0%
DWELLING OWNERSHIP
Own 404,316 193,584 47.9% 151,300 37.4% 50,145 12.4% 2,651 0.7% 6,636 1.6% 0 0.0%
Rent / Other 80,495 34,631 43.0% 27,671 34.4% 13,239 16.4% 2,507 3.1% 2,447 3.0% 0 0.0%
2017 RESIDENTIAL SURVEY SECTION 5 ‐ MAJOR APPLIANCES ‐ REFERENCE TABLE 5.02
AVERAGE NUMBER OF COOKED MEALS PER DAY
Centra Gas Manitoba Inc. 2019/20 General Rate Application Appendix 7.7
March 22, 2019 Page 67 of 228

60
5.03 Age (Years) of Main Cooking Appliance
TOTAL
AVERAGE
AGE
0‐3
YRS %
4‐6
YRS %
7‐9
YRS %
10‐20
YRS %
OVER
20 YRS %
NO
COOKING %
OVERALL 484,811 11.7 88,609 18.3% 92,690 19.1% 76,558 15.8% 138,730 28.6% 87,425 18.0% 799 0.2%
FUEL AREA
Winnipeg Ci ty 261,760 12.2 49,458 18.9% 47,135 18.0% 38,348 14.7% 72,270 27.6% 54,280 20.7% 269 0.1%
Gas Avai lable 140,021 11.2 24,493 17.5% 28,508 20.4% 23,267 16.6% 41,244 29.5% 22,410 16.0% 100 0.1%
No Gas Avai lable 83,030 10.6 14,659 17.7% 17,048 20.5% 14,943 18.0% 25,217 30.4% 10,735 12.9% 429 0.5%
DWELLING TYPE
Single Detached 373,568 11.2 63,271 16.9% 73,314 19.6% 62,900 16.8% 117,111 31.3% 56,328 15.1% 644 0.2%
Multi Attached 46,834 10.9 11,367 24.3% 8,681 18.5% 6,361 13.6% 12,390 26.5% 7,881 16.8% 154 0.3%
Apartment Sui te 64,409 14.7 13,971 21.7% 10,695 16.6% 7,297 11.3% 9,230 14.3% 23,216 36.0% 0 0.0%
BUILDING CODE ERA
2010‐2017 37,645 4.0 17,948 47.7% 14,559 38.7% 4,088 10.9% 903 2.4% 0 0.0% 146 0.4%
1990‐2009 89,181 10.4 12,883 14.4% 14,493 16.3% 17,146 19.2% 36,982 41.5% 7,422 8.3% 256 0.3%
1970‐1989 161,749 12.3 29,094 18.0% 31,165 19.3% 23,172 14.3% 43,234 26.7% 34,899 21.6% 185 0.1%
1950‐1969 110,314 13.3 15,475 14.0% 18,450 16.7% 17,289 15.7% 33,390 30.3% 25,598 23.2% 112 0.1%
Pre 1950 85,922 12.9 13,209 15.4% 14,023 16.3% 14,862 17.3% 24,221 28.2% 19,506 22.7% 100 0.1%
SPACE HEAT FUEL
Electric Heat 191,639 10.8 38,011 19.8% 41,118 21.5% 30,012 15.7% 52,290 27.3% 29,811 15.6% 399 0.2%
Natura l Gas Heat 249,938 11.6 44,393 17.8% 45,434 18.2% 40,144 16.1% 78,459 31.4% 41,239 16.5% 269 0.1%
Other Fuel 6,945 11.0 396 5.7% 2,051 29.5% 1,774 25.5% 1,568 22.6% 1,024 14.7% 131 1.9%
Shared (No Heat on Bi l l ) 36,289 16.7 5,809 16.0% 4,087 11.3% 4,628 12.8% 6,414 17.7% 15,351 42.3% 0 0.0%
PEOPLE PER HOUSEHOLD
One 124,779 14.1 20,184 16.2% 16,720 13.4% 17,850 14.3% 35,569 28.5% 34,028 27.3% 428 0.3%
Two 221,729 10.9 42,287 19.1% 45,200 20.4% 34,953 15.8% 66,819 30.1% 32,439 14.6% 31 0.0%
Three 60,069 11.4 10,706 17.8% 13,398 22.3% 9,294 15.5% 15,480 25.8% 11,046 18.4% 146 0.2%
Four 48,897 10.5 9,604 19.6% 10,476 21.4% 8,202 16.8% 14,027 28.7% 6,556 13.4% 31 0.1%
Five + 29,337 9.7 5,829 19.9% 6,896 23.5% 6,258 21.3% 6,835 23.3% 3,356 11.4% 162 0.6%
HOUSEHOLD INCOME
Less Than $25,000 59,481 13.5 11,228 18.9% 9,435 15.9% 6,482 10.9% 16,914 28.4% 14,955 25.1% 467 0.8%
$25,000 ‐ $49,999 137,082 12.7 20,576 15.0% 24,671 18.0% 21,540 15.7% 40,653 29.7% 29,579 21.6% 62 0.0%
$50,000 ‐ $74,999 123,824 11.4 22,245 18.0% 25,272 20.4% 21,383 17.3% 33,557 27.1% 21,367 17.3% 0 0.0%
$75,000 ‐ $99,999 66,780 10.2 17,444 26.1% 11,961 17.9% 9,424 14.1% 19,036 28.5% 8,915 13.3% 0 0.0%
$100,000 + 97,644 10.3 17,117 17.5% 21,350 21.9% 17,729 18.2% 28,570 29.3% 12,609 12.9% 269 0.3%
WINNIPEG LICO‐125 CLASS
Yes 158,987 12.8 25,842 16.3% 28,796 18.1% 23,267 14.6% 44,720 28.1% 35,832 22.5% 530 0.3%
No 325,824 11.1 62,767 19.3% 63,894 19.6% 53,291 16.4% 94,010 28.9% 51,592 15.8% 269 0.1%
INDIGENOUS SELF‐DECLARED ANCESTRY
Yes 51,429 10.9 9,030 17.6% 12,890 25.1% 8,004 15.6% 13,108 25.5% 8,079 15.7% 318 0.6%
No 409,630 11.8 76,222 18.6% 74,052 18.1% 64,478 15.7% 118,827 29.0% 75,570 18.4% 481 0.1%
Undeclared 23,751 11.2 3,357 14.1% 5,748 24.2% 4,075 17.2% 6,796 28.6% 3,776 15.9% 0 0.0%
FIRST NATION ON RESERVE
FIRST NATION ON RESERVE 15,456 9.1 3,324 21.5% 3,564 23.1% 2,697 17.4% 4,296 27.8% 1,257 8.1% 318 2.1%
BILL PAYMENT RATING
Excel lent 439,339 11.7 80,337 18.3% 84,959 19.3% 68,662 15.6% 124,944 28.4% 79,978 18.2% 458 0.1%
Sati s factory 22,395 11.3 4,205 18.8% 4,336 19.4% 2,993 13.4% 7,252 32.4% 3,423 15.3% 185 0.8%
Poor 23,077 11.9 4,066 17.6% 3,395 14.7% 4,902 21.2% 6,535 28.3% 4,023 17.4% 155 0.7%
DWELLING OWNERSHIP
Own 404,316 11.0 72,431 17.9% 80,981 20.0% 66,390 16.4% 123,897 30.6% 60,166 14.9% 451 0.1%
Rent / Other 80,495 14.7 16,178 20.1% 11,710 14.5% 10,168 12.6% 14,833 18.4% 27,259 33.9% 348 0.4%
2017 RESIDENTIAL SURVEY SECTION 5 ‐ MAJOR APPLIANCES ‐ REFERENCE TABLE 5.03
AGE (YEARS) OF MAIN COOKING APPLIANCE
Centra Gas Manitoba Inc. 2019/20 General Rate Application Appendix 7.7
March 22, 2019 Page 68 of 228

61
5.04 Total Number of Refrigerators
TOTAL ONE UNIT % TWO UNITS %
THREE OR
MORE % NO UNIT %
OVERALL 484,811 272,369 56.2% 207,375 42.8% 466 0.1% 4,601 0.9%
FUEL AREA
Winnipeg Ci ty 261,760 160,014 61.1% 99,228 37.9% 230 0.1% 2,289 0.9%
Gas Avai lable 140,021 66,933 47.8% 70,987 50.7% 205 0.1% 1,896 1.4%
No Gas Avai lable 83,030 45,422 54.7% 37,160 44.8% 31 0.0% 416 0.5%
DWELLING TYPE
Single Detached 373,568 180,124 48.2% 189,633 50.8% 466 0.1% 3,345 0.9%
Multi Attached 46,834 33,484 71.5% 12,784 27.3% 0 0.0% 566 1.2%
Apartment Suite 64,409 58,761 91.2% 4,958 7.7% 0 0.0% 690 1.1%
BUILDING CODE ERA
2010‐2017 37,645 24,487 65.0% 12,889 34.2% 115 0.3% 154 0.4%
1990‐2009 89,181 43,803 49.1% 44,348 49.7% 134 0.1% 896 1.0%
1970‐1989 161,749 85,309 52.7% 74,324 46.0% 0 0.0% 2,115 1.3%
1950‐1969 110,314 62,128 56.3% 47,396 43.0% 217 0.2% 574 0.5%
Pre 1950 85,922 56,642 65.9% 28,418 33.1% 0 0.0% 862 1.0%
SPACE HEAT FUEL
Electri c Heat 191,639 111,444 58.2% 78,434 40.9% 31 0.0% 1,730 0.9%
Natura l Gas Heat 249,938 123,223 49.3% 123,964 49.6% 435 0.2% 2,316 0.9%
Other Fuel 6,945 4,687 67.5% 1,702 24.5% 0 0.0% 556 8.0%
Shared (No Heat on Bi l l ) 36,289 33,014 91.0% 3,275 9.0% 0 0.0% 0 0.0%
PEOPLE PER HOUSEHOLD
One 124,779 96,431 77.3% 25,886 20.7% 146 0.1% 2,317 1.9%
Two 221,729 105,963 47.8% 113,782 51.3% 217 0.1% 1,767 0.8%
Three 60,069 30,745 51.2% 28,965 48.2% 103 0.2% 257 0.4%
Four 48,897 25,572 52.3% 23,064 47.2% 0 0.0% 261 0.5%
Five + 29,337 13,658 46.6% 15,678 53.4% 0 0.0% 0 0.0%
HOUSEHOLD INCOME
Less Than $25,000 59,481 46,119 77.5% 12,825 21.6% 31 0.1% 506 0.9%
$25,000 ‐ $49,999 137,082 84,833 61.9% 50,191 36.6% 115 0.1% 1,943 1.4%
$50,000 ‐ $74,999 123,824 67,770 54.7% 54,448 44.0% 115 0.1% 1,491 1.2%
$75,000 ‐ $99,999 66,780 33,723 50.5% 32,510 48.7% 0 0.0% 547 0.8%
$100,000 + 97,644 39,924 40.9% 57,400 58.8% 205 0.2% 115 0.1%
WINNIPEG LICO‐125 CLASS
Yes 158,987 105,208 66.2% 51,399 32.3% 146 0.1% 2,234 1.4%
No 325,824 167,161 51.3% 155,976 47.9% 320 0.1% 2,368 0.7%
INDIGENOUS SELF‐DECLARED ANCESTRY
Yes 51,429 31,456 61.2% 19,277 37.5% 31 0.1% 665 1.3%
No 409,630 229,031 55.9% 177,085 43.2% 435 0.1% 3,079 0.8%
Undeclared 23,751 11,882 50.0% 11,012 46.4% 0 0.0% 857 3.6%
FIRST NATION ON RESERVE
FIRST NATION ON RESERVE 15,456 12,153 78.6% 3,079 19.9% 31 0.2% 193 1.3%
BILL PAYMENT RATING
Excel lent 439,339 241,636 55.0% 192,801 43.9% 332 0.1% 4,570 1.0%
Satis factory 22,395 14,901 66.5% 7,392 33.0% 103 0.5% 0 0.0%
Poor 23,077 15,833 68.6% 7,182 31.1% 31 0.1% 31 0.1%
DWELLING OWNERSHIP
Own 404,316 202,247 50.0% 198,007 49.0% 466 0.1% 3,597 0.9%
Rent / Other 80,495 70,122 87.1% 9,368 11.6% 0 0.0% 1,004 1.2%
2017 RESIDENTIAL SURVEY SECTION 5 ‐ MAJOR APPLIANCES ‐ REFERENCE TABLE 5.04
TOTAL NUMBER OF REFRIGERATORS
Centra Gas Manitoba Inc. 2019/20 General Rate Application Appendix 7.7
March 22, 2019 Page 69 of 228

62
5.05a Size (Cubic Feet) of Main Refrigerator
TOTAL
SMALL
<12ft3
%
MEDIUM
13‐16 ft3
%
LARGE 17‐
22 ft3
%
X‐LARGE
23+ ft
3% NO UNIT %
OVERALL 484,811 19,650 4.1% 165,790 34.2% 273,944 56.5% 20,826 4.3% 4,601 0.9%
FUEL AREA
Winnipeg City 261,760 10,160 3.9% 93,008 35.5% 145,841 55.7% 10,463 4.0% 2,289 0.9%
Gas Avai lable 140,021 6,486 4.6% 45,267 32.3% 79,135 56.5% 7,237 5.2% 1,896 1.4%
No Gas Avai lable 83,030 3,004 3.6% 27,515 33.1% 48,968 59.0% 3,127 3.8% 416 0.5%
DWELLING TYPE
Single Detached 373,568 11,858 3.2% 112,282 30.1% 226,629 60.7% 19,453 5.2% 3,345 0.9%
Multi Attached 46,834 2,879 6.1% 20,792 44.4% 21,723 46.4% 874 1.9% 566 1.2%
Apartment Sui te 64,409 4,912 7.6% 32,716 50.8% 25,591 39.7% 499 0.8% 690 1.1%
BUILDING CODE ERA
2010‐2017 37,645 831 2.2% 10,775 28.6% 22,161 58.9% 3,724 9.9% 154 0.4%
1990‐2009 89,181 2,514 2.8% 25,053 28.1% 55,292 62.0% 5,427 6.1% 896 1.0%
1970‐1989 161,749 5,312 3.3% 51,940 32.1% 96,496 59.7% 5,886 3.6% 2,115 1.3%
1950‐1969 110,314 5,244 4.8% 44,366 40.2% 56,609 51.3% 3,522 3.2% 574 0.5%
Pre 1950 85,922 5,748 6.7% 33,656 39.2% 43,387 50.5% 2,268 2.6% 862 1.0%
SPACE HEAT FUEL
Electric Heat 191,639 7,328 3.8% 70,517 36.8% 105,181 54.9% 6,884 3.6% 1,730 0.9%
Natura l Gas Heat 249,938 7,173 2.9% 74,272 29.7% 152,441 61.0% 13,736 5.5% 2,316 0.9%
Other Fuel 6,945 1,861 26.8% 1,964 28.3% 2,564 36.9% 0 0.0% 556 8.0%
Shared (No Heat on Bi l l ) 36,289 3,287 9.1% 19,037 52.5% 13,758 37.9% 206 0.6% 0 0.0%
PEOPLE PER HOUSEHOLD
One 124,779 9,751 7.8% 56,232 45.1% 54,416 43.6% 2,063 1.7% 2,317 1.9%
Two 221,729 7,077 3.2% 72,105 32.5% 132,742 59.9% 8,039 3.6% 1,767 0.8%
Three 60,069 1,746 2.9% 16,048 26.7% 38,771 64.5% 3,247 5.4% 257 0.4%
Four 48,897 683 1.4% 13,080 26.8% 30,658 62.7% 4,214 8.6% 261 0.5%
Five + 29,337 393 1.3% 8,325 28.4% 17,355 59.2% 3,263 11.1% 0 0.0%
HOUSEHOLD INCOME
Less Than $25,000 59,481 6,758 11.4% 25,808 43.4% 25,503 42.9% 905 1.5% 506 0.9%
$25,000 ‐ $49,999 137,082 6,851 5.0% 55,720 40.6% 69,414 50.6% 3,155 2.3% 1,943 1.4%
$50,000 ‐ $74,999 123,824 3,164 2.6% 42,643 34.4% 72,394 58.5% 4,132 3.3% 1,491 1.2%
$75,000 ‐ $99,999 66,780 1,142 1.7% 19,230 28.8% 41,905 62.8% 3,956 5.9% 547 0.8%
$100,000 + 97,644 1,734 1.8% 22,389 22.9% 64,728 66.3% 8,679 8.9% 115 0.1%
WINNIPEG LICO‐125 CLASS
Yes 158,987 11,336 7.1% 66,666 41.9% 74,677 47.0% 4,074 2.6% 2,234 1.4%
No 325,824 8,314 2.6% 99,124 30.4% 199,266 61.2% 16,752 5.1% 2,368 0.7%
INDIGENOUS SELF‐DECLARED ANCESTRY
Yes 51,429 1,268 2.5% 18,162 35.3% 28,962 56.3% 2,371 4.6% 665 1.3%
No 409,630 17,648 4.3% 139,460 34.0% 232,027 56.6% 17,416 4.3% 3,079 0.8%
Undeclared 23,751 734 3.1% 8,167 34.4% 12,954 54.5% 1,039 4.4% 857 3.6%
FIRST NATION ON RESERVE
FIRST NATION ON RESERVE 15,456 653 4.2% 5,787 37.4% 8,293 53.7% 529 3.4% 193 1.3%
BILL PAYMENT RATING
Excel lent 439,339 17,700 4.0% 149,972 34.1% 248,268 56.5% 18,829 4.3% 4,570 1.0%
Satis factory 22,395 1,150 5.1% 8,167 36.5% 12,500 55.8% 578 2.6% 0 0.0%
Poor 23,077 800 3.5% 7,650 33.2% 13,176 57.1% 1,419 6.2% 31 0.1%
DWELLING OWNERSHIP
Own 404,316 13,000 3.2% 125,979 31.2% 242,173 59.9% 19,568 4.8% 3,597 0.9%
Rent / Other 80,495 6,650 8.3% 39,811 49.5% 31,771 39.5% 1,258 1.6% 1,004 1.2%
2017 RESIDENTIAL SURVEY SECTION 5 ‐ MAJOR APPLIANCES ‐ REFERENCE TABLE 5.05a
SIZE (CUBIC FEET) OF MAIN REFRIGERATOR
Centra Gas Manitoba Inc. 2019/20 General Rate Application Appendix 7.7
March 22, 2019 Page 70 of 228

63
5.05b Age (Years) of Main Refrigerator
TOTAL
AVERAGE
AGE
0‐3
YRS %
4‐6
YRS %
7‐9
YRS %
10‐20
YRS %
OVER
20 YRS %
NO
UNIT %
OVERALL 484,811 9.9 112,475 23.2% 105,054 21.7% 77,248 15.9% 125,212 25.8% 60,220 12.4% 4,601 0.9%
FUEL AREA
Winnipeg City 261,760 10.4 61,973 23.7% 54,832 20.9% 40,658 15.5% 64,051 24.5% 37,956 14.5% 2,289 0.9%
Gas Avai lable 140,021 9.4 31,713 22.6% 31,888 22.8% 22,992 16.4% 37,512 26.8% 14,020 10.0% 1,896 1.4%
No Gas Avai lable 83,030 9.5 18,789 22.6% 18,334 22.1% 13,598 16.4% 23,648 28.5% 8,244 9.9% 416 0.5%
DWELLING TYPE
Single Detached 373,568 9.3 84,810 22.7% 84,123 22.5% 63,595 17.0% 104,391 27.9% 33,304 8.9% 3,345 0.9%
Multi Attached 46,834 10.6 11,612 24.8% 9,600 20.5% 7,244 15.5% 10,520 22.5% 7,292 15.6% 566 1.2%
Apartment Sui te 64,409 13.5 16,053 24.9% 11,331 17.6% 6,409 10.0% 10,301 16.0% 19,625 30.5% 690 1.1%
BUILDING CODE ERA
2010‐2017 37,645 3.8 20,449 54.3% 13,223 35.1% 2,793 7.4% 1,026 2.7% 0 0.0% 154 0.4%
1990‐2009 89,181 9.0 17,384 19.5% 17,993 20.2% 17,417 19.5% 30,127 33.8% 5,364 6.0% 896 1.0%
1970‐1989 161,749 10.5 35,658 22.0% 34,488 21.3% 27,097 16.8% 39,122 24.2% 23,267 14.4% 2,115 1.3%
1950‐1969 110,314 11.3 22,905 20.8% 21,901 19.9% 15,921 14.4% 30,357 27.5% 18,657 16.9% 574 0.5%
Pre 1950 85,922 11.0 16,079 18.7% 17,448 20.3% 14,021 16.3% 24,580 28.6% 12,932 15.1% 862 1.0%
SPACE HEAT FUEL
Electric Heat 191,639 9.5 48,916 25.5% 41,989 21.9% 29,346 15.3% 47,954 25.0% 21,704 11.3% 1,730 0.9%
Natura l Gas Heat 249,938 9.4 56,241 22.5% 55,880 22.4% 42,735 17.1% 68,907 27.6% 23,860 9.5% 2,316 0.9%
Other Fuel 6,945 10.3 396 5.7% 2,330 33.5% 1,277 18.4% 1,493 21.5% 893 12.9% 556 8.0%
Shared (No Heat on Bi l l ) 36,289 15.7 6,922 19.1% 4,855 13.4% 3,891 10.7% 6,857 18.9% 13,764 37.9% 0 0.0%
PEOPLE PER HOUSEHOLD
One 124,779 12.4 24,127 19.3% 20,675 16.6% 17,939 14.4% 33,611 26.9% 26,110 20.9% 2,317 1.9%
Two 221,729 9.2 50,874 22.9% 51,332 23.2% 36,779 16.6% 61,312 27.7% 19,664 8.9% 1,767 0.8%
Three 60,069 9.2 15,508 25.8% 14,260 23.7% 9,667 16.1% 13,521 22.5% 6,857 11.4% 257 0.4%
Four 48,897 8.7 13,574 27.8% 11,869 24.3% 8,056 16.5% 10,745 22.0% 4,391 9.0% 261 0.5%
Five + 29,337 8.9 8,392 28.6% 6,917 23.6% 4,807 16.4% 6,023 20.5% 3,198 10.9% 0 0.0%
HOUSEHOLD INCOME
Less Than $25,000 59,481 11.9 12,718 21.4% 11,127 18.7% 6,355 10.7% 17,410 29.3% 11,365 19.1% 506 0.9%
$25,000 ‐ $49,999 137,082 11.1 27,300 19.9% 25,100 18.3% 22,290 16.3% 39,794 29.0% 20,656 15.1% 1,943 1.4%
$50,000 ‐ $74,999 123,824 10.0 27,963 22.6% 27,413 22.1% 19,488 15.7% 32,206 26.0% 15,262 12.3% 1,491 1.2%
$75,000 ‐ $99,999 66,780 8.8 18,076 27.1% 15,740 23.6% 11,322 17.0% 14,300 21.4% 6,795 10.2% 547 0.8%
$100,000 + 97,644 7.9 26,418 27.1% 25,673 26.3% 17,795 18.2% 21,502 22.0% 6,141 6.3% 115 0.1%
WINNIPEG LICO‐125 CLASS
Yes 158,987 11.0 33,421 21.0% 30,543 19.2% 22,247 14.0% 45,890 28.9% 24,652 15.5% 2,234 1.4%
No 325,824 9.4 79,054 24.3% 74,511 22.9% 55,001 16.9% 79,322 24.3% 35,568 10.9% 2,368 0.7%
INDIGENOUS SELF‐DECLARED ANCESTRY
Yes 51,429 9.8 12,125 23.6% 11,659 22.7% 8,492 16.5% 12,010 23.4% 6,478 12.6% 665 1.3%
No 409,630 10.0 96,724 23.6% 86,818 21.2% 64,639 15.8% 107,486 26.2% 50,884 12.4% 3,079 0.8%
Undeclared 23,751 10.0 3,627 15.3% 6,577 27.7% 4,117 17.3% 5,715 24.1% 2,858 12.0% 857 3.6%
FIRST NATION ON RESERVE
FIRST NATION ON RESERVE 15,456 8.7 3,760 24.3% 3,165 20.5% 2,660 17.2% 4,770 30.9% 908 5.9% 193 1.3%
BILL PAYMENT RATING
Excel lent 439,339 9.9 101,783 23.2% 96,758 22.0% 69,717 15.9% 111,970 25.5% 54,541 12.4% 4,570 1.0%
Satis factory 22,395 10.2 5,145 23.0% 4,654 20.8% 2,805 12.5% 6,805 30.4% 2,986 13.3% 0 0.0%
Poor 23,077 10.2 5,547 24.0% 3,642 15.8% 4,726 20.5% 6,437 27.9% 2,694 11.7% 31 0.1%
DWELLING OWNERSHIP
Own 404,316 9.2 94,290 23.3% 90,847 22.5% 68,613 17.0% 109,784 27.2% 37,185 9.2% 3,597 0.9%
Rent / Other 80,495 13.5 18,185 22.6% 14,207 17.6% 8,636 10.7% 15,428 19.2% 23,035 28.6% 1,004 1.2%
2017 RESIDENTIAL SURVEY SECTION 5 ‐ MAJOR APPLIANCES ‐ REFERENCE TABLE 5.05b
AGE (YEARS) OF MAIN REFRIGERATOR
Centra Gas Manitoba Inc. 2019/20 General Rate Application Appendix 7.7
March 22, 2019 Page 71 of 228

64
5.06a Size (Cubic Feet) of Secondary Refrigerator
TOTAL
SMALL
<12ft3
%
MEDIUM
13‐16 ft3
%
LARGE 17‐
22 ft3
%
X‐LARGE
23+ ft
3% NO UNIT %
OVERALL 484,811 68,799 14.2% 80,052 16.5% 56,735 11.7% 3,309 0.7% 275,916 56.9%
FUEL AREA
Winnipeg Ci ty 261,760 36,386 13.9% 36,294 13.9% 25,561 9.8% 1,670 0.6% 161,850 61.8%
Gas Avai lable 140,021 21,425 15.3% 28,334 20.2% 20,742 14.8% 894 0.6% 68,626 49.0%
No Gas Avai lable 83,030 10,988 13.2% 15,424 18.6% 10,432 12.6% 745 0.9% 45,441 54.7%
DWELLING TYPE
Single Detached 373,568 59,330 15.9% 74,771 20.0% 53,353 14.3% 3,246 0.9% 182,868 49.0%
Multi Attached 46,834 7,186 15.3% 2,975 6.4% 2,623 5.6% 0 0.0% 34,050 72.7%
Apartment Sui te 64,409 2,283 3.5% 2,305 3.6% 759 1.2% 63 0.1% 58,999 91.6%
BUILDING CODE ERA
2010‐2017 37,645 5,676 15.1% 3,227 8.6% 4,049 10.8% 217 0.6% 24,476 65.0%
1990‐2009 89,181 15,488 17.4% 14,183 15.9% 13,900 15.6% 1,087 1.2% 44,523 49.9%
1970‐1989 161,749 22,407 13.9% 31,130 19.2% 20,002 12.4% 1,399 0.9% 86,809 53.7%
1950‐1969 110,314 14,887 13.5% 19,777 17.9% 12,329 11.2% 605 0.5% 62,716 56.9%
Pre 1950 85,922 10,341 12.0% 11,734 13.7% 6,455 7.5% 0 0.0% 57,392 66.8%
SPACE HEAT FUEL
Electri c Heat 191,639 23,533 12.3% 32,586 17.0% 21,430 11.2% 1,446 0.8% 112,644 58.8%
Natura l Gas Heat 249,938 42,437 17.0% 45,524 18.2% 34,741 13.9% 1,799 0.7% 125,437 50.2%
Other Fuel 6,945 1,364 19.6% 337 4.9% 131 1.9% 0 0.0% 5,112 73.6%
Shared (No Heat on Bi l l ) 36,289 1,465 4.0% 1,604 4.4% 434 1.2% 63 0.2% 32,724 90.2%
PEOPLE PER HOUSEHOLD
One 124,779 9,257 7.4% 10,234 8.2% 6,575 5.3% 94 0.1% 98,620 79.0%
Two 221,729 37,596 17.0% 45,818 20.7% 29,780 13.4% 1,505 0.7% 107,031 48.3%
Three 60,069 9,941 16.5% 10,498 17.5% 8,461 14.1% 230 0.4% 30,940 51.5%
Four 48,897 7,381 15.1% 8,553 17.5% 6,888 14.1% 344 0.7% 25,730 52.6%
Five + 29,337 4,623 15.8% 4,949 16.9% 5,032 17.2% 1,136 3.9% 13,596 46.3%
HOUSEHOLD INCOME
Less Than $25,000 59,481 5,082 8.5% 4,329 7.3% 3,524 5.9% 125 0.2% 46,420 78.0%
$25,000 ‐ $49,999 137,082 16,997 12.4% 21,621 15.8% 11,203 8.2% 748 0.5% 86,514 63.1%
$50,000 ‐ $74,999 123,824 16,819 13.6% 21,301 17.2% 16,174 13.1% 507 0.4% 69,023 55.7%
$75,000 ‐ $99,999 66,780 11,039 16.5% 12,277 18.4% 9,013 13.5% 427 0.6% 34,024 50.9%
$100,000 + 97,644 18,861 19.3% 20,523 21.0% 16,822 17.2% 1,502 1.5% 39,936 40.9%
WINNIPEG LICO‐125 CLASS
Yes 158,987 18,363 11.5% 20,319 12.8% 12,387 7.8% 781 0.5% 107,137 67.4%
No 325,824 50,436 15.5% 59,733 18.3% 44,348 13.6% 2,528 0.8% 168,779 51.8%
INDIGENOUS SELF‐DECLARED ANCESTRY
Yes 51,429 7,079 13.8% 6,642 12.9% 5,282 10.3% 692 1.3% 31,734 61.7%
No 409,630 57,365 14.0% 69,386 16.9% 49,022 12.0% 2,414 0.6% 231,443 56.5%
Undeclared 23,751 4,354 18.3% 4,024 16.9% 2,431 10.2% 203 0.9% 12,739 53.6%
FIRST NATION ON RESERVE
FIRST NATION ON RESERVE 15,456 933 6.0% 902 5.8% 1,375 8.9% 187 1.2% 12,059 78.0%
BILL PAYMENT RATING
Excel lent 439,339 63,908 14.5% 75,171 17.1% 51,896 11.8% 3,081 0.7% 245,283 55.8%
Satis factory 22,395 2,658 11.9% 2,541 11.3% 2,365 10.6% 31 0.1% 14,801 66.1%
Poor 23,077 2,233 9.7% 2,340 10.1% 2,475 10.7% 197 0.9% 15,833 68.6%
DWELLING OWNERSHIP
Own 404,316 64,655 16.0% 76,628 19.0% 54,485 13.5% 3,019 0.7% 205,530 50.8%
Rent / Other 80,495 4,143 5.1% 3,424 4.3% 2,251 2.8% 290 0.4% 70,387 87.4%
2017 RESIDENTIAL SURVEY SECTION 5 ‐ MAJOR APPLIANCES ‐ REFERENCE TABLE 5.06a
SIZE (CUBIC FEET) OF SECONDARY REFRIGERATOR
Centra Gas Manitoba Inc. 2019/20 General Rate Application Appendix 7.7
March 22, 2019 Page 72 of 228

65
5.06b Age (Years) of Secondary Refrigerator
TOTAL
AVERAGE
AGE
0‐3
YRS %
4‐6
YRS %
7‐9
YRS %
10‐20
YRS %
OVER 20
YRS % NO UNIT %
OVERALL 484,811 15.6 8,937 1.8% 22,441 4.6% 28,802 5.9% 91,407 18.9% 57,308 11.8% 275,916 56.9%
FUEL AREA
Winnipeg Ci ty 261,760 15.2 4,890 1.9% 11,716 4.5% 15,335 5.9% 42,040 16.1% 25,928 9.9% 161,850 61.8%
Gas Avai lable 140,021 16.1 2,633 1.9% 6,413 4.6% 9,032 6.5% 32,738 23.4% 20,578 14.7% 68,626 49.0%
No Gas Avai lable 83,030 15.9 1,414 1.7% 4,311 5.2% 4,434 5.3% 16,629 20.0% 10,801 13.0% 45,441 54.7%
DWELLING TYPE
Single Detached 373,568 15.7 7,733 2.1% 19,135 5.1% 27,188 7.3% 83,824 22.4% 52,820 14.1% 182,868 49.0%
Multi Attached 46,834 13.8 1,204 2.6% 2,302 4.9% 982 2.1% 5,677 12.1% 2,619 5.6% 34,050 72.7%
Apartment Sui te 64,409 16.5 0 0.0% 1,004 1.6% 632 1.0% 1,906 3.0% 1,869 2.9% 58,999 91.6%
BUILDING CODE ERA
2010‐2017 37,645 7.4 3,222 8.6% 3,498 9.3% 3,068 8.1% 3,014 8.0% 367 1.0% 24,476 65.0%
1990‐2009 89,181 14.6 1,624 1.8% 3,595 4.0% 6,067 6.8% 25,024 28.1% 8,349 9.4% 44,523 49.9%
1970‐1989 161,749 16.8 1,492 0.9% 7,496 4.6% 8,927 5.5% 32,572 20.1% 24,453 15.1% 86,809 53.7%
1950‐1969 110,314 16.5 1,687 1.5% 4,378 4.0% 6,999 6.3% 19,888 18.0% 14,646 13.3% 62,716 56.9%
Pre 1950 85,922 16.4 912 1.1% 3,475 4.0% 3,741 4.4% 10,910 12.7% 9,493 11.0% 57,392 66.8%
SPACE HEAT FUEL
Electri c Heat 191,639 16.0 2,143 1.1% 8,454 4.4% 9,623 5.0% 36,552 19.1% 22,223 11.6% 112,644 58.8%
Natura l Gas Heat 249,938 15.4 6,794 2.7% 12,766 5.1% 19,035 7.6% 52,351 20.9% 33,555 13.4% 125,437 50.2%
Other Fuel 6,945 17.7 0 0.0% 425 6.1% 0 0.0% 602 8.7% 806 11.6% 5,112 73.6%
Shared (No Heat on Bi l l ) 36,289 15.4 0 0.0% 797 2.2% 143 0.4% 1,901 5.2% 724 2.0% 32,724 90.2%
PEOPLE PER HOUSEHOLD
One 124,779 18.3 344 0.3% 2,252 1.8% 2,498 2.0% 10,589 8.5% 10,476 8.4% 98,620 79.0%
Two 221,729 15.9 5,021 2.3% 10,209 4.6% 15,401 6.9% 52,515 23.7% 31,551 14.2% 107,031 48.3%
Three 60,069 15.1 1,141 1.9% 3,593 6.0% 5,201 8.7% 11,528 19.2% 7,666 12.8% 30,940 51.5%
Four 48,897 13.4 1,812 3.7% 3,521 7.2% 3,027 6.2% 10,399 21.3% 4,407 9.0% 25,730 52.6%
Five + 29,337 13.6 618 2.1% 2,865 9.8% 2,675 9.1% 6,375 21.7% 3,207 10.9% 13,596 46.3%
HOUSEHOLD INCOME
Less Than $25,000 59,481 17.7 124 0.2% 1,521 2.6% 1,431 2.4% 4,941 8.3% 5,044 8.5% 46,420 78.0%
$25,000 ‐ $49,999 137,082 17.2 1,371 1.0% 4,627 3.4% 6,510 4.7% 21,005 15.3% 17,055 12.4% 86,514 63.1%
$50,000 ‐ $74,999 123,824 16.2 2,481 2.0% 4,704 3.8% 7,227 5.8% 24,328 19.6% 16,060 13.0% 69,023 55.7%
$75,000 ‐ $99,999 66,780 15.2 1,797 2.7% 3,542 5.3% 4,132 6.2% 14,296 21.4% 8,989 13.5% 34,024 50.9%
$100,000 + 97,644 13.4 3,164 3.2% 8,047 8.2% 9,502 9.7% 26,836 27.5% 10,159 10.4% 39,936 40.9%
WINNIPEG LICO‐125 CLASS
Yes 158,987 16.8 1,309 0.8% 6,209 3.9% 6,155 3.9% 21,063 13.2% 17,114 10.8% 107,137 67.4%
No 325,824 15.2 7,628 2.3% 16,232 5.0% 22,647 7.0% 70,344 21.6% 40,193 12.3% 168,779 51.8%
INDIGENOUS SELF‐DECLARED ANCESTRY
Yes 51,429 14.7 515 1.0% 3,446 6.7% 3,469 6.7% 7,282 14.2% 4,983 9.7% 31,734 61.7%
No 409,630 15.7 8,090 2.0% 17,765 4.3% 23,426 5.7% 80,186 19.6% 48,720 11.9% 231,443 56.5%
Undeclared 23,751 16.2 332 1.4% 1,229 5.2% 1,907 8.0% 3,939 16.6% 3,606 15.2% 12,739 53.6%
FIRST NATION ON RESERVE
FIRST NATION ON RESERVE 15,456 13.5 187 1.2% 623 4.0% 435 2.8% 1,523 9.9% 629 4.1% 12,059 78.0%
BILL PAYMENT RATING
Excel lent 439,339 15.7 8,046 1.8% 20,250 4.6% 26,551 6.0% 85,581 19.5% 53,627 12.2% 245,283 55.8%
Satis factory 22,395 14.5 580 2.6% 1,242 5.5% 858 3.8% 2,804 12.5% 2,110 9.4% 14,801 66.1%
Poor 23,077 14.2 311 1.3% 949 4.1% 1,392 6.0% 3,022 13.1% 1,570 6.8% 15,833 68.6%
DWELLING OWNERSHIP
Own 404,316 15.7 8,437 2.1% 20,024 5.0% 27,471 6.8% 88,047 21.8% 54,808 13.6% 205,530 50.8%
Rent / Other 80,495 13.8 500 0.6% 2,418 3.0% 1,330 1.7% 3,360 4.2% 2,500 3.1% 70,387 87.4%
2017 RESIDENTIAL SURVEY SECTION 5 ‐ MAJOR APPLIANCES ‐ REFERENCE TABLE 5.06b
AGE (YEARS) OF SECONDARY REFRIGERATOR
Centra Gas Manitoba Inc. 2019/20 General Rate Application Appendix 7.7
March 22, 2019 Page 73 of 228

66
5.07 Total Number of Freezers
TOTAL
ONE
UNIT %
TWO
UNITS %
THREE OR
MORE % NO UNIT %
OVERALL 484,811 276,176 57.0% 83,535 17.2% 855 0.2% 124,245 25.6%
FUEL AREA
Winnipeg City 261,760 155,036 59.2% 20,370 7.8% 115 0.0% 86,240 32.9%
Gas Ava i lable 140,021 81,762 58.4% 38,183 27.3% 406 0.3% 19,669 14.0%
No Gas Ava i lable 83,030 39,378 47.4% 24,982 30.1% 335 0.4% 18,335 22.1%
DWELLING TYPE
Single Detached 373,568 226,939 60.7% 78,555 21.0% 855 0.2% 67,218 18.0%
Multi Attached 46,834 25,519 54.5% 3,474 7.4% 0 0.0% 17,840 38.1%
Apartment Sui te 64,409 23,717 36.8% 1,506 2.3% 0 0.0% 39,186 60.8%
BUILDING CODE ERA
2010‐2017 37,645 19,632 52.1% 4,355 11.6% 0 0.0% 13,658 36.3%
1990‐2009 89,181 54,357 61.0% 16,128 18.1% 100 0.1% 18,596 20.9%
1970‐1989 161,749 96,400 59.6% 30,118 18.6% 112 0.1% 35,119 21.7%
1950‐1969 110,314 63,928 58.0% 16,881 15.3% 214 0.2% 29,291 26.6%
Pre 1950 85,922 41,859 48.7% 16,053 18.7% 429 0.5% 27,581 32.1%
SPACE HEAT FUEL
Electric Heat 191,639 95,388 49.8% 48,843 25.5% 536 0.3% 46,873 24.5%
Natura l Gas Heat 249,938 166,843 66.8% 31,627 12.7% 320 0.1% 51,148 20.5%
Other Fuel 6,945 3,107 44.7% 2,345 33.8% 0 0.0% 1,493 21.5%
Shared (No Heat on Bi l l ) 36,289 10,837 29.9% 721 2.0% 0 0.0% 24,731 68.2%
PEOPLE PER HOUSEHOLD
One 124,779 58,480 46.9% 12,916 10.4% 112 0.1% 53,272 42.7%
Two 221,729 129,450 58.4% 46,710 21.1% 429 0.2% 45,139 20.4%
Three 60,069 38,786 64.6% 9,977 16.6% 212 0.4% 11,094 18.5%
Four 48,897 32,706 66.9% 6,685 13.7% 0 0.0% 9,505 19.4%
Five + 29,337 16,753 57.1% 7,247 24.7% 103 0.3% 5,234 17.8%
HOUSEHOLD INCOME
Less Than $25,000 59,481 28,969 48.7% 9,771 16.4% 212 0.4% 20,529 34.5%
$25,000 ‐ $49,999 137,082 71,423 52.1% 26,427 19.3% 214 0.2% 39,018 28.5%
$50,000 ‐ $74,999 123,824 69,575 56.2% 22,835 18.4% 212 0.2% 31,202 25.2%
$75,000 ‐ $99,999 66,780 41,888 62.7% 11,723 17.6% 0 0.0% 13,169 19.7%
$100,000 + 97,644 64,321 65.9% 12,779 13.1% 217 0.2% 20,327 20.8%
WINNIPEG LICO‐125 CLASS
Yes 158,987 81,328 51.2% 31,021 19.5% 315 0.2% 46,323 29.1%
No 325,824 194,848 59.8% 52,514 16.1% 541 0.2% 77,922 23.9%
INDIGENOUS SELF‐DECLARED ANCESTRY
Yes 51,429 25,481 49.5% 10,284 20.0% 103 0.2% 15,561 30.3%
No 409,630 237,586 58.0% 68,828 16.8% 650 0.2% 102,566 25.0%
Undeclared 23,751 13,108 55.2% 4,424 18.6% 103 0.4% 6,117 25.8%
FIRST NATION ON RESERVE
FIRST NATION ON RESERVE 15,456 7,876 51.0% 1,624 10.5% 0 0.0% 5,956 38.5%
BILL PAYMENT RATING
Excel lent 439,339 252,275 57.4% 77,158 17.6% 643 0.1% 109,263 24.9%
Sati s factory 22,395 12,257 54.7% 3,230 14.4% 112 0.5% 6,797 30.3%
Poor 23,077 11,644 50.5% 3,148 13.6% 100 0.4% 8,185 35.5%
DWELLING OWNERSHIP
Own 404,316 242,146 59.9% 80,077 19.8% 855 0.2% 81,237 20.1%
Rent / Other 80,495 34,029 42.3% 3,458 4.3% 0 0.0% 43,008 53.4%
2017 RESIDENTIAL SURVEY SECTION 5 ‐ MAJOR APPLIANCES ‐ REFERENCE TABLE 5.07
TOTAL NUMBER OF FREEZERS
Centra Gas Manitoba Inc. 2019/20 General Rate Application Appendix 7.7
March 22, 2019 Page 74 of 228

67
5.08a Size (Cubic Feet) of Main Freezer
TOTAL SMALL % MEDIUM % LARGE % X‐LARGE % NO UNIT %
OVERALL 484,811 126,015 26.0% 128,014 26.4% 93,169 19.2% 13,368 2.8% 124,245 25.6%
FUEL AREA
Winnipeg City 261,760 69,272 26.5% 62,696 24.0% 37,820 14.4% 5,733 2.2% 86,240 32.9%
Gas Avai lable 140,021 37,340 26.7% 42,609 30.4% 35,391 25.3% 5,012 3.6% 19,669 14.0%
No Gas Avai lable 83,030 19,403 23.4% 22,710 27.4% 19,959 24.0% 2,623 3.2% 18,335 22.1%
DWELLING TYPE
Single Detached 373,568 90,704 24.3% 116,500 31.2% 86,499 23.2% 12,647 3.4% 67,218 18.0%
Multi Attached 46,834 15,948 34.1% 8,448 18.0% 3,877 8.3% 721 1.5% 17,840 38.1%
Apartment Suite 64,409 19,364 30.1% 3,066 4.8% 2,793 4.3% 0 0.0% 39,186 60.8%
BUILDING CODE ERA
2010‐2017 37,645 8,418 22.4% 8,628 22.9% 5,995 15.9% 946 2.5% 13,658 36.3%
1990‐2009 89,181 24,926 27.9% 24,318 27.3% 19,056 21.4% 2,285 2.6% 18,596 20.9%
1970‐1989 161,749 43,464 26.9% 44,061 27.2% 34,392 21.3% 4,712 2.9% 35,119 21.7%
1950‐1969 110,314 25,351 23.0% 30,379 27.5% 21,162 19.2% 4,132 3.7% 29,291 26.6%
Pre 1950 85,922 23,857 27.8% 20,628 24.0% 12,564 14.6% 1,293 1.5% 27,581 32.1%
SPACE HEAT FUEL
Electric Heat 191,639 50,573 26.4% 46,793 24.4% 42,274 22.1% 5,127 2.7% 46,873 24.5%
Natural Gas Heat 249,938 65,168 26.1% 76,805 30.7% 48,576 19.4% 8,241 3.3% 51,148 20.5%
Other Fuel 6,945 1,496 21.5% 2,505 36.1% 1,452 20.9% 0 0.0% 1,493 21.5%
Shared (No Heat on Bi l l ) 36,289 8,779 24.2% 1,912 5.3% 867 2.4% 0 0.0% 24,731 68.2%
PEOPLE PER HOUSEHOLD
One 124,779 36,284 29.1% 20,232 16.2% 13,863 11.1% 1,129 0.9% 53,272 42.7%
Two 221,729 57,645 26.0% 65,625 29.6% 47,744 21.5% 5,576 2.5% 45,139 20.4%
Three 60,069 15,198 25.3% 18,147 30.2% 13,671 22.8% 1,960 3.3% 11,094 18.5%
Four 48,897 11,325 23.2% 16,210 33.2% 9,914 20.3% 1,942 4.0% 9,505 19.4%
Five + 29,337 5,564 19.0% 7,800 26.6% 7,977 27.2% 2,761 9.4% 5,234 17.8%
HOUSEHOLD INCOME
Less Than $25,000 59,481 18,198 30.6% 11,548 19.4% 8,333 14.0% 873 1.5% 20,529 34.5%
$25,000 ‐ $49,999 137,082 37,782 27.6% 33,964 24.8% 23,619 17.2% 2,699 2.0% 39,018 28.5%
$50,000 ‐ $74,999 123,824 32,352 26.1% 31,081 25.1% 25,658 20.7% 3,532 2.9% 31,202 25.2%
$75,000 ‐ $99,999 66,780 15,539 23.3% 20,262 30.3% 16,105 24.1% 1,704 2.6% 13,169 19.7%
$100,000 + 97,644 22,144 22.7% 31,159 31.9% 19,453 19.9% 4,561 4.7% 20,327 20.8%
WINNIPEG LICO‐125 CLASS
Yes 158,987 46,094 29.0% 36,324 22.8% 27,037 17.0% 3,209 2.0% 46,323 29.1%
No 325,824 79,922 24.5% 91,690 28.1% 66,132 20.3% 10,159 3.1% 77,922 23.9%
INDIGENOUS SELF‐DECLARED ANCESTRY
Yes 51,429 12,348 24.0% 13,650 26.5% 8,384 16.3% 1,486 2.9% 15,561 30.3%
No 409,630 107,908 26.3% 108,640 26.5% 79,055 19.3% 11,462 2.8% 102,566 25.0%
Undeclared 23,751 5,760 24.3% 5,724 24.1% 5,730 24.1% 420 1.8% 6,117 25.8%
FIRST NATION ON RESERVE
FIRST NATION ON RESERVE 15,456 3,412 22.1% 3,818 24.7% 2,021 13.1% 249 1.6% 5,956 38.5%
BILL PAYMENT RATING
Excel lent 439,339 116,032 26.4% 115,468 26.3% 86,894 19.8% 11,683 2.7% 109,263 24.9%
Satis factory 22,395 5,113 22.8% 6,702 29.9% 2,636 11.8% 1,147 5.1% 6,797 30.3%
Poor 23,077 4,870 21.1% 5,845 25.3% 3,638 15.8% 538 2.3% 8,185 35.5%
DWELLING OWNERSHIP
Own 404,316 101,258 25.0% 119,678 29.6% 89,554 22.1% 12,590 3.1% 81,237 20.1%
Rent / Other 80,495 24,758 30.8% 8,337 10.4% 3,614 4.5% 778 1.0% 43,008 53.4%
2017 RESIDENTIAL SURVEY SECTION 5 ‐ MAJOR APPLIANCES ‐ REFERENCE TABLE 5.08a
SIZE (CUBIC FEET) OF MAIN FREEZER
Centra Gas Manitoba Inc. 2019/20 General Rate Application Appendix 7.7
March 22, 2019 Page 75 of 228

68
5.08b Age (Years) of Main Freezer
TOTAL
AVERAGE
AGE
0‐3
YRS %
4‐6
YRS %
7‐9
YRS %
10‐20
YRS %
OVER
20 YRS %
NO
UNIT %
OVERALL 484,811 13.6 50,060 10.3% 53,546 11.0% 47,303 9.8% 121,906 25.1% 87,751 18.1% 124,245 25.6%
FUEL AREA
Winnipeg City 261,760 14.2 22,547 8.6% 25,792 9.9% 22,491 8.6% 58,262 22.3% 46,428 17.7% 86,240 32.9%
Gas Avai lable 140,021 13.1 19,891 14.2% 17,701 12.6% 15,407 11.0% 39,649 28.3% 27,703 19.8% 19,669 14.0%
No Gas Avai lable 83,030 13.1 7,622 9.2% 10,053 12.1% 9,405 11.3% 23,994 28.9% 13,620 16.4% 18,335 22.1%
DWELLING TYPE
Single Detached 373,568 13.9 40,347 10.8% 43,307 11.6% 39,951 10.7% 106,131 28.4% 76,613 20.5% 67,218 18.0%
Multi Attached 46,834 13.6 4,624 9.9% 4,794 10.2% 3,562 7.6% 9,027 19.3% 6,986 14.9% 17,840 38.1%
Apartment Sui te 64,409 10.9 5,089 7.9% 5,445 8.5% 3,790 5.9% 6,747 10.5% 4,152 6.4% 39,186 60.8%
BUILDING CODE ERA
2010‐2017 37,645 7.1 7,973 21.2% 6,150 16.3% 3,488 9.3% 5,294 14.1% 1,081 2.9% 13,658 36.3%
1990‐2009 89,181 12.0 9,279 10.4% 10,165 11.4% 10,174 11.4% 30,977 34.7% 9,990 11.2% 18,596 20.9%
1970‐1989 161,749 14.4 16,653 10.3% 17,653 10.9% 16,088 9.9% 41,311 25.5% 34,925 21.6% 35,119 21.7%
1950‐1969 110,314 15.6 9,287 8.4% 10,879 9.9% 9,472 8.6% 24,532 22.2% 26,853 24.3% 29,291 26.6%
Pre 1950 85,922 13.9 6,867 8.0% 8,700 10.1% 8,081 9.4% 19,791 23.0% 14,902 17.3% 27,581 32.1%
SPACE HEAT FUEL
Electric Heat 191,639 12.9 20,423 10.7% 24,790 12.9% 19,197 10.0% 49,267 25.7% 31,089 16.2% 46,873 24.5%
Natura l Gas Heat 249,938 14.2 27,203 10.9% 26,129 10.5% 24,717 9.9% 68,585 27.4% 52,156 20.9% 51,148 20.5%
Other Fuel 6,945 12.3 690 9.9% 893 12.9% 1,143 16.5% 1,583 22.8% 1,143 16.5% 1,493 21.5%
Shared (No Heat on Bi l l ) 36,289 13.8 1,744 4.8% 1,734 4.8% 2,246 6.2% 2,471 6.8% 3,362 9.3% 24,731 68.2%
PEOPLE PER HOUSEHOLD
One 124,779 14.5 9,367 7.5% 9,507 7.6% 8,113 6.5% 24,885 19.9% 19,636 15.7% 53,272 42.7%
Two 221,729 13.8 24,063 10.9% 26,270 11.8% 22,492 10.1% 59,011 26.6% 44,753 20.2% 45,139 20.4%
Three 60,069 13.5 6,438 10.7% 7,344 12.2% 6,412 10.7% 17,330 28.8% 11,453 19.1% 11,094 18.5%
Four 48,897 12.5 6,099 12.5% 5,739 11.7% 6,299 12.9% 13,638 27.9% 7,617 15.6% 9,505 19.4%
Five + 29,337 11.6 4,094 14.0% 4,687 16.0% 3,987 13.6% 7,041 24.0% 4,293 14.6% 5,234 17.8%
HOUSEHOLD INCOME
Less Than $25,000 59,481 14.0 4,413 7.4% 5,986 10.1% 4,642 7.8% 14,306 24.1% 9,606 16.1% 20,529 34.5%
$25,000 ‐ $49,999 137,082 14.1 13,622 9.9% 14,386 10.5% 12,365 9.0% 32,311 23.6% 25,380 18.5% 39,018 28.5%
$50,000 ‐ $74,999 123,824 14.6 11,517 9.3% 11,317 9.1% 10,841 8.8% 33,359 26.9% 25,588 20.7% 31,202 25.2%
$75,000 ‐ $99,999 66,780 12.7 9,127 13.7% 9,302 13.9% 6,562 9.8% 16,665 25.0% 11,954 17.9% 13,169 19.7%
$100,000 + 97,644 12.4 11,381 11.7% 12,556 12.9% 12,893 13.2% 25,264 25.9% 15,224 15.6% 20,327 20.8%
WINNIPEG LICO‐125 CLASS
Yes 158,987 14.1 13,823 8.7% 17,696 11.1% 14,142 8.9% 37,971 23.9% 29,031 18.3% 46,323 29.1%
No 325,824 13.4 36,237 11.1% 35,850 11.0% 33,161 10.2% 83,935 25.8% 58,720 18.0% 77,922 23.9%
INDIGENOUS SELF‐DECLARED ANCESTRY
Yes 51,429 12.4 4,772 9.3% 6,450 12.5% 6,048 11.8% 11,501 22.4% 7,097 13.8% 15,561 30.3%
No 409,630 13.8 42,737 10.4% 44,933 11.0% 38,150 9.3% 104,948 25.6% 76,296 18.6% 102,566 25.0%
Undeclared 23,751 13.3 2,551 10.7% 2,163 9.1% 3,104 13.1% 5,457 23.0% 4,359 18.4% 6,117 25.8%
FIRST NATION ON RESERVE
FIRST NATION ON RESERVE 15,456 11.0 1,323 8.6% 2,002 13.0% 1,306 8.4% 3,774 24.4% 1,095 7.1% 5,956 38.5%
BILL PAYMENT RATING
Excel lent 439,339 13.6 45,971 10.5% 49,057 11.2% 42,394 9.6% 112,266 25.6% 80,388 18.3% 109,263 24.9%
Satis factory 22,395 14.3 2,071 9.2% 2,248 10.0% 2,512 11.2% 4,215 18.8% 4,552 20.3% 6,797 30.3%
Poor 23,077 12.5 2,018 8.7% 2,241 9.7% 2,397 10.4% 5,425 23.5% 2,811 12.2% 8,185 35.5%
DWELLING OWNERSHIP
Own 404,316 13.9 42,986 10.6% 44,666 11.0% 42,610 10.5% 112,014 27.7% 80,803 20.0% 81,237 20.1%
Rent / Other 80,495 11.4 7,074 8.8% 8,880 11.0% 4,693 5.8% 9,892 12.3% 6,948 8.6% 43,008 53.4%
2017 RESIDENTIAL SURVEY SECTION 5 ‐ MAJOR APPLIANCES ‐ REFERENCE TABLE 5.08b
AGE (YEARS) OF MAIN FREEZER
Centra Gas Manitoba Inc. 2019/20 General Rate Application Appendix 7.7
March 22, 2019 Page 76 of 228

69
5.09a Size (Cubic Feet) of Secondary Freezer
TOTAL SMALL % MEDIUM % LARGE % X‐LARGE % NO UNIT %
OVERALL 484,811 31,422 6.5% 29,350 6.1% 23,403 4.8% 1,594 0.3% 399,042 82.3%
FUEL AREA
Winnipeg City 261,760 9,867 3.8% 5,560 2.1% 5,656 2.2% 178 0.1% 240,499 91.9%
Gas Avai lable 140,021 12,781 9.1% 15,348 11.0% 9,838 7.0% 908 0.6% 101,146 72.2%
No Gas Avai lable 83,030 8,774 10.6% 8,442 10.2% 7,909 9.5% 509 0.6% 57,397 69.1%
DWELLING TYPE
Single Detached 373,568 28,648 7.7% 28,529 7.6% 21,499 5.8% 1,594 0.4% 293,298 78.5%
Multi Attached 46,834 2,191 4.7% 821 1.8% 617 1.3% 0 0.0% 43,205 92.3%
Apartment Sui te 64,409 583 0.9% 0 0.0% 1,287 2.0% 0 0.0% 62,539 97.1%
BUILDING CODE ERA
2010‐2017 37,645 1,809 4.8% 1,645 4.4% 1,103 2.9% 112 0.3% 32,977 87.6%
1990‐2009 89,181 6,328 7.1% 5,715 6.4% 4,315 4.8% 62 0.1% 72,761 81.6%
1970‐1989 161,749 11,003 6.8% 10,272 6.4% 8,509 5.3% 515 0.3% 131,450 81.3%
1950‐1969 110,314 6,156 5.6% 6,210 5.6% 4,631 4.2% 481 0.4% 92,835 84.2%
Pre 1950 85,922 6,126 7.1% 5,507 6.4% 4,845 5.6% 424 0.5% 69,019 80.3%
SPACE HEAT FUEL
Electric Heat 191,639 17,074 8.9% 18,340 9.6% 13,340 7.0% 1,389 0.7% 141,496 73.8%
Natura l Gas Heat 249,938 13,924 5.6% 10,541 4.2% 7,891 3.2% 205 0.1% 217,377 87.0%
Other Fuel 6,945 425 6.1% 469 6.7% 1,452 20.9% 0 0.0% 4,600 66.2%
Shared (No Heat on Bi l l ) 36,289 0 0.0% 0 0.0% 721 2.0% 0 0.0% 35,568 98.0%
PEOPLE PER HOUSEHOLD
One 124,779 5,088 4.1% 3,613 2.9% 4,284 3.4% 214 0.2% 111,580 89.4%
Two 221,729 17,820 8.0% 16,470 7.4% 12,995 5.9% 859 0.4% 173,585 78.3%
Three 60,069 3,095 5.2% 4,231 7.0% 2,817 4.7% 31 0.1% 49,896 83.1%
Four 48,897 3,374 6.9% 1,917 3.9% 1,511 3.1% 100 0.2% 41,994 85.9%
Five + 29,337 2,045 7.0% 3,120 10.6% 1,795 6.1% 390 1.3% 21,987 74.9%
HOUSEHOLD INCOME
Less Than $25,000 59,481 3,410 5.7% 3,619 6.1% 3,170 5.3% 0 0.0% 49,281 82.9%
$25,000 ‐ $49,999 137,082 10,843 7.9% 9,061 6.6% 7,163 5.2% 174 0.1% 109,842 80.1%
$50,000 ‐ $74,999 123,824 8,029 6.5% 7,234 5.8% 6,940 5.6% 1,108 0.9% 100,514 81.2%
$75,000 ‐ $99,999 66,780 4,559 6.8% 4,543 6.8% 2,618 3.9% 201 0.3% 54,859 82.1%
$100,000 + 97,644 4,581 4.7% 4,893 5.0% 3,514 3.6% 112 0.1% 84,545 86.6%
WINNIPEG LICO‐125 CLASS
Yes 158,987 11,772 7.4% 11,146 7.0% 8,670 5.5% 564 0.4% 126,836 79.8%
No 325,824 19,650 6.0% 18,204 5.6% 14,733 4.5% 1,031 0.3% 272,206 83.5%
INDIGENOUS SELF‐DECLARED ANCESTRY
Yes 51,429 3,147 6.1% 3,501 6.8% 3,506 6.8% 441 0.9% 40,835 79.4%
No 409,630 26,586 6.5% 24,595 6.0% 18,214 4.4% 1,153 0.3% 339,083 82.8%
Undeclared 23,751 1,689 7.1% 1,254 5.3% 1,684 7.1% 0 0.0% 19,125 80.5%
FIRST NATION ON RESERVE
FIRST NATION ON RESERVE 15,456 497 3.2% 566 3.7% 591 3.8% 62 0.4% 13,739 88.9%
BILL PAYMENT RATING
Excel lent 439,339 29,327 6.7% 27,368 6.2% 21,041 4.8% 1,463 0.3% 360,141 82.0%
Sati s factory 22,395 899 4.0% 1,035 4.6% 1,164 5.2% 131 0.6% 19,165 85.6%
Poor 23,077 1,196 5.2% 947 4.1% 1,198 5.2% 0 0.0% 19,736 85.5%
DWELLING OWNERSHIP
Own 404,316 29,892 7.4% 28,165 7.0% 22,131 5.5% 1,432 0.4% 322,698 79.8%
Rent / Other 80,495 1,530 1.9% 1,185 1.5% 1,272 1.6% 163 0.2% 76,344 94.8%
2017 RESIDENTIAL SURVEY SECTION 5 ‐ MAJOR APPLIANCES ‐ REFERENCE TABLE 5.09a
SIZE (CUBIC FEET) OF SECONDARY FREEZER
Centra Gas Manitoba Inc. 2019/20 General Rate Application Appendix 7.7
March 22, 2019 Page 77 of 228

70
5.09b Age (Years) of Secondary Freezer
TOTAL
AVERAGE
AGE
0‐3
YRS %
4‐6
YRS %
7‐9
YRS %
10‐20
YRS %
OVER
20 YRS %
NO
UNIT %
OVERALL 484,811 18.5 2,577 0.5% 6,517 1.3% 7,945 1.6% 34,727 7.2% 34,003 7.0% 399,042 82.3%
FUEL AREA
Winnipeg City 261,760 18.6 674 0.3% 1,588 0.6% 2,627 1.0% 7,700 2.9% 8,671 3.3% 240,499 91.9%
Gas Avai lable 140,021 18.4 1,413 1.0% 2,832 2.0% 3,730 2.7% 15,788 11.3% 15,112 10.8% 101,146 72.2%
No Gas Avai lable 83,030 18.6 490 0.6% 2,096 2.5% 1,587 1.9% 11,239 13.5% 10,220 12.3% 57,397 69.1%
DWELLING TYPE
Single Detached 373,568 18.8 1,732 0.5% 6,191 1.7% 7,025 1.9% 32,691 8.8% 32,632 8.7% 293,298 78.5%
Multi Attached 46,834 17.1 412 0.9% 0 0.0% 719 1.5% 1,127 2.4% 1,371 2.9% 43,205 92.3%
Apartment Sui te 64,409 9.2 434 0.7% 326 0.5% 202 0.3% 909 1.4% 0 0.0% 62,539 97.1%
BUILDING CODE ERA
2010‐2017 37,645 11.4 715 1.9% 795 2.1% 634 1.7% 1,942 5.2% 581 1.5% 32,977 87.6%
1990‐2009 89,181 15.8 365 0.4% 1,201 1.3% 2,297 2.6% 9,026 10.1% 3,531 4.0% 72,761 81.6%
1970‐1989 161,749 19.9 719 0.4% 2,246 1.4% 2,975 1.8% 9,523 5.9% 14,837 9.2% 131,450 81.3%
1950‐1969 110,314 19.6 472 0.4% 1,307 1.2% 950 0.9% 6,969 6.3% 7,780 7.1% 92,835 84.2%
Pre 1950 85,922 19.5 305 0.4% 968 1.1% 1,089 1.3% 7,267 8.5% 7,273 8.5% 69,019 80.3%
SPACE HEAT FUEL
Electric Heat 191,639 18.6 1,245 0.6% 4,112 2.1% 4,263 2.2% 20,339 10.6% 20,185 10.5% 141,496 73.8%
Natural Gas Heat 249,938 18.7 899 0.4% 1,980 0.8% 3,683 1.5% 12,943 5.2% 13,056 5.2% 217,377 87.0%
Other Fuel 6,945 18.1 0 0.0% 425 6.1% 0 0.0% 1,158 16.7% 762 11.0% 4,600 66.2%
Shared (No Heat on Bi l l ) 36,289 7.0 434 1.2% 0 0.0% 0 0.0% 287 0.8% 0 0.0% 35,568 98.0%
PEOPLE PER HOUSEHOLD
One 124,779 18.9 103 0.1% 1,506 1.2% 1,127 0.9% 4,926 3.9% 5,538 4.4% 111,580 89.4%
Two 221,729 19.0 1,764 0.8% 3,227 1.5% 4,387 2.0% 17,806 8.0% 20,961 9.5% 173,585 78.3%
Three 60,069 18.8 103 0.2% 433 0.7% 908 1.5% 5,010 8.3% 3,720 6.2% 49,896 83.1%
Four 48,897 16.1 330 0.7% 674 1.4% 747 1.5% 3,488 7.1% 1,663 3.4% 41,994 85.9%
Five + 29,337 16.5 279 0.9% 676 2.3% 775 2.6% 3,498 11.9% 2,121 7.2% 21,987 74.9%
HOUSEHOLD INCOME
Less Than $25,000 59,481 18.3 217 0.4% 995 1.7% 813 1.4% 4,303 7.2% 3,872 6.5% 49,281 82.9%
$25,000 ‐ $49,999 137,082 18.7 709 0.5% 2,392 1.7% 2,814 2.1% 9,553 7.0% 11,772 8.6% 109,842 80.1%
$50,000 ‐ $74,999 123,824 19.3 857 0.7% 1,485 1.2% 1,558 1.3% 9,116 7.4% 10,294 8.3% 100,514 81.2%
$75,000 ‐ $99,999 66,780 17.5 375 0.6% 696 1.0% 1,580 2.4% 5,231 7.8% 4,040 6.0% 54,859 82.1%
$100,000 + 97,644 17.7 420 0.4% 949 1.0% 1,181 1.2% 6,524 6.7% 4,025 4.1% 84,545 86.6%
WINNIPEG LICO‐125 CLASS
Yes 158,987 18.3 814 0.5% 3,314 2.1% 3,158 2.0% 12,109 7.6% 12,755 8.0% 126,836 79.8%
No 325,824 18.6 1,763 0.5% 3,202 1.0% 4,787 1.5% 22,618 6.9% 21,248 6.5% 272,206 83.5%
INDIGENOUS SELF‐DECLARED ANCESTRY
Yes 51,429 16.0 308 0.6% 1,147 2.2% 961 1.9% 5,209 10.1% 2,970 5.8% 40,835 79.4%
No 409,630 18.9 1,955 0.5% 4,970 1.2% 6,769 1.7% 27,793 6.8% 29,061 7.1% 339,083 82.8%
Undeclared 23,751 18.2 315 1.3% 400 1.7% 215 0.9% 1,725 7.3% 1,972 8.3% 19,125 80.5%
FIRST NATION ON RESERVE
FIRST NATION ON RESERVE 15,456 14.0 155 1.0% 280 1.8% 62 0.4% 846 5.5% 373 2.4% 13,739 88.9%
BILL PAYMENT RATING
Excel lent 439,339 18.5 2,152 0.5% 6,211 1.4% 7,563 1.7% 31,690 7.2% 31,582 7.2% 360,141 82.0%
Satis factory 22,395 19.7 248 1.1% 0 0.0% 351 1.6% 1,042 4.7% 1,588 7.1% 19,165 85.6%
Poor 23,077 16.7 177 0.8% 305 1.3% 31 0.1% 1,995 8.6% 833 3.6% 19,736 85.5%
DWELLING OWNERSHIP
Own 404,316 18.7 2,147 0.5% 6,087 1.5% 7,074 1.7% 33,265 8.2% 33,047 8.2% 322,698 79.8%
Rent / Other 80,495 14.0 431 0.5% 430 0.5% 872 1.1% 1,462 1.8% 956 1.2% 76,344 94.8%
2017 RESIDENTIAL SURVEY SECTION 5 ‐ MAJOR APPLIANCES ‐ REFERENCE TABLE 5.09b
AGE (YEARS) OF SECONDARY FREEZER
Centra Gas Manitoba Inc. 2019/20 General Rate Application Appendix 7.7
March 22, 2019 Page 78 of 228

71
5.10a Age (Years) of Dishwasher
TOTAL
AVERAGE
AGE
0‐3
YRS %
4‐6
YRS %
7‐9
YRS %
10‐20
YRS %
OVER
20 YRS %
NO
UNIT %
OVERALL 484,811 9.0 98,768 20.4% 71,982 14.8% 56,734 11.7% 85,008 17.5% 31,045 6.4% 141,273 29.1%
FUEL AREA
Winnipeg City 261,760 9.6 54,920 21.0% 39,964 15.3% 30,999 11.8% 49,028 18.7% 22,342 8.5% 64,507 24.6%
Gas Avai lable 140,021 8.0 33,645 24.0% 21,807 15.6% 18,094 12.9% 25,078 17.9% 5,790 4.1% 35,608 25.4%
No Gas Avai lable 83,030 8.8 10,203 12.3% 10,212 12.3% 7,641 9.2% 10,902 13.1% 2,914 3.5% 41,158 49.6%
DWELLING TYPE
Single Detached 373,568 8.6 73,706 19.7% 58,413 15.6% 46,252 12.4% 73,411 19.7% 17,970 4.8% 103,815 27.8%
Multi Attached 46,834 8.3 11,465 24.5% 5,545 11.8% 5,033 10.7% 6,259 13.4% 2,510 5.4% 16,022 34.2%
Apartment Sui te 64,409 11.7 13,597 21.1% 8,025 12.5% 5,448 8.5% 5,338 8.3% 10,565 16.4% 21,436 33.3%
BUILDING CODE ERA
2010‐2017 37,645 2.3 31,025 82.4% 3,226 8.6% 0 0.0% 115 0.3% 0 0.0% 3,279 8.7%
1990‐2009 89,181 7.8 14,192 15.9% 20,740 23.3% 15,613 17.5% 19,802 22.2% 1,211 1.4% 17,623 19.8%
1970‐1989 161,749 10.1 28,478 17.6% 23,953 14.8% 21,394 13.2% 31,242 19.3% 14,864 9.2% 41,816 25.9%
1950‐1969 110,314 10.9 14,801 13.4% 15,543 14.1% 10,895 9.9% 21,231 19.2% 10,348 9.4% 37,496 34.0%
Pre 1950 85,922 9.8 10,271 12.0% 8,520 9.9% 8,831 10.3% 12,619 14.7% 4,622 5.4% 41,059 47.8%
SPACE HEAT FUEL
Electric Heat 191,639 8.3 41,513 21.7% 27,204 14.2% 19,904 10.4% 26,304 13.7% 10,440 5.4% 66,275 34.6%
Natura l Gas Heat 249,938 8.9 53,782 21.5% 40,353 16.1% 34,172 13.7% 54,308 21.7% 14,660 5.9% 52,662 21.1%
Other Fuel 6,945 6.9 1,158 16.7% 1,524 21.9% 337 4.9% 1,027 14.8% 0 0.0% 2,898 41.7%
Shared (No Heat on Bi l l ) 36,289 15.9 2,314 6.4% 2,901 8.0% 2,321 6.4% 3,369 9.3% 5,946 16.4% 19,438 53.6%
PEOPLE PER HOUSEHOLD
One 124,779 11.0 17,687 14.2% 12,423 10.0% 9,912 7.9% 19,951 16.0% 10,907 8.7% 53,901 43.2%
Two 221,729 9.0 43,858 19.8% 35,001 15.8% 28,632 12.9% 46,798 21.1% 13,119 5.9% 54,321 24.5%
Three 60,069 8.0 14,341 23.9% 10,917 18.2% 8,844 14.7% 8,860 14.7% 3,396 5.7% 13,710 22.8%
Four 48,897 7.3 14,788 30.2% 8,809 18.0% 5,912 12.1% 5,848 12.0% 2,783 5.7% 10,756 22.0%
Five + 29,337 6.8 8,094 27.6% 4,832 16.5% 3,434 11.7% 3,550 12.1% 841 2.9% 8,585 29.3%
HOUSEHOLD INCOME
Less Than $25,000 59,481 11.1 5,096 8.6% 4,032 6.8% 2,698 4.5% 7,254 12.2% 3,023 5.1% 37,378 62.8%
$25,000 ‐ $49,999 137,082 10.4 18,982 13.8% 18,129 13.2% 14,960 10.9% 23,093 16.8% 11,110 8.1% 50,809 37.1%
$50,000 ‐ $74,999 123,824 9.0 27,647 22.3% 16,992 13.7% 15,532 12.5% 23,744 19.2% 8,365 6.8% 31,544 25.5%
$75,000 ‐ $99,999 66,780 8.3 17,496 26.2% 11,324 17.0% 8,664 13.0% 12,555 18.8% 4,215 6.3% 12,525 18.8%
$100,000 + 97,644 7.5 29,546 30.3% 21,506 22.0% 14,879 15.2% 18,364 18.8% 4,332 4.4% 9,017 9.2%
WINNIPEG LICO‐125 CLASS
Yes 158,987 10.2 20,405 12.8% 17,747 11.2% 13,376 8.4% 22,073 13.9% 10,421 6.6% 74,965 47.2%
No 325,824 8.6 78,363 24.1% 54,235 16.6% 43,358 13.3% 62,935 19.3% 20,625 6.3% 66,308 20.4%
INDIGENOUS SELF‐DECLARED ANCESTRY
Yes 51,429 8.8 7,185 14.0% 5,774 11.2% 4,010 7.8% 4,637 9.0% 2,587 5.0% 27,236 53.0%
No 409,630 9.0 87,299 21.3% 61,893 15.1% 49,390 12.1% 76,497 18.7% 26,862 6.6% 107,690 26.3%
Undeclared 23,751 8.9 4,283 18.0% 4,315 18.2% 3,334 14.0% 3,875 16.3% 1,596 6.7% 6,347 26.7%
FIRST NATION ON RESERVE
FIRST NATION ON RESERVE 15,456 8.2 187 1.2% 591 3.8% 249 1.6% 311 2.0% 62 0.4% 14,057 90.9%
BILL PAYMENT RATING
Excel lent 439,339 9.0 91,644 20.9% 67,625 15.4% 53,500 12.2% 78,682 17.9% 28,698 6.5% 119,190 27.1%
Satis factory 22,395 8.2 4,412 19.7% 2,534 11.3% 981 4.4% 3,724 16.6% 870 3.9% 9,874 44.1%
Poor 23,077 10.6 2,712 11.8% 1,823 7.9% 2,252 9.8% 2,603 11.3% 1,478 6.4% 12,210 52.9%
DWELLING OWNERSHIP
Own 404,316 8.6 87,302 21.6% 65,638 16.2% 51,433 12.7% 80,513 19.9% 20,772 5.1% 98,658 24.4%
Rent / Other 80,495 12.3 11,466 14.2% 6,344 7.9% 5,301 6.6% 4,496 5.6% 10,274 12.8% 42,615 52.9%
2017 RESIDENTIAL SURVEY SECTION 5 ‐ MAJOR APPLIANCES ‐ REFERENCE TABLE 5.10a
AGE (YEARS) OF DISHWASHER
Centra Gas Manitoba Inc. 2019/20 General Rate Application Appendix 7.7
March 22, 2019 Page 79 of 228
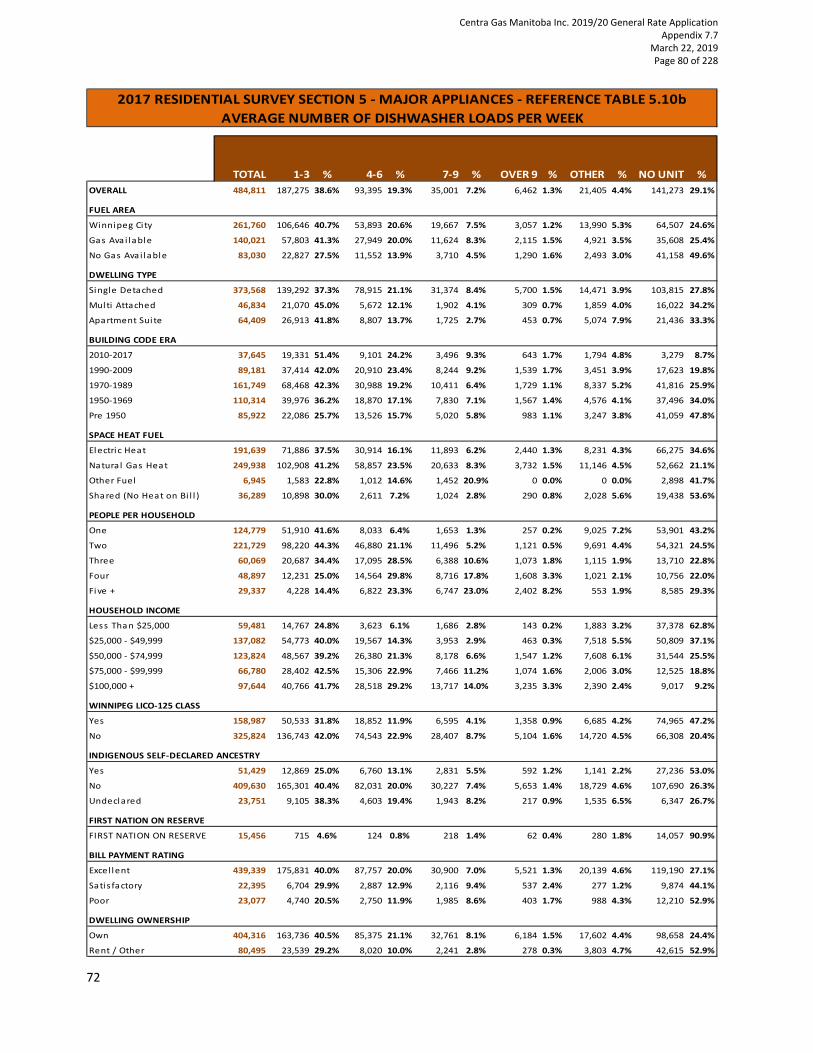
72
5.10b Average Number of Dishwasher Loads per Week
TOTAL 1‐3 % 4‐6 % 7‐9 % OVER 9 % OTHER % NO UNIT %
OVERALL 484,811 187,275 38.6% 93,395 19.3% 35,001 7.2% 6,462 1.3% 21,405 4.4% 141,273 29.1%
FUEL AREA
Winnipeg City 261,760 106,646 40.7% 53,893 20.6% 19,667 7.5% 3,057 1.2% 13,990 5.3% 64,507 24.6%
Gas Avai lable 140,021 57,803 41.3% 27,949 20.0% 11,624 8.3% 2,115 1.5% 4,921 3.5% 35,608 25.4%
No Gas Avai lable 83,030 22,827 27.5% 11,552 13.9% 3,710 4.5% 1,290 1.6% 2,493 3.0% 41,158 49.6%
DWELLING TYPE
Single Detached 373,568 139,292 37.3% 78,915 21.1% 31,374 8.4% 5,700 1.5% 14,471 3.9% 103,815 27.8%
Multi Attached 46,834 21,070 45.0% 5,672 12.1% 1,902 4.1% 309 0.7% 1,859 4.0% 16,022 34.2%
Apartment Sui te 64,409 26,913 41.8% 8,807 13.7% 1,725 2.7% 453 0.7% 5,074 7.9% 21,436 33.3%
BUILDING CODE ERA
2010‐2017 37,645 19,331 51.4% 9,101 24.2% 3,496 9.3% 643 1.7% 1,794 4.8% 3,279 8.7%
1990‐2009 89,181 37,414 42.0% 20,910 23.4% 8,244 9.2% 1,539 1.7% 3,451 3.9% 17,623 19.8%
1970‐1989 161,749 68,468 42.3% 30,988 19.2% 10,411 6.4% 1,729 1.1% 8,337 5.2% 41,816 25.9%
1950‐1969 110,314 39,976 36.2% 18,870 17.1% 7,830 7.1% 1,567 1.4% 4,576 4.1% 37,496 34.0%
Pre 1950 85,922 22,086 25.7% 13,526 15.7% 5,020 5.8% 983 1.1% 3,247 3.8% 41,059 47.8%
SPACE HEAT FUEL
Electric Heat 191,639 71,886 37.5% 30,914 16.1% 11,893 6.2% 2,440 1.3% 8,231 4.3% 66,275 34.6%
Natural Gas Heat 249,938 102,908 41.2% 58,857 23.5% 20,633 8.3% 3,732 1.5% 11,146 4.5% 52,662 21.1%
Other Fuel 6,945 1,583 22.8% 1,012 14.6% 1,452 20.9% 0 0.0% 0 0.0% 2,898 41.7%
Shared (No Heat on Bi l l ) 36,289 10,898 30.0% 2,611 7.2% 1,024 2.8% 290 0.8% 2,028 5.6% 19,438 53.6%
PEOPLE PER HOUSEHOLD
One 124,779 51,910 41.6% 8,033 6.4% 1,653 1.3% 257 0.2% 9,025 7.2% 53,901 43.2%
Two 221,729 98,220 44.3% 46,880 21.1% 11,496 5.2% 1,121 0.5% 9,691 4.4% 54,321 24.5%
Three 60,069 20,687 34.4% 17,095 28.5% 6,388 10.6% 1,073 1.8% 1,115 1.9% 13,710 22.8%
Four 48,897 12,231 25.0% 14,564 29.8% 8,716 17.8% 1,608 3.3% 1,021 2.1% 10,756 22.0%
Five + 29,337 4,228 14.4% 6,822 23.3% 6,747 23.0% 2,402 8.2% 553 1.9% 8,585 29.3%
HOUSEHOLD INCOME
Less Than $25,000 59,481 14,767 24.8% 3,623 6.1% 1,686 2.8% 143 0.2% 1,883 3.2% 37,378 62.8%
$25,000 ‐ $49,999 137,082 54,773 40.0% 19,567 14.3% 3,953 2.9% 463 0.3% 7,518 5.5% 50,809 37.1%
$50,000 ‐ $74,999 123,824 48,567 39.2% 26,380 21.3% 8,178 6.6% 1,547 1.2% 7,608 6.1% 31,544 25.5%
$75,000 ‐ $99,999 66,780 28,402 42.5% 15,306 22.9% 7,466 11.2% 1,074 1.6% 2,006 3.0% 12,525 18.8%
$100,000 + 97,644 40,766 41.7% 28,518 29.2% 13,717 14.0% 3,235 3.3% 2,390 2.4% 9,017 9.2%
WINNIPEG LICO‐125 CLASS
Yes 158,987 50,533 31.8% 18,852 11.9% 6,595 4.1% 1,358 0.9% 6,685 4.2% 74,965 47.2%
No 325,824 136,743 42.0% 74,543 22.9% 28,407 8.7% 5,104 1.6% 14,720 4.5% 66,308 20.4%
INDIGENOUS SELF‐DECLARED ANCESTRY
Yes 51,429 12,869 25.0% 6,760 13.1% 2,831 5.5% 592 1.2% 1,141 2.2% 27,236 53.0%
No 409,630 165,301 40.4% 82,031 20.0% 30,227 7.4% 5,653 1.4% 18,729 4.6% 107,690 26.3%
Undeclared 23,751 9,105 38.3% 4,603 19.4% 1,943 8.2% 217 0.9% 1,535 6.5% 6,347 26.7%
FIRST NATION ON RESERVE
FIRST NATION ON RESERVE 15,456 715 4.6% 124 0.8% 218 1.4% 62 0.4% 280 1.8% 14,057 90.9%
BILL PAYMENT RATING
Excel lent 439,339 175,831 40.0% 87,757 20.0% 30,900 7.0% 5,521 1.3% 20,139 4.6% 119,190 27.1%
Satis factory 22,395 6,704 29.9% 2,887 12.9% 2,116 9.4% 537 2.4% 277 1.2% 9,874 44.1%
Poor 23,077 4,740 20.5% 2,750 11.9% 1,985 8.6% 403 1.7% 988 4.3% 12,210 52.9%
DWELLING OWNERSHIP
Own 404,316 163,736 40.5% 85,375 21.1% 32,761 8.1% 6,184 1.5% 17,602 4.4% 98,658 24.4%
Rent / Other 80,495 23,539 29.2% 8,020 10.0% 2,241 2.8% 278 0.3% 3,803 4.7% 42,615 52.9%
2017 RESIDENTIAL SURVEY SECTION 5 ‐ MAJOR APPLIANCES ‐ REFERENCE TABLE 5.10b
AVERAGE NUMBER OF DISHWASHER LOADS PER WEEK
Centra Gas Manitoba Inc. 2019/20 General Rate Application Appendix 7.7
March 22, 2019 Page 80 of 228

73
5.11a Type of Clothes Washing Machine
TOTAL LAUNDROMAT %
TOP
LOAD %
FRONT
LOAD % OTHER % NO UNIT %
OVERALL 484,811 25,880 5.3% 234,297 48.3% 201,907 41.6% 4,338 0.9% 18,389 3.8%
FUEL AREA
Winnipeg City 261,760 20,431 7.8% 120,672 46.1% 108,551 41.5% 1,223 0.5% 10,882 4.2%
Gas Avai lable 140,021 3,337 2.4% 68,467 48.9% 62,890 44.9% 2,034 1.5% 3,293 2.4%
No Gas Ava i lable 83,030 2,112 2.5% 45,158 54.4% 30,466 36.7% 1,081 1.3% 4,213 5.1%
DWELLING TYPE
Single Detached 373,568 2,310 0.6% 192,276 51.5% 168,184 45.0% 2,165 0.6% 8,633 2.3%
Multi Attached 46,834 1,089 2.3% 24,028 51.3% 17,310 37.0% 1,462 3.1% 2,944 6.3%
Apartment Sui te 64,409 22,482 34.9% 17,992 27.9% 16,413 25.5% 710 1.1% 6,812 10.6%
BUILDING CODE ERA
2010‐2017 37,645 369 1.0% 10,097 26.8% 26,117 69.4% 396 1.1% 666 1.8%
1990‐2009 89,181 1,250 1.4% 39,169 43.9% 45,982 51.6% 1,081 1.2% 1,699 1.9%
1970‐1989 161,749 7,921 4.9% 83,482 51.6% 63,099 39.0% 1,137 0.7% 6,110 3.8%
1950‐1969 110,314 11,073 10.0% 54,924 49.8% 38,186 34.6% 863 0.8% 5,269 4.8%
Pre 1950 85,922 5,267 6.1% 46,625 54.3% 28,523 33.2% 862 1.0% 4,646 5.4%
SPACE HEAT FUEL
Electric Heat 191,639 7,284 3.8% 94,255 49.2% 78,193 40.8% 2,245 1.2% 9,662 5.0%
Natura l Gas Heat 249,938 1,747 0.7% 128,904 51.6% 114,919 46.0% 861 0.3% 3,507 1.4%
Other Fuel 6,945 0 0.0% 4,716 67.9% 2,098 30.2% 0 0.0% 131 1.9%
Shared (No Heat on Bi l l ) 36,289 16,849 46.4% 6,422 17.7% 6,697 18.5% 1,232 3.4% 5,089 14.0%
PEOPLE PER HOUSEHOLD
One 124,779 15,326 12.3% 66,185 53.0% 31,376 25.1% 1,722 1.4% 10,172 8.2%
Two 221,729 9,024 4.1% 111,728 50.4% 93,024 42.0% 1,957 0.9% 5,996 2.7%
Three 60,069 959 1.6% 27,114 45.1% 30,902 51.4% 124 0.2% 971 1.6%
Four 48,897 317 0.6% 18,688 38.2% 28,843 59.0% 317 0.6% 732 1.5%
Five + 29,337 255 0.9% 10,583 36.1% 17,763 60.5% 218 0.7% 518 1.8%
HOUSEHOLD INCOME
Less Than $25,000 59,481 7,336 12.3% 34,605 58.2% 10,865 18.3% 1,062 1.8% 5,614 9.4%
$25,000 ‐ $49,999 137,082 7,821 5.7% 76,531 55.8% 43,896 32.0% 1,812 1.3% 7,022 5.1%
$50,000 ‐ $74,999 123,824 6,803 5.5% 58,607 47.3% 54,256 43.8% 1,252 1.0% 2,906 2.3%
$75,000 ‐ $99,999 66,780 2,050 3.1% 27,924 41.8% 34,580 51.8% 212 0.3% 2,013 3.0%
$100,000 + 97,644 1,871 1.9% 36,629 37.5% 58,310 59.7% 0 0.0% 834 0.9%
WINNIPEG LICO‐125 CLASS
Yes 158,987 12,081 7.6% 87,605 55.1% 46,751 29.4% 2,580 1.6% 9,970 6.3%
No 325,824 13,799 4.2% 146,692 45.0% 155,156 47.6% 1,757 0.5% 8,419 2.6%
INDIGENOUS SELF‐DECLARED ANCESTRY
Yes 51,429 3,336 6.5% 25,224 49.0% 19,098 37.1% 1,190 2.3% 2,581 5.0%
No 409,630 22,112 5.4% 196,737 48.0% 172,773 42.2% 3,148 0.8% 14,861 3.6%
Undeclared 23,751 432 1.8% 12,336 51.9% 10,036 42.3% 0 0.0% 948 4.0%
FIRST NATION ON RESERVE
FIRST NATION ON RESERVE 15,456 286 1.8% 9,506 61.5% 4,072 26.3% 591 3.8% 1,002 6.5%
BILL PAYMENT RATING
Excel lent 439,339 23,595 5.4% 211,053 48.0% 185,507 42.2% 3,797 0.9% 15,386 3.5%
Satis factory 22,395 1,106 4.9% 11,105 49.6% 8,577 38.3% 124 0.6% 1,483 6.6%
Poor 23,077 1,179 5.1% 12,139 52.6% 7,823 33.9% 416 1.8% 1,520 6.6%
DWELLING OWNERSHIP
Own 404,316 4,795 1.2% 202,625 50.1% 184,664 45.7% 2,376 0.6% 9,856 2.4%
Rent / Other 80,495 21,085 26.2% 31,672 39.3% 17,243 21.4% 1,961 2.4% 8,533 10.6%
2017 RESIDENTIAL SURVEY SECTION 5 ‐ MAJOR APPLIANCES ‐ REFERENCE TABLE 5.11a
TYPE OF CLOTHES WASHING MACHINE
Centra Gas Manitoba Inc. 2019/20 General Rate Application Appendix 7.7
March 22, 2019 Page 81 of 228

74
5.11b Average Number of Clothes Washer Loads per Week
TOTAL 1‐3 % 4‐6 % 7‐9 % OVER 9 %
LAUND
ROMAT % OTHER %
NO
UNIT %
OVERALL 484,811 247,800 51.1% 138,598 28.6% 37,582 7.8% 16,295 3.4% 25,880 5.3% 266 0.1% 18,389 3.8%
FUEL AREA
Winnipeg City 261,760 137,233 52.4% 69,106 26.4% 17,232 6.6% 6,721 2.6% 20,431 7.8% 154 0.1% 10,882 4.2%
Gas Avai lable 140,021 70,070 50.0% 45,823 32.7% 12,631 9.0% 4,867 3.5% 3,337 2.4% 0 0.0% 3,293 2.4%
No Gas Avai lable 83,030 40,498 48.8% 23,669 28.5% 7,719 9.3% 4,707 5.7% 2,112 2.5% 112 0.1% 4,213 5.1%
DWELLING TYPE
Single Detached 373,568 195,761 52.4% 117,639 31.5% 34,109 9.1% 15,005 4.0% 2,310 0.6% 112 0.0% 8,633 2.3%
Multi Attached 46,834 27,193 58.1% 12,970 27.7% 2,075 4.4% 407 0.9% 1,089 2.3% 154 0.3% 2,944 6.3%
Apartment Sui te 64,409 24,846 38.6% 7,989 12.4% 1,398 2.2% 883 1.4% 22,482 34.9% 0 0.0% 6,812 10.6%
BUILDING CODE ERA
2010‐2017 37,645 20,162 53.6% 11,014 29.3% 3,487 9.3% 1,946 5.2% 369 1.0% 0 0.0% 666 1.8%
1990‐2009 89,181 41,996 47.1% 30,913 34.7% 9,445 10.6% 3,878 4.3% 1,250 1.4% 0 0.0% 1,699 1.9%
1970‐1989 161,749 83,824 51.8% 47,048 29.1% 11,674 7.2% 4,905 3.0% 7,921 4.9% 266 0.2% 6,110 3.8%
1950‐1969 110,314 53,677 48.7% 29,122 26.4% 8,253 7.5% 2,921 2.6% 11,073 10.0% 0 0.0% 5,269 4.8%
Pre 1950 85,922 48,142 56.0% 20,501 23.9% 4,722 5.5% 2,645 3.1% 5,267 6.1% 0 0.0% 4,646 5.4%
SPACE HEAT FUEL
Electric Heat 191,639 96,315 50.3% 54,985 28.7% 15,355 8.0% 7,926 4.1% 7,284 3.8% 112 0.1% 9,662 5.0%
Natura l Gas Heat 249,938 138,013 55.2% 77,410 31.0% 20,932 8.4% 8,175 3.3% 1,747 0.7% 154 0.1% 3,507 1.4%
Other Fuel 6,945 3,957 57.0% 2,301 33.1% 425 6.1% 131 1.9% 0 0.0% 0 0.0% 131 1.9%
Shared (No Heat on Bi l l ) 36,289 9,516 26.2% 3,901 10.8% 870 2.4% 63 0.2% 16,849 46.4% 0 0.0% 5,089 14.0%
PEOPLE PER HOUSEHOLD
One 124,779 85,451 68.5% 11,018 8.8% 1,316 1.1% 1,230 1.0% 15,326 12.3% 266 0.2% 10,172 8.2%
Two 221,729 125,101 56.4% 69,361 31.3% 9,857 4.4% 2,390 1.1% 9,024 4.1% 0 0.0% 5,996 2.7%
Three 60,069 21,390 35.6% 27,591 45.9% 7,603 12.7% 1,555 2.6% 959 1.6% 0 0.0% 971 1.6%
Four 48,897 11,286 23.1% 21,837 44.7% 9,772 20.0% 4,952 10.1% 317 0.6% 0 0.0% 732 1.5%
Five + 29,337 4,572 15.6% 8,791 30.0% 9,033 30.8% 6,168 21.0% 255 0.9% 0 0.0% 518 1.8%
HOUSEHOLD INCOME
Less Than $25,000 59,481 32,120 54.0% 10,235 17.2% 2,035 3.4% 2,141 3.6% 7,336 12.3% 0 0.0% 5,614 9.4%
$25,000 ‐ $49,999 137,082 82,543 60.2% 30,290 22.1% 6,343 4.6% 2,953 2.2% 7,821 5.7% 112 0.1% 7,022 5.1%
$50,000 ‐ $74,999 123,824 62,136 50.2% 38,893 31.4% 9,702 7.8% 3,230 2.6% 6,803 5.5% 154 0.1% 2,906 2.3%
$75,000 ‐ $99,999 66,780 30,950 46.3% 22,535 33.7% 6,121 9.2% 3,110 4.7% 2,050 3.1% 0 0.0% 2,013 3.0%
$100,000 + 97,644 40,050 41.0% 36,646 37.5% 13,381 13.7% 4,861 5.0% 1,871 1.9% 0 0.0% 834 0.9%
WINNIPEG LICO‐125 CLASS
Yes 158,987 85,619 53.9% 35,622 22.4% 9,458 5.9% 6,125 3.9% 12,081 7.6% 112 0.1% 9,970 6.3%
No 325,824 162,181 49.8% 102,976 31.6% 28,124 8.6% 10,170 3.1% 13,799 4.2% 154 0.0% 8,419 2.6%
INDIGENOUS SELF‐DECLARED ANCESTRY
Yes 51,429 19,564 38.0% 16,249 31.6% 6,605 12.8% 3,095 6.0% 3,336 6.5% 0 0.0% 2,581 5.0%
No 409,630 214,915 52.5% 115,920 28.3% 29,284 7.1% 12,273 3.0% 22,112 5.4% 266 0.1% 14,861 3.6%
Undeclared 23,751 13,321 56.1% 6,429 27.1% 1,694 7.1% 928 3.9% 432 1.8% 0 0.0% 948 4.0%
FIRST NATION ON RESERVE
FIRST NATION ON RESERVE 15,456 5,011 32.4% 4,507 29.2% 2,561 16.6% 2,090 13.5% 286 1.8% 0 0.0% 1,002 6.5%
BILL PAYMENT RATING
Excel lent 439,339 229,533 52.2% 126,134 28.7% 31,964 7.3% 12,461 2.8% 23,595 5.4% 266 0.1% 15,386 3.5%
Satis factory 22,395 9,909 44.2% 5,837 26.1% 2,372 10.6% 1,688 7.5% 1,106 4.9% 0 0.0% 1,483 6.6%
Poor 23,077 8,358 36.2% 6,628 28.7% 3,246 14.1% 2,145 9.3% 1,179 5.1% 0 0.0% 1,520 6.6%
DWELLING OWNERSHIP
Own 404,316 217,883 53.9% 124,998 30.9% 33,676 8.3% 12,842 3.2% 4,795 1.2% 266 0.1% 9,856 2.4%
Rent / Other 80,495 29,918 37.2% 13,601 16.9% 3,905 4.9% 3,453 4.3% 21,085 26.2% 0 0.0% 8,533 10.6%
2017 RESIDENTIAL SURVEY SECTION 5 ‐ MAJOR APPLIANCES ‐ REFERENCE TABLE 5.11b
AVERAGE NUMBER OF CLOTHES WASHER LOADS PER WEEK
Centra Gas Manitoba Inc. 2019/20 General Rate Application Appendix 7.7
March 22, 2019 Page 82 of 228
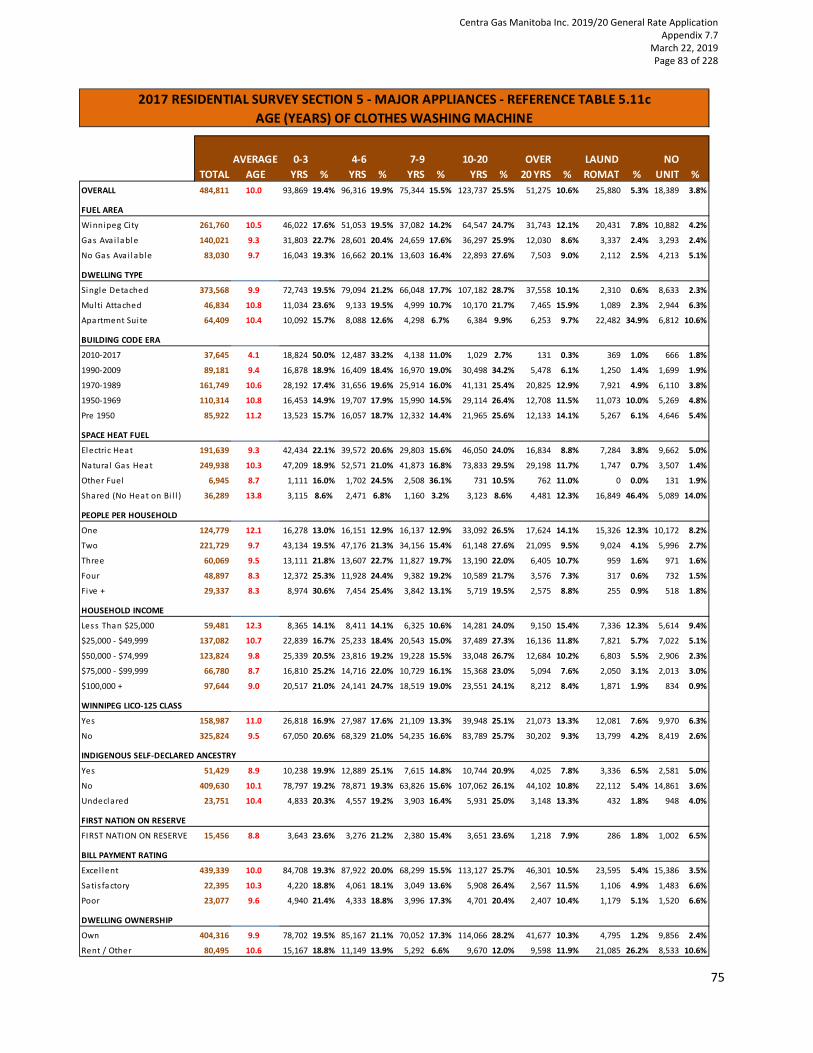
75
5.11c Age (Years) of Clothes Washing Machine
TOTAL
AVERAGE
AGE
0‐3
YRS %
4‐6
YRS %
7‐9
YRS %
10‐20
YRS %
OVER
20 YRS %
LAUND
ROMAT %
NO
UNIT %
OVERALL 484,811 10.0 93,869 19.4% 96,316 19.9% 75,344 15.5% 123,737 25.5% 51,275 10.6% 25,880 5.3% 18,389 3.8%
FUEL AREA
Winnipeg City 261,760 10.5 46,022 17.6% 51,053 19.5% 37,082 14.2% 64,547 24.7% 31,743 12.1% 20,431 7.8% 10,882 4.2%
Gas Avai lable 140,021 9.3 31,803 22.7% 28,601 20.4% 24,659 17.6% 36,297 25.9% 12,030 8.6% 3,337 2.4% 3,293 2.4%
No Gas Avai lable 83,030 9.7 16,043 19.3% 16,662 20.1% 13,603 16.4% 22,893 27.6% 7,503 9.0% 2,112 2.5% 4,213 5.1%
DWELLING TYPE
Single Detached 373,568 9.9 72,743 19.5% 79,094 21.2% 66,048 17.7% 107,182 28.7% 37,558 10.1% 2,310 0.6% 8,633 2.3%
Multi Attached 46,834 10.8 11,034 23.6% 9,133 19.5% 4,999 10.7% 10,170 21.7% 7,465 15.9% 1,089 2.3% 2,944 6.3%
Apartment Sui te 64,409 10.4 10,092 15.7% 8,088 12.6% 4,298 6.7% 6,384 9.9% 6,253 9.7% 22,482 34.9% 6,812 10.6%
BUILDING CODE ERA
2010‐2017 37,645 4.1 18,824 50.0% 12,487 33.2% 4,138 11.0% 1,029 2.7% 131 0.3% 369 1.0% 666 1.8%
1990‐2009 89,181 9.4 16,878 18.9% 16,409 18.4% 16,970 19.0% 30,498 34.2% 5,478 6.1% 1,250 1.4% 1,699 1.9%
1970‐1989 161,749 10.6 28,192 17.4% 31,656 19.6% 25,914 16.0% 41,131 25.4% 20,825 12.9% 7,921 4.9% 6,110 3.8%
1950‐1969 110,314 10.8 16,453 14.9% 19,707 17.9% 15,990 14.5% 29,114 26.4% 12,708 11.5% 11,073 10.0% 5,269 4.8%
Pre 1950 85,922 11.2 13,523 15.7% 16,057 18.7% 12,332 14.4% 21,965 25.6% 12,133 14.1% 5,267 6.1% 4,646 5.4%
SPACE HEAT FUEL
Electric Heat 191,639 9.3 42,434 22.1% 39,572 20.6% 29,803 15.6% 46,050 24.0% 16,834 8.8% 7,284 3.8% 9,662 5.0%
Natural Gas Heat 249,938 10.3 47,209 18.9% 52,571 21.0% 41,873 16.8% 73,833 29.5% 29,198 11.7% 1,747 0.7% 3,507 1.4%
Other Fuel 6,945 8.7 1,111 16.0% 1,702 24.5% 2,508 36.1% 731 10.5% 762 11.0% 0 0.0% 131 1.9%
Shared (No Heat on Bi l l ) 36,289 13.8 3,115 8.6% 2,471 6.8% 1,160 3.2% 3,123 8.6% 4,481 12.3% 16,849 46.4% 5,089 14.0%
PEOPLE PER HOUSEHOLD
One 124,779 12.1 16,278 13.0% 16,151 12.9% 16,137 12.9% 33,092 26.5% 17,624 14.1% 15,326 12.3% 10,172 8.2%
Two 221,729 9.7 43,134 19.5% 47,176 21.3% 34,156 15.4% 61,148 27.6% 21,095 9.5% 9,024 4.1% 5,996 2.7%
Three 60,069 9.5 13,111 21.8% 13,607 22.7% 11,827 19.7% 13,190 22.0% 6,405 10.7% 959 1.6% 971 1.6%
Four 48,897 8.3 12,372 25.3% 11,928 24.4% 9,382 19.2% 10,589 21.7% 3,576 7.3% 317 0.6% 732 1.5%
Five + 29,337 8.3 8,974 30.6% 7,454 25.4% 3,842 13.1% 5,719 19.5% 2,575 8.8% 255 0.9% 518 1.8%
HOUSEHOLD INCOME
Less Than $25,000 59,481 12.3 8,365 14.1% 8,411 14.1% 6,325 10.6% 14,281 24.0% 9,150 15.4% 7,336 12.3% 5,614 9.4%
$25,000 ‐ $49,999 137,082 10.7 22,839 16.7% 25,233 18.4% 20,543 15.0% 37,489 27.3% 16,136 11.8% 7,821 5.7% 7,022 5.1%
$50,000 ‐ $74,999 123,824 9.8 25,339 20.5% 23,816 19.2% 19,228 15.5% 33,048 26.7% 12,684 10.2% 6,803 5.5% 2,906 2.3%
$75,000 ‐ $99,999 66,780 8.7 16,810 25.2% 14,716 22.0% 10,729 16.1% 15,368 23.0% 5,094 7.6% 2,050 3.1% 2,013 3.0%
$100,000 + 97,644 9.0 20,517 21.0% 24,141 24.7% 18,519 19.0% 23,551 24.1% 8,212 8.4% 1,871 1.9% 834 0.9%
WINNIPEG LICO‐125 CLASS
Yes 158,987 11.0 26,818 16.9% 27,987 17.6% 21,109 13.3% 39,948 25.1% 21,073 13.3% 12,081 7.6% 9,970 6.3%
No 325,824 9.5 67,050 20.6% 68,329 21.0% 54,235 16.6% 83,789 25.7% 30,202 9.3% 13,799 4.2% 8,419 2.6%
INDIGENOUS SELF‐DECLARED ANCESTRY
Yes 51,429 8.9 10,238 19.9% 12,889 25.1% 7,615 14.8% 10,744 20.9% 4,025 7.8% 3,336 6.5% 2,581 5.0%
No 409,630 10.1 78,797 19.2% 78,871 19.3% 63,826 15.6% 107,062 26.1% 44,102 10.8% 22,112 5.4% 14,861 3.6%
Undeclared 23,751 10.4 4,833 20.3% 4,557 19.2% 3,903 16.4% 5,931 25.0% 3,148 13.3% 432 1.8% 948 4.0%
FIRST NATION ON RESERVE
FIRST NATION ON RESERVE 15,456 8.8 3,643 23.6% 3,276 21.2% 2,380 15.4% 3,651 23.6% 1,218 7.9% 286 1.8% 1,002 6.5%
BILL PAYMENT RATING
Excel lent 439,339 10.0 84,708 19.3% 87,922 20.0% 68,299 15.5% 113,127 25.7% 46,301 10.5% 23,595 5.4% 15,386 3.5%
Satis factory 22,395 10.3 4,220 18.8% 4,061 18.1% 3,049 13.6% 5,908 26.4% 2,567 11.5% 1,106 4.9% 1,483 6.6%
Poor 23,077 9.6 4,940 21.4% 4,333 18.8% 3,996 17.3% 4,701 20.4% 2,407 10.4% 1,179 5.1% 1,520 6.6%
DWELLING OWNERSHIP
Own 404,316 9.9 78,702 19.5% 85,167 21.1% 70,052 17.3% 114,066 28.2% 41,677 10.3% 4,795 1.2% 9,856 2.4%
Rent / Other 80,495 10.6 15,167 18.8% 11,149 13.9% 5,292 6.6% 9,670 12.0% 9,598 11.9% 21,085 26.2% 8,533 10.6%
2017 RESIDENTIAL SURVEY SECTION 5 ‐ MAJOR APPLIANCES ‐ REFERENCE TABLE 5.11c
AGE (YEARS) OF CLOTHES WASHING MACHINE
Centra Gas Manitoba Inc. 2019/20 General Rate Application Appendix 7.7
March 22, 2019 Page 83 of 228

76
5.12a Type of Fuel Used for Clothes Dryer
TOTAL ELECTRIC %
NATURAL
GAS % PROPANE % LAUNDROMAT % NO UNIT %
OVERALL 484,811 424,768 87.6% 13,881 2.9% 1,490 0.3% 25,880 5.3% 18,791 3.9%
FUEL AREA
Winnipeg City 261,760 218,072 83.3% 10,637 4.1% 1,095 0.4% 20,431 7.8% 11,526 4.4%
Gas Avai lable 140,021 130,552 93.2% 3,244 2.3% 252 0.2% 3,337 2.4% 2,635 1.9%
No Gas Avai lable 83,030 76,144 91.7% 0 0.0% 143 0.2% 2,112 2.5% 4,631 5.6%
DWELLING TYPE
Single Detached 373,568 348,437 93.3% 13,573 3.6% 243 0.1% 2,310 0.6% 9,006 2.4%
Multi Attached 46,834 41,740 89.1% 309 0.7% 596 1.3% 1,089 2.3% 3,101 6.6%
Apartment Sui te 64,409 34,592 53.7% 0 0.0% 651 1.0% 22,482 34.9% 6,684 10.4%
BUILDING CODE ERA
2010‐2017 37,645 36,360 96.6% 103 0.3% 326 0.9% 369 1.0% 488 1.3%
1990‐2009 89,181 84,260 94.5% 1,419 1.6% 284 0.3% 1,250 1.4% 1,969 2.2%
1970‐1989 161,749 143,458 88.7% 3,115 1.9% 437 0.3% 7,921 4.9% 6,817 4.2%
1950‐1969 110,314 88,775 80.5% 5,839 5.3% 0 0.0% 11,073 10.0% 4,628 4.2%
Pre 1950 85,922 71,916 83.7% 3,406 4.0% 444 0.5% 5,267 6.1% 4,889 5.7%
SPACE HEAT FUEL
Electric Heat 191,639 173,607 90.6% 168 0.1% 1,046 0.5% 7,284 3.8% 9,533 5.0%
Natura l Gas Heat 249,938 230,487 92.2% 13,713 5.5% 0 0.0% 1,747 0.7% 3,990 1.6%
Other Fuel 6,945 6,476 93.3% 0 0.0% 0 0.0% 0 0.0% 469 6.7%
Shared (No Heat on Bi l l ) 36,289 14,197 39.1% 0 0.0% 444 1.2% 16,849 46.4% 4,799 13.2%
PEOPLE PER HOUSEHOLD
One 124,779 96,038 77.0% 2,240 1.8% 426 0.3% 15,326 12.3% 10,750 8.6%
Two 221,729 197,808 89.2% 8,300 3.7% 1,033 0.5% 9,024 4.1% 5,564 2.5%
Three 60,069 56,691 94.4% 1,694 2.8% 0 0.0% 959 1.6% 726 1.2%
Four 48,897 45,996 94.1% 1,111 2.3% 0 0.0% 317 0.6% 1,472 3.0%
Five + 29,337 28,235 96.2% 537 1.8% 31 0.1% 255 0.9% 279 0.9%
HOUSEHOLD INCOME
Less Than $25,000 59,481 45,840 77.1% 664 1.1% 143 0.2% 7,336 12.3% 5,499 9.2%
$25,000 ‐ $49,999 137,082 117,128 85.4% 4,641 3.4% 640 0.5% 7,821 5.7% 6,852 5.0%
$50,000 ‐ $74,999 123,824 109,632 88.5% 3,587 2.9% 0 0.0% 6,803 5.5% 3,802 3.1%
$75,000 ‐ $99,999 66,780 60,464 90.5% 2,364 3.5% 263 0.4% 2,050 3.1% 1,638 2.5%
$100,000 + 97,644 91,704 93.9% 2,626 2.7% 444 0.5% 1,871 1.9% 1,000 1.0%
WINNIPEG LICO‐125 CLASS
Yes 158,987 132,773 83.5% 3,856 2.4% 620 0.4% 12,081 7.6% 9,657 6.1%
No 325,824 291,995 89.6% 10,025 3.1% 870 0.3% 13,799 4.2% 9,134 2.8%
INDIGENOUS SELF‐DECLARED ANCESTRY
Yes 51,429 44,683 86.9% 574 1.1% 305 0.6% 3,336 6.5% 2,531 4.9%
No 409,630 359,074 87.7% 12,100 3.0% 1,184 0.3% 22,112 5.4% 15,160 3.7%
Undeclared 23,751 21,011 88.5% 1,207 5.1% 0 0.0% 432 1.8% 1,101 4.6%
FIRST NATION ON RESERVE
FIRST NATION ON RESERVE 15,456 13,996 90.6% 0 0.0% 31 0.2% 286 1.8% 1,143 7.4%
BILL PAYMENT RATING
Excel lent 439,339 385,907 87.8% 12,833 2.9% 1,144 0.3% 23,595 5.4% 15,859 3.6%
Satis factory 22,395 18,964 84.7% 562 2.5% 183 0.8% 1,106 4.9% 1,580 7.1%
Poor 23,077 19,897 86.2% 486 2.1% 163 0.7% 1,179 5.1% 1,352 5.9%
DWELLING OWNERSHIP
Own 404,316 373,718 92.4% 13,664 3.4% 981 0.2% 4,795 1.2% 11,158 2.8%
Rent / Other 80,495 51,050 63.4% 217 0.3% 509 0.6% 21,085 26.2% 7,634 9.5%
2017 RESIDENTIAL SURVEY SECTION 5 ‐ MAJOR APPLIANCES ‐ REFERENCE TABLE 5.12a
TYPE OF FUEL USED FOR CLOTHES DRYER
Centra Gas Manitoba Inc. 2019/20 General Rate Application Appendix 7.7
March 22, 2019 Page 84 of 228

77
5.12b Average Number of Clothes Dryer Loads per Week
TOTAL 1‐3 % 4‐6 % 7‐9 % OVER 9 %
LAUND
ROMAT % OTHER %
NO
UNIT %
OVERALL 484,811 248,156 51.2% 135,717 28.0% 40,861 8.4% 14,849 3.1% 25,880 5.3% 556 0.1% 18,791 3.9%
FUEL AREA
Winnipeg City 261,760 137,079 52.4% 67,740 25.9% 18,604 7.1% 5,936 2.3% 20,431 7.8% 444 0.2% 11,526 4.4%
Gas Avai lable 140,021 71,004 50.7% 44,856 32.0% 13,828 9.9% 4,361 3.1% 3,337 2.4% 0 0.0% 2,635 1.9%
No Gas Avai lable 83,030 40,073 48.3% 23,121 27.8% 8,430 10.2% 4,551 5.5% 2,112 2.5% 112 0.1% 4,631 5.6%
DWELLING TYPE
Single Detached 373,568 196,241 52.5% 115,195 30.8% 36,820 9.9% 13,885 3.7% 2,310 0.6% 112 0.0% 9,006 2.4%
Multi Attached 46,834 26,542 56.7% 12,897 27.5% 2,644 5.6% 407 0.9% 1,089 2.3% 154 0.3% 3,101 6.6%
Apartment Sui te 64,409 25,373 39.4% 7,625 11.8% 1,398 2.2% 557 0.9% 22,482 34.9% 290 0.5% 6,684 10.4%
BUILDING CODE ERA
2010‐2017 37,645 20,363 54.1% 10,947 29.1% 3,580 9.5% 1,898 5.0% 369 1.0% 0 0.0% 488 1.3%
1990‐2009 89,181 41,612 46.7% 30,734 34.5% 9,963 11.2% 3,653 4.1% 1,250 1.4% 0 0.0% 1,969 2.2%
1970‐1989 161,749 83,852 51.8% 45,961 28.4% 12,652 7.8% 4,279 2.6% 7,921 4.9% 266 0.2% 6,817 4.2%
1950‐1969 110,314 53,978 48.9% 28,733 26.0% 8,680 7.9% 2,933 2.7% 11,073 10.0% 290 0.3% 4,628 4.2%
Pre 1950 85,922 48,352 56.3% 19,342 22.5% 5,986 7.0% 2,086 2.4% 5,267 6.1% 0 0.0% 4,889 5.7%
SPACE HEAT FUEL
Electri c Heat 191,639 97,151 50.7% 53,641 28.0% 16,775 8.8% 7,144 3.7% 7,284 3.8% 112 0.1% 9,533 5.0%
Natura l Gas Heat 249,938 137,870 55.2% 76,211 30.5% 22,454 9.0% 7,511 3.0% 1,747 0.7% 154 0.1% 3,990 1.6%
Other Fuel 6,945 3,619 52.1% 1,964 28.3% 762 11.0% 131 1.9% 0 0.0% 0 0.0% 469 6.7%
Shared (No Heat on Bi l l ) 36,289 9,516 26.2% 3,901 10.8% 870 2.4% 63 0.2% 16,849 46.4% 290 0.8% 4,799 13.2%
PEOPLE PER HOUSEHOLD
One 124,779 84,483 67.7% 11,138 8.9% 1,378 1.1% 1,149 0.9% 15,326 12.3% 556 0.4% 10,750 8.6%
Two 221,729 124,766 56.3% 67,444 30.4% 13,105 5.9% 1,825 0.8% 9,024 4.1% 0 0.0% 5,564 2.5%
Three 60,069 22,749 37.9% 25,971 43.2% 7,765 12.9% 1,900 3.2% 959 1.6% 0 0.0% 726 1.2%
Four 48,897 11,944 24.4% 21,641 44.3% 9,421 19.3% 4,102 8.4% 317 0.6% 0 0.0% 1,472 3.0%
Five + 29,337 4,215 14.4% 9,523 32.5% 9,191 31.3% 5,874 20.0% 255 0.9% 0 0.0% 279 0.9%
HOUSEHOLD INCOME
Less Than $25,000 59,481 31,791 53.4% 9,863 16.6% 2,945 5.0% 2,048 3.4% 7,336 12.3% 0 0.0% 5,499 9.2%
$25,000 ‐ $49,999 137,082 82,652 60.3% 29,320 21.4% 7,224 5.3% 2,812 2.1% 7,821 5.7% 402 0.3% 6,852 5.0%
$50,000 ‐ $74,999 123,824 61,171 49.4% 39,233 31.7% 10,152 8.2% 2,507 2.0% 6,803 5.5% 154 0.1% 3,802 3.1%
$75,000 ‐ $99,999 66,780 31,506 47.2% 22,225 33.3% 6,554 9.8% 2,807 4.2% 2,050 3.1% 0 0.0% 1,638 2.5%
$100,000 + 97,644 41,036 42.0% 35,076 35.9% 13,986 14.3% 4,675 4.8% 1,871 1.9% 0 0.0% 1,000 1.0%
WINNIPEG LICO‐125 CLASS
Yes 158,987 85,781 54.0% 34,758 21.9% 10,786 6.8% 5,522 3.5% 12,081 7.6% 402 0.3% 9,657 6.1%
No 325,824 162,375 49.8% 100,959 31.0% 30,075 9.2% 9,327 2.9% 13,799 4.2% 154 0.0% 9,134 2.8%
INDIGENOUS SELF‐DECLARED ANCESTRY
Yes 51,429 19,430 37.8% 16,198 31.5% 7,193 14.0% 2,741 5.3% 3,336 6.5% 0 0.0% 2,531 4.9%
No 409,630 215,703 52.7% 112,811 27.5% 32,077 7.8% 11,212 2.7% 22,112 5.4% 556 0.1% 15,160 3.7%
Undeclared 23,751 13,023 54.8% 6,708 28.2% 1,591 6.7% 896 3.8% 432 1.8% 0 0.0% 1,101 4.6%
FIRST NATION ON RESERVE
FIRST NATION ON RESERVE 15,456 4,564 29.5% 4,563 29.5% 2,934 19.0% 1,965 12.7% 286 1.8% 0 0.0% 1,143 7.4%
BILL PAYMENT RATING
Excel lent 439,339 229,791 52.3% 123,785 28.2% 34,604 7.9% 11,149 2.5% 23,595 5.4% 556 0.1% 15,859 3.6%
Sati s factory 22,395 9,988 44.6% 5,598 25.0% 2,599 11.6% 1,524 6.8% 1,106 4.9% 0 0.0% 1,580 7.1%
Poor 23,077 8,377 36.3% 6,334 27.4% 3,658 15.9% 2,176 9.4% 1,179 5.1% 0 0.0% 1,352 5.9%
DWELLING OWNERSHIP
Own 404,316 218,060 53.9% 122,151 30.2% 36,172 8.9% 11,714 2.9% 4,795 1.2% 266 0.1% 11,158 2.8%
Rent / Other 80,495 30,096 37.4% 13,566 16.9% 4,689 5.8% 3,135 3.9% 21,085 26.2% 290 0.4% 7,634 9.5%
2017 RESIDENTIAL SURVEY SECTION 5 ‐ MAJOR APPLIANCES ‐ REFERENCE TABLE 5.12b
AVERAGE NUMBER OF CLOTHES DRYER LOADS PER WEEK
Centra Gas Manitoba Inc. 2019/20 General Rate Application Appendix 7.7
March 22, 2019 Page 85 of 228
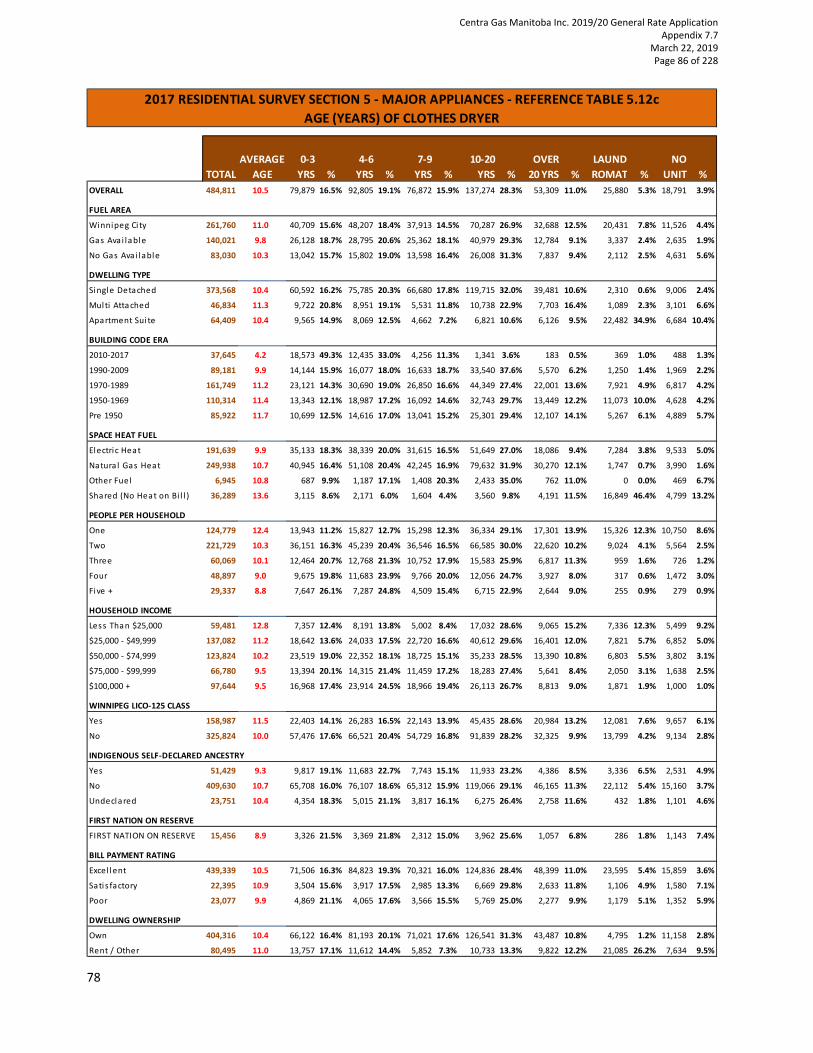
78
5.12c Age (Years) of Clothes Dryer
TOTAL
AVERAGE
AGE
0‐3
YRS %
4‐6
YRS %
7‐9
YRS %
10‐20
YRS %
OVER
20 YRS %
LAUND
ROMAT %
NO
UNIT %
OVERALL 484,811 10.5 79,879 16.5% 92,805 19.1% 76,872 15.9% 137,274 28.3% 53,309 11.0% 25,880 5.3% 18,791 3.9%
FUEL AREA
Winnipeg City 261,760 11.0 40,709 15.6% 48,207 18.4% 37,913 14.5% 70,287 26.9% 32,688 12.5% 20,431 7.8% 11,526 4.4%
Gas Avai lable 140,021 9.8 26,128 18.7% 28,795 20.6% 25,362 18.1% 40,979 29.3% 12,784 9.1% 3,337 2.4% 2,635 1.9%
No Gas Avai lable 83,030 10.3 13,042 15.7% 15,802 19.0% 13,598 16.4% 26,008 31.3% 7,837 9.4% 2,112 2.5% 4,631 5.6%
DWELLING TYPE
Single Detached 373,568 10.4 60,592 16.2% 75,785 20.3% 66,680 17.8% 119,715 32.0% 39,481 10.6% 2,310 0.6% 9,006 2.4%
Multi Attached 46,834 11.3 9,722 20.8% 8,951 19.1% 5,531 11.8% 10,738 22.9% 7,703 16.4% 1,089 2.3% 3,101 6.6%
Apartment Sui te 64,409 10.4 9,565 14.9% 8,069 12.5% 4,662 7.2% 6,821 10.6% 6,126 9.5% 22,482 34.9% 6,684 10.4%
BUILDING CODE ERA
2010‐2017 37,645 4.2 18,573 49.3% 12,435 33.0% 4,256 11.3% 1,341 3.6% 183 0.5% 369 1.0% 488 1.3%
1990‐2009 89,181 9.9 14,144 15.9% 16,077 18.0% 16,633 18.7% 33,540 37.6% 5,570 6.2% 1,250 1.4% 1,969 2.2%
1970‐1989 161,749 11.2 23,121 14.3% 30,690 19.0% 26,850 16.6% 44,349 27.4% 22,001 13.6% 7,921 4.9% 6,817 4.2%
1950‐1969 110,314 11.4 13,343 12.1% 18,987 17.2% 16,092 14.6% 32,743 29.7% 13,449 12.2% 11,073 10.0% 4,628 4.2%
Pre 1950 85,922 11.7 10,699 12.5% 14,616 17.0% 13,041 15.2% 25,301 29.4% 12,107 14.1% 5,267 6.1% 4,889 5.7%
SPACE HEAT FUEL
Electric Heat 191,639 9.9 35,133 18.3% 38,339 20.0% 31,615 16.5% 51,649 27.0% 18,086 9.4% 7,284 3.8% 9,533 5.0%
Natura l Gas Heat 249,938 10.7 40,945 16.4% 51,108 20.4% 42,245 16.9% 79,632 31.9% 30,270 12.1% 1,747 0.7% 3,990 1.6%
Other Fuel 6,945 10.8 687 9.9% 1,187 17.1% 1,408 20.3% 2,433 35.0% 762 11.0% 0 0.0% 469 6.7%
Shared (No Heat on Bi l l ) 36,289 13.6 3,115 8.6% 2,171 6.0% 1,604 4.4% 3,560 9.8% 4,191 11.5% 16,849 46.4% 4,799 13.2%
PEOPLE PER HOUSEHOLD
One 124,779 12.4 13,943 11.2% 15,827 12.7% 15,298 12.3% 36,334 29.1% 17,301 13.9% 15,326 12.3% 10,750 8.6%
Two 221,729 10.3 36,151 16.3% 45,239 20.4% 36,546 16.5% 66,585 30.0% 22,620 10.2% 9,024 4.1% 5,564 2.5%
Three 60,069 10.1 12,464 20.7% 12,768 21.3% 10,752 17.9% 15,583 25.9% 6,817 11.3% 959 1.6% 726 1.2%
Four 48,897 9.0 9,675 19.8% 11,683 23.9% 9,766 20.0% 12,056 24.7% 3,927 8.0% 317 0.6% 1,472 3.0%
Five + 29,337 8.8 7,647 26.1% 7,287 24.8% 4,509 15.4% 6,715 22.9% 2,644 9.0% 255 0.9% 279 0.9%
HOUSEHOLD INCOME
Less Than $25,000 59,481 12.8 7,357 12.4% 8,191 13.8% 5,002 8.4% 17,032 28.6% 9,065 15.2% 7,336 12.3% 5,499 9.2%
$25,000 ‐ $49,999 137,082 11.2 18,642 13.6% 24,033 17.5% 22,720 16.6% 40,612 29.6% 16,401 12.0% 7,821 5.7% 6,852 5.0%
$50,000 ‐ $74,999 123,824 10.2 23,519 19.0% 22,352 18.1% 18,725 15.1% 35,233 28.5% 13,390 10.8% 6,803 5.5% 3,802 3.1%
$75,000 ‐ $99,999 66,780 9.5 13,394 20.1% 14,315 21.4% 11,459 17.2% 18,283 27.4% 5,641 8.4% 2,050 3.1% 1,638 2.5%
$100,000 + 97,644 9.5 16,968 17.4% 23,914 24.5% 18,966 19.4% 26,113 26.7% 8,813 9.0% 1,871 1.9% 1,000 1.0%
WINNIPEG LICO‐125 CLASS
Yes 158,987 11.5 22,403 14.1% 26,283 16.5% 22,143 13.9% 45,435 28.6% 20,984 13.2% 12,081 7.6% 9,657 6.1%
No 325,824 10.0 57,476 17.6% 66,521 20.4% 54,729 16.8% 91,839 28.2% 32,325 9.9% 13,799 4.2% 9,134 2.8%
INDIGENOUS SELF‐DECLARED ANCESTRY
Yes 51,429 9.3 9,817 19.1% 11,683 22.7% 7,743 15.1% 11,933 23.2% 4,386 8.5% 3,336 6.5% 2,531 4.9%
No 409,630 10.7 65,708 16.0% 76,107 18.6% 65,312 15.9% 119,066 29.1% 46,165 11.3% 22,112 5.4% 15,160 3.7%
Undeclared 23,751 10.4 4,354 18.3% 5,015 21.1% 3,817 16.1% 6,275 26.4% 2,758 11.6% 432 1.8% 1,101 4.6%
FIRST NATION ON RESERVE
FIRST NATION ON RESERVE 15,456 8.9 3,326 21.5% 3,369 21.8% 2,312 15.0% 3,962 25.6% 1,057 6.8% 286 1.8% 1,143 7.4%
BILL PAYMENT RATING
Excel lent 439,339 10.5 71,506 16.3% 84,823 19.3% 70,321 16.0% 124,836 28.4% 48,399 11.0% 23,595 5.4% 15,859 3.6%
Sati s factory 22,395 10.9 3,504 15.6% 3,917 17.5% 2,985 13.3% 6,669 29.8% 2,633 11.8% 1,106 4.9% 1,580 7.1%
Poor 23,077 9.9 4,869 21.1% 4,065 17.6% 3,566 15.5% 5,769 25.0% 2,277 9.9% 1,179 5.1% 1,352 5.9%
DWELLING OWNERSHIP
Own 404,316 10.4 66,122 16.4% 81,193 20.1% 71,021 17.6% 126,541 31.3% 43,487 10.8% 4,795 1.2% 11,158 2.8%
Rent / Other 80,495 11.0 13,757 17.1% 11,612 14.4% 5,852 7.3% 10,733 13.3% 9,822 12.2% 21,085 26.2% 7,634 9.5%
2017 RESIDENTIAL SURVEY SECTION 5 ‐ MAJOR APPLIANCES ‐ REFERENCE TABLE 5.12c
AGE (YEARS) OF CLOTHES DRYER
Centra Gas Manitoba Inc. 2019/20 General Rate Application Appendix 7.7
March 22, 2019 Page 86 of 228

79
SECTION 6 ELECTRONICS AND LIGHTING
SECTION 6 ELECTRONICS AND
LIGHTING
Centra Gas Manitoba Inc. 2019/20 General Rate Application Appendix 7.7
March 22, 2019 Page 87 of 228

80
6.01a Number of Televisions in Use
TOTAL NONE % ONE % TWO % THREE % FOUR % FIVE + %
OVERALL 484,811 23,425 4.8% 160,424 33.1% 177,445 36.6% 86,595 17.9% 25,687 5.3% 11,234 2.3%
FUEL AREA
Winnipeg City 261,760 11,965 4.6% 78,167 29.9% 98,207 37.5% 50,367 19.2% 15,379 5.9% 7,675 2.9%
Gas Avai lable 140,021 7,753 5.5% 50,145 35.8% 47,476 33.9% 24,872 17.8% 6,874 4.9% 2,901 2.1%
No Gas Avai lable 83,030 3,706 4.5% 32,112 38.7% 31,762 38.3% 11,357 13.7% 3,434 4.1% 658 0.8%
DWELLING TYPE
Single Detached 373,568 14,052 3.8% 112,183 30.0% 139,128 37.2% 74,792 20.0% 23,772 6.4% 9,642 2.6%
Multi Attached 46,834 3,064 6.5% 16,232 34.7% 17,113 36.5% 7,803 16.7% 1,609 3.4% 1,012 2.2%
Apartment Sui te 64,409 6,308 9.8% 32,010 49.7% 21,205 32.9% 4,000 6.2% 306 0.5% 580 0.9%
BUILDING CODE ERA
2010‐2017 37,645 1,737 4.6% 13,147 34.9% 11,211 29.8% 8,039 21.4% 2,259 6.0% 1,252 3.3%
1990‐2009 89,181 3,251 3.6% 27,384 30.7% 31,040 34.8% 17,677 19.8% 7,372 8.3% 2,458 2.8%
1970‐1989 161,749 5,208 3.2% 47,938 29.6% 63,689 39.4% 33,825 20.9% 7,796 4.8% 3,293 2.0%
1950‐1969 110,314 5,010 4.5% 37,791 34.3% 40,600 36.8% 18,465 16.7% 5,408 4.9% 3,041 2.8%
Pre 1950 85,922 8,219 9.6% 34,164 39.8% 30,906 36.0% 8,589 10.0% 2,852 3.3% 1,191 1.4%
SPACE HEAT FUEL
Electric Heat 191,639 8,949 4.7% 77,392 40.4% 70,963 37.0% 25,684 13.4% 6,677 3.5% 1,974 1.0%
Natura l Gas Heat 249,938 7,824 3.1% 64,206 25.7% 92,821 37.1% 58,689 23.5% 18,161 7.3% 8,237 3.3%
Other Fuel 6,945 1,318 19.0% 1,917 27.6% 3,110 44.8% 337 4.9% 262 3.8% 0 0.0%
Shared (No Heat on Bi l l ) 36,289 5,334 14.7% 16,909 46.6% 10,550 29.1% 1,884 5.2% 587 1.6% 1,024 2.8%
PEOPLE PER HOUSEHOLD
One 124,779 10,299 8.3% 64,506 51.7% 36,791 29.5% 11,511 9.2% 1,051 0.8% 622 0.5%
Two 221,729 8,260 3.7% 67,198 30.3% 93,249 42.1% 39,719 17.9% 9,710 4.4% 3,592 1.6%
Three 60,069 2,398 4.0% 12,871 21.4% 21,293 35.4% 16,209 27.0% 5,774 9.6% 1,524 2.5%
Four 48,897 1,374 2.8% 10,497 21.5% 15,956 32.6% 12,442 25.4% 6,226 12.7% 2,402 4.9%
Five + 29,337 1,094 3.7% 5,352 18.2% 10,156 34.6% 6,715 22.9% 2,926 10.0% 3,094 10.5%
HOUSEHOLD INCOME
Less Than $25,000 59,481 4,345 7.3% 29,299 49.3% 16,626 28.0% 6,903 11.6% 1,759 3.0% 549 0.9%
$25,000 ‐ $49,999 137,082 7,516 5.5% 51,361 37.5% 55,159 40.2% 18,354 13.4% 3,196 2.3% 1,497 1.1%
$50,000 ‐ $74,999 123,824 5,907 4.8% 39,715 32.1% 48,698 39.3% 21,337 17.2% 6,000 4.8% 2,167 1.8%
$75,000 ‐ $99,999 66,780 2,460 3.7% 18,233 27.3% 23,707 35.5% 15,849 23.7% 4,525 6.8% 2,006 3.0%
$100,000 + 97,644 3,197 3.3% 21,816 22.3% 33,255 34.1% 24,153 24.7% 10,208 10.5% 5,015 5.1%
WINNIPEG LICO‐125 CLASS
Yes 158,987 9,768 6.1% 63,338 39.8% 56,662 35.6% 21,583 13.6% 5,006 3.1% 2,630 1.7%
No 325,824 13,657 4.2% 97,086 29.8% 120,783 37.1% 65,012 20.0% 20,682 6.3% 8,604 2.6%
INDIGENOUS SELF‐DECLARED ANCESTRY
Yes 51,429 1,275 2.5% 13,975 27.2% 21,340 41.5% 9,861 19.2% 3,645 7.1% 1,333 2.6%
No 409,630 20,686 5.1% 140,022 34.2% 146,062 35.7% 72,529 17.7% 20,814 5.1% 9,518 2.3%
Undeclared 23,751 1,463 6.2% 6,427 27.1% 10,043 42.3% 4,206 17.7% 1,228 5.2% 384 1.6%
FIRST NATION ON RESERVE
FIRST NATION ON RESERVE 15,456 497 3.2% 4,402 28.5% 5,657 36.6% 2,767 17.9% 1,697 11.0% 435 2.8%
BILL PAYMENT RATING
Excel lent 439,339 21,572 4.9% 144,500 32.9% 161,892 36.8% 79,618 18.1% 21,836 5.0% 9,921 2.3%
Sati s factory 22,395 701 3.1% 8,806 39.3% 7,723 34.5% 3,045 13.6% 1,484 6.6% 636 2.8%
Poor 23,077 1,152 5.0% 7,118 30.8% 7,830 33.9% 3,933 17.0% 2,367 10.3% 677 2.9%
DWELLING OWNERSHIP
Own 404,316 16,067 4.0% 123,448 30.5% 152,710 37.8% 78,254 19.4% 23,548 5.8% 10,290 2.5%
Rent / Other 80,495 7,358 9.1% 36,976 45.9% 24,735 30.7% 8,342 10.4% 2,139 2.7% 945 1.2%
2017 RESIDENTIAL SURVEY SECTION 6 ‐ ELECTRONICS AND LIGHTING ‐ REFERENCE TABLE 6.01a
NUMBER OF TELEVISIONS IN USE
Centra Gas Manitoba Inc. 2019/20 General Rate Application Appendix 7.7
March 22, 2019 Page 88 of 228

81
6.01b Number of Set‐Top Boxes in Use
TOTAL NONE % ONE % TWO % THREE % FOUR % FIVE + %
OVERALL 484,811 23,425 4.8% 183,943 37.9% 169,716 35.0% 104,103 21.5% 1,179 0.2% 2,445 0.5%
FUEL AREA
Winnipeg City 261,760 11,965 4.6% 92,630 35.4% 92,600 35.4% 61,581 23.5% 1,148 0.4% 1,836 0.7%
Gas Avai lable 140,021 7,753 5.5% 55,178 39.4% 47,490 33.9% 28,991 20.7% 0 0.0% 609 0.4%
No Gas Avai lable 83,030 3,706 4.5% 36,135 43.5% 29,627 35.7% 13,531 16.3% 31 0.0% 0 0.0%
DWELLING TYPE
Single Detached 373,568 14,052 3.8% 130,140 34.8% 134,500 36.0% 91,252 24.4% 1,179 0.3% 2,445 0.7%
Multi Attached 46,834 3,064 6.5% 19,127 40.8% 16,062 34.3% 8,580 18.3% 0 0.0% 0 0.0%
Apartment Sui te 64,409 6,308 9.8% 34,677 53.8% 19,154 29.7% 4,271 6.6% 0 0.0% 0 0.0%
BUILDING CODE ERA
2010‐2017 37,645 1,737 4.6% 14,953 39.7% 11,347 30.1% 9,118 24.2% 261 0.7% 230 0.6%
1990‐2009 89,181 3,251 3.6% 30,039 33.7% 31,077 34.8% 23,820 26.7% 459 0.5% 535 0.6%
1970‐1989 161,749 5,208 3.2% 56,756 35.1% 60,308 37.3% 38,370 23.7% 115 0.1% 992 0.6%
1950‐1969 110,314 5,010 4.5% 43,966 39.9% 38,172 34.6% 22,363 20.3% 230 0.2% 574 0.5%
Pre 1950 85,922 8,219 9.6% 38,229 44.5% 28,812 33.5% 10,432 12.1% 115 0.1% 115 0.1%
SPACE HEAT FUEL
Electric Heat 191,639 8,949 4.7% 84,808 44.3% 68,848 35.9% 28,702 15.0% 31 0.0% 301 0.2%
Natura l Gas Heat 249,938 7,824 3.1% 77,668 31.1% 89,558 35.8% 71,596 28.6% 1,148 0.5% 2,144 0.9%
Other Fuel 6,945 1,318 19.0% 2,520 36.3% 2,508 36.1% 600 8.6% 0 0.0% 0 0.0%
Shared (No Heat on Bi l l ) 36,289 5,334 14.7% 18,947 52.2% 8,803 24.3% 3,205 8.8% 0 0.0% 0 0.0%
PEOPLE PER HOUSEHOLD
One 124,779 10,299 8.3% 69,198 55.5% 33,739 27.0% 11,429 9.2% 0 0.0% 115 0.1%
Two 221,729 8,260 3.7% 76,606 34.5% 89,068 40.2% 46,791 21.1% 230 0.1% 775 0.3%
Three 60,069 2,398 4.0% 16,553 27.6% 20,678 34.4% 19,535 32.5% 459 0.8% 447 0.7%
Four 48,897 1,374 2.8% 13,818 28.3% 16,002 32.7% 16,694 34.1% 230 0.5% 779 1.6%
Five + 29,337 1,094 3.7% 7,768 26.5% 10,229 34.9% 9,654 32.9% 261 0.9% 330 1.1%
HOUSEHOLD INCOME
Less Than $25,000 59,481 4,345 7.3% 30,954 52.0% 16,102 27.1% 8,080 13.6% 0 0.0% 0 0.0%
$25,000 ‐ $49,999 137,082 7,516 5.5% 56,892 41.5% 51,917 37.9% 20,382 14.9% 31 0.0% 344 0.3%
$50,000 ‐ $74,999 123,824 5,907 4.8% 47,535 38.4% 45,228 36.5% 24,135 19.5% 574 0.5% 445 0.4%
$75,000 ‐ $99,999 66,780 2,460 3.7% 21,404 32.1% 23,503 35.2% 18,751 28.1% 115 0.2% 547 0.8%
$100,000 + 97,644 3,197 3.3% 27,158 27.8% 32,966 33.8% 32,754 33.5% 459 0.5% 1,109 1.1%
WINNIPEG LICO‐125 CLASS
Yes 158,987 9,768 6.1% 69,905 44.0% 53,833 33.9% 24,646 15.5% 261 0.2% 574 0.4%
No 325,824 13,657 4.2% 114,038 35.0% 115,884 35.6% 79,456 24.4% 918 0.3% 1,871 0.6%
INDIGENOUS SELF‐DECLARED ANCESTRY
Yes 51,429 1,275 2.5% 17,551 34.1% 20,226 39.3% 12,231 23.8% 31 0.1% 115 0.2%
No 409,630 20,686 5.1% 158,741 38.8% 140,179 34.2% 86,661 21.2% 1,033 0.3% 2,330 0.6%
Undeclared 23,751 1,463 6.2% 7,651 32.2% 9,311 39.2% 5,211 21.9% 115 0.5% 0 0.0%
FIRST NATION ON RESERVE
FIRST NATION ON RESERVE 15,456 497 3.2% 5,272 34.1% 5,533 35.8% 4,122 26.7% 31 0.2% 0 0.0%
BILL PAYMENT RATING
Excel lent 439,339 21,572 4.9% 164,757 37.5% 155,875 35.5% 94,116 21.4% 918 0.2% 2,101 0.5%
Sati s factory 22,395 701 3.1% 10,136 45.3% 7,035 31.4% 4,178 18.7% 230 1.0% 115 0.5%
Poor 23,077 1,152 5.0% 9,050 39.2% 6,806 29.5% 5,809 25.2% 31 0.1% 230 1.0%
DWELLING OWNERSHIP
Own 404,316 16,067 4.0% 143,243 35.4% 146,066 36.1% 95,462 23.6% 1,148 0.3% 2,330 0.6%
Rent / Other 80,495 7,358 9.1% 40,700 50.6% 23,650 29.4% 8,640 10.7% 31 0.0% 115 0.1%
2017 RESIDENTIAL SURVEY SECTION 6 ‐ ELECTRONICS AND LIGHTING ‐ REFERENCE TABLE 6.01b
NUMBER OF SET‐TOP BOXES IN USE
Centra Gas Manitoba Inc. 2019/20 General Rate Application Appendix 7.7
March 22, 2019 Page 89 of 228

82
6.01c Number of DVD/Blu‐Ray Units in Use
TOTAL NONE % ONE % TWO % THREE % FOUR % FIVE + %
OVERALL 484,811 232,880 48.0% 189,945 39.2% 50,710 10.5% 9,423 1.9% 1,505 0.3% 349 0.1%
FUEL AREA
Winnipeg City 261,760 127,783 48.8% 100,085 38.2% 27,570 10.5% 5,455 2.1% 752 0.3% 115 0.0%
Gas Ava i lable 140,021 65,023 46.4% 57,037 40.7% 14,813 10.6% 2,540 1.8% 406 0.3% 203 0.1%
No Gas Avai lable 83,030 40,074 48.3% 32,823 39.5% 8,327 10.0% 1,428 1.7% 348 0.4% 31 0.0%
DWELLING TYPE
Single Detached 373,568 165,680 44.4% 153,239 41.0% 44,203 11.8% 8,593 2.3% 1,505 0.4% 349 0.1%
Multi Attached 46,834 28,752 61.4% 14,970 32.0% 2,734 5.8% 377 0.8% 0 0.0% 0 0.0%
Apartment Sui te 64,409 38,448 59.7% 21,737 33.7% 3,772 5.9% 453 0.7% 0 0.0% 0 0.0%
BUILDING CODE ERA
2010‐2017 37,645 18,261 48.5% 14,132 37.5% 4,278 11.4% 943 2.5% 31 0.1% 0 0.0%
1990‐2009 89,181 39,919 44.8% 35,352 39.6% 10,962 12.3% 2,194 2.5% 520 0.6% 234 0.3%
1970‐1989 161,749 73,990 45.7% 66,031 40.8% 18,395 11.4% 2,836 1.8% 498 0.3% 0 0.0%
1950‐1969 110,314 56,235 51.0% 40,842 37.0% 10,831 9.8% 2,061 1.9% 230 0.2% 115 0.1%
Pre 1950 85,922 44,475 51.8% 33,587 39.1% 6,245 7.3% 1,390 1.6% 226 0.3% 0 0.0%
SPACE HEAT FUEL
Electric Heat 191,639 94,350 49.2% 76,821 40.1% 16,789 8.8% 2,821 1.5% 726 0.4% 131 0.1%
Natura l Gas Heat 249,938 110,580 44.2% 100,339 40.1% 31,843 12.7% 6,180 2.5% 779 0.3% 217 0.1%
Other Fuel 6,945 4,175 60.1% 2,301 33.1% 337 4.9% 131 1.9% 0 0.0% 0 0.0%
Shared (No Heat on Bi l l ) 36,289 23,775 65.5% 10,484 28.9% 1,741 4.8% 290 0.8% 0 0.0% 0 0.0%
PEOPLE PER HOUSEHOLD
One 124,779 73,151 58.6% 45,651 36.6% 5,041 4.0% 936 0.8% 0 0.0% 0 0.0%
Two 221,729 108,202 48.8% 86,882 39.2% 24,111 10.9% 2,419 1.1% 115 0.1% 0 0.0%
Three 60,069 23,109 38.5% 25,326 42.2% 9,250 15.4% 2,054 3.4% 330 0.5% 0 0.0%
Four 48,897 17,638 36.1% 21,384 43.7% 7,107 14.5% 2,067 4.2% 598 1.2% 103 0.2%
Five + 29,337 10,781 36.7% 10,700 36.5% 5,200 17.7% 1,947 6.6% 462 1.6% 246 0.8%
HOUSEHOLD INCOME
Less Than $25,000 59,481 39,630 66.6% 15,345 25.8% 3,504 5.9% 792 1.3% 177 0.3% 31 0.1%
$25,000 ‐ $49,999 137,082 75,189 54.8% 51,373 37.5% 8,977 6.5% 1,543 1.1% 0 0.0% 0 0.0%
$50,000 ‐ $74,999 123,824 57,703 46.6% 51,502 41.6% 12,853 10.4% 1,537 1.2% 115 0.1% 115 0.1%
$75,000 ‐ $99,999 66,780 25,919 38.8% 29,368 44.0% 9,074 13.6% 1,958 2.9% 460 0.7% 0 0.0%
$100,000 + 97,644 34,438 35.3% 42,357 43.4% 16,302 16.7% 3,592 3.7% 753 0.8% 203 0.2%
WINNIPEG LICO‐125 CLASS
Yes 158,987 94,868 59.7% 50,746 31.9% 10,503 6.6% 2,432 1.5% 292 0.2% 146 0.1%
No 325,824 138,012 42.4% 139,199 42.7% 40,206 12.3% 6,990 2.1% 1,213 0.4% 203 0.1%
INDIGENOUS SELF‐DECLARED ANCESTRY
Yes 51,429 23,628 45.9% 19,661 38.2% 6,002 11.7% 1,880 3.7% 124 0.2% 134 0.3%
No 409,630 197,258 48.2% 161,622 39.5% 42,057 10.3% 7,199 1.8% 1,280 0.3% 215 0.1%
Undeclared 23,751 11,994 50.5% 8,662 36.5% 2,650 11.2% 344 1.4% 100 0.4% 0 0.0%
FIRST NATION ON RESERVE
FIRST NATION ON RESERVE 15,456 7,635 49.4% 5,670 36.7% 1,523 9.9% 472 3.1% 124 0.8% 31 0.2%
BILL PAYMENT RATING
Excel lent 439,339 210,838 48.0% 174,552 39.7% 44,751 10.2% 7,733 1.8% 1,262 0.3% 203 0.0%
Satis factory 22,395 10,719 47.9% 7,283 32.5% 3,355 15.0% 823 3.7% 100 0.4% 115 0.5%
Poor 23,077 11,323 49.1% 8,110 35.1% 2,603 11.3% 867 3.8% 143 0.6% 31 0.1%
DWELLING OWNERSHIP
Own 404,316 185,409 45.9% 164,740 40.7% 43,864 10.8% 8,542 2.1% 1,443 0.4% 318 0.1%
Rent / Other 80,495 47,470 59.0% 25,205 31.3% 6,846 8.5% 881 1.1% 62 0.1% 31 0.0%
2017 RESIDENTIAL SURVEY SECTION 6 ‐ ELECTRONICS AND LIGHTING ‐ REFERENCE TABLE 6.01c
NUMBER OF DVD/BLU‐RAY UNITS IN USE
Centra Gas Manitoba Inc. 2019/20 General Rate Application Appendix 7.7
March 22, 2019 Page 90 of 228

83
6.01d Number of Gaming Consoles in Use
TOTAL NONE % ONE % TWO % THREE % FOUR % FIVE + %
OVERALL 484,811 352,647 72.7% 99,359 20.5% 24,429 5.0% 5,722 1.2% 1,688 0.3% 967 0.2%
FUEL AREA
Winnipeg City 261,760 183,107 70.0% 59,148 22.6% 14,459 5.5% 3,119 1.2% 1,178 0.5% 749 0.3%
Gas Ava i lable 140,021 106,289 75.9% 26,256 18.8% 5,246 3.7% 1,659 1.2% 385 0.3% 187 0.1%
No Gas Avai lable 83,030 63,251 76.2% 13,955 16.8% 4,725 5.7% 944 1.1% 124 0.1% 31 0.0%
DWELLING TYPE
Single Detached 373,568 268,340 71.8% 77,328 20.7% 20,987 5.6% 4,809 1.3% 1,428 0.4% 677 0.2%
Multi Attached 46,834 33,184 70.9% 9,650 20.6% 2,990 6.4% 750 1.6% 260 0.6% 0 0.0%
Apartment Sui te 64,409 51,122 79.4% 12,381 19.2% 453 0.7% 163 0.3% 0 0.0% 290 0.5%
BUILDING CODE ERA
2010‐2017 37,645 23,667 62.9% 10,703 28.4% 2,225 5.9% 789 2.1% 115 0.3% 146 0.4%
1990‐2009 89,181 64,131 71.9% 17,431 19.5% 5,770 6.5% 1,553 1.7% 194 0.2% 103 0.1%
1970‐1989 161,749 120,678 74.6% 31,026 19.2% 7,595 4.7% 1,431 0.9% 705 0.4% 314 0.2%
1950‐1969 110,314 79,827 72.4% 23,440 21.2% 5,386 4.9% 1,058 1.0% 199 0.2% 405 0.4%
Pre 1950 85,922 64,343 74.9% 16,760 19.5% 3,453 4.0% 891 1.0% 475 0.6% 0 0.0%
SPACE HEAT FUEL
Electric Heat 191,639 147,459 76.9% 32,738 17.1% 8,434 4.4% 2,123 1.1% 769 0.4% 115 0.1%
Natura l Gas Heat 249,938 171,802 68.7% 58,502 23.4% 14,999 6.0% 3,155 1.3% 918 0.4% 562 0.2%
Other Fuel 6,945 5,408 77.9% 1,274 18.4% 262 3.8% 0 0.0% 0 0.0% 0 0.0%
Shared (No Heat on Bi l l ) 36,289 27,976 77.1% 6,845 18.9% 734 2.0% 444 1.2% 0 0.0% 290 0.8%
PEOPLE PER HOUSEHOLD
One 124,779 112,181 89.9% 11,694 9.4% 874 0.7% 31 0.0% 0 0.0% 0 0.0%
Two 221,729 182,809 82.4% 33,052 14.9% 5,034 2.3% 444 0.2% 100 0.0% 290 0.1%
Three 60,069 30,022 50.0% 23,104 38.5% 5,311 8.8% 1,288 2.1% 230 0.4% 115 0.2%
Four 48,897 18,906 38.7% 18,510 37.9% 8,708 17.8% 1,925 3.9% 629 1.3% 217 0.4%
Five + 29,337 8,729 29.8% 12,999 44.3% 4,502 15.3% 2,033 6.9% 729 2.5% 345 1.2%
HOUSEHOLD INCOME
Less Than $25,000 59,481 51,337 86.3% 6,216 10.5% 1,163 2.0% 311 0.5% 454 0.8% 0 0.0%
$25,000 ‐ $49,999 137,082 114,839 83.8% 17,924 13.1% 2,823 2.1% 959 0.7% 100 0.1% 436 0.3%
$50,000 ‐ $74,999 123,824 90,455 73.1% 24,628 19.9% 6,863 5.5% 1,388 1.1% 146 0.1% 344 0.3%
$75,000 ‐ $99,999 66,780 39,963 59.8% 19,761 29.6% 5,123 7.7% 1,320 2.0% 529 0.8% 84 0.1%
$100,000 + 97,644 56,052 57.4% 30,830 31.6% 8,457 8.7% 1,743 1.8% 459 0.5% 103 0.1%
WINNIPEG LICO‐125 CLASS
Yes 158,987 127,365 80.1% 23,026 14.5% 5,772 3.6% 1,748 1.1% 700 0.4% 375 0.2%
No 325,824 225,282 69.1% 76,333 23.4% 18,657 5.7% 3,974 1.2% 988 0.3% 591 0.2%
INDIGENOUS SELF‐DECLARED ANCESTRY
Yes 51,429 30,917 60.1% 13,822 26.9% 5,016 9.8% 1,056 2.1% 485 0.9% 134 0.3%
No 409,630 303,956 74.2% 80,969 19.8% 18,438 4.5% 4,346 1.1% 1,088 0.3% 833 0.2%
Undeclared 23,751 17,773 74.8% 4,568 19.2% 976 4.1% 320 1.3% 115 0.5% 0 0.0%
FIRST NATION ON RESERVE
FIRST NATION ON RESERVE 15,456 9,245 59.8% 3,649 23.6% 1,940 12.6% 466 3.0% 124 0.8% 31 0.2%
BILL PAYMENT RATING
Excel lent 439,339 324,571 73.9% 87,979 20.0% 20,321 4.6% 4,320 1.0% 1,441 0.3% 706 0.2%
Satis factory 22,395 14,442 64.5% 5,206 23.2% 2,291 10.2% 279 1.2% 31 0.1% 146 0.7%
Poor 23,077 13,633 59.1% 6,174 26.8% 1,818 7.9% 1,122 4.9% 215 0.9% 115 0.5%
DWELLING OWNERSHIP
Own 404,316 294,845 72.9% 81,402 20.1% 21,190 5.2% 4,836 1.2% 1,397 0.3% 646 0.2%
Rent / Other 80,495 57,801 71.8% 17,957 22.3% 3,239 4.0% 885 1.1% 291 0.4% 321 0.4%
2017 RESIDENTIAL SURVEY SECTION 6 ‐ ELECTRONICS AND LIGHTING ‐ REFERENCE TABLE 6.01d
NUMBER OF GAMING CONSOLES IN USE
Centra Gas Manitoba Inc. 2019/20 General Rate Application Appendix 7.7
March 22, 2019 Page 91 of 228

84
6.01e Number of Desktop Computers in Use
TOTAL NONE % ONE % TWO % THREE % FOUR % FIVE + %
OVERALL 484,811 255,424 52.7% 194,361 40.1% 27,922 5.8% 4,777 1.0% 1,636 0.3% 691 0.1%
FUEL AREA
Winnipeg City 261,760 128,934 49.3% 108,796 41.6% 18,781 7.2% 3,563 1.4% 1,302 0.5% 384 0.1%
Gas Avai lable 140,021 75,113 53.6% 57,250 40.9% 6,167 4.4% 879 0.6% 303 0.2% 308 0.2%
No Gas Avai lable 83,030 51,376 61.9% 28,315 34.1% 2,973 3.6% 335 0.4% 31 0.0% 0 0.0%
DWELLING TYPE
Single Detached 373,568 187,297 50.1% 157,049 42.0% 22,878 6.1% 4,324 1.2% 1,482 0.4% 537 0.1%
Multi Attached 46,834 27,224 58.1% 15,548 33.2% 3,753 8.0% 0 0.0% 154 0.3% 154 0.3%
Apartment Sui te 64,409 40,902 63.5% 21,763 33.8% 1,291 2.0% 453 0.7% 0 0.0% 0 0.0%
BUILDING CODE ERA
2010‐2017 37,645 21,774 57.8% 13,814 36.7% 1,668 4.4% 389 1.0% 0 0.0% 0 0.0%
1990‐2009 89,181 45,701 51.2% 36,095 40.5% 5,452 6.1% 1,302 1.5% 476 0.5% 154 0.2%
1970‐1989 161,749 81,470 50.4% 68,812 42.5% 9,498 5.9% 1,382 0.9% 472 0.3% 115 0.1%
1950‐1969 110,314 56,545 51.3% 45,439 41.2% 6,636 6.0% 927 0.8% 344 0.3% 422 0.4%
Pre 1950 85,922 49,933 58.1% 30,200 35.1% 4,668 5.4% 777 0.9% 344 0.4% 0 0.0%
SPACE HEAT FUEL
Electric Heat 191,639 110,680 57.8% 71,572 37.3% 7,832 4.1% 1,323 0.7% 232 0.1% 0 0.0%
Natura l Gas Heat 249,938 115,932 46.4% 110,904 44.4% 17,841 7.1% 3,164 1.3% 1,404 0.6% 691 0.3%
Other Fuel 6,945 5,714 82.3% 893 12.9% 337 4.9% 0 0.0% 0 0.0% 0 0.0%
Shared (No Heat on Bi l l ) 36,289 23,097 63.6% 10,991 30.3% 1,912 5.3% 290 0.8% 0 0.0% 0 0.0%
PEOPLE PER HOUSEHOLD
One 124,779 83,970 67.3% 38,619 30.9% 1,390 1.1% 456 0.4% 230 0.2% 115 0.1%
Two 221,729 103,934 46.9% 99,761 45.0% 15,612 7.0% 1,875 0.8% 330 0.1% 217 0.1%
Three 60,069 29,689 49.4% 23,531 39.2% 5,287 8.8% 963 1.6% 599 1.0% 0 0.0%
Four 48,897 21,928 44.8% 22,246 45.5% 3,397 6.9% 1,121 2.3% 103 0.2% 103 0.2%
Five + 29,337 15,903 54.2% 10,203 34.8% 2,236 7.6% 362 1.2% 375 1.3% 257 0.9%
HOUSEHOLD INCOME
Less Than $25,000 59,481 44,394 74.6% 13,129 22.1% 1,926 3.2% 0 0.0% 31 0.1% 0 0.0%
$25,000 ‐ $49,999 137,082 76,581 55.9% 54,147 39.5% 5,070 3.7% 1,028 0.7% 154 0.1% 103 0.1%
$50,000 ‐ $74,999 123,824 60,406 48.8% 54,276 43.8% 6,924 5.6% 1,299 1.0% 445 0.4% 474 0.4%
$75,000 ‐ $99,999 66,780 31,414 47.0% 29,502 44.2% 4,847 7.3% 903 1.4% 0 0.0% 115 0.2%
$100,000 + 97,644 42,629 43.7% 43,306 44.4% 9,155 9.4% 1,548 1.6% 1,006 1.0% 0 0.0%
WINNIPEG LICO‐125 CLASS
Yes 158,987 100,579 63.3% 51,119 32.2% 6,094 3.8% 907 0.6% 185 0.1% 103 0.1%
No 325,824 154,845 47.5% 143,242 44.0% 21,828 6.7% 3,870 1.2% 1,451 0.4% 589 0.2%
INDIGENOUS SELF‐DECLARED ANCESTRY
Yes 51,429 30,867 60.0% 17,382 33.8% 2,512 4.9% 522 1.0% 146 0.3% 0 0.0%
No 409,630 211,777 51.7% 167,190 40.8% 24,526 6.0% 3,956 1.0% 1,490 0.4% 691 0.2%
Undeclared 23,751 12,779 53.8% 9,789 41.2% 884 3.7% 299 1.3% 0 0.0% 0 0.0%
FIRST NATION ON RESERVE
FIRST NATION ON RESERVE 15,456 11,465 74.2% 3,519 22.8% 441 2.9% 0 0.0% 31 0.2% 0 0.0%
BILL PAYMENT RATING
Excel lent 439,339 225,432 51.3% 181,801 41.4% 25,271 5.8% 4,662 1.1% 1,482 0.3% 691 0.2%
Sati s factory 22,395 14,439 64.5% 6,800 30.4% 1,041 4.6% 115 0.5% 0 0.0% 0 0.0%
Poor 23,077 15,553 67.4% 5,760 25.0% 1,610 7.0% 0 0.0% 154 0.7% 0 0.0%
DWELLING OWNERSHIP
Own 404,316 201,251 49.8% 170,715 42.2% 25,535 6.3% 4,487 1.1% 1,636 0.4% 691 0.2%
Rent / Other 80,495 54,172 67.3% 23,646 29.4% 2,386 3.0% 290 0.4% 0 0.0% 0 0.0%
2017 RESIDENTIAL SURVEY SECTION 6 ‐ ELECTRONICS AND LIGHTING ‐ REFERENCE TABLE 6.01e
NUMBER OF DESKTOP COMPUTERS IN USE
Centra Gas Manitoba Inc. 2019/20 General Rate Application Appendix 7.7
March 22, 2019 Page 92 of 228

85
6.01f Number of Laptop Computers in Use
TOTAL NONE % ONE % TWO % THREE % FOUR % FIVE + %
OVERALL 484,811 205,349 42.4% 192,687 39.7% 64,288 13.3% 16,736 3.5% 4,415 0.9% 1,336 0.3%
FUEL AREA
Winnipeg City 261,760 99,368 38.0% 107,718 41.2% 37,069 14.2% 13,413 5.1% 3,158 1.2% 1,033 0.4%
Gas Ava i lable 140,021 61,558 44.0% 56,298 40.2% 18,231 13.0% 2,628 1.9% 1,003 0.7% 303 0.2%
No Gas Avai lable 83,030 44,422 53.5% 28,671 34.5% 8,988 10.8% 695 0.8% 254 0.3% 0 0.0%
DWELLING TYPE
Single Detached 373,568 154,264 41.3% 147,181 39.4% 53,779 14.4% 12,756 3.4% 4,252 1.1% 1,336 0.4%
Multi Attached 46,834 21,491 45.9% 19,143 40.9% 3,741 8.0% 2,459 5.2% 0 0.0% 0 0.0%
Apartment Sui te 64,409 29,593 45.9% 26,364 40.9% 6,768 10.5% 1,521 2.4% 163 0.3% 0 0.0%
BUILDING CODE ERA
2010‐2017 37,645 12,328 32.7% 17,630 46.8% 5,388 14.3% 1,867 5.0% 215 0.6% 217 0.6%
1990‐2009 89,181 35,823 40.2% 33,113 37.1% 16,190 18.2% 3,032 3.4% 707 0.8% 316 0.4%
1970‐1989 161,749 72,902 45.1% 62,218 38.5% 19,456 12.0% 5,213 3.2% 1,730 1.1% 230 0.1%
1950‐1969 110,314 47,999 43.5% 45,132 40.9% 12,743 11.6% 3,120 2.8% 975 0.9% 344 0.3%
Pre 1950 85,922 36,296 42.2% 34,594 40.3% 10,510 12.2% 3,504 4.1% 788 0.9% 230 0.3%
SPACE HEAT FUEL
Electric Heat 191,639 92,506 48.3% 74,300 38.8% 20,284 10.6% 3,291 1.7% 1,058 0.6% 201 0.1%
Natura l Gas Heat 249,938 91,042 36.4% 102,469 41.0% 39,804 15.9% 12,131 4.9% 3,357 1.3% 1,135 0.5%
Other Fuel 6,945 3,617 52.1% 2,316 33.4% 1,012 14.6% 0 0.0% 0 0.0% 0 0.0%
Shared (No Heat on Bi l l ) 36,289 18,185 50.1% 13,602 37.5% 3,188 8.8% 1,314 3.6% 0 0.0% 0 0.0%
PEOPLE PER HOUSEHOLD
One 124,779 72,473 58.1% 48,542 38.9% 2,477 2.0% 1,184 0.9% 103 0.1% 0 0.0%
Two 221,729 97,106 43.8% 89,264 40.3% 32,514 14.7% 2,238 1.0% 606 0.3% 0 0.0%
Three 60,069 16,955 28.2% 25,195 41.9% 12,731 21.2% 4,451 7.4% 519 0.9% 217 0.4%
Four 48,897 11,915 24.4% 18,407 37.6% 11,461 23.4% 4,806 9.8% 1,849 3.8% 459 0.9%
Five + 29,337 6,898 23.5% 11,279 38.4% 5,104 17.4% 4,057 13.8% 1,338 4.6% 660 2.2%
HOUSEHOLD INCOME
Less Than $25,000 59,481 40,246 67.7% 16,111 27.1% 2,502 4.2% 591 1.0% 31 0.1% 0 0.0%
$25,000 ‐ $49,999 137,082 73,226 53.4% 51,731 37.7% 9,084 6.6% 2,444 1.8% 597 0.4% 0 0.0%
$50,000 ‐ $74,999 123,824 47,589 38.4% 52,827 42.7% 17,998 14.5% 4,288 3.5% 676 0.5% 445 0.4%
$75,000 ‐ $99,999 66,780 20,619 30.9% 29,699 44.5% 12,277 18.4% 3,442 5.2% 743 1.1% 0 0.0%
$100,000 + 97,644 23,669 24.2% 42,319 43.3% 22,427 23.0% 5,971 6.1% 2,367 2.4% 891 0.9%
WINNIPEG LICO‐125 CLASS
Yes 158,987 91,762 57.7% 50,889 32.0% 11,325 7.1% 3,767 2.4% 913 0.6% 330 0.2%
No 325,824 113,587 34.9% 141,798 43.5% 52,963 16.3% 12,969 4.0% 3,502 1.1% 1,006 0.3%
INDIGENOUS SELF‐DECLARED ANCESTRY
Yes 51,429 24,804 48.2% 19,112 37.2% 6,201 12.1% 961 1.9% 351 0.7% 0 0.0%
No 409,630 169,602 41.4% 164,562 40.2% 54,838 13.4% 15,328 3.7% 4,064 1.0% 1,236 0.3%
Undeclared 23,751 10,942 46.1% 9,013 37.9% 3,249 13.7% 447 1.9% 0 0.0% 100 0.4%
FIRST NATION ON RESERVE
FIRST NATION ON RESERVE 15,456 10,561 68.3% 3,583 23.2% 1,187 7.7% 93 0.6% 31 0.2% 0 0.0%
BILL PAYMENT RATING
Excel lent 439,339 183,575 41.8% 177,264 40.3% 59,200 13.5% 13,995 3.2% 4,300 1.0% 1,004 0.2%
Satis factory 22,395 10,593 47.3% 8,249 36.8% 2,521 11.3% 930 4.2% 0 0.0% 103 0.5%
Poor 23,077 11,181 48.5% 7,174 31.1% 2,567 11.1% 1,811 7.8% 115 0.5% 230 1.0%
DWELLING OWNERSHIP
Own 404,316 165,213 40.9% 162,736 40.2% 56,031 13.9% 14,957 3.7% 4,043 1.0% 1,336 0.3%
Rent / Other 80,495 40,136 49.9% 29,951 37.2% 8,258 10.3% 1,779 2.2% 372 0.5% 0 0.0%
2017 RESIDENTIAL SURVEY SECTION 6 ‐ ELECTRONICS AND LIGHTING ‐ REFERENCE TABLE 6.01f
NUMBER OF LAPTOP COMPUTERS IN USE
Centra Gas Manitoba Inc. 2019/20 General Rate Application Appendix 7.7
March 22, 2019 Page 93 of 228

86
6.01g Number of Tablets in Use
TOTAL NONE % ONE % TWO % THREE % FOUR % FIVE + %
OVERALL 484,811 230,578 47.6% 169,227 34.9% 65,800 13.6% 13,863 2.9% 4,176 0.9% 1,166 0.2%
FUEL AREA
Winnipeg City 261,760 114,460 43.7% 95,534 36.5% 38,568 14.7% 9,606 3.7% 2,560 1.0% 1,033 0.4%
Gas Ava i lable 140,021 70,403 50.3% 48,169 34.4% 17,179 12.3% 3,171 2.3% 996 0.7% 103 0.1%
No Gas Avai lable 83,030 45,715 55.1% 25,524 30.7% 10,053 12.1% 1,086 1.3% 620 0.7% 31 0.0%
DWELLING TYPE
Single Detached 373,568 168,817 45.2% 132,635 35.5% 56,125 15.0% 11,131 3.0% 3,694 1.0% 1,166 0.3%
Multi Attached 46,834 22,945 49.0% 16,100 34.4% 5,554 11.9% 1,752 3.7% 482 1.0% 0 0.0%
Apartment Sui te 64,409 38,816 60.3% 20,492 31.8% 4,121 6.4% 980 1.5% 0 0.0% 0 0.0%
BUILDING CODE ERA
2010‐2017 37,645 13,427 35.7% 14,533 38.6% 6,827 18.1% 1,965 5.2% 779 2.1% 115 0.3%
1990‐2009 89,181 37,492 42.0% 34,224 38.4% 13,343 15.0% 2,819 3.2% 1,074 1.2% 230 0.3%
1970‐1989 161,749 78,420 48.5% 56,668 35.0% 21,650 13.4% 3,990 2.5% 773 0.5% 248 0.2%
1950‐1969 110,314 56,138 50.9% 36,593 33.2% 14,235 12.9% 2,211 2.0% 908 0.8% 230 0.2%
Pre 1950 85,922 45,102 52.5% 27,210 31.7% 9,746 11.3% 2,877 3.3% 642 0.7% 344 0.4%
SPACE HEAT FUEL
Electric Heat 191,639 102,755 53.6% 64,242 33.5% 19,548 10.2% 3,517 1.8% 1,546 0.8% 31 0.0%
Natura l Gas Heat 249,938 100,385 40.2% 94,267 37.7% 41,465 16.6% 10,056 4.0% 2,630 1.1% 1,135 0.5%
Other Fuel 6,945 3,573 51.4% 2,083 30.0% 1,289 18.6% 0 0.0% 0 0.0% 0 0.0%
Shared (No Heat on Bi l l ) 36,289 23,866 65.8% 8,635 23.8% 3,498 9.6% 290 0.8% 0 0.0% 0 0.0%
PEOPLE PER HOUSEHOLD
One 124,779 88,046 70.6% 32,896 26.4% 3,238 2.6% 485 0.4% 115 0.1% 0 0.0%
Two 221,729 100,779 45.5% 84,100 37.9% 34,037 15.4% 2,586 1.2% 226 0.1% 0 0.0%
Three 60,069 20,649 34.4% 25,521 42.5% 10,425 17.4% 3,142 5.2% 217 0.4% 115 0.2%
Four 48,897 12,023 24.6% 17,023 34.8% 12,725 26.0% 5,047 10.3% 1,745 3.6% 332 0.7%
Five + 29,337 9,080 31.0% 9,686 33.0% 5,374 18.3% 2,604 8.9% 1,873 6.4% 720 2.5%
HOUSEHOLD INCOME
Less Than $25,000 59,481 43,982 73.9% 11,651 19.6% 3,122 5.2% 570 1.0% 124 0.2% 31 0.1%
$25,000 ‐ $49,999 137,082 82,829 60.4% 42,003 30.6% 10,318 7.5% 1,578 1.2% 355 0.3% 0 0.0%
$50,000 ‐ $74,999 123,824 53,283 43.0% 49,138 39.7% 17,165 13.9% 3,093 2.5% 1,030 0.8% 115 0.1%
$75,000 ‐ $99,999 66,780 22,793 34.1% 28,668 42.9% 12,320 18.4% 2,125 3.2% 529 0.8% 344 0.5%
$100,000 + 97,644 27,691 28.4% 37,767 38.7% 22,875 23.4% 6,497 6.7% 2,138 2.2% 676 0.7%
WINNIPEG LICO‐125 CLASS
Yes 158,987 101,294 63.7% 42,407 26.7% 11,655 7.3% 2,530 1.6% 956 0.6% 146 0.1%
No 325,824 129,284 39.7% 126,820 38.9% 54,146 16.6% 11,334 3.5% 3,220 1.0% 1,021 0.3%
INDIGENOUS SELF‐DECLARED ANCESTRY
Yes 51,429 25,116 48.8% 16,581 32.2% 7,512 14.6% 1,800 3.5% 388 0.8% 31 0.1%
No 409,630 193,915 47.3% 143,975 35.1% 55,328 13.5% 11,604 2.8% 3,673 0.9% 1,135 0.3%
Undeclared 23,751 11,547 48.6% 8,670 36.5% 2,960 12.5% 459 1.9% 115 0.5% 0 0.0%
FIRST NATION ON RESERVE
FIRST NATION ON RESERVE 15,456 9,655 62.5% 3,488 22.6% 1,624 10.5% 373 2.4% 286 1.8% 31 0.2%
BILL PAYMENT RATING
Excel lent 439,339 210,049 47.8% 153,499 34.9% 58,848 13.4% 12,112 2.8% 3,695 0.8% 1,135 0.3%
Satis factory 22,395 10,109 45.1% 7,767 34.7% 3,434 15.3% 808 3.6% 276 1.2% 0 0.0%
Poor 23,077 10,419 45.1% 7,961 34.5% 3,518 15.2% 944 4.1% 205 0.9% 31 0.1%
DWELLING OWNERSHIP
Own 404,316 181,565 44.9% 146,563 36.2% 59,453 14.7% 11,801 2.9% 3,798 0.9% 1,135 0.3%
Rent / Other 80,495 49,013 60.9% 22,664 28.2% 6,347 7.9% 2,063 2.6% 378 0.5% 31 0.0%
2017 RESIDENTIAL SURVEY SECTION 6 ‐ ELECTRONICS AND LIGHTING ‐ REFERENCE TABLE 6.01g
NUMBER OF TABLETS IN USE
Centra Gas Manitoba Inc. 2019/20 General Rate Application Appendix 7.7
March 22, 2019 Page 94 of 228

87
6.01h Number of Cell Phone Chargers in Use
TOTAL NONE % ONE % TWO % THREE % FOUR % FIVE + %
OVERALL 484,811 62,380 12.9% 174,376 36.0% 153,197 31.6% 56,182 11.6% 24,016 5.0% 14,661 3.0%
FUEL AREA
Winnipeg City 261,760 30,913 11.8% 92,447 35.3% 81,192 31.0% 34,395 13.1% 13,791 5.3% 9,021 3.4%
Gas Avai lable 140,021 17,934 12.8% 49,562 35.4% 46,985 33.6% 15,071 10.8% 6,747 4.8% 3,722 2.7%
No Gas Avai lable 83,030 13,532 16.3% 32,367 39.0% 25,020 30.1% 6,716 8.1% 3,478 4.2% 1,917 2.3%
DWELLING TYPE
Single Detached 373,568 44,079 11.8% 125,544 33.6% 122,905 32.9% 46,611 12.5% 21,042 5.6% 13,387 3.6%
Multi Attached 46,834 7,413 15.8% 15,999 34.2% 15,042 32.1% 5,471 11.7% 2,378 5.1% 531 1.1%
Apartment Sui te 64,409 10,887 16.9% 32,833 51.0% 15,250 23.7% 4,099 6.4% 596 0.9% 743 1.2%
BUILDING CODE ERA
2010‐2017 37,645 1,959 5.2% 11,551 30.7% 13,408 35.6% 5,823 15.5% 3,135 8.3% 1,768 4.7%
1990‐2009 89,181 10,985 12.3% 27,924 31.3% 30,004 33.6% 11,072 12.4% 5,861 6.6% 3,334 3.7%
1970‐1989 161,749 21,683 13.4% 59,822 37.0% 50,742 31.4% 18,606 11.5% 6,637 4.1% 4,259 2.6%
1950‐1969 110,314 14,384 13.0% 44,111 40.0% 32,483 29.4% 12,625 11.4% 3,829 3.5% 2,882 2.6%
Pre 1950 85,922 13,369 15.6% 30,968 36.0% 26,560 30.9% 8,055 9.4% 4,553 5.3% 2,417 2.8%
SPACE HEAT FUEL
Electric Heat 191,639 29,649 15.5% 72,683 37.9% 59,010 30.8% 18,273 9.5% 7,813 4.1% 4,210 2.2%
Natura l Gas Heat 249,938 27,065 10.8% 77,904 31.2% 84,854 33.9% 34,813 13.9% 15,432 6.2% 9,871 3.9%
Other Fuel 6,945 1,068 15.4% 3,913 56.3% 675 9.7% 952 13.7% 337 4.9% 0 0.0%
Shared (No Heat on Bi l l ) 36,289 4,597 12.7% 19,876 54.8% 8,658 23.9% 2,143 5.9% 434 1.2% 580 1.6%
PEOPLE PER HOUSEHOLD
One 124,779 32,329 25.9% 79,187 63.5% 9,397 7.5% 2,694 2.2% 669 0.5% 504 0.4%
Two 221,729 25,453 11.5% 78,626 35.5% 102,645 46.3% 11,970 5.4% 2,092 0.9% 943 0.4%
Three 60,069 2,240 3.7% 9,553 15.9% 19,811 33.0% 23,552 39.2% 3,562 5.9% 1,352 2.3%
Four 48,897 1,358 2.8% 4,189 8.6% 14,811 30.3% 11,907 24.4% 12,683 25.9% 3,948 8.1%
Five + 29,337 999 3.4% 2,822 9.6% 6,533 22.3% 6,059 20.7% 5,010 17.1% 7,914 27.0%
HOUSEHOLD INCOME
Less Than $25,000 59,481 19,617 33.0% 28,835 48.5% 7,425 12.5% 2,088 3.5% 1,217 2.0% 298 0.5%
$25,000 ‐ $49,999 137,082 26,620 19.4% 65,597 47.9% 33,677 24.6% 7,516 5.5% 2,357 1.7% 1,316 1.0%
$50,000 ‐ $74,999 123,824 9,827 7.9% 44,394 35.9% 44,465 35.9% 15,275 12.3% 6,371 5.1% 3,492 2.8%
$75,000 ‐ $99,999 66,780 2,682 4.0% 16,611 24.9% 29,273 43.8% 10,879 16.3% 4,398 6.6% 2,936 4.4%
$100,000 + 97,644 3,633 3.7% 18,939 19.4% 38,358 39.3% 20,424 20.9% 9,672 9.9% 6,619 6.8%
WINNIPEG LICO‐125 CLASS
Yes 158,987 38,886 24.5% 66,491 41.8% 33,009 20.8% 11,244 7.1% 5,770 3.6% 3,587 2.3%
No 325,824 23,493 7.2% 107,886 33.1% 120,188 36.9% 44,937 13.8% 18,246 5.6% 11,073 3.4%
INDIGENOUS SELF‐DECLARED ANCESTRY
Yes 51,429 5,781 11.2% 16,528 32.1% 16,253 31.6% 7,753 15.1% 3,497 6.8% 1,617 3.1%
No 409,630 53,036 12.9% 149,082 36.4% 129,988 31.7% 46,061 11.2% 19,208 4.7% 12,255 3.0%
Undeclared 23,751 3,563 15.0% 8,767 36.9% 6,955 29.3% 2,367 10.0% 1,311 5.5% 789 3.3%
FIRST NATION ON RESERVE
FIRST NATION ON RESERVE 15,456 3,270 21.2% 4,607 29.8% 3,519 22.8% 2,282 14.8% 1,088 7.0% 690 4.5%
BILL PAYMENT RATING
Excel lent 439,339 57,832 13.2% 160,079 36.4% 139,325 31.7% 49,963 11.4% 20,253 4.6% 11,888 2.7%
Satis factory 22,395 1,845 8.2% 7,737 34.5% 6,854 30.6% 3,671 16.4% 1,504 6.7% 783 3.5%
Poor 23,077 2,703 11.7% 6,560 28.4% 7,018 30.4% 2,548 11.0% 2,258 9.8% 1,989 8.6%
DWELLING OWNERSHIP
Own 404,316 48,670 12.0% 139,091 34.4% 133,648 33.1% 48,425 12.0% 21,539 5.3% 12,942 3.2%
Rent / Other 80,495 13,709 17.0% 35,285 43.8% 19,548 24.3% 7,756 9.6% 2,476 3.1% 1,719 2.1%
2017 RESIDENTIAL SURVEY SECTION 6 ‐ ELECTRONICS AND LIGHTING ‐ REFERENCE TABLE 6.01h
NUMBER OF CELL PHONE CHARGERS IN USE
Centra Gas Manitoba Inc. 2019/20 General Rate Application Appendix 7.7
March 22, 2019 Page 95 of 228

88
6.02 Home Internet Access
TOTAL
NO HOME
INTERNET %
HOME ONLY
INTERNET %
MOBILE ONLY
INTERNET %
BOTH HOME
AND MOBILE %
OVERALL 484,811 64,257 13.3% 194,294 40.1% 14,234 2.9% 212,026 43.7%
FUEL AREA
Winnipeg City 261,760 21,248 8.1% 108,122 41.3% 2,742 1.0% 129,648 49.5%
Gas Avai lable 140,021 21,241 15.2% 57,358 41.0% 5,804 4.1% 55,618 39.7%
No Gas Avai lable 83,030 21,768 26.2% 28,814 34.7% 5,687 6.8% 26,760 32.2%
DWELLING TYPE
Single Detached 373,568 46,919 12.6% 149,425 40.0% 12,317 3.3% 164,907 44.1%
Multi Attached 46,834 5,877 12.5% 19,258 41.1% 479 1.0% 21,220 45.3%
Apartment Sui te 64,409 11,461 17.8% 25,612 39.8% 1,437 2.2% 25,899 40.2%
BUILDING CODE ERA
2010‐2017 37,645 2,712 7.2% 12,967 34.4% 1,129 3.0% 20,838 55.4%
1990‐2009 89,181 10,874 12.2% 38,627 43.3% 3,438 3.9% 36,242 40.6%
1970‐1989 161,749 23,025 14.2% 66,491 41.1% 4,540 2.8% 67,693 41.9%
1950‐1969 110,314 13,453 12.2% 46,850 42.5% 2,621 2.4% 47,389 43.0%
Pre 1950 85,922 14,193 16.5% 29,360 34.2% 2,505 2.9% 39,864 46.4%
SPACE HEAT FUEL
Electric Heat 191,639 37,523 19.6% 72,059 37.6% 10,599 5.5% 71,458 37.3%
Natura l Gas Heat 249,938 18,055 7.2% 105,681 42.3% 2,765 1.1% 123,437 49.4%
Other Fuel 6,945 3,148 45.3% 2,330 33.5% 0 0.0% 1,467 21.1%
Shared (No Heat on Bi l l ) 36,289 5,531 15.2% 14,225 39.2% 870 2.4% 15,663 43.2%
PEOPLE PER HOUSEHOLD
One 124,779 33,377 26.7% 51,162 41.0% 4,517 3.6% 35,724 28.6%
Two 221,729 23,415 10.6% 99,764 45.0% 7,285 3.3% 91,264 41.2%
Three 60,069 3,955 6.6% 18,772 31.3% 1,058 1.8% 36,285 60.4%
Four 48,897 1,879 3.8% 15,328 31.3% 540 1.1% 31,150 63.7%
Five + 29,337 1,631 5.6% 9,269 31.6% 834 2.8% 17,602 60.0%
HOUSEHOLD INCOME
Less Than $25,000 59,481 25,502 42.9% 20,836 35.0% 1,996 3.4% 11,147 18.7%
$25,000 ‐ $49,999 137,082 26,069 19.0% 63,957 46.7% 4,584 3.3% 42,472 31.0%
$50,000 ‐ $74,999 123,824 8,222 6.6% 53,611 43.3% 4,359 3.5% 57,632 46.5%
$75,000 ‐ $99,999 66,780 2,284 3.4% 25,517 38.2% 1,941 2.9% 37,037 55.5%
$100,000 + 97,644 2,180 2.2% 30,373 31.1% 1,354 1.4% 63,738 65.3%
WINNIPEG LICO‐125 CLASS
Yes 158,987 45,877 28.9% 64,697 40.7% 5,544 3.5% 42,869 27.0%
No 325,824 18,380 5.6% 129,597 39.8% 8,690 2.7% 169,157 51.9%
INDIGENOUS SELF‐DECLARED ANCESTRY
Yes 51,429 10,642 20.7% 17,063 33.2% 1,376 2.7% 22,349 43.5%
No 409,630 50,487 12.3% 166,872 40.7% 11,342 2.8% 180,929 44.2%
Undeclared 23,751 3,128 13.2% 10,359 43.6% 1,516 6.4% 8,748 36.8%
FIRST NATION ON RESERVE
FIRST NATION ON RESERVE 15,456 6,783 43.9% 4,644 30.0% 938 6.1% 3,091 20.0%
BILL PAYMENT RATING
Excel lent 439,339 55,351 12.6% 180,903 41.2% 12,077 2.7% 191,009 43.5%
Sati s factory 22,395 3,405 15.2% 6,928 30.9% 1,011 4.5% 11,052 49.3%
Poor 23,077 5,501 23.8% 6,464 28.0% 1,146 5.0% 9,966 43.2%
DWELLING OWNERSHIP
Own 404,316 45,814 11.3% 165,251 40.9% 11,666 2.9% 181,585 44.9%
Rent / Other 80,495 18,442 22.9% 29,044 36.1% 2,568 3.2% 30,441 37.8%
2017 RESIDENTIAL SURVEY SECTION 6 ‐ ELECTRONICS AND LIGHTING ‐ REFERENCE TABLE 6.02
HOME INTERNET ACCESS
Centra Gas Manitoba Inc. 2019/20 General Rate Application Appendix 7.7
March 22, 2019 Page 96 of 228

89
6.03 Types of Telephone Services
TOTAL
NO
LANDLINE %
LANDLINE
ONLY %
MOBILE
ONLY %
BOTH
LANDLINE
AND MOBILE %
OVERALL 484,811 11,119 2.3% 66,608 13.7% 115,447 23.8% 291,638 60.2%
FUEL AREA
Winnipeg City 261,760 5,236 2.0% 31,403 12.0% 61,343 23.4% 163,778 62.6%
Gas Avai lable 140,021 2,516 1.8% 17,586 12.6% 35,685 25.5% 84,234 60.2%
No Gas Avai lable 83,030 3,367 4.1% 17,619 21.2% 18,419 22.2% 43,626 52.5%
DWELLING TYPE
Single Detached 373,568 7,381 2.0% 49,565 13.3% 77,317 20.7% 239,306 64.1%
Multi Attached 46,834 2,107 4.5% 6,462 13.8% 12,973 27.7% 25,292 54.0%
Apartment Sui te 64,409 1,631 2.5% 10,581 16.4% 25,157 39.1% 27,040 42.0%
BUILDING CODE ERA
2010‐2017 37,645 1,405 3.7% 2,217 5.9% 14,687 39.0% 19,336 51.4%
1990‐2009 89,181 1,661 1.9% 12,018 13.5% 17,349 19.5% 58,154 65.2%
1970‐1989 161,749 3,972 2.5% 22,800 14.1% 33,108 20.5% 101,868 63.0%
1950‐1969 110,314 2,126 1.9% 15,649 14.2% 27,119 24.6% 65,421 59.3%
Pre 1950 85,922 1,955 2.3% 13,924 16.2% 23,184 27.0% 46,859 54.5%
SPACE HEAT FUEL
Electric Heat 191,639 6,158 3.2% 32,429 16.9% 46,481 24.3% 106,570 55.6%
Natura l Gas Heat 249,938 3,953 1.6% 27,845 11.1% 50,551 20.2% 167,589 67.1%
Other Fuel 6,945 469 6.7% 2,005 28.9% 1,496 21.5% 2,976 42.8%
Shared (No Heat on Bi l l ) 36,289 539 1.5% 4,328 11.9% 16,919 46.6% 14,503 40.0%
PEOPLE PER HOUSEHOLD
One 124,779 3,489 2.8% 31,294 25.1% 33,870 27.1% 56,126 45.0%
Two 221,729 2,820 1.3% 27,563 12.4% 46,691 21.1% 144,654 65.2%
Three 60,069 1,907 3.2% 2,989 5.0% 15,247 25.4% 39,926 66.5%
Four 48,897 2,163 4.4% 2,381 4.9% 12,693 26.0% 31,660 64.7%
Five + 29,337 740 2.5% 2,380 8.1% 6,946 23.7% 19,271 65.7%
HOUSEHOLD INCOME
Less Than $25,000 59,481 3,006 5.1% 19,889 33.4% 13,831 23.3% 22,754 38.3%
$25,000 ‐ $49,999 137,082 2,778 2.0% 25,852 18.9% 27,828 20.3% 80,624 58.8%
$50,000 ‐ $74,999 123,824 2,082 1.7% 12,079 9.8% 30,806 24.9% 78,857 63.7%
$75,000 ‐ $99,999 66,780 1,376 2.1% 4,075 6.1% 19,345 29.0% 41,984 62.9%
$100,000 + 97,644 1,876 1.9% 4,711 4.8% 23,638 24.2% 67,419 69.0%
WINNIPEG LICO‐125 CLASS
Yes 158,987 5,542 3.5% 38,536 24.2% 32,943 20.7% 81,965 51.6%
No 325,824 5,576 1.7% 28,072 8.6% 82,504 25.3% 209,672 64.4%
INDIGENOUS SELF‐DECLARED ANCESTRY
Yes 51,429 2,600 5.1% 7,456 14.5% 15,951 31.0% 25,422 49.4%
No 409,630 8,101 2.0% 55,132 13.5% 94,779 23.1% 251,618 61.4%
Undeclared 23,751 417 1.8% 4,020 16.9% 4,717 19.9% 14,597 61.5%
FIRST NATION ON RESERVE
FIRST NATION ON RESERVE 15,456 1,579 10.2% 4,417 28.6% 3,375 21.8% 6,086 39.4%
BILL PAYMENT RATING
Excel lent 439,339 8,040 1.8% 60,257 13.7% 101,059 23.0% 269,982 61.5%
Satis factory 22,395 842 3.8% 2,775 12.4% 7,618 34.0% 11,160 49.8%
Poor 23,077 2,237 9.7% 3,576 15.5% 6,769 29.3% 10,495 45.5%
DWELLING OWNERSHIP
Own 404,316 7,084 1.8% 50,942 12.6% 85,465 21.1% 260,825 64.5%
Rent / Other 80,495 4,035 5.0% 15,666 19.5% 29,981 37.2% 30,813 38.3%
2017 RESIDENTIAL SURVEY SECTION 6 ‐ ELECTRONICS AND LIGHTING ‐ REFERENCE TABLE 6.03
TYPES OF TELEPHONE SERVICES
Centra Gas Manitoba Inc. 2019/20 General Rate Application Appendix 7.7
March 22, 2019 Page 97 of 228

90
6.04a Count of Incandescent Lights in Residence
TOTAL NONE % 1‐5 % 6‐10 % 11‐20 % 21‐30 % 31+ %
OVERALL 484,811 156,473 32.3% 128,108 26.4% 86,192 17.8% 65,647 13.5% 36,734 7.6% 11,657 2.4%
FUEL AREA
Winnipeg City 261,760 84,034 32.1% 78,880 30.1% 44,685 17.1% 30,511 11.7% 18,143 6.9% 5,507 2.1%
Gas Avai lable 140,021 42,851 30.6% 32,625 23.3% 25,550 18.2% 22,655 16.2% 11,368 8.1% 4,972 3.6%
No Gas Avai lable 83,030 29,589 35.6% 16,602 20.0% 15,956 19.2% 12,481 15.0% 7,224 8.7% 1,178 1.4%
DWELLING TYPE
Single Detached 373,568 117,189 31.4% 95,475 25.6% 67,986 18.2% 53,468 14.3% 28,929 7.7% 10,520 2.8%
Multi Attached 46,834 16,602 35.4% 11,580 24.7% 7,858 16.8% 6,678 14.3% 2,979 6.4% 1,137 2.4%
Apartment Sui te 64,409 22,683 35.2% 21,052 32.7% 10,348 16.1% 5,501 8.5% 4,826 7.5% 0 0.0%
BUILDING CODE ERA
2010‐2017 37,645 15,175 40.3% 8,423 22.4% 5,727 15.2% 4,186 11.1% 3,050 8.1% 1,084 2.9%
1990‐2009 89,181 28,773 32.3% 20,896 23.4% 16,219 18.2% 11,895 13.3% 9,127 10.2% 2,271 2.5%
1970‐1989 161,749 48,943 30.3% 40,801 25.2% 30,976 19.2% 25,120 15.5% 11,484 7.1% 4,424 2.7%
1950‐1969 110,314 37,570 34.1% 31,601 28.6% 17,296 15.7% 14,016 12.7% 7,274 6.6% 2,557 2.3%
Pre 1950 85,922 26,013 30.3% 26,387 30.7% 15,974 18.6% 10,429 12.1% 5,799 6.7% 1,320 1.5%
SPACE HEAT FUEL
Electric Heat 191,639 63,782 33.3% 44,882 23.4% 37,416 19.5% 26,974 14.1% 15,356 8.0% 3,228 1.7%
Natura l Gas Heat 249,938 76,381 30.6% 70,215 28.1% 41,927 16.8% 34,476 13.8% 18,510 7.4% 8,429 3.4%
Other Fuel 6,945 2,595 37.4% 2,170 31.3% 893 12.9% 893 12.9% 393 5.7% 0 0.0%
Shared (No Heat on Bi l l ) 36,289 13,714 37.8% 10,841 29.9% 5,956 16.4% 3,304 9.1% 2,474 6.8% 0 0.0%
PEOPLE PER HOUSEHOLD
One 124,779 42,366 34.0% 36,713 29.4% 22,486 18.0% 13,956 11.2% 7,977 6.4% 1,281 1.0%
Two 221,729 65,824 29.7% 55,666 25.1% 40,440 18.2% 33,668 15.2% 19,003 8.6% 7,129 3.2%
Three 60,069 19,468 32.4% 16,713 27.8% 10,879 18.1% 8,437 14.0% 3,330 5.5% 1,242 2.1%
Four 48,897 18,719 38.3% 12,098 24.7% 7,691 15.7% 5,450 11.1% 3,971 8.1% 967 2.0%
Five + 29,337 10,097 34.4% 6,918 23.6% 4,695 16.0% 4,136 14.1% 2,453 8.4% 1,037 3.5%
HOUSEHOLD INCOME
Less Than $25,000 59,481 23,063 38.8% 13,790 23.2% 11,186 18.8% 5,736 9.6% 5,175 8.7% 532 0.9%
$25,000 ‐ $49,999 137,082 48,814 35.6% 34,056 24.8% 25,509 18.6% 15,612 11.4% 11,030 8.0% 2,061 1.5%
$50,000 ‐ $74,999 123,824 38,216 30.9% 35,265 28.5% 19,812 16.0% 18,589 15.0% 8,687 7.0% 3,255 2.6%
$75,000 ‐ $99,999 66,780 19,765 29.6% 18,138 27.2% 10,664 16.0% 12,067 18.1% 4,092 6.1% 2,053 3.1%
$100,000 + 97,644 26,615 27.3% 26,859 27.5% 19,020 19.5% 13,643 14.0% 7,751 7.9% 3,756 3.8%
WINNIPEG LICO‐125 CLASS
Yes 158,987 57,676 36.3% 38,633 24.3% 28,715 18.1% 16,891 10.6% 14,262 9.0% 2,811 1.8%
No 325,824 98,797 30.3% 89,475 27.5% 57,477 17.6% 48,756 15.0% 22,473 6.9% 8,846 2.7%
INDIGENOUS SELF‐DECLARED ANCESTRY
Yes 51,429 20,498 39.9% 11,452 22.3% 9,047 17.6% 5,608 10.9% 4,242 8.2% 583 1.1%
No 409,630 126,926 31.0% 110,298 26.9% 73,891 18.0% 57,364 14.0% 30,602 7.5% 10,549 2.6%
Undeclared 23,751 9,049 38.1% 6,358 26.8% 3,253 13.7% 2,675 11.3% 1,890 8.0% 525 2.2%
FIRST NATION ON RESERVE
FIRST NATION ON RESERVE 15,456 6,441 41.7% 2,753 17.8% 2,685 17.4% 1,505 9.7% 2,009 13.0% 62 0.4%
BILL PAYMENT RATING
Excel lent 439,339 140,412 32.0% 116,662 26.6% 77,514 17.6% 60,677 13.8% 32,890 7.5% 11,184 2.5%
Satis factory 22,395 6,857 30.6% 5,658 25.3% 4,264 19.0% 3,273 14.6% 2,017 9.0% 327 1.5%
Poor 23,077 9,205 39.9% 5,788 25.1% 4,414 19.1% 1,697 7.4% 1,827 7.9% 146 0.6%
DWELLING OWNERSHIP
Own 404,316 127,056 31.4% 105,424 26.1% 72,039 17.8% 58,129 14.4% 30,298 7.5% 11,371 2.8%
Rent / Other 80,495 29,418 36.5% 22,684 28.2% 14,153 17.6% 7,518 9.3% 6,436 8.0% 286 0.4%
2017 RESIDENTIAL SURVEY SECTION 6 ‐ ELECTRONICS AND LIGHTING ‐ REFERENCE TABLE 6.04a
COUNT OF INCANDESCENT LIGHTS IN RESIDENCE
Centra Gas Manitoba Inc. 2019/20 General Rate Application Appendix 7.7
March 22, 2019 Page 98 of 228
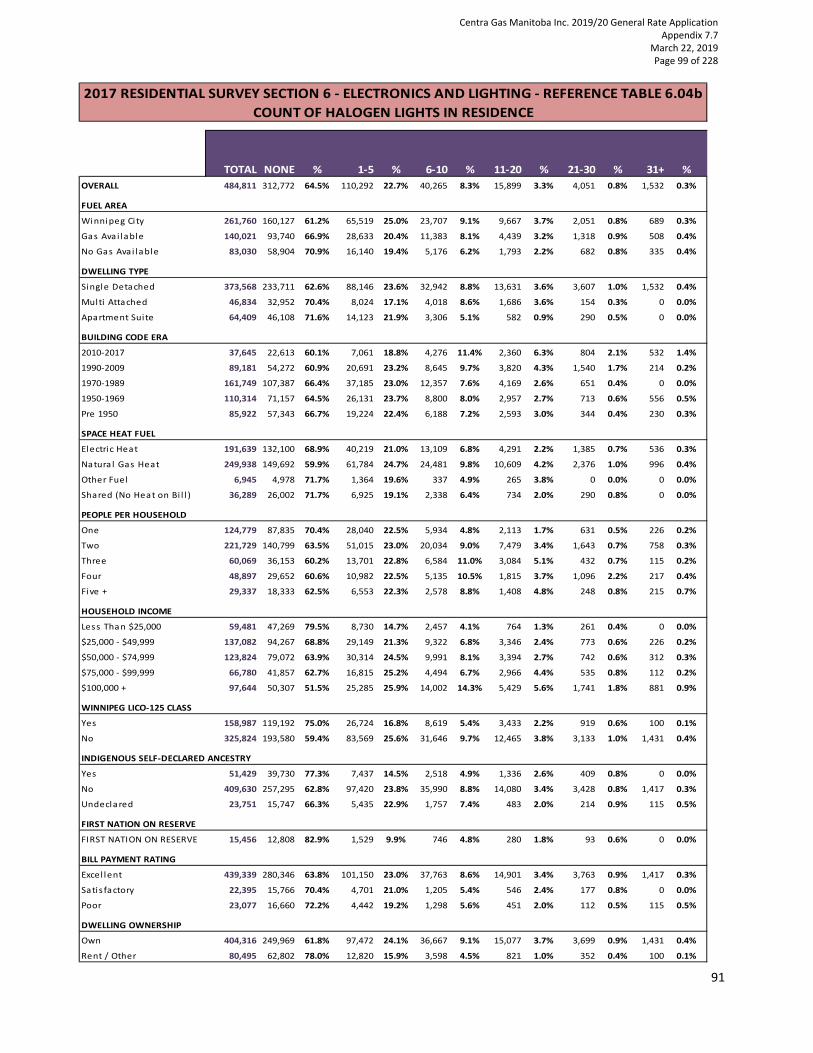
91
6.04b Count of Halogen Lights in Residence
TOTAL NONE % 1‐5 % 6‐10 % 11‐20 % 21‐30 % 31+ %
OVERALL 484,811 312,772 64.5% 110,292 22.7% 40,265 8.3% 15,899 3.3% 4,051 0.8% 1,532 0.3%
FUEL AREA
Winnipeg Ci ty 261,760 160,127 61.2% 65,519 25.0% 23,707 9.1% 9,667 3.7% 2,051 0.8% 689 0.3%
Gas Avai lable 140,021 93,740 66.9% 28,633 20.4% 11,383 8.1% 4,439 3.2% 1,318 0.9% 508 0.4%
No Gas Avai lable 83,030 58,904 70.9% 16,140 19.4% 5,176 6.2% 1,793 2.2% 682 0.8% 335 0.4%
DWELLING TYPE
Single Detached 373,568 233,711 62.6% 88,146 23.6% 32,942 8.8% 13,631 3.6% 3,607 1.0% 1,532 0.4%
Multi Attached 46,834 32,952 70.4% 8,024 17.1% 4,018 8.6% 1,686 3.6% 154 0.3% 0 0.0%
Apartment Suite 64,409 46,108 71.6% 14,123 21.9% 3,306 5.1% 582 0.9% 290 0.5% 0 0.0%
BUILDING CODE ERA
2010‐2017 37,645 22,613 60.1% 7,061 18.8% 4,276 11.4% 2,360 6.3% 804 2.1% 532 1.4%
1990‐2009 89,181 54,272 60.9% 20,691 23.2% 8,645 9.7% 3,820 4.3% 1,540 1.7% 214 0.2%
1970‐1989 161,749 107,387 66.4% 37,185 23.0% 12,357 7.6% 4,169 2.6% 651 0.4% 0 0.0%
1950‐1969 110,314 71,157 64.5% 26,131 23.7% 8,800 8.0% 2,957 2.7% 713 0.6% 556 0.5%
Pre 1950 85,922 57,343 66.7% 19,224 22.4% 6,188 7.2% 2,593 3.0% 344 0.4% 230 0.3%
SPACE HEAT FUEL
Electri c Heat 191,639 132,100 68.9% 40,219 21.0% 13,109 6.8% 4,291 2.2% 1,385 0.7% 536 0.3%
Natura l Gas Heat 249,938 149,692 59.9% 61,784 24.7% 24,481 9.8% 10,609 4.2% 2,376 1.0% 996 0.4%
Other Fuel 6,945 4,978 71.7% 1,364 19.6% 337 4.9% 265 3.8% 0 0.0% 0 0.0%
Shared (No Heat on Bi l l ) 36,289 26,002 71.7% 6,925 19.1% 2,338 6.4% 734 2.0% 290 0.8% 0 0.0%
PEOPLE PER HOUSEHOLD
One 124,779 87,835 70.4% 28,040 22.5% 5,934 4.8% 2,113 1.7% 631 0.5% 226 0.2%
Two 221,729 140,799 63.5% 51,015 23.0% 20,034 9.0% 7,479 3.4% 1,643 0.7% 758 0.3%
Three 60,069 36,153 60.2% 13,701 22.8% 6,584 11.0% 3,084 5.1% 432 0.7% 115 0.2%
Four 48,897 29,652 60.6% 10,982 22.5% 5,135 10.5% 1,815 3.7% 1,096 2.2% 217 0.4%
Five + 29,337 18,333 62.5% 6,553 22.3% 2,578 8.8% 1,408 4.8% 248 0.8% 215 0.7%
HOUSEHOLD INCOME
Less Than $25,000 59,481 47,269 79.5% 8,730 14.7% 2,457 4.1% 764 1.3% 261 0.4% 0 0.0%
$25,000 ‐ $49,999 137,082 94,267 68.8% 29,149 21.3% 9,322 6.8% 3,346 2.4% 773 0.6% 226 0.2%
$50,000 ‐ $74,999 123,824 79,072 63.9% 30,314 24.5% 9,991 8.1% 3,394 2.7% 742 0.6% 312 0.3%
$75,000 ‐ $99,999 66,780 41,857 62.7% 16,815 25.2% 4,494 6.7% 2,966 4.4% 535 0.8% 112 0.2%
$100,000 + 97,644 50,307 51.5% 25,285 25.9% 14,002 14.3% 5,429 5.6% 1,741 1.8% 881 0.9%
WINNIPEG LICO‐125 CLASS
Yes 158,987 119,192 75.0% 26,724 16.8% 8,619 5.4% 3,433 2.2% 919 0.6% 100 0.1%
No 325,824 193,580 59.4% 83,569 25.6% 31,646 9.7% 12,465 3.8% 3,133 1.0% 1,431 0.4%
INDIGENOUS SELF‐DECLARED ANCESTRY
Yes 51,429 39,730 77.3% 7,437 14.5% 2,518 4.9% 1,336 2.6% 409 0.8% 0 0.0%
No 409,630 257,295 62.8% 97,420 23.8% 35,990 8.8% 14,080 3.4% 3,428 0.8% 1,417 0.3%
Undeclared 23,751 15,747 66.3% 5,435 22.9% 1,757 7.4% 483 2.0% 214 0.9% 115 0.5%
FIRST NATION ON RESERVE
FIRST NATION ON RESERVE 15,456 12,808 82.9% 1,529 9.9% 746 4.8% 280 1.8% 93 0.6% 0 0.0%
BILL PAYMENT RATING
Excel lent 439,339 280,346 63.8% 101,150 23.0% 37,763 8.6% 14,901 3.4% 3,763 0.9% 1,417 0.3%
Satis factory 22,395 15,766 70.4% 4,701 21.0% 1,205 5.4% 546 2.4% 177 0.8% 0 0.0%
Poor 23,077 16,660 72.2% 4,442 19.2% 1,298 5.6% 451 2.0% 112 0.5% 115 0.5%
DWELLING OWNERSHIP
Own 404,316 249,969 61.8% 97,472 24.1% 36,667 9.1% 15,077 3.7% 3,699 0.9% 1,431 0.4%
Rent / Other 80,495 62,802 78.0% 12,820 15.9% 3,598 4.5% 821 1.0% 352 0.4% 100 0.1%
2017 RESIDENTIAL SURVEY SECTION 6 ‐ ELECTRONICS AND LIGHTING ‐ REFERENCE TABLE 6.04b
COUNT OF HALOGEN LIGHTS IN RESIDENCE
Centra Gas Manitoba Inc. 2019/20 General Rate Application Appendix 7.7
March 22, 2019 Page 99 of 228

92
6.04c Count of Compact Fluorescents Lights (CFL) in Residence
TOTAL NONE % 1‐5 % 6‐10 % 11‐20 % 21‐30 % 31+ %
OVERALL 484,811 282,370 58.2% 112,370 23.2% 55,612 11.5% 27,960 5.8% 4,681 1.0% 1,817 0.4%
FUEL AREA
Winnipeg Ci ty 261,760 142,703 54.5% 67,392 25.7% 32,309 12.3% 16,131 6.2% 2,244 0.9% 981 0.4%
Gas Avai lable 140,021 84,918 60.6% 28,998 20.7% 16,025 11.4% 8,189 5.8% 1,501 1.1% 390 0.3%
No Gas Avai lable 83,030 54,750 65.9% 15,980 19.2% 7,277 8.8% 3,640 4.4% 937 1.1% 446 0.5%
DWELLING TYPE
Single Detached 373,568 205,166 54.9% 88,836 23.8% 48,241 12.9% 25,028 6.7% 4,480 1.2% 1,817 0.5%
Multi Attached 46,834 30,940 66.1% 10,277 21.9% 3,661 7.8% 1,955 4.2% 0 0.0% 0 0.0%
Apartment Suite 64,409 46,264 71.8% 13,257 20.6% 3,710 5.8% 977 1.5% 202 0.3% 0 0.0%
BUILDING CODE ERA
2010‐2017 37,645 26,103 69.3% 5,250 13.9% 3,432 9.1% 2,114 5.6% 417 1.1% 330 0.9%
1990‐2009 89,181 51,282 57.5% 19,301 21.6% 11,410 12.8% 5,867 6.6% 981 1.1% 341 0.4%
1970‐1989 161,749 94,971 58.7% 37,387 23.1% 19,000 11.7% 7,932 4.9% 1,738 1.1% 721 0.4%
1950‐1969 110,314 65,061 59.0% 26,006 23.6% 11,906 10.8% 6,251 5.7% 891 0.8% 199 0.2%
Pre 1950 85,922 44,953 52.3% 24,426 28.4% 9,866 11.5% 5,796 6.7% 655 0.8% 226 0.3%
SPACE HEAT FUEL
Electri c Heat 191,639 121,761 63.5% 36,500 19.0% 19,974 10.4% 10,493 5.5% 2,103 1.1% 809 0.4%
Natura l Gas Heat 249,938 128,348 51.4% 67,273 26.9% 33,707 13.5% 17,023 6.8% 2,578 1.0% 1,008 0.4%
Other Fuel 6,945 5,243 75.5% 1,364 19.6% 337 4.9% 0 0.0% 0 0.0% 0 0.0%
Shared (No Heat on Bi l l ) 36,289 27,019 74.5% 7,233 19.9% 1,594 4.4% 444 1.2% 0 0.0% 0 0.0%
PEOPLE PER HOUSEHOLD
One 124,779 82,811 66.4% 26,161 21.0% 10,692 8.6% 4,312 3.5% 692 0.6% 112 0.1%
Two 221,729 127,681 57.6% 55,105 24.9% 25,428 11.5% 10,915 4.9% 2,178 1.0% 422 0.2%
Three 60,069 31,045 51.7% 13,957 23.2% 8,683 14.5% 4,920 8.2% 790 1.3% 673 1.1%
Four 48,897 25,588 52.3% 10,810 22.1% 6,610 13.5% 4,851 9.9% 605 1.2% 432 0.9%
Five + 29,337 15,245 52.0% 6,337 21.6% 4,198 14.3% 2,963 10.1% 416 1.4% 178 0.6%
HOUSEHOLD INCOME
Less Than $25,000 59,481 46,031 77.4% 9,320 15.7% 3,175 5.3% 924 1.6% 31 0.1% 0 0.0%
$25,000 ‐ $49,999 137,082 86,805 63.3% 29,846 21.8% 13,155 9.6% 6,190 4.5% 752 0.5% 335 0.2%
$50,000 ‐ $74,999 123,824 68,630 55.4% 30,477 24.6% 15,603 12.6% 7,646 6.2% 1,180 1.0% 287 0.2%
$75,000 ‐ $99,999 66,780 33,891 50.8% 17,772 26.6% 9,366 14.0% 4,422 6.6% 873 1.3% 456 0.7%
$100,000 + 97,644 47,013 48.1% 24,955 25.6% 14,313 14.7% 8,778 9.0% 1,845 1.9% 740 0.8%
WINNIPEG LICO‐125 CLASS
Yes 158,987 110,630 69.6% 29,573 18.6% 13,129 8.3% 4,830 3.0% 712 0.4% 112 0.1%
No 325,824 171,740 52.7% 82,797 25.4% 42,483 13.0% 23,130 7.1% 3,969 1.2% 1,706 0.5%
INDIGENOUS SELF‐DECLARED ANCESTRY
Yes 51,429 33,389 64.9% 10,546 20.5% 5,117 10.0% 1,820 3.5% 557 1.1% 0 0.0%
No 409,630 234,198 57.2% 97,368 23.8% 47,863 11.7% 24,678 6.0% 3,817 0.9% 1,706 0.4%
Undeclared 23,751 14,784 62.2% 4,456 18.8% 2,631 11.1% 1,462 6.2% 307 1.3% 112 0.5%
FIRST NATION ON RESERVE
FIRST NATION ON RESERVE 15,456 12,361 80.0% 1,846 11.9% 715 4.6% 441 2.9% 93 0.6% 0 0.0%
BILL PAYMENT RATING
Excel lent 439,339 253,877 57.8% 103,357 23.5% 50,806 11.6% 25,426 5.8% 4,349 1.0% 1,524 0.3%
Satis factory 22,395 12,567 56.1% 5,009 22.4% 3,269 14.6% 1,321 5.9% 230 1.0% 0 0.0%
Poor 23,077 15,926 69.0% 4,004 17.4% 1,538 6.7% 1,213 5.3% 103 0.4% 293 1.3%
DWELLING OWNERSHIP
Own 404,316 222,269 55.0% 97,453 24.1% 51,728 12.8% 26,633 6.6% 4,417 1.1% 1,817 0.4%
Rent / Other 80,495 60,102 74.7% 14,917 18.5% 3,884 4.8% 1,328 1.6% 264 0.3% 0 0.0%
2017 RESIDENTIAL SURVEY SECTION 6 ‐ ELECTRONICS AND LIGHTING ‐ REFERENCE TABLE 6.04c
COUNT OF COMPACT FLUORESCENT LIGHTS (CFL) IN RESIDENCE
Centra Gas Manitoba Inc. 2019/20 General Rate Application Appendix 7.7
March 22, 2019 Page 100 of 228

93
6.04d Count of Light Emitting Diode (LED) Lights in Residence
TOTAL NONE % 1‐5 % 6‐10 % 11‐20 % 21‐30 % 31+ %
OVERALL 484,811 134,918 27.8% 94,386 19.5% 76,053 15.7% 134,527 27.7% 27,957 5.8% 16,970 3.5%
FUEL AREA
Winnipeg City 261,760 69,949 26.7% 56,107 21.4% 42,836 16.4% 70,560 27.0% 14,773 5.6% 7,535 2.9%
Gas Avai lable 140,021 36,903 26.4% 24,283 17.3% 21,065 15.0% 40,373 28.8% 9,879 7.1% 7,519 5.4%
No Gas Avai lable 83,030 28,066 33.8% 13,996 16.9% 12,153 14.6% 23,594 28.4% 3,305 4.0% 1,916 2.3%
DWELLING TYPE
Single Detached 373,568 91,731 24.6% 69,724 18.7% 59,664 16.0% 111,467 29.8% 24,741 6.6% 16,241 4.3%
Multi Attached 46,834 16,701 35.7% 10,269 21.9% 7,250 15.5% 9,575 20.4% 2,473 5.3% 566 1.2%
Apartment Sui te 64,409 26,486 41.1% 14,393 22.3% 9,140 14.2% 13,484 20.9% 743 1.2% 163 0.3%
BUILDING CODE ERA
2010‐2017 37,645 9,016 23.9% 5,703 15.1% 5,255 14.0% 8,348 22.2% 4,616 12.3% 4,708 12.5%
1990‐2009 89,181 23,956 26.9% 14,428 16.2% 13,284 14.9% 26,242 29.4% 6,954 7.8% 4,317 4.8%
1970‐1989 161,749 45,481 28.1% 31,548 19.5% 29,620 18.3% 43,800 27.1% 7,480 4.6% 3,819 2.4%
1950‐1969 110,314 29,987 27.2% 22,918 20.8% 16,285 14.8% 33,611 30.5% 5,297 4.8% 2,217 2.0%
Pre 1950 85,922 26,478 30.8% 19,788 23.0% 11,610 13.5% 22,526 26.2% 3,611 4.2% 1,909 2.2%
SPACE HEAT FUEL
Electric Heat 191,639 61,852 32.3% 32,981 17.2% 30,356 15.8% 51,465 26.9% 10,163 5.3% 4,823 2.5%
Natura l Gas Heat 249,938 54,871 22.0% 51,576 20.6% 42,172 16.9% 72,089 28.8% 17,214 6.9% 12,016 4.8%
Other Fuel 6,945 2,386 34.4% 690 9.9% 337 4.9% 3,401 49.0% 0 0.0% 131 1.9%
Shared (No Heat on Bi l l ) 36,289 15,809 43.6% 9,139 25.2% 3,188 8.8% 7,572 20.9% 580 1.6% 0 0.0%
PEOPLE PER HOUSEHOLD
One 124,779 46,597 37.3% 27,920 22.4% 18,052 14.5% 28,731 23.0% 2,609 2.1% 871 0.7%
Two 221,729 57,879 26.1% 43,855 19.8% 34,957 15.8% 64,729 29.2% 13,360 6.0% 6,948 3.1%
Three 60,069 14,769 24.6% 10,536 17.5% 10,556 17.6% 16,734 27.9% 4,579 7.6% 2,894 4.8%
Four 48,897 8,623 17.6% 8,467 17.3% 6,871 14.1% 16,156 33.0% 4,103 8.4% 4,676 9.6%
Five + 29,337 7,049 24.0% 3,608 12.3% 5,617 19.1% 8,176 27.9% 3,306 11.3% 1,581 5.4%
HOUSEHOLD INCOME
Less Than $25,000 59,481 28,319 47.6% 8,222 13.8% 7,200 12.1% 14,723 24.8% 774 1.3% 243 0.4%
$25,000 ‐ $49,999 137,082 44,974 32.8% 26,688 19.5% 17,646 12.9% 40,092 29.2% 5,847 4.3% 1,835 1.3%
$50,000 ‐ $74,999 123,824 28,816 23.3% 28,279 22.8% 21,776 17.6% 33,592 27.1% 8,043 6.5% 3,318 2.7%
$75,000 ‐ $99,999 66,780 14,019 21.0% 14,895 22.3% 12,505 18.7% 17,353 26.0% 4,720 7.1% 3,289 4.9%
$100,000 + 97,644 18,790 19.2% 16,303 16.7% 16,926 17.3% 28,767 29.5% 8,574 8.8% 8,285 8.5%
WINNIPEG LICO‐125 CLASS
Yes 158,987 61,619 38.8% 25,490 16.0% 21,099 13.3% 42,754 26.9% 6,258 3.9% 1,767 1.1%
No 325,824 73,299 22.5% 68,896 21.1% 54,954 16.9% 91,773 28.2% 21,699 6.7% 15,203 4.7%
INDIGENOUS SELF‐DECLARED ANCESTRY
Yes 51,429 17,806 34.6% 9,197 17.9% 5,490 10.7% 15,754 30.6% 1,925 3.7% 1,256 2.4%
No 409,630 110,660 27.0% 80,803 19.7% 67,430 16.5% 111,928 27.3% 24,194 5.9% 14,615 3.6%
Undeclared 23,751 6,452 27.2% 4,386 18.5% 3,133 13.2% 6,845 28.8% 1,838 7.7% 1,099 4.6%
FIRST NATION ON RESERVE
FIRST NATION ON RESERVE 15,456 7,734 50.0% 2,027 13.1% 1,529 9.9% 3,941 25.5% 93 0.6% 131 0.8%
BILL PAYMENT RATING
Excel lent 439,339 118,924 27.1% 87,210 19.9% 67,635 15.4% 122,612 27.9% 26,599 6.1% 16,359 3.7%
Sati s factory 22,395 7,283 32.5% 4,196 18.7% 4,610 20.6% 5,490 24.5% 305 1.4% 511 2.3%
Poor 23,077 8,710 37.7% 2,980 12.9% 3,809 16.5% 6,425 27.8% 1,053 4.6% 100 0.4%
DWELLING OWNERSHIP
Own 404,316 96,461 23.9% 77,499 19.2% 66,438 16.4% 120,115 29.7% 27,224 6.7% 16,579 4.1%
Rent / Other 80,495 38,457 47.8% 16,887 21.0% 9,615 11.9% 14,412 17.9% 733 0.9% 391 0.5%
2017 RESIDENTIAL SURVEY SECTION 6 ‐ ELECTRONICS AND LIGHTING ‐ REFERENCE TABLE 6.04d
COUNT OF LIGHT EMITTING DIODE (LED) LIGHTS IN RESIDENCE
Centra Gas Manitoba Inc. 2019/20 General Rate Application Appendix 7.7
March 22, 2019 Page 101 of 228
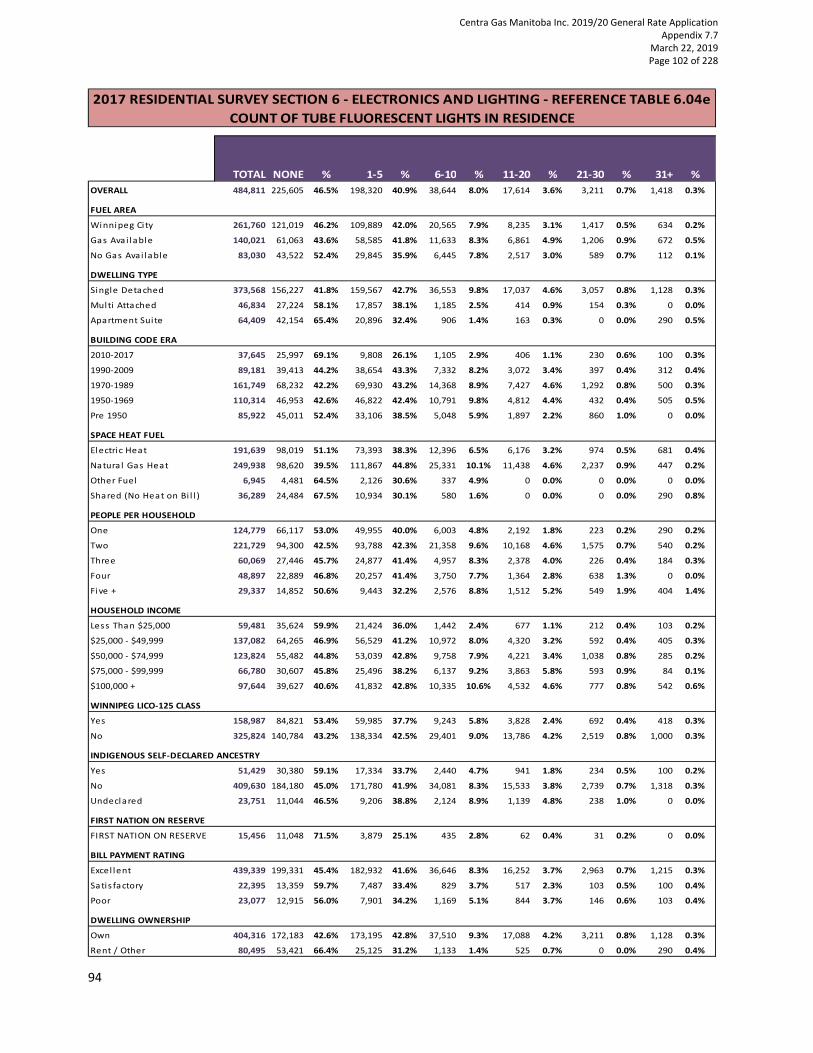
94
6.04e Count of Tube Fluorescent Lights in Residence
TOTAL NONE % 1‐5 % 6‐10 % 11‐20 % 21‐30 % 31+ %
OVERALL 484,811 225,605 46.5% 198,320 40.9% 38,644 8.0% 17,614 3.6% 3,211 0.7% 1,418 0.3%
FUEL AREA
Winnipeg Ci ty 261,760 121,019 46.2% 109,889 42.0% 20,565 7.9% 8,235 3.1% 1,417 0.5% 634 0.2%
Gas Avai lable 140,021 61,063 43.6% 58,585 41.8% 11,633 8.3% 6,861 4.9% 1,206 0.9% 672 0.5%
No Gas Avai lable 83,030 43,522 52.4% 29,845 35.9% 6,445 7.8% 2,517 3.0% 589 0.7% 112 0.1%
DWELLING TYPE
Single Detached 373,568 156,227 41.8% 159,567 42.7% 36,553 9.8% 17,037 4.6% 3,057 0.8% 1,128 0.3%
Multi Attached 46,834 27,224 58.1% 17,857 38.1% 1,185 2.5% 414 0.9% 154 0.3% 0 0.0%
Apartment Suite 64,409 42,154 65.4% 20,896 32.4% 906 1.4% 163 0.3% 0 0.0% 290 0.5%
BUILDING CODE ERA
2010‐2017 37,645 25,997 69.1% 9,808 26.1% 1,105 2.9% 406 1.1% 230 0.6% 100 0.3%
1990‐2009 89,181 39,413 44.2% 38,654 43.3% 7,332 8.2% 3,072 3.4% 397 0.4% 312 0.4%
1970‐1989 161,749 68,232 42.2% 69,930 43.2% 14,368 8.9% 7,427 4.6% 1,292 0.8% 500 0.3%
1950‐1969 110,314 46,953 42.6% 46,822 42.4% 10,791 9.8% 4,812 4.4% 432 0.4% 505 0.5%
Pre 1950 85,922 45,011 52.4% 33,106 38.5% 5,048 5.9% 1,897 2.2% 860 1.0% 0 0.0%
SPACE HEAT FUEL
Electri c Heat 191,639 98,019 51.1% 73,393 38.3% 12,396 6.5% 6,176 3.2% 974 0.5% 681 0.4%
Natura l Gas Heat 249,938 98,620 39.5% 111,867 44.8% 25,331 10.1% 11,438 4.6% 2,237 0.9% 447 0.2%
Other Fuel 6,945 4,481 64.5% 2,126 30.6% 337 4.9% 0 0.0% 0 0.0% 0 0.0%
Shared (No Heat on Bi l l ) 36,289 24,484 67.5% 10,934 30.1% 580 1.6% 0 0.0% 0 0.0% 290 0.8%
PEOPLE PER HOUSEHOLD
One 124,779 66,117 53.0% 49,955 40.0% 6,003 4.8% 2,192 1.8% 223 0.2% 290 0.2%
Two 221,729 94,300 42.5% 93,788 42.3% 21,358 9.6% 10,168 4.6% 1,575 0.7% 540 0.2%
Three 60,069 27,446 45.7% 24,877 41.4% 4,957 8.3% 2,378 4.0% 226 0.4% 184 0.3%
Four 48,897 22,889 46.8% 20,257 41.4% 3,750 7.7% 1,364 2.8% 638 1.3% 0 0.0%
Five + 29,337 14,852 50.6% 9,443 32.2% 2,576 8.8% 1,512 5.2% 549 1.9% 404 1.4%
HOUSEHOLD INCOME
Less Than $25,000 59,481 35,624 59.9% 21,424 36.0% 1,442 2.4% 677 1.1% 212 0.4% 103 0.2%
$25,000 ‐ $49,999 137,082 64,265 46.9% 56,529 41.2% 10,972 8.0% 4,320 3.2% 592 0.4% 405 0.3%
$50,000 ‐ $74,999 123,824 55,482 44.8% 53,039 42.8% 9,758 7.9% 4,221 3.4% 1,038 0.8% 285 0.2%
$75,000 ‐ $99,999 66,780 30,607 45.8% 25,496 38.2% 6,137 9.2% 3,863 5.8% 593 0.9% 84 0.1%
$100,000 + 97,644 39,627 40.6% 41,832 42.8% 10,335 10.6% 4,532 4.6% 777 0.8% 542 0.6%
WINNIPEG LICO‐125 CLASS
Yes 158,987 84,821 53.4% 59,985 37.7% 9,243 5.8% 3,828 2.4% 692 0.4% 418 0.3%
No 325,824 140,784 43.2% 138,334 42.5% 29,401 9.0% 13,786 4.2% 2,519 0.8% 1,000 0.3%
INDIGENOUS SELF‐DECLARED ANCESTRY
Yes 51,429 30,380 59.1% 17,334 33.7% 2,440 4.7% 941 1.8% 234 0.5% 100 0.2%
No 409,630 184,180 45.0% 171,780 41.9% 34,081 8.3% 15,533 3.8% 2,739 0.7% 1,318 0.3%
Undeclared 23,751 11,044 46.5% 9,206 38.8% 2,124 8.9% 1,139 4.8% 238 1.0% 0 0.0%
FIRST NATION ON RESERVE
FIRST NATION ON RESERVE 15,456 11,048 71.5% 3,879 25.1% 435 2.8% 62 0.4% 31 0.2% 0 0.0%
BILL PAYMENT RATING
Excel lent 439,339 199,331 45.4% 182,932 41.6% 36,646 8.3% 16,252 3.7% 2,963 0.7% 1,215 0.3%
Satis factory 22,395 13,359 59.7% 7,487 33.4% 829 3.7% 517 2.3% 103 0.5% 100 0.4%
Poor 23,077 12,915 56.0% 7,901 34.2% 1,169 5.1% 844 3.7% 146 0.6% 103 0.4%
DWELLING OWNERSHIP
Own 404,316 172,183 42.6% 173,195 42.8% 37,510 9.3% 17,088 4.2% 3,211 0.8% 1,128 0.3%
Rent / Other 80,495 53,421 66.4% 25,125 31.2% 1,133 1.4% 525 0.7% 0 0.0% 290 0.4%
2017 RESIDENTIAL SURVEY SECTION 6 ‐ ELECTRONICS AND LIGHTING ‐ REFERENCE TABLE 6.04e
COUNT OF TUBE FLUORESCENT LIGHTS IN RESIDENCE
Centra Gas Manitoba Inc. 2019/20 General Rate Application Appendix 7.7
March 22, 2019 Page 102 of 228

95
6.05 LED Lights Purchased Through Manitoba Hydro’s Instant Rebate Promotion
TOTAL NONE % 1‐5 % 6‐10 % 11‐20 % 21‐30 % 31+ %
OVERALL 484,811 286,487 59.1% 66,080 13.6% 53,171 11.0% 50,463 10.4% 16,898 3.5% 11,711 2.4%
FUEL AREA
Winnipeg Ci ty 261,760 151,927 58.0% 37,254 14.2% 28,867 11.0% 29,130 11.1% 9,038 3.5% 5,544 2.1%
Gas Avai lable 140,021 80,309 57.4% 18,874 13.5% 14,490 10.3% 15,926 11.4% 5,814 4.2% 4,607 3.3%
No Gas Avai lable 83,030 54,250 65.3% 9,952 12.0% 9,814 11.8% 5,407 6.5% 2,046 2.5% 1,559 1.9%
DWELLING TYPE
Single Detached 373,568 206,722 55.3% 50,919 13.6% 44,601 11.9% 44,585 11.9% 15,701 4.2% 11,040 3.0%
Multi Attached 46,834 33,014 70.5% 6,016 12.8% 4,014 8.6% 2,612 5.6% 871 1.9% 306 0.7%
Apartment Sui te 64,409 46,751 72.6% 9,146 14.2% 4,556 7.1% 3,266 5.1% 326 0.5% 365 0.6%
BUILDING CODE ERA
2010‐2017 37,645 22,701 60.3% 2,945 7.8% 3,050 8.1% 4,916 13.1% 2,276 6.0% 1,756 4.7%
1990‐2009 89,181 50,982 57.2% 10,430 11.7% 9,403 10.5% 10,912 12.2% 4,086 4.6% 3,369 3.8%
1970‐1989 161,749 93,607 57.9% 23,696 14.7% 18,956 11.7% 16,687 10.3% 5,053 3.1% 3,749 2.3%
1950‐1969 110,314 65,570 59.4% 16,423 14.9% 12,318 11.2% 11,015 10.0% 3,330 3.0% 1,659 1.5%
Pre 1950 85,922 53,627 62.4% 12,585 14.6% 9,445 11.0% 6,934 8.1% 2,153 2.5% 1,178 1.4%
SPACE HEAT FUEL
Electric Heat 191,639 121,662 63.5% 23,864 12.5% 19,871 10.4% 16,220 8.5% 6,416 3.3% 3,607 1.9%
Natural Gas Heat 249,938 133,361 53.4% 35,473 14.2% 30,894 12.4% 31,960 12.8% 10,482 4.2% 7,767 3.1%
Other Fuel 6,945 4,041 58.2% 734 10.6% 1,143 16.5% 690 9.9% 0 0.0% 337 4.9%
Shared (No Heat on Bi l l ) 36,289 27,423 75.6% 6,009 16.6% 1,263 3.5% 1,594 4.4% 0 0.0% 0 0.0%
PEOPLE PER HOUSEHOLD
One 124,779 84,247 67.5% 18,906 15.2% 11,130 8.9% 7,772 6.2% 1,900 1.5% 824 0.7%
Two 221,729 127,071 57.3% 30,005 13.5% 26,514 12.0% 26,378 11.9% 7,456 3.4% 4,306 1.9%
Three 60,069 34,526 57.5% 7,761 12.9% 6,783 11.3% 6,356 10.6% 2,353 3.9% 2,291 3.8%
Four 48,897 23,762 48.6% 6,527 13.3% 6,158 12.6% 6,414 13.1% 3,065 6.3% 2,970 6.1%
Five + 29,337 16,880 57.5% 2,881 9.8% 2,587 8.8% 3,543 12.1% 2,124 7.2% 1,321 4.5%
HOUSEHOLD INCOME
Less Than $25,000 59,481 43,760 73.6% 7,186 12.1% 6,110 10.3% 1,858 3.1% 441 0.7% 124 0.2%
$25,000 ‐ $49,999 137,082 87,430 63.8% 19,664 14.3% 13,976 10.2% 11,198 8.2% 2,929 2.1% 1,885 1.4%
$50,000 ‐ $74,999 123,824 71,741 57.9% 16,608 13.4% 14,165 11.4% 14,019 11.3% 4,631 3.7% 2,660 2.1%
$75,000 ‐ $99,999 66,780 35,107 52.6% 9,478 14.2% 8,038 12.0% 9,715 14.5% 2,608 3.9% 1,834 2.7%
$100,000 + 97,644 48,449 49.6% 13,144 13.5% 10,882 11.1% 13,673 14.0% 6,289 6.4% 5,207 5.3%
WINNIPEG LICO‐125 CLASS
Yes 158,987 108,096 68.0% 19,583 12.3% 15,195 9.6% 10,772 6.8% 3,710 2.3% 1,631 1.0%
No 325,824 178,391 54.8% 46,497 14.3% 37,976 11.7% 39,692 12.2% 13,188 4.0% 10,080 3.1%
INDIGENOUS SELF‐DECLARED ANCESTRY
Yes 51,429 34,402 66.9% 5,351 10.4% 4,676 9.1% 3,729 7.3% 1,761 3.4% 1,511 2.9%
No 409,630 238,907 58.3% 58,739 14.3% 45,981 11.2% 42,604 10.4% 14,011 3.4% 9,388 2.3%
Undeclared 23,751 13,179 55.5% 1,990 8.4% 2,514 10.6% 4,131 17.4% 1,125 4.7% 812 3.4%
FIRST NATION ON RESERVE
FIRST NATION ON RESERVE 15,456 11,851 76.7% 1,635 10.6% 1,125 7.3% 596 3.9% 62 0.4% 187 1.2%
BILL PAYMENT RATING
Excel lent 439,339 254,814 58.0% 60,476 13.8% 49,501 11.3% 47,885 10.9% 15,730 3.6% 10,932 2.5%
Sati s factory 22,395 15,230 68.0% 2,333 10.4% 2,307 10.3% 2,086 9.3% 305 1.4% 134 0.6%
Poor 23,077 16,443 71.3% 3,271 14.2% 1,363 5.9% 493 2.1% 862 3.7% 645 2.8%
DWELLING OWNERSHIP
Own 404,316 223,885 55.4% 57,621 14.3% 47,921 11.9% 47,279 11.7% 16,572 4.1% 11,037 2.7%
Rent / Other 80,495 62,602 77.8% 8,458 10.5% 5,250 6.5% 3,184 4.0% 326 0.4% 674 0.8%
2017 RESIDENTIAL SURVEY SECTION 6 ‐ ELECTRONICS AND LIGHTING ‐ REFERENCE TABLE 6.05
LED LIGHTS PURCHASED THROUGH MANITOBA HYDRO'S INSTANT REBATE PROMOTION
Centra Gas Manitoba Inc. 2019/20 General Rate Application Appendix 7.7
March 22, 2019 Page 103 of 228

96
6.06 LED Lights Purchased Not During Manitoba Hydro’s Instant Rebate Promotion
TOTAL NONE % 1‐5 % 6‐10 % 11‐20 % 21‐30 % 31+ %
OVERALL 484,811 261,151 53.9% 111,134 22.9% 56,596 11.7% 37,464 7.7% 11,366 2.3% 7,100 1.5%
FUEL AREA
Winnipeg Ci ty 261,760 140,054 53.5% 63,825 24.4% 28,237 10.8% 20,706 7.9% 5,425 2.1% 3,512 1.3%
Gas Avai lable 140,021 73,367 52.4% 31,429 22.4% 17,893 12.8% 10,879 7.8% 3,833 2.7% 2,620 1.9%
No Gas Avai lable 83,030 47,730 57.5% 15,879 19.1% 10,465 12.6% 5,879 7.1% 2,109 2.5% 968 1.2%
DWELLING TYPE
Single Detached 373,568 189,986 50.9% 88,776 23.8% 48,169 12.9% 29,783 8.0% 10,440 2.8% 6,415 1.7%
Multi Attached 46,834 27,611 59.0% 9,215 19.7% 4,412 9.4% 4,564 9.7% 927 2.0% 105 0.2%
Apartment Suite 64,409 43,554 67.6% 13,143 20.4% 4,014 6.2% 3,118 4.8% 0 0.0% 580 0.9%
BUILDING CODE ERA
2010‐2017 37,645 20,970 55.7% 7,177 19.1% 3,061 8.1% 3,880 10.3% 1,407 3.7% 1,151 3.1%
1990‐2009 89,181 45,632 51.2% 20,004 22.4% 11,704 13.1% 7,870 8.8% 2,404 2.7% 1,567 1.8%
1970‐1989 161,749 87,379 54.0% 39,478 24.4% 19,829 12.3% 10,231 6.3% 3,021 1.9% 1,810 1.1%
1950‐1969 110,314 58,103 52.7% 25,047 22.7% 12,416 11.3% 9,844 8.9% 2,999 2.7% 1,905 1.7%
Pre 1950 85,922 49,066 57.1% 19,428 22.6% 9,586 11.2% 5,639 6.6% 1,535 1.8% 668 0.8%
SPACE HEAT FUEL
Electri c Heat 191,639 108,899 56.8% 40,330 21.0% 20,844 10.9% 14,454 7.5% 4,479 2.3% 2,635 1.4%
Natura l Gas Heat 249,938 123,560 49.4% 62,575 25.0% 32,644 13.1% 20,386 8.2% 6,888 2.8% 3,885 1.6%
Other Fuel 6,945 3,544 51.0% 1,699 24.5% 1,702 24.5% 0 0.0% 0 0.0% 0 0.0%
Shared (No Heat on Bi l l ) 36,289 25,148 69.3% 6,530 18.0% 1,406 3.9% 2,625 7.2% 0 0.0% 580 1.6%
PEOPLE PER HOUSEHOLD
One 124,779 79,563 63.8% 27,135 21.7% 9,643 7.7% 6,665 5.3% 1,111 0.9% 662 0.5%
Two 221,729 115,277 52.0% 53,151 24.0% 28,217 12.7% 16,986 7.7% 5,326 2.4% 2,772 1.3%
Three 60,069 30,264 50.4% 14,079 23.4% 8,335 13.9% 4,908 8.2% 1,435 2.4% 1,049 1.7%
Four 48,897 21,459 43.9% 11,739 24.0% 6,980 14.3% 6,031 12.3% 1,463 3.0% 1,225 2.5%
Five + 29,337 14,588 49.7% 5,030 17.1% 3,422 11.7% 2,874 9.8% 2,032 6.9% 1,391 4.7%
HOUSEHOLD INCOME
Less Than $25,000 59,481 40,613 68.3% 9,995 16.8% 5,822 9.8% 1,921 3.2% 863 1.5% 267 0.4%
$25,000 ‐ $49,999 137,082 80,226 58.5% 29,156 21.3% 13,181 9.6% 9,723 7.1% 2,917 2.1% 1,879 1.4%
$50,000 ‐ $74,999 123,824 63,878 51.6% 30,606 24.7% 14,229 11.5% 10,672 8.6% 2,790 2.3% 1,647 1.3%
$75,000 ‐ $99,999 66,780 31,129 46.6% 17,859 26.7% 9,981 14.9% 5,860 8.8% 1,304 2.0% 648 1.0%
$100,000 + 97,644 45,305 46.4% 23,517 24.1% 13,383 13.7% 9,289 9.5% 3,492 3.6% 2,659 2.7%
WINNIPEG LICO‐125 CLASS
Yes 158,987 99,664 62.7% 29,227 18.4% 16,000 10.1% 9,074 5.7% 3,817 2.4% 1,206 0.8%
No 325,824 161,487 49.6% 81,906 25.1% 40,596 12.5% 28,391 8.7% 7,549 2.3% 5,894 1.8%
INDIGENOUS SELF‐DECLARED ANCESTRY
Yes 51,429 31,187 60.6% 9,977 19.4% 5,460 10.6% 3,468 6.7% 949 1.8% 387 0.8%
No 409,630 217,558 53.1% 96,471 23.6% 47,906 11.7% 31,958 7.8% 9,370 2.3% 6,368 1.6%
Undeclared 23,751 12,406 52.2% 4,686 19.7% 3,229 13.6% 2,038 8.6% 1,048 4.4% 344 1.4%
FIRST NATION ON RESERVE
FIRST NATION ON RESERVE 15,456 11,148 72.1% 1,852 12.0% 1,461 9.5% 591 3.8% 218 1.4% 187 1.2%
BILL PAYMENT RATING
Excel lent 439,339 234,658 53.4% 102,142 23.2% 50,635 11.5% 34,859 7.9% 10,497 2.4% 6,548 1.5%
Satis factory 22,395 12,035 53.7% 5,696 25.4% 2,829 12.6% 1,240 5.5% 480 2.1% 115 0.5%
Poor 23,077 14,458 62.7% 3,295 14.3% 3,132 13.6% 1,365 5.9% 389 1.7% 438 1.9%
DWELLING OWNERSHIP
Own 404,316 204,319 50.5% 97,489 24.1% 51,092 12.6% 34,241 8.5% 10,965 2.7% 6,211 1.5%
Rent / Other 80,495 56,832 70.6% 13,644 17.0% 5,504 6.8% 3,224 4.0% 402 0.5% 889 1.1%
2017 RESIDENTIAL SURVEY SECTION 6 ‐ ELECTRONICS AND LIGHTING ‐ REFERENCE TABLE 6.06
LED LIGHTS PURCHASED NOT DURING MANITOBA HYDRO'S INSTANT REBATE PROMOTION
Centra Gas Manitoba Inc. 2019/20 General Rate Application Appendix 7.7
March 22, 2019 Page 104 of 228
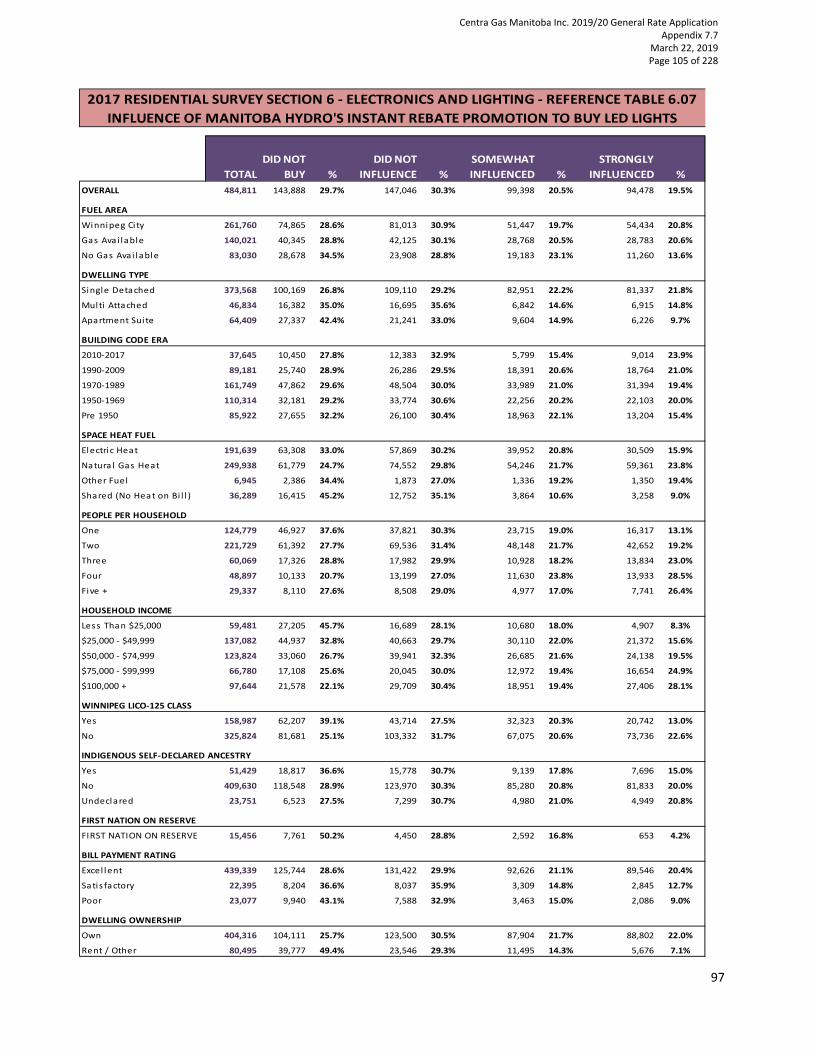
97
6.07 Influence of Manitoba Hydro’s Instant Rebate Promotion to Buy LED Lights
TOTAL
DID NOT
BUY %
DID NOT
INFLUENCE %
SOMEWHAT
INFLUENCED %
STRONGLY
INFLUENCED %
OVERALL 484,811 143,888 29.7% 147,046 30.3% 99,398 20.5% 94,478 19.5%
FUEL AREA
Winnipeg Ci ty 261,760 74,865 28.6% 81,013 30.9% 51,447 19.7% 54,434 20.8%
Gas Avai lable 140,021 40,345 28.8% 42,125 30.1% 28,768 20.5% 28,783 20.6%
No Gas Avai lable 83,030 28,678 34.5% 23,908 28.8% 19,183 23.1% 11,260 13.6%
DWELLING TYPE
Single Detached 373,568 100,169 26.8% 109,110 29.2% 82,951 22.2% 81,337 21.8%
Multi Attached 46,834 16,382 35.0% 16,695 35.6% 6,842 14.6% 6,915 14.8%
Apartment Suite 64,409 27,337 42.4% 21,241 33.0% 9,604 14.9% 6,226 9.7%
BUILDING CODE ERA
2010‐2017 37,645 10,450 27.8% 12,383 32.9% 5,799 15.4% 9,014 23.9%
1990‐2009 89,181 25,740 28.9% 26,286 29.5% 18,391 20.6% 18,764 21.0%
1970‐1989 161,749 47,862 29.6% 48,504 30.0% 33,989 21.0% 31,394 19.4%
1950‐1969 110,314 32,181 29.2% 33,774 30.6% 22,256 20.2% 22,103 20.0%
Pre 1950 85,922 27,655 32.2% 26,100 30.4% 18,963 22.1% 13,204 15.4%
SPACE HEAT FUEL
Electri c Heat 191,639 63,308 33.0% 57,869 30.2% 39,952 20.8% 30,509 15.9%
Natura l Gas Heat 249,938 61,779 24.7% 74,552 29.8% 54,246 21.7% 59,361 23.8%
Other Fuel 6,945 2,386 34.4% 1,873 27.0% 1,336 19.2% 1,350 19.4%
Shared (No Heat on Bi l l ) 36,289 16,415 45.2% 12,752 35.1% 3,864 10.6% 3,258 9.0%
PEOPLE PER HOUSEHOLD
One 124,779 46,927 37.6% 37,821 30.3% 23,715 19.0% 16,317 13.1%
Two 221,729 61,392 27.7% 69,536 31.4% 48,148 21.7% 42,652 19.2%
Three 60,069 17,326 28.8% 17,982 29.9% 10,928 18.2% 13,834 23.0%
Four 48,897 10,133 20.7% 13,199 27.0% 11,630 23.8% 13,933 28.5%
Five + 29,337 8,110 27.6% 8,508 29.0% 4,977 17.0% 7,741 26.4%
HOUSEHOLD INCOME
Less Than $25,000 59,481 27,205 45.7% 16,689 28.1% 10,680 18.0% 4,907 8.3%
$25,000 ‐ $49,999 137,082 44,937 32.8% 40,663 29.7% 30,110 22.0% 21,372 15.6%
$50,000 ‐ $74,999 123,824 33,060 26.7% 39,941 32.3% 26,685 21.6% 24,138 19.5%
$75,000 ‐ $99,999 66,780 17,108 25.6% 20,045 30.0% 12,972 19.4% 16,654 24.9%
$100,000 + 97,644 21,578 22.1% 29,709 30.4% 18,951 19.4% 27,406 28.1%
WINNIPEG LICO‐125 CLASS
Yes 158,987 62,207 39.1% 43,714 27.5% 32,323 20.3% 20,742 13.0%
No 325,824 81,681 25.1% 103,332 31.7% 67,075 20.6% 73,736 22.6%
INDIGENOUS SELF‐DECLARED ANCESTRY
Yes 51,429 18,817 36.6% 15,778 30.7% 9,139 17.8% 7,696 15.0%
No 409,630 118,548 28.9% 123,970 30.3% 85,280 20.8% 81,833 20.0%
Undeclared 23,751 6,523 27.5% 7,299 30.7% 4,980 21.0% 4,949 20.8%
FIRST NATION ON RESERVE
FIRST NATION ON RESERVE 15,456 7,761 50.2% 4,450 28.8% 2,592 16.8% 653 4.2%
BILL PAYMENT RATING
Excel lent 439,339 125,744 28.6% 131,422 29.9% 92,626 21.1% 89,546 20.4%
Satis factory 22,395 8,204 36.6% 8,037 35.9% 3,309 14.8% 2,845 12.7%
Poor 23,077 9,940 43.1% 7,588 32.9% 3,463 15.0% 2,086 9.0%
DWELLING OWNERSHIP
Own 404,316 104,111 25.7% 123,500 30.5% 87,904 21.7% 88,802 22.0%
Rent / Other 80,495 39,777 49.4% 23,546 29.3% 11,495 14.3% 5,676 7.1%
2017 RESIDENTIAL SURVEY SECTION 6 ‐ ELECTRONICS AND LIGHTING ‐ REFERENCE TABLE 6.07
INFLUENCE OF MANITOBA HYDRO'S INSTANT REBATE PROMOTION TO BUY LED LIGHTS
Centra Gas Manitoba Inc. 2019/20 General Rate Application Appendix 7.7
March 22, 2019 Page 105 of 228

98
6.08 If There Wasn’t a Promotion, Would You Have Purchased LED Lights
TOTAL
WOULD
NOT BUY %
WOULD
BUY LESS %
WOULD BUY
THE SAME %
NO LED
BULBS %
OVERALL 484,811 61,101 12.6% 105,984 21.9% 199,792 41.2% 117,934 24.3%
FUEL AREA
Winnipeg Ci ty 261,760 33,202 12.7% 60,075 23.0% 108,493 41.4% 59,990 22.9%
Gas Avai lable 140,021 18,480 13.2% 31,014 22.1% 57,185 40.8% 33,342 23.8%
No Gas Avai lable 83,030 9,419 11.3% 14,895 17.9% 34,114 41.1% 24,602 29.6%
DWELLING TYPE
Single Detached 373,568 48,764 13.1% 90,085 24.1% 153,630 41.1% 81,089 21.7%
Multi Attached 46,834 4,977 10.6% 7,030 15.0% 20,602 44.0% 14,224 30.4%
Apartment Suite 64,409 7,359 11.4% 8,869 13.8% 25,560 39.7% 22,621 35.1%
BUILDING CODE ERA
2010‐2017 37,645 4,297 11.4% 9,152 24.3% 16,829 44.7% 7,367 19.6%
1990‐2009 89,181 11,177 12.5% 19,417 21.8% 37,689 42.3% 20,898 23.4%
1970‐1989 161,749 20,173 12.5% 35,225 21.8% 66,064 40.8% 40,286 24.9%
1950‐1969 110,314 15,750 14.3% 23,005 20.9% 44,519 40.4% 27,040 24.5%
Pre 1950 85,922 9,704 11.3% 19,184 22.3% 34,691 40.4% 22,343 26.0%
SPACE HEAT FUEL
Electri c Heat 191,639 22,236 11.6% 37,543 19.6% 79,112 41.3% 52,748 27.5%
Natura l Gas Heat 249,938 33,919 13.6% 62,050 24.8% 104,429 41.8% 49,540 19.8%
Other Fuel 6,945 734 10.6% 2,039 29.4% 1,917 27.6% 2,255 32.5%
Shared (No Heat on Bi l l ) 36,289 4,212 11.6% 4,352 12.0% 14,334 39.5% 13,391 36.9%
PEOPLE PER HOUSEHOLD
One 124,779 13,902 11.1% 21,410 17.2% 50,400 40.4% 39,068 31.3%
Two 221,729 25,897 11.7% 50,824 22.9% 93,799 42.3% 51,210 23.1%
Three 60,069 9,056 15.1% 12,861 21.4% 24,332 40.5% 13,820 23.0%
Four 48,897 7,707 15.8% 13,293 27.2% 20,000 40.9% 7,897 16.1%
Five + 29,337 4,539 15.5% 7,596 25.9% 11,262 38.4% 5,940 20.2%
HOUSEHOLD INCOME
Less Than $25,000 59,481 6,369 10.7% 7,645 12.9% 20,243 34.0% 25,224 42.4%
$25,000 ‐ $49,999 137,082 16,969 12.4% 25,340 18.5% 56,086 40.9% 38,688 28.2%
$50,000 ‐ $74,999 123,824 15,072 12.2% 27,431 22.2% 56,524 45.6% 24,797 20.0%
$75,000 ‐ $99,999 66,780 8,102 12.1% 17,793 26.6% 27,746 41.5% 13,139 19.7%
$100,000 + 97,644 14,589 14.9% 27,775 28.4% 39,195 40.1% 16,085 16.5%
WINNIPEG LICO‐125 CLASS
Yes 158,987 20,391 12.8% 25,250 15.9% 59,254 37.3% 54,092 34.0%
No 325,824 40,710 12.5% 80,734 24.8% 140,538 43.1% 63,842 19.6%
INDIGENOUS SELF‐DECLARED ANCESTRY
Yes 51,429 8,214 16.0% 8,263 16.1% 20,017 38.9% 14,935 29.0%
No 409,630 49,958 12.2% 92,102 22.5% 169,836 41.5% 97,735 23.9%
Undeclared 23,751 2,928 12.3% 5,620 23.7% 9,940 41.8% 5,264 22.2%
FIRST NATION ON RESERVE
FIRST NATION ON RESERVE 15,456 2,045 13.2% 1,648 10.7% 5,490 35.5% 6,273 40.6%
BILL PAYMENT RATING
Excel lent 439,339 55,935 12.7% 99,825 22.7% 180,218 41.0% 103,360 23.5%
Satis factory 22,395 2,615 11.7% 3,403 15.2% 10,160 45.4% 6,217 27.8%
Poor 23,077 2,551 11.1% 2,756 11.9% 9,414 40.8% 8,357 36.2%
DWELLING OWNERSHIP
Own 404,316 52,395 13.0% 97,347 24.1% 169,365 41.9% 85,209 21.1%
Rent / Other 80,495 8,706 10.8% 8,637 10.7% 30,427 37.8% 32,725 40.7%
2017 RESIDENTIAL SURVEY SECTION 6 ‐ ELECTRONICS AND LIGHTING ‐ REFERENCE TABLE 6.08
IF THERE WASN'T A PROMOTION, WOULD YOU HAVE PURCHASED LED LIGHTS
Centra Gas Manitoba Inc. 2019/20 General Rate Application Appendix 7.7
March 22, 2019 Page 106 of 228

99
6.09 Use of Outdoor Seasonal Lights
TOTAL NONE % LED LIGHTS %
INCANDESCENT
LIGHTS %
BOTH LED AND
INCANDESCENT %
OVERALL 484,811 235,908 48.7% 163,249 33.7% 41,150 8.5% 44,505 9.2%
FUEL AREA
Winnipeg City 261,760 135,603 51.8% 87,841 33.6% 20,399 7.8% 17,917 6.8%
Gas Ava i lable 140,021 59,897 42.8% 49,643 35.5% 13,352 9.5% 17,129 12.2%
No Gas Avai lable 83,030 40,408 48.7% 25,764 31.0% 7,399 8.9% 9,459 11.4%
DWELLING TYPE
Single Detached 373,568 163,235 43.7% 139,582 37.4% 33,092 8.9% 37,660 10.1%
Multi Attached 46,834 27,856 59.5% 11,172 23.9% 4,594 9.8% 3,211 6.9%
Apartment Sui te 64,409 44,817 69.6% 12,494 19.4% 3,464 5.4% 3,634 5.6%
BUILDING CODE ERA
2010‐2017 37,645 17,469 46.4% 15,379 40.9% 1,372 3.6% 3,425 9.1%
1990‐2009 89,181 38,187 42.8% 35,094 39.4% 6,914 7.8% 8,987 10.1%
1970‐1989 161,749 78,681 48.6% 50,401 31.2% 15,386 9.5% 17,281 10.7%
1950‐1969 110,314 53,568 48.6% 37,724 34.2% 10,975 9.9% 8,048 7.3%
Pre 1950 85,922 48,004 55.9% 24,651 28.7% 6,503 7.6% 6,764 7.9%
SPACE HEAT FUEL
Electric Heat 191,639 97,059 50.6% 57,473 30.0% 16,538 8.6% 20,568 10.7%
Natura l Gas Heat 249,938 109,626 43.9% 97,005 38.8% 20,633 8.3% 22,674 9.1%
Other Fuel 6,945 4,644 66.9% 1,627 23.4% 675 9.7% 0 0.0%
Shared (No Heat on Bi l l ) 36,289 24,580 67.7% 7,143 19.7% 3,304 9.1% 1,263 3.5%
PEOPLE PER HOUSEHOLD
One 124,779 85,568 68.6% 23,938 19.2% 8,558 6.9% 6,715 5.4%
Two 221,729 94,639 42.7% 82,883 37.4% 20,958 9.5% 23,249 10.5%
Three 60,069 25,646 42.7% 22,782 37.9% 6,015 10.0% 5,626 9.4%
Four 48,897 18,495 37.8% 21,851 44.7% 2,886 5.9% 5,664 11.6%
Five + 29,337 11,560 39.4% 11,794 40.2% 2,731 9.3% 3,251 11.1%
HOUSEHOLD INCOME
Less Than $25,000 59,481 40,820 68.6% 11,122 18.7% 4,272 7.2% 3,268 5.5%
$25,000 ‐ $49,999 137,082 77,104 56.2% 35,985 26.3% 11,541 8.4% 12,452 9.1%
$50,000 ‐ $74,999 123,824 56,158 45.4% 43,607 35.2% 10,985 8.9% 13,075 10.6%
$75,000 ‐ $99,999 66,780 26,734 40.0% 27,691 41.5% 5,977 8.9% 6,378 9.6%
$100,000 + 97,644 35,093 35.9% 44,844 45.9% 8,376 8.6% 9,332 9.6%
WINNIPEG LICO‐125 CLASS
Yes 158,987 96,319 60.6% 37,920 23.9% 12,826 8.1% 11,922 7.5%
No 325,824 139,589 42.8% 125,328 38.5% 28,324 8.7% 32,583 10.0%
INDIGENOUS SELF‐DECLARED ANCESTRY
Yes 51,429 27,393 53.3% 15,728 30.6% 3,367 6.5% 4,942 9.6%
No 409,630 194,728 47.5% 140,792 34.4% 36,889 9.0% 37,221 9.1%
Undeclared 23,751 13,787 58.0% 6,729 28.3% 894 3.8% 2,342 9.9%
FIRST NATION ON RESERVE
FIRST NATION ON RESERVE 15,456 9,208 59.6% 3,221 20.8% 1,467 9.5% 1,560 10.1%
BILL PAYMENT RATING
Excel lent 439,339 208,762 47.5% 151,649 34.5% 38,197 8.7% 40,731 9.3%
Satis factory 22,395 12,874 57.5% 6,342 28.3% 1,123 5.0% 2,056 9.2%
Poor 23,077 14,272 61.8% 5,257 22.8% 1,830 7.9% 1,719 7.4%
DWELLING OWNERSHIP
Own 404,316 182,216 45.1% 147,017 36.4% 35,440 8.8% 39,644 9.8%
Rent / Other 80,495 53,692 66.7% 16,232 20.2% 5,710 7.1% 4,861 6.0%
2017 RESIDENTIAL SURVEY SECTION 6 ‐ ELECTRONICS AND LIGHTING ‐ REFERENCE TABLE 6.09
USE OF OUTDOOR SEASONAL LIGHTS
Centra Gas Manitoba Inc. 2019/20 General Rate Application Appendix 7.7
March 22, 2019 Page 107 of 228
100
Centra Gas Manitoba Inc. 2019/20 General Rate Application Appendix 7.7
March 22, 2019 Page 108 of 228

101
SECTION 7 POOLS AND VEHICLES
SECTION 7 POOLS AND VEHICLES
Centra Gas Manitoba Inc. 2019/20 General Rate Application Appendix 7.7
March 22, 2019 Page 109 of 228

102
7.01a Pool Type
TOTAL NO POOL % INDOOR POOL %
OUTDOOR
ABOVE
GROUND %
OUTDOOR
BELOW
GROUND %
OVERALL 484,811 467,241 96.4% 214 0.0% 4,887 1.0% 12,469 2.6%
FUEL AREA
Winnipeg City 261,760 250,925 95.9% 0 0.0% 2,055 0.8% 8,780 3.4%
Gas Avai lable 140,021 134,879 96.3% 103 0.1% 2,132 1.5% 2,908 2.1%
No Gas Ava i lable 83,030 81,437 98.1% 112 0.1% 701 0.8% 781 0.9%
DWELLING TYPE
Single Detached 373,568 357,895 95.8% 214 0.1% 4,289 1.1% 11,170 3.0%
Multi Attached 46,834 44,937 95.9% 0 0.0% 598 1.3% 1,299 2.8%
Apartment Sui te 64,409 64,409 100.0% 0 0.0% 0 0.0% 0 0.0%
BUILDING CODE ERA
2010‐2017 37,645 37,089 98.5% 0 0.0% 134 0.4% 422 1.1%
1990‐2009 89,181 86,269 96.7% 103 0.1% 1,065 1.2% 1,745 2.0%
1970‐1989 161,749 153,404 94.8% 112 0.1% 1,864 1.2% 6,369 3.9%
1950‐1969 110,314 106,648 96.7% 0 0.0% 607 0.6% 3,059 2.8%
Pre 1950 85,922 83,831 97.6% 0 0.0% 1,217 1.4% 874 1.0%
SPACE HEAT FUEL
Electric Heat 191,639 186,712 97.4% 112 0.1% 1,784 0.9% 3,031 1.6%
Natura l Gas Heat 249,938 237,739 95.1% 103 0.0% 2,659 1.1% 9,438 3.8%
Other Fuel 6,945 6,945 100.0% 0 0.0% 0 0.0% 0 0.0%
Shared (No Heat on Bi l l ) 36,289 35,845 98.8% 0 0.0% 444 1.2% 0 0.0%
PEOPLE PER HOUSEHOLD
One 124,779 122,240 98.0% 0 0.0% 930 0.7% 1,609 1.3%
Two 221,729 215,105 97.0% 214 0.1% 1,429 0.6% 4,981 2.2%
Three 60,069 56,391 93.9% 0 0.0% 1,062 1.8% 2,616 4.4%
Four 48,897 46,202 94.5% 0 0.0% 947 1.9% 1,747 3.6%
Five + 29,337 27,302 93.1% 0 0.0% 518 1.8% 1,516 5.2%
HOUSEHOLD INCOME
Less Than $25,000 59,481 58,955 99.1% 0 0.0% 154 0.3% 371 0.6%
$25,000 ‐ $49,999 137,082 134,801 98.3% 0 0.0% 578 0.4% 1,703 1.2%
$50,000 ‐ $74,999 123,824 119,609 96.6% 0 0.0% 951 0.8% 3,264 2.6%
$75,000 ‐ $99,999 66,780 63,138 94.5% 112 0.2% 1,387 2.1% 2,143 3.2%
$100,000 + 97,644 90,738 92.9% 103 0.1% 1,817 1.9% 4,987 5.1%
WINNIPEG LICO‐125 CLASS
Yes 158,987 156,206 98.3% 0 0.0% 730 0.5% 2,050 1.3%
No 325,824 311,035 95.5% 214 0.1% 4,157 1.3% 10,419 3.2%
INDIGENOUS SELF‐DECLARED ANCESTRY
Yes 51,429 49,748 96.7% 0 0.0% 348 0.7% 1,333 2.6%
No 409,630 394,632 96.3% 214 0.1% 4,313 1.1% 10,471 2.6%
Undeclared 23,751 22,861 96.3% 0 0.0% 226 1.0% 664 2.8%
FIRST NATION ON RESERVE
FIRST NATION ON RESERVE 15,456 15,425 99.8% 0 0.0% 31 0.2% 0 0.0%
BILL PAYMENT RATING
Excel lent 439,339 423,760 96.5% 214 0.0% 3,777 0.9% 11,588 2.6%
Satis factory 22,395 21,209 94.7% 0 0.0% 979 4.4% 208 0.9%
Poor 23,077 22,272 96.5% 0 0.0% 131 0.6% 673 2.9%
DWELLING OWNERSHIP
Own 404,316 387,402 95.8% 214 0.1% 4,856 1.2% 11,844 2.9%
Rent / Other 80,495 79,839 99.2% 0 0.0% 31 0.0% 625 0.8%
2017 RESIDENTIAL SURVEY SECTION 7 ‐ POOLS AND VEHICLES ‐ REFERENCE TABLE 7.01a
POOL TYPE
Centra Gas Manitoba Inc. 2019/20 General Rate Application Appendix 7.7
March 22, 2019 Page 110 of 228

103
7.01b Pool Fuel
TOTAL
NOT
HEATED % ELECTRIC %
NATURAL
GAS % PROPANE % SOLAR % NO POOL %
OVERALL 484,811 438 0.1% 5,517 1.1% 6,866 1.4% 1,496 0.3% 3,254 0.7% 467,241 96.4%
FUEL AREA
Winnipeg Ci ty 261,760 438 0.2% 2,454 0.9% 5,738 2.2% 1,057 0.4% 1,148 0.4% 250,925 95.9%
Gas Avai lable 140,021 0 0.0% 2,281 1.6% 1,128 0.8% 408 0.3% 1,325 0.9% 134,879 96.3%
No Gas Avai lable 83,030 0 0.0% 781 0.9% 0 0.0% 31 0.0% 781 0.9% 81,437 98.1%
DWELLING TYPE
Single Detached 373,568 178 0.0% 4,583 1.2% 6,866 1.8% 898 0.2% 3,148 0.8% 357,895 95.8%
Multi Attached 46,834 260 0.6% 934 2.0% 0 0.0% 598 1.3% 105 0.2% 44,937 95.9%
Apartment Suite 64,409 0 0.0% 0 0.0% 0 0.0% 0 0.0% 0 0.0% 64,409 100.0%
BUILDING CODE ERA
2010‐2017 37,645 0 0.0% 103 0.3% 115 0.3% 31 0.1% 308 0.8% 37,089 98.5%
1990‐2009 89,181 0 0.0% 1,366 1.5% 791 0.9% 217 0.2% 538 0.6% 86,269 96.7%
1970‐1989 161,749 260 0.2% 2,590 1.6% 3,677 2.3% 704 0.4% 1,115 0.7% 153,404 94.8%
1950‐1969 110,314 178 0.2% 685 0.6% 1,939 1.8% 100 0.1% 764 0.7% 106,648 96.7%
Pre 1950 85,922 0 0.0% 774 0.9% 344 0.4% 444 0.5% 530 0.6% 83,831 97.6%
SPACE HEAT FUEL
Electric Heat 191,639 438 0.2% 3,074 1.6% 0 0.0% 131 0.1% 1,283 0.7% 186,712 97.4%
Natural Gas Heat 249,938 0 0.0% 2,442 1.0% 6,866 2.7% 921 0.4% 1,971 0.8% 237,739 95.1%
Other Fuel 6,945 0 0.0% 0 0.0% 0 0.0% 0 0.0% 0 0.0% 6,945 100.0%
Shared (No Heat on Bi l l ) 36,289 0 0.0% 0 0.0% 0 0.0% 444 1.2% 0 0.0% 35,845 98.8%
PEOPLE PER HOUSEHOLD
One 124,779 178 0.1% 975 0.8% 562 0.5% 713 0.6% 112 0.1% 122,240 98.0%
Two 221,729 0 0.0% 1,924 0.9% 3,152 1.4% 248 0.1% 1,300 0.6% 215,105 97.0%
Three 60,069 260 0.4% 1,062 1.8% 1,480 2.5% 115 0.2% 761 1.3% 56,391 93.9%
Four 48,897 0 0.0% 1,062 2.2% 881 1.8% 217 0.4% 534 1.1% 46,202 94.5%
Five + 29,337 0 0.0% 493 1.7% 791 2.7% 203 0.7% 547 1.9% 27,302 93.1%
HOUSEHOLD INCOME
Less Than $25,000 59,481 0 0.0% 260 0.4% 0 0.0% 154 0.3% 112 0.2% 58,955 99.1%
$25,000 ‐ $49,999 137,082 260 0.2% 432 0.3% 791 0.6% 146 0.1% 652 0.5% 134,801 98.3%
$50,000 ‐ $74,999 123,824 178 0.1% 1,772 1.4% 1,480 1.2% 115 0.1% 670 0.5% 119,609 96.6%
$75,000 ‐ $99,999 66,780 0 0.0% 1,478 2.2% 1,213 1.8% 205 0.3% 745 1.1% 63,138 94.5%
$100,000 + 97,644 0 0.0% 1,574 1.6% 3,382 3.5% 876 0.9% 1,075 1.1% 90,738 92.9%
WINNIPEG LICO‐125 CLASS
Yes 158,987 260 0.2% 868 0.5% 689 0.4% 300 0.2% 664 0.4% 156,206 98.3%
No 325,824 178 0.1% 4,648 1.4% 6,177 1.9% 1,196 0.4% 2,590 0.8% 311,035 95.5%
INDIGENOUS SELF‐DECLARED ANCESTRY
Yes 51,429 0 0.0% 1,014 2.0% 332 0.6% 31 0.1% 303 0.6% 49,748 96.7%
No 409,630 438 0.1% 4,276 1.0% 6,087 1.5% 1,465 0.4% 2,733 0.7% 394,632 96.3%
Undeclared 23,751 0 0.0% 226 1.0% 447 1.9% 0 0.0% 217 0.9% 22,861 96.3%
FIRST NATION ON RESERVE
FIRST NATION ON RESERVE 15,456 0 0.0% 0 0.0% 0 0.0% 31 0.2% 0 0.0% 15,425 99.8%
BILL PAYMENT RATING
Excel lent 439,339 438 0.1% 5,098 1.2% 6,419 1.5% 804 0.2% 2,819 0.6% 423,760 96.5%
Satis factory 22,395 0 0.0% 318 1.4% 103 0.5% 661 3.0% 105 0.5% 21,209 94.7%
Poor 23,077 0 0.0% 100 0.4% 344 1.5% 31 0.1% 329 1.4% 22,272 96.5%
DWELLING OWNERSHIP
Own 404,316 178 0.0% 5,257 1.3% 6,866 1.7% 1,465 0.4% 3,148 0.8% 387,402 95.8%
Rent / Other 80,495 260 0.3% 260 0.3% 0 0.0% 31 0.0% 105 0.1% 79,839 99.2%
2017 RESIDENTIAL SURVEY SECTION 7 ‐ POOLS AND VEHICLES ‐ REFERENCE TABLE 7.01b
POOL FUEL
Centra Gas Manitoba Inc. 2019/20 General Rate Application Appendix 7.7
March 22, 2019 Page 111 of 228
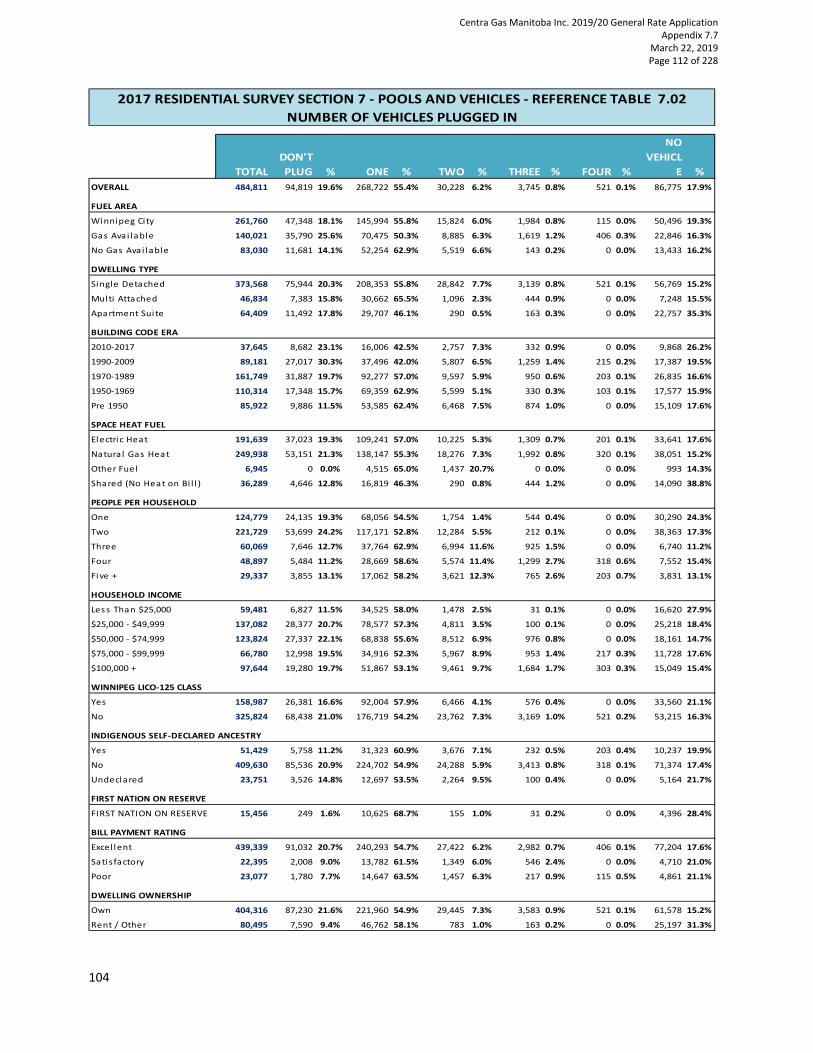
104
7.02 Number of Vehicles Plugged In
TOTAL
DON'T
PLUG % ONE % TWO % THREE % FOUR %
NO
VEHICL
E %
OVERALL 484,811 94,819 19.6% 268,722 55.4% 30,228 6.2% 3,745 0.8% 521 0.1% 86,775 17.9%
FUEL AREA
Winnipeg City 261,760 47,348 18.1% 145,994 55.8% 15,824 6.0% 1,984 0.8% 115 0.0% 50,496 19.3%
Gas Avai lable 140,021 35,790 25.6% 70,475 50.3% 8,885 6.3% 1,619 1.2% 406 0.3% 22,846 16.3%
No Gas Avai lable 83,030 11,681 14.1% 52,254 62.9% 5,519 6.6% 143 0.2% 0 0.0% 13,433 16.2%
DWELLING TYPE
Single Detached 373,568 75,944 20.3% 208,353 55.8% 28,842 7.7% 3,139 0.8% 521 0.1% 56,769 15.2%
Multi Attached 46,834 7,383 15.8% 30,662 65.5% 1,096 2.3% 444 0.9% 0 0.0% 7,248 15.5%
Apartment Sui te 64,409 11,492 17.8% 29,707 46.1% 290 0.5% 163 0.3% 0 0.0% 22,757 35.3%
BUILDING CODE ERA
2010‐2017 37,645 8,682 23.1% 16,006 42.5% 2,757 7.3% 332 0.9% 0 0.0% 9,868 26.2%
1990‐2009 89,181 27,017 30.3% 37,496 42.0% 5,807 6.5% 1,259 1.4% 215 0.2% 17,387 19.5%
1970‐1989 161,749 31,887 19.7% 92,277 57.0% 9,597 5.9% 950 0.6% 203 0.1% 26,835 16.6%
1950‐1969 110,314 17,348 15.7% 69,359 62.9% 5,599 5.1% 330 0.3% 103 0.1% 17,577 15.9%
Pre 1950 85,922 9,886 11.5% 53,585 62.4% 6,468 7.5% 874 1.0% 0 0.0% 15,109 17.6%
SPACE HEAT FUEL
Electric Heat 191,639 37,023 19.3% 109,241 57.0% 10,225 5.3% 1,309 0.7% 201 0.1% 33,641 17.6%
Natura l Gas Heat 249,938 53,151 21.3% 138,147 55.3% 18,276 7.3% 1,992 0.8% 320 0.1% 38,051 15.2%
Other Fuel 6,945 0 0.0% 4,515 65.0% 1,437 20.7% 0 0.0% 0 0.0% 993 14.3%
Shared (No Heat on Bi l l ) 36,289 4,646 12.8% 16,819 46.3% 290 0.8% 444 1.2% 0 0.0% 14,090 38.8%
PEOPLE PER HOUSEHOLD
One 124,779 24,135 19.3% 68,056 54.5% 1,754 1.4% 544 0.4% 0 0.0% 30,290 24.3%
Two 221,729 53,699 24.2% 117,171 52.8% 12,284 5.5% 212 0.1% 0 0.0% 38,363 17.3%
Three 60,069 7,646 12.7% 37,764 62.9% 6,994 11.6% 925 1.5% 0 0.0% 6,740 11.2%
Four 48,897 5,484 11.2% 28,669 58.6% 5,574 11.4% 1,299 2.7% 318 0.6% 7,552 15.4%
Five + 29,337 3,855 13.1% 17,062 58.2% 3,621 12.3% 765 2.6% 203 0.7% 3,831 13.1%
HOUSEHOLD INCOME
Less Than $25,000 59,481 6,827 11.5% 34,525 58.0% 1,478 2.5% 31 0.1% 0 0.0% 16,620 27.9%
$25,000 ‐ $49,999 137,082 28,377 20.7% 78,577 57.3% 4,811 3.5% 100 0.1% 0 0.0% 25,218 18.4%
$50,000 ‐ $74,999 123,824 27,337 22.1% 68,838 55.6% 8,512 6.9% 976 0.8% 0 0.0% 18,161 14.7%
$75,000 ‐ $99,999 66,780 12,998 19.5% 34,916 52.3% 5,967 8.9% 953 1.4% 217 0.3% 11,728 17.6%
$100,000 + 97,644 19,280 19.7% 51,867 53.1% 9,461 9.7% 1,684 1.7% 303 0.3% 15,049 15.4%
WINNIPEG LICO‐125 CLASS
Yes 158,987 26,381 16.6% 92,004 57.9% 6,466 4.1% 576 0.4% 0 0.0% 33,560 21.1%
No 325,824 68,438 21.0% 176,719 54.2% 23,762 7.3% 3,169 1.0% 521 0.2% 53,215 16.3%
INDIGENOUS SELF‐DECLARED ANCESTRY
Yes 51,429 5,758 11.2% 31,323 60.9% 3,676 7.1% 232 0.5% 203 0.4% 10,237 19.9%
No 409,630 85,536 20.9% 224,702 54.9% 24,288 5.9% 3,413 0.8% 318 0.1% 71,374 17.4%
Undeclared 23,751 3,526 14.8% 12,697 53.5% 2,264 9.5% 100 0.4% 0 0.0% 5,164 21.7%
FIRST NATION ON RESERVE
FIRST NATION ON RESERVE 15,456 249 1.6% 10,625 68.7% 155 1.0% 31 0.2% 0 0.0% 4,396 28.4%
BILL PAYMENT RATING
Excel lent 439,339 91,032 20.7% 240,293 54.7% 27,422 6.2% 2,982 0.7% 406 0.1% 77,204 17.6%
Sati s factory 22,395 2,008 9.0% 13,782 61.5% 1,349 6.0% 546 2.4% 0 0.0% 4,710 21.0%
Poor 23,077 1,780 7.7% 14,647 63.5% 1,457 6.3% 217 0.9% 115 0.5% 4,861 21.1%
DWELLING OWNERSHIP
Own 404,316 87,230 21.6% 221,960 54.9% 29,445 7.3% 3,583 0.9% 521 0.1% 61,578 15.2%
Rent / Other 80,495 7,590 9.4% 46,762 58.1% 783 1.0% 163 0.2% 0 0.0% 25,197 31.3%
2017 RESIDENTIAL SURVEY SECTION 7 ‐ POOLS AND VEHICLES ‐ REFERENCE TABLE 7.02
NUMBER OF VEHICLES PLUGGED IN
Centra Gas Manitoba Inc. 2019/20 General Rate Application Appendix 7.7
March 22, 2019 Page 112 of 228

105
7.03a Parking Location
TOTAL
DETACHED
GARAGE %
ATTACHED
GARAGE %
CARPORT
/SHELTER %
UNDERGROUND
PARKADE % OUTSIDE %
NO
VEHICLE %
OVERALL 484,811 100,209 20.7% 105,649 21.8% 11,518 2.4% 11,600 2.4% 169,059 34.9% 86,775 17.9%
FUEL AREA
Winnipeg Ci ty 261,760 60,256 23.0% 47,307 18.1% 6,828 2.6% 10,582 4.0% 86,292 33.0% 50,496 19.3%
Gas Avai lable 140,021 24,157 17.3% 45,530 32.5% 2,477 1.8% 1,018 0.7% 43,993 31.4% 22,846 16.3%
No Gas Ava i lable 83,030 15,797 19.0% 12,812 15.4% 2,213 2.7% 0 0.0% 38,774 46.7% 13,433 16.2%
DWELLING TYPE
Single Detached 373,568 94,702 25.4% 96,174 25.7% 9,321 2.5% 84 0.0% 116,517 31.2% 56,769 15.2%
Multi Attached 46,834 4,619 9.9% 8,277 17.7% 602 1.3% 461 1.0% 25,628 54.7% 7,248 15.5%
Apartment Sui te 64,409 888 1.4% 1,198 1.9% 1,596 2.5% 11,056 17.2% 26,913 41.8% 22,757 35.3%
BUILDING CODE ERA
2010‐2017 37,645 1,914 5.1% 13,424 35.7% 809 2.1% 1,667 4.4% 9,964 26.5% 9,868 26.2%
1990‐2009 89,181 9,048 10.1% 36,291 40.7% 406 0.5% 3,417 3.8% 22,633 25.4% 17,387 19.5%
1970‐1989 161,749 28,704 17.7% 38,063 23.5% 3,058 1.9% 4,189 2.6% 60,901 37.7% 26,835 16.6%
1950‐1969 110,314 33,863 30.7% 11,972 10.9% 3,992 3.6% 2,038 1.8% 40,872 37.1% 17,577 15.9%
Pre 1950 85,922 26,681 31.1% 5,898 6.9% 3,254 3.8% 290 0.3% 34,689 40.4% 15,109 17.6%
SPACE HEAT FUEL
Electric Heat 191,639 31,973 16.7% 36,531 19.1% 5,398 2.8% 5,971 3.1% 78,125 40.8% 33,641 17.6%
Natura l Gas Heat 249,938 65,570 26.2% 68,194 27.3% 4,850 1.9% 1,134 0.5% 72,140 28.9% 38,051 15.2%
Other Fuel 6,945 1,789 25.8% 337 4.9% 690 9.9% 0 0.0% 3,136 45.2% 993 14.3%
Shared (No Heat on Bi l l ) 36,289 877 2.4% 587 1.6% 580 1.6% 4,495 12.4% 15,659 43.2% 14,090 38.8%
PEOPLE PER HOUSEHOLD
One 124,779 28,382 22.7% 14,776 11.8% 3,414 2.7% 6,077 4.9% 41,841 33.5% 30,290 24.3%
Two 221,729 45,750 20.6% 54,660 24.7% 4,993 2.3% 5,207 2.3% 72,757 32.8% 38,363 17.3%
Three 60,069 11,746 19.6% 15,200 25.3% 1,693 2.8% 317 0.5% 24,375 40.6% 6,740 11.2%
Four 48,897 10,464 21.4% 12,524 25.6% 828 1.7% 0 0.0% 17,529 35.8% 7,552 15.4%
Five + 29,337 3,868 13.2% 8,490 28.9% 589 2.0% 0 0.0% 12,558 42.8% 3,831 13.1%
HOUSEHOLD INCOME
Less Than $25,000 59,481 10,853 18.2% 4,898 8.2% 1,592 2.7% 941 1.6% 24,577 41.3% 16,620 27.9%
$25,000 ‐ $49,999 137,082 31,276 22.8% 21,544 15.7% 4,306 3.1% 4,720 3.4% 50,018 36.5% 25,218 18.4%
$50,000 ‐ $74,999 123,824 27,821 22.5% 28,342 22.9% 2,636 2.1% 4,265 3.4% 42,600 34.4% 18,161 14.7%
$75,000 ‐ $99,999 66,780 12,090 18.1% 19,198 28.7% 1,435 2.1% 611 0.9% 21,717 32.5% 11,728 17.6%
$100,000 + 97,644 18,168 18.6% 31,668 32.4% 1,550 1.6% 1,062 1.1% 30,148 30.9% 15,049 15.4%
WINNIPEG LICO‐125 CLASS
Yes 158,987 34,037 21.4% 22,473 14.1% 4,363 2.7% 3,832 2.4% 60,721 38.2% 33,560 21.1%
No 325,824 66,173 20.3% 83,176 25.5% 7,155 2.2% 7,769 2.4% 108,338 33.3% 53,215 16.3%
INDIGENOUS SELF‐DECLARED ANCESTRY
Yes 51,429 7,869 15.3% 7,415 14.4% 486 0.9% 84 0.2% 25,339 49.3% 10,237 19.9%
No 409,630 86,270 21.1% 93,958 22.9% 10,175 2.5% 11,191 2.7% 136,662 33.4% 71,374 17.4%
Undeclared 23,751 6,070 25.6% 4,276 18.0% 858 3.6% 326 1.4% 7,059 29.7% 5,164 21.7%
FIRST NATION ON RESERVE
FIRST NATION ON RESERVE 15,456 466 3.0% 529 3.4% 93 0.6% 0 0.0% 9,972 64.5% 4,396 28.4%
BILL PAYMENT RATING
Excel lent 439,339 93,043 21.2% 101,024 23.0% 10,690 2.4% 10,483 2.4% 146,896 33.4% 77,204 17.6%
Sati s factory 22,395 4,476 20.0% 2,831 12.6% 230 1.0% 247 1.1% 9,902 44.2% 4,710 21.0%
Poor 23,077 2,691 11.7% 1,795 7.8% 599 2.6% 870 3.8% 12,261 53.1% 4,861 21.1%
DWELLING OWNERSHIP
Own 404,316 96,629 23.9% 102,986 25.5% 10,142 2.5% 5,941 1.5% 127,040 31.4% 61,578 15.2%
Rent / Other 80,495 3,581 4.4% 2,663 3.3% 1,375 1.7% 5,659 7.0% 42,019 52.2% 25,197 31.3%
2017 RESIDENTIAL SURVEY SECTION 7 ‐ POOLS AND VEHICLES ‐ REFERENCE TABLE 7.03a
PARKING LOCATION
Centra Gas Manitoba Inc. 2019/20 General Rate Application Appendix 7.7
March 22, 2019 Page 113 of 228

106
7.03b Car Timer for Block Heater
TOTAL
DON'T
PLUG % YES % NO % NO VEHICLE %
OVERALL 484,811 94,819 19.6% 76,004 15.7% 227,213 46.9% 86,775 17.9%
FUEL AREA
Winnipeg City 261,760 47,348 18.1% 45,160 17.3% 118,755 45.4% 50,496 19.3%
Gas Avai lable 140,021 35,790 25.6% 19,118 13.7% 62,267 44.5% 22,846 16.3%
No Gas Avai lable 83,030 11,681 14.1% 11,726 14.1% 46,190 55.6% 13,433 16.2%
DWELLING TYPE
Single Detached 373,568 75,944 20.3% 62,037 16.6% 178,817 47.9% 56,769 15.2%
Multi Attached 46,834 7,383 15.8% 6,469 13.8% 25,734 54.9% 7,248 15.5%
Apartment Sui te 64,409 11,492 17.8% 7,498 11.6% 22,662 35.2% 22,757 35.3%
BUILDING CODE ERA
2010‐2017 37,645 8,682 23.1% 4,653 12.4% 14,442 38.4% 9,868 26.2%
1990‐2009 89,181 27,017 30.3% 10,260 11.5% 34,517 38.7% 17,387 19.5%
1970‐1989 161,749 31,887 19.7% 24,866 15.4% 78,161 48.3% 26,835 16.6%
1950‐1969 110,314 17,348 15.7% 22,813 20.7% 52,577 47.7% 17,577 15.9%
Pre 1950 85,922 9,886 11.5% 13,412 15.6% 47,515 55.3% 15,109 17.6%
SPACE HEAT FUEL
Electri c Heat 191,639 37,023 19.3% 26,226 13.7% 94,749 49.4% 33,641 17.6%
Natura l Gas Heat 249,938 53,151 21.3% 44,139 17.7% 114,596 45.8% 38,051 15.2%
Other Fuel 6,945 0 0.0% 1,848 26.6% 4,104 59.1% 993 14.3%
Shared (No Heat on Bi l l ) 36,289 4,646 12.8% 3,790 10.4% 13,763 37.9% 14,090 38.8%
PEOPLE PER HOUSEHOLD
One 124,779 24,135 19.3% 19,343 15.5% 51,012 40.9% 30,290 24.3%
Two 221,729 53,699 24.2% 33,732 15.2% 95,935 43.3% 38,363 17.3%
Three 60,069 7,646 12.7% 10,623 17.7% 35,061 58.4% 6,740 11.2%
Four 48,897 5,484 11.2% 8,400 17.2% 27,461 56.2% 7,552 15.4%
Five + 29,337 3,855 13.1% 3,906 13.3% 17,745 60.5% 3,831 13.1%
HOUSEHOLD INCOME
Less Than $25,000 59,481 6,827 11.5% 9,471 15.9% 26,563 44.7% 16,620 27.9%
$25,000 ‐ $49,999 137,082 28,377 20.7% 22,421 16.4% 61,067 44.5% 25,218 18.4%
$50,000 ‐ $74,999 123,824 27,337 22.1% 20,883 16.9% 57,443 46.4% 18,161 14.7%
$75,000 ‐ $99,999 66,780 12,998 19.5% 9,336 14.0% 32,717 49.0% 11,728 17.6%
$100,000 + 97,644 19,280 19.7% 13,894 14.2% 49,422 50.6% 15,049 15.4%
WINNIPEG LICO‐125 CLASS
Yes 158,987 26,381 16.6% 25,716 16.2% 73,329 46.1% 33,560 21.1%
No 325,824 68,438 21.0% 50,287 15.4% 153,884 47.2% 53,215 16.3%
INDIGENOUS SELF‐DECLARED ANCESTRY
Yes 51,429 5,758 11.2% 5,563 10.8% 29,871 58.1% 10,237 19.9%
No 409,630 85,536 20.9% 67,702 16.5% 185,018 45.2% 71,374 17.4%
Undeclared 23,751 3,526 14.8% 2,738 11.5% 12,323 51.9% 5,164 21.7%
FIRST NATION ON RESERVE
FIRST NATION ON RESERVE 15,456 249 1.6% 1,442 9.3% 9,370 60.6% 4,396 28.4%
BILL PAYMENT RATING
Excel lent 439,339 91,032 20.7% 71,120 16.2% 199,983 45.5% 77,204 17.6%
Sati s factory 22,395 2,008 9.0% 2,751 12.3% 12,927 57.7% 4,710 21.0%
Poor 23,077 1,780 7.7% 2,133 9.2% 14,303 62.0% 4,861 21.1%
DWELLING OWNERSHIP
Own 404,316 87,230 21.6% 67,968 16.8% 187,540 46.4% 61,578 15.2%
Rent / Other 80,495 7,590 9.4% 8,036 10.0% 39,673 49.3% 25,197 31.3%
2017 RESIDENTIAL SURVEY SECTION 7 ‐ POOLS AND VEHICLES ‐ REFERENCE TABLE 7.03b
CAR TIMER FOR BLOCKHEATER
Centra Gas Manitoba Inc. 2019/20 General Rate Application Appendix 7.7
March 22, 2019 Page 114 of 228

107
7.03c Interior Car Warmer
TOTAL
DON'T
PLUG % YES % NO % NO VEHICLE %
OVERALL 484,811 94,819 19.6% 16,662 3.4% 286,555 59.1% 86,775 17.9%
FUEL AREA
Winnipeg City 261,760 47,348 18.1% 11,136 4.3% 152,779 58.4% 50,496 19.3%
Gas Avai lable 140,021 35,790 25.6% 3,601 2.6% 77,783 55.6% 22,846 16.3%
No Gas Avai lable 83,030 11,681 14.1% 1,924 2.3% 55,992 67.4% 13,433 16.2%
DWELLING TYPE
Single Detached 373,568 75,944 20.3% 11,923 3.2% 228,931 61.3% 56,769 15.2%
Multi Attached 46,834 7,383 15.8% 2,110 4.5% 30,092 64.3% 7,248 15.5%
Apartment Sui te 64,409 11,492 17.8% 2,629 4.1% 27,531 42.7% 22,757 35.3%
BUILDING CODE ERA
2010‐2017 37,645 8,682 23.1% 1,392 3.7% 17,704 47.0% 9,868 26.2%
1990‐2009 89,181 27,017 30.3% 3,029 3.4% 41,748 46.8% 17,387 19.5%
1970‐1989 161,749 31,887 19.7% 5,921 3.7% 97,105 60.0% 26,835 16.6%
1950‐1969 110,314 17,348 15.7% 3,618 3.3% 71,772 65.1% 17,577 15.9%
Pre 1950 85,922 9,886 11.5% 2,701 3.1% 58,226 67.8% 15,109 17.6%
SPACE HEAT FUEL
Electric Heat 191,639 37,023 19.3% 5,200 2.7% 115,776 60.4% 33,641 17.6%
Natura l Gas Heat 249,938 53,151 21.3% 9,587 3.8% 149,149 59.7% 38,051 15.2%
Other Fuel 6,945 0 0.0% 425 6.1% 5,527 79.6% 993 14.3%
Shared (No Heat on Bi l l ) 36,289 4,646 12.8% 1,451 4.0% 16,103 44.4% 14,090 38.8%
PEOPLE PER HOUSEHOLD
One 124,779 24,135 19.3% 4,163 3.3% 66,192 53.0% 30,290 24.3%
Two 221,729 53,699 24.2% 6,643 3.0% 123,024 55.5% 38,363 17.3%
Three 60,069 7,646 12.7% 2,152 3.6% 43,531 72.5% 6,740 11.2%
Four 48,897 5,484 11.2% 2,750 5.6% 33,111 67.7% 7,552 15.4%
Five + 29,337 3,855 13.1% 954 3.3% 20,697 70.5% 3,831 13.1%
HOUSEHOLD INCOME
Less Than $25,000 59,481 6,827 11.5% 1,522 2.6% 34,512 58.0% 16,620 27.9%
$25,000 ‐ $49,999 137,082 28,377 20.7% 4,814 3.5% 78,673 57.4% 25,218 18.4%
$50,000 ‐ $74,999 123,824 27,337 22.1% 4,858 3.9% 73,469 59.3% 18,161 14.7%
$75,000 ‐ $99,999 66,780 12,998 19.5% 1,842 2.8% 40,211 60.2% 11,728 17.6%
$100,000 + 97,644 19,280 19.7% 3,625 3.7% 59,690 61.1% 15,049 15.4%
WINNIPEG LICO‐125 CLASS
Yes 158,987 26,381 16.6% 5,017 3.2% 94,029 59.1% 33,560 21.1%
No 325,824 68,438 21.0% 11,645 3.6% 192,526 59.1% 53,215 16.3%
INDIGENOUS SELF‐DECLARED ANCESTRY
Yes 51,429 5,758 11.2% 1,034 2.0% 34,401 66.9% 10,237 19.9%
No 409,630 85,536 20.9% 14,954 3.7% 237,767 58.0% 71,374 17.4%
Undeclared 23,751 3,526 14.8% 674 2.8% 14,388 60.6% 5,164 21.7%
FIRST NATION ON RESERVE
FIRST NATION ON RESERVE 15,456 249 1.6% 653 4.2% 10,159 65.7% 4,396 28.4%
BILL PAYMENT RATING
Excel lent 439,339 91,032 20.7% 15,114 3.4% 255,989 58.3% 77,204 17.6%
Sati s factory 22,395 2,008 9.0% 863 3.9% 14,814 66.1% 4,710 21.0%
Poor 23,077 1,780 7.7% 685 3.0% 15,751 68.3% 4,861 21.1%
DWELLING OWNERSHIP
Own 404,316 87,230 21.6% 13,566 3.4% 241,942 59.8% 61,578 15.2%
Rent / Other 80,495 7,590 9.4% 3,096 3.8% 44,612 55.4% 25,197 31.3%
2017 RESIDENTIAL SURVEY SECTION 7 ‐ POOLS AND VEHICLES ‐ REFERENCE TABLE 7.03c
INTERIOR CAR WARMER
Centra Gas Manitoba Inc. 2019/20 General Rate Application Appendix 7.7
March 22, 2019 Page 115 of 228

108
Centra Gas Manitoba Inc. 2019/20 General Rate Application Appendix 7.7
March 22, 2019 Page 116 of 228

109
SECTION 8 DEMAND SIDE MANAGEMENT (DSM) PROGRAMS
SECTION 8 DEMAND SIDE
MANAGEMENT (DSM)
PROGRAMS
Centra Gas Manitoba Inc. 2019/20 General Rate Application Appendix 7.7
March 22, 2019 Page 117 of 228

110
8.01a Participation in Affordable Energy Program
TOTAL YES % NO %
OVERALL 484,811 22,400 4.6% 462,411 95.4%
FUEL AREA
Winnipeg City 261,760 15,812 6.0% 245,948 94.0%
Gas Ava i lable 140,021 4,011 2.9% 136,010 97.1%
No Gas Ava i lable 83,030 2,577 3.1% 80,453 96.9%
DWELLING TYPE
Single Detached 373,568 17,405 4.7% 356,163 95.3%
Multi Attached 46,834 2,727 5.8% 44,107 94.2%
Apartment Sui te 64,409 2,268 3.5% 62,141 96.5%
BUILDING CODE ERA
2010‐2017 37,645 810 2.2% 36,835 97.8%
1990‐2009 89,181 2,197 2.5% 86,984 97.5%
1970‐1989 161,749 8,004 4.9% 153,744 95.1%
1950‐1969 110,314 5,616 5.1% 104,699 94.9%
Pre 1950 85,922 5,772 6.7% 80,150 93.3%
SPACE HEAT FUEL
Electric Heat 191,639 5,803 3.0% 185,836 97.0%
Natura l Gas Heat 249,938 14,281 5.7% 235,657 94.3%
Other Fuel 6,945 131 1.9% 6,814 98.1%
Shared (No Heat on Bi l l ) 36,289 2,184 6.0% 34,105 94.0%
PEOPLE PER HOUSEHOLD
One 124,779 7,108 5.7% 117,671 94.3%
Two 221,729 7,917 3.6% 213,812 96.4%
Three 60,069 3,133 5.2% 56,937 94.8%
Four 48,897 2,559 5.2% 46,338 94.8%
Five + 29,337 1,683 5.7% 27,654 94.3%
HOUSEHOLD INCOME
Less Than $25,000 59,481 4,533 7.6% 54,948 92.4%
$25,000 ‐ $49,999 137,082 8,038 5.9% 129,045 94.1%
$50,000 ‐ $74,999 123,824 4,836 3.9% 118,988 96.1%
$75,000 ‐ $99,999 66,780 1,403 2.1% 65,377 97.9%
$100,000 + 97,644 3,590 3.7% 94,054 96.3%
WINNIPEG LICO‐125 CLASS
Yes 158,987 11,377 7.2% 147,609 92.8%
No 325,824 11,023 3.4% 314,802 96.6%
INDIGENOUS SELF‐DECLARED ANCESTRY
Yes 51,429 2,879 5.6% 48,551 94.4%
No 409,630 19,065 4.7% 390,565 95.3%
Undeclared 23,751 456 1.9% 23,295 98.1%
FIRST NATION ON RESERVE
FIRST NATION ON RESERVE 15,456 1,163 7.5% 14,293 92.5%
BILL PAYMENT RATING
Excel lent 439,339 20,076 4.6% 419,263 95.4%
Satis factory 22,395 1,138 5.1% 21,257 94.9%
Poor 23,077 1,186 5.1% 21,891 94.9%
DWELLING OWNERSHIP
Own 404,316 18,828 4.7% 385,488 95.3%
Rent / Other 80,495 3,572 4.4% 76,923 95.6%
2017 RESIDENTIAL SURVEY SECTION 8 ‐ DEMAND SIDE MANAGEMENT ‐ REFERENCE TABLE 8.01a
PARTICIPATION IN THE AFFORDABLE ENERGY PROGRAM
Centra Gas Manitoba Inc. 2019/20 General Rate Application Appendix 7.7
March 22, 2019 Page 118 of 228

111
8.01b Participation in Appliance Rebate Program
TOTAL YES % NO %
OVERALL 484,811 31,684 6.5% 453,127 93.5%
FUEL AREA
Winnipeg City 261,760 19,386 7.4% 242,374 92.6%
Gas Ava i lable 140,021 8,142 5.8% 131,879 94.2%
No Gas Ava i lable 83,030 4,156 5.0% 78,874 95.0%
DWELLING TYPE
Single Detached 373,568 29,365 7.9% 344,203 92.1%
Multi Attached 46,834 1,447 3.1% 45,387 96.9%
Apartment Sui te 64,409 873 1.4% 63,536 98.6%
BUILDING CODE ERA
2010‐2017 37,645 1,076 2.9% 36,569 97.1%
1990‐2009 89,181 5,210 5.8% 83,972 94.2%
1970‐1989 161,749 12,487 7.7% 149,262 92.3%
1950‐1969 110,314 7,755 7.0% 102,560 93.0%
Pre 1950 85,922 5,157 6.0% 80,764 94.0%
SPACE HEAT FUEL
Electric Heat 191,639 9,052 4.7% 182,587 95.3%
Natura l Gas Heat 249,938 21,934 8.8% 228,004 91.2%
Other Fuel 6,945 556 8.0% 6,389 92.0%
Shared (No Heat on Bi l l ) 36,289 143 0.4% 36,146 99.6%
PEOPLE PER HOUSEHOLD
One 124,779 5,736 4.6% 119,043 95.4%
Two 221,729 17,870 8.1% 203,859 91.9%
Three 60,069 3,702 6.2% 56,368 93.8%
Four 48,897 3,257 6.7% 45,640 93.3%
Five + 29,337 1,119 3.8% 28,217 96.2%
HOUSEHOLD INCOME
Less Than $25,000 59,481 2,837 4.8% 56,644 95.2%
$25,000 ‐ $49,999 137,082 6,722 4.9% 130,360 95.1%
$50,000 ‐ $74,999 123,824 8,821 7.1% 115,003 92.9%
$75,000 ‐ $99,999 66,780 5,114 7.7% 61,666 92.3%
$100,000 + 97,644 8,191 8.4% 89,453 91.6%
WINNIPEG LICO‐125 CLASS
Yes 158,987 8,133 5.1% 150,854 94.9%
No 325,824 23,552 7.2% 302,273 92.8%
INDIGENOUS SELF‐DECLARED ANCESTRY
Yes 51,429 2,728 5.3% 48,702 94.7%
No 409,630 27,559 6.7% 382,072 93.3%
Undeclared 23,751 1,398 5.9% 22,353 94.1%
FIRST NATION ON RESERVE
FIRST NATION ON RESERVE 15,456 691 4.5% 14,765 95.5%
BILL PAYMENT RATING
Excel lent 439,339 30,243 6.9% 409,096 93.1%
Satis factory 22,395 647 2.9% 21,748 97.1%
Poor 23,077 795 3.4% 22,282 96.6%
DWELLING OWNERSHIP
Own 404,316 30,174 7.5% 374,142 92.5%
Rent / Other 80,495 1,510 1.9% 78,985 98.1%
2017 RESIDENTIAL SURVEY SECTION 8 ‐ DEMAND SIDE MANAGEMENT ‐ REFERENCE TABLE 8.01b
PARTICIPATION IN THE APPLIANCE REBATE PROGRAM
Centra Gas Manitoba Inc. 2019/20 General Rate Application Appendix 7.7
March 22, 2019 Page 119 of 228
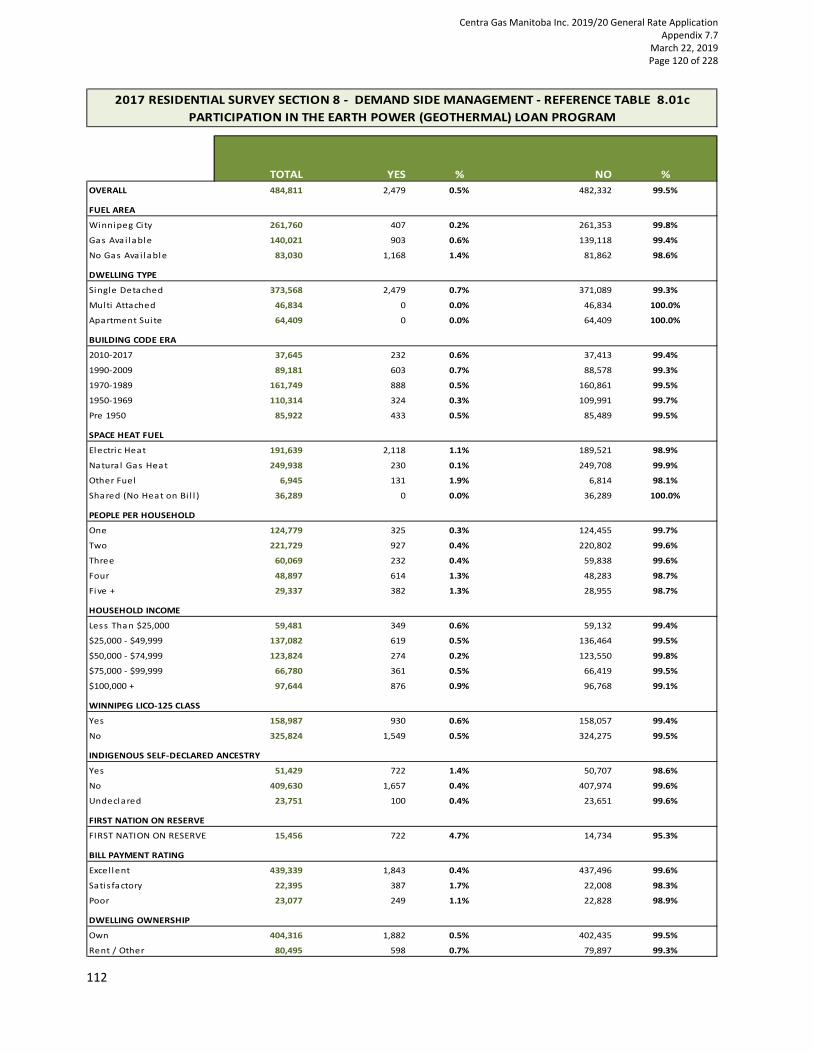
112
8.01c Participation in Earth Power (Geothermal) Loan Program
TOTAL YES % NO %
OVERALL 484,811 2,479 0.5% 482,332 99.5%
FUEL AREA
Winnipeg City 261,760 407 0.2% 261,353 99.8%
Gas Ava i lable 140,021 903 0.6% 139,118 99.4%
No Gas Ava i lable 83,030 1,168 1.4% 81,862 98.6%
DWELLING TYPE
Single Detached 373,568 2,479 0.7% 371,089 99.3%
Multi Attached 46,834 0 0.0% 46,834 100.0%
Apartment Sui te 64,409 0 0.0% 64,409 100.0%
BUILDING CODE ERA
2010‐2017 37,645 232 0.6% 37,413 99.4%
1990‐2009 89,181 603 0.7% 88,578 99.3%
1970‐1989 161,749 888 0.5% 160,861 99.5%
1950‐1969 110,314 324 0.3% 109,991 99.7%
Pre 1950 85,922 433 0.5% 85,489 99.5%
SPACE HEAT FUEL
Electric Heat 191,639 2,118 1.1% 189,521 98.9%
Natura l Gas Heat 249,938 230 0.1% 249,708 99.9%
Other Fuel 6,945 131 1.9% 6,814 98.1%
Shared (No Heat on Bi l l ) 36,289 0 0.0% 36,289 100.0%
PEOPLE PER HOUSEHOLD
One 124,779 325 0.3% 124,455 99.7%
Two 221,729 927 0.4% 220,802 99.6%
Three 60,069 232 0.4% 59,838 99.6%
Four 48,897 614 1.3% 48,283 98.7%
Five + 29,337 382 1.3% 28,955 98.7%
HOUSEHOLD INCOME
Less Than $25,000 59,481 349 0.6% 59,132 99.4%
$25,000 ‐ $49,999 137,082 619 0.5% 136,464 99.5%
$50,000 ‐ $74,999 123,824 274 0.2% 123,550 99.8%
$75,000 ‐ $99,999 66,780 361 0.5% 66,419 99.5%
$100,000 + 97,644 876 0.9% 96,768 99.1%
WINNIPEG LICO‐125 CLASS
Yes 158,987 930 0.6% 158,057 99.4%
No 325,824 1,549 0.5% 324,275 99.5%
INDIGENOUS SELF‐DECLARED ANCESTRY
Yes 51,429 722 1.4% 50,707 98.6%
No 409,630 1,657 0.4% 407,974 99.6%
Undeclared 23,751 100 0.4% 23,651 99.6%
FIRST NATION ON RESERVE
FIRST NATION ON RESERVE 15,456 722 4.7% 14,734 95.3%
BILL PAYMENT RATING
Excel lent 439,339 1,843 0.4% 437,496 99.6%
Satis factory 22,395 387 1.7% 22,008 98.3%
Poor 23,077 249 1.1% 22,828 98.9%
DWELLING OWNERSHIP
Own 404,316 1,882 0.5% 402,435 99.5%
Rent / Other 80,495 598 0.7% 79,897 99.3%
2017 RESIDENTIAL SURVEY SECTION 8 ‐ DEMAND SIDE MANAGEMENT ‐ REFERENCE TABLE 8.01c
PARTICIPATION IN THE EARTH POWER (GEOTHERMAL) LOAN PROGRAM
Centra Gas Manitoba Inc. 2019/20 General Rate Application Appendix 7.7
March 22, 2019 Page 120 of 228

113
8.01d Participation in Home Insulation Program
TOTAL YES % NO %
OVERALL 484,811 56,203 11.6% 428,608 88.4%
FUEL AREA
Winnipeg City 261,760 30,149 11.5% 231,611 88.5%
Gas Ava i lable 140,021 16,062 11.5% 123,959 88.5%
No Gas Ava i lable 83,030 9,992 12.0% 73,038 88.0%
DWELLING TYPE
Single Detached 373,568 50,879 13.6% 322,689 86.4%
Multi Attached 46,834 4,816 10.3% 42,018 89.7%
Apartment Sui te 64,409 508 0.8% 63,901 99.2%
BUILDING CODE ERA
2010‐2017 37,645 469 1.2% 37,176 98.8%
1990‐2009 89,181 3,821 4.3% 85,360 95.7%
1970‐1989 161,749 17,863 11.0% 143,886 89.0%
1950‐1969 110,314 16,900 15.3% 93,414 84.7%
Pre 1950 85,922 17,151 20.0% 68,771 80.0%
SPACE HEAT FUEL
Electric Heat 191,639 20,177 10.5% 171,462 89.5%
Natura l Gas Heat 249,938 33,658 13.5% 216,280 86.5%
Other Fuel 6,945 893 12.9% 6,052 87.1%
Shared (No Heat on Bi l l ) 36,289 1,475 4.1% 34,814 95.9%
PEOPLE PER HOUSEHOLD
One 124,779 11,374 9.1% 113,405 90.9%
Two 221,729 28,302 12.8% 193,427 87.2%
Three 60,069 6,826 11.4% 53,243 88.6%
Four 48,897 5,533 11.3% 43,364 88.7%
Five + 29,337 4,169 14.2% 25,168 85.8%
HOUSEHOLD INCOME
Less Than $25,000 59,481 4,029 6.8% 55,452 93.2%
$25,000 ‐ $49,999 137,082 17,399 12.7% 119,684 87.3%
$50,000 ‐ $74,999 123,824 15,244 12.3% 108,580 87.7%
$75,000 ‐ $99,999 66,780 6,449 9.7% 60,331 90.3%
$100,000 + 97,644 13,082 13.4% 84,562 86.6%
WINNIPEG LICO‐125 CLASS
Yes 158,987 17,804 11.2% 141,183 88.8%
No 325,824 38,399 11.8% 287,425 88.2%
INDIGENOUS SELF‐DECLARED ANCESTRY
Yes 51,429 4,989 9.7% 46,440 90.3%
No 409,630 49,184 12.0% 360,447 88.0%
Undeclared 23,751 2,030 8.5% 21,721 91.5%
FIRST NATION ON RESERVE
FIRST NATION ON RESERVE 15,456 920 6.0% 14,536 94.0%
BILL PAYMENT RATING
Excel lent 439,339 51,364 11.7% 387,975 88.3%
Satis factory 22,395 2,728 12.2% 19,667 87.8%
Poor 23,077 2,111 9.1% 20,966 90.9%
DWELLING OWNERSHIP
Own 404,316 54,848 13.6% 349,468 86.4%
Rent / Other 80,495 1,355 1.7% 79,139 98.3%
2017 RESIDENTIAL SURVEY SECTION 8 ‐ DEMAND SIDE MANAGEMENT ‐ REFERENCE TABLE 8.01d
PARTICIPATION IN THE HOME INSULATION PROGRAM
Centra Gas Manitoba Inc. 2019/20 General Rate Application Appendix 7.7
March 22, 2019 Page 121 of 228

114
8.01e Participation in LED Light Bulb In‐Store Rebate Promotion
TOTAL YES % NO %
OVERALL 484,811 157,066 32.4% 327,745 67.6%
FUEL AREA
Winnipeg City 261,760 90,083 34.4% 171,677 65.6%
Gas Avai lable 140,021 45,427 32.4% 94,594 67.6%
No Gas Avai lable 83,030 21,555 26.0% 61,475 74.0%
DWELLING TYPE
Single Detached 373,568 136,036 36.4% 237,532 63.6%
Multi Attached 46,834 8,892 19.0% 37,942 81.0%
Apartment Sui te 64,409 12,138 18.8% 52,271 81.2%
BUILDING CODE ERA
2010‐2017 37,645 11,577 30.8% 26,068 69.2%
1990‐2009 89,181 28,344 31.8% 60,837 68.2%
1970‐1989 161,749 52,676 32.6% 109,072 67.4%
1950‐1969 110,314 38,593 35.0% 71,722 65.0%
Pre 1950 85,922 25,876 30.1% 60,046 69.9%
SPACE HEAT FUEL
Electric Heat 191,639 53,140 27.7% 138,499 72.3%
Natura l Gas Heat 249,938 95,997 38.4% 153,941 61.6%
Other Fuel 6,945 2,273 32.7% 4,672 67.3%
Shared (No Heat on Bi l l ) 36,289 5,656 15.6% 30,633 84.4%
PEOPLE PER HOUSEHOLD
One 124,779 31,043 24.9% 93,737 75.1%
Two 221,729 74,973 33.8% 146,756 66.2%
Three 60,069 20,866 34.7% 39,203 65.3%
Four 48,897 21,191 43.3% 27,705 56.7%
Five + 29,337 8,992 30.7% 20,344 69.3%
HOUSEHOLD INCOME
Less Than $25,000 59,481 9,914 16.7% 49,567 83.3%
$25,000 ‐ $49,999 137,082 38,654 28.2% 98,429 71.8%
$50,000 ‐ $74,999 123,824 41,900 33.8% 81,924 66.2%
$75,000 ‐ $99,999 66,780 26,163 39.2% 40,617 60.8%
$100,000 + 97,644 40,436 41.4% 57,208 58.6%
WINNIPEG LICO‐125 CLASS
Yes 158,987 37,334 23.5% 121,653 76.5%
No 325,824 119,732 36.7% 206,093 63.3%
INDIGENOUS SELF‐DECLARED ANCESTRY
Yes 51,429 12,361 24.0% 39,069 76.0%
No 409,630 137,379 33.5% 272,251 66.5%
Undeclared 23,751 7,326 30.8% 16,425 69.2%
FIRST NATION ON RESERVE
FIRST NATION ON RESERVE 15,456 1,792 11.6% 13,665 88.4%
BILL PAYMENT RATING
Excel lent 439,339 148,023 33.7% 291,316 66.3%
Satis factory 22,395 5,653 25.2% 16,742 74.8%
Poor 23,077 3,390 14.7% 19,687 85.3%
DWELLING OWNERSHIP
Own 404,316 146,729 36.3% 257,588 63.7%
Rent / Other 80,495 10,337 12.8% 70,158 87.2%
2017 RESIDENTIAL SURVEY SECTION 8 ‐ DEMAND SIDE MANAGEMENT ‐ REFERENCE TABLE 8.01e
PARTICIPATION IN THE LED LIGHT BULB IN‐STORE REBATE PROMOTION
Centra Gas Manitoba Inc. 2019/20 General Rate Application Appendix 7.7
March 22, 2019 Page 122 of 228
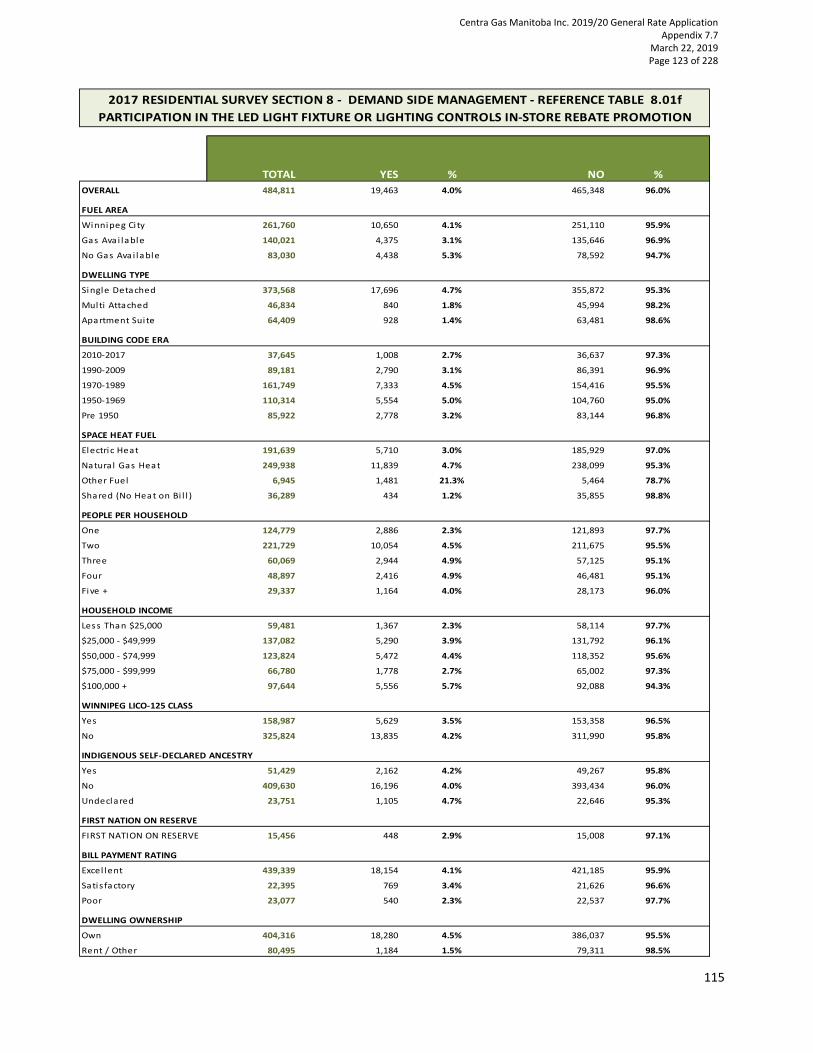
115
8.01f Participation in LED Light Fixture or Lighting Controls In‐Store Promotion
TOTAL YES % NO %
OVERALL 484,811 19,463 4.0% 465,348 96.0%
FUEL AREA
Winnipeg City 261,760 10,650 4.1% 251,110 95.9%
Gas Ava i lable 140,021 4,375 3.1% 135,646 96.9%
No Gas Ava i lable 83,030 4,438 5.3% 78,592 94.7%
DWELLING TYPE
Single Detached 373,568 17,696 4.7% 355,872 95.3%
Multi Attached 46,834 840 1.8% 45,994 98.2%
Apartment Sui te 64,409 928 1.4% 63,481 98.6%
BUILDING CODE ERA
2010‐2017 37,645 1,008 2.7% 36,637 97.3%
1990‐2009 89,181 2,790 3.1% 86,391 96.9%
1970‐1989 161,749 7,333 4.5% 154,416 95.5%
1950‐1969 110,314 5,554 5.0% 104,760 95.0%
Pre 1950 85,922 2,778 3.2% 83,144 96.8%
SPACE HEAT FUEL
Electric Heat 191,639 5,710 3.0% 185,929 97.0%
Natura l Gas Heat 249,938 11,839 4.7% 238,099 95.3%
Other Fuel 6,945 1,481 21.3% 5,464 78.7%
Shared (No Heat on Bi l l ) 36,289 434 1.2% 35,855 98.8%
PEOPLE PER HOUSEHOLD
One 124,779 2,886 2.3% 121,893 97.7%
Two 221,729 10,054 4.5% 211,675 95.5%
Three 60,069 2,944 4.9% 57,125 95.1%
Four 48,897 2,416 4.9% 46,481 95.1%
Five + 29,337 1,164 4.0% 28,173 96.0%
HOUSEHOLD INCOME
Less Than $25,000 59,481 1,367 2.3% 58,114 97.7%
$25,000 ‐ $49,999 137,082 5,290 3.9% 131,792 96.1%
$50,000 ‐ $74,999 123,824 5,472 4.4% 118,352 95.6%
$75,000 ‐ $99,999 66,780 1,778 2.7% 65,002 97.3%
$100,000 + 97,644 5,556 5.7% 92,088 94.3%
WINNIPEG LICO‐125 CLASS
Yes 158,987 5,629 3.5% 153,358 96.5%
No 325,824 13,835 4.2% 311,990 95.8%
INDIGENOUS SELF‐DECLARED ANCESTRY
Yes 51,429 2,162 4.2% 49,267 95.8%
No 409,630 16,196 4.0% 393,434 96.0%
Undeclared 23,751 1,105 4.7% 22,646 95.3%
FIRST NATION ON RESERVE
FIRST NATION ON RESERVE 15,456 448 2.9% 15,008 97.1%
BILL PAYMENT RATING
Excel lent 439,339 18,154 4.1% 421,185 95.9%
Satis factory 22,395 769 3.4% 21,626 96.6%
Poor 23,077 540 2.3% 22,537 97.7%
DWELLING OWNERSHIP
Own 404,316 18,280 4.5% 386,037 95.5%
Rent / Other 80,495 1,184 1.5% 79,311 98.5%
2017 RESIDENTIAL SURVEY SECTION 8 ‐ DEMAND SIDE MANAGEMENT ‐ REFERENCE TABLE 8.01f
PARTICIPATION IN THE LED LIGHT FIXTURE OR LIGHTING CONTROLS IN‐STORE REBATE PROMOTION
Centra Gas Manitoba Inc. 2019/20 General Rate Application Appendix 7.7
March 22, 2019 Page 123 of 228

116
8.01g Participation in Plug‐In Timers, Power Bars, or Showerheads In‐Store Rebate Promotion
TOTAL YES % NO %
OVERALL 484,811 47,799 9.9% 437,012 90.1%
FUEL AREA
Winnipeg City 261,760 26,910 10.3% 234,850 89.7%
Gas Ava i lable 140,021 13,568 9.7% 126,453 90.3%
No Gas Ava i lable 83,030 7,321 8.8% 75,709 91.2%
DWELLING TYPE
Single Detached 373,568 38,630 10.3% 334,938 89.7%
Multi Attached 46,834 2,872 6.1% 43,962 93.9%
Apartment Sui te 64,409 6,297 9.8% 58,112 90.2%
BUILDING CODE ERA
2010‐2017 37,645 2,554 6.8% 35,091 93.2%
1990‐2009 89,181 9,548 10.7% 79,633 89.3%
1970‐1989 161,749 16,316 10.1% 145,432 89.9%
1950‐1969 110,314 13,580 12.3% 96,734 87.7%
Pre 1950 85,922 5,800 6.8% 80,122 93.2%
SPACE HEAT FUEL
Electric Heat 191,639 17,520 9.1% 174,119 90.9%
Natura l Gas Heat 249,938 26,816 10.7% 223,122 89.3%
Other Fuel 6,945 999 14.4% 5,946 85.6%
Shared (No Heat on Bi l l ) 36,289 2,464 6.8% 33,825 93.2%
PEOPLE PER HOUSEHOLD
One 124,779 12,662 10.1% 112,117 89.9%
Two 221,729 26,384 11.9% 195,345 88.1%
Three 60,069 3,827 6.4% 56,242 93.6%
Four 48,897 3,952 8.1% 44,944 91.9%
Five + 29,337 974 3.3% 28,363 96.7%
HOUSEHOLD INCOME
Less Than $25,000 59,481 4,712 7.9% 54,769 92.1%
$25,000 ‐ $49,999 137,082 15,263 11.1% 121,819 88.9%
$50,000 ‐ $74,999 123,824 13,071 10.6% 110,753 89.4%
$75,000 ‐ $99,999 66,780 5,512 8.3% 61,267 91.7%
$100,000 + 97,644 9,240 9.5% 88,404 90.5%
WINNIPEG LICO‐125 CLASS
Yes 158,987 15,023 9.4% 143,963 90.6%
No 325,824 32,776 10.1% 293,048 89.9%
INDIGENOUS SELF‐DECLARED ANCESTRY
Yes 51,429 3,740 7.3% 47,689 92.7%
No 409,630 41,205 10.1% 368,425 89.9%
Undeclared 23,751 2,854 12.0% 20,897 88.0%
FIRST NATION ON RESERVE
FIRST NATION ON RESERVE 15,456 1,075 7.0% 14,381 93.0%
BILL PAYMENT RATING
Excel lent 439,339 45,816 10.4% 393,523 89.6%
Satis factory 22,395 887 4.0% 21,508 96.0%
Poor 23,077 1,096 4.8% 21,981 95.2%
DWELLING OWNERSHIP
Own 404,316 41,831 10.3% 362,485 89.7%
Rent / Other 80,495 5,968 7.4% 74,526 92.6%
2017 RESIDENTIAL SURVEY SECTION 8 ‐ DEMAND SIDE MANAGEMENT ‐ REFERENCE TABLE 8.01g
PARTICIPATION IN PLUG‐IN TIMERS, POWER BARS, OR SHOWERHEADS IN‐STORE REBATE PROMOTION
Centra Gas Manitoba Inc. 2019/20 General Rate Application Appendix 7.7
March 22, 2019 Page 124 of 228

117
8.01h Participation in Weather Stripping or Window Kits In‐Store Rebate Promotion
TOTAL YES % NO %
OVERALL 484,811 16,706 3.4% 468,105 96.6%
FUEL AREA
Winnipeg City 261,760 9,663 3.7% 252,097 96.3%
Gas Avai lable 140,021 3,744 2.7% 136,277 97.3%
No Gas Avai lable 83,030 3,299 4.0% 79,731 96.0%
DWELLING TYPE
Single Detached 373,568 13,685 3.7% 359,883 96.3%
Multi Attached 46,834 1,331 2.8% 45,503 97.2%
Apartment Sui te 64,409 1,690 2.6% 62,719 97.4%
BUILDING CODE ERA
2010‐2017 37,645 396 1.1% 37,249 98.9%
1990‐2009 89,181 1,986 2.2% 87,195 97.8%
1970‐1989 161,749 5,086 3.1% 156,663 96.9%
1950‐1969 110,314 4,377 4.0% 105,937 96.0%
Pre 1950 85,922 4,862 5.7% 81,060 94.3%
SPACE HEAT FUEL
Electric Heat 191,639 5,823 3.0% 185,816 97.0%
Natura l Gas Heat 249,938 9,339 3.7% 240,599 96.3%
Other Fuel 6,945 675 9.7% 6,270 90.3%
Shared (No Heat on Bi l l ) 36,289 870 2.4% 35,419 97.6%
PEOPLE PER HOUSEHOLD
One 124,779 4,569 3.7% 120,210 96.3%
Two 221,729 8,528 3.8% 213,201 96.2%
Three 60,069 1,277 2.1% 58,792 97.9%
Four 48,897 1,566 3.2% 47,330 96.8%
Five + 29,337 765 2.6% 28,571 97.4%
HOUSEHOLD INCOME
Less Than $25,000 59,481 2,815 4.7% 56,666 95.3%
$25,000 ‐ $49,999 137,082 5,158 3.8% 131,925 96.2%
$50,000 ‐ $74,999 123,824 4,513 3.6% 119,311 96.4%
$75,000 ‐ $99,999 66,780 1,454 2.2% 65,326 97.8%
$100,000 + 97,644 2,767 2.8% 94,877 97.2%
WINNIPEG LICO‐125 CLASS
Yes 158,987 6,828 4.3% 152,159 95.7%
No 325,824 9,878 3.0% 315,946 97.0%
INDIGENOUS SELF‐DECLARED ANCESTRY
Yes 51,429 1,619 3.1% 49,811 96.9%
No 409,630 14,488 3.5% 395,143 96.5%
Undeclared 23,751 600 2.5% 23,151 97.5%
FIRST NATION ON RESERVE
FIRST NATION ON RESERVE 15,456 622 4.0% 14,834 96.0%
BILL PAYMENT RATING
Excel lent 439,339 15,223 3.5% 424,116 96.5%
Satis factory 22,395 820 3.7% 21,575 96.3%
Poor 23,077 664 2.9% 22,413 97.1%
DWELLING OWNERSHIP
Own 404,316 14,235 3.5% 390,081 96.5%
Rent / Other 80,495 2,472 3.1% 78,023 96.9%
2017 RESIDENTIAL SURVEY SECTION 8 ‐ DEMAND SIDE MANAGEMENT ‐ REFERENCE TABLE 8.01h
PARTICIPATION IN WEATHERSTRIPPING OR WINDOW KITS IN‐STORE REBATE PROMOTION
Centra Gas Manitoba Inc. 2019/20 General Rate Application Appendix 7.7
March 22, 2019 Page 125 of 228

118
8.01i Participation in the New Home Program
TOTAL YES % NO %
OVERALL 484,811 3,409 0.7% 481,402 99.3%
FUEL AREA
Winnipeg City 261,760 1,262 0.5% 260,498 99.5%
Gas Avai lable 140,021 1,017 0.7% 139,004 99.3%
No Gas Avai lable 83,030 1,130 1.4% 81,900 98.6%
DWELLING TYPE
Single Detached 373,568 3,304 0.9% 370,264 99.1%
Multi Attached 46,834 105 0.2% 46,729 99.8%
Apartment Sui te 64,409 0 0.0% 64,409 100.0%
BUILDING CODE ERA
2010‐2017 37,645 1,598 4.2% 36,047 95.8%
1990‐2009 89,181 774 0.9% 88,408 99.1%
1970‐1989 161,749 389 0.2% 161,360 99.8%
1950‐1969 110,314 435 0.4% 109,879 99.6%
Pre 1950 85,922 214 0.2% 85,708 99.8%
SPACE HEAT FUEL
Electric Heat 191,639 1,501 0.8% 190,138 99.2%
Natura l Gas Heat 249,938 1,778 0.7% 248,160 99.3%
Other Fuel 6,945 131 1.9% 6,814 98.1%
Shared (No Heat on Bi l l ) 36,289 0 0.0% 36,289 100.0%
PEOPLE PER HOUSEHOLD
One 124,779 296 0.2% 124,484 99.8%
Two 221,729 1,634 0.7% 220,095 99.3%
Three 60,069 453 0.8% 59,617 99.2%
Four 48,897 819 1.7% 48,077 98.3%
Five + 29,337 208 0.7% 29,129 99.3%
HOUSEHOLD INCOME
Less Than $25,000 59,481 174 0.3% 59,307 99.7%
$25,000 ‐ $49,999 137,082 539 0.4% 136,543 99.6%
$50,000 ‐ $74,999 123,824 580 0.5% 123,244 99.5%
$75,000 ‐ $99,999 66,780 770 1.2% 66,009 98.8%
$100,000 + 97,644 1,346 1.4% 96,298 98.6%
WINNIPEG LICO‐125 CLASS
Yes 158,987 859 0.5% 158,128 99.5%
No 325,824 2,551 0.8% 323,273 99.2%
INDIGENOUS SELF‐DECLARED ANCESTRY
Yes 51,429 451 0.9% 50,978 99.1%
No 409,630 2,735 0.7% 406,895 99.3%
Undeclared 23,751 223 0.9% 23,528 99.1%
FIRST NATION ON RESERVE
FIRST NATION ON RESERVE 15,456 349 2.3% 15,107 97.7%
BILL PAYMENT RATING
Excel lent 439,339 2,709 0.6% 436,630 99.4%
Satis factory 22,395 277 1.2% 22,118 98.8%
Poor 23,077 423 1.8% 22,654 98.2%
DWELLING OWNERSHIP
Own 404,316 3,123 0.8% 401,193 99.2%
Rent / Other 80,495 287 0.4% 80,208 99.6%
2017 RESIDENTIAL SURVEY SECTION 8 ‐ DEMAND SIDE MANAGEMENT ‐ REFERENCE TABLE 8.01i
PARTICIPATION IN THE NEW HOME PROGRAM
Centra Gas Manitoba Inc. 2019/20 General Rate Application Appendix 7.7
March 22, 2019 Page 126 of 228

119
8.01j Participation in Pay As You Save (PAYS) Financing Program
TOTAL YES % NO %
OVERALL 484,811 7,712 1.6% 477,099 98.4%
FUEL AREA
Winnipeg City 261,760 5,947 2.3% 255,813 97.7%
Gas Ava i lable 140,021 679 0.5% 139,342 99.5%
No Gas Ava i lable 83,030 1,086 1.3% 81,944 98.7%
DWELLING TYPE
Single Detached 373,568 6,746 1.8% 366,822 98.2%
Multi Attached 46,834 222 0.5% 46,612 99.5%
Apartment Sui te 64,409 743 1.2% 63,666 98.8%
BUILDING CODE ERA
2010‐2017 37,645 115 0.3% 37,530 99.7%
1990‐2009 89,181 484 0.5% 88,697 99.5%
1970‐1989 161,749 1,635 1.0% 160,113 99.0%
1950‐1969 110,314 3,092 2.8% 107,222 97.2%
Pre 1950 85,922 2,385 2.8% 83,537 97.2%
SPACE HEAT FUEL
Electric Heat 191,639 1,386 0.7% 190,253 99.3%
Natura l Gas Heat 249,938 5,614 2.2% 244,324 97.8%
Other Fuel 6,945 131 1.9% 6,814 98.1%
Shared (No Heat on Bi l l ) 36,289 580 1.6% 35,709 98.4%
PEOPLE PER HOUSEHOLD
One 124,779 1,544 1.2% 123,236 98.8%
Two 221,729 3,876 1.7% 217,853 98.3%
Three 60,069 837 1.4% 59,232 98.6%
Four 48,897 831 1.7% 48,065 98.3%
Five + 29,337 624 2.1% 28,713 97.9%
HOUSEHOLD INCOME
Less Than $25,000 59,481 1,299 2.2% 58,182 97.8%
$25,000 ‐ $49,999 137,082 2,071 1.5% 135,011 98.5%
$50,000 ‐ $74,999 123,824 1,720 1.4% 122,104 98.6%
$75,000 ‐ $99,999 66,780 689 1.0% 66,091 99.0%
$100,000 + 97,644 1,933 2.0% 95,711 98.0%
WINNIPEG LICO‐125 CLASS
Yes 158,987 2,923 1.8% 156,063 98.2%
No 325,824 4,788 1.5% 321,036 98.5%
INDIGENOUS SELF‐DECLARED ANCESTRY
Yes 51,429 873 1.7% 50,557 98.3%
No 409,630 6,380 1.6% 403,250 98.4%
Undeclared 23,751 459 1.9% 23,292 98.1%
FIRST NATION ON RESERVE
FIRST NATION ON RESERVE 15,456 417 2.7% 15,039 97.3%
BILL PAYMENT RATING
Excel lent 439,339 6,682 1.5% 432,657 98.5%
Satis factory 22,395 503 2.2% 21,892 97.8%
Poor 23,077 526 2.3% 22,551 97.7%
DWELLING OWNERSHIP
Own 404,316 6,612 1.6% 397,704 98.4%
Rent / Other 80,495 1,099 1.4% 79,395 98.6%
2017 RESIDENTIAL SURVEY SECTION 8 ‐ DEMAND SIDE MANAGEMENT ‐ REFERENCE TABLE 8.01j
PARTICIPATION IN THE PAY AS YOU SAVE (PAYS) FINANCING PROGRAM
Centra Gas Manitoba Inc. 2019/20 General Rate Application Appendix 7.7
March 22, 2019 Page 127 of 228

120
8.01k Participation in Refrigerator Retirement Program
TOTAL YES % NO %
OVERALL 484,811 71,489 14.7% 413,322 85.3%
FUEL AREA
Winnipeg City 261,760 41,726 15.9% 220,034 84.1%
Gas Ava i lable 140,021 19,793 14.1% 120,228 85.9%
No Gas Ava i lable 83,030 9,970 12.0% 73,060 88.0%
DWELLING TYPE
Single Detached 373,568 66,080 17.7% 307,488 82.3%
Multi Attached 46,834 3,976 8.5% 42,858 91.5%
Apartment Sui te 64,409 1,433 2.2% 62,976 97.8%
BUILDING CODE ERA
2010‐2017 37,645 1,671 4.4% 35,974 95.6%
1990‐2009 89,181 10,377 11.6% 78,804 88.4%
1970‐1989 161,749 24,158 14.9% 137,590 85.1%
1950‐1969 110,314 21,368 19.4% 88,947 80.6%
Pre 1950 85,922 13,915 16.2% 72,007 83.8%
SPACE HEAT FUEL
Electric Heat 191,639 21,197 11.1% 170,442 88.9%
Natura l Gas Heat 249,938 48,824 19.5% 201,114 80.5%
Other Fuel 6,945 0 0.0% 6,945 100.0%
Shared (No Heat on Bi l l ) 36,289 1,468 4.0% 34,821 96.0%
PEOPLE PER HOUSEHOLD
One 124,779 13,560 10.9% 111,220 89.1%
Two 221,729 38,421 17.3% 183,309 82.7%
Three 60,069 7,895 13.1% 52,174 86.9%
Four 48,897 8,181 16.7% 40,715 83.3%
Five + 29,337 3,433 11.7% 25,904 88.3%
HOUSEHOLD INCOME
Less Than $25,000 59,481 5,577 9.4% 53,904 90.6%
$25,000 ‐ $49,999 137,082 18,961 13.8% 118,121 86.2%
$50,000 ‐ $74,999 123,824 18,574 15.0% 105,250 85.0%
$75,000 ‐ $99,999 66,780 11,556 17.3% 55,224 82.7%
$100,000 + 97,644 16,821 17.2% 80,823 82.8%
WINNIPEG LICO‐125 CLASS
Yes 158,987 19,511 12.3% 139,476 87.7%
No 325,824 51,978 16.0% 273,846 84.0%
INDIGENOUS SELF‐DECLARED ANCESTRY
Yes 51,429 4,121 8.0% 47,308 92.0%
No 409,630 64,321 15.7% 345,309 84.3%
Undeclared 23,751 3,047 12.8% 20,704 87.2%
FIRST NATION ON RESERVE
FIRST NATION ON RESERVE 15,456 155 1.0% 15,301 99.0%
BILL PAYMENT RATING
Excel lent 439,339 68,063 15.5% 371,276 84.5%
Satis factory 22,395 1,702 7.6% 20,693 92.4%
Poor 23,077 1,725 7.5% 21,352 92.5%
DWELLING OWNERSHIP
Own 404,316 69,346 17.2% 334,970 82.8%
Rent / Other 80,495 2,143 2.7% 78,352 97.3%
2017 RESIDENTIAL SURVEY SECTION 8 ‐ DEMAND SIDE MANAGEMENT ‐ REFERENCE TABLE 8.01k
PARTICIPATION IN THE REFRIGERATOR RETIREMENT PROGRAM
Centra Gas Manitoba Inc. 2019/20 General Rate Application Appendix 7.7
March 22, 2019 Page 128 of 228

121
8.01l Participation in Residential Loan Program
TOTAL YES % NO %
OVERALL 484,811 26,931 5.6% 457,880 94.4%
FUEL AREA
Winnipeg City 261,760 20,761 7.9% 240,999 92.1%
Gas Ava i lable 140,021 4,775 3.4% 135,246 96.6%
No Gas Ava i lable 83,030 1,395 1.7% 81,635 98.3%
DWELLING TYPE
Single Detached 373,568 24,461 6.5% 349,107 93.5%
Multi Attached 46,834 2,470 5.3% 44,364 94.7%
Apartment Sui te 64,409 0 0.0% 64,409 100.0%
BUILDING CODE ERA
2010‐2017 37,645 0 0.0% 37,645 100.0%
1990‐2009 89,181 2,207 2.5% 86,974 97.5%
1970‐1989 161,749 9,639 6.0% 152,110 94.0%
1950‐1969 110,314 9,369 8.5% 100,946 91.5%
Pre 1950 85,922 5,716 6.7% 80,206 93.3%
SPACE HEAT FUEL
Electric Heat 191,639 4,043 2.1% 187,596 97.9%
Natura l Gas Heat 249,938 22,039 8.8% 227,899 91.2%
Other Fuel 6,945 849 12.2% 6,096 87.8%
Shared (No Heat on Bi l l ) 36,289 0 0.0% 36,289 100.0%
PEOPLE PER HOUSEHOLD
One 124,779 5,517 4.4% 119,262 95.6%
Two 221,729 9,903 4.5% 211,826 95.5%
Three 60,069 5,699 9.5% 54,370 90.5%
Four 48,897 3,848 7.9% 45,049 92.1%
Five + 29,337 1,963 6.7% 27,374 93.3%
HOUSEHOLD INCOME
Less Than $25,000 59,481 987 1.7% 58,493 98.3%
$25,000 ‐ $49,999 137,082 6,168 4.5% 130,914 95.5%
$50,000 ‐ $74,999 123,824 8,656 7.0% 115,168 93.0%
$75,000 ‐ $99,999 66,780 3,481 5.2% 63,299 94.8%
$100,000 + 97,644 7,639 7.8% 90,005 92.2%
WINNIPEG LICO‐125 CLASS
Yes 158,987 5,285 3.3% 153,702 96.7%
No 325,824 21,646 6.6% 304,178 93.4%
INDIGENOUS SELF‐DECLARED ANCESTRY
Yes 51,429 2,524 4.9% 48,906 95.1%
No 409,630 22,907 5.6% 386,724 94.4%
Undeclared 23,751 1,501 6.3% 22,251 93.7%
FIRST NATION ON RESERVE
FIRST NATION ON RESERVE 15,456 93 0.6% 15,363 99.4%
BILL PAYMENT RATING
Excel lent 439,339 25,492 5.8% 413,847 94.2%
Satis factory 22,395 966 4.3% 21,429 95.7%
Poor 23,077 473 2.0% 22,604 98.0%
DWELLING OWNERSHIP
Own 404,316 26,726 6.6% 377,590 93.4%
Rent / Other 80,495 205 0.3% 80,290 99.7%
2017 RESIDENTIAL SURVEY SECTION 8 ‐ DEMAND SIDE MANAGEMENT ‐ REFERENCE TABLE 8.01l
PARTICIPATION IN THE RESIDENTIAL LOAN PROGRAM
Centra Gas Manitoba Inc. 2019/20 General Rate Application Appendix 7.7
March 22, 2019 Page 129 of 228

122
8.01m Participation in Smart Thermostat Rebate Program
TOTAL YES % NO %
OVERALL 484,811 5,721 1.2% 479,090 98.8%
FUEL AREA
Winnipeg City 261,760 3,194 1.2% 258,566 98.8%
Gas Avai lable 140,021 1,621 1.2% 138,400 98.8%
No Gas Avai lable 83,030 905 1.1% 82,125 98.9%
DWELLING TYPE
Single Detached 373,568 5,396 1.4% 368,172 98.6%
Multi Attached 46,834 0 0.0% 46,834 100.0%
Apartment Sui te 64,409 326 0.5% 64,084 99.5%
BUILDING CODE ERA
2010‐2017 37,645 942 2.5% 36,703 97.5%
1990‐2009 89,181 1,332 1.5% 87,849 98.5%
1970‐1989 161,749 1,016 0.6% 160,732 99.4%
1950‐1969 110,314 1,535 1.4% 108,779 98.6%
Pre 1950 85,922 896 1.0% 85,026 99.0%
SPACE HEAT FUEL
Electric Heat 191,639 2,134 1.1% 189,505 98.9%
Natura l Gas Heat 249,938 3,587 1.4% 246,351 98.6%
Other Fuel 6,945 0 0.0% 6,945 100.0%
Shared (No Heat on Bi l l ) 36,289 0 0.0% 36,289 100.0%
PEOPLE PER HOUSEHOLD
One 124,779 497 0.4% 124,283 99.6%
Two 221,729 2,776 1.3% 218,953 98.7%
Three 60,069 890 1.5% 59,179 98.5%
Four 48,897 888 1.8% 48,008 98.2%
Five + 29,337 670 2.3% 28,667 97.7%
HOUSEHOLD INCOME
Less Than $25,000 59,481 177 0.3% 59,304 99.7%
$25,000 ‐ $49,999 137,082 420 0.3% 136,662 99.7%
$50,000 ‐ $74,999 123,824 1,143 0.9% 122,681 99.1%
$75,000 ‐ $99,999 66,780 1,268 1.9% 65,511 98.1%
$100,000 + 97,644 2,713 2.8% 94,931 97.2%
WINNIPEG LICO‐125 CLASS
Yes 158,987 718 0.5% 158,269 99.5%
No 325,824 5,003 1.5% 320,821 98.5%
INDIGENOUS SELF‐DECLARED ANCESTRY
Yes 51,429 572 1.1% 50,858 98.9%
No 409,630 4,920 1.2% 404,710 98.8%
Undeclared 23,751 230 1.0% 23,522 99.0%
FIRST NATION ON RESERVE
FIRST NATION ON RESERVE 15,456 93 0.6% 15,363 99.4%
BILL PAYMENT RATING
Excel lent 439,339 5,243 1.2% 434,096 98.8%
Satis factory 22,395 363 1.6% 22,032 98.4%
Poor 23,077 115 0.5% 22,962 99.5%
DWELLING OWNERSHIP
Own 404,316 5,465 1.4% 398,851 98.6%
Rent / Other 80,495 256 0.3% 80,239 99.7%
2017 RESIDENTIAL SURVEY SECTION 8 ‐ DEMAND SIDE MANAGEMENT ‐ REFERENCE TABLE 8.01m
PARTICIPATION IN THE SMART THERMOSTAT REBATE PROGRAM
Centra Gas Manitoba Inc. 2019/20 General Rate Application Appendix 7.7
March 22, 2019 Page 130 of 228

123
8.01n Participation in Weather and Energy Saver Program
TOTAL YES % NO %
OVERALL 484,811 113,730 23.5% 371,081 76.5%
FUEL AREA
Winnipeg City 261,760 69,301 26.5% 192,459 73.5%
Gas Avai lable 140,021 29,387 21.0% 110,634 79.0%
No Gas Avai lable 83,030 15,041 18.1% 67,989 81.9%
DWELLING TYPE
Single Detached 373,568 97,638 26.1% 275,930 73.9%
Multi Attached 46,834 9,983 21.3% 36,851 78.7%
Apartment Sui te 64,409 6,109 9.5% 58,300 90.5%
BUILDING CODE ERA
2010‐2017 37,645 3,961 10.5% 33,684 89.5%
1990‐2009 89,181 20,224 22.7% 68,957 77.3%
1970‐1989 161,749 39,624 24.5% 122,124 75.5%
1950‐1969 110,314 31,007 28.1% 79,307 71.9%
Pre 1950 85,922 18,913 22.0% 67,008 78.0%
SPACE HEAT FUEL
Electric Heat 191,639 35,533 18.5% 156,106 81.5%
Natura l Gas Heat 249,938 73,928 29.6% 176,010 70.4%
Other Fuel 6,945 337 4.9% 6,608 95.1%
Shared (No Heat on Bi l l ) 36,289 3,932 10.8% 32,357 89.2%
PEOPLE PER HOUSEHOLD
One 124,779 22,388 17.9% 102,391 82.1%
Two 221,729 55,586 25.1% 166,143 74.9%
Three 60,069 15,378 25.6% 44,692 74.4%
Four 48,897 13,296 27.2% 35,601 72.8%
Five + 29,337 7,083 24.1% 22,253 75.9%
HOUSEHOLD INCOME
Less Than $25,000 59,481 8,077 13.6% 51,404 86.4%
$25,000 ‐ $49,999 137,082 29,997 21.9% 107,085 78.1%
$50,000 ‐ $74,999 123,824 35,651 28.8% 88,173 71.2%
$75,000 ‐ $99,999 66,780 15,841 23.7% 50,939 76.3%
$100,000 + 97,644 24,165 24.7% 73,479 75.3%
WINNIPEG LICO‐125 CLASS
Yes 158,987 29,607 18.6% 129,379 81.4%
No 325,824 84,123 25.8% 241,701 74.2%
INDIGENOUS SELF‐DECLARED ANCESTRY
Yes 51,429 9,078 17.7% 42,351 82.3%
No 409,630 99,010 24.2% 310,621 75.8%
Undeclared 23,751 5,642 23.8% 18,109 76.2%
FIRST NATION ON RESERVE
FIRST NATION ON RESERVE 15,456 1,560 10.1% 13,896 89.9%
BILL PAYMENT RATING
Excel lent 439,339 107,608 24.5% 331,731 75.5%
Satis factory 22,395 3,405 15.2% 18,990 84.8%
Poor 23,077 2,717 11.8% 20,360 88.2%
DWELLING OWNERSHIP
Own 404,316 106,359 26.3% 297,957 73.7%
Rent / Other 80,495 7,371 9.2% 73,124 90.8%
2017 RESIDENTIAL SURVEY SECTION 8 ‐ DEMAND SIDE MANAGEMENT ‐ REFERENCE TABLE 8.01n
PARTICIPATION IN THE WATER AND ENERGY SAVER PROGRAM
Centra Gas Manitoba Inc. 2019/20 General Rate Application Appendix 7.7
March 22, 2019 Page 131 of 228

124
8.01o Participation in Solar Energy Program
TOTAL YES % NO %
OVERALL 484,811 3,313 0.7% 481,498 99.3%
FUEL AREA
Winnipeg City 261,760 1,181 0.5% 260,579 99.5%
Gas Avai lable 140,021 504 0.4% 139,517 99.6%
No Gas Avai lable 83,030 1,628 2.0% 81,402 98.0%
DWELLING TYPE
Single Detached 373,568 2,209 0.6% 371,359 99.4%
Multi Attached 46,834 154 0.3% 46,680 99.7%
Apartment Sui te 64,409 950 1.5% 63,459 98.5%
BUILDING CODE ERA
2010‐2017 37,645 366 1.0% 37,279 99.0%
1990‐2009 89,181 425 0.5% 88,756 99.5%
1970‐1989 161,749 417 0.3% 161,331 99.7%
1950‐1969 110,314 1,337 1.2% 108,977 98.8%
Pre 1950 85,922 768 0.9% 85,154 99.1%
SPACE HEAT FUEL
Electric Heat 191,639 1,358 0.7% 190,281 99.3%
Natura l Gas Heat 249,938 831 0.3% 249,107 99.7%
Other Fuel 6,945 337 4.9% 6,608 95.1%
Shared (No Heat on Bi l l ) 36,289 787 2.2% 35,502 97.8%
PEOPLE PER HOUSEHOLD
One 124,779 599 0.5% 124,181 99.5%
Two 221,729 2,168 1.0% 219,562 99.0%
Three 60,069 103 0.2% 59,967 99.8%
Four 48,897 445 0.9% 48,452 99.1%
Five + 29,337 0 0.0% 29,337 100.0%
HOUSEHOLD INCOME
Less Than $25,000 59,481 194 0.3% 59,287 99.7%
$25,000 ‐ $49,999 137,082 617 0.4% 136,466 99.6%
$50,000 ‐ $74,999 123,824 1,276 1.0% 122,548 99.0%
$75,000 ‐ $99,999 66,780 707 1.1% 66,073 98.9%
$100,000 + 97,644 520 0.5% 97,125 99.5%
WINNIPEG LICO‐125 CLASS
Yes 158,987 294 0.2% 158,693 99.8%
No 325,824 3,019 0.9% 322,805 99.1%
INDIGENOUS SELF‐DECLARED ANCESTRY
Yes 51,429 227 0.4% 51,202 99.6%
No 409,630 3,086 0.8% 406,544 99.2%
Undeclared 23,751 0 0.0% 23,751 100.0%
FIRST NATION ON RESERVE
FIRST NATION ON RESERVE 15,456 124 0.8% 15,332 99.2%
BILL PAYMENT RATING
Excel lent 439,339 3,136 0.7% 436,203 99.3%
Satis factory 22,395 31 0.1% 22,364 99.9%
Poor 23,077 146 0.6% 22,931 99.4%
DWELLING OWNERSHIP
Own 404,316 2,085 0.5% 402,231 99.5%
Rent / Other 80,495 1,229 1.5% 79,266 98.5%
2017 RESIDENTIAL SURVEY SECTION 8 ‐ DEMAND SIDE MANAGEMENT ‐ REFERENCE TABLE 8.01o
PARTICIPATION IN THE SOLAR ENERGY PROGRAM
Centra Gas Manitoba Inc. 2019/20 General Rate Application Appendix 7.7
March 22, 2019 Page 132 of 228

125
8.02a Influence of Manitoba Hydro’s DSM Program to Upgrade Your Home Insulation
TOTAL
DID NOT
INSTALL/BUY %
DID NOT
INFLUENCE %
SOMEWHAT
INFLUENCED %
STRONGLY
INFLUENCED %
OVERALL 484,811 347,806 71.7% 64,257 13.3% 26,746 5.5% 46,003 9.5%
FUEL AREA
Winnipeg City 261,760 186,708 71.3% 34,635 13.2% 15,317 5.9% 25,100 9.6%
Gas Avai lable 140,021 103,239 73.7% 18,007 12.9% 6,578 4.7% 12,197 8.7%
No Gas Avai lable 83,030 57,859 69.7% 11,614 14.0% 4,851 5.8% 8,706 10.5%
DWELLING TYPE
Single Detached 373,568 252,558 67.6% 56,477 15.1% 23,492 6.3% 41,041 11.0%
Multi Attached 46,834 34,685 74.1% 5,681 12.1% 2,141 4.6% 4,326 9.2%
Apartment Suite 64,409 60,563 94.0% 2,098 3.3% 1,113 1.7% 635 1.0%
BUILDING CODE ERA
2010‐2017 37,645 31,689 84.2% 4,596 12.2% 755 2.0% 605 1.6%
1990‐2009 89,181 73,366 82.3% 9,736 10.9% 2,696 3.0% 3,384 3.8%
1970‐1989 161,749 119,225 73.7% 18,789 11.6% 8,690 5.4% 15,045 9.3%
1950‐1969 110,314 72,008 65.3% 17,146 15.5% 7,572 6.9% 13,588 12.3%
Pre 1950 85,922 51,518 60.0% 13,989 16.3% 7,033 8.2% 13,381 15.6%
SPACE HEAT FUEL
Electric Heat 191,639 143,759 75.0% 22,751 11.9% 8,610 4.5% 16,520 8.6%
Natural Gas Heat 249,938 167,929 67.2% 38,881 15.6% 16,197 6.5% 26,931 10.8%
Other Fuel 6,945 4,716 67.9% 734 10.6% 265 3.8% 1,231 17.7%
Shared (No Heat on Bi l l ) 36,289 31,402 86.5% 1,891 5.2% 1,675 4.6% 1,321 3.6%
PEOPLE PER HOUSEHOLD
One 124,779 96,926 77.7% 13,429 10.8% 5,695 4.6% 8,730 7.0%
Two 221,729 155,104 70.0% 30,823 13.9% 12,315 5.6% 23,487 10.6%
Three 60,069 42,413 70.6% 7,702 12.8% 4,259 7.1% 5,694 9.5%
Four 48,897 32,993 67.5% 8,343 17.1% 3,121 6.4% 4,440 9.1%
Five + 29,337 20,369 69.4% 3,959 13.5% 1,356 4.6% 3,652 12.4%
HOUSEHOLD INCOME
Less Than $25,000 59,481 47,452 79.8% 4,871 8.2% 2,820 4.7% 4,337 7.3%
$25,000 ‐ $49,999 137,082 99,313 72.4% 15,090 11.0% 7,931 5.8% 14,749 10.8%
$50,000 ‐ $74,999 123,824 86,317 69.7% 18,245 14.7% 7,332 5.9% 11,930 9.6%
$75,000 ‐ $99,999 66,780 48,512 72.6% 10,221 15.3% 2,703 4.0% 5,345 8.0%
$100,000 + 97,644 66,212 67.8% 15,829 16.2% 5,960 6.1% 9,643 9.9%
WINNIPEG LICO‐125 CLASS
Yes 158,987 116,985 73.6% 16,204 10.2% 10,079 6.3% 15,719 9.9%
No 325,824 230,821 70.8% 48,053 14.7% 16,667 5.1% 30,283 9.3%
INDIGENOUS SELF‐DECLARED ANCESTRY
Yes 51,429 37,379 72.7% 6,585 12.8% 2,355 4.6% 5,111 9.9%
No 409,630 293,408 71.6% 53,572 13.1% 22,846 5.6% 39,804 9.7%
Undeclared 23,751 17,019 71.7% 4,100 17.3% 1,545 6.5% 1,087 4.6%
FIRST NATION ON RESERVE
FIRST NATION ON RESERVE 15,456 11,783 76.2% 1,690 10.9% 721 4.7% 1,262 8.2%
BILL PAYMENT RATING
Excel lent 439,339 313,958 71.5% 59,620 13.6% 23,869 5.4% 41,892 9.5%
Satis factory 22,395 16,371 73.1% 2,311 10.3% 1,531 6.8% 2,182 9.7%
Poor 23,077 17,477 75.7% 2,326 10.1% 1,346 5.8% 1,928 8.4%
DWELLING OWNERSHIP
Own 404,316 274,632 67.9% 60,424 14.9% 24,911 6.2% 44,349 11.0%
Rent / Other 80,495 73,174 90.9% 3,833 4.8% 1,835 2.3% 1,654 2.1%
2017 RESIDENTIAL SURVEY SECTION 8 ‐ DEMAND SIDE MANAGEMENT ‐ REFERENCE TABLE 8.02a
INFLUENCE OF MANITOBA HYDRO'S DSM PROGRAM TO UPGRADE YOUR HOME INSULATION
Centra Gas Manitoba Inc. 2019/20 General Rate Application Appendix 7.7
March 22, 2019 Page 133 of 228
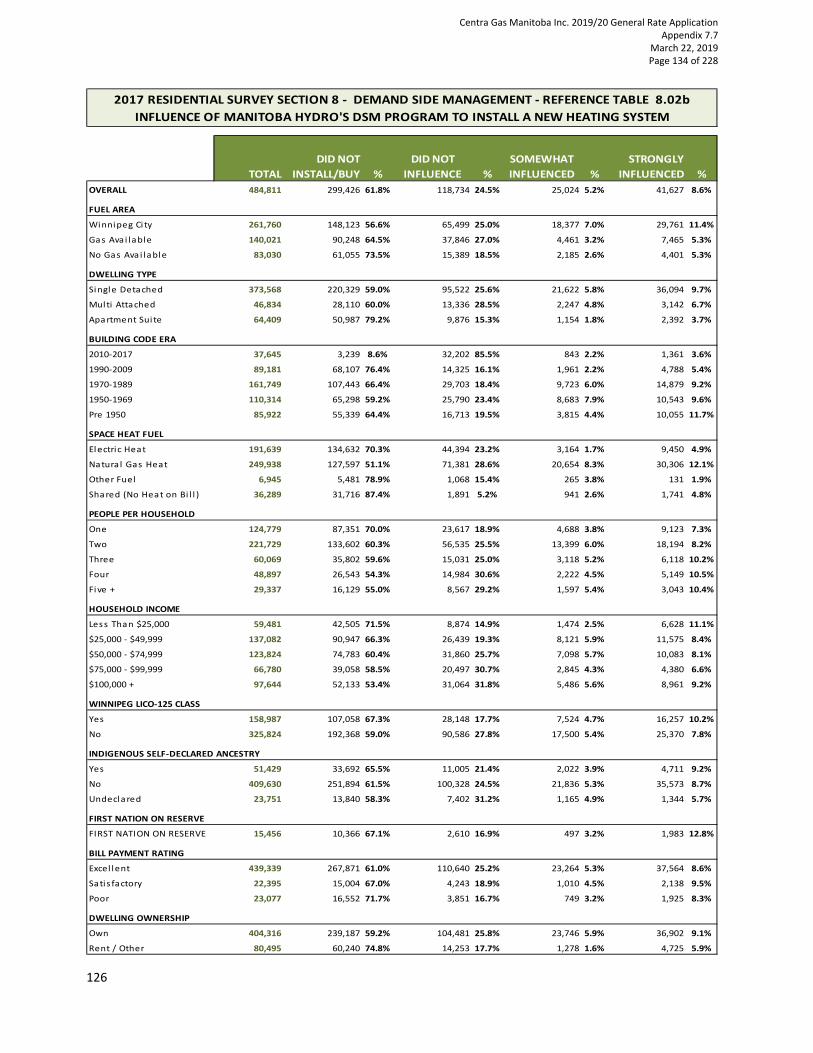
126
8.02b Influence of Manitoba Hydro’s DSM Program to Install New Heating System
TOTAL
DID NOT
INSTALL/BUY %
DID NOT
INFLUENCE %
SOMEWHAT
INFLUENCED %
STRONGLY
INFLUENCED %
OVERALL 484,811 299,426 61.8% 118,734 24.5% 25,024 5.2% 41,627 8.6%
FUEL AREA
Winnipeg City 261,760 148,123 56.6% 65,499 25.0% 18,377 7.0% 29,761 11.4%
Gas Avai lable 140,021 90,248 64.5% 37,846 27.0% 4,461 3.2% 7,465 5.3%
No Gas Ava i lable 83,030 61,055 73.5% 15,389 18.5% 2,185 2.6% 4,401 5.3%
DWELLING TYPE
Single Detached 373,568 220,329 59.0% 95,522 25.6% 21,622 5.8% 36,094 9.7%
Multi Attached 46,834 28,110 60.0% 13,336 28.5% 2,247 4.8% 3,142 6.7%
Apartment Sui te 64,409 50,987 79.2% 9,876 15.3% 1,154 1.8% 2,392 3.7%
BUILDING CODE ERA
2010‐2017 37,645 3,239 8.6% 32,202 85.5% 843 2.2% 1,361 3.6%
1990‐2009 89,181 68,107 76.4% 14,325 16.1% 1,961 2.2% 4,788 5.4%
1970‐1989 161,749 107,443 66.4% 29,703 18.4% 9,723 6.0% 14,879 9.2%
1950‐1969 110,314 65,298 59.2% 25,790 23.4% 8,683 7.9% 10,543 9.6%
Pre 1950 85,922 55,339 64.4% 16,713 19.5% 3,815 4.4% 10,055 11.7%
SPACE HEAT FUEL
Electric Heat 191,639 134,632 70.3% 44,394 23.2% 3,164 1.7% 9,450 4.9%
Natura l Gas Heat 249,938 127,597 51.1% 71,381 28.6% 20,654 8.3% 30,306 12.1%
Other Fuel 6,945 5,481 78.9% 1,068 15.4% 265 3.8% 131 1.9%
Shared (No Heat on Bi l l ) 36,289 31,716 87.4% 1,891 5.2% 941 2.6% 1,741 4.8%
PEOPLE PER HOUSEHOLD
One 124,779 87,351 70.0% 23,617 18.9% 4,688 3.8% 9,123 7.3%
Two 221,729 133,602 60.3% 56,535 25.5% 13,399 6.0% 18,194 8.2%
Three 60,069 35,802 59.6% 15,031 25.0% 3,118 5.2% 6,118 10.2%
Four 48,897 26,543 54.3% 14,984 30.6% 2,222 4.5% 5,149 10.5%
Five + 29,337 16,129 55.0% 8,567 29.2% 1,597 5.4% 3,043 10.4%
HOUSEHOLD INCOME
Less Than $25,000 59,481 42,505 71.5% 8,874 14.9% 1,474 2.5% 6,628 11.1%
$25,000 ‐ $49,999 137,082 90,947 66.3% 26,439 19.3% 8,121 5.9% 11,575 8.4%
$50,000 ‐ $74,999 123,824 74,783 60.4% 31,860 25.7% 7,098 5.7% 10,083 8.1%
$75,000 ‐ $99,999 66,780 39,058 58.5% 20,497 30.7% 2,845 4.3% 4,380 6.6%
$100,000 + 97,644 52,133 53.4% 31,064 31.8% 5,486 5.6% 8,961 9.2%
WINNIPEG LICO‐125 CLASS
Yes 158,987 107,058 67.3% 28,148 17.7% 7,524 4.7% 16,257 10.2%
No 325,824 192,368 59.0% 90,586 27.8% 17,500 5.4% 25,370 7.8%
INDIGENOUS SELF‐DECLARED ANCESTRY
Yes 51,429 33,692 65.5% 11,005 21.4% 2,022 3.9% 4,711 9.2%
No 409,630 251,894 61.5% 100,328 24.5% 21,836 5.3% 35,573 8.7%
Undeclared 23,751 13,840 58.3% 7,402 31.2% 1,165 4.9% 1,344 5.7%
FIRST NATION ON RESERVE
FIRST NATION ON RESERVE 15,456 10,366 67.1% 2,610 16.9% 497 3.2% 1,983 12.8%
BILL PAYMENT RATING
Excel lent 439,339 267,871 61.0% 110,640 25.2% 23,264 5.3% 37,564 8.6%
Satis factory 22,395 15,004 67.0% 4,243 18.9% 1,010 4.5% 2,138 9.5%
Poor 23,077 16,552 71.7% 3,851 16.7% 749 3.2% 1,925 8.3%
DWELLING OWNERSHIP
Own 404,316 239,187 59.2% 104,481 25.8% 23,746 5.9% 36,902 9.1%
Rent / Other 80,495 60,240 74.8% 14,253 17.7% 1,278 1.6% 4,725 5.9%
2017 RESIDENTIAL SURVEY SECTION 8 ‐ DEMAND SIDE MANAGEMENT ‐ REFERENCE TABLE 8.02b
INFLUENCE OF MANITOBA HYDRO'S DSM PROGRAM TO INSTALL A NEW HEATING SYSTEM
Centra Gas Manitoba Inc. 2019/20 General Rate Application Appendix 7.7
March 22, 2019 Page 134 of 228
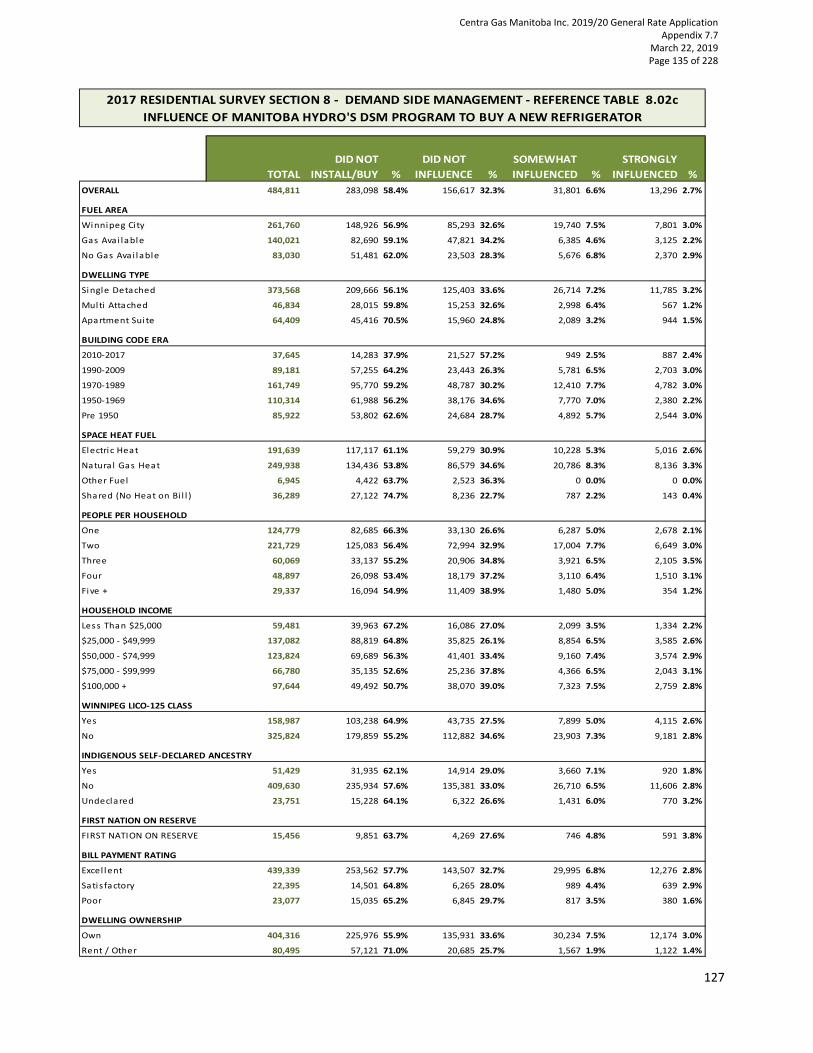
127
8.02c Influence of Manitoba Hydro’s DSM Program to Buy a New Refrigerator
TOTAL
DID NOT
INSTALL/BUY %
DID NOT
INFLUENCE %
SOMEWHAT
INFLUENCED %
STRONGLY
INFLUENCED %
OVERALL 484,811 283,098 58.4% 156,617 32.3% 31,801 6.6% 13,296 2.7%
FUEL AREA
Winnipeg City 261,760 148,926 56.9% 85,293 32.6% 19,740 7.5% 7,801 3.0%
Gas Avai lable 140,021 82,690 59.1% 47,821 34.2% 6,385 4.6% 3,125 2.2%
No Gas Avai lable 83,030 51,481 62.0% 23,503 28.3% 5,676 6.8% 2,370 2.9%
DWELLING TYPE
Single Detached 373,568 209,666 56.1% 125,403 33.6% 26,714 7.2% 11,785 3.2%
Multi Attached 46,834 28,015 59.8% 15,253 32.6% 2,998 6.4% 567 1.2%
Apartment Sui te 64,409 45,416 70.5% 15,960 24.8% 2,089 3.2% 944 1.5%
BUILDING CODE ERA
2010‐2017 37,645 14,283 37.9% 21,527 57.2% 949 2.5% 887 2.4%
1990‐2009 89,181 57,255 64.2% 23,443 26.3% 5,781 6.5% 2,703 3.0%
1970‐1989 161,749 95,770 59.2% 48,787 30.2% 12,410 7.7% 4,782 3.0%
1950‐1969 110,314 61,988 56.2% 38,176 34.6% 7,770 7.0% 2,380 2.2%
Pre 1950 85,922 53,802 62.6% 24,684 28.7% 4,892 5.7% 2,544 3.0%
SPACE HEAT FUEL
Electric Heat 191,639 117,117 61.1% 59,279 30.9% 10,228 5.3% 5,016 2.6%
Natura l Gas Heat 249,938 134,436 53.8% 86,579 34.6% 20,786 8.3% 8,136 3.3%
Other Fuel 6,945 4,422 63.7% 2,523 36.3% 0 0.0% 0 0.0%
Shared (No Heat on Bi l l ) 36,289 27,122 74.7% 8,236 22.7% 787 2.2% 143 0.4%
PEOPLE PER HOUSEHOLD
One 124,779 82,685 66.3% 33,130 26.6% 6,287 5.0% 2,678 2.1%
Two 221,729 125,083 56.4% 72,994 32.9% 17,004 7.7% 6,649 3.0%
Three 60,069 33,137 55.2% 20,906 34.8% 3,921 6.5% 2,105 3.5%
Four 48,897 26,098 53.4% 18,179 37.2% 3,110 6.4% 1,510 3.1%
Five + 29,337 16,094 54.9% 11,409 38.9% 1,480 5.0% 354 1.2%
HOUSEHOLD INCOME
Less Than $25,000 59,481 39,963 67.2% 16,086 27.0% 2,099 3.5% 1,334 2.2%
$25,000 ‐ $49,999 137,082 88,819 64.8% 35,825 26.1% 8,854 6.5% 3,585 2.6%
$50,000 ‐ $74,999 123,824 69,689 56.3% 41,401 33.4% 9,160 7.4% 3,574 2.9%
$75,000 ‐ $99,999 66,780 35,135 52.6% 25,236 37.8% 4,366 6.5% 2,043 3.1%
$100,000 + 97,644 49,492 50.7% 38,070 39.0% 7,323 7.5% 2,759 2.8%
WINNIPEG LICO‐125 CLASS
Yes 158,987 103,238 64.9% 43,735 27.5% 7,899 5.0% 4,115 2.6%
No 325,824 179,859 55.2% 112,882 34.6% 23,903 7.3% 9,181 2.8%
INDIGENOUS SELF‐DECLARED ANCESTRY
Yes 51,429 31,935 62.1% 14,914 29.0% 3,660 7.1% 920 1.8%
No 409,630 235,934 57.6% 135,381 33.0% 26,710 6.5% 11,606 2.8%
Undeclared 23,751 15,228 64.1% 6,322 26.6% 1,431 6.0% 770 3.2%
FIRST NATION ON RESERVE
FIRST NATION ON RESERVE 15,456 9,851 63.7% 4,269 27.6% 746 4.8% 591 3.8%
BILL PAYMENT RATING
Excel lent 439,339 253,562 57.7% 143,507 32.7% 29,995 6.8% 12,276 2.8%
Sati s factory 22,395 14,501 64.8% 6,265 28.0% 989 4.4% 639 2.9%
Poor 23,077 15,035 65.2% 6,845 29.7% 817 3.5% 380 1.6%
DWELLING OWNERSHIP
Own 404,316 225,976 55.9% 135,931 33.6% 30,234 7.5% 12,174 3.0%
Rent / Other 80,495 57,121 71.0% 20,685 25.7% 1,567 1.9% 1,122 1.4%
2017 RESIDENTIAL SURVEY SECTION 8 ‐ DEMAND SIDE MANAGEMENT ‐ REFERENCE TABLE 8.02c
INFLUENCE OF MANITOBA HYDRO'S DSM PROGRAM TO BUY A NEW REFRIGERATOR
Centra Gas Manitoba Inc. 2019/20 General Rate Application Appendix 7.7
March 22, 2019 Page 135 of 228

128
8.02d Influence of Manitoba Hydro’s DSM Program to Buy a New Freezer
TOTAL
DID NOT
INSTALL/BUY %
DID NOT
INFLUENCE %
SOMEWHAT
INFLUENCED %
STRONGLY
INFLUENCED %
OVERALL 484,811 358,100 73.9% 103,465 21.3% 16,325 3.4% 6,921 1.4%
FUEL AREA
Winnipeg City 261,760 195,025 74.5% 54,089 20.7% 8,471 3.2% 4,174 1.6%
Gas Avai lable 140,021 99,829 71.3% 33,750 24.1% 5,222 3.7% 1,220 0.9%
No Gas Avai lable 83,030 63,246 76.2% 15,626 18.8% 2,631 3.2% 1,527 1.8%
DWELLING TYPE
Single Detached 373,568 265,332 71.0% 87,505 23.4% 14,538 3.9% 6,193 1.7%
Multi Attached 46,834 36,842 78.7% 8,593 18.3% 983 2.1% 415 0.9%
Apartment Sui te 64,409 55,927 86.8% 7,367 11.4% 803 1.2% 312 0.5%
BUILDING CODE ERA
2010‐2017 37,645 25,965 69.0% 10,621 28.2% 815 2.2% 245 0.7%
1990‐2009 89,181 67,558 75.8% 17,363 19.5% 2,598 2.9% 1,663 1.9%
1970‐1989 161,749 119,086 73.6% 33,555 20.7% 6,427 4.0% 2,681 1.7%
1950‐1969 110,314 80,050 72.6% 24,383 22.1% 4,319 3.9% 1,562 1.4%
Pre 1950 85,922 65,442 76.2% 17,544 20.4% 2,165 2.5% 771 0.9%
SPACE HEAT FUEL
Electric Heat 191,639 147,547 77.0% 36,744 19.2% 4,503 2.3% 2,846 1.5%
Natura l Gas Heat 249,938 174,194 69.7% 60,487 24.2% 11,182 4.5% 4,075 1.6%
Other Fuel 6,945 4,938 71.1% 2,007 28.9% 0 0.0% 0 0.0%
Shared (No Heat on Bi l l ) 36,289 31,423 86.6% 4,226 11.6% 640 1.8% 0 0.0%
PEOPLE PER HOUSEHOLD
One 124,779 102,251 81.9% 18,912 15.2% 2,729 2.2% 887 0.7%
Two 221,729 157,796 71.2% 50,853 22.9% 8,637 3.9% 4,443 2.0%
Three 60,069 43,295 72.1% 13,417 22.3% 2,306 3.8% 1,051 1.7%
Four 48,897 34,841 71.3% 12,005 24.6% 1,718 3.5% 332 0.7%
Five + 29,337 19,917 67.9% 8,277 28.2% 934 3.2% 208 0.7%
HOUSEHOLD INCOME
Less Than $25,000 59,481 49,832 83.8% 7,751 13.0% 1,045 1.8% 852 1.4%
$25,000 ‐ $49,999 137,082 105,763 77.2% 24,819 18.1% 4,865 3.5% 1,635 1.2%
$50,000 ‐ $74,999 123,824 89,534 72.3% 28,507 23.0% 3,948 3.2% 1,836 1.5%
$75,000 ‐ $99,999 66,780 46,424 69.5% 16,667 25.0% 2,334 3.5% 1,355 2.0%
$100,000 + 97,644 66,547 68.2% 25,721 26.3% 4,132 4.2% 1,244 1.3%
WINNIPEG LICO‐125 CLASS
Yes 158,987 126,132 79.3% 26,600 16.7% 4,396 2.8% 1,858 1.2%
No 325,824 231,968 71.2% 76,865 23.6% 11,928 3.7% 5,063 1.6%
INDIGENOUS SELF‐DECLARED ANCESTRY
Yes 51,429 39,923 77.6% 8,891 17.3% 1,941 3.8% 674 1.3%
No 409,630 301,297 73.6% 89,113 21.8% 13,399 3.3% 5,821 1.4%
Undeclared 23,751 16,880 71.1% 5,460 23.0% 985 4.1% 426 1.8%
FIRST NATION ON RESERVE
FIRST NATION ON RESERVE 15,456 12,262 79.3% 2,324 15.0% 466 3.0% 404 2.6%
BILL PAYMENT RATING
Excel lent 439,339 322,326 73.4% 95,533 21.7% 15,136 3.4% 6,343 1.4%
Satis factory 22,395 17,175 76.7% 4,199 18.7% 661 3.0% 360 1.6%
Poor 23,077 18,599 80.6% 3,733 16.2% 528 2.3% 218 0.9%
DWELLING OWNERSHIP
Own 404,316 290,676 71.9% 92,257 22.8% 14,991 3.7% 6,393 1.6%
Rent / Other 80,495 67,425 83.8% 11,208 13.9% 1,334 1.7% 528 0.7%
2017 RESIDENTIAL SURVEY SECTION 8 ‐ DEMAND SIDE MANAGEMENT ‐ REFERENCE TABLE 8.02d
INFLUENCE OF MANITOBA HYDRO'S DSM PROGRAM TO BUY A NEW FREEZER
Centra Gas Manitoba Inc. 2019/20 General Rate Application Appendix 7.7
March 22, 2019 Page 136 of 228

129
8.02e Influence of Manitoba Hydro’s DSM Program to Buy a New Clothes Washer
TOTAL
DID NOT
INSTALL/BUY %
DID NOT
INFLUENCE %
SOMEWHAT
INFLUENCED %
STRONGLY
INFLUENCED %
OVERALL 484,811 301,690 62.2% 146,511 30.2% 24,849 5.1% 11,761 2.4%
FUEL AREA
Winnipeg City 261,760 164,029 62.7% 76,019 29.0% 14,133 5.4% 7,579 2.9%
Gas Avai lable 140,021 84,165 60.1% 47,157 33.7% 6,410 4.6% 2,289 1.6%
No Gas Avai lable 83,030 53,496 64.4% 23,335 28.1% 4,306 5.2% 1,893 2.3%
DWELLING TYPE
Single Detached 373,568 221,301 59.2% 121,160 32.4% 21,213 5.7% 9,893 2.6%
Multi Attached 46,834 29,644 63.3% 14,125 30.2% 2,035 4.3% 1,030 2.2%
Apartment Sui te 64,409 50,745 78.8% 11,226 17.4% 1,601 2.5% 838 1.3%
BUILDING CODE ERA
2010‐2017 37,645 15,564 41.3% 20,453 54.3% 1,054 2.8% 574 1.5%
1990‐2009 89,181 56,018 62.8% 25,177 28.2% 5,251 5.9% 2,736 3.1%
1970‐1989 161,749 102,540 63.4% 45,411 28.1% 9,458 5.8% 4,339 2.7%
1950‐1969 110,314 70,012 63.5% 32,135 29.1% 5,749 5.2% 2,418 2.2%
Pre 1950 85,922 57,557 67.0% 23,335 27.2% 3,337 3.9% 1,693 2.0%
SPACE HEAT FUEL
Electric Heat 191,639 123,032 64.2% 56,136 29.3% 8,305 4.3% 4,166 2.2%
Natura l Gas Heat 249,938 144,271 57.7% 82,605 33.1% 15,757 6.3% 7,304 2.9%
Other Fuel 6,945 4,045 58.2% 2,900 41.8% 0 0.0% 0 0.0%
Shared (No Heat on Bi l l ) 36,289 30,343 83.6% 4,869 13.4% 787 2.2% 290 0.8%
PEOPLE PER HOUSEHOLD
One 124,779 91,695 73.5% 26,837 21.5% 4,243 3.4% 2,004 1.6%
Two 221,729 132,693 59.8% 70,523 31.8% 12,740 5.7% 5,773 2.6%
Three 60,069 34,052 56.7% 19,964 33.2% 4,061 6.8% 1,992 3.3%
Four 48,897 27,182 55.6% 17,533 35.9% 2,810 5.7% 1,371 2.8%
Five + 29,337 16,069 54.8% 11,653 39.7% 994 3.4% 620 2.1%
HOUSEHOLD INCOME
Less Than $25,000 59,481 44,827 75.4% 11,933 20.1% 1,731 2.9% 990 1.7%
$25,000 ‐ $49,999 137,082 93,668 68.3% 32,917 24.0% 6,838 5.0% 3,659 2.7%
$50,000 ‐ $74,999 123,824 71,878 58.0% 41,881 33.8% 6,918 5.6% 3,147 2.5%
$75,000 ‐ $99,999 66,780 38,036 57.0% 24,648 36.9% 2,918 4.4% 1,179 1.8%
$100,000 + 97,644 53,281 54.6% 35,133 36.0% 6,444 6.6% 2,787 2.9%
WINNIPEG LICO‐125 CLASS
Yes 158,987 111,619 70.2% 36,240 22.8% 7,145 4.5% 3,983 2.5%
No 325,824 190,071 58.3% 110,271 33.8% 17,704 5.4% 7,778 2.4%
INDIGENOUS SELF‐DECLARED ANCESTRY
Yes 51,429 33,961 66.0% 13,359 26.0% 3,137 6.1% 972 1.9%
No 409,630 253,361 61.9% 125,591 30.7% 20,534 5.0% 10,144 2.5%
Undeclared 23,751 14,368 60.5% 7,561 31.8% 1,177 5.0% 644 2.7%
FIRST NATION ON RESERVE
FIRST NATION ON RESERVE 15,456 9,724 62.9% 4,265 27.6% 876 5.7% 591 3.8%
BILL PAYMENT RATING
Excel lent 439,339 271,469 61.8% 134,243 30.6% 22,599 5.1% 11,028 2.5%
Satis factory 22,395 14,782 66.0% 6,313 28.2% 877 3.9% 422 1.9%
Poor 23,077 15,439 66.9% 5,955 25.8% 1,372 5.9% 311 1.3%
DWELLING OWNERSHIP
Own 404,316 242,165 59.9% 128,541 31.8% 23,033 5.7% 10,578 2.6%
Rent / Other 80,495 59,525 73.9% 17,970 22.3% 1,816 2.3% 1,183 1.5%
2017 RESIDENTIAL SURVEY SECTION 8 ‐ DEMAND SIDE MANAGEMENT ‐ REFERENCE TABLE 8.02e
INFLUENCE OF MANITOBA HYDRO'S DSM PROGRAM TO BUY A NEW CLOTHES WASHER
Centra Gas Manitoba Inc. 2019/20 General Rate Application Appendix 7.7
March 22, 2019 Page 137 of 228

130
8.02f Influence of Manitoba Hydro’s DSM Program to Buy a Wi‐fi Thermostat
TOTAL
DID NOT
INSTALL/BUY %
DID NOT
INFLUENCE %
SOMEWHAT
INFLUENCED %
STRONGLY
INFLUENCED %
OVERALL 484,811 414,179 85.4% 55,947 11.5% 6,911 1.4% 7,775 1.6%
FUEL AREA
Winnipeg City 261,760 219,710 83.9% 33,049 12.6% 4,461 1.7% 4,541 1.7%
Gas Avai lable 140,021 121,392 86.7% 15,303 10.9% 1,600 1.1% 1,726 1.2%
No Gas Avai lable 83,030 73,076 88.0% 7,595 9.1% 850 1.0% 1,509 1.8%
DWELLING TYPE
Single Detached 373,568 311,917 83.5% 49,126 13.2% 5,862 1.6% 6,662 1.8%
Multi Attached 46,834 41,842 89.3% 4,269 9.1% 723 1.5% 0 0.0%
Apartment Sui te 64,409 60,420 93.8% 2,551 4.0% 326 0.5% 1,113 1.7%
BUILDING CODE ERA
2010‐2017 37,645 30,045 79.8% 5,493 14.6% 1,295 3.4% 812 2.2%
1990‐2009 89,181 74,325 83.3% 11,765 13.2% 1,277 1.4% 1,814 2.0%
1970‐1989 161,749 143,454 88.7% 14,607 9.0% 2,042 1.3% 1,647 1.0%
1950‐1969 110,314 91,365 82.8% 15,003 13.6% 1,621 1.5% 2,325 2.1%
Pre 1950 85,922 74,990 87.3% 9,078 10.6% 676 0.8% 1,177 1.4%
SPACE HEAT FUEL
Electric Heat 191,639 171,442 89.5% 15,700 8.2% 1,645 0.9% 2,852 1.5%
Natura l Gas Heat 249,938 203,383 81.4% 37,153 14.9% 5,266 2.1% 4,136 1.7%
Other Fuel 6,945 6,476 93.3% 469 6.7% 0 0.0% 0 0.0%
Shared (No Heat on Bi l l ) 36,289 32,877 90.6% 2,625 7.2% 0 0.0% 787 2.2%
PEOPLE PER HOUSEHOLD
One 124,779 113,040 90.6% 10,067 8.1% 720 0.6% 952 0.8%
Two 221,729 188,537 85.0% 26,572 12.0% 2,929 1.3% 3,692 1.7%
Three 60,069 50,021 83.3% 7,144 11.9% 1,595 2.7% 1,309 2.2%
Four 48,897 38,780 79.3% 7,735 15.8% 1,291 2.6% 1,091 2.2%
Five + 29,337 23,800 81.1% 4,428 15.1% 376 1.3% 732 2.5%
HOUSEHOLD INCOME
Less Than $25,000 59,481 55,930 94.0% 2,665 4.5% 490 0.8% 396 0.7%
$25,000 ‐ $49,999 137,082 122,312 89.2% 12,268 8.9% 1,251 0.9% 1,251 0.9%
$50,000 ‐ $74,999 123,824 104,751 84.6% 15,122 12.2% 1,615 1.3% 2,336 1.9%
$75,000 ‐ $99,999 66,780 55,697 83.4% 8,682 13.0% 1,297 1.9% 1,104 1.7%
$100,000 + 97,644 75,489 77.3% 17,209 17.6% 2,258 2.3% 2,688 2.8%
WINNIPEG LICO‐125 CLASS
Yes 158,987 143,785 90.4% 11,754 7.4% 1,856 1.2% 1,592 1.0%
No 325,824 270,394 83.0% 44,192 13.6% 5,055 1.6% 6,183 1.9%
INDIGENOUS SELF‐DECLARED ANCESTRY
Yes 51,429 45,191 87.9% 4,769 9.3% 692 1.3% 777 1.5%
No 409,630 348,838 85.2% 48,372 11.8% 5,754 1.4% 6,666 1.6%
Undeclared 23,751 20,150 84.8% 2,805 11.8% 465 2.0% 332 1.4%
FIRST NATION ON RESERVE
FIRST NATION ON RESERVE 15,456 13,964 90.3% 933 6.0% 249 1.6% 311 2.0%
BILL PAYMENT RATING
Excel lent 439,339 373,232 85.0% 52,874 12.0% 5,977 1.4% 7,256 1.7%
Satis factory 22,395 19,805 88.4% 1,771 7.9% 508 2.3% 311 1.4%
Poor 23,077 21,142 91.6% 1,302 5.6% 425 1.8% 208 0.9%
DWELLING OWNERSHIP
Own 404,316 339,261 83.9% 52,025 12.9% 6,619 1.6% 6,412 1.6%
Rent / Other 80,495 74,918 93.1% 3,922 4.9% 292 0.4% 1,363 1.7%
2017 RESIDENTIAL SURVEY SECTION 8 ‐ DEMAND SIDE MANAGEMENT ‐ REFERENCE TABLE 8.02f
INFLUENCE OF MANITOBA HYDRO'S DSM PROGRAM TO BUY A WI‐FI THERMOSTAT
Centra Gas Manitoba Inc. 2019/20 General Rate Application Appendix 7.7
March 22, 2019 Page 138 of 228

131
8.03 What Has Been Done to Your Home to Reduce Energy Use
TOTAL
ALL THAT
CAN BE
DONE %
MOST OF
WHAT CAN BE
DONE %
HALF OF
WHAT CAN
BE DONE %
NOT MUCH
HAS BEEN
DONE %
NOTHING
HAS BEEN
DONE %
OVERALL 484,811 35,327 7.3% 124,862 25.8% 142,720 29.4% 101,825 21.0% 80,076 16.5%
FUEL AREA
Winnipeg City 261,760 17,226 6.6% 65,790 25.1% 85,112 32.5% 50,358 19.2% 43,274 16.5%
Gas Avai lable 140,021 11,279 8.1% 39,180 28.0% 36,905 26.4% 31,987 22.8% 20,669 14.8%
No Gas Avai lable 83,030 6,823 8.2% 19,892 24.0% 20,703 24.9% 19,479 23.5% 16,133 19.4%
DWELLING TYPE
Single Detached 373,568 24,787 6.6% 108,576 29.1% 117,862 31.6% 80,422 21.5% 41,921 11.2%
Multi Attached 46,834 4,191 8.9% 7,563 16.1% 13,362 28.5% 10,571 22.6% 11,148 23.8%
Apartment Sui te 64,409 6,350 9.9% 8,723 13.5% 11,497 17.9% 10,832 16.8% 27,007 41.9%
BUILDING CODE ERA
2010‐2017 37,645 4,218 11.2% 12,272 32.6% 7,280 19.3% 4,631 12.3% 9,243 24.6%
1990‐2009 89,181 7,202 8.1% 21,443 24.0% 23,371 26.2% 20,275 22.7% 16,890 18.9%
1970‐1989 161,749 11,459 7.1% 40,454 25.0% 49,255 30.5% 34,349 21.2% 26,231 16.2%
1950‐1969 110,314 7,273 6.6% 29,331 26.6% 36,833 33.4% 21,618 19.6% 15,261 13.8%
Pre 1950 85,922 5,176 6.0% 21,362 24.9% 25,982 30.2% 20,951 24.4% 12,451 14.5%
SPACE HEAT FUEL
Electric Heat 191,639 15,389 8.0% 48,037 25.1% 47,127 24.6% 40,802 21.3% 40,284 21.0%
Natura l Gas Heat 249,938 15,064 6.0% 73,006 29.2% 86,355 34.6% 51,956 20.8% 23,557 9.4%
Other Fuel 6,945 893 12.9% 1,071 15.4% 1,231 17.7% 2,813 40.5% 937 13.5%
Shared (No Heat on Bi l l ) 36,289 3,982 11.0% 2,748 7.6% 8,008 22.1% 6,253 17.2% 15,298 42.2%
PEOPLE PER HOUSEHOLD
One 124,779 10,498 8.4% 25,098 20.1% 34,551 27.7% 22,757 18.2% 31,875 25.5%
Two 221,729 18,194 8.2% 65,533 29.6% 60,068 27.1% 47,211 21.3% 30,723 13.9%
Three 60,069 3,568 5.9% 14,837 24.7% 22,058 36.7% 13,622 22.7% 5,984 10.0%
Four 48,897 2,085 4.3% 12,433 25.4% 18,022 36.9% 10,987 22.5% 5,369 11.0%
Five + 29,337 982 3.3% 6,961 23.7% 8,021 27.3% 7,247 24.7% 6,124 20.9%
HOUSEHOLD INCOME
Less Than $25,000 59,481 6,714 11.3% 8,820 14.8% 12,703 21.4% 11,980 20.1% 19,265 32.4%
$25,000 ‐ $49,999 137,082 11,121 8.1% 34,303 25.0% 36,320 26.5% 27,356 20.0% 27,982 20.4%
$50,000 ‐ $74,999 123,824 8,545 6.9% 32,675 26.4% 39,758 32.1% 25,850 20.9% 16,996 13.7%
$75,000 ‐ $99,999 66,780 3,961 5.9% 17,683 26.5% 21,734 32.5% 15,574 23.3% 7,829 11.7%
$100,000 + 97,644 4,987 5.1% 31,382 32.1% 32,206 33.0% 21,064 21.6% 8,005 8.2%
WINNIPEG LICO‐125 CLASS
Yes 158,987 13,721 8.6% 33,126 20.8% 39,620 24.9% 32,440 20.4% 40,080 25.2%
No 325,824 21,607 6.6% 91,736 28.2% 103,101 31.6% 69,385 21.3% 39,996 12.3%
INDIGENOUS SELF‐DECLARED ANCESTRY
Yes 51,429 3,227 6.3% 9,388 18.3% 12,937 25.2% 11,096 21.6% 14,781 28.7%
No 409,630 29,993 7.3% 109,346 26.7% 123,160 30.1% 86,556 21.1% 60,576 14.8%
Undeclared 23,751 2,107 8.9% 6,129 25.8% 6,623 27.9% 4,172 17.6% 4,720 19.9%
FIRST NATION ON RESERVE
FIRST NATION ON RESERVE 15,456 1,785 11.5% 1,753 11.3% 3,159 20.4% 3,053 19.8% 5,707 36.9%
BILL PAYMENT RATING
Excel lent 439,339 32,144 7.3% 118,191 26.9% 131,936 30.0% 89,135 20.3% 67,933 15.5%
Satis factory 22,395 1,346 6.0% 3,464 15.5% 6,128 27.4% 5,866 26.2% 5,591 25.0%
Poor 23,077 1,838 8.0% 3,207 13.9% 4,656 20.2% 6,824 29.6% 6,552 28.4%
DWELLING OWNERSHIP
Own 404,316 27,665 6.8% 116,717 28.9% 128,462 31.8% 87,660 21.7% 43,813 10.8%
Rent / Other 80,495 7,663 9.5% 8,145 10.1% 14,259 17.7% 14,165 17.6% 36,264 45.1%
2017 RESIDENTIAL SURVEY SECTION 8 ‐ DEMAND SIDE MANAGEMENT ‐ REFERENCE TABLE 8.03
WHAT HAS BEEN DONE TO YOUR HOME TO REDUCE ENERGY USE
Centra Gas Manitoba Inc. 2019/20 General Rate Application Appendix 7.7
March 22, 2019 Page 139 of 228

132
Centra Gas Manitoba Inc. 2019/20 General Rate Application Appendix 7.7
March 22, 2019 Page 140 of 228

133
SECTION 9 BILLS AND RATES
SECTION 9 BILLS AND RATES
Centra Gas Manitoba Inc. 2019/20 General Rate Application Appendix 7.7
March 22, 2019 Page 141 of 228

134
9.01 How Do You Usually Pay Your Manitoba Hydro Bill
TOTAL
IN PERSON AT
MB HYDRO
OFFICE %
IN PERSON AT
MB HYDRO
AGENCY % MAIL %
ON‐
LINE %
PRE‐
AUTHORIZED
PAYMENT % TELEPHONE %
THIRD
PARTY %
OVERALL 484,811 15,377 3.2% 67,615 13.9% 20,384 4.2% 205,656 42.4% 151,129 31.2% 19,433 4.0% 5,217 1.1%
FUEL AREA
Winnipeg City 261,760 4,787 1.8% 32,833 12.5% 7,888 3.0% 121,355 46.4% 81,930 31.3% 11,940 4.6% 1,027 0.4%
Gas Avai lable 140,021 6,128 4.4% 19,480 13.9% 6,692 4.8% 55,193 39.4% 48,246 34.5% 3,928 2.8% 355 0.3%
No Gas Avai lable 83,030 4,462 5.4% 15,302 18.4% 5,805 7.0% 29,108 35.1% 20,953 25.2% 3,565 4.3% 3,835 4.6%
DWELLING TYPE
Single Detached 373,568 11,273 3.0% 51,718 13.8% 15,711 4.2% 158,327 42.4% 117,313 31.4% 14,751 3.9% 4,476 1.2%
Multi Attached 46,834 1,850 4.0% 7,189 15.3% 1,337 2.9% 19,919 42.5% 14,251 30.4% 1,999 4.3% 288 0.6%
Apartment Sui te 64,409 2,253 3.5% 8,709 13.5% 3,336 5.2% 27,409 42.6% 19,565 30.4% 2,684 4.2% 453 0.7%
BUILDING CODE ERA
2010‐2017 37,645 947 2.5% 4,051 10.8% 694 1.8% 20,602 54.7% 10,773 28.6% 177 0.5% 400 1.1%
1990‐2009 89,181 2,961 3.3% 12,124 13.6% 2,523 2.8% 32,942 36.9% 33,597 37.7% 2,717 3.0% 2,317 2.6%
1970‐1989 161,749 4,347 2.7% 20,759 12.8% 8,288 5.1% 69,005 42.7% 48,881 30.2% 9,134 5.6% 1,334 0.8%
1950‐1969 110,314 2,418 2.2% 14,937 13.5% 4,752 4.3% 47,278 42.9% 35,929 32.6% 4,886 4.4% 115 0.1%
Pre 1950 85,922 4,704 5.5% 15,745 18.3% 4,126 4.8% 35,828 41.7% 21,949 25.5% 2,519 2.9% 1,051 1.2%
SPACE HEAT FUEL
Electric Heat 191,639 7,416 3.9% 30,289 15.8% 10,786 5.6% 73,930 38.6% 57,790 30.2% 7,309 3.8% 4,119 2.1%
Natural Gas Heat 249,938 4,752 1.9% 30,626 12.3% 7,426 3.0% 113,142 45.3% 83,666 33.5% 9,650 3.9% 676 0.3%
Other Fuel 6,945 675 9.7% 2,049 29.5% 425 6.1% 1,496 21.5% 1,437 20.7% 734 10.6% 131 1.9%
Shared (No Heat on Bi l l ) 36,289 2,534 7.0% 4,653 12.8% 1,748 4.8% 17,088 47.1% 8,236 22.7% 1,741 4.8% 290 0.8%
PEOPLE PER HOUSEHOLD
One 124,779 5,193 4.2% 22,738 18.2% 6,415 5.1% 39,301 31.5% 43,040 34.5% 6,184 5.0% 1,909 1.5%
Two 221,729 6,197 2.8% 30,702 13.8% 10,567 4.8% 89,156 40.2% 75,534 34.1% 8,405 3.8% 1,168 0.5%
Three 60,069 1,972 3.3% 5,940 9.9% 1,492 2.5% 31,831 53.0% 15,380 25.6% 3,175 5.3% 280 0.5%
Four 48,897 1,237 2.5% 4,551 9.3% 1,216 2.5% 27,197 55.6% 12,646 25.9% 1,153 2.4% 896 1.8%
Five + 29,337 779 2.7% 3,684 12.6% 694 2.4% 18,170 61.9% 4,529 15.4% 516 1.8% 964 3.3%
HOUSEHOLD INCOME
Less Than $25,000 59,481 5,612 9.4% 16,960 28.5% 4,003 6.7% 10,267 17.3% 15,620 26.3% 3,126 5.3% 3,892 6.5%
$25,000 ‐ $49,999 137,082 4,882 3.6% 27,818 20.3% 6,656 4.9% 48,304 35.2% 42,574 31.1% 6,022 4.4% 827 0.6%
$50,000 ‐ $74,999 123,824 1,920 1.6% 13,043 10.5% 5,022 4.1% 58,677 47.4% 39,480 31.9% 5,382 4.3% 301 0.2%
$75,000 ‐ $99,999 66,780 1,640 2.5% 4,489 6.7% 1,351 2.0% 34,664 51.9% 22,209 33.3% 2,261 3.4% 165 0.2%
$100,000 + 97,644 1,323 1.4% 5,305 5.4% 3,353 3.4% 53,744 55.0% 31,246 32.0% 2,643 2.7% 31 0.0%
WINNIPEG LICO‐125 CLASS
Yes 158,987 9,472 6.0% 38,344 24.1% 8,422 5.3% 47,361 29.8% 43,814 27.6% 6,885 4.3% 4,689 2.9%
No 325,824 5,905 1.8% 29,271 9.0% 11,962 3.7% 158,295 48.6% 107,314 32.9% 12,549 3.9% 528 0.2%
INDIGENOUS SELF‐DECLARED ANCESTRY
Yes 51,429 3,367 6.5% 10,038 19.5% 1,812 3.5% 20,463 39.8% 9,597 18.7% 2,007 3.9% 4,145 8.1%
No 409,630 10,988 2.7% 53,116 13.0% 17,179 4.2% 176,176 43.0% 134,898 32.9% 16,547 4.0% 727 0.2%
Undeclared 23,751 1,022 4.3% 4,462 18.8% 1,393 5.9% 9,017 38.0% 6,635 27.9% 879 3.7% 344 1.4%
FIRST NATION ON RESERVE
FIRST NATION ON RESERVE 15,456 1,530 9.9% 5,024 32.5% 317 2.0% 3,686 23.8% 653 4.2% 971 6.3% 3,276 21.2%
BILL PAYMENT RATING
Excel lent 439,339 10,635 2.4% 57,984 13.2% 17,936 4.1% 182,792 41.6% 149,933 34.1% 17,439 4.0% 2,620 0.6%
Satis factory 22,395 1,762 7.9% 4,863 21.7% 1,638 7.3% 10,753 48.0% 1,196 5.3% 1,087 4.9% 1,096 4.9%
Poor 23,077 2,979 12.9% 4,768 20.7% 811 3.5% 12,110 52.5% 0 0.0% 908 3.9% 1,501 6.5%
DWELLING OWNERSHIP
Own 404,316 10,990 2.7% 52,273 12.9% 16,918 4.2% 171,088 42.3% 135,312 33.5% 16,175 4.0% 1,560 0.4%
Rent / Other 80,495 4,387 5.4% 15,343 19.1% 3,466 4.3% 34,568 42.9% 15,817 19.6% 3,258 4.0% 3,656 4.5%
2017 RESIDENTIAL SURVEY SECTION 9 ‐ BILLS AND RATES ‐ REFERENCE TABLE 9.01
HOW DO YOU USUALLY PAY YOUR MANITOBA HYRDO BILL
Centra Gas Manitoba Inc. 2019/20 General Rate Application Appendix 7.7
March 22, 2019 Page 142 of 228

135
9.02 How Often Do You Check Your Energy Bill
TOTAL EVERY MONTH %
EVERY TWO
MONTHS %
1 TO 4 TIMES
PER YEAR % NEVER CHECK %
OVERALL 484,811 371,398 76.6% 30,856 6.4% 51,701 10.7% 30,857 6.4%
FUEL AREA
Winnipeg City 261,760 195,077 74.5% 18,916 7.2% 29,152 11.1% 18,615 7.1%
Gas Avai lable 140,021 110,181 78.7% 7,689 5.5% 14,856 10.6% 7,295 5.2%
No Gas Avai lable 83,030 66,139 79.7% 4,251 5.1% 7,693 9.3% 4,947 6.0%
DWELLING TYPE
Single Detached 373,568 290,951 77.9% 20,137 5.4% 42,356 11.3% 20,124 5.4%
Multi Attached 46,834 36,102 77.1% 2,806 6.0% 4,097 8.7% 3,829 8.2%
Apartment Suite 64,409 44,345 68.8% 7,912 12.3% 5,248 8.1% 6,904 10.7%
BUILDING CODE ERA
2010‐2017 37,645 30,596 81.3% 2,486 6.6% 3,001 8.0% 1,562 4.2%
1990‐2009 89,181 66,096 74.1% 4,327 4.9% 13,263 14.9% 5,495 6.2%
1970‐1989 161,749 125,966 77.9% 10,218 6.3% 14,815 9.2% 10,749 6.6%
1950‐1969 110,314 82,238 74.5% 8,942 8.1% 11,526 10.4% 7,608 6.9%
Pre 1950 85,922 66,502 77.4% 4,882 5.7% 9,096 10.6% 5,442 6.3%
SPACE HEAT FUEL
Electri c Heat 191,639 154,247 80.5% 10,451 5.5% 16,892 8.8% 10,048 5.2%
Natura l Gas Heat 249,938 191,897 76.8% 13,465 5.4% 30,483 12.2% 14,093 5.6%
Other Fuel 6,945 3,441 49.6% 1,758 25.3% 1,277 18.4% 469 6.7%
Shared (No Heat on Bi l l ) 36,289 21,812 60.1% 5,181 14.3% 3,048 8.4% 6,247 17.2%
PEOPLE PER HOUSEHOLD
One 124,779 93,321 74.8% 8,987 7.2% 11,227 9.0% 11,245 9.0%
Two 221,729 176,120 79.4% 12,707 5.7% 21,843 9.9% 11,059 5.0%
Three 60,069 45,788 76.2% 4,126 6.9% 7,580 12.6% 2,575 4.3%
Four 48,897 33,813 69.2% 3,506 7.2% 7,962 16.3% 3,615 7.4%
Five + 29,337 22,355 76.2% 1,529 5.2% 3,089 10.5% 2,364 8.1%
HOUSEHOLD INCOME
Less Than $25,000 59,481 43,491 73.1% 4,779 8.0% 4,700 7.9% 6,511 10.9%
$25,000 ‐ $49,999 137,082 110,196 80.4% 7,067 5.2% 12,392 9.0% 7,428 5.4%
$50,000 ‐ $74,999 123,824 96,848 78.2% 7,982 6.4% 12,537 10.1% 6,457 5.2%
$75,000 ‐ $99,999 66,780 50,657 75.9% 3,582 5.4% 8,614 12.9% 3,927 5.9%
$100,000 + 97,644 70,205 71.9% 7,447 7.6% 13,459 13.8% 6,533 6.7%
WINNIPEG LICO‐125 CLASS
Yes 158,987 123,302 77.6% 10,591 6.7% 13,689 8.6% 11,405 7.2%
No 325,824 248,096 76.1% 20,265 6.2% 38,012 11.7% 19,452 6.0%
INDIGENOUS SELF‐DECLARED ANCESTRY
Yes 51,429 37,702 73.3% 2,866 5.6% 5,517 10.7% 5,344 10.4%
No 409,630 315,782 77.1% 26,770 6.5% 43,194 10.5% 23,884 5.8%
Undeclared 23,751 17,914 75.4% 1,220 5.1% 2,989 12.6% 1,629 6.9%
FIRST NATION ON RESERVE
FIRST NATION ON RESERVE 15,456 10,780 69.7% 629 4.1% 2,106 13.6% 1,941 12.6%
BILL PAYMENT RATING
Excel lent 439,339 339,247 77.2% 27,626 6.3% 44,753 10.2% 27,713 6.3%
Satis factory 22,395 16,665 74.4% 1,043 4.7% 3,213 14.3% 1,474 6.6%
Poor 23,077 15,485 67.1% 2,187 9.5% 3,735 16.2% 1,670 7.2%
DWELLING OWNERSHIP
Own 404,316 313,936 77.6% 22,610 5.6% 46,101 11.4% 21,669 5.4%
Rent / Other 80,495 57,462 71.4% 8,246 10.2% 5,599 7.0% 9,187 11.4%
2017 RESIDENTIAL SURVEY SECTION 9 ‐ BILLS AND RATES ‐ REFERENCE TABLE 9.02
HOW OFTEN DO YOU CHECK YOUR ENERGY BILL
Centra Gas Manitoba Inc. 2019/20 General Rate Application Appendix 7.7
March 22, 2019 Page 143 of 228

136
9.03 Awareness of Manitoba Hydro's My Bill
TOTAL YES % NO %
OVERALL 484,811 139,093 28.7% 345,718 71.3%
FUEL AREA
Winnipeg City 261,760 90,120 34.4% 171,640 65.6%
Gas Avai lable 140,021 32,433 23.2% 107,588 76.8%
No Gas Avai lable 83,030 16,541 19.9% 66,489 80.1%
DWELLING TYPE
Single Detached 373,568 105,276 28.2% 268,292 71.8%
Multi Attached 46,834 11,885 25.4% 34,949 74.6%
Apartment Sui te 64,409 21,933 34.1% 42,476 65.9%
BUILDING CODE ERA
2010‐2017 37,645 12,938 34.4% 24,707 65.6%
1990‐2009 89,181 25,753 28.9% 63,428 71.1%
1970‐1989 161,749 44,607 27.6% 117,142 72.4%
1950‐1969 110,314 32,628 29.6% 77,686 70.4%
Pre 1950 85,922 23,168 27.0% 62,754 73.0%
SPACE HEAT FUEL
Electric Heat 191,639 44,485 23.2% 147,154 76.8%
Natura l Gas Heat 249,938 81,062 32.4% 168,876 67.6%
Other Fuel 6,945 1,568 22.6% 5,377 77.4%
Shared (No Heat on Bi l l ) 36,289 11,979 33.0% 24,310 67.0%
PEOPLE PER HOUSEHOLD
One 124,779 29,515 23.7% 95,265 76.3%
Two 221,729 63,541 28.7% 158,188 71.3%
Three 60,069 19,270 32.1% 40,800 67.9%
Four 48,897 18,269 37.4% 30,627 62.6%
Five + 29,337 8,499 29.0% 20,838 71.0%
HOUSEHOLD INCOME
Less Than $25,000 59,481 6,054 10.2% 53,426 89.8%
$25,000 ‐ $49,999 137,082 27,280 19.9% 109,802 80.1%
$50,000 ‐ $74,999 123,824 41,629 33.6% 82,195 66.4%
$75,000 ‐ $99,999 66,780 23,064 34.5% 43,716 65.5%
$100,000 + 97,644 41,066 42.1% 56,578 57.9%
WINNIPEG LICO‐125 CLASS
Yes 158,987 25,010 15.7% 133,977 84.3%
No 325,824 114,083 35.0% 211,741 65.0%
INDIGENOUS SELF‐DECLARED ANCESTRY
Yes 51,429 9,718 18.9% 41,711 81.1%
No 409,630 124,342 30.4% 285,288 69.6%
Undeclared 23,751 5,033 21.2% 18,718 78.8%
FIRST NATION ON RESERVE
FIRST NATION ON RESERVE 15,456 1,032 6.7% 14,424 93.3%
BILL PAYMENT RATING
Excel lent 439,339 130,763 29.8% 308,576 70.2%
Satis factory 22,395 5,106 22.8% 17,289 77.2%
Poor 23,077 3,224 14.0% 19,853 86.0%
DWELLING OWNERSHIP
Own 404,316 117,139 29.0% 287,177 71.0%
Rent / Other 80,495 21,954 27.3% 58,541 72.7%
2017 RESIDENTIAL SURVEY SECTION 9 ‐ BILLS AND RATES ‐ REFERENCE TABLE 9.03
AWARENESS OF MANITOBA HYDRO'S MYBILL
Centra Gas Manitoba Inc. 2019/20 General Rate Application Appendix 7.7
March 22, 2019 Page 144 of 228

137
9.04 Interest in Receiving Your Hydro Bill by Email
TOTAL YES % NO %
NOT
SURE %
ALREADY
DO
NO
INTERNET %
OVERALL 484,811 38,499 7.9% 236,773 48.8% 38,916 8.0% 148,787 30.7% 21,836 4.5%
FUEL AREA
Winnipeg City 261,760 20,599 7.9% 119,828 45.8% 20,272 7.7% 93,878 35.9% 7,182 2.7%
Gas Avai lable 140,021 11,983 8.6% 72,985 52.1% 11,559 8.3% 36,572 26.1% 6,922 4.9%
No Gas Avai lable 83,030 5,917 7.1% 43,960 52.9% 7,084 8.5% 18,337 22.1% 7,732 9.3%
DWELLING TYPE
Single Detached 373,568 28,303 7.6% 183,949 49.2% 32,523 8.7% 111,716 29.9% 17,077 4.6%
Multi Attached 46,834 5,001 10.7% 25,619 54.7% 2,884 6.2% 12,448 26.6% 883 1.9%
Apartment Sui te 64,409 5,195 8.1% 27,206 42.2% 3,509 5.4% 24,623 38.2% 3,876 6.0%
BUILDING CODE ERA
2010‐2017 37,645 4,468 11.9% 15,585 41.4% 2,809 7.5% 13,882 36.9% 901 2.4%
1990‐2009 89,181 8,558 9.6% 43,791 49.1% 5,648 6.3% 27,706 31.1% 3,478 3.9%
1970‐1989 161,749 12,036 7.4% 80,325 49.7% 14,580 9.0% 47,831 29.6% 6,977 4.3%
1950‐1969 110,314 7,305 6.6% 53,407 48.4% 8,565 7.8% 35,088 31.8% 5,950 5.4%
Pre 1950 85,922 6,132 7.1% 43,665 50.8% 7,314 8.5% 24,281 28.3% 4,530 5.3%
SPACE HEAT FUEL
Electric Heat 191,639 17,011 8.9% 97,812 51.0% 15,028 7.8% 49,816 26.0% 11,970 6.2%
Natural Gas Heat 249,938 19,198 7.7% 118,553 47.4% 21,617 8.6% 84,376 33.8% 6,195 2.5%
Other Fuel 6,945 0 0.0% 2,592 37.3% 530 7.6% 2,036 29.3% 1,786 25.7%
Shared (No Heat on Bi l l ) 36,289 2,290 6.3% 17,815 49.1% 1,741 4.8% 12,559 34.6% 1,884 5.2%
PEOPLE PER HOUSEHOLD
One 124,779 8,087 6.5% 63,733 51.1% 8,048 6.4% 32,780 26.3% 12,132 9.7%
Two 221,729 16,085 7.3% 112,165 50.6% 17,455 7.9% 68,621 30.9% 7,403 3.3%
Three 60,069 4,927 8.2% 28,144 46.9% 5,396 9.0% 20,211 33.6% 1,392 2.3%
Four 48,897 6,037 12.3% 19,103 39.1% 4,700 9.6% 18,584 38.0% 473 1.0%
Five + 29,337 3,363 11.5% 13,629 46.5% 3,317 11.3% 8,592 29.3% 435 1.5%
HOUSEHOLD INCOME
Less Than $25,000 59,481 3,373 5.7% 35,339 59.4% 4,177 7.0% 7,940 13.3% 8,652 14.5%
$25,000 ‐ $49,999 137,082 10,246 7.5% 76,794 56.0% 9,243 6.7% 30,485 22.2% 10,314 7.5%
$50,000 ‐ $74,999 123,824 8,573 6.9% 58,297 47.1% 10,068 8.1% 44,648 36.1% 2,238 1.8%
$75,000 ‐ $99,999 66,780 5,808 8.7% 30,235 45.3% 6,680 10.0% 23,627 35.4% 429 0.6%
$100,000 + 97,644 10,499 10.8% 36,108 37.0% 8,747 9.0% 42,087 43.1% 203 0.2%
WINNIPEG LICO‐125 CLASS
Yes 158,987 11,307 7.1% 90,322 56.8% 11,603 7.3% 29,180 18.4% 16,574 10.4%
No 325,824 27,192 8.3% 146,451 44.9% 27,312 8.4% 119,607 36.7% 5,261 1.6%
INDIGENOUS SELF‐DECLARED ANCESTRY
Yes 51,429 5,397 10.5% 27,385 53.2% 4,581 8.9% 10,784 21.0% 3,282 6.4%
No 409,630 31,113 7.6% 195,385 47.7% 32,920 8.0% 132,529 32.4% 17,685 4.3%
Undeclared 23,751 1,989 8.4% 14,004 59.0% 1,415 6.0% 5,475 23.1% 869 3.7%
FIRST NATION ON RESERVE
FIRST NATION ON RESERVE 15,456 1,871 12.1% 8,342 54.0% 1,492 9.7% 1,505 9.7% 2,245 14.5%
BILL PAYMENT RATING
Excel lent 439,339 32,870 7.5% 213,874 48.7% 34,314 7.8% 139,292 31.7% 18,990 4.3%
Satis factory 22,395 2,566 11.5% 11,387 50.8% 2,018 9.0% 5,598 25.0% 826 3.7%
Poor 23,077 3,063 13.3% 11,512 49.9% 2,584 11.2% 3,898 16.9% 2,020 8.8%
DWELLING OWNERSHIP
Own 404,316 31,371 7.8% 198,101 49.0% 34,288 8.5% 124,489 30.8% 16,068 4.0%
Rent / Other 80,495 7,128 8.9% 38,673 48.0% 4,628 5.7% 24,299 30.2% 5,768 7.2%
2017 RESIDENTIAL SURVEY SECTION 9 ‐ BILLS AND RATES ‐ REFERENCE TABLE 9.04
INTEREST IN RECEIVING YOUR MANITOBA HYDRO BILL BY EMAIL
Centra Gas Manitoba Inc. 2019/20 General Rate Application Appendix 7.7
March 22, 2019 Page 145 of 228
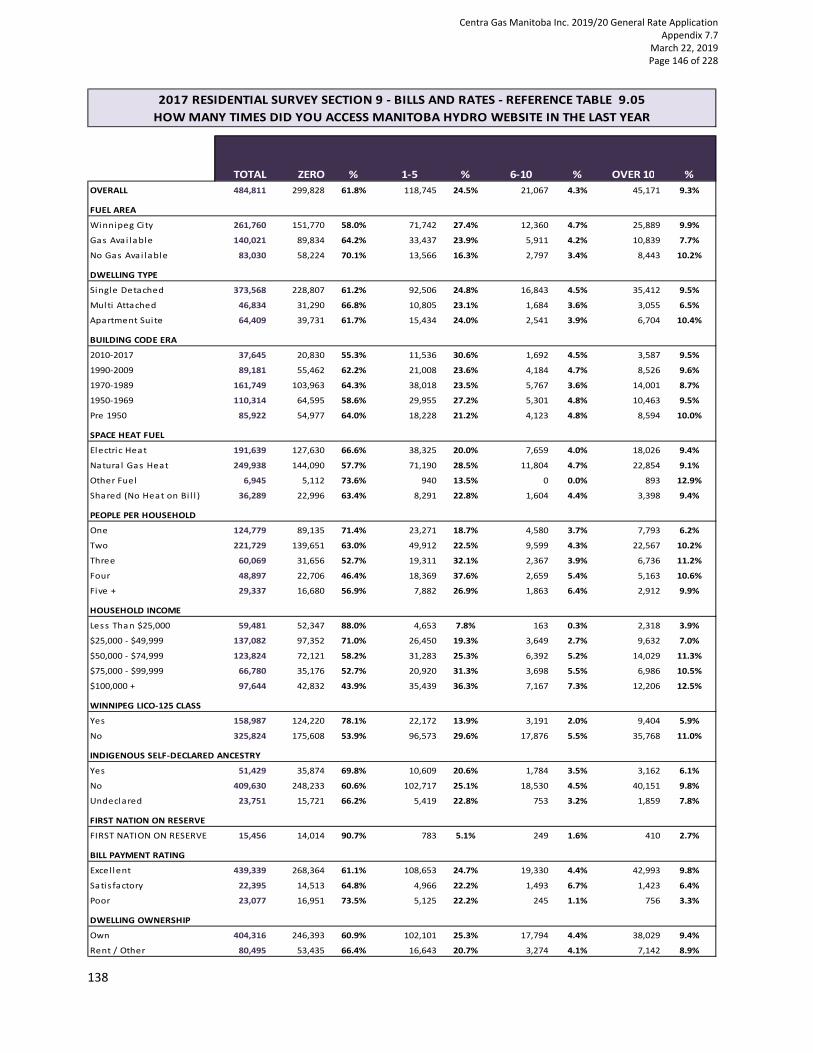
138
9.05 How Many Times Did You Access Manitoba Hydro’s Website in the Last Year
TOTAL ZERO % 1‐5 % 6‐10 % OVER 10 %
OVERALL 484,811 299,828 61.8% 118,745 24.5% 21,067 4.3% 45,171 9.3%
FUEL AREA
Winnipeg City 261,760 151,770 58.0% 71,742 27.4% 12,360 4.7% 25,889 9.9%
Gas Avai lable 140,021 89,834 64.2% 33,437 23.9% 5,911 4.2% 10,839 7.7%
No Gas Avai lable 83,030 58,224 70.1% 13,566 16.3% 2,797 3.4% 8,443 10.2%
DWELLING TYPE
Single Detached 373,568 228,807 61.2% 92,506 24.8% 16,843 4.5% 35,412 9.5%
Multi Attached 46,834 31,290 66.8% 10,805 23.1% 1,684 3.6% 3,055 6.5%
Apartment Sui te 64,409 39,731 61.7% 15,434 24.0% 2,541 3.9% 6,704 10.4%
BUILDING CODE ERA
2010‐2017 37,645 20,830 55.3% 11,536 30.6% 1,692 4.5% 3,587 9.5%
1990‐2009 89,181 55,462 62.2% 21,008 23.6% 4,184 4.7% 8,526 9.6%
1970‐1989 161,749 103,963 64.3% 38,018 23.5% 5,767 3.6% 14,001 8.7%
1950‐1969 110,314 64,595 58.6% 29,955 27.2% 5,301 4.8% 10,463 9.5%
Pre 1950 85,922 54,977 64.0% 18,228 21.2% 4,123 4.8% 8,594 10.0%
SPACE HEAT FUEL
Electric Heat 191,639 127,630 66.6% 38,325 20.0% 7,659 4.0% 18,026 9.4%
Natura l Gas Heat 249,938 144,090 57.7% 71,190 28.5% 11,804 4.7% 22,854 9.1%
Other Fuel 6,945 5,112 73.6% 940 13.5% 0 0.0% 893 12.9%
Shared (No Heat on Bi l l ) 36,289 22,996 63.4% 8,291 22.8% 1,604 4.4% 3,398 9.4%
PEOPLE PER HOUSEHOLD
One 124,779 89,135 71.4% 23,271 18.7% 4,580 3.7% 7,793 6.2%
Two 221,729 139,651 63.0% 49,912 22.5% 9,599 4.3% 22,567 10.2%
Three 60,069 31,656 52.7% 19,311 32.1% 2,367 3.9% 6,736 11.2%
Four 48,897 22,706 46.4% 18,369 37.6% 2,659 5.4% 5,163 10.6%
Five + 29,337 16,680 56.9% 7,882 26.9% 1,863 6.4% 2,912 9.9%
HOUSEHOLD INCOME
Less Than $25,000 59,481 52,347 88.0% 4,653 7.8% 163 0.3% 2,318 3.9%
$25,000 ‐ $49,999 137,082 97,352 71.0% 26,450 19.3% 3,649 2.7% 9,632 7.0%
$50,000 ‐ $74,999 123,824 72,121 58.2% 31,283 25.3% 6,392 5.2% 14,029 11.3%
$75,000 ‐ $99,999 66,780 35,176 52.7% 20,920 31.3% 3,698 5.5% 6,986 10.5%
$100,000 + 97,644 42,832 43.9% 35,439 36.3% 7,167 7.3% 12,206 12.5%
WINNIPEG LICO‐125 CLASS
Yes 158,987 124,220 78.1% 22,172 13.9% 3,191 2.0% 9,404 5.9%
No 325,824 175,608 53.9% 96,573 29.6% 17,876 5.5% 35,768 11.0%
INDIGENOUS SELF‐DECLARED ANCESTRY
Yes 51,429 35,874 69.8% 10,609 20.6% 1,784 3.5% 3,162 6.1%
No 409,630 248,233 60.6% 102,717 25.1% 18,530 4.5% 40,151 9.8%
Undeclared 23,751 15,721 66.2% 5,419 22.8% 753 3.2% 1,859 7.8%
FIRST NATION ON RESERVE
FIRST NATION ON RESERVE 15,456 14,014 90.7% 783 5.1% 249 1.6% 410 2.7%
BILL PAYMENT RATING
Excel lent 439,339 268,364 61.1% 108,653 24.7% 19,330 4.4% 42,993 9.8%
Sati s factory 22,395 14,513 64.8% 4,966 22.2% 1,493 6.7% 1,423 6.4%
Poor 23,077 16,951 73.5% 5,125 22.2% 245 1.1% 756 3.3%
DWELLING OWNERSHIP
Own 404,316 246,393 60.9% 102,101 25.3% 17,794 4.4% 38,029 9.4%
Rent / Other 80,495 53,435 66.4% 16,643 20.7% 3,274 4.1% 7,142 8.9%
2017 RESIDENTIAL SURVEY SECTION 9 ‐ BILLS AND RATES ‐ REFERENCE TABLE 9.05
HOW MANY TIMES DID YOU ACCESS MANITOBA HYDRO WEBSITE IN THE LAST YEAR
Centra Gas Manitoba Inc. 2019/20 General Rate Application Appendix 7.7
March 22, 2019 Page 146 of 228

139
9.06a When You Check Your Bill, Do You Mainly Look at Due Date
TOTAL YES % NO %
OVERALL 484,811 274,923 56.7% 209,888 43.3%
FUEL AREA
Winnipeg City 261,760 157,094 60.0% 104,666 40.0%
Gas Avai lable 140,021 75,093 53.6% 64,928 46.4%
No Gas Avai lable 83,030 42,736 51.5% 40,294 48.5%
DWELLING TYPE
Single Detached 373,568 210,617 56.4% 162,951 43.6%
Multi Attached 46,834 26,352 56.3% 20,482 43.7%
Apartment Sui te 64,409 37,954 58.9% 26,455 41.1%
BUILDING CODE ERA
2010‐2017 37,645 22,915 60.9% 14,730 39.1%
1990‐2009 89,181 44,867 50.3% 44,314 49.7%
1970‐1989 161,749 93,375 57.7% 68,374 42.3%
1950‐1969 110,314 64,614 58.6% 45,701 41.4%
Pre 1950 85,922 49,152 57.2% 36,770 42.8%
SPACE HEAT FUEL
Electric Heat 191,639 102,236 53.3% 89,403 46.7%
Natural Gas Heat 249,938 146,394 58.6% 103,544 41.4%
Other Fuel 6,945 4,746 68.3% 2,199 31.7%
Shared (No Heat on Bi l l ) 36,289 21,547 59.4% 14,742 40.6%
PEOPLE PER HOUSEHOLD
One 124,779 69,380 55.6% 55,400 44.4%
Two 221,729 123,558 55.7% 98,171 44.3%
Three 60,069 36,199 60.3% 23,871 39.7%
Four 48,897 28,599 58.5% 20,297 41.5%
Five + 29,337 17,187 58.6% 12,150 41.4%
HOUSEHOLD INCOME
Less Than $25,000 59,481 32,662 54.9% 26,819 45.1%
$25,000 ‐ $49,999 137,082 80,294 58.6% 56,788 41.4%
$50,000 ‐ $74,999 123,824 70,319 56.8% 53,505 43.2%
$75,000 ‐ $99,999 66,780 37,069 55.5% 29,711 44.5%
$100,000 + 97,644 54,579 55.9% 43,065 44.1%
WINNIPEG LICO‐125 CLASS
Yes 158,987 92,190 58.0% 66,797 42.0%
No 325,824 182,733 56.1% 143,091 43.9%
INDIGENOUS SELF‐DECLARED ANCESTRY
Yes 51,429 30,004 58.3% 21,425 41.7%
No 409,630 231,106 56.4% 178,525 43.6%
Undeclared 23,751 13,814 58.2% 9,938 41.8%
FIRST NATION ON RESERVE
FIRST NATION ON RESERVE 15,456 9,375 60.7% 6,081 39.3%
BILL PAYMENT RATING
Excel lent 439,339 246,934 56.2% 192,405 43.8%
Satis factory 22,395 13,351 59.6% 9,044 40.4%
Poor 23,077 14,638 63.4% 8,439 36.6%
DWELLING OWNERSHIP
Own 404,316 225,216 55.7% 179,100 44.3%
Rent / Other 80,495 49,707 61.8% 30,788 38.2%
2017 RESIDENTIAL SURVEY SECTION 9 ‐ BILLS AND RATES ‐ REFERENCE TABLE 9.06a
WHEN YOU CHECK YOUR BILL, DO YOU MAINLY LOOK AT DUE DATE
Centra Gas Manitoba Inc. 2019/20 General Rate Application Appendix 7.7
March 22, 2019 Page 147 of 228

140
9.06b When You Check Your Bill, Do You Mainly Look at Dollar Amount Owing
TOTAL YES % NO %
OVERALL 484,811 376,619 77.7% 108,192 22.3%
FUEL AREA
Winnipeg City 261,760 207,020 79.1% 54,740 20.9%
Gas Avai lable 140,021 109,370 78.1% 30,651 21.9%
No Gas Avai lable 83,030 60,230 72.5% 22,800 27.5%
DWELLING TYPE
Single Detached 373,568 288,724 77.3% 84,844 22.7%
Multi Attached 46,834 35,335 75.4% 11,499 24.6%
Apartment Sui te 64,409 52,560 81.6% 11,849 18.4%
BUILDING CODE ERA
2010‐2017 37,645 30,560 81.2% 7,085 18.8%
1990‐2009 89,181 67,881 76.1% 21,300 23.9%
1970‐1989 161,749 124,861 77.2% 36,888 22.8%
1950‐1969 110,314 85,662 77.7% 24,653 22.3%
Pre 1950 85,922 67,656 78.7% 18,266 21.3%
SPACE HEAT FUEL
Electric Heat 191,639 147,229 76.8% 44,410 23.2%
Natura l Gas Heat 249,938 195,677 78.3% 54,261 21.7%
Other Fuel 6,945 6,214 89.5% 731 10.5%
Shared (No Heat on Bi l l ) 36,289 27,500 75.8% 8,789 24.2%
PEOPLE PER HOUSEHOLD
One 124,779 93,385 74.8% 31,395 25.2%
Two 221,729 172,533 77.8% 49,196 22.2%
Three 60,069 48,810 81.3% 11,259 18.7%
Four 48,897 39,254 80.3% 9,643 19.7%
Five + 29,337 22,638 77.2% 6,699 22.8%
HOUSEHOLD INCOME
Less Than $25,000 59,481 42,230 71.0% 17,251 29.0%
$25,000 ‐ $49,999 137,082 107,720 78.6% 29,362 21.4%
$50,000 ‐ $74,999 123,824 97,379 78.6% 26,445 21.4%
$75,000 ‐ $99,999 66,780 52,278 78.3% 14,502 21.7%
$100,000 + 97,644 77,012 78.9% 20,632 21.1%
WINNIPEG LICO‐125 CLASS
Yes 158,987 119,752 75.3% 39,235 24.7%
No 325,824 256,868 78.8% 68,957 21.2%
INDIGENOUS SELF‐DECLARED ANCESTRY
Yes 51,429 38,806 75.5% 12,623 24.5%
No 409,630 320,184 78.2% 89,446 21.8%
Undeclared 23,751 17,629 74.2% 6,123 25.8%
FIRST NATION ON RESERVE
FIRST NATION ON RESERVE 15,456 11,115 71.9% 4,341 28.1%
BILL PAYMENT RATING
Excel lent 439,339 338,971 77.2% 100,368 22.8%
Satis factory 22,395 17,858 79.7% 4,537 20.3%
Poor 23,077 19,790 85.8% 3,287 14.2%
DWELLING OWNERSHIP
Own 404,316 313,013 77.4% 91,303 22.6%
Rent / Other 80,495 63,607 79.0% 16,888 21.0%
2017 RESIDENTIAL SURVEY SECTION 9 ‐ BILLS AND RATES ‐ REFERENCE TABLE 9.06b
WHEN YOU CHECK YOUR BILL, DO YOU MAINLY LOOK AT DOLLAR AMOUNT OWING
Centra Gas Manitoba Inc. 2019/20 General Rate Application Appendix 7.7
March 22, 2019 Page 148 of 228

141
9.06c When You Check Your Bill, Do You Mainly Look at Current Usage Amount
TOTAL YES % NO %
OVERALL 484,811 248,478 51.3% 236,333 48.7%
FUEL AREA
Winnipeg City 261,760 128,625 49.1% 133,135 50.9%
Gas Avai lable 140,021 74,343 53.1% 65,678 46.9%
No Gas Avai lable 83,030 45,509 54.8% 37,521 45.2%
DWELLING TYPE
Single Detached 373,568 198,443 53.1% 175,125 46.9%
Multi Attached 46,834 20,665 44.1% 26,169 55.9%
Apartment Sui te 64,409 29,370 45.6% 35,039 54.4%
BUILDING CODE ERA
2010‐2017 37,645 22,625 60.1% 15,020 39.9%
1990‐2009 89,181 43,580 48.9% 45,601 51.1%
1970‐1989 161,749 82,142 50.8% 79,606 49.2%
1950‐1969 110,314 56,778 51.5% 53,536 48.5%
Pre 1950 85,922 43,352 50.5% 42,570 49.5%
SPACE HEAT FUEL
Electric Heat 191,639 105,257 54.9% 86,382 45.1%
Natural Gas Heat 249,938 126,463 50.6% 123,475 49.4%
Other Fuel 6,945 3,148 45.3% 3,797 54.7%
Shared (No Heat on Bi l l ) 36,289 13,610 37.5% 22,679 62.5%
PEOPLE PER HOUSEHOLD
One 124,779 57,145 45.8% 67,634 54.2%
Two 221,729 118,988 53.7% 102,741 46.3%
Three 60,069 32,246 53.7% 27,824 46.3%
Four 48,897 25,003 51.1% 23,893 48.9%
Five + 29,337 15,095 51.5% 14,241 48.5%
HOUSEHOLD INCOME
Less Than $25,000 59,481 24,547 41.3% 34,934 58.7%
$25,000 ‐ $49,999 137,082 70,462 51.4% 66,620 48.6%
$50,000 ‐ $74,999 123,824 67,156 54.2% 56,668 45.8%
$75,000 ‐ $99,999 66,780 36,116 54.1% 30,664 45.9%
$100,000 + 97,644 50,196 51.4% 47,448 48.6%
WINNIPEG LICO‐125 CLASS
Yes 158,987 76,228 47.9% 82,759 52.1%
No 325,824 172,250 52.9% 153,575 47.1%
INDIGENOUS SELF‐DECLARED ANCESTRY
Yes 51,429 22,650 44.0% 28,779 56.0%
No 409,630 214,210 52.3% 195,421 47.7%
Undeclared 23,751 11,618 48.9% 12,134 51.1%
FIRST NATION ON RESERVE
FIRST NATION ON RESERVE 15,456 4,602 29.8% 10,854 70.2%
BILL PAYMENT RATING
Excel lent 439,339 228,921 52.1% 210,418 47.9%
Satis factory 22,395 10,041 44.8% 12,354 55.2%
Poor 23,077 9,516 41.2% 13,561 58.8%
DWELLING OWNERSHIP
Own 404,316 213,752 52.9% 190,564 47.1%
Rent / Other 80,495 34,726 43.1% 45,769 56.9%
2017 RESIDENTIAL SURVEY SECTION 9 ‐ BILLS AND RATES ‐ REFERENCE TABLE 9.06c
WHEN YOU CHECK YOUR BILL, DO YOU MAINLY LOOK AT CURRENT USAGE AMOUNT
Centra Gas Manitoba Inc. 2019/20 General Rate Application Appendix 7.7
March 22, 2019 Page 149 of 228

142
9.06d When You Check Your Bill, Do You Mainly Look at Usage History
TOTAL YES % NO %
OVERALL 484,811 168,441 34.7% 316,370 65.3%
FUEL AREA
Winnipeg City 261,760 91,862 35.1% 169,898 64.9%
Gas Avai lable 140,021 47,359 33.8% 92,662 66.2%
No Gas Avai lable 83,030 29,220 35.2% 53,810 64.8%
DWELLING TYPE
Single Detached 373,568 136,290 36.5% 237,278 63.5%
Multi Attached 46,834 14,296 30.5% 32,538 69.5%
Apartment Sui te 64,409 17,854 27.7% 46,555 72.3%
BUILDING CODE ERA
2010‐2017 37,645 13,254 35.2% 24,391 64.8%
1990‐2009 89,181 30,048 33.7% 59,134 66.3%
1970‐1989 161,749 57,359 35.5% 104,390 64.5%
1950‐1969 110,314 38,289 34.7% 72,026 65.3%
Pre 1950 85,922 29,492 34.3% 56,430 65.7%
SPACE HEAT FUEL
Electric Heat 191,639 67,998 35.5% 123,641 64.5%
Natura l Gas Heat 249,938 89,774 35.9% 160,164 64.1%
Other Fuel 6,945 2,345 33.8% 4,600 66.2%
Shared (No Heat on Bi l l ) 36,289 8,324 22.9% 27,965 77.1%
PEOPLE PER HOUSEHOLD
One 124,779 35,605 28.5% 89,175 71.5%
Two 221,729 76,845 34.7% 144,884 65.3%
Three 60,069 24,587 40.9% 35,482 59.1%
Four 48,897 19,156 39.2% 29,740 60.8%
Five + 29,337 12,247 41.7% 17,089 58.3%
HOUSEHOLD INCOME
Less Than $25,000 59,481 13,642 22.9% 45,838 77.1%
$25,000 ‐ $49,999 137,082 42,840 31.3% 94,243 68.7%
$50,000 ‐ $74,999 123,824 47,286 38.2% 76,539 61.8%
$75,000 ‐ $99,999 66,780 25,452 38.1% 41,328 61.9%
$100,000 + 97,644 39,222 40.2% 58,422 59.8%
WINNIPEG LICO‐125 CLASS
Yes 158,987 45,252 28.5% 113,734 71.5%
No 325,824 123,188 37.8% 202,636 62.2%
INDIGENOUS SELF‐DECLARED ANCESTRY
Yes 51,429 14,783 28.7% 36,646 71.3%
No 409,630 144,651 35.3% 264,979 64.7%
Undeclared 23,751 9,007 37.9% 14,745 62.1%
FIRST NATION ON RESERVE
FIRST NATION ON RESERVE 15,456 2,649 17.1% 12,808 82.9%
BILL PAYMENT RATING
Excel lent 439,339 156,062 35.5% 283,277 64.5%
Sati s factory 22,395 5,904 26.4% 16,491 73.6%
Poor 23,077 6,475 28.1% 16,602 71.9%
DWELLING OWNERSHIP
Own 404,316 147,377 36.5% 256,940 63.5%
Rent / Other 80,495 21,064 26.2% 59,431 73.8%
2017 RESIDENTIAL SURVEY SECTION 9 ‐ BILLS AND RATES ‐ REFERENCE TABLE 9.06d
WHEN YOU CHECK YOUR BILL, DO YOU MAINLY LOOK AT USAGE HISTORY
Centra Gas Manitoba Inc. 2019/20 General Rate Application Appendix 7.7
March 22, 2019 Page 150 of 228
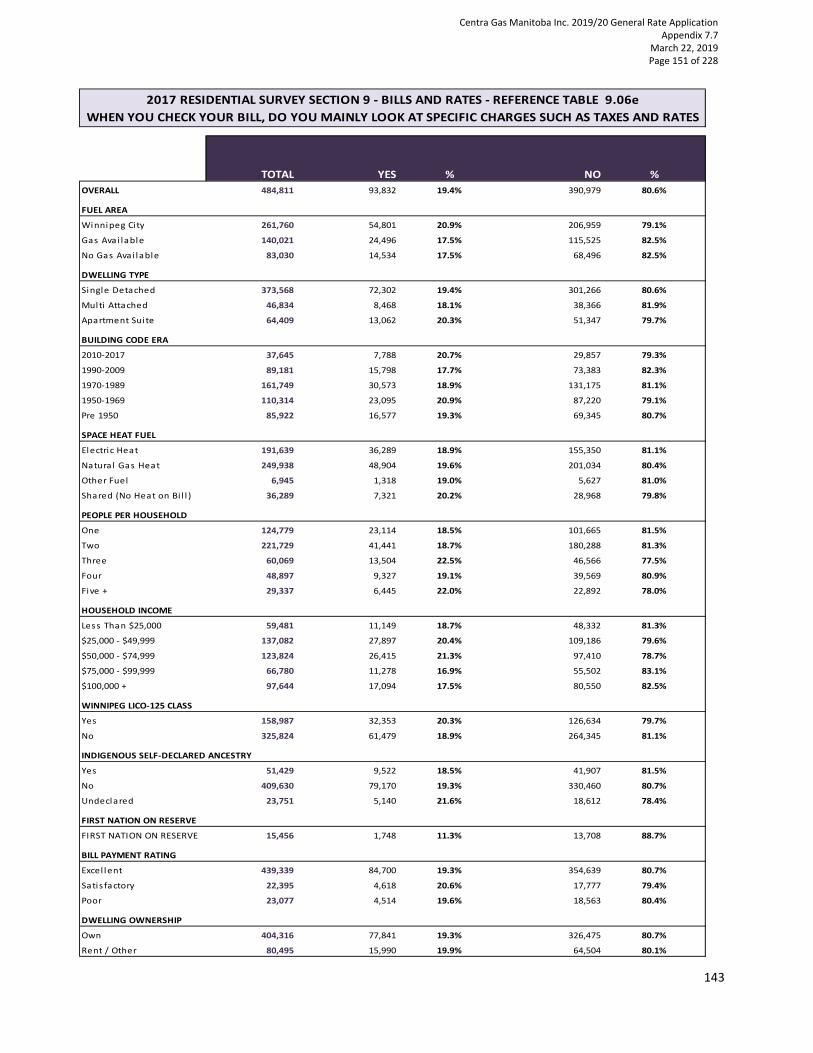
143
9.06e When You Check Your Bill, Do You Mainly Look at Specific Charges Such as Taxes and Rates
TOTAL YES % NO %
OVERALL 484,811 93,832 19.4% 390,979 80.6%
FUEL AREA
Winnipeg City 261,760 54,801 20.9% 206,959 79.1%
Gas Avai lable 140,021 24,496 17.5% 115,525 82.5%
No Gas Avai lable 83,030 14,534 17.5% 68,496 82.5%
DWELLING TYPE
Single Detached 373,568 72,302 19.4% 301,266 80.6%
Multi Attached 46,834 8,468 18.1% 38,366 81.9%
Apartment Sui te 64,409 13,062 20.3% 51,347 79.7%
BUILDING CODE ERA
2010‐2017 37,645 7,788 20.7% 29,857 79.3%
1990‐2009 89,181 15,798 17.7% 73,383 82.3%
1970‐1989 161,749 30,573 18.9% 131,175 81.1%
1950‐1969 110,314 23,095 20.9% 87,220 79.1%
Pre 1950 85,922 16,577 19.3% 69,345 80.7%
SPACE HEAT FUEL
Electric Heat 191,639 36,289 18.9% 155,350 81.1%
Natura l Gas Heat 249,938 48,904 19.6% 201,034 80.4%
Other Fuel 6,945 1,318 19.0% 5,627 81.0%
Shared (No Heat on Bi l l ) 36,289 7,321 20.2% 28,968 79.8%
PEOPLE PER HOUSEHOLD
One 124,779 23,114 18.5% 101,665 81.5%
Two 221,729 41,441 18.7% 180,288 81.3%
Three 60,069 13,504 22.5% 46,566 77.5%
Four 48,897 9,327 19.1% 39,569 80.9%
Five + 29,337 6,445 22.0% 22,892 78.0%
HOUSEHOLD INCOME
Less Than $25,000 59,481 11,149 18.7% 48,332 81.3%
$25,000 ‐ $49,999 137,082 27,897 20.4% 109,186 79.6%
$50,000 ‐ $74,999 123,824 26,415 21.3% 97,410 78.7%
$75,000 ‐ $99,999 66,780 11,278 16.9% 55,502 83.1%
$100,000 + 97,644 17,094 17.5% 80,550 82.5%
WINNIPEG LICO‐125 CLASS
Yes 158,987 32,353 20.3% 126,634 79.7%
No 325,824 61,479 18.9% 264,345 81.1%
INDIGENOUS SELF‐DECLARED ANCESTRY
Yes 51,429 9,522 18.5% 41,907 81.5%
No 409,630 79,170 19.3% 330,460 80.7%
Undeclared 23,751 5,140 21.6% 18,612 78.4%
FIRST NATION ON RESERVE
FIRST NATION ON RESERVE 15,456 1,748 11.3% 13,708 88.7%
BILL PAYMENT RATING
Excel lent 439,339 84,700 19.3% 354,639 80.7%
Satis factory 22,395 4,618 20.6% 17,777 79.4%
Poor 23,077 4,514 19.6% 18,563 80.4%
DWELLING OWNERSHIP
Own 404,316 77,841 19.3% 326,475 80.7%
Rent / Other 80,495 15,990 19.9% 64,504 80.1%
2017 RESIDENTIAL SURVEY SECTION 9 ‐ BILLS AND RATES ‐ REFERENCE TABLE 9.06e
WHEN YOU CHECK YOUR BILL, DO YOU MAINLY LOOK AT SPECIFIC CHARGES SUCH AS TAXES AND RATES
Centra Gas Manitoba Inc. 2019/20 General Rate Application Appendix 7.7
March 22, 2019 Page 151 of 228

144
9.06f When You Check Your Bill, Do You Mainly Look at Equal Payment Plan Amount
TOTAL YES % NO %
OVERALL 484,811 92,116 19.0% 392,695 81.0%
FUEL AREA
Winnipeg City 261,760 47,062 18.0% 214,698 82.0%
Gas Avai lable 140,021 29,440 21.0% 110,581 79.0%
No Gas Avai lable 83,030 15,614 18.8% 67,416 81.2%
DWELLING TYPE
Single Detached 373,568 75,053 20.1% 298,515 79.9%
Multi Attached 46,834 8,520 18.2% 38,314 81.8%
Apartment Sui te 64,409 8,543 13.3% 55,866 86.7%
BUILDING CODE ERA
2010‐2017 37,645 5,829 15.5% 31,816 84.5%
1990‐2009 89,181 17,496 19.6% 71,686 80.4%
1970‐1989 161,749 32,956 20.4% 128,793 79.6%
1950‐1969 110,314 19,792 17.9% 90,523 82.1%
Pre 1950 85,922 16,044 18.7% 69,878 81.3%
SPACE HEAT FUEL
Electric Heat 191,639 38,416 20.0% 153,223 80.0%
Natural Gas Heat 249,938 51,108 20.4% 198,830 79.6%
Other Fuel 6,945 602 8.7% 6,343 91.3%
Shared (No Heat on Bi l l ) 36,289 1,990 5.5% 34,299 94.5%
PEOPLE PER HOUSEHOLD
One 124,779 18,489 14.8% 106,290 85.2%
Two 221,729 46,036 20.8% 175,693 79.2%
Three 60,069 11,754 19.6% 48,315 80.4%
Four 48,897 9,651 19.7% 39,246 80.3%
Five + 29,337 6,186 21.1% 23,151 78.9%
HOUSEHOLD INCOME
Less Than $25,000 59,481 8,508 14.3% 50,973 85.7%
$25,000 ‐ $49,999 137,082 23,046 16.8% 114,037 83.2%
$50,000 ‐ $74,999 123,824 27,007 21.8% 96,817 78.2%
$75,000 ‐ $99,999 66,780 15,422 23.1% 51,357 76.9%
$100,000 + 97,644 18,133 18.6% 79,511 81.4%
WINNIPEG LICO‐125 CLASS
Yes 158,987 25,412 16.0% 133,575 84.0%
No 325,824 66,704 20.5% 259,120 79.5%
INDIGENOUS SELF‐DECLARED ANCESTRY
Yes 51,429 9,927 19.3% 41,502 80.7%
No 409,630 77,700 19.0% 331,930 81.0%
Undeclared 23,751 4,489 18.9% 19,263 81.1%
FIRST NATION ON RESERVE
FIRST NATION ON RESERVE 15,456 1,710 11.1% 13,746 88.9%
BILL PAYMENT RATING
Excel lent 439,339 89,317 20.3% 350,022 79.7%
Satis factory 22,395 1,554 6.9% 20,841 93.1%
Poor 23,077 1,245 5.4% 21,832 94.6%
DWELLING OWNERSHIP
Own 404,316 80,911 20.0% 323,405 80.0%
Rent / Other 80,495 11,205 13.9% 69,290 86.1%
2017 RESIDENTIAL SURVEY SECTION 9 ‐ BILLS AND RATES ‐ REFERENCE TABLE 9.06f
WHEN YOU CHECK YOUR BILL, DO YOU MAINLY LOOK AT EQUAL PAYMENT PLAN AMOUNT
Centra Gas Manitoba Inc. 2019/20 General Rate Application Appendix 7.7
March 22, 2019 Page 152 of 228

145
9.06g When You Check Your Bill, Do You Mainly Look at Meter Readings
TOTAL YES % NO %
OVERALL 484,811 134,453 27.7% 350,358 72.3%
FUEL AREA
Winnipeg City 261,760 66,478 25.4% 195,282 74.6%
Gas Avai lable 140,021 36,912 26.4% 103,109 73.6%
No Gas Avai lable 83,030 31,063 37.4% 51,967 62.6%
DWELLING TYPE
Single Detached 373,568 110,838 29.7% 262,730 70.3%
Multi Attached 46,834 11,351 24.2% 35,483 75.8%
Apartment Suite 64,409 12,264 19.0% 52,145 81.0%
BUILDING CODE ERA
2010‐2017 37,645 12,546 33.3% 25,099 66.7%
1990‐2009 89,181 25,483 28.6% 63,698 71.4%
1970‐1989 161,749 44,429 27.5% 117,320 72.5%
1950‐1969 110,314 28,047 25.4% 82,267 74.6%
Pre 1950 85,922 23,947 27.9% 61,975 72.1%
SPACE HEAT FUEL
Electric Heat 191,639 64,079 33.4% 127,560 66.6%
Natura l Gas Heat 249,938 62,879 25.2% 187,059 74.8%
Other Fuel 6,945 1,873 27.0% 5,072 73.0%
Shared (No Heat on Bi l l ) 36,289 5,621 15.5% 30,668 84.5%
PEOPLE PER HOUSEHOLD
One 124,779 28,584 22.9% 96,195 77.1%
Two 221,729 64,566 29.1% 157,163 70.9%
Three 60,069 17,866 29.7% 42,203 70.3%
Four 48,897 13,987 28.6% 34,910 71.4%
Five + 29,337 9,449 32.2% 19,888 67.8%
HOUSEHOLD INCOME
Less Than $25,000 59,481 13,855 23.3% 45,626 76.7%
$25,000 ‐ $49,999 137,082 38,701 28.2% 98,382 71.8%
$50,000 ‐ $74,999 123,824 36,259 29.3% 87,565 70.7%
$75,000 ‐ $99,999 66,780 20,346 30.5% 46,434 69.5%
$100,000 + 97,644 25,292 25.9% 72,352 74.1%
WINNIPEG LICO‐125 CLASS
Yes 158,987 42,950 27.0% 116,036 73.0%
No 325,824 91,502 28.1% 234,322 71.9%
INDIGENOUS SELF‐DECLARED ANCESTRY
Yes 51,429 13,628 26.5% 37,801 73.5%
No 409,630 114,622 28.0% 295,008 72.0%
Undeclared 23,751 6,202 26.1% 17,549 73.9%
FIRST NATION ON RESERVE
FIRST NATION ON RESERVE 15,456 3,973 25.7% 11,483 74.3%
BILL PAYMENT RATING
Excel lent 439,339 123,980 28.2% 315,359 71.8%
Satis factory 22,395 5,795 25.9% 16,600 74.1%
Poor 23,077 4,678 20.3% 18,399 79.7%
DWELLING OWNERSHIP
Own 404,316 117,760 29.1% 286,556 70.9%
Rent / Other 80,495 16,692 20.7% 63,803 79.3%
2017 RESIDENTIAL SURVEY SECTION 9 ‐ BILLS AND RATES ‐ REFERENCE TABLE 9.06g
WHEN YOU CHECK YOUR BILL, DO YOU MAINLY LOOK AT METER READINGS
Centra Gas Manitoba Inc. 2019/20 General Rate Application Appendix 7.7
March 22, 2019 Page 153 of 228

146
9.06h Never Check Your Bill
TOTAL YES % NO %
OVERALL 484,811 22,595 4.7% 462,216 95.3%
FUEL AREA
Winnipeg City 261,760 13,842 5.3% 247,918 94.7%
Gas Avai lable 140,021 4,951 3.5% 135,070 96.5%
No Gas Avai lable 83,030 3,802 4.6% 79,228 95.4%
DWELLING TYPE
Single Detached 373,568 15,166 4.1% 358,402 95.9%
Multi Attached 46,834 3,790 8.1% 43,044 91.9%
Apartment Sui te 64,409 3,639 5.6% 60,770 94.4%
BUILDING CODE ERA
2010‐2017 37,645 1,334 3.5% 36,311 96.5%
1990‐2009 89,181 4,364 4.9% 84,817 95.1%
1970‐1989 161,749 6,991 4.3% 154,758 95.7%
1950‐1969 110,314 4,816 4.4% 105,499 95.6%
Pre 1950 85,922 5,090 5.9% 80,832 94.1%
SPACE HEAT FUEL
Electric Heat 191,639 8,343 4.4% 183,296 95.6%
Natura l Gas Heat 249,938 10,462 4.2% 239,476 95.8%
Other Fuel 6,945 0 0.0% 6,945 100.0%
Shared (No Heat on Bi l l ) 36,289 3,790 10.4% 32,499 89.6%
PEOPLE PER HOUSEHOLD
One 124,779 12,470 10.0% 112,309 90.0%
Two 221,729 7,073 3.2% 214,657 96.8%
Three 60,069 652 1.1% 59,417 98.9%
Four 48,897 1,176 2.4% 47,721 97.6%
Five + 29,337 1,224 4.2% 28,112 95.8%
HOUSEHOLD INCOME
Less Than $25,000 59,481 6,035 10.1% 53,445 89.9%
$25,000 ‐ $49,999 137,082 5,572 4.1% 131,511 95.9%
$50,000 ‐ $74,999 123,824 4,439 3.6% 119,385 96.4%
$75,000 ‐ $99,999 66,780 2,283 3.4% 64,497 96.6%
$100,000 + 97,644 4,265 4.4% 93,379 95.6%
WINNIPEG LICO‐125 CLASS
Yes 158,987 9,487 6.0% 149,500 94.0%
No 325,824 13,108 4.0% 312,716 96.0%
INDIGENOUS SELF‐DECLARED ANCESTRY
Yes 51,429 3,734 7.3% 47,695 92.7%
No 409,630 17,490 4.3% 392,140 95.7%
Undeclared 23,751 1,371 5.8% 22,380 94.2%
FIRST NATION ON RESERVE
FIRST NATION ON RESERVE 15,456 1,151 7.4% 14,305 92.6%
BILL PAYMENT RATING
Excel lent 439,339 19,547 4.4% 419,792 95.6%
Satis factory 22,395 1,785 8.0% 20,610 92.0%
Poor 23,077 1,263 5.5% 21,815 94.5%
DWELLING OWNERSHIP
Own 404,316 16,367 4.0% 387,950 96.0%
Rent / Other 80,495 6,228 7.7% 74,267 92.3%
2017 RESIDENTIAL SURVEY SECTION 9 ‐ BILLS AND RATES ‐ REFERENCE TABLE 9.06h
NEVER CHECK YOU BILL
Centra Gas Manitoba Inc. 2019/20 General Rate Application Appendix 7.7
March 22, 2019 Page 154 of 228

147
9.07a Reduced Spending on Food in the past Two Years to Pay Your Manitoba Hydro Bill
TOTAL NEVER % ONE % TWO % THREE % FOUR + %
CHOOSE
NOT TO
ANSWER %
OVERALL 484,811 310,431 64.0% 9,861 2.0% 13,399 2.8% 9,097 1.9% 27,348 5.6% 114,675 23.7%
FUEL AREA
Winnipeg City 261,760 178,718 68.3% 5,775 2.2% 7,182 2.7% 4,109 1.6% 12,104 4.6% 53,873 20.6%
Gas Avai lable 140,021 90,710 64.8% 2,128 1.5% 3,932 2.8% 2,537 1.8% 7,175 5.1% 33,539 24.0%
No Gas Avai lable 83,030 41,003 49.4% 1,959 2.4% 2,284 2.8% 2,452 3.0% 8,069 9.7% 27,264 32.8%
DWELLING TYPE
Single Detached 373,568 239,831 64.2% 6,498 1.7% 9,836 2.6% 6,201 1.7% 21,748 5.8% 89,454 23.9%
Multi Attached 46,834 27,464 58.6% 1,502 3.2% 1,273 2.7% 1,913 4.1% 2,971 6.3% 11,711 25.0%
Apartment Suite 64,409 43,136 67.0% 1,861 2.9% 2,290 3.6% 984 1.5% 2,629 4.1% 13,510 21.0%
BUILDING CODE ERA
2010‐2017 37,645 24,242 64.4% 798 2.1% 1,824 4.8% 744 2.0% 1,860 4.9% 8,176 21.7%
1990‐2009 89,181 59,134 66.3% 1,826 2.0% 1,922 2.2% 1,492 1.7% 4,461 5.0% 20,345 22.8%
1970‐1989 161,749 103,619 64.1% 2,825 1.7% 3,595 2.2% 3,656 2.3% 8,344 5.2% 39,711 24.6%
1950‐1969 110,314 72,941 66.1% 2,139 1.9% 2,636 2.4% 1,847 1.7% 5,599 5.1% 25,152 22.8%
Pre 1950 85,922 50,495 58.8% 2,273 2.6% 3,421 4.0% 1,359 1.6% 7,083 8.2% 21,291 24.8%
SPACE HEAT FUEL
Electric Heat 191,639 109,165 57.0% 4,634 2.4% 5,983 3.1% 4,972 2.6% 14,511 7.6% 52,374 27.3%
Natura l Gas Heat 249,938 174,262 69.7% 4,321 1.7% 6,414 2.6% 3,415 1.4% 10,268 4.1% 51,259 20.5%
Other Fuel 6,945 3,563 51.3% 262 3.8% 131 1.9% 131 1.9% 675 9.7% 2,182 31.4%
Shared (No Heat on Bi l l ) 36,289 23,441 64.6% 643 1.8% 870 2.4% 580 1.6% 1,894 5.2% 8,860 24.4%
PEOPLE PER HOUSEHOLD
One 124,779 75,426 60.4% 2,579 2.1% 2,787 2.2% 2,653 2.1% 7,188 5.8% 34,146 27.4%
Two 221,729 151,453 68.3% 3,246 1.5% 5,632 2.5% 2,605 1.2% 9,394 4.2% 49,399 22.3%
Three 60,069 35,657 59.4% 1,842 3.1% 1,811 3.0% 1,769 2.9% 4,047 6.7% 14,944 24.9%
Four 48,897 32,569 66.6% 1,499 3.1% 1,608 3.3% 1,052 2.2% 3,573 7.3% 8,595 17.6%
Five + 29,337 15,327 52.2% 695 2.4% 1,561 5.3% 1,017 3.5% 3,145 10.7% 7,591 25.9%
HOUSEHOLD INCOME
Less Than $25,000 59,481 25,176 42.3% 2,501 4.2% 3,349 5.6% 2,378 4.0% 5,307 8.9% 20,771 34.9%
$25,000 ‐ $49,999 137,082 77,645 56.6% 2,819 2.1% 4,441 3.2% 1,964 1.4% 9,730 7.1% 40,484 29.5%
$50,000 ‐ $74,999 123,824 82,720 66.8% 2,063 1.7% 2,497 2.0% 2,345 1.9% 7,104 5.7% 27,095 21.9%
$75,000 ‐ $99,999 66,780 47,415 71.0% 1,565 2.3% 1,581 2.4% 1,134 1.7% 2,669 4.0% 12,415 18.6%
$100,000 + 97,644 77,475 79.3% 912 0.9% 1,531 1.6% 1,277 1.3% 2,538 2.6% 13,911 14.2%
WINNIPEG LICO‐125 CLASS
Yes 158,987 77,470 48.7% 4,472 2.8% 7,097 4.5% 3,924 2.5% 13,554 8.5% 52,470 33.0%
No 325,824 232,961 71.5% 5,389 1.7% 6,302 1.9% 5,173 1.6% 13,793 4.2% 62,206 19.1%
INDIGENOUS SELF‐DECLARED ANCESTRY
Yes 51,429 22,223 43.2% 1,750 3.4% 2,547 5.0% 2,111 4.1% 6,231 12.1% 16,568 32.2%
No 409,630 277,280 67.7% 7,614 1.9% 10,089 2.5% 5,975 1.5% 19,689 4.8% 88,984 21.7%
Undeclared 23,751 10,928 46.0% 497 2.1% 762 3.2% 1,012 4.3% 1,428 6.0% 9,124 38.4%
FIRST NATION ON RESERVE
FIRST NATION ON RESERVE 15,456 4,141 26.8% 996 6.4% 1,037 6.7% 815 5.3% 1,883 12.2% 6,584 42.6%
BILL PAYMENT RATING
Excel lent 439,339 294,407 67.0% 7,587 1.7% 10,359 2.4% 7,482 1.7% 19,513 4.4% 99,990 22.8%
Satis factory 22,395 9,928 44.3% 813 3.6% 1,334 6.0% 965 4.3% 2,512 11.2% 6,843 30.6%
Poor 23,077 6,095 26.4% 1,461 6.3% 1,706 7.4% 650 2.8% 5,323 23.1% 7,842 34.0%
DWELLING OWNERSHIP
Own 404,316 268,408 66.4% 6,774 1.7% 9,605 2.4% 5,796 1.4% 20,989 5.2% 92,744 22.9%
Rent / Other 80,495 42,023 52.2% 3,087 3.8% 3,794 4.7% 3,301 4.1% 6,359 7.9% 21,931 27.2%
2017 RESIDENTIAL SURVEY SECTION 9 ‐ BILLS AND RATES ‐ REFERENCE TABLE 9.07a
IN LAST TWO YEARS REDUCED SPENDING ON FOOD TO PAY FOR YOUR MANITOBA HYDRO BILL
Centra Gas Manitoba Inc. 2019/20 General Rate Application Appendix 7.7
March 22, 2019 Page 155 of 228

148
9.07b Reduced Spending on Rent in the past Two Years to Pay Your Manitoba Hydro Bill
TOTAL NEVER % ONE % TWO % THREE % FOUR + %
CHOOSE
NOT TO
ANSWER %
OVERALL 484,811 329,620 68.0% 2,184 0.5% 2,213 0.5% 949 0.2% 3,870 0.8% 145,975 30.1%
FUEL AREA
Winnipeg City 261,760 188,959 72.2% 1,194 0.5% 749 0.3% 562 0.2% 1,909 0.7% 68,388 26.1%
Gas Avai lable 140,021 95,100 67.9% 406 0.3% 709 0.5% 201 0.1% 894 0.6% 42,711 30.5%
No Gas Avai lable 83,030 45,562 54.9% 584 0.7% 755 0.9% 187 0.2% 1,067 1.3% 34,876 42.0%
DWELLING TYPE
Single Detached 373,568 251,637 67.4% 1,386 0.4% 1,923 0.5% 795 0.2% 2,935 0.8% 114,892 30.8%
Multi Attached 46,834 31,136 66.5% 154 0.3% 0 0.0% 154 0.3% 482 1.0% 14,908 31.8%
Apartment Sui te 64,409 46,848 72.7% 643 1.0% 290 0.5% 0 0.0% 453 0.7% 16,175 25.1%
BUILDING CODE ERA
2010‐2017 37,645 27,068 71.9% 31 0.1% 162 0.4% 194 0.5% 163 0.4% 10,028 26.6%
1990‐2009 89,181 60,804 68.2% 578 0.6% 239 0.3% 62 0.1% 508 0.6% 26,990 30.3%
1970‐1989 161,749 110,143 68.1% 584 0.4% 537 0.3% 547 0.3% 883 0.5% 49,054 30.3%
1950‐1969 110,314 76,170 69.0% 154 0.1% 843 0.8% 31 0.0% 1,156 1.0% 31,960 29.0%
Pre 1950 85,922 55,435 64.5% 836 1.0% 432 0.5% 115 0.1% 1,160 1.4% 27,943 32.5%
SPACE HEAT FUEL
Electric Heat 191,639 120,142 62.7% 722 0.4% 557 0.3% 565 0.3% 1,916 1.0% 67,737 35.3%
Natura l Gas Heat 249,938 181,173 72.5% 818 0.3% 767 0.3% 384 0.2% 1,664 0.7% 65,132 26.1%
Other Fuel 6,945 3,694 53.2% 0 0.0% 600 8.6% 0 0.0% 0 0.0% 2,651 38.2%
Shared (No Heat on Bi l l ) 36,289 24,611 67.8% 643 1.8% 290 0.8% 0 0.0% 290 0.8% 10,454 28.8%
PEOPLE PER HOUSEHOLD
One 124,779 78,660 63.0% 579 0.5% 606 0.5% 31 0.0% 701 0.6% 44,202 35.4%
Two 221,729 157,614 71.1% 993 0.4% 576 0.3% 246 0.1% 973 0.4% 61,327 27.7%
Three 60,069 40,361 67.2% 226 0.4% 440 0.7% 185 0.3% 689 1.1% 18,167 30.2%
Four 48,897 34,885 71.3% 177 0.4% 396 0.8% 293 0.6% 773 1.6% 12,373 25.3%
Five + 29,337 18,100 61.7% 208 0.7% 196 0.7% 194 0.7% 733 2.5% 9,906 33.8%
HOUSEHOLD INCOME
Less Than $25,000 59,481 27,257 45.8% 561 0.9% 765 1.3% 155 0.3% 1,044 1.8% 29,699 49.9%
$25,000 ‐ $49,999 137,082 83,710 61.1% 254 0.2% 866 0.6% 31 0.0% 1,512 1.1% 50,709 37.0%
$50,000 ‐ $74,999 123,824 89,004 71.9% 848 0.7% 31 0.0% 433 0.3% 769 0.6% 32,740 26.4%
$75,000 ‐ $99,999 66,780 49,973 74.8% 103 0.2% 318 0.5% 230 0.3% 316 0.5% 15,841 23.7%
$100,000 + 97,644 79,676 81.6% 418 0.4% 234 0.2% 100 0.1% 230 0.2% 16,987 17.4%
WINNIPEG LICO‐125 CLASS
Yes 158,987 84,540 53.2% 992 0.6% 1,011 0.6% 465 0.3% 2,457 1.5% 69,522 43.7%
No 325,824 245,080 75.2% 1,191 0.4% 1,202 0.4% 484 0.1% 1,413 0.4% 76,453 23.5%
INDIGENOUS SELF‐DECLARED ANCESTRY
Yes 51,429 26,418 51.4% 476 0.9% 387 0.8% 187 0.4% 1,084 2.1% 22,878 44.5%
No 409,630 291,366 71.1% 1,708 0.4% 1,826 0.4% 648 0.2% 2,394 0.6% 111,688 27.3%
Undeclared 23,751 11,836 49.8% 0 0.0% 0 0.0% 115 0.5% 392 1.7% 11,408 48.0%
FIRST NATION ON RESERVE
FIRST NATION ON RESERVE 15,456 4,869 31.5% 250 1.6% 155 1.0% 187 1.2% 286 1.8% 9,710 62.8%
BILL PAYMENT RATING
Excel lent 439,339 306,799 69.8% 1,934 0.4% 1,436 0.3% 616 0.1% 2,296 0.5% 126,258 28.7%
Satis factory 22,395 12,710 56.8% 0 0.0% 193 0.9% 31 0.1% 467 2.1% 8,993 40.2%
Poor 23,077 10,111 43.8% 250 1.1% 584 2.5% 302 1.3% 1,107 4.8% 10,724 46.5%
DWELLING OWNERSHIP
Own 404,316 281,677 69.7% 902 0.2% 967 0.2% 825 0.2% 2,163 0.5% 117,783 29.1%
Rent / Other 80,495 47,943 59.6% 1,282 1.6% 1,246 1.5% 124 0.2% 1,707 2.1% 28,192 35.0%
2017 RESIDENTIAL SURVEY SECTION 9 ‐ BILLS AND RATES ‐ REFERENCE TABLE 9.07b
IN LAST TWO YEARS REDUCED SPENDING ON RENT TO PAY FOR YOUR MANITOBA HYDRO BILL
Centra Gas Manitoba Inc. 2019/20 General Rate Application Appendix 7.7
March 22, 2019 Page 156 of 228

149
9.07c Reduced Spending on Loans in the past Two Years to Pay Your Manitoba Hydro Bill
TOTAL NEVER % ONE % TWO % THREE % FOUR + %
CHOOSE
NOT TO
ANSWER %
OVERALL 484,811 322,420 66.5% 5,529 1.1% 3,318 0.7% 2,530 0.5% 9,149 1.9% 141,864 29.3%
FUEL AREA
Winnipeg City 261,760 182,745 69.8% 2,979 1.1% 1,262 0.5% 1,443 0.6% 5,012 1.9% 68,319 26.1%
Gas Avai lable 140,021 95,190 68.0% 1,017 0.7% 1,112 0.8% 503 0.4% 2,072 1.5% 40,127 28.7%
No Gas Avai lable 83,030 44,485 53.6% 1,534 1.8% 944 1.1% 583 0.7% 2,065 2.5% 33,418 40.2%
DWELLING TYPE
Single Detached 373,568 249,907 66.9% 3,928 1.1% 3,116 0.8% 1,751 0.5% 7,168 1.9% 107,698 28.8%
Multi Attached 46,834 30,202 64.5% 569 1.2% 0 0.0% 414 0.9% 531 1.1% 15,119 32.3%
Apartment Sui te 64,409 42,312 65.7% 1,033 1.6% 202 0.3% 365 0.6% 1,451 2.3% 19,047 29.6%
BUILDING CODE ERA
2010‐2017 37,645 26,492 70.4% 225 0.6% 576 1.5% 379 1.0% 277 0.7% 9,696 25.8%
1990‐2009 89,181 60,088 67.4% 759 0.9% 909 1.0% 246 0.3% 1,224 1.4% 25,955 29.1%
1970‐1989 161,749 107,895 66.7% 2,250 1.4% 868 0.5% 1,564 1.0% 2,161 1.3% 47,011 29.1%
1950‐1969 110,314 74,457 67.5% 837 0.8% 441 0.4% 115 0.1% 2,615 2.4% 31,849 28.9%
Pre 1950 85,922 53,488 62.3% 1,458 1.7% 523 0.6% 226 0.3% 2,873 3.3% 27,354 31.8%
SPACE HEAT FUEL
Electric Heat 191,639 116,977 61.0% 2,227 1.2% 1,748 0.9% 1,687 0.9% 3,522 1.8% 65,477 34.2%
Natura l Gas Heat 249,938 180,281 72.1% 2,301 0.9% 1,570 0.6% 843 0.3% 4,177 1.7% 60,767 24.3%
Other Fuel 6,945 4,032 58.1% 131 1.9% 0 0.0% 0 0.0% 0 0.0% 2,782 40.1%
Shared (No Heat on Bi l l ) 36,289 21,130 58.2% 870 2.4% 0 0.0% 0 0.0% 1,451 4.0% 12,838 35.4%
PEOPLE PER HOUSEHOLD
One 124,779 75,493 60.5% 2,211 1.8% 212 0.2% 423 0.3% 1,819 1.5% 44,622 35.8%
Two 221,729 155,830 70.3% 1,548 0.7% 1,341 0.6% 672 0.3% 2,621 1.2% 59,718 26.9%
Three 60,069 39,523 65.8% 877 1.5% 490 0.8% 246 0.4% 1,307 2.2% 17,626 29.3%
Four 48,897 33,875 69.3% 473 1.0% 873 1.8% 901 1.8% 1,998 4.1% 10,776 22.0%
Five + 29,337 17,700 60.3% 421 1.4% 402 1.4% 289 1.0% 1,405 4.8% 9,121 31.1%
HOUSEHOLD INCOME
Less Than $25,000 59,481 25,319 42.6% 2,302 3.9% 451 0.8% 267 0.4% 1,040 1.7% 30,102 50.6%
$25,000 ‐ $49,999 137,082 81,747 59.6% 1,184 0.9% 760 0.6% 717 0.5% 2,495 1.8% 50,180 36.6%
$50,000 ‐ $74,999 123,824 86,299 69.7% 885 0.7% 871 0.7% 1,115 0.9% 3,066 2.5% 31,587 25.5%
$75,000 ‐ $99,999 66,780 49,917 74.7% 608 0.9% 559 0.8% 100 0.2% 1,192 1.8% 14,403 21.6%
$100,000 + 97,644 79,139 81.0% 550 0.6% 678 0.7% 330 0.3% 1,356 1.4% 15,592 16.0%
WINNIPEG LICO‐125 CLASS
Yes 158,987 80,587 50.7% 3,279 2.1% 1,382 0.9% 1,213 0.8% 3,345 2.1% 69,180 43.5%
No 325,824 241,833 74.2% 2,250 0.7% 1,936 0.6% 1,317 0.4% 5,804 1.8% 72,684 22.3%
INDIGENOUS SELF‐DECLARED ANCESTRY
Yes 51,429 25,250 49.1% 1,311 2.5% 712 1.4% 638 1.2% 2,005 3.9% 21,514 41.8%
No 409,630 285,207 69.6% 4,116 1.0% 2,377 0.6% 1,777 0.4% 6,686 1.6% 109,467 26.7%
Undeclared 23,751 11,963 50.4% 103 0.4% 230 1.0% 115 0.5% 459 1.9% 10,883 45.8%
FIRST NATION ON RESERVE
FIRST NATION ON RESERVE 15,456 4,713 30.5% 591 3.8% 497 3.2% 249 1.6% 503 3.3% 8,903 57.6%
BILL PAYMENT RATING
Excel lent 439,339 301,226 68.6% 4,489 1.0% 2,683 0.6% 1,839 0.4% 6,492 1.5% 122,610 27.9%
Satis factory 22,395 11,991 53.5% 339 1.5% 174 0.8% 246 1.1% 922 4.1% 8,723 39.0%
Poor 23,077 9,203 39.9% 701 3.0% 461 2.0% 445 1.9% 1,736 7.5% 10,531 45.6%
DWELLING OWNERSHIP
Own 404,316 278,526 68.9% 3,818 0.9% 2,640 0.7% 2,110 0.5% 7,002 1.7% 110,219 27.3%
Rent / Other 80,495 43,894 54.5% 1,711 2.1% 678 0.8% 420 0.5% 2,147 2.7% 31,645 39.3%
2017 RESIDENTIAL SURVEY SECTION 9 ‐ BILLS AND RATES ‐ REFERENCE TABLE 9.07c
IN LAST TWO YEARS REDUCED SPENDING ON LOANS TO PAY FOR YOUR MANITOBA HYDRO BILL
Centra Gas Manitoba Inc. 2019/20 General Rate Application Appendix 7.7
March 22, 2019 Page 157 of 228

150
9.07d Reduced Spending on Insurance in the past Two Years to Pay Your Manitoba Hydro Bill
TOTAL NEVER % ONE % TWO % THREE % FOUR + %
CHOOSE
NOT TO
ANSWER %
OVERALL 484,811 331,998 68.5% 5,819 1.2% 3,137 0.6% 2,247 0.5% 6,461 1.3% 135,149 27.9%
FUEL AREA
Winnipeg City 261,760 189,188 72.3% 2,842 1.1% 1,310 0.5% 906 0.3% 3,003 1.1% 64,511 24.6%
Gas Avai lable 140,021 96,317 68.8% 1,747 1.2% 796 0.6% 708 0.5% 1,486 1.1% 38,967 27.8%
No Gas Avai lable 83,030 46,494 56.0% 1,229 1.5% 1,031 1.2% 633 0.8% 1,972 2.4% 31,671 38.1%
DWELLING TYPE
Single Detached 373,568 256,590 68.7% 4,047 1.1% 2,869 0.8% 1,891 0.5% 5,273 1.4% 102,898 27.5%
Multi Attached 46,834 31,030 66.3% 374 0.8% 105 0.2% 154 0.3% 444 0.9% 14,725 31.4%
Apartment Suite 64,409 44,378 68.9% 1,398 2.2% 163 0.3% 202 0.3% 743 1.2% 17,526 27.2%
BUILDING CODE ERA
2010‐2017 37,645 26,981 71.7% 364 1.0% 163 0.4% 476 1.3% 230 0.6% 9,430 25.1%
1990‐2009 89,181 61,468 68.9% 1,252 1.4% 714 0.8% 392 0.4% 1,263 1.4% 24,092 27.0%
1970‐1989 161,749 111,407 68.9% 1,666 1.0% 1,044 0.6% 833 0.5% 1,511 0.9% 45,288 28.0%
1950‐1969 110,314 77,083 69.9% 949 0.9% 631 0.6% 112 0.1% 1,536 1.4% 30,004 27.2%
Pre 1950 85,922 55,059 64.1% 1,586 1.8% 586 0.7% 435 0.5% 1,921 2.2% 26,335 30.6%
SPACE HEAT FUEL
Electric Heat 191,639 120,810 63.0% 3,097 1.6% 1,548 0.8% 1,314 0.7% 3,006 1.6% 61,864 32.3%
Natural Gas Heat 249,938 184,285 73.7% 1,851 0.7% 1,458 0.6% 933 0.4% 2,875 1.2% 58,535 23.4%
Other Fuel 6,945 4,032 58.1% 0 0.0% 131 1.9% 0 0.0% 0 0.0% 2,782 40.1%
Shared (No Heat on Bi l l ) 36,289 22,871 63.0% 870 2.4% 0 0.0% 0 0.0% 580 1.6% 11,968 33.0%
PEOPLE PER HOUSEHOLD
One 124,779 78,412 62.8% 1,581 1.3% 833 0.7% 329 0.3% 1,368 1.1% 42,256 33.9%
Two 221,729 159,653 72.0% 1,874 0.8% 1,376 0.6% 692 0.3% 2,187 1.0% 55,947 25.2%
Three 60,069 40,438 67.3% 1,240 2.1% 136 0.2% 62 0.1% 736 1.2% 17,456 29.1%
Four 48,897 34,910 71.4% 597 1.2% 503 1.0% 786 1.6% 1,468 3.0% 10,632 21.7%
Five + 29,337 18,585 63.4% 526 1.8% 289 1.0% 378 1.3% 701 2.4% 8,858 30.2%
HOUSEHOLD INCOME
Less Than $25,000 59,481 26,886 45.2% 1,715 2.9% 664 1.1% 285 0.5% 1,451 2.4% 28,479 47.9%
$25,000 ‐ $49,999 137,082 84,337 61.5% 1,433 1.0% 970 0.7% 806 0.6% 1,744 1.3% 47,792 34.9%
$50,000 ‐ $74,999 123,824 89,030 71.9% 1,225 1.0% 630 0.5% 852 0.7% 2,153 1.7% 29,933 24.2%
$75,000 ‐ $99,999 66,780 51,239 76.7% 542 0.8% 445 0.7% 100 0.2% 584 0.9% 13,870 20.8%
$100,000 + 97,644 80,506 82.4% 903 0.9% 428 0.4% 203 0.2% 528 0.5% 15,076 15.4%
WINNIPEG LICO‐125 CLASS
Yes 158,987 84,693 53.3% 3,121 2.0% 1,600 1.0% 1,433 0.9% 2,969 1.9% 65,170 41.0%
No 325,824 247,305 75.9% 2,698 0.8% 1,537 0.5% 814 0.2% 3,492 1.1% 69,979 21.5%
INDIGENOUS SELF‐DECLARED ANCESTRY
Yes 51,429 25,783 50.1% 1,351 2.6% 659 1.3% 401 0.8% 2,148 4.2% 21,088 41.0%
No 409,630 294,016 71.8% 4,167 1.0% 2,367 0.6% 1,846 0.5% 3,639 0.9% 103,595 25.3%
Undeclared 23,751 12,199 51.4% 301 1.3% 112 0.5% 0 0.0% 674 2.8% 10,466 44.1%
FIRST NATION ON RESERVE
FIRST NATION ON RESERVE 15,456 4,713 30.5% 783 5.1% 311 2.0% 187 1.2% 633 4.1% 8,829 57.1%
BILL PAYMENT RATING
Excel lent 439,339 309,477 70.4% 4,680 1.1% 2,655 0.6% 1,538 0.3% 4,715 1.1% 116,275 26.5%
Satis factory 22,395 12,580 56.2% 308 1.4% 358 1.6% 31 0.1% 712 3.2% 8,406 37.5%
Poor 23,077 9,941 43.1% 831 3.6% 124 0.5% 678 2.9% 1,034 4.5% 10,468 45.4%
DWELLING OWNERSHIP
Own 404,316 285,917 70.7% 3,963 1.0% 2,519 0.6% 1,921 0.5% 4,652 1.2% 105,346 26.1%
Rent / Other 80,495 46,081 57.2% 1,856 2.3% 619 0.8% 326 0.4% 1,809 2.2% 29,803 37.0%
2017 RESIDENTIAL SURVEY SECTION 9 ‐ BILLS AND RATES ‐ REFERENCE TABLE 9.07d
IN LAST TWO YEARS REDUCED SPENDING ON INSURANCE TO PAY FOR YOUR MANITOBA HYDRO BILL
Centra Gas Manitoba Inc. 2019/20 General Rate Application Appendix 7.7
March 22, 2019 Page 158 of 228

151
9.07e Reduced Spending on Clothing in the past Two Years to Pay Your Manitoba Hydro Bill
TOTAL NEVER % ONE % TWO % THREE % FOUR + %
CHOOSE
NOT TO
ANSWER %
OVERALL 484,811 297,251 61.3% ##### 2.4% 13,330 2.7% 9,180 1.9% 34,879 7.2% 118,577 24.5%
FUEL AREA
Winnipeg City 261,760 170,894 65.3% 6,507 2.5% 5,550 2.1% 4,622 1.8% 17,453 6.7% 56,734 21.7%
Gas Avai lable 140,021 87,096 62.2% 2,479 1.8% 3,951 2.8% 2,943 2.1% 8,367 6.0% 35,185 25.1%
No Gas Avai lable 83,030 39,260 47.3% 2,608 3.1% 3,830 4.6% 1,615 1.9% 9,059 10.9% 26,659 32.1%
DWELLING TYPE
Single Detached 373,568 229,387 61.4% 8,901 2.4% 11,179 3.0% 6,956 1.9% 26,738 7.2% 90,407 24.2%
Multi Attached 46,834 26,225 56.0% 877 1.9% 1,174 2.5% 1,205 2.6% 4,115 8.8% 13,238 28.3%
Apartment Suite 64,409 41,639 64.6% 1,815 2.8% 977 1.5% 1,019 1.6% 4,027 6.3% 14,932 23.2%
BUILDING CODE ERA
2010‐2017 37,645 23,275 61.8% 804 2.1% 1,206 3.2% 1,690 4.5% 2,628 7.0% 8,042 21.4%
1990‐2009 89,181 56,703 63.6% 1,679 1.9% 1,985 2.2% 1,510 1.7% 5,246 5.9% 22,060 24.7%
1970‐1989 161,749 99,406 61.5% 3,756 2.3% 4,200 2.6% 3,242 2.0% 11,055 6.8% 40,089 24.8%
1950‐1969 110,314 69,751 63.2% 3,291 3.0% 2,092 1.9% 1,536 1.4% 6,929 6.3% 26,715 24.2%
Pre 1950 85,922 48,116 56.0% 2,064 2.4% 3,847 4.5% 1,202 1.4% 9,022 10.5% 21,671 25.2%
SPACE HEAT FUEL
Electric Heat 191,639 104,192 54.4% 4,558 2.4% 7,517 3.9% 3,837 2.0% 17,563 9.2% 53,973 28.2%
Natural Gas Heat 249,938 167,808 67.1% 5,454 2.2% 5,476 2.2% 4,922 2.0% 14,084 5.6% 52,195 20.9%
Other Fuel 6,945 3,694 53.2% 131 1.9% 337 4.9% 131 1.9% 469 6.7% 2,182 31.4%
Shared (No Heat on Bi l l ) 36,289 21,557 59.4% 1,451 4.0% 0 0.0% 290 0.8% 2,765 7.6% 10,227 28.2%
PEOPLE PER HOUSEHOLD
One 124,779 70,209 56.3% 1,721 1.4% 3,612 2.9% 1,808 1.4% 9,807 7.9% 37,622 30.2%
Two 221,729 149,880 67.6% 3,887 1.8% 3,796 1.7% 2,878 1.3% 11,727 5.3% 49,562 22.4%
Three 60,069 33,863 56.4% 1,962 3.3% 2,799 4.7% 1,217 2.0% 4,891 8.1% 15,338 25.5%
Four 48,897 29,709 60.8% 2,404 4.9% 1,766 3.6% 1,736 3.6% 4,556 9.3% 8,725 17.8%
Five + 29,337 13,590 46.3% 1,620 5.5% 1,357 4.6% 1,541 5.3% 3,899 13.3% 7,330 25.0%
HOUSEHOLD INCOME
Less Than $25,000 59,481 23,730 39.9% 1,961 3.3% 3,367 5.7% 1,489 2.5% 5,455 9.2% 23,478 39.5%
$25,000 ‐ $49,999 137,082 73,380 53.5% 2,765 2.0% 3,996 2.9% 2,227 1.6% 11,843 8.6% 42,871 31.3%
$50,000 ‐ $74,999 123,824 79,219 64.0% 2,138 1.7% 2,344 1.9% 3,138 2.5% 10,023 8.1% 26,962 21.8%
$75,000 ‐ $99,999 66,780 45,942 68.8% 2,058 3.1% 1,468 2.2% 1,098 1.6% 3,692 5.5% 12,522 18.8%
$100,000 + 97,644 74,980 76.8% 2,671 2.7% 2,155 2.2% 1,228 1.3% 3,866 4.0% 12,744 13.1%
WINNIPEG LICO‐125 CLASS
Yes 158,987 72,407 45.5% 4,763 3.0% 6,580 4.1% 3,833 2.4% 15,298 9.6% 56,106 35.3%
No 325,824 224,844 69.0% 6,831 2.1% 6,750 2.1% 5,347 1.6% 19,582 6.0% 62,471 19.2%
INDIGENOUS SELF‐DECLARED ANCESTRY
Yes 51,429 21,128 41.1% 2,536 4.9% 2,358 4.6% 1,426 2.8% 7,257 14.1% 16,724 32.5%
No 409,630 265,393 64.8% 8,443 2.1% 10,286 2.5% 7,525 1.8% 25,601 6.2% 92,382 22.6%
Undeclared 23,751 10,729 45.2% 615 2.6% 686 2.9% 230 1.0% 2,021 8.5% 9,471 39.9%
FIRST NATION ON RESERVE
FIRST NATION ON RESERVE 15,456 3,806 24.6% 1,026 6.6% 1,037 6.7% 814 5.3% 2,013 13.0% 6,760 43.7%
BILL PAYMENT RATING
Excel lent 439,339 281,774 64.1% 8,825 2.0% 10,711 2.4% 7,493 1.7% 27,239 6.2% 103,297 23.5%
Satis factory 22,395 9,214 41.1% 1,038 4.6% 833 3.7% 794 3.5% 3,214 14.3% 7,303 32.6%
Poor 23,077 6,263 27.1% 1,730 7.5% 1,786 7.7% 893 3.9% 4,427 19.2% 7,978 34.6%
DWELLING OWNERSHIP
Own 404,316 257,502 63.7% 7,876 1.9% 10,809 2.7% 7,221 1.8% 26,885 6.6% 94,024 23.3%
Rent / Other 80,495 39,749 49.4% 3,718 4.6% 2,521 3.1% 1,959 2.4% 7,994 9.9% 24,553 30.5%
2017 RESIDENTIAL SURVEY SECTION 9 ‐ BILLS AND RATES ‐ REFERENCE TABLE 9.07e
IN LAST TWO YEARS REDUCED SPENDING ON CLOTHING TO PAY FOR YOUR MANITOBA HYDRO BILL
Centra Gas Manitoba Inc. 2019/20 General Rate Application Appendix 7.7
March 22, 2019 Page 159 of 228

152
9.07f Reduced Spending on Entertainment in the past Two Years to Pay Your Manitoba Hydro Bill
TOTAL NEVER % ONE % TWO % THREE % FOUR + %
CHOOSE
NOT TO
ANSWER %
OVERALL 484,811 289,031 59.6% 10,345 2.1% 12,904 2.7% 8,787 1.8% 42,173 8.7% 121,571 25.1%
FUEL AREA
Winnipeg City 261,760 166,613 63.7% 5,255 2.0% 6,109 2.3% 4,180 1.6% 21,420 8.2% 58,183 22.2%
Gas Avai lable 140,021 84,571 60.4% 2,811 2.0% 4,035 2.9% 2,944 2.1% 10,993 7.9% 34,666 24.8%
No Gas Avai lable 83,030 37,846 45.6% 2,279 2.7% 2,760 3.3% 1,663 2.0% 9,760 11.8% 28,722 34.6%
DWELLING TYPE
Single Detached 373,568 222,737 59.6% 8,967 2.4% 10,385 2.8% 7,092 1.9% 32,008 8.6% 92,379 24.7%
Multi Attached 46,834 26,541 56.7% 723 1.5% 1,050 2.2% 588 1.3% 4,578 9.8% 13,354 28.5%
Apartment Sui te 64,409 39,753 61.7% 655 1.0% 1,468 2.3% 1,108 1.7% 5,587 8.7% 15,838 24.6%
BUILDING CODE ERA
2010‐2017 37,645 22,303 59.2% 1,045 2.8% 1,077 2.9% 1,608 4.3% 3,522 9.4% 8,090 21.5%
1990‐2009 89,181 55,570 62.3% 1,682 1.9% 1,780 2.0% 1,336 1.5% 6,488 7.3% 22,326 25.0%
1970‐1989 161,749 97,806 60.5% 3,012 1.9% 4,032 2.5% 3,243 2.0% 12,447 7.7% 41,208 25.5%
1950‐1969 110,314 67,288 61.0% 2,961 2.7% 2,683 2.4% 1,488 1.3% 9,063 8.2% 26,831 24.3%
Pre 1950 85,922 46,063 53.6% 1,645 1.9% 3,332 3.9% 1,112 1.3% 10,653 12.4% 23,117 26.9%
SPACE HEAT FUEL
Electric Heat 191,639 100,439 52.4% 4,841 2.5% 6,669 3.5% 3,915 2.0% 20,740 10.8% 55,036 28.7%
Natura l Gas Heat 249,938 164,211 65.7% 5,083 2.0% 5,945 2.4% 4,292 1.7% 17,330 6.9% 53,077 21.2%
Other Fuel 6,945 3,694 53.2% 131 1.9% 0 0.0% 0 0.0% 469 6.7% 2,651 38.2%
Shared (No Heat on Bi l l ) 36,289 20,686 57.0% 290 0.8% 290 0.8% 580 1.6% 3,635 10.0% 10,807 29.8%
PEOPLE PER HOUSEHOLD
One 124,779 69,013 55.3% 1,452 1.2% 2,953 2.4% 1,429 1.1% 11,676 9.4% 38,255 30.7%
Two 221,729 146,157 65.9% 3,926 1.8% 3,702 1.7% 3,684 1.7% 14,572 6.6% 49,688 22.4%
Three 60,069 31,936 53.2% 1,409 2.3% 3,155 5.3% 893 1.5% 6,032 10.0% 16,645 27.7%
Four 48,897 28,777 58.9% 2,276 4.7% 1,703 3.5% 2,117 4.3% 4,819 9.9% 9,205 18.8%
Five + 29,337 13,147 44.8% 1,282 4.4% 1,391 4.7% 664 2.3% 5,074 17.3% 7,778 26.5%
HOUSEHOLD INCOME
Less Than $25,000 59,481 23,265 39.1% 1,534 2.6% 1,695 2.9% 653 1.1% 7,077 11.9% 25,257 42.5%
$25,000 ‐ $49,999 137,082 70,866 51.7% 2,473 1.8% 4,276 3.1% 2,419 1.8% 13,653 10.0% 43,396 31.7%
$50,000 ‐ $74,999 123,824 77,011 62.2% 2,264 1.8% 2,754 2.2% 2,805 2.3% 11,594 9.4% 27,397 22.1%
$75,000 ‐ $99,999 66,780 44,526 66.7% 1,286 1.9% 2,259 3.4% 1,073 1.6% 5,064 7.6% 12,571 18.8%
$100,000 + 97,644 73,363 75.1% 2,789 2.9% 1,920 2.0% 1,837 1.9% 4,784 4.9% 12,951 13.3%
WINNIPEG LICO‐125 CLASS
Yes 158,987 69,922 44.0% 3,493 2.2% 5,154 3.2% 2,689 1.7% 18,041 11.3% 59,689 37.5%
No 325,824 219,109 67.2% 6,852 2.1% 7,751 2.4% 6,098 1.9% 24,132 7.4% 61,883 19.0%
INDIGENOUS SELF‐DECLARED ANCESTRY
Yes 51,429 19,658 38.2% 1,621 3.2% 2,582 5.0% 1,706 3.3% 7,613 14.8% 18,249 35.5%
No 409,630 258,552 63.1% 8,410 2.1% 9,622 2.3% 6,649 1.6% 32,539 7.9% 93,859 22.9%
Undeclared 23,751 10,820 45.6% 314 1.3% 700 2.9% 432 1.8% 2,021 8.5% 9,464 39.8%
FIRST NATION ON RESERVE
FIRST NATION ON RESERVE 15,456 3,619 23.4% 808 5.2% 752 4.9% 659 4.3% 2,075 13.4% 7,543 48.8%
BILL PAYMENT RATING
Excel lent 439,339 274,247 62.4% 8,706 2.0% 10,235 2.3% 7,416 1.7% 33,510 7.6% 105,224 24.0%
Sati s factory 22,395 8,839 39.5% 774 3.5% 1,151 5.1% 320 1.4% 3,090 13.8% 8,220 36.7%
Poor 23,077 5,944 25.8% 864 3.7% 1,518 6.6% 1,051 4.6% 5,573 24.2% 8,127 35.2%
DWELLING OWNERSHIP
Own 404,316 250,534 62.0% 8,229 2.0% 10,841 2.7% 6,822 1.7% 32,733 8.1% 95,157 23.5%
Rent / Other 80,495 38,497 47.8% 2,115 2.6% 2,063 2.6% 1,965 2.4% 9,440 11.7% 26,414 32.8%
2017 RESIDENTIAL SURVEY SECTION 9 ‐ BILLS AND RATES ‐ REFERENCE TABLE 9.07f
IN LAST 2 YEARS REDUCED SPENDING ON ENTERTAINMENT TO PAY FOR YOUR MANITOBA HYDRO BILL
Centra Gas Manitoba Inc. 2019/20 General Rate Application Appendix 7.7
March 22, 2019 Page 160 of 228

153
9.07g Reduced Spending on Travel in the past Two Years to Pay Your Manitoba Hydro Bill
TOTAL NEVER % ONE % TWO % THREE % FOUR + %
CHOOSE
NOT TO
ANSWER %
OVERALL 484,811 295,300 60.9% 10,682 2.2% 10,841 2.2% 6,851 1.4% 37,309 7.7% 123,829 25.5%
FUEL AREA
Winnipeg City 261,760 169,571 64.8% 5,935 2.3% 5,416 2.1% 2,619 1.0% 18,496 7.1% 59,723 22.8%
Gas Avai lable 140,021 86,546 61.8% 2,512 1.8% 3,185 2.3% 3,034 2.2% 9,298 6.6% 35,446 25.3%
No Gas Avai lable 83,030 39,182 47.2% 2,235 2.7% 2,239 2.7% 1,198 1.4% 9,516 11.5% 28,660 34.5%
DWELLING TYPE
Single Detached 373,568 228,042 61.0% 8,704 2.3% 8,872 2.4% 5,348 1.4% 28,615 7.7% 93,987 25.2%
Multi Attached 46,834 26,781 57.2% 1,321 2.8% 702 1.5% 154 0.3% 3,744 8.0% 14,131 30.2%
Apartment Sui te 64,409 40,476 62.8% 657 1.0% 1,267 2.0% 1,349 2.1% 4,950 7.7% 15,711 24.4%
BUILDING CODE ERA
2010‐2017 37,645 23,133 61.5% 1,477 3.9% 824 2.2% 992 2.6% 2,156 5.7% 9,063 24.1%
1990‐2009 89,181 56,010 62.8% 1,897 2.1% 2,048 2.3% 1,013 1.1% 5,714 6.4% 22,499 25.2%
1970‐1989 161,749 99,668 61.6% 3,082 1.9% 4,006 2.5% 2,638 1.6% 11,422 7.1% 40,933 25.3%
1950‐1969 110,314 69,239 62.8% 1,917 1.7% 1,684 1.5% 1,409 1.3% 8,751 7.9% 27,315 24.8%
Pre 1950 85,922 47,250 55.0% 2,309 2.7% 2,279 2.7% 799 0.9% 9,267 10.8% 24,019 28.0%
SPACE HEAT FUEL
Electric Heat 191,639 103,622 54.1% 4,638 2.4% 5,813 3.0% 3,472 1.8% 17,968 9.4% 56,126 29.3%
Natura l Gas Heat 249,938 167,403 67.0% 5,469 2.2% 4,737 1.9% 2,799 1.1% 14,995 6.0% 54,535 21.8%
Other Fuel 6,945 4,032 58.1% 131 1.9% 0 0.0% 0 0.0% 131 1.9% 2,651 38.2%
Shared (No Heat on Bi l l ) 36,289 20,243 55.8% 444 1.2% 290 0.8% 580 1.6% 4,215 11.6% 10,517 29.0%
PEOPLE PER HOUSEHOLD
One 124,779 70,295 56.3% 1,813 1.5% 2,822 2.3% 1,471 1.2% 9,936 8.0% 38,443 30.8%
Two 221,729 147,795 66.7% 3,276 1.5% 3,697 1.7% 2,297 1.0% 13,657 6.2% 51,007 23.0%
Three 60,069 32,765 54.5% 2,041 3.4% 2,240 3.7% 892 1.5% 5,288 8.8% 16,844 28.0%
Four 48,897 30,222 61.8% 2,022 4.1% 1,252 2.6% 1,462 3.0% 4,389 9.0% 9,549 19.5%
Five + 29,337 14,223 48.5% 1,530 5.2% 830 2.8% 729 2.5% 4,040 13.8% 7,985 27.2%
HOUSEHOLD INCOME
Less Than $25,000 59,481 25,201 42.4% 1,140 1.9% 2,110 3.5% 746 1.3% 4,789 8.1% 25,495 42.9%
$25,000 ‐ $49,999 137,082 72,287 52.7% 1,823 1.3% 3,087 2.3% 2,164 1.6% 14,042 10.2% 43,680 31.9%
$50,000 ‐ $74,999 123,824 77,944 62.9% 2,420 2.0% 2,881 2.3% 2,233 1.8% 10,241 8.3% 28,105 22.7%
$75,000 ‐ $99,999 66,780 45,872 68.7% 1,535 2.3% 1,500 2.2% 468 0.7% 4,196 6.3% 13,209 19.8%
$100,000 + 97,644 73,996 75.8% 3,764 3.9% 1,262 1.3% 1,240 1.3% 4,042 4.1% 13,340 13.7%
WINNIPEG LICO‐125 CLASS
Yes 158,987 72,831 45.8% 2,990 1.9% 4,768 3.0% 2,917 1.8% 15,301 9.6% 60,180 37.9%
No 325,824 222,469 68.3% 7,692 2.4% 6,073 1.9% 3,933 1.2% 22,009 6.8% 63,649 19.5%
INDIGENOUS SELF‐DECLARED ANCESTRY
Yes 51,429 21,575 42.0% 1,346 2.6% 1,830 3.6% 1,363 2.6% 6,767 13.2% 18,548 36.1%
No 409,630 262,696 64.1% 8,920 2.2% 8,495 2.1% 5,271 1.3% 28,673 7.0% 95,575 23.3%
Undeclared 23,751 11,028 46.4% 416 1.8% 516 2.2% 217 0.9% 1,869 7.9% 9,706 40.9%
FIRST NATION ON RESERVE
FIRST NATION ON RESERVE 15,456 3,967 25.7% 622 4.0% 789 5.1% 529 3.4% 2,069 13.4% 7,481 48.4%
BILL PAYMENT RATING
Excel lent 439,339 278,843 63.5% 9,500 2.2% 9,120 2.1% 5,847 1.3% 29,780 6.8% 106,249 24.2%
Sati s factory 22,395 9,839 43.9% 566 2.5% 758 3.4% 93 0.4% 2,762 12.3% 8,377 37.4%
Poor 23,077 6,617 28.7% 616 2.7% 963 4.2% 910 3.9% 4,767 20.7% 9,203 39.9%
DWELLING OWNERSHIP
Own 404,316 255,023 63.1% 9,318 2.3% 9,183 2.3% 5,451 1.3% 28,629 7.1% 96,712 23.9%
Rent / Other 80,495 40,277 50.0% 1,364 1.7% 1,657 2.1% 1,400 1.7% 8,680 10.8% 27,117 33.7%
2017 RESIDENTIAL SURVEY SECTION 9 ‐ BILLS AND RATES ‐ REFERENCE TABLE 9.07g
IN LAST TWO YEARS REDUCED SPENDING ON TRAVEL TO PAY FOR YOUR MANITOBA HYDRO BILL
Centra Gas Manitoba Inc. 2019/20 General Rate Application Appendix 7.7
March 22, 2019 Page 161 of 228

154
9.07h Reduced Spending on Cell Phones in the past Two Years to Pay Your Manitoba Hydro Bill
TOTAL NEVER % ONE % TWO % THREE % FOUR + %
CHOOSE
NOT TO
ANSWER %
OVERALL 484,811 319,699 65.9% 6,553 1.4% 6,268 1.3% 3,672 0.8% 11,668 2.4% 136,949 28.2%
FUEL AREA
Winnipeg City 261,760 182,459 69.7% 3,458 1.3% 3,193 1.2% 1,525 0.6% 6,159 2.4% 64,966 24.8%
Gas Avai lable 140,021 94,127 67.2% 1,314 0.9% 1,505 1.1% 1,265 0.9% 1,911 1.4% 39,900 28.5%
No Gas Avai lable 83,030 43,113 51.9% 1,782 2.1% 1,571 1.9% 882 1.1% 3,598 4.3% 32,084 38.6%
DWELLING TYPE
Single Detached 373,568 247,012 66.1% 5,203 1.4% 4,968 1.3% 2,404 0.6% 8,774 2.3% 105,206 28.2%
Multi Attached 46,834 29,413 62.8% 444 0.9% 847 1.8% 412 0.9% 1,118 2.4% 14,599 31.2%
Apartment Sui te 64,409 43,274 67.2% 906 1.4% 453 0.7% 857 1.3% 1,776 2.8% 17,144 26.6%
BUILDING CODE ERA
2010‐2017 37,645 25,780 68.5% 559 1.5% 399 1.1% 559 1.5% 599 1.6% 9,749 25.9%
1990‐2009 89,181 59,245 66.4% 1,494 1.7% 1,554 1.7% 623 0.7% 1,612 1.8% 24,653 27.6%
1970‐1989 161,749 107,510 66.5% 1,674 1.0% 2,044 1.3% 1,108 0.7% 4,078 2.5% 45,335 28.0%
1950‐1969 110,314 74,063 67.1% 1,686 1.5% 1,305 1.2% 781 0.7% 2,660 2.4% 29,819 27.0%
Pre 1950 85,922 53,102 61.8% 1,140 1.3% 966 1.1% 601 0.7% 2,719 3.2% 27,394 31.9%
SPACE HEAT FUEL
Electric Heat 191,639 114,886 59.9% 3,189 1.7% 3,009 1.6% 2,102 1.1% 5,450 2.8% 63,003 32.9%
Natura l Gas Heat 249,938 178,201 71.3% 2,784 1.1% 2,838 1.1% 1,280 0.5% 4,768 1.9% 60,066 24.0%
Other Fuel 6,945 4,032 58.1% 0 0.0% 131 1.9% 0 0.0% 0 0.0% 2,782 40.1%
Shared (No Heat on Bi l l ) 36,289 22,581 62.2% 580 1.6% 290 0.8% 290 0.8% 1,451 4.0% 11,097 30.6%
PEOPLE PER HOUSEHOLD
One 124,779 75,929 60.9% 895 0.7% 1,219 1.0% 489 0.4% 2,884 2.3% 43,363 34.8%
Two 221,729 154,865 69.8% 2,711 1.2% 2,366 1.1% 1,534 0.7% 3,478 1.6% 56,775 25.6%
Three 60,069 38,381 63.9% 838 1.4% 896 1.5% 775 1.3% 1,707 2.8% 17,472 29.1%
Four 48,897 33,725 69.0% 1,325 2.7% 1,124 2.3% 484 1.0% 1,969 4.0% 10,271 21.0%
Five + 29,337 16,800 57.3% 785 2.7% 664 2.3% 389 1.3% 1,630 5.6% 9,068 30.9%
HOUSEHOLD INCOME
Less Than $25,000 59,481 26,202 44.1% 1,377 2.3% 1,538 2.6% 1,070 1.8% 2,003 3.4% 27,291 45.9%
$25,000 ‐ $49,999 137,082 77,910 56.8% 1,941 1.4% 2,061 1.5% 995 0.7% 4,733 3.5% 49,441 36.1%
$50,000 ‐ $74,999 123,824 85,277 68.9% 1,703 1.4% 1,759 1.4% 943 0.8% 2,950 2.4% 31,192 25.2%
$75,000 ‐ $99,999 66,780 50,506 75.6% 747 1.1% 375 0.6% 316 0.5% 1,040 1.6% 13,796 20.7%
$100,000 + 97,644 79,804 81.7% 785 0.8% 535 0.5% 349 0.4% 943 1.0% 15,228 15.6%
WINNIPEG LICO‐125 CLASS
Yes 158,987 78,235 49.2% 3,189 2.0% 3,647 2.3% 1,909 1.2% 6,076 3.8% 65,931 41.5%
No 325,824 241,464 74.1% 3,365 1.0% 2,621 0.8% 1,763 0.5% 5,592 1.7% 71,018 21.8%
INDIGENOUS SELF‐DECLARED ANCESTRY
Yes 51,429 23,860 46.4% 1,872 3.6% 1,702 3.3% 952 1.9% 3,621 7.0% 19,422 37.8%
No 409,630 284,419 69.4% 4,349 1.1% 4,349 1.1% 2,615 0.6% 7,216 1.8% 106,681 26.0%
Undeclared 23,751 11,420 48.1% 332 1.4% 217 0.9% 105 0.4% 831 3.5% 10,847 45.7%
FIRST NATION ON RESERVE
FIRST NATION ON RESERVE 15,456 4,086 26.4% 1,193 7.7% 659 4.3% 435 2.8% 1,255 8.1% 7,828 50.6%
BILL PAYMENT RATING
Excel lent 439,339 299,963 68.3% 4,951 1.1% 4,340 1.0% 2,105 0.5% 8,440 1.9% 119,539 27.2%
Sati s factory 22,395 11,343 50.7% 500 2.2% 561 2.5% 616 2.7% 1,233 5.5% 8,142 36.4%
Poor 23,077 8,393 36.4% 1,103 4.8% 1,367 5.9% 952 4.1% 1,995 8.6% 9,268 40.2%
DWELLING OWNERSHIP
Own 404,316 277,133 68.5% 4,421 1.1% 4,386 1.1% 2,291 0.6% 8,048 2.0% 108,036 26.7%
Rent / Other 80,495 42,566 52.9% 2,132 2.6% 1,883 2.3% 1,381 1.7% 3,620 4.5% 28,913 35.9%
2017 RESIDENTIAL SURVEY SECTION 9 ‐ BILLS AND RATES ‐ REFERENCE TABLE 9.07h
IN LAST TWO YEARS REDUCED SPENDING ON CELL PHONES TO PAY FOR YOUR MANITOBA HYDRO BILL
Centra Gas Manitoba Inc. 2019/20 General Rate Application Appendix 7.7
March 22, 2019 Page 162 of 228

155
9.07i Reduced Spending on Cable TV in the past Two Years to Pay Your Manitoba Hydro Bill
TOTAL NEVER % ONE % TWO % THREE % FOUR + %
CHOOSE
NOT TO
ANSWER %
OVERALL 484,811 312,858 64.5% 8,636 1.8% 8,939 1.8% 3,569 0.7% 17,359 3.6% 133,450 27.5%
FUEL AREA
Winnipeg City 261,760 178,935 68.4% 4,351 1.7% 4,890 1.9% 2,091 0.8% 10,226 3.9% 61,267 23.4%
Gas Avai lable 140,021 91,590 65.4% 2,427 1.7% 2,409 1.7% 708 0.5% 2,608 1.9% 40,278 28.8%
No Gas Avai lable 83,030 42,332 51.0% 1,858 2.2% 1,640 2.0% 770 0.9% 4,525 5.4% 31,905 38.4%
DWELLING TYPE
Single Detached 373,568 242,108 64.8% 6,477 1.7% 7,927 2.1% 2,768 0.7% 11,733 3.1% 102,554 27.5%
Multi Attached 46,834 28,530 60.9% 791 1.7% 520 1.1% 309 0.7% 2,130 4.5% 14,555 31.1%
Apartment Sui te 64,409 42,219 65.5% 1,369 2.1% 492 0.8% 492 0.8% 3,495 5.4% 16,341 25.4%
BUILDING CODE ERA
2010‐2017 37,645 25,361 67.4% 538 1.4% 572 1.5% 357 0.9% 1,196 3.2% 9,620 25.6%
1990‐2009 89,181 57,970 65.0% 1,854 2.1% 1,920 2.2% 418 0.5% 2,557 2.9% 24,463 27.4%
1970‐1989 161,749 105,467 65.2% 3,274 2.0% 2,586 1.6% 845 0.5% 5,297 3.3% 44,280 27.4%
1950‐1969 110,314 73,369 66.5% 1,453 1.3% 1,849 1.7% 344 0.3% 4,287 3.9% 29,012 26.3%
Pre 1950 85,922 50,690 59.0% 1,517 1.8% 2,011 2.3% 1,604 1.9% 4,023 4.7% 26,076 30.3%
SPACE HEAT FUEL
Electric Heat 191,639 111,055 57.9% 4,475 2.3% 3,898 2.0% 1,273 0.7% 7,641 4.0% 63,298 33.0%
Natura l Gas Heat 249,938 176,072 70.4% 3,808 1.5% 4,620 1.8% 2,006 0.8% 6,906 2.8% 56,527 22.6%
Other Fuel 6,945 4,032 58.1% 0 0.0% 131 1.9% 0 0.0% 337 4.9% 2,445 35.2%
Shared (No Heat on Bi l l ) 36,289 21,700 59.8% 353 1.0% 290 0.8% 290 0.8% 2,474 6.8% 11,181 30.8%
PEOPLE PER HOUSEHOLD
One 124,779 73,925 59.2% 1,644 1.3% 1,460 1.2% 662 0.5% 4,812 3.9% 42,276 33.9%
Two 221,729 153,517 69.2% 3,027 1.4% 3,742 1.7% 766 0.3% 5,251 2.4% 55,426 25.0%
Three 60,069 36,729 61.1% 1,100 1.8% 1,581 2.6% 653 1.1% 3,377 5.6% 16,631 27.7%
Four 48,897 32,682 66.8% 1,622 3.3% 1,484 3.0% 984 2.0% 1,969 4.0% 10,156 20.8%
Five + 29,337 16,004 54.6% 1,244 4.2% 672 2.3% 504 1.7% 1,951 6.7% 8,961 30.5%
HOUSEHOLD INCOME
Less Than $25,000 59,481 25,486 42.8% 1,791 3.0% 1,845 3.1% 1,074 1.8% 2,572 4.3% 26,713 44.9%
$25,000 ‐ $49,999 137,082 77,692 56.7% 2,127 1.6% 2,683 2.0% 807 0.6% 6,243 4.6% 47,531 34.7%
$50,000 ‐ $74,999 123,824 82,869 66.9% 2,123 1.7% 2,449 2.0% 594 0.5% 5,187 4.2% 30,603 24.7%
$75,000 ‐ $99,999 66,780 49,005 73.4% 1,140 1.7% 1,009 1.5% 445 0.7% 1,852 2.8% 13,330 20.0%
$100,000 + 97,644 77,807 79.7% 1,455 1.5% 954 1.0% 650 0.7% 1,505 1.5% 15,274 15.6%
WINNIPEG LICO‐125 CLASS
Yes 158,987 77,167 48.5% 3,643 2.3% 4,617 2.9% 2,054 1.3% 7,441 4.7% 64,065 40.3%
No 325,824 235,691 72.3% 4,993 1.5% 4,322 1.3% 1,514 0.5% 9,918 3.0% 69,386 21.3%
INDIGENOUS SELF‐DECLARED ANCESTRY
Yes 51,429 23,472 45.6% 2,002 3.9% 2,245 4.4% 662 1.3% 4,480 8.7% 18,568 36.1%
No 409,630 277,868 67.8% 6,302 1.5% 6,330 1.5% 2,566 0.6% 11,949 2.9% 104,615 25.5%
Undeclared 23,751 11,518 48.5% 332 1.4% 363 1.5% 341 1.4% 930 3.9% 10,267 43.2%
FIRST NATION ON RESERVE
FIRST NATION ON RESERVE 15,456 4,216 27.3% 1,157 7.5% 808 5.2% 435 2.8% 1,224 7.9% 7,616 49.3%
BILL PAYMENT RATING
Excel lent 439,339 294,194 67.0% 6,791 1.5% 6,694 1.5% 2,658 0.6% 13,465 3.1% 115,537 26.3%
Sati s factory 22,395 10,854 48.5% 592 2.6% 756 3.4% 350 1.6% 1,254 5.6% 8,589 38.4%
Poor 23,077 7,810 33.8% 1,254 5.4% 1,489 6.5% 561 2.4% 2,639 11.4% 9,324 40.4%
DWELLING OWNERSHIP
Own 404,316 271,039 67.0% 5,998 1.5% 7,569 1.9% 2,486 0.6% 11,618 2.9% 105,606 26.1%
Rent / Other 80,495 41,819 52.0% 2,638 3.3% 1,370 1.7% 1,082 1.3% 5,741 7.1% 27,845 34.6%
2017 RESIDENTIAL SURVEY SECTION 9 ‐ BILLS AND RATES ‐ REFERENCE TABLE 9.07i
IN LAST TWO YEARS REDUCED SPENDING ON CABLE TV TO PAY FOR YOUR MANITOBA HYDRO BILL
Centra Gas Manitoba Inc. 2019/20 General Rate Application Appendix 7.7
March 22, 2019 Page 163 of 228

156
9.07j Reduced Spending on Transportation in the past Two Years to Pay Your Manitoba Hydro Bill
TOTAL NEVER % ONE % TWO % THREE % FOUR + %
CHOOSE
NOT TO
ANSWER %
OVERALL 484,811 314,313 64.8% 8,119 1.7% 8,461 1.7% 4,599 0.9% 18,592 3.8% 130,726 27.0%
FUEL AREA
Winnipeg City 261,760 181,502 69.3% 3,840 1.5% 3,690 1.4% 2,193 0.8% 8,342 3.2% 62,195 23.8%
Gas Avai lable 140,021 90,861 64.9% 2,234 1.6% 2,308 1.6% 1,315 0.9% 4,482 3.2% 38,822 27.7%
No Gas Avai lable 83,030 41,951 50.5% 2,045 2.5% 2,464 3.0% 1,092 1.3% 5,768 6.9% 29,710 35.8%
DWELLING TYPE
Single Detached 373,568 242,526 64.9% 6,112 1.6% 6,613 1.8% 3,926 1.1% 14,674 3.9% 99,717 26.7%
Multi Attached 46,834 28,135 60.1% 934 2.0% 327 0.7% 309 0.7% 1,904 4.1% 15,224 32.5%
Apartment Sui te 64,409 43,652 67.8% 1,072 1.7% 1,521 2.4% 365 0.6% 2,013 3.1% 15,785 24.5%
BUILDING CODE ERA
2010‐2017 37,645 26,043 69.2% 591 1.6% 343 0.9% 357 0.9% 923 2.5% 9,387 24.9%
1990‐2009 89,181 59,327 66.5% 1,563 1.8% 1,238 1.4% 677 0.8% 2,972 3.3% 23,404 26.2%
1970‐1989 161,749 104,249 64.5% 2,648 1.6% 3,168 2.0% 1,595 1.0% 6,498 4.0% 43,590 26.9%
1950‐1969 110,314 72,815 66.0% 2,267 2.1% 1,340 1.2% 707 0.6% 3,642 3.3% 29,543 26.8%
Pre 1950 85,922 51,879 60.4% 1,049 1.2% 2,373 2.8% 1,263 1.5% 4,557 5.3% 24,801 28.9%
SPACE HEAT FUEL
Electric Heat 191,639 110,576 57.7% 3,433 1.8% 4,851 2.5% 2,159 1.1% 10,824 5.6% 59,795 31.2%
Natura l Gas Heat 249,938 176,882 70.8% 3,478 1.4% 2,608 1.0% 2,440 1.0% 6,607 2.6% 57,922 23.2%
Other Fuel 6,945 3,694 53.2% 337 4.9% 131 1.9% 0 0.0% 0 0.0% 2,782 40.1%
Shared (No Heat on Bi l l ) 36,289 23,161 63.8% 870 2.4% 870 2.4% 0 0.0% 1,160 3.2% 10,227 28.2%
PEOPLE PER HOUSEHOLD
One 124,779 73,817 59.2% 1,760 1.4% 2,542 2.0% 842 0.7% 4,676 3.7% 41,143 33.0%
Two 221,729 153,023 69.0% 2,834 1.3% 3,121 1.4% 2,048 0.9% 6,789 3.1% 53,914 24.3%
Three 60,069 37,473 62.4% 1,288 2.1% 1,489 2.5% 196 0.3% 2,521 4.2% 17,102 28.5%
Four 48,897 33,651 68.8% 1,189 2.4% 840 1.7% 1,005 2.1% 2,477 5.1% 9,734 19.9%
Five + 29,337 16,350 55.7% 1,047 3.6% 470 1.6% 508 1.7% 2,129 7.3% 8,833 30.1%
HOUSEHOLD INCOME
Less Than $25,000 59,481 25,058 42.1% 1,905 3.2% 1,849 3.1% 729 1.2% 2,959 5.0% 26,981 45.4%
$25,000 ‐ $49,999 137,082 77,093 56.2% 1,871 1.4% 3,543 2.6% 1,333 1.0% 7,114 5.2% 46,128 33.6%
$50,000 ‐ $74,999 123,824 84,534 68.3% 2,081 1.7% 1,383 1.1% 1,228 1.0% 4,887 3.9% 29,710 24.0%
$75,000 ‐ $99,999 66,780 48,638 72.8% 1,166 1.7% 743 1.1% 660 1.0% 1,848 2.8% 13,726 20.6%
$100,000 + 97,644 78,990 80.9% 1,096 1.1% 943 1.0% 650 0.7% 1,785 1.8% 14,181 14.5%
WINNIPEG LICO‐125 CLASS
Yes 158,987 76,942 48.4% 3,606 2.3% 4,781 3.0% 1,834 1.2% 9,417 5.9% 62,407 39.3%
No 325,824 237,371 72.9% 4,513 1.4% 3,680 1.1% 2,765 0.8% 9,175 2.8% 68,319 21.0%
INDIGENOUS SELF‐DECLARED ANCESTRY
Yes 51,429 22,884 44.5% 1,585 3.1% 2,043 4.0% 1,081 2.1% 4,093 8.0% 19,742 38.4%
No 409,630 279,523 68.2% 6,419 1.6% 6,191 1.5% 3,188 0.8% 13,533 3.3% 100,776 24.6%
Undeclared 23,751 11,906 50.1% 115 0.5% 226 1.0% 330 1.4% 967 4.1% 10,208 43.0%
FIRST NATION ON RESERVE
FIRST NATION ON RESERVE 15,456 4,185 27.1% 902 5.8% 659 4.3% 311 2.0% 1,416 9.2% 7,984 51.7%
BILL PAYMENT RATING
Excel lent 439,339 295,672 67.3% 6,556 1.5% 5,847 1.3% 3,759 0.9% 14,267 3.2% 113,237 25.8%
Satis factory 22,395 11,015 49.2% 469 2.1% 1,089 4.9% 389 1.7% 1,725 7.7% 7,709 34.4%
Poor 23,077 7,626 33.0% 1,094 4.7% 1,526 6.6% 451 2.0% 2,600 11.3% 9,780 42.4%
DWELLING OWNERSHIP
Own 404,316 270,719 67.0% 5,662 1.4% 7,008 1.7% 3,677 0.9% 14,309 3.5% 102,941 25.5%
Rent / Other 80,495 43,595 54.2% 2,456 3.1% 1,453 1.8% 923 1.1% 4,284 5.3% 27,785 34.5%
2017 RESIDENTIAL SURVEY SECTION 9 ‐ BILLS AND RATES ‐ REFERENCE TABLE 9.07j
IN LAST 2 YEARS REDUCED SPENDING ON TRANSPORTATION TO PAY FOR YOUR MANITOBA HYDRO BILL
Centra Gas Manitoba Inc. 2019/20 General Rate Application Appendix 7.7
March 22, 2019 Page 164 of 228

157
9.07k Reduced Spending on Gifts in the past Two Years to Pay Your Manitoba Hydro Bill
TOTAL NEVER % ONE % TWO % THREE % FOUR + %
CHOOSE
NOT TO
ANSWER %
OVERALL 484,811 294,118 60.7% 12,459 2.6% 11,144 2.3% 8,545 1.8% 33,602 6.9% 124,944 25.8%
FUEL AREA
Winnipeg City 261,760 169,857 64.9% 6,182 2.4% 5,052 1.9% 4,941 1.9% 16,132 6.2% 59,596 22.8%
Gas Avai lable 140,021 85,348 61.0% 3,426 2.4% 3,722 2.7% 2,182 1.6% 9,226 6.6% 36,117 25.8%
No Gas Avai lable 83,030 38,913 46.9% 2,852 3.4% 2,370 2.9% 1,421 1.7% 8,243 9.9% 29,231 35.2%
DWELLING TYPE
Single Detached 373,568 227,287 60.8% 9,656 2.6% 9,637 2.6% 5,707 1.5% 26,477 7.1% 94,805 25.4%
Multi Attached 46,834 26,100 55.7% 1,370 2.9% 68 0.1% 1,568 3.3% 3,590 7.7% 14,138 30.2%
Apartment Suite 64,409 40,731 63.2% 1,433 2.2% 1,439 2.2% 1,270 2.0% 3,535 5.5% 16,001 24.8%
BUILDING CODE ERA
2010‐2017 37,645 23,342 62.0% 670 1.8% 1,512 4.0% 946 2.5% 2,219 5.9% 8,956 23.8%
1990‐2009 89,181 55,657 62.4% 2,431 2.7% 1,312 1.5% 1,428 1.6% 5,468 6.1% 22,884 25.7%
1970‐1989 161,749 99,324 61.4% 3,029 1.9% 3,879 2.4% 3,230 2.0% 10,919 6.8% 41,368 25.6%
1950‐1969 110,314 68,411 62.0% 3,051 2.8% 2,012 1.8% 1,176 1.1% 7,414 6.7% 28,250 25.6%
Pre 1950 85,922 47,383 55.1% 3,279 3.8% 2,429 2.8% 1,764 2.1% 7,581 8.8% 23,486 27.3%
SPACE HEAT FUEL
Electric Heat 191,639 102,713 53.6% 5,305 2.8% 5,261 2.7% 4,106 2.1% 17,125 8.9% 57,128 29.8%
Natural Gas Heat 249,938 166,887 66.8% 5,662 2.3% 5,171 2.1% 3,859 1.5% 14,002 5.6% 54,357 21.7%
Other Fuel 6,945 3,694 53.2% 469 6.7% 131 1.9% 0 0.0% 0 0.0% 2,651 38.2%
Shared (No Heat on Bi l l ) 36,289 20,823 57.4% 1,024 2.8% 580 1.6% 580 1.6% 2,474 6.8% 10,807 29.8%
PEOPLE PER HOUSEHOLD
One 124,779 70,768 56.7% 2,255 1.8% 2,121 1.7% 3,307 2.7% 8,171 6.5% 38,158 30.6%
Two 221,729 146,848 66.2% 4,601 2.1% 3,453 1.6% 2,346 1.1% 12,409 5.6% 52,072 23.5%
Three 60,069 32,526 54.1% 2,222 3.7% 2,190 3.6% 1,251 2.1% 5,137 8.6% 16,743 27.9%
Four 48,897 29,903 61.2% 2,330 4.8% 1,978 4.0% 1,018 2.1% 4,061 8.3% 9,607 19.6%
Five + 29,337 14,072 48.0% 1,052 3.6% 1,401 4.8% 624 2.1% 3,825 13.0% 8,363 28.5%
HOUSEHOLD INCOME
Less Than $25,000 59,481 23,710 39.9% 2,601 4.4% 1,681 2.8% 944 1.6% 5,303 8.9% 25,242 42.4%
$25,000 ‐ $49,999 137,082 72,872 53.2% 2,664 1.9% 2,571 1.9% 3,249 2.4% 10,923 8.0% 44,803 32.7%
$50,000 ‐ $74,999 123,824 78,322 63.3% 2,067 1.7% 2,913 2.4% 2,572 2.1% 9,781 7.9% 28,169 22.7%
$75,000 ‐ $99,999 66,780 45,277 67.8% 2,029 3.0% 2,085 3.1% 666 1.0% 3,868 5.8% 12,854 19.2%
$100,000 + 97,644 73,937 75.7% 3,099 3.2% 1,892 1.9% 1,113 1.1% 3,726 3.8% 13,876 14.2%
WINNIPEG LICO‐125 CLASS
Yes 158,987 71,722 45.1% 4,864 3.1% 4,461 2.8% 3,437 2.2% 14,803 9.3% 59,699 37.5%
No 325,824 222,395 68.3% 7,595 2.3% 6,683 2.1% 5,108 1.6% 18,798 5.8% 65,245 20.0%
INDIGENOUS SELF‐DECLARED ANCESTRY
Yes 51,429 21,090 41.0% 1,811 3.5% 2,091 4.1% 1,503 2.9% 5,994 11.7% 18,939 36.8%
No 409,630 262,184 64.0% 10,172 2.5% 8,734 2.1% 6,736 1.6% 25,629 6.3% 96,175 23.5%
Undeclared 23,751 10,844 45.7% 476 2.0% 318 1.3% 305 1.3% 1,978 8.3% 9,830 41.4%
FIRST NATION ON RESERVE
FIRST NATION ON RESERVE 15,456 3,712 24.0% 746 4.8% 534 3.5% 721 4.7% 1,883 12.2% 7,860 50.9%
BILL PAYMENT RATING
Excel lent 439,339 279,531 63.6% 9,956 2.3% 8,214 1.9% 7,214 1.6% 26,612 6.1% 107,812 24.5%
Satis factory 22,395 9,035 40.3% 912 4.1% 1,294 5.8% 704 3.1% 2,249 10.0% 8,202 36.6%
Poor 23,077 5,552 24.1% 1,591 6.9% 1,636 7.1% 627 2.7% 4,742 20.5% 8,929 38.7%
DWELLING OWNERSHIP
Own 404,316 254,604 63.0% 9,550 2.4% 8,936 2.2% 7,055 1.7% 26,519 6.6% 97,652 24.2%
Rent / Other 80,495 39,513 49.1% 2,909 3.6% 2,208 2.7% 1,490 1.9% 7,083 8.8% 27,292 33.9%
2017 RESIDENTIAL SURVEY SECTION 9 ‐ BILLS AND RATES ‐ REFERENCE TABLE 9.07k
IN LAST TWO YEARS REDUCED SPENDING ON GIFTS TO PAY FOR YOUR MANITOBA HYDRO BILL
Centra Gas Manitoba Inc. 2019/20 General Rate Application Appendix 7.7
March 22, 2019 Page 165 of 228

158
9.07l Reduced Spending on Medical Expenses in the past Two Years to Pay Your Manitoba Hydro Bill
TOTAL NEVER % ONE % TWO % THREE % FOUR + %
CHOOSE
NOT TO
ANSWER %
OVERALL 484,811 323,492 66.7% 6,394 1.3% 4,653 1.0% 3,080 0.6% 9,877 2.0% 137,315 28.3%
FUEL AREA
Winnipeg City 261,760 184,003 70.3% 3,696 1.4% 2,381 0.9% 1,798 0.7% 3,938 1.5% 65,944 25.2%
Gas Avai lable 140,021 94,642 67.6% 1,398 1.0% 1,218 0.9% 711 0.5% 2,701 1.9% 39,352 28.1%
No Gas Avai lable 83,030 44,847 54.0% 1,300 1.6% 1,054 1.3% 572 0.7% 3,238 3.9% 32,020 38.6%
DWELLING TYPE
Single Detached 373,568 251,415 67.3% 4,304 1.2% 3,127 0.8% 1,779 0.5% 8,111 2.2% 104,833 28.1%
Multi Attached 46,834 27,950 59.7% 569 1.2% 655 1.4% 519 1.1% 1,151 2.5% 15,990 34.1%
Apartment Sui te 64,409 44,127 68.5% 1,521 2.4% 870 1.4% 782 1.2% 616 1.0% 16,493 25.6%
BUILDING CODE ERA
2010‐2017 37,645 26,045 69.2% 437 1.2% 336 0.9% 264 0.7% 732 1.9% 9,831 26.1%
1990‐2009 89,181 60,472 67.8% 950 1.1% 668 0.7% 294 0.3% 1,822 2.0% 24,975 28.0%
1970‐1989 161,749 108,724 67.2% 2,127 1.3% 949 0.6% 1,084 0.7% 3,095 1.9% 45,770 28.3%
1950‐1969 110,314 74,601 67.6% 1,544 1.4% 1,221 1.1% 665 0.6% 2,291 2.1% 29,992 27.2%
Pre 1950 85,922 53,650 62.4% 1,336 1.6% 1,479 1.7% 773 0.9% 1,937 2.3% 26,747 31.1%
SPACE HEAT FUEL
Electric Heat 191,639 117,197 61.2% 2,860 1.5% 2,195 1.1% 1,204 0.6% 5,801 3.0% 62,382 32.6%
Natura l Gas Heat 249,938 180,594 72.3% 2,325 0.9% 1,588 0.6% 1,165 0.5% 3,786 1.5% 60,479 24.2%
Other Fuel 6,945 3,563 51.3% 337 4.9% 0 0.0% 131 1.9% 0 0.0% 2,913 41.9%
Shared (No Heat on Bi l l ) 36,289 22,137 61.0% 870 2.4% 870 2.4% 580 1.6% 290 0.8% 11,541 31.8%
PEOPLE PER HOUSEHOLD
One 124,779 76,559 61.4% 1,628 1.3% 1,609 1.3% 1,012 0.8% 2,431 1.9% 41,539 33.3%
Two 221,729 156,067 70.4% 2,187 1.0% 1,803 0.8% 1,221 0.6% 3,742 1.7% 56,709 25.6%
Three 60,069 39,767 66.2% 1,101 1.8% 103 0.2% 208 0.3% 1,292 2.2% 17,599 29.3%
Four 48,897 34,420 70.4% 1,012 2.1% 329 0.7% 379 0.8% 1,251 2.6% 11,506 23.5%
Five + 29,337 16,679 56.9% 465 1.6% 809 2.8% 261 0.9% 1,162 4.0% 9,962 34.0%
HOUSEHOLD INCOME
Less Than $25,000 59,481 25,675 43.2% 1,696 2.9% 1,388 2.3% 951 1.6% 1,718 2.9% 28,053 47.2%
$25,000 ‐ $49,999 137,082 81,061 59.1% 1,743 1.3% 1,181 0.9% 989 0.7% 3,905 2.8% 48,203 35.2%
$50,000 ‐ $74,999 123,824 86,186 69.6% 1,692 1.4% 1,485 1.2% 708 0.6% 2,721 2.2% 31,033 25.1%
$75,000 ‐ $99,999 66,780 50,643 75.8% 593 0.9% 320 0.5% 0 0.0% 796 1.2% 14,428 21.6%
$100,000 + 97,644 79,928 81.9% 670 0.7% 278 0.3% 432 0.4% 738 0.8% 15,598 16.0%
WINNIPEG LICO‐125 CLASS
Yes 158,987 80,479 50.6% 3,500 2.2% 2,346 1.5% 1,740 1.1% 5,360 3.4% 65,561 41.2%
No 325,824 243,013 74.6% 2,893 0.9% 2,307 0.7% 1,340 0.4% 4,517 1.4% 71,754 22.0%
INDIGENOUS SELF‐DECLARED ANCESTRY
Yes 51,429 25,081 48.8% 1,234 2.4% 487 0.9% 451 0.9% 2,498 4.9% 21,678 42.2%
No 409,630 286,517 69.9% 5,057 1.2% 4,165 1.0% 2,403 0.6% 6,515 1.6% 104,973 25.6%
Undeclared 23,751 11,894 50.1% 103 0.4% 0 0.0% 226 1.0% 864 3.6% 10,664 44.9%
FIRST NATION ON RESERVE
FIRST NATION ON RESERVE 15,456 4,520 29.2% 404 2.6% 353 2.3% 349 2.3% 783 5.1% 9,047 58.5%
BILL PAYMENT RATING
Excel lent 439,339 304,054 69.2% 4,592 1.0% 3,566 0.8% 2,736 0.6% 7,277 1.7% 117,113 26.7%
Satis factory 22,395 11,700 52.2% 818 3.7% 453 2.0% 146 0.7% 762 3.4% 8,517 38.0%
Poor 23,077 7,738 33.5% 984 4.3% 634 2.7% 198 0.9% 1,838 8.0% 11,685 50.6%
DWELLING OWNERSHIP
Own 404,316 280,561 69.4% 4,422 1.1% 2,909 0.7% 1,546 0.4% 7,665 1.9% 107,213 26.5%
Rent / Other 80,495 42,931 53.3% 1,971 2.4% 1,744 2.2% 1,534 1.9% 2,212 2.7% 30,102 37.4%
2017 RESIDENTIAL SURVEY SECTION 9 ‐ BILLS AND RATES ‐ REFERENCE TABLE 9.07l
IN LAST TWO YEARS REDUCED SPENDING ON MEDICAL EXP. TO PAY FOR YOUR MANITOBA HYDRO BILL
Centra Gas Manitoba Inc. 2019/20 General Rate Application Appendix 7.7
March 22, 2019 Page 166 of 228

159
9.08 Number of Times in the past Two Years Missed A Payment Due to Financial Difficulties
TOTAL NEVER % ONE % TWO % THREE % FOUR %
OVER
FOUR %
CHOOSE
NOT TO
ANSWER %
OVERALL 484,811 424,122 87.5% 14,148 2.9% 12,507 2.6% 7,645 1.6% 3,609 0.7% 12,058 2.5% 10,722 2.2%
FUEL AREA
Winnipeg City 261,760 234,829 89.7% 7,118 2.7% 5,515 2.1% 3,612 1.4% 737 0.3% 6,250 2.4% 3,699 1.4%
Gas Avai lable 140,021 125,488 89.6% 4,163 3.0% 2,654 1.9% 1,870 1.3% 1,277 0.9% 1,857 1.3% 2,711 1.9%
No Gas Avai lable 83,030 63,805 76.8% 2,866 3.5% 4,338 5.2% 2,163 2.6% 1,595 1.9% 3,951 4.8% 4,312 5.2%
DWELLING TYPE
Single Detached 373,568 327,927 87.8% 10,804 2.9% 9,669 2.6% 5,824 1.6% 3,142 0.8% 8,551 2.3% 7,652 2.0%
Multi Attached 46,834 40,126 85.7% 1,088 2.3% 1,529 3.3% 916 2.0% 304 0.6% 1,831 3.9% 1,040 2.2%
Apartment Sui te 64,409 56,069 87.1% 2,256 3.5% 1,309 2.0% 906 1.4% 163 0.3% 1,676 2.6% 2,029 3.2%
BUILDING CODE ERA
2010‐2017 37,645 33,721 89.6% 1,189 3.2% 1,051 2.8% 289 0.8% 236 0.6% 577 1.5% 581 1.5%
1990‐2009 89,181 79,054 88.6% 1,755 2.0% 2,286 2.6% 1,580 1.8% 1,032 1.2% 1,663 1.9% 1,811 2.0%
1970‐1989 161,749 143,783 88.9% 4,645 2.9% 3,864 2.4% 2,733 1.7% 806 0.5% 2,868 1.8% 3,049 1.9%
1950‐1969 110,314 96,355 87.3% 3,624 3.3% 2,076 1.9% 1,357 1.2% 787 0.7% 3,687 3.3% 2,429 2.2%
Pre 1950 85,922 71,209 82.9% 2,934 3.4% 3,230 3.8% 1,687 2.0% 747 0.9% 3,262 3.8% 2,852 3.3%
SPACE HEAT FUEL
Electric Heat 191,639 162,005 84.5% 6,089 3.2% 6,077 3.2% 3,176 1.7% 2,933 1.5% 5,159 2.7% 6,199 3.2%
Natura l Gas Heat 249,938 227,026 90.8% 7,188 2.9% 4,731 1.9% 3,246 1.3% 676 0.3% 4,473 1.8% 2,596 1.0%
Other Fuel 6,945 4,940 71.1% 0 0.0% 675 9.7% 393 5.7% 0 0.0% 469 6.7% 469 6.7%
Shared (No Heat on Bi l l ) 36,289 30,151 83.1% 870 2.4% 1,024 2.8% 829 2.3% 0 0.0% 1,957 5.4% 1,458 4.0%
PEOPLE PER HOUSEHOLD
One 124,779 110,623 88.7% 3,047 2.4% 2,531 2.0% 1,623 1.3% 899 0.7% 2,565 2.1% 3,491 2.8%
Two 221,729 201,408 90.8% 5,387 2.4% 4,596 2.1% 2,280 1.0% 1,081 0.5% 3,446 1.6% 3,532 1.6%
Three 60,069 50,989 84.9% 2,321 3.9% 2,371 3.9% 1,299 2.2% 378 0.6% 1,581 2.6% 1,130 1.9%
Four 48,897 39,893 81.6% 1,932 4.0% 1,963 4.0% 768 1.6% 731 1.5% 2,521 5.2% 1,088 2.2%
Five + 29,337 21,209 72.3% 1,461 5.0% 1,045 3.6% 1,675 5.7% 521 1.8% 1,946 6.6% 1,481 5.0%
HOUSEHOLD INCOME
Less Than $25,000 59,481 44,395 74.6% 2,144 3.6% 3,658 6.1% 1,885 3.2% 534 0.9% 3,464 5.8% 3,399 5.7%
$25,000 ‐ $49,999 137,082 119,814 87.4% 4,654 3.4% 3,500 2.6% 1,865 1.4% 1,759 1.3% 3,709 2.7% 1,782 1.3%
$50,000 ‐ $74,999 123,824 109,330 88.3% 3,065 2.5% 2,336 1.9% 2,116 1.7% 628 0.5% 3,748 3.0% 2,601 2.1%
$75,000 ‐ $99,999 66,780 60,839 91.1% 1,906 2.9% 1,135 1.7% 721 1.1% 389 0.6% 412 0.6% 1,378 2.1%
$100,000 + 97,644 89,743 91.9% 2,378 2.4% 1,878 1.9% 1,059 1.1% 299 0.3% 725 0.7% 1,561 1.6%
WINNIPEG LICO‐125 CLASS
Yes 158,987 127,308 80.1% 6,658 4.2% 6,582 4.1% 3,606 2.3% 2,068 1.3% 7,285 4.6% 5,480 3.4%
No 325,824 296,814 91.1% 7,490 2.3% 5,926 1.8% 4,039 1.2% 1,541 0.5% 4,773 1.5% 5,242 1.6%
INDIGENOUS SELF‐DECLARED ANCESTRY
Yes 51,429 35,178 68.4% 2,441 4.7% 3,538 6.9% 2,290 4.5% 691 1.3% 4,160 8.1% 3,131 6.1%
No 409,630 368,020 89.8% 10,960 2.7% 8,305 2.0% 5,087 1.2% 2,918 0.7% 7,360 1.8% 6,981 1.7%
Undeclared 23,751 20,924 88.1% 746 3.1% 665 2.8% 269 1.1% 0 0.0% 538 2.3% 610 2.6%
FIRST NATION ON RESERVE
FIRST NATION ON RESERVE 15,456 6,621 42.8% 746 4.8% 1,959 12.7% 1,492 9.7% 591 3.8% 1,666 10.8% 2,381 15.4%
BILL PAYMENT RATING
Excel lent 439,339 412,175 93.8% 11,537 2.6% 7,653 1.7% 3,155 0.7% 1,286 0.3% 3,533 0.8% 0 0.0%
Satis factory 22,395 8,474 37.8% 1,391 6.2% 2,733 12.2% 1,714 7.7% 881 3.9% 1,594 7.1% 5,609 25.0%
Poor 23,077 3,473 15.0% 1,220 5.3% 2,121 9.2% 2,776 12.0% 1,442 6.2% 6,931 30.0% 5,113 22.2%
DWELLING OWNERSHIP
Own 404,316 363,575 89.9% 11,311 2.8% 8,273 2.0% 4,764 1.2% 2,700 0.7% 7,340 1.8% 6,352 1.6%
Rent / Other 80,495 60,546 75.2% 2,837 3.5% 4,234 5.3% 2,881 3.6% 909 1.1% 4,718 5.9% 4,369 5.4%
2017 RESIDENTIAL SURVEY SECTION 9 ‐ BILLS AND RATES ‐ REFERENCE TABLE 9.08
IN PAST TWO YEARS MISSED MANITOBA HYDRO BILL PAYMENT DUE TO FINANCIAL DIFFICULTIES
Centra Gas Manitoba Inc. 2019/20 General Rate Application Appendix 7.7
March 22, 2019 Page 167 of 228

160
9.09 Missed Payment in the Last Two Years Due to
TOTAL YES % YES % YES % YES % YES % YES % YES % YES % YES % YES %
OVERALL 484,811 242,192 50.0% 11,809 2.4% 4,928 1.0% 13,124 2.7% 25,714 5.3% 12,234 2.5% 11,431 2.4% 32,329 6.7% 18,884 3.9% 164,356 33.9%
FUEL AREA
Winnipeg City 261,760 140,443 53.7% 5,663 2.2% 2,680 1.0% 5,348 2.0% 12,649 4.8% 6,109 2.3% 6,036 2.3% 16,113 6.2% 8,741 3.3% 84,402 32.2%
Gas Avai lable 140,021 68,842 49.2% 2,865 2.0% 1,110 0.8% 3,582 2.6% 5,936 4.2% 2,853 2.0% 3,069 2.2% 7,971 5.7% 4,435 3.2% 51,149 36.5%
No Gas Avai lable 83,030 32,907 39.6% 3,281 4.0% 1,138 1.4% 4,194 5.1% 7,128 8.6% 3,271 3.9% 2,325 2.8% 8,246 9.9% 5,708 6.9% 28,806 34.7%
DWELLING TYPE
Single Detached 373,568 186,535 49.9% 9,356 2.5% 2,924 0.8% 9,850 2.6% 18,642 5.0% 8,679 2.3% 9,247 2.5% 24,198 6.5% 13,449 3.6% 129,306 34.6%
Multi Attached 46,834 21,607 46.1% 873 1.9% 1,187 2.5% 2,659 5.7% 2,640 5.6% 1,503 3.2% 1,657 3.5% 3,975 8.5% 2,569 5.5% 15,473 33.0%
Apartment Suite 64,409 34,051 52.9% 1,580 2.5% 817 1.3% 616 1.0% 4,432 6.9% 2,052 3.2% 527 0.8% 4,156 6.5% 2,866 4.4% 19,578 30.4%
BUILDING CODE ERA
2010‐2017 37,645 18,852 50.1% 1,065 2.8% 291 0.8% 980 2.6% 1,558 4.1% 852 2.3% 1,038 2.8% 2,273 6.0% 1,106 2.9% 13,221 35.1%
1990‐2009 89,181 45,366 50.9% 2,210 2.5% 625 0.7% 1,874 2.1% 4,436 5.0% 1,553 1.7% 1,372 1.5% 4,911 5.5% 2,795 3.1% 31,579 35.4%
1970‐1989 161,749 79,665 49.3% 3,190 2.0% 1,752 1.1% 4,868 3.0% 7,182 4.4% 3,141 1.9% 2,938 1.8% 10,244 6.3% 6,327 3.9% 55,749 34.5%
1950‐1969 110,314 57,130 51.8% 2,938 2.7% 1,589 1.4% 3,172 2.9% 5,970 5.4% 3,415 3.1% 2,879 2.6% 7,633 6.9% 4,552 4.1% 36,361 33.0%
Pre 1950 85,922 41,178 47.9% 2,406 2.8% 671 0.8% 2,230 2.6% 6,568 7.6% 3,273 3.8% 3,204 3.7% 7,268 8.5% 4,104 4.8% 27,446 31.9%
SPACE HEAT FUEL
Electri c Heat 191,639 83,397 43.5% 4,871 2.5% 2,291 1.2% 7,961 4.2% 13,031 6.8% 5,606 2.9% 5,228 2.7% 14,890 7.8% 9,669 5.0% 68,821 35.9%
Natura l Gas Heat 249,938 136,556 54.6% 5,456 2.2% 2,010 0.8% 4,429 1.8% 8,959 3.6% 4,243 1.7% 5,315 2.1% 13,425 5.4% 6,806 2.7% 82,872 33.2%
Other Fuel 6,945 2,389 34.4% 469 6.7% 337 4.9% 0 0.0% 806 11.6% 337 4.9% 0 0.0% 806 11.6% 556 8.0% 2,726 39.3%
Shared (No Heat on Bi l l ) 36,289 19,850 54.7% 1,014 2.8% 290 0.8% 734 2.0% 2,918 8.0% 2,048 5.6% 888 2.4% 3,208 8.8% 1,853 5.1% 9,937 27.4%
PEOPLE PER HOUSEHOLD
One 124,779 59,890 48.0% 1,848 1.5% 1,411 1.1% 4,408 3.5% 5,320 4.3% 2,246 1.8% 1,583 1.3% 6,190 5.0% 4,540 3.6% 46,635 37.4%
Two 221,729 115,527 52.1% 3,764 1.7% 1,738 0.8% 5,198 2.3% 9,585 4.3% 5,067 2.3% 5,330 2.4% 10,780 4.9% 8,152 3.7% 77,683 35.0%
Three 60,069 28,847 48.0% 1,781 3.0% 993 1.7% 1,908 3.2% 4,112 6.8% 2,237 3.7% 2,045 3.4% 5,717 9.5% 1,906 3.2% 19,669 32.7%
Four 48,897 26,345 53.9% 2,787 5.7% 401 0.8% 598 1.2% 3,477 7.1% 1,582 3.2% 1,688 3.5% 4,755 9.7% 2,256 4.6% 12,198 24.9%
Five + 29,337 11,582 39.5% 1,629 5.6% 385 1.3% 1,012 3.5% 3,219 11.0% 1,102 3.8% 786 2.7% 4,886 16.7% 2,031 6.9% 8,171 27.9%
HOUSEHOLD INCOME
Less Than $25,000 59,481 22,413 37.7% 2,287 3.8% 950 1.6% 4,871 8.2% 5,238 8.8% 2,160 3.6% 1,595 2.7% 6,142 10.3% 3,815 6.4% 20,149 33.9%
$25,000 ‐ $49,999 137,082 64,906 47.3% 3,700 2.7% 1,865 1.4% 5,342 3.9% 8,296 6.1% 4,371 3.2% 4,352 3.2% 8,623 6.3% 5,836 4.3% 48,820 35.6%
$50,000 ‐ $74,999 123,824 60,643 49.0% 2,678 2.2% 1,445 1.2% 1,573 1.3% 6,930 5.6% 3,265 2.6% 2,573 2.1% 8,887 7.2% 3,960 3.2% 43,883 35.4%
$75,000 ‐ $99,999 66,780 35,932 53.8% 1,662 2.5% 324 0.5% 595 0.9% 2,715 4.1% 957 1.4% 1,285 1.9% 3,660 5.5% 2,600 3.9% 22,058 33.0%
$100,000 + 97,644 58,298 59.7% 1,482 1.5% 344 0.4% 744 0.8% 2,535 2.6% 1,481 1.5% 1,627 1.7% 5,019 5.1% 2,673 2.7% 29,445 30.2%
WINNIPEG LICO‐125 CLASS
Yes 158,987 67,145 42.2% 5,983 3.8% 2,236 1.4% 9,178 5.8% 13,236 8.3% 5,329 3.4% 4,741 3.0% 14,149 8.9% 8,823 5.5% 53,660 33.8%
No 325,824 175,047 53.7% 5,826 1.8% 2,691 0.8% 3,946 1.2% 12,478 3.8% 6,905 2.1% 6,689 2.1% 18,180 5.6% 10,062 3.1% 110,697 34.0%
INDIGENOUS SELF‐DECLARED ANCESTRY
Yes 51,429 17,094 33.2% 3,861 7.5% 1,056 2.1% 2,014 3.9% 5,862 11.4% 2,147 4.2% 1,348 2.6% 6,702 13.0% 3,792 7.4% 18,041 35.1%
No 409,630 217,752 53.2% 7,498 1.8% 3,709 0.9% 10,591 2.6% 18,733 4.6% 9,426 2.3% 9,307 2.3% 24,038 5.9% 14,020 3.4% 133,434 32.6%
Undeclared 23,751 7,345 30.9% 449 1.9% 163 0.7% 520 2.2% 1,119 4.7% 661 2.8% 776 3.3% 1,589 6.7% 1,072 4.5% 12,882 54.2%
FIRST NATION ON RESERVE
FIRST NATIONS ON RESERVE 15,456 3,507 22.7% 1,696 11.0% 311 2.0% 1,150 7.4% 2,294 14.8% 560 3.6% 93 0.6% 2,822 18.3% 1,467 9.5% 4,999 32.3%
BILL PAYMENT RATING
Excel lent 439,339 233,288 53.1% 5,902 1.3% 2,891 0.7% 10,777 2.5% 14,713 3.3% 7,650 1.7% 8,454 1.9% 18,757 4.3% 12,878 2.9% 154,748 35.2%
Sati s factory 22,395 5,694 25.4% 2,053 9.2% 792 3.5% 1,150 5.1% 4,057 18.1% 1,312 5.9% 911 4.1% 4,084 18.2% 2,316 10.3% 6,268 28.0%
Poor 23,077 3,210 13.9% 3,853 16.7% 1,245 5.4% 1,197 5.2% 6,944 30.1% 3,272 14.2% 2,066 9.0% 9,488 41.1% 3,690 16.0% 3,341 14.5%
DWELLING OWNERSHIP
Own 404,316 208,034 51.5% 7,621 1.9% 3,534 0.9% 10,965 2.7% 18,101 4.5% 9,722 2.4% 10,870 2.7% 23,606 5.8% 14,129 3.5% 139,449 34.5%
Rent / Other 80,495 34,157 42.4% 4,188 5.2% 1,394 1.7% 2,159 2.7% 7,613 9.5% 2,512 3.1% 560 0.7% 8,723 10.8% 4,755 5.9% 24,907 30.9%
REDUCED OR
INSUFFICIENT
PAYCHECK
2017 RESIDENTIAL SURVEY SECTION 9 ‐ BILLS AND RATES ‐ REFERENCE TABLE 9.09
IF YOU MISSED A MANITOBA HYDRO BILL PAYMENT IN THE LAST TWO YEARS, IS IT BECAUSE OF ONE OF THE FOLLOWING:
CHOOSE NOT
TO ANSWEROTHER
UNEXPECTED
MAJOR
EXPENSE
PROPERTY
TAXES
LOAN OR
MORTAGE
PAYMENTRETIREMENT
SEPARATION
OR DIVORCEJOB LOSS
NOT BEEN
HARD
Centra Gas Manitoba Inc. 2019/20 General Rate Application Appendix 7.7
March 22, 2019 Page 168 of 228

161
9.10 How Do You Think You Compare to Similar Households That Heat with the Same Commodity
TOTAL
USE A
LOT
MORE %
USE A
LITTLE
MORE %
USE
ABOUT
THE SAME %
USE A
LITTLE
LESS %
USE A
LOT LESS %
DO NOT
KNOW %
OVERALL 484,811 22,575 4.7% 43,824 9.0% 116,463 24.0% 89,352 18.4% 30,802 6.4% 181,794 37.5%
FUEL AREA
Winnipeg Ci ty 261,760 8,896 3.4% 20,633 7.9% 60,284 23.0% 53,889 20.6% 19,537 7.5% 98,522 37.6%
Gas Ava i lable 140,021 7,354 5.3% 14,619 10.4% 37,480 26.8% 22,983 16.4% 7,078 5.1% 50,506 36.1%
No Gas Avai lable 83,030 6,325 7.6% 8,573 10.3% 18,699 22.5% 12,480 15.0% 4,187 5.0% 32,766 39.5%
DWELLING TYPE
Single Detached 373,568 19,061 5.1% 36,390 9.7% 95,441 25.5% 65,137 17.4% 19,827 5.3% 137,711 36.9%
Multi Attached 46,834 1,693 3.6% 2,875 6.1% 10,028 21.4% 10,633 22.7% 3,359 7.2% 18,247 39.0%
Apartment Suite 64,409 1,822 2.8% 4,559 7.1% 10,994 17.1% 13,582 21.1% 7,617 11.8% 25,836 40.1%
BUILDING CODE ERA
2010‐2017 37,645 2,154 5.7% 3,935 10.5% 9,929 26.4% 8,311 22.1% 1,924 5.1% 11,392 30.3%
1990‐2009 89,181 4,610 5.2% 8,405 9.4% 24,944 28.0% 14,767 16.6% 5,173 5.8% 31,283 35.1%
1970‐1989 161,749 5,694 3.5% 13,192 8.2% 37,489 23.2% 30,731 19.0% 11,360 7.0% 63,282 39.1%
1950‐1969 110,314 4,776 4.3% 9,113 8.3% 27,237 24.7% 19,803 18.0% 5,070 4.6% 44,316 40.2%
Pre 1950 85,922 5,342 6.2% 9,179 10.7% 16,864 19.6% 15,740 18.3% 7,276 8.5% 31,521 36.7%
SPACE HEAT FUEL
Electric Heat 191,639 13,523 7.1% 19,579 10.2% 42,132 22.0% 31,890 16.6% 13,310 6.9% 71,206 37.2%
Natura l Gas Heat 249,938 8,278 3.3% 21,380 8.6% 66,430 26.6% 48,916 19.6% 14,158 5.7% 90,776 36.3%
Other Fuel 6,945 131 1.9% 1,012 14.6% 1,362 19.6% 1,143 16.5% 0 0.0% 3,297 47.5%
Shared (No Heat on Bi l l ) 36,289 643 1.8% 1,853 5.1% 6,540 18.0% 7,403 20.4% 3,335 9.2% 16,515 45.5%
PEOPLE PER HOUSEHOLD
One 124,779 3,122 2.5% 6,189 5.0% 18,235 14.6% 27,569 22.1% 12,832 10.3% 56,833 45.5%
Two 221,729 8,941 4.0% 19,490 8.8% 55,072 24.8% 42,959 19.4% 13,587 6.1% 81,680 36.8%
Three 60,069 2,792 4.6% 7,505 12.5% 18,016 30.0% 9,675 16.1% 2,285 3.8% 19,796 33.0%
Four 48,897 4,130 8.4% 6,128 12.5% 16,901 34.6% 5,965 12.2% 1,273 2.6% 14,501 29.7%
Five + 29,337 3,590 12.2% 4,512 15.4% 8,240 28.1% 3,184 10.9% 825 2.8% 8,984 30.6%
HOUSEHOLD INCOME
Less Than $25,000 59,481 4,871 8.2% 3,168 5.3% 9,129 15.3% 9,228 15.5% 3,771 6.3% 29,313 49.3%
$25,000 ‐ $49,999 137,082 4,661 3.4% 10,351 7.6% 26,537 19.4% 23,013 16.8% 10,564 7.7% 61,956 45.2%
$50,000 ‐ $74,999 123,824 5,139 4.2% 10,553 8.5% 29,633 23.9% 23,718 19.2% 8,222 6.6% 46,559 37.6%
$75,000 ‐ $99,999 66,780 2,994 4.5% 7,891 11.8% 20,194 30.2% 12,441 18.6% 2,998 4.5% 20,261 30.3%
$100,000 + 97,644 4,910 5.0% 11,861 12.1% 30,970 31.7% 20,951 21.5% 5,247 5.4% 23,705 24.3%
WINNIPEG LICO‐125 CLASS
Yes 158,987 9,142 5.8% 12,657 8.0% 28,808 18.1% 24,073 15.1% 10,459 6.6% 73,849 46.4%
No 325,824 13,433 4.1% 31,167 9.6% 87,655 26.9% 65,279 20.0% 20,344 6.2% 107,946 33.1%
INDIGENOUS SELF‐DECLARED ANCESTRY
Yes 51,429 5,193 10.1% 4,296 8.4% 10,226 19.9% 8,003 15.6% 2,661 5.2% 21,051 40.9%
No 409,630 16,403 4.0% 38,020 9.3% 102,012 24.9% 78,098 19.1% 26,796 6.5% 148,302 36.2%
Undeclared 23,751 980 4.1% 1,508 6.4% 4,225 17.8% 3,251 13.7% 1,345 5.7% 12,441 52.4%
FIRST NATION ON RESERVE
FIRST NATION ON RESERVE 15,456 2,183 14.1% 1,063 6.9% 2,152 13.9% 1,921 12.4% 777 5.0% 7,360 47.6%
BILL PAYMENT RATING
Excel lent 439,339 18,177 4.1% 40,365 9.2% 107,452 24.5% 81,921 18.6% 27,617 6.3% 163,807 37.3%
Satis factory 22,395 1,900 8.5% 1,786 8.0% 4,137 18.5% 4,278 19.1% 1,672 7.5% 8,622 38.5%
Poor 23,077 2,498 10.8% 1,673 7.3% 4,874 21.1% 3,152 13.7% 1,514 6.6% 9,366 40.6%
DWELLING OWNERSHIP
Own 404,316 17,452 4.3% 38,813 9.6% 104,224 25.8% 73,546 18.2% 23,553 5.8% 146,729 36.3%
Rent / Other 80,495 5,123 6.4% 5,011 6.2% 12,240 15.2% 15,806 19.6% 7,249 9.0% 35,065 43.6%
2017 RESIDENTIAL SURVEY SECTION 9 ‐ BILLS AND RATES ‐ REFERENCE TABLE 9.10
HOW DO YOU THINK YOU COMPARE TO SIMILAR HOUSEHOLDS THAT HEAT WITH THE SAME COMMODITY
Centra Gas Manitoba Inc. 2019/20 General Rate Application Appendix 7.7
March 22, 2019 Page 169 of 228

162
9.11 How Do You Think Manitoba Hydro’s Rates Compare to Other Provinces or States
TOTAL
RATES ARE
A LOT
HIGHER %
RATES ARE
A LITTLE
HIGHER %
RATES ARE
ABOUT THE
SAME %
RATES ARE
A LITTLE
LOWER %
RATES ARE
A LOT
LOWER %
DO NOT
KNOW %
OVERALL 484,811 29,579 6.1% 29,128 6.0% 25,062 5.2% 60,856 12.6% 26,572 5.5% 313,615 64.7%
FUEL AREA
Winnipeg Ci ty 261,760 12,521 4.8% 15,426 5.9% 13,488 5.2% 37,373 14.3% 17,779 6.8% 165,173 63.1%
Gas Avai lable 140,021 8,181 5.8% 9,377 6.7% 7,442 5.3% 14,053 10.0% 6,331 4.5% 94,636 67.6%
No Gas Avai lable 83,030 8,876 10.7% 4,324 5.2% 4,133 5.0% 9,430 11.4% 2,462 3.0% 53,805 64.8%
DWELLING TYPE
Single Detached 373,568 22,545 6.0% 23,246 6.2% 20,303 5.4% 50,322 13.5% 19,578 5.2% 237,575 63.6%
Multi Attached 46,834 4,113 8.8% 3,104 6.6% 2,056 4.4% 5,370 11.5% 2,044 4.4% 30,146 64.4%
Apartment Sui te 64,409 2,921 4.5% 2,777 4.3% 2,703 4.2% 5,164 8.0% 4,950 7.7% 45,893 71.3%
BUILDING CODE ERA
2010‐2017 37,645 2,854 7.6% 3,459 9.2% 2,524 6.7% 4,562 12.1% 1,407 3.7% 22,839 60.7%
1990‐2009 89,181 4,858 5.4% 5,140 5.8% 4,936 5.5% 10,628 11.9% 4,742 5.3% 58,878 66.0%
1970‐1989 161,749 10,766 6.7% 11,014 6.8% 8,218 5.1% 19,640 12.1% 7,635 4.7% 104,475 64.6%
1950‐1969 110,314 5,384 4.9% 5,204 4.7% 5,626 5.1% 14,982 13.6% 6,772 6.1% 72,347 65.6%
Pre 1950 85,922 5,717 6.7% 4,312 5.0% 3,759 4.4% 11,043 12.9% 6,016 7.0% 55,075 64.1%
SPACE HEAT FUEL
Electri c Heat 191,639 14,847 7.7% 11,494 6.0% 9,588 5.0% 20,332 10.6% 6,826 3.6% 128,553 67.1%
Natura l Gas Heat 249,938 11,846 4.7% 16,661 6.7% 13,977 5.6% 36,497 14.6% 15,266 6.1% 155,691 62.3%
Other Fuel 6,945 425 6.1% 0 0.0% 337 4.9% 675 9.7% 265 3.8% 5,243 75.5%
Shared (No Heat on Bi l l ) 36,289 2,461 6.8% 973 2.7% 1,160 3.2% 3,352 9.2% 4,215 11.6% 24,128 66.5%
PEOPLE PER HOUSEHOLD
One 124,779 5,599 4.5% 6,580 5.3% 5,173 4.1% 11,326 9.1% 4,278 3.4% 91,824 73.6%
Two 221,729 14,195 6.4% 12,683 5.7% 11,184 5.0% 31,148 14.0% 13,481 6.1% 139,037 62.7%
Three 60,069 3,413 5.7% 4,499 7.5% 4,177 7.0% 7,991 13.3% 4,523 7.5% 35,465 59.0%
Four 48,897 3,500 7.2% 3,180 6.5% 2,557 5.2% 7,215 14.8% 3,168 6.5% 29,277 59.9%
Five + 29,337 2,871 9.8% 2,185 7.4% 1,971 6.7% 3,176 10.8% 1,121 3.8% 18,012 61.4%
HOUSEHOLD INCOME
Less Than $25,000 59,481 6,188 10.4% 2,989 5.0% 1,702 2.9% 3,062 5.1% 1,129 1.9% 44,411 74.7%
$25,000 ‐ $49,999 137,082 9,158 6.7% 8,788 6.4% 6,412 4.7% 10,596 7.7% 4,265 3.1% 97,862 71.4%
$50,000 ‐ $74,999 123,824 5,436 4.4% 6,996 5.7% 6,506 5.3% 16,681 13.5% 6,907 5.6% 81,297 65.7%
$75,000 ‐ $99,999 66,780 4,521 6.8% 5,071 7.6% 3,315 5.0% 10,364 15.5% 3,984 6.0% 39,525 59.2%
$100,000 + 97,644 4,275 4.4% 5,283 5.4% 7,127 7.3% 20,153 20.6% 10,286 10.5% 50,520 51.7%
WINNIPEG LICO‐125 CLASS
Yes 158,987 12,880 8.1% 10,078 6.3% 6,588 4.1% 10,300 6.5% 3,715 2.3% 115,427 72.6%
No 325,824 16,698 5.1% 19,050 5.8% 18,475 5.7% 50,556 15.5% 22,857 7.0% 198,188 60.8%
INDIGENOUS SELF‐DECLARED ANCESTRY
Yes 51,429 6,106 11.9% 4,069 7.9% 1,930 3.8% 4,211 8.2% 2,243 4.4% 32,870 63.9%
No 409,630 21,584 5.3% 23,823 5.8% 21,721 5.3% 54,512 13.3% 23,131 5.6% 264,859 64.7%
Undeclared 23,751 1,889 8.0% 1,235 5.2% 1,411 5.9% 2,133 9.0% 1,198 5.0% 15,886 66.9%
FIRST NATION ON RESERVE
FIRST NATION ON RESERVE 15,456 3,085 20.0% 1,026 6.6% 373 2.4% 410 2.7% 155 1.0% 10,407 67.3%
BILL PAYMENT RATING
Excel lent 439,339 24,159 5.5% 26,990 6.1% 23,522 5.4% 58,213 13.3% 24,670 5.6% 281,784 64.1%
Satis factory 22,395 2,196 9.8% 1,207 5.4% 248 1.1% 1,529 6.8% 961 4.3% 16,254 72.6%
Poor 23,077 3,224 14.0% 930 4.0% 1,292 5.6% 1,114 4.8% 940 4.1% 15,577 67.5%
DWELLING OWNERSHIP
Own 404,316 23,224 5.7% 25,302 6.3% 20,768 5.1% 56,029 13.9% 22,234 5.5% 256,759 63.5%
Rent / Other 80,495 6,355 7.9% 3,826 4.8% 4,294 5.3% 4,827 6.0% 4,338 5.4% 56,855 70.6%
2017 RESIDENTIAL SURVEY SECTION 9 ‐ BILLS AND RATES ‐ REFERENCE TABLE 9.11
HOW DO YOU THINK MANITOBA HYDRO'S RATES COMPARE TO OTHER PROVINCES OR STATES
Centra Gas Manitoba Inc. 2019/20 General Rate Application Appendix 7.7
March 22, 2019 Page 170 of 228

163
9.12 What Do You Think Manitoba Hydro’s Residential Electric Rate per Kilo‐Watt Hour Is
TOTAL
IT IS THE SAME REGARDLESS
OF THE AMOUNT OF
ELECTRICITY USED EACH
MONTH %
IT INCREASES FOR ANY
ELECTRICITY USED BEYOND
A SPECIFIC AMOUNT FOR
THAT MONTH %
IT DECREASES FOR ANY
ELECTRICITY USED BEYOND
A SPECIFIC AMOUNT FOR
THAT MONTH %
DO NOT
KNOW %
OVERALL 484,811 102,239 21.1% 54,467 11.2% 16,185 3.3% 311,920 64.3%
FUEL AREA
Winnipeg City 261,760 53,662 20.5% 32,579 12.4% 6,281 2.4% 169,238 64.7%
Gas Avai lable 140,021 29,973 21.4% 12,735 9.1% 6,963 5.0% 90,350 64.5%
No Gas Avai lable 83,030 18,605 22.4% 9,153 11.0% 2,941 3.5% 52,332 63.0%
DWELLING TYPE
Single Detached 373,568 85,105 22.8% 40,972 11.0% 13,574 3.6% 233,916 62.6%
Multi Attached 46,834 7,963 17.0% 5,414 11.6% 1,595 3.4% 31,861 68.0%
Apartment Sui te 64,409 9,171 14.2% 8,081 12.5% 1,016 1.6% 46,142 71.6%
BUILDING CODE ERA
2010‐2017 37,645 8,220 21.8% 3,841 10.2% 952 2.5% 24,633 65.4%
1990‐2009 89,181 19,251 21.6% 10,688 12.0% 3,849 4.3% 55,393 62.1%
1970‐1989 161,749 33,673 20.8% 16,313 10.1% 5,969 3.7% 105,793 65.4%
1950‐1969 110,314 20,840 18.9% 13,544 12.3% 2,732 2.5% 73,198 66.4%
Pre 1950 85,922 20,255 23.6% 10,081 11.7% 2,683 3.1% 52,903 61.6%
SPACE HEAT FUEL
Electric Heat 191,639 40,412 21.1% 20,839 10.9% 7,870 4.1% 122,518 63.9%
Natura l Gas Heat 249,938 55,286 22.1% 28,233 11.3% 7,919 3.2% 158,500 63.4%
Other Fuel 6,945 1,012 14.6% 602 8.7% 396 5.7% 4,934 71.0%
Shared (No Heat on Bi l l ) 36,289 5,529 15.2% 4,792 13.2% 0 0.0% 25,968 71.6%
PEOPLE PER HOUSEHOLD
One 124,779 20,374 16.3% 12,349 9.9% 2,689 2.2% 89,367 71.6%
Two 221,729 48,589 21.9% 24,532 11.1% 10,128 4.6% 138,480 62.5%
Three 60,069 14,761 24.6% 8,583 14.3% 1,721 2.9% 35,004 58.3%
Four 48,897 12,163 24.9% 6,431 13.2% 1,261 2.6% 29,041 59.4%
Five + 29,337 6,351 21.6% 2,572 8.8% 386 1.3% 20,028 68.3%
HOUSEHOLD INCOME
Less Than $25,000 59,481 6,108 10.3% 6,552 11.0% 1,563 2.6% 45,257 76.1%
$25,000 ‐ $49,999 137,082 22,651 16.5% 16,642 12.1% 4,712 3.4% 93,077 67.9%
$50,000 ‐ $74,999 123,824 25,877 20.9% 12,235 9.9% 5,269 4.3% 80,442 65.0%
$75,000 ‐ $99,999 66,780 16,228 24.3% 8,203 12.3% 1,873 2.8% 40,475 60.6%
$100,000 + 97,644 31,376 32.1% 10,834 11.1% 2,766 2.8% 52,668 53.9%
WINNIPEG LICO‐125 CLASS
Yes 158,987 20,343 12.8% 19,618 12.3% 4,614 2.9% 114,411 72.0%
No 325,824 81,896 25.1% 34,849 10.7% 11,570 3.6% 197,509 60.6%
INDIGENOUS SELF‐DECLARED ANCESTRY
Yes 51,429 8,287 16.1% 5,867 11.4% 1,360 2.6% 35,916 69.8%
No 409,630 89,752 21.9% 45,979 11.2% 14,262 3.5% 259,638 63.4%
Undeclared 23,751 4,201 17.7% 2,622 11.0% 563 2.4% 16,366 68.9%
FIRST NATION ON RESERVE
FIRST NATION ON RESERVE 15,456 1,498 9.7% 2,089 13.5% 442 2.9% 11,427 73.9%
BILL PAYMENT RATING
Excel lent 439,339 95,678 21.8% 49,148 11.2% 14,313 3.3% 280,199 63.8%
Sati s factory 22,395 3,162 14.1% 2,063 9.2% 1,245 5.6% 15,925 71.1%
Poor 23,077 3,399 14.7% 3,256 14.1% 627 2.7% 15,795 68.4%
DWELLING OWNERSHIP
Own 404,316 92,339 22.8% 44,217 10.9% 15,233 3.8% 252,528 62.5%
Rent / Other 80,495 9,901 12.3% 10,250 12.7% 952 1.2% 59,392 73.8%
2017 RESIDENTIAL SURVEY SECTION 9 ‐ BILLS AND RATES ‐ REFERENCE TABLE 9.12
WHAT DO YOU THINK MANITOBA HYDRO'S RESIDENTIAL ELECTRIC RATE PER KILO‐WATT HOUR IS
Centra Gas Manitoba Inc. 2019/20 General Rate Application Appendix 7.7
March 22, 2019 Page 171 of 228

164
9.13 What Do You Think About Increasing Rates After a Certain Level Of Usage
TOTAL
I AGREE IT WOULD
LOWER ENERGY USE
AND I SUPPORT IT %
I AGREE IT WOULD
LOWER ENERGY USE
BUT I DO NOT SUPPORT
THIS IDEA %
I DISAGREE IT WOULD
LOWER ENERGY USE BUT I
SUPPORT THIS IDEA %
I DISAGREE IT WOULD
LOWER ENERGY USE AND I
DO NOT SUPPORT THIS
IDEA %
DO NOT
KNOW %
OVERALL 484,811 101,918 21.0% 67,446 13.9% 25,105 5.2% 149,617 30.9% 140,724 29.0%
FUEL AREA
Winnipeg City 261,760 65,886 25.2% 34,682 13.2% 15,706 6.0% 72,832 27.8% 72,654 27.8%
Gas Avai lable 140,021 23,772 17.0% 20,624 14.7% 6,366 4.5% 48,837 34.9% 40,422 28.9%
No Gas Avai lable 83,030 12,260 14.8% 12,141 14.6% 3,033 3.7% 27,948 33.7% 27,649 33.3%
DWELLING TYPE
Single Detached 373,568 72,546 19.4% 52,935 14.2% 18,626 5.0% 124,933 33.4% 104,527 28.0%
Multi Attached 46,834 10,724 22.9% 7,476 16.0% 1,803 3.8% 10,672 22.8% 16,159 34.5%
Apartment Sui te 64,409 18,647 29.0% 7,035 10.9% 4,676 7.3% 14,012 21.8% 20,039 31.1%
BUILDING CODE ERA
2010‐2017 37,645 6,999 18.6% 5,108 13.6% 1,952 5.2% 12,001 31.9% 11,584 30.8%
1990‐2009 89,181 18,847 21.1% 13,055 14.6% 3,666 4.1% 26,408 29.6% 27,205 30.5%
1970‐1989 161,749 32,143 19.9% 21,852 13.5% 9,306 5.8% 51,089 31.6% 47,358 29.3%
1950‐1969 110,314 22,645 20.5% 17,013 15.4% 6,251 5.7% 33,529 30.4% 30,876 28.0%
Pre 1950 85,922 21,284 24.8% 10,418 12.1% 3,929 4.6% 26,590 30.9% 23,701 27.6%
SPACE HEAT FUEL
Electric Heat 191,639 31,416 16.4% 28,195 14.7% 8,926 4.7% 63,326 33.0% 59,775 31.2%
Natura l Gas Heat 249,938 58,261 23.3% 34,423 13.8% 13,715 5.5% 76,951 30.8% 66,588 26.6%
Other Fuel 6,945 1,202 17.3% 734 10.6% 0 0.0% 1,350 19.4% 3,660 52.7%
Shared (No Heat on Bi l l ) 36,289 11,038 30.4% 4,095 11.3% 2,464 6.8% 7,990 22.0% 10,702 29.5%
PEOPLE PER HOUSEHOLD
One 124,779 28,087 22.5% 11,493 9.2% 6,979 5.6% 30,560 24.5% 47,661 38.2%
Two 221,729 46,479 21.0% 33,274 15.0% 11,328 5.1% 70,246 31.7% 60,401 27.2%
Three 60,069 10,386 17.3% 8,792 14.6% 3,699 6.2% 22,152 36.9% 15,041 25.0%
Four 48,897 12,265 25.1% 8,585 17.6% 2,122 4.3% 15,816 32.3% 10,109 20.7%
Five + 29,337 4,701 16.0% 5,302 18.1% 977 3.3% 10,844 37.0% 7,512 25.6%
HOUSEHOLD INCOME
Less Than $25,000 59,481 12,695 21.3% 6,039 10.2% 2,038 3.4% 11,120 18.7% 27,589 46.4%
$25,000 ‐ $49,999 137,082 27,209 19.8% 16,996 12.4% 6,234 4.5% 39,880 29.1% 46,763 34.1%
$50,000 ‐ $74,999 123,824 23,394 18.9% 18,657 15.1% 6,681 5.4% 42,524 34.3% 32,568 26.3%
$75,000 ‐ $99,999 66,780 12,897 19.3% 10,754 16.1% 3,504 5.2% 23,362 35.0% 16,263 24.4%
$100,000 + 97,644 25,722 26.3% 15,000 15.4% 6,648 6.8% 32,731 33.5% 17,542 18.0%
WINNIPEG LICO‐125 CLASS
Yes 158,987 32,821 20.6% 19,073 12.0% 6,594 4.1% 39,748 25.0% 60,750 38.2%
No 325,824 69,097 21.2% 48,373 14.8% 18,511 5.7% 109,870 33.7% 79,974 24.5%
INDIGENOUS SELF‐DECLARED ANCESTRY
Yes 51,429 10,112 19.7% 5,934 11.5% 2,521 4.9% 15,007 29.2% 17,856 34.7%
No 409,630 88,955 21.7% 59,660 14.6% 22,189 5.4% 125,609 30.7% 113,216 27.6%
Undeclared 23,751 2,851 12.0% 1,852 7.8% 395 1.7% 9,002 37.9% 9,652 40.6%
FIRST NATION ON RESERVE
FIRST NATION ON RESERVE 15,456 2,786 18.0% 1,479 9.6% 435 2.8% 3,058 19.8% 7,697 49.8%
BILL PAYMENT RATING
Excel lent 439,339 94,333 21.5% 60,437 13.8% 23,467 5.3% 136,631 31.1% 124,471 28.3%
Satis factory 22,395 3,527 15.7% 3,044 13.6% 1,142 5.1% 6,209 27.7% 8,473 37.8%
Poor 23,077 4,058 17.6% 3,965 17.2% 497 2.2% 6,777 29.4% 7,780 33.7%
DWELLING OWNERSHIP
Own 404,316 81,559 20.2% 57,465 14.2% 21,228 5.3% 131,613 32.6% 112,451 27.8%
Rent / Other 80,495 20,359 25.3% 9,981 12.4% 3,877 4.8% 18,004 22.4% 28,273 35.1%
2017 RESIDENTIAL SURVEY SECTION 9 ‐ BILLS AND RATES ‐ REFERENCE TABLE 9.13
WHAT DO YOU THINK ABOUT INCREASING RATES AFTER A CERTAIN LEVEL OF USAGE TO ENCOURAGE RESIDENTS TO DECRASE THEIR USAGE
Centra Gas Manitoba Inc. 2019/20 General Rate Application Appendix 7.7
March 22, 2019 Page 172 of 228

165
SECTION 10 HOUSEHOLD DEMOGRAPHICS
SECTION 10 HOUSEHOLD
DEMOGRAPHICS
Centra Gas Manitoba Inc. 2019/20 General Rate Application Appendix 7.7
March 22, 2019 Page 173 of 228

166
10.01 People per Household
TOTAL
AVERAGE
PPH ONE % TWO % THREE % FOUR % FIVE + %
OVERALL 484,811 2.3 124,779 25.7% 221,729 45.7% 60,069 12.4% 48,897 10.1% 29,337 6.1%
FUEL AREA
Winnipeg City 261,760 2.3 74,051 28.3% 109,356 41.8% 36,643 14.0% 28,445 10.9% 13,265 5.1%
Gas Avai lable 140,021 2.3 30,909 22.1% 71,935 51.4% 15,303 10.9% 13,224 9.4% 8,649 6.2%
No Gas Avai lable 83,030 2.4 19,819 23.9% 40,438 48.7% 8,123 9.8% 7,228 8.7% 7,422 8.9%
DWELLING TYPE
Single Detached 373,568 2.4 76,744 20.5% 175,943 47.1% 49,546 13.3% 44,378 11.9% 26,956 7.2%
Multi Attached 46,834 2.2 14,238 30.4% 20,073 42.9% 6,876 14.7% 3,701 7.9% 1,947 4.2%
Apartment Sui te 64,409 1.6 33,798 52.5% 25,714 39.9% 3,647 5.7% 817 1.3% 434 0.7%
BUILDING CODE ERA
2010‐2017 37,645 2.7 7,200 19.1% 15,292 40.6% 4,353 11.6% 6,358 16.9% 4,442 11.8%
1990‐2009 89,181 2.5 15,114 16.9% 44,621 50.0% 12,452 14.0% 10,332 11.6% 6,663 7.5%
1970‐1989 161,749 2.2 42,430 26.2% 77,892 48.2% 19,887 12.3% 13,715 8.5% 7,825 4.8%
1950‐1969 110,314 2.2 29,579 26.8% 51,602 46.8% 13,823 12.5% 9,747 8.8% 5,563 5.0%
Pre 1950 85,922 2.2 30,457 35.4% 32,322 37.6% 9,555 11.1% 8,744 10.2% 4,845 5.6%
SPACE HEAT FUEL
Electric Heat 191,639 2.2 52,102 27.2% 92,279 48.2% 19,704 10.3% 13,680 7.1% 13,873 7.2%
Natura l Gas Heat 249,938 2.4 49,489 19.8% 114,446 45.8% 37,305 14.9% 33,931 13.6% 14,768 5.9%
Other Fuel 6,945 2.2 2,769 39.9% 1,905 27.4% 1,012 14.6% 996 14.3% 262 3.8%
Shared (No Heat on Bi l l ) 36,289 1.6 20,419 56.3% 13,099 36.1% 2,048 5.6% 290 0.8% 434 1.2%
PEOPLE PER HOUSEHOLD
One 124,779 1.0 124,779 100.0% 0 0.0% 0 0.0% 0 0.0% 0 0.0%
Two 221,729 2.0 0 0.0% 221,729 100.0% 0 0.0% 0 0.0% 0 0.0%
Three 60,069 3.0 0 0.0% 0 0.0% 60,069 100.0% 0 0.0% 0 0.0%
Four 48,897 4.0 0 0.0% 0 0.0% 0 0.0% 48,897 100.0% 0 0.0%
Five + 29,337 5.6 0 0.0% 0 0.0% 0 0.0% 0 0.0% 29,337 100.0%
HOUSEHOLD INCOME
Less Than $25,000 59,481 1.8 33,467 56.3% 16,048 27.0% 4,134 7.0% 2,389 4.0% 3,442 5.8%
$25,000 ‐ $49,999 137,082 1.9 51,484 37.6% 65,113 47.5% 11,252 8.2% 4,889 3.6% 4,344 3.2%
$50,000 ‐ $74,999 123,824 2.3 27,476 22.2% 64,860 52.4% 13,241 10.7% 10,414 8.4% 7,833 6.3%
$75,000 ‐ $99,999 66,780 2.6 6,372 9.5% 35,494 53.2% 10,440 15.6% 9,473 14.2% 5,000 7.5%
$100,000 + 97,644 2.9 5,979 6.1% 40,213 41.2% 21,002 21.5% 21,732 22.3% 8,718 8.9%
WINNIPEG LICO‐125 CLASS
Yes 158,987 2.2 60,381 38.0% 57,007 35.9% 15,386 9.7% 11,022 6.9% 15,190 9.6%
No 325,824 2.3 64,399 19.8% 164,722 50.6% 44,683 13.7% 37,875 11.6% 14,146 4.3%
INDIGENOUS SELF‐DECLARED ANCESTRY
Yes 51,429 2.8 8,961 17.4% 20,631 40.1% 6,294 12.2% 7,691 15.0% 7,852 15.3%
No 409,630 2.2 109,620 26.8% 190,572 46.5% 50,163 12.2% 39,186 9.6% 20,090 4.9%
Undeclared 23,751 2.3 6,199 26.1% 10,526 44.3% 3,612 15.2% 2,020 8.5% 1,395 5.9%
FIRST NATION ON RESERVE
FIRST NATION ON RESERVE 15,456 3.4 2,532 16.4% 4,083 26.4% 2,244 14.5% 2,281 14.8% 4,316 27.9%
BILL PAYMENT RATING
Excel lent 439,339 2.2 114,405 26.0% 207,270 47.2% 53,455 12.2% 41,545 9.5% 22,664 5.2%
Sati s factory 22,395 2.5 5,898 26.3% 7,883 35.2% 2,855 12.7% 3,461 15.5% 2,298 10.3%
Poor 23,077 3.0 4,477 19.4% 6,576 28.5% 3,760 16.3% 3,890 16.9% 4,374 19.0%
DWELLING OWNERSHIP
Own 404,316 2.3 89,992 22.3% 194,283 48.1% 53,067 13.1% 43,591 10.8% 23,383 5.8%
Rent / Other 80,495 2.1 34,787 43.2% 27,446 34.1% 7,003 8.7% 5,305 6.6% 5,954 7.4%
2017 RESIDENTIAL SURVEY SECTION 10 ‐ HOUSEHOLD DEMOGRAPHICS ‐ REFERENCE TABLE 10.01
PEOPLE PER HOUSEHOLD
Centra Gas Manitoba Inc. 2019/20 General Rate Application Appendix 7.7
March 22, 2019 Page 174 of 228

167
10.02 Do You Identify as an Indigenous Person
TOTAL NO %
FIRST NATION
WITH SECURE
CERTIFICATE
OF INDIAN
STATUS %
FIRST NATION
WITH NO
SECURE
CERTIFICATE OF
INDIAN STATUS %
METIS WITH
METIS
CITIZENSHIP
CARD %
METIS WITH
NO METIS
CITIZENSHIP
CARD %
INUIT WITH
SECURE
CERTIFICATE
OF INDIAN
STATUS %
INUIT WITH
NO SECURE
CERTIFICATE
OF INDIAN
STATUS %
CHOOSE
NOT TO
ANSWER %
OVERALL 484,811 409,630 84.5% 15,858 3.3% 6,975 1.4% 16,864 3.5% 11,417 2.4% 201 0.0% 115 0.0% 23,751 4.9%
FUEL AREA
Winnipeg Ci ty 261,760 231,125 88.3% 290 0.1% 3,393 1.3% 7,468 2.9% 5,855 2.2% 0 0.0% 115 0.0% 13,514 5.2%
Gas Avai lable 140,021 123,161 88.0% 0 0.0% 1,115 0.8% 5,382 3.8% 3,142 2.2% 201 0.1% 0 0.0% 7,020 5.0%
No Gas Avai lable 83,030 55,344 66.7% 15,568 18.7% 2,466 3.0% 4,014 4.8% 2,421 2.9% 0 0.0% 0 0.0% 3,218 3.9%
DWELLING TYPE
Single Detached 373,568 311,303 83.3% 14,690 3.9% 4,448 1.2% 13,778 3.7% 8,522 2.3% 201 0.1% 115 0.0% 20,512 5.5%
Multi Attached 46,834 39,674 84.7% 815 1.7% 1,494 3.2% 1,200 2.6% 1,915 4.1% 0 0.0% 0 0.0% 1,736 3.7%
Apartment Suite 64,409 58,653 91.1% 353 0.5% 1,033 1.6% 1,886 2.9% 980 1.5% 0 0.0% 0 0.0% 1,504 2.3%
BUILDING CODE ERA
2010‐2017 37,645 31,746 84.3% 1,646 4.4% 143 0.4% 1,283 3.4% 901 2.4% 0 0.0% 0 0.0% 1,926 5.1%
1990‐2009 89,181 71,849 80.6% 8,760 9.8% 906 1.0% 2,790 3.1% 1,400 1.6% 100 0.1% 0 0.0% 3,376 3.8%
1970‐1989 161,749 137,229 84.8% 5,122 3.2% 1,345 0.8% 4,950 3.1% 4,262 2.6% 0 0.0% 115 0.1% 8,727 5.4%
1950‐1969 110,314 96,286 87.3% 174 0.2% 2,890 2.6% 4,225 3.8% 1,613 1.5% 100 0.1% 0 0.0% 5,027 4.6%
Pre 1950 85,922 72,520 84.4% 155 0.2% 1,692 2.0% 3,615 4.2% 3,242 3.8% 0 0.0% 0 0.0% 4,697 5.5%
SPACE HEAT FUEL
Electri c Heat 191,639 151,957 79.3% 14,980 7.8% 3,183 1.7% 7,717 4.0% 4,920 2.6% 201 0.1% 0 0.0% 8,681 4.5%
Natura l Gas Heat 249,938 220,003 88.0% 0 0.0% 2,253 0.9% 7,939 3.2% 4,982 2.0% 0 0.0% 115 0.0% 14,646 5.9%
Other Fuel 6,945 5,059 72.8% 525 7.6% 262 3.8% 337 4.9% 337 4.9% 0 0.0% 0 0.0% 425 6.1%
Shared (No Heat on Bi l l ) 36,289 32,612 89.9% 353 1.0% 1,276 3.5% 870 2.4% 1,178 3.2% 0 0.0% 0 0.0% 0 0.0%
PEOPLE PER HOUSEHOLD
One 124,779 109,620 87.9% 2,532 2.0% 1,563 1.3% 2,371 1.9% 2,495 2.0% 0 0.0% 0 0.0% 6,199 5.0%
Two 221,729 190,572 85.9% 4,485 2.0% 2,956 1.3% 7,850 3.5% 5,240 2.4% 100 0.0% 0 0.0% 10,526 4.7%
Three 60,069 50,163 83.5% 2,244 3.7% 351 0.6% 1,623 2.7% 1,975 3.3% 100 0.2% 0 0.0% 3,612 6.0%
Four 48,897 39,186 80.1% 2,281 4.7% 1,357 2.8% 3,185 6.5% 868 1.8% 0 0.0% 0 0.0% 2,020 4.1%
Five + 29,337 20,090 68.5% 4,316 14.7% 747 2.5% 1,835 6.3% 840 2.9% 0 0.0% 115 0.4% 1,395 4.8%
HOUSEHOLD INCOME
Less Than $25,000 59,481 43,731 73.5% 8,223 13.8% 1,717 2.9% 1,363 2.3% 2,003 3.4% 0 0.0% 0 0.0% 2,444 4.1%
$25,000 ‐ $49,999 137,082 116,354 84.9% 4,395 3.2% 2,366 1.7% 4,124 3.0% 1,839 1.3% 0 0.0% 0 0.0% 8,005 5.8%
$50,000 ‐ $74,999 123,824 104,884 84.7% 1,871 1.5% 1,431 1.2% 4,648 3.8% 3,985 3.2% 0 0.0% 0 0.0% 7,004 5.7%
$75,000 ‐ $99,999 66,780 57,712 86.4% 933 1.4% 869 1.3% 2,839 4.3% 1,453 2.2% 201 0.3% 0 0.0% 2,774 4.2%
$100,000 + 97,644 86,950 89.0% 435 0.4% 593 0.6% 3,889 4.0% 2,137 2.2% 0 0.0% 115 0.1% 3,525 3.6%
WINNIPEG LICO‐125 CLASS
Yes 158,987 124,576 78.4% 13,059 8.2% 4,175 2.6% 4,439 2.8% 3,425 2.2% 0 0.0% 0 0.0% 9,313 5.9%
No 325,824 285,055 87.5% 2,798 0.9% 2,800 0.9% 12,425 3.8% 7,993 2.5% 201 0.1% 115 0.0% 14,438 4.4%
INDIGENOUS SELF‐DECLARED ANCESTRY
Yes 51,429 0 0.0% 15,858 30.8% 6,975 13.6% 16,864 32.8% 11,417 22.2% 201 0.4% 115 0.2% 0 0.0%
No 409,630 409,630 100.0% 0 0.0% 0 0.0% 0 0.0% 0 0.0% 0 0.0% 0 0.0% 0 0.0%
Undeclared 23,751 0 0.0% 0 0.0% 0 0.0% 0 0.0% 0 0.0% 0 0.0% 0 0.0% 23,751 100.0%
FIRST NATION ON RESERVE
FIRST NATION ON RESERVE 15,456 0 0.0% 15,456 100.0% 0 0.0% 0 0.0% 0 0.0% 0 0.0% 0 0.0% 0 0.0%
BILL PAYMENT RATING
Excel lent 439,339 379,314 86.3% 6,949 1.6% 5,233 1.2% 15,158 3.5% 10,685 2.4% 201 0.0% 115 0.0% 21,684 4.9%
Satis factory 22,395 16,582 74.0% 3,053 13.6% 488 2.2% 754 3.4% 417 1.9% 0 0.0% 0 0.0% 1,101 4.9%
Poor 23,077 13,735 59.5% 5,855 25.4% 1,254 5.4% 952 4.1% 315 1.4% 0 0.0% 0 0.0% 967 4.2%
DWELLING OWNERSHIP
Own 404,316 350,294 86.6% 4,514 1.1% 3,566 0.9% 15,046 3.7% 9,058 2.2% 201 0.0% 115 0.0% 21,522 5.3%
Rent / Other 80,495 59,337 73.7% 11,344 14.1% 3,409 4.2% 1,818 2.3% 2,359 2.9% 0 0.0% 0 0.0% 2,229 2.8%
2017 RESIDENTIAL SURVEY SECTION 10 ‐ HOUSEHOLD DEMOGRAPHICS ‐ REFERENCE TABLE 10.02
DO YOU IDENTIFY YOURSELF AS AN INDIGENOUS PERSON
Centra Gas Manitoba Inc. 2019/20 General Rate Application Appendix 7.7
March 22, 2019 Page 175 of 228

168
10.03a Language Other Than English Spoken in Your Household
TOTAL
ENGLISH
ONLY % FRENCH % ANISHINAABE % CREE % DAKOTA % DENE % INUKTITUT % MICHIF %
OVERALL 484,811 351,392 72.5% 40,496 8.4% 6,347 1.3% 6,067 1.3% 187 0.0% 262 0.1% 0 0.0% 112 0.0%
FUEL AREA
Winnipeg City 261,760 188,470 72.0% 24,200 9.2% 1,254 0.5% 115 0.0% 0 0.0% 0 0.0% 0 0.0% 0 0.0%
Gas Avai lable 140,021 103,839 74.2% 10,994 7.9% 308 0.2% 103 0.1% 0 0.0% 0 0.0% 0 0.0% 0 0.0%
No Gas Avai lable 83,030 59,082 71.2% 5,302 6.4% 4,785 5.8% 5,850 7.0% 187 0.2% 262 0.3% 0 0.0% 112 0.1%
DWELLING TYPE
Single Detached 373,568 268,970 72.0% 31,888 8.5% 5,119 1.4% 5,665 1.5% 187 0.0% 262 0.1% 0 0.0% 112 0.0%
Multi Attached 46,834 33,729 72.0% 3,758 8.0% 358 0.8% 340 0.7% 0 0.0% 0 0.0% 0 0.0% 0 0.0%
Apartment Sui te 64,409 48,693 75.6% 4,850 7.5% 870 1.4% 63 0.1% 0 0.0% 0 0.0% 0 0.0% 0 0.0%
BUILDING CODE ERA
2010‐2017 37,645 24,353 64.7% 3,625 9.6% 549 1.5% 602 1.6% 0 0.0% 0 0.0% 0 0.0% 0 0.0%
1990‐2009 89,181 60,121 67.4% 7,778 8.7% 2,436 2.7% 3,401 3.8% 93 0.1% 131 0.1% 0 0.0% 112 0.1%
1970‐1989 161,749 118,575 73.3% 13,570 8.4% 2,205 1.4% 1,673 1.0% 93 0.1% 131 0.1% 0 0.0% 0 0.0%
1950‐1969 110,314 85,528 77.5% 7,006 6.4% 735 0.7% 276 0.3% 0 0.0% 0 0.0% 0 0.0% 0 0.0%
Pre 1950 85,922 62,815 73.1% 8,516 9.9% 422 0.5% 115 0.1% 0 0.0% 0 0.0% 0 0.0% 0 0.0%
SPACE HEAT FUEL
Electric Heat 191,639 140,892 73.5% 14,444 7.5% 4,785 2.5% 5,525 2.9% 187 0.1% 0 0.0% 0 0.0% 112 0.1%
Natural Gas Heat 249,938 177,885 71.2% 22,422 9.0% 691 0.3% 217 0.1% 0 0.0% 0 0.0% 0 0.0% 0 0.0%
Other Fuel 6,945 5,309 76.4% 131 1.9% 0 0.0% 262 3.8% 0 0.0% 262 3.8% 0 0.0% 0 0.0%
Shared (No Heat on Bi l l ) 36,289 27,305 75.2% 3,498 9.6% 870 2.4% 63 0.2% 0 0.0% 0 0.0% 0 0.0% 0 0.0%
PEOPLE PER HOUSEHOLD
One 124,779 98,527 79.0% 7,585 6.1% 867 0.7% 778 0.6% 93 0.1% 131 0.1% 0 0.0% 112 0.1%
Two 221,729 163,955 73.9% 17,831 8.0% 2,387 1.1% 1,469 0.7% 0 0.0% 131 0.1% 0 0.0% 0 0.0%
Three 60,069 41,984 69.9% 5,208 8.7% 871 1.4% 560 0.9% 31 0.1% 0 0.0% 0 0.0% 0 0.0%
Four 48,897 31,664 64.8% 5,173 10.6% 979 2.0% 1,343 2.7% 0 0.0% 0 0.0% 0 0.0% 0 0.0%
Five + 29,337 15,263 52.0% 4,700 16.0% 1,243 4.2% 1,917 6.5% 62 0.2% 0 0.0% 0 0.0% 0 0.0%
HOUSEHOLD INCOME
Less Than $25,000 59,481 40,912 68.8% 2,787 4.7% 2,972 5.0% 2,998 5.0% 155 0.3% 131 0.2% 0 0.0% 0 0.0%
$25,000 ‐ $49,999 137,082 99,790 72.8% 7,588 5.5% 2,300 1.7% 1,606 1.2% 0 0.0% 131 0.1% 0 0.0% 112 0.1%
$50,000 ‐ $74,999 123,824 91,282 73.7% 8,982 7.3% 631 0.5% 854 0.7% 0 0.0% 0 0.0% 0 0.0% 0 0.0%
$75,000 ‐ $99,999 66,780 47,321 70.9% 7,382 11.1% 155 0.2% 485 0.7% 31 0.0% 0 0.0% 0 0.0% 0 0.0%
$100,000 + 97,644 72,086 73.8% 13,757 14.1% 289 0.3% 124 0.1% 0 0.0% 0 0.0% 0 0.0% 0 0.0%
WINNIPEG LICO‐125 CLASS
Yes 158,987 107,894 67.9% 7,790 4.9% 5,272 3.3% 5,032 3.2% 155 0.1% 262 0.2% 0 0.0% 112 0.1%
No 325,824 243,498 74.7% 32,706 10.0% 1,075 0.3% 1,035 0.3% 31 0.0% 0 0.0% 0 0.0% 0 0.0%
INDIGENOUS SELF‐DECLARED ANCESTRY
Yes 51,429 30,576 59.5% 5,661 11.0% 6,347 12.3% 6,067 11.8% 187 0.4% 262 0.5% 0 0.0% 112 0.2%
No 409,630 309,370 75.5% 33,684 8.2% 0 0.0% 0 0.0% 0 0.0% 0 0.0% 0 0.0% 0 0.0%
Undeclared 23,751 11,446 48.2% 1,151 4.8% 0 0.0% 0 0.0% 0 0.0% 0 0.0% 0 0.0% 0 0.0%
FIRST NATION ON RESERVE
FIRST NATION ON RESERVE 15,456 4,569 29.6% 62 0.4% 4,339 28.1% 5,222 33.8% 187 1.2% 262 1.7% 0 0.0% 0 0.0%
BILL PAYMENT RATING
Excel lent 439,339 322,296 73.4% 37,075 8.4% 3,354 0.8% 2,352 0.5% 0 0.0% 131 0.0% 0 0.0% 112 0.0%
Satis factory 22,395 14,810 66.1% 1,763 7.9% 991 4.4% 908 4.1% 31 0.1% 131 0.6% 0 0.0% 0 0.0%
Poor 23,077 14,285 61.9% 1,659 7.2% 2,002 8.7% 2,806 12.2% 155 0.7% 0 0.0% 0 0.0% 0 0.0%
DWELLING OWNERSHIP
Own 404,316 296,539 73.3% 35,098 8.7% 1,970 0.5% 1,756 0.4% 0 0.0% 0 0.0% 0 0.0% 112 0.0%
Rent / Other 80,495 54,853 68.1% 5,398 6.7% 4,377 5.4% 4,311 5.4% 187 0.2% 262 0.3% 0 0.0% 0 0.0%
2017 RESIDENTIAL SURVEY SECTION 10 ‐ HOUSEHOLD DEMOGRAPHICS ‐ REFERENCE TABLE 10.03
LANGUAGE OTHER THAN ENGLISH SPOKEN IN YOUR HOUSEHOLD
Centra Gas Manitoba Inc. 2019/20 General Rate Application Appendix 7.7
March 22, 2019 Page 176 of 228

169
10.03b Language Other Than English Spoken in Your Household Continued
TOTAL OJI‐CREE % GERMAN % TAGALOG % UKRANIAN % PUNJABI % SPANISH % MANDARIN % POLISH %
OVERALL 484,811 280 0.1% 18,832 3.9% 10,482 2.2% 8,894 1.8% 2,426 0.5% 2,472 0.5% 2,137 0.4% 2,635 0.5%
FUEL AREA
Winnipeg City 261,760 0 0.0% 5,602 2.1% 9,032 3.5% 4,146 1.6% 2,323 0.9% 1,659 0.6% 1,817 0.7% 1,876 0.7%
Gas Ava i lable 140,021 0 0.0% 11,444 8.2% 1,295 0.9% 3,297 2.4% 103 0.1% 590 0.4% 208 0.1% 760 0.5%
No Gas Avai lable 83,030 280 0.3% 1,785 2.2% 155 0.2% 1,451 1.7% 0 0.0% 223 0.3% 112 0.1% 0 0.0%
DWELLING TYPE
Single Detached 373,568 280 0.1% 14,889 4.0% 7,535 2.0% 7,607 2.0% 1,250 0.3% 1,846 0.5% 1,706 0.5% 2,127 0.6%
Multi Attached 46,834 0 0.0% 1,953 4.2% 1,285 2.7% 306 0.7% 723 1.5% 463 1.0% 105 0.2% 306 0.7%
Apartment Suite 64,409 0 0.0% 1,990 3.1% 1,662 2.6% 980 1.5% 453 0.7% 163 0.3% 326 0.5% 202 0.3%
BUILDING CODE ERA
2010‐2017 37,645 93 0.2% 2,309 6.1% 986 2.6% 100 0.3% 529 1.4% 103 0.3% 899 2.4% 0 0.0%
1990‐2009 89,181 124 0.1% 5,691 6.4% 1,296 1.5% 1,616 1.8% 392 0.4% 492 0.6% 322 0.4% 714 0.8%
1970‐1989 161,749 62 0.0% 4,874 3.0% 3,130 1.9% 3,611 2.2% 828 0.5% 823 0.5% 226 0.1% 1,233 0.8%
1950‐1969 110,314 0 0.0% 3,227 2.9% 1,853 1.7% 2,230 2.0% 230 0.2% 840 0.8% 574 0.5% 459 0.4%
Pre 1950 85,922 0 0.0% 2,731 3.2% 3,218 3.7% 1,336 1.6% 447 0.5% 215 0.3% 115 0.1% 230 0.3%
SPACE HEAT FUEL
Electric Heat 191,639 280 0.1% 8,207 4.3% 2,238 1.2% 3,698 1.9% 423 0.2% 771 0.4% 437 0.2% 555 0.3%
Natural Gas Heat 249,938 0 0.0% 9,611 3.8% 7,233 2.9% 4,906 2.0% 1,713 0.7% 1,701 0.7% 1,700 0.7% 2,081 0.8%
Other Fuel 6,945 0 0.0% 0 0.0% 0 0.0% 0 0.0% 0 0.0% 0 0.0% 0 0.0% 0 0.0%
Shared (No Heat on Bi l l ) 36,289 0 0.0% 1,014 2.8% 1,011 2.8% 290 0.8% 290 0.8% 0 0.0% 0 0.0% 0 0.0%
PEOPLE PER HOUSEHOLD
One 124,779 31 0.0% 3,913 3.1% 698 0.6% 2,950 2.4% 217 0.2% 255 0.2% 278 0.2% 230 0.2%
Two 221,729 31 0.0% 10,784 4.9% 2,848 1.3% 5,077 2.3% 634 0.3% 584 0.3% 848 0.4% 1,490 0.7%
Three 60,069 0 0.0% 2,273 3.8% 1,972 3.3% 432 0.7% 661 1.1% 803 1.3% 230 0.4% 457 0.8%
Four 48,897 0 0.0% 900 1.8% 3,162 6.5% 332 0.7% 423 0.9% 574 1.2% 552 1.1% 344 0.7%
Five + 29,337 218 0.7% 962 3.3% 1,801 6.1% 103 0.3% 489 1.7% 257 0.9% 230 0.8% 115 0.4%
HOUSEHOLD INCOME
Less Than $25,000 59,481 93 0.2% 2,118 3.6% 912 1.5% 1,965 3.3% 529 0.9% 0 0.0% 230 0.4% 115 0.2%
$25,000 ‐ $49,999 137,082 124 0.1% 6,619 4.8% 3,279 2.4% 2,846 2.1% 831 0.6% 736 0.5% 622 0.5% 1,068 0.8%
$50,000 ‐ $74,999 123,824 0 0.0% 5,393 4.4% 2,971 2.4% 2,981 2.4% 290 0.2% 519 0.4% 459 0.4% 432 0.3%
$75,000 ‐ $99,999 66,780 31 0.0% 2,097 3.1% 2,236 3.3% 571 0.9% 499 0.7% 484 0.7% 278 0.4% 676 1.0%
$100,000 + 97,644 31 0.0% 2,604 2.7% 1,084 1.1% 532 0.5% 278 0.3% 733 0.8% 549 0.6% 344 0.4%
WINNIPEG LICO‐125 CLASS
Yes 158,987 218 0.1% 8,036 5.1% 4,708 3.0% 3,937 2.5% 1,474 0.9% 838 0.5% 966 0.6% 1,068 0.7%
No 325,824 62 0.0% 10,795 3.3% 5,773 1.8% 4,957 1.5% 951 0.3% 1,634 0.5% 1,171 0.4% 1,568 0.5%
INDIGENOUS SELF‐DECLARED ANCESTRY
Yes 51,429 280 0.5% 115 0.2% 0 0.0% 103 0.2% 115 0.2% 0 0.0% 112 0.2% 0 0.0%
No 409,630 0 0.0% 18,042 4.4% 10,137 2.5% 8,245 2.0% 2,196 0.5% 2,472 0.6% 1,910 0.5% 2,481 0.6%
Undeclared 23,751 0 0.0% 675 2.8% 344 1.4% 546 2.3% 115 0.5% 0 0.0% 115 0.5% 154 0.6%
FIRST NATION ON RESERVE
FIRST NATION ON RESERVE 15,456 280 1.8% 0 0.0% 0 0.0% 0 0.0% 0 0.0% 0 0.0% 0 0.0% 0 0.0%
BILL PAYMENT RATING
Excel lent 439,339 62 0.0% 17,781 4.0% 9,501 2.2% 8,679 2.0% 1,825 0.4% 2,357 0.5% 2,022 0.5% 2,481 0.6%
Sati s factory 22,395 93 0.4% 738 3.3% 763 3.4% 215 1.0% 384 1.7% 115 0.5% 115 0.5% 0 0.0%
Poor 23,077 124 0.5% 312 1.4% 217 0.9% 0 0.0% 217 0.9% 0 0.0% 0 0.0% 154 0.7%
DWELLING OWNERSHIP
Own 404,316 62 0.0% 16,083 4.0% 8,744 2.2% 8,299 2.1% 1,876 0.5% 2,052 0.5% 2,137 0.5% 2,434 0.6%
Rent / Other 80,495 218 0.3% 2,749 3.4% 1,737 2.2% 595 0.7% 550 0.7% 420 0.5% 0 0.0% 202 0.3%
2017 RESIDENTIAL SURVEY SECTION 10 ‐ HOUSEHOLD DEMOGRAPHICS ‐ REFERENCE TABLE 10.03 (CONTINUED)
LANGUAGE OTHER THAN ENGLISH SPOKEN IN YOUR HOUSEHOLD
Centra Gas Manitoba Inc. 2019/20 General Rate Application Appendix 7.7
March 22, 2019 Page 177 of 228

170
10.03c Language Other Than English Spoken in Your Household Continued
TOTAL RUSSIAN % PORTUGESE % ITALIAN % ARABIC % GREEK % OTHER %
CHOOSE
NOT TO
ANSWER %
OVERALL 484,811 1,158 0.2% 1,898 0.4% 1,698 0.4% 392 0.1% 217 0.0% 10,374 2.1% 16,055 3.3%
FUEL AREA
Winnipeg City 261,760 1,058 0.4% 1,686 0.6% 1,698 0.6% 392 0.1% 115 0.0% 6,937 2.7% 9,380 3.6%
Gas Avai lable 140,021 100 0.1% 100 0.1% 0 0.0% 0 0.0% 103 0.1% 2,399 1.7% 4,380 3.1%
No Gas Avai lable 83,030 0 0.0% 112 0.1% 0 0.0% 0 0.0% 0 0.0% 1,038 1.2% 2,295 2.8%
DWELLING TYPE
Single Detached 373,568 559 0.1% 1,589 0.4% 1,148 0.3% 230 0.1% 217 0.1% 7,302 2.0% 13,081 3.5%
Multi Attached 46,834 309 0.7% 309 0.7% 260 0.6% 0 0.0% 0 0.0% 924 2.0% 1,707 3.6%
Apartment Suite 64,409 290 0.5% 0 0.0% 290 0.5% 163 0.3% 0 0.0% 2,149 3.3% 1,267 2.0%
BUILDING CODE ERA
2010‐2017 37,645 100 0.3% 456 1.2% 0 0.0% 278 0.7% 0 0.0% 1,057 2.8% 1,605 4.3%
1990‐2009 89,181 115 0.1% 445 0.5% 230 0.3% 0 0.0% 0 0.0% 1,343 1.5% 2,330 2.6%
1970‐1989 161,749 269 0.2% 538 0.3% 1,124 0.7% 115 0.1% 115 0.1% 2,799 1.7% 5,754 3.6%
1950‐1969 110,314 674 0.6% 230 0.2% 344 0.3% 0 0.0% 0 0.0% 2,572 2.3% 3,538 3.2%
Pre 1950 85,922 0 0.0% 230 0.3% 0 0.0% 0 0.0% 103 0.1% 2,603 3.0% 2,828 3.3%
SPACE HEAT FUEL
Electric Heat 191,639 100 0.1% 212 0.1% 260 0.1% 163 0.1% 0 0.0% 2,201 1.1% 6,150 3.2%
Natura l Gas Heat 249,938 768 0.3% 1,686 0.7% 1,148 0.5% 230 0.1% 217 0.1% 6,540 2.6% 9,190 3.7%
Other Fuel 6,945 0 0.0% 0 0.0% 0 0.0% 0 0.0% 0 0.0% 556 8.0% 425 6.1%
Shared (No Heat on Bi l l ) 36,289 290 0.8% 0 0.0% 290 0.8% 0 0.0% 0 0.0% 1,077 3.0% 290 0.8%
PEOPLE PER HOUSEHOLD
One 124,779 0 0.0% 230 0.2% 344 0.3% 0 0.0% 103 0.1% 1,978 1.6% 5,459 4.4%
Two 221,729 674 0.3% 865 0.4% 719 0.3% 278 0.1% 0 0.0% 5,178 2.3% 5,947 2.7%
Three 60,069 269 0.4% 459 0.8% 520 0.9% 0 0.0% 115 0.2% 1,330 2.2% 1,896 3.2%
Four 48,897 115 0.2% 230 0.5% 115 0.2% 0 0.0% 0 0.0% 1,052 2.2% 1,940 4.0%
Five + 29,337 100 0.3% 115 0.4% 0 0.0% 115 0.4% 0 0.0% 836 2.9% 812 2.8%
HOUSEHOLD INCOME
Less Than $25,000 59,481 0 0.0% 115 0.2% 115 0.2% 0 0.0% 103 0.2% 1,736 2.9% 1,496 2.5%
$25,000 ‐ $49,999 137,082 115 0.1% 764 0.6% 459 0.3% 0 0.0% 0 0.0% 3,084 2.3% 5,009 3.7%
$50,000 ‐ $74,999 123,824 330 0.3% 230 0.2% 604 0.5% 0 0.0% 0 0.0% 2,695 2.2% 5,171 4.2%
$75,000 ‐ $99,999 66,780 444 0.7% 330 0.5% 115 0.2% 115 0.2% 0 0.0% 1,033 1.5% 2,497 3.7%
$100,000 + 97,644 269 0.3% 459 0.5% 405 0.4% 278 0.3% 115 0.1% 1,825 1.9% 1,881 1.9%
WINNIPEG LICO‐125 CLASS
Yes 158,987 215 0.1% 725 0.5% 459 0.3% 0 0.0% 103 0.1% 4,190 2.6% 5,533 3.5%
No 325,824 943 0.3% 1,173 0.4% 1,239 0.4% 392 0.1% 115 0.0% 6,184 1.9% 10,521 3.2%
INDIGENOUS SELF‐DECLARED ANCESTRY
Yes 51,429 0 0.0% 0 0.0% 0 0.0% 0 0.0% 0 0.0% 471 0.9% 1,024 2.0%
No 409,630 1,158 0.3% 1,671 0.4% 1,583 0.4% 392 0.1% 217 0.1% 9,094 2.2% 6,976 1.7%
Undeclared 23,751 0 0.0% 226 1.0% 115 0.5% 0 0.0% 0 0.0% 809 3.4% 8,055 33.9%
FIRST NATION ON RESERVE
FIRST NATION ON RESERVE 15,456 0 0.0% 0 0.0% 0 0.0% 0 0.0% 0 0.0% 256 1.7% 280 1.8%
BILL PAYMENT RATING
Excel lent 439,339 1,158 0.3% 1,797 0.4% 1,583 0.4% 392 0.1% 217 0.0% 9,748 2.2% 14,415 3.3%
Satis factory 22,395 0 0.0% 100 0.4% 115 0.5% 0 0.0% 0 0.0% 512 2.3% 610 2.7%
Poor 23,077 0 0.0% 0 0.0% 0 0.0% 0 0.0% 0 0.0% 115 0.5% 1,029 4.5%
DWELLING OWNERSHIP
Own 404,316 868 0.2% 1,898 0.5% 1,407 0.3% 230 0.1% 217 0.1% 8,278 2.0% 14,257 3.5%
Rent / Other 80,495 290 0.4% 0 0.0% 290 0.4% 163 0.2% 0 0.0% 2,096 2.6% 1,798 2.2%
2017 RESIDENTIAL SURVEY SECTION 10 ‐ HOUSEHOLD DEMOGRAPHICS ‐ REFERENCE TABLE 10.03 (CONTINUED)
LANGUAGE OTHER THAN ENGLISH SPOKEN IN YOUR HOUSEHOLD
Centra Gas Manitoba Inc. 2019/20 General Rate Application Appendix 7.7
March 22, 2019 Page 178 of 228

171
10.04 Total Annual Household Income
TOTAL
AVERAGE
INCOME
UNDER
$25,000 %
$25,000 ‐
$49,999 %
$50,000 ‐
$74,999 %
$75,000 ‐
$99,999 %
$100,000
& OVER %
OVERALL 484,811 $76,815 59,481 12.3% 137,082 28.3% 123,824 25.5% 66,780 13.8% 97,644 20.1%
FUEL AREA
Winnipeg City 261,760 $83,385 23,913 9.1% 71,825 27.4% 67,658 25.8% 35,872 13.7% 62,492 23.9%
Gas Avai lable 140,021 $74,574 17,367 12.4% 38,590 27.6% 37,608 26.9% 20,559 14.7% 25,898 18.5%
No Gas Avai lable 83,030 $59,879 18,201 21.9% 26,667 32.1% 18,558 22.4% 10,349 12.5% 9,254 11.1%
DWELLING TYPE
Single Detached 373,568 $82,407 37,111 9.9% 98,611 26.4% 94,735 25.4% 57,836 15.5% 85,274 22.8%
Multi Attached 46,834 $64,168 8,235 17.6% 13,926 29.7% 14,544 31.1% 3,401 7.3% 6,728 14.4%
Apartment Sui te 64,409 $53,575 14,134 21.9% 24,545 38.1% 14,545 22.6% 5,543 8.6% 5,641 8.8%
BUILDING CODE ERA
2010‐2017 37,645 $99,822 3,216 8.5% 7,077 18.8% 9,360 24.9% 7,124 18.9% 10,868 28.9%
1990‐2009 89,181 $88,656 9,280 10.4% 20,475 23.0% 22,179 24.9% 14,321 16.1% 22,926 25.7%
1970‐1989 161,749 $71,107 19,390 12.0% 50,471 31.2% 41,451 25.6% 22,062 13.6% 28,375 17.5%
1950‐1969 110,314 $71,914 12,974 11.8% 33,633 30.5% 31,227 28.3% 13,166 11.9% 19,314 17.5%
Pre 1950 85,922 $71,479 14,620 17.0% 25,427 29.6% 19,606 22.8% 10,107 11.8% 16,161 18.8%
SPACE HEAT FUEL
Electric Heat 191,639 $63,800 31,151 16.3% 64,229 33.5% 46,938 24.5% 24,794 12.9% 24,527 12.8%
Natura l Gas Heat 249,938 $90,111 15,766 6.3% 61,104 24.4% 66,076 26.4% 39,427 15.8% 67,564 27.0%
Other Fuel 6,945 $57,568 3,544 51.0% 469 6.7% 1,524 21.9% 675 9.7% 734 10.6%
Shared (No Heat on Bi l l ) 36,289 $57,650 9,019 24.9% 11,281 31.1% 9,286 25.6% 1,884 5.2% 4,820 13.3%
PEOPLE PER HOUSEHOLD
One 124,779 $45,523 33,467 26.8% 51,484 41.3% 27,476 22.0% 6,372 5.1% 5,979 4.8%
Two 221,729 $74,896 16,048 7.2% 65,113 29.4% 64,860 29.3% 35,494 16.0% 40,213 18.1%
Three 60,069 $102,092 4,134 6.9% 11,252 18.7% 13,241 22.0% 10,440 17.4% 21,002 35.0%
Four 48,897 $124,607 2,389 4.9% 4,889 10.0% 10,414 21.3% 9,473 19.4% 21,732 44.4%
Five + 29,337 $92,997 3,442 11.7% 4,344 14.8% 7,833 26.7% 5,000 17.0% 8,718 29.7%
HOUSEHOLD INCOME
Less Than $25,000 59,481 $20,077 59,481 100.0% 0 0.0% 0 0.0% 0 0.0% 0 0.0%
$25,000 ‐ $49,999 137,082 $36,975 0 0.0% 137,082 100.0% 0 0.0% 0 0.0% 0 0.0%
$50,000 ‐ $74,999 123,824 $61,043 0 0.0% 0 0.0% 123,824 100.0% 0 0.0% 0 0.0%
$75,000 ‐ $99,999 66,780 $86,279 0 0.0% 0 0.0% 0 0.0% 66,780 100.0% 0 0.0%
$100,000 + 97,644 $180,836 0 0.0% 0 0.0% 0 0.0% 0 0.0% 97,644 100.0%
WINNIPEG LICO‐125 CLASS
Yes 158,987 $30,231 59,481 37.4% 88,357 55.6% 10,450 6.6% 699 0.4% 0 0.0%
No 325,824 $99,545 0 0.0% 48,726 15.0% 113,374 34.8% 66,081 20.3% 97,644 30.0%
INDIGENOUS SELF‐DECLARED ANCESTRY
Yes 51,429 $61,566 13,306 25.9% 12,724 24.7% 11,936 23.2% 6,294 12.2% 7,169 13.9%
No 409,630 $79,034 43,731 10.7% 116,354 28.4% 104,884 25.6% 57,712 14.1% 86,950 21.2%
Undeclared 23,751 $71,555 2,444 10.3% 8,005 33.7% 7,004 29.5% 2,774 11.7% 3,525 14.8%
FIRST NATION ON RESERVE
FIRST NATION ON RESERVE 15,456 $36,363 7,933 51.3% 4,284 27.7% 1,871 12.1% 933 6.0% 435 2.8%
BILL PAYMENT RATING
Excel lent 439,339 $78,158 47,223 10.7% 125,852 28.6% 114,347 26.0% 61,453 14.0% 90,465 20.6%
Satis factory 22,395 $72,060 5,234 23.4% 4,396 19.6% 5,438 24.3% 2,670 11.9% 4,657 20.8%
Poor 23,077 $55,851 7,024 30.4% 6,834 29.6% 4,039 17.5% 2,657 11.5% 2,522 10.9%
DWELLING OWNERSHIP
Own 404,316 $82,715 33,631 8.3% 110,628 27.4% 107,034 26.5% 61,103 15.1% 91,921 22.7%
Rent / Other 80,495 $47,180 25,850 32.1% 26,455 32.9% 16,790 20.9% 5,677 7.1% 5,723 7.1%
2017 RESIDENTIAL SURVEY SECTION 10 ‐ HOUSEHOLD DEMOGRAPHICS ‐ REFERENCE TABLE 10.04
TOTAL ANNUAL HOUSESHOLD INCOME
Centra Gas Manitoba Inc. 2019/20 General Rate Application Appendix 7.7
March 22, 2019 Page 179 of 228

172
10.05 Highest Education Level Attended by Head(s) of Household
TOTAL
HIGH
SCHOOL
OR LESS %
NON‐
UNIVERSITY % UNIVERSITY %
CHOOSE
NOT TO
ANSWER %
OVERALL 484,811 127,666 26.3% 129,414 26.7% 166,231 34.3% 61,499 12.7%
FUEL AREA
Winnipeg City 261,760 54,213 20.7% 63,248 24.2% 111,668 42.7% 32,630 12.5%
Gas Avai lable 140,021 45,482 32.5% 41,563 29.7% 35,676 25.5% 17,301 12.4%
No Gas Avai lable 83,030 27,971 33.7% 24,604 29.6% 18,887 22.7% 11,568 13.9%
DWELLING TYPE
Single Detached 373,568 98,718 26.4% 103,163 27.6% 124,063 33.2% 47,624 12.7%
Multi Attached 46,834 12,194 26.0% 13,879 29.6% 15,285 32.6% 5,476 11.7%
Apartment Suite 64,409 16,754 26.0% 12,372 19.2% 26,884 41.7% 8,399 13.0%
BUILDING CODE ERA
2010‐2017 37,645 5,898 15.7% 10,285 27.3% 17,448 46.3% 4,015 10.7%
1990‐2009 89,181 22,397 25.1% 20,610 23.1% 33,843 37.9% 12,331 13.8%
1970‐1989 161,749 45,468 28.1% 45,164 27.9% 48,709 30.1% 22,408 13.9%
1950‐1969 110,314 30,052 27.2% 30,533 27.7% 36,613 33.2% 13,117 11.9%
Pre 1950 85,922 23,852 27.8% 22,823 26.6% 29,618 34.5% 9,629 11.2%
SPACE HEAT FUEL
Electric Heat 191,639 59,379 31.0% 55,464 28.9% 49,932 26.1% 26,864 14.0%
Natural Gas Heat 249,938 54,666 21.9% 66,863 26.8% 98,405 39.4% 30,004 12.0%
Other Fuel 6,945 3,619 52.1% 1,274 18.4% 1,158 16.7% 893 12.9%
Shared (No Heat on Bi l l ) 36,289 10,002 27.6% 5,813 16.0% 16,737 46.1% 3,737 10.3%
PEOPLE PER HOUSEHOLD
One 124,779 41,118 33.0% 30,877 24.7% 34,328 27.5% 18,456 14.8%
Two 221,729 58,390 26.3% 60,400 27.2% 73,730 33.3% 29,209 13.2%
Three 60,069 12,637 21.0% 16,678 27.8% 23,809 39.6% 6,945 11.6%
Four 48,897 8,975 18.4% 12,961 26.5% 22,916 46.9% 4,044 8.3%
Five + 29,337 6,545 22.3% 8,499 29.0% 11,448 39.0% 2,844 9.7%
HOUSEHOLD INCOME
Less Than $25,000 59,481 31,070 52.2% 12,691 21.3% 6,749 11.3% 8,971 15.1%
$25,000 ‐ $49,999 137,082 49,554 36.1% 37,622 27.4% 25,406 18.5% 24,500 17.9%
$50,000 ‐ $74,999 123,824 27,320 22.1% 38,833 31.4% 42,165 34.1% 15,506 12.5%
$75,000 ‐ $99,999 66,780 10,874 16.3% 20,781 31.1% 28,184 42.2% 6,941 10.4%
$100,000 + 97,644 8,848 9.1% 19,487 20.0% 63,728 65.3% 5,581 5.7%
WINNIPEG LICO‐125 CLASS
Yes 158,987 69,256 43.6% 37,125 23.4% 24,700 15.5% 27,906 17.6%
No 325,824 58,410 17.9% 92,290 28.3% 141,531 43.4% 33,593 10.3%
INDIGENOUS SELF‐DECLARED ANCESTRY
Yes 51,429 16,056 31.2% 16,456 32.0% 12,850 25.0% 6,068 11.8%
No 409,630 107,941 26.4% 109,419 26.7% 148,661 36.3% 43,609 10.6%
Undeclared 23,751 3,669 15.4% 3,540 14.9% 4,720 19.9% 11,822 49.8%
FIRST NATION ON RESERVE
FIRST NATION ON RESERVE 15,456 5,178 33.5% 4,279 27.7% 2,680 17.3% 3,320 21.5%
BILL PAYMENT RATING
Excel lent 439,339 113,357 25.8% 114,859 26.1% 155,815 35.5% 55,308 12.6%
Satis factory 22,395 6,452 28.8% 7,600 33.9% 5,221 23.3% 3,122 13.9%
Poor 23,077 7,857 34.0% 6,955 30.1% 5,195 22.5% 3,070 13.3%
DWELLING OWNERSHIP
Own 404,316 103,604 25.6% 109,382 27.1% 141,410 35.0% 49,920 12.3%
Rent / Other 80,495 24,063 29.9% 20,033 24.9% 24,821 30.8% 11,579 14.4%
2017 RESIDENTIAL SURVEY SECTION 10 ‐ HOUSEHOLD DEMOGRAPHICS ‐ REFERENCE TABLE 10.05
HIGHEST EDUCATION LEVEL ATTAINED BY HEAD(S) OF HOUSEHOLD
Centra Gas Manitoba Inc. 2019/20 General Rate Application Appendix 7.7
March 22, 2019 Page 180 of 228

173
10.06 Winnipeg LICO‐125 Classification
TOTAL YES LICO % NOT LICO %
OVERALL 484,811 158,987 32.8% 325,824 67.2%
FUEL AREA
Winnipeg City 261,760 73,323 28.0% 188,437 72.0%
Gas Avai lable 140,021 45,966 32.8% 94,055 67.2%
No Gas Avai lable 83,030 39,698 47.8% 43,332 52.2%
DWELLING TYPE
Single Detached 373,568 112,000 30.0% 261,568 70.0%
Multi Attached 46,834 18,431 39.4% 28,403 60.6%
Apartment Sui te 64,409 28,555 44.3% 35,854 55.7%
BUILDING CODE ERA
2010‐2017 37,645 9,326 24.8% 28,319 75.2%
1990‐2009 89,181 24,801 27.8% 64,380 72.2%
1970‐1989 161,749 55,411 34.3% 106,337 65.7%
1950‐1969 110,314 36,356 33.0% 73,959 67.0%
Pre 1950 85,922 33,093 38.5% 52,829 61.5%
SPACE HEAT FUEL
Electric Heat 191,639 78,001 40.7% 113,638 59.3%
Natura l Gas Heat 249,938 60,742 24.3% 189,196 75.7%
Other Fuel 6,945 4,013 57.8% 2,932 42.2%
Shared (No Heat on Bi l l ) 36,289 16,231 44.7% 20,058 55.3%
PEOPLE PER HOUSEHOLD
One 124,779 60,381 48.4% 64,399 51.6%
Two 221,729 57,007 25.7% 164,722 74.3%
Three 60,069 15,386 25.6% 44,683 74.4%
Four 48,897 11,022 22.5% 37,875 77.5%
Five + 29,337 15,190 51.8% 14,146 48.2%
HOUSEHOLD INCOME
Less Than $25,000 59,481 59,481 100.0% 0 0.0%
$25,000 ‐ $49,999 137,082 88,357 64.5% 48,726 35.5%
$50,000 ‐ $74,999 123,824 10,450 8.4% 113,374 91.6%
$75,000 ‐ $99,999 66,780 699 1.0% 66,081 99.0%
$100,000 + 97,644 0 0.0% 97,644 100.0%
WINNIPEG LICO‐125 CLASS
Yes 158,987 158,987 100.0% 0 0.0%
No 325,824 0 0.0% 325,824 100.0%
INDIGENOUS SELF‐DECLARED ANCESTRY
Yes 51,429 25,098 48.8% 26,331 51.2%
No 409,630 124,576 30.4% 285,055 69.6%
Undeclared 23,751 9,313 39.2% 14,438 60.8%
FIRST NATION ON RESERVE
FIRST NATION ON RESERVE 15,456 12,658 81.9% 2,798 18.1%
BILL PAYMENT RATING
Excel lent 439,339 136,054 31.0% 303,285 69.0%
Satis factory 22,395 9,869 44.1% 12,526 55.9%
Poor 23,077 13,063 56.6% 10,014 43.4%
DWELLING OWNERSHIP
Own 404,316 114,589 28.3% 289,727 71.7%
Rent / Other 80,495 44,398 55.2% 36,097 44.8%
2017 RESIDENTIAL SURVEY SECTION 10 ‐ HOUSEHOLD DEMOGRAPHICS ‐ REFERENCE TABLE 10.06
WINNIPEG LICO‐125 CLASSIFICATION
Centra Gas Manitoba Inc. 2019/20 General Rate Application Appendix 7.7
March 22, 2019 Page 181 of 228

174
10.07 Bill Payment Rating
TOTAL EXCELLENT % SATISFACTORY % POOR %
OVERALL 484,811 439,339 90.6% 22,395 4.6% 23,077 4.8%
FUEL AREA
Winnipeg Ci ty 261,760 242,708 92.7% 10,327 3.9% 8,725 3.3%
Gas Avai lable 140,021 129,289 92.3% 6,000 4.3% 4,731 3.4%
No Gas Avai lable 83,030 67,341 81.1% 6,068 7.3% 9,621 11.6%
DWELLING TYPE
Single Detached 373,568 338,926 90.7% 17,808 4.8% 16,834 4.5%
Multi Attached 46,834 42,306 90.3% 2,212 4.7% 2,317 4.9%
Apartment Sui te 64,409 58,107 90.2% 2,375 3.7% 3,927 6.1%
BUILDING CODE ERA
2010‐2017 37,645 33,864 90.0% 1,897 5.0% 1,885 5.0%
1990‐2009 89,181 79,485 89.1% 4,645 5.2% 5,051 5.7%
1970‐1989 161,749 148,787 92.0% 6,560 4.1% 6,402 4.0%
1950‐1969 110,314 101,074 91.6% 4,441 4.0% 4,800 4.4%
Pre 1950 85,922 76,130 88.6% 4,853 5.6% 4,939 5.7%
SPACE HEAT FUEL
Electric Heat 191,639 167,896 87.6% 10,533 5.5% 13,210 6.9%
Natural Gas Heat 249,938 234,030 93.6% 10,012 4.0% 5,896 2.4%
Other Fuel 6,945 5,408 77.9% 393 5.7% 1,143 16.5%
Shared (No Heat on Bi l l ) 36,289 32,004 88.2% 1,458 4.0% 2,828 7.8%
PEOPLE PER HOUSEHOLD
One 124,779 114,405 91.7% 5,898 4.7% 4,477 3.6%
Two 221,729 207,270 93.5% 7,883 3.6% 6,576 3.0%
Three 60,069 53,455 89.0% 2,855 4.8% 3,760 6.3%
Four 48,897 41,545 85.0% 3,461 7.1% 3,890 8.0%
Five + 29,337 22,664 77.3% 2,298 7.8% 4,374 14.9%
HOUSEHOLD INCOME
Less Than $25,000 59,481 47,223 79.4% 5,234 8.8% 7,024 11.8%
$25,000 ‐ $49,999 137,082 125,852 91.8% 4,396 3.2% 6,834 5.0%
$50,000 ‐ $74,999 123,824 114,347 92.3% 5,438 4.4% 4,039 3.3%
$75,000 ‐ $99,999 66,780 61,453 92.0% 2,670 4.0% 2,657 4.0%
$100,000 + 97,644 90,465 92.6% 4,657 4.8% 2,522 2.6%
WINNIPEG LICO‐125 CLASS
Yes 158,987 136,054 85.6% 9,869 6.2% 13,063 8.2%
No 325,824 303,285 93.1% 12,526 3.8% 10,014 3.1%
INDIGENOUS SELF‐DECLARED ANCESTRY
Yes 51,429 38,341 74.6% 4,713 9.2% 8,375 16.3%
No 409,630 379,314 92.6% 16,582 4.0% 13,735 3.4%
Undeclared 23,751 21,684 91.3% 1,101 4.6% 967 4.1%
FIRST NATION ON RESERVE
FIRST NATION ON RESERVE 15,456 6,659 43.1% 2,942 19.0% 5,855 37.9%
BILL PAYMENT RATING
Excel lent 439,339 439,339 100.0% 0 0.0% 0 0.0%
Sati s factory 22,395 0 0.0% 22,395 100.0% 0 0.0%
Poor 23,077 0 0.0% 0 0.0% 23,077 100.0%
DWELLING OWNERSHIP
Own 404,316 374,841 92.7% 16,363 4.0% 13,112 3.2%
Rent / Other 80,495 64,498 80.1% 6,032 7.5% 9,965 12.4%
2017 RESIDENTIAL SURVEY SECTION 10 ‐ HOUSEHOLD DEMOGRAPHICS ‐ REFERENCE TABLE 10.07
BILL PAYMENT RATING
Centra Gas Manitoba Inc. 2019/20 General Rate Application Appendix 7.7
March 22, 2019 Page 182 of 228
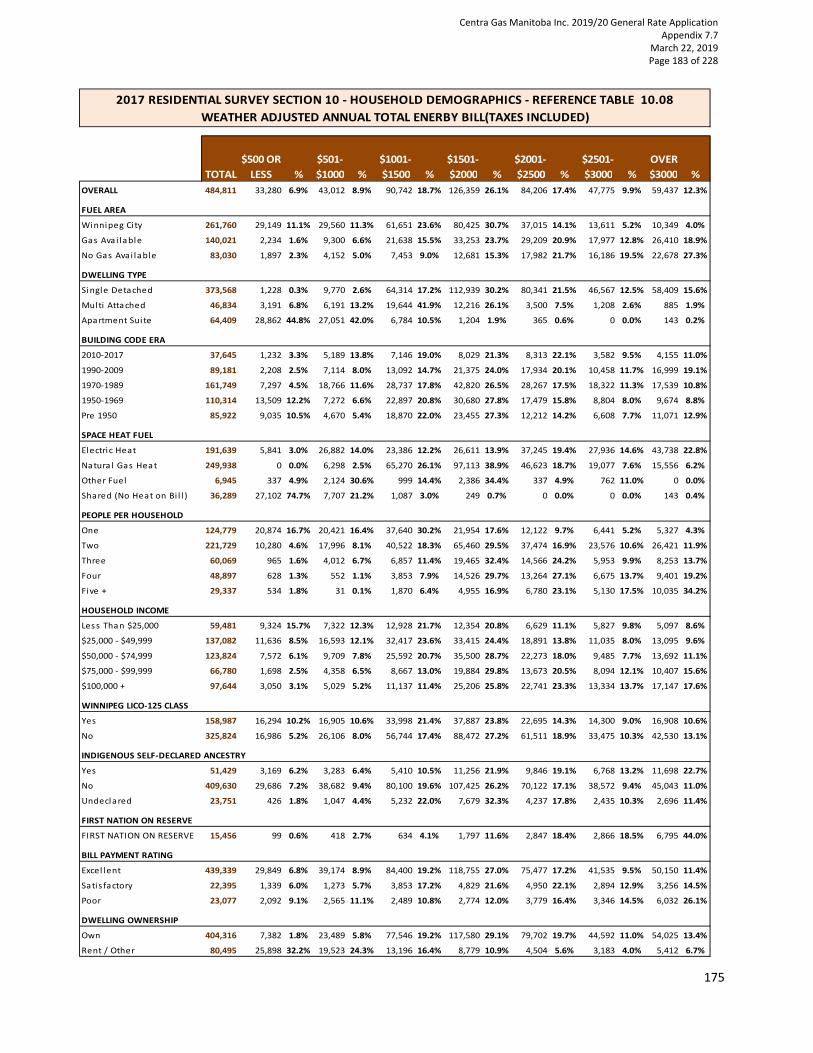
175
10.08 Weather Adjusted Annual Total Energy Bill (Taxes Included)
TOTAL
$500 OR
LESS %
$501‐
$1000 %
$1001‐
$1500 %
$1501‐
$2000 %
$2001‐
$2500 %
$2501‐
$3000 %
OVER
$3000 %
OVERALL 484,811 33,280 6.9% 43,012 8.9% 90,742 18.7% 126,359 26.1% 84,206 17.4% 47,775 9.9% 59,437 12.3%
FUEL AREA
Winnipeg City 261,760 29,149 11.1% 29,560 11.3% 61,651 23.6% 80,425 30.7% 37,015 14.1% 13,611 5.2% 10,349 4.0%
Gas Ava i lable 140,021 2,234 1.6% 9,300 6.6% 21,638 15.5% 33,253 23.7% 29,209 20.9% 17,977 12.8% 26,410 18.9%
No Gas Avai lable 83,030 1,897 2.3% 4,152 5.0% 7,453 9.0% 12,681 15.3% 17,982 21.7% 16,186 19.5% 22,678 27.3%
DWELLING TYPE
Single Detached 373,568 1,228 0.3% 9,770 2.6% 64,314 17.2% 112,939 30.2% 80,341 21.5% 46,567 12.5% 58,409 15.6%
Multi Attached 46,834 3,191 6.8% 6,191 13.2% 19,644 41.9% 12,216 26.1% 3,500 7.5% 1,208 2.6% 885 1.9%
Apartment Sui te 64,409 28,862 44.8% 27,051 42.0% 6,784 10.5% 1,204 1.9% 365 0.6% 0 0.0% 143 0.2%
BUILDING CODE ERA
2010‐2017 37,645 1,232 3.3% 5,189 13.8% 7,146 19.0% 8,029 21.3% 8,313 22.1% 3,582 9.5% 4,155 11.0%
1990‐2009 89,181 2,208 2.5% 7,114 8.0% 13,092 14.7% 21,375 24.0% 17,934 20.1% 10,458 11.7% 16,999 19.1%
1970‐1989 161,749 7,297 4.5% 18,766 11.6% 28,737 17.8% 42,820 26.5% 28,267 17.5% 18,322 11.3% 17,539 10.8%
1950‐1969 110,314 13,509 12.2% 7,272 6.6% 22,897 20.8% 30,680 27.8% 17,479 15.8% 8,804 8.0% 9,674 8.8%
Pre 1950 85,922 9,035 10.5% 4,670 5.4% 18,870 22.0% 23,455 27.3% 12,212 14.2% 6,608 7.7% 11,071 12.9%
SPACE HEAT FUEL
Electric Heat 191,639 5,841 3.0% 26,882 14.0% 23,386 12.2% 26,611 13.9% 37,245 19.4% 27,936 14.6% 43,738 22.8%
Natura l Gas Heat 249,938 0 0.0% 6,298 2.5% 65,270 26.1% 97,113 38.9% 46,623 18.7% 19,077 7.6% 15,556 6.2%
Other Fuel 6,945 337 4.9% 2,124 30.6% 999 14.4% 2,386 34.4% 337 4.9% 762 11.0% 0 0.0%
Shared (No Heat on Bi l l ) 36,289 27,102 74.7% 7,707 21.2% 1,087 3.0% 249 0.7% 0 0.0% 0 0.0% 143 0.4%
PEOPLE PER HOUSEHOLD
One 124,779 20,874 16.7% 20,421 16.4% 37,640 30.2% 21,954 17.6% 12,122 9.7% 6,441 5.2% 5,327 4.3%
Two 221,729 10,280 4.6% 17,996 8.1% 40,522 18.3% 65,460 29.5% 37,474 16.9% 23,576 10.6% 26,421 11.9%
Three 60,069 965 1.6% 4,012 6.7% 6,857 11.4% 19,465 32.4% 14,566 24.2% 5,953 9.9% 8,253 13.7%
Four 48,897 628 1.3% 552 1.1% 3,853 7.9% 14,526 29.7% 13,264 27.1% 6,675 13.7% 9,401 19.2%
Five + 29,337 534 1.8% 31 0.1% 1,870 6.4% 4,955 16.9% 6,780 23.1% 5,130 17.5% 10,035 34.2%
HOUSEHOLD INCOME
Less Than $25,000 59,481 9,324 15.7% 7,322 12.3% 12,928 21.7% 12,354 20.8% 6,629 11.1% 5,827 9.8% 5,097 8.6%
$25,000 ‐ $49,999 137,082 11,636 8.5% 16,593 12.1% 32,417 23.6% 33,415 24.4% 18,891 13.8% 11,035 8.0% 13,095 9.6%
$50,000 ‐ $74,999 123,824 7,572 6.1% 9,709 7.8% 25,592 20.7% 35,500 28.7% 22,273 18.0% 9,485 7.7% 13,692 11.1%
$75,000 ‐ $99,999 66,780 1,698 2.5% 4,358 6.5% 8,667 13.0% 19,884 29.8% 13,673 20.5% 8,094 12.1% 10,407 15.6%
$100,000 + 97,644 3,050 3.1% 5,029 5.2% 11,137 11.4% 25,206 25.8% 22,741 23.3% 13,334 13.7% 17,147 17.6%
WINNIPEG LICO‐125 CLASS
Yes 158,987 16,294 10.2% 16,905 10.6% 33,998 21.4% 37,887 23.8% 22,695 14.3% 14,300 9.0% 16,908 10.6%
No 325,824 16,986 5.2% 26,106 8.0% 56,744 17.4% 88,472 27.2% 61,511 18.9% 33,475 10.3% 42,530 13.1%
INDIGENOUS SELF‐DECLARED ANCESTRY
Yes 51,429 3,169 6.2% 3,283 6.4% 5,410 10.5% 11,256 21.9% 9,846 19.1% 6,768 13.2% 11,698 22.7%
No 409,630 29,686 7.2% 38,682 9.4% 80,100 19.6% 107,425 26.2% 70,122 17.1% 38,572 9.4% 45,043 11.0%
Undeclared 23,751 426 1.8% 1,047 4.4% 5,232 22.0% 7,679 32.3% 4,237 17.8% 2,435 10.3% 2,696 11.4%
FIRST NATION ON RESERVE
FIRST NATION ON RESERVE 15,456 99 0.6% 418 2.7% 634 4.1% 1,797 11.6% 2,847 18.4% 2,866 18.5% 6,795 44.0%
BILL PAYMENT RATING
Excel lent 439,339 29,849 6.8% 39,174 8.9% 84,400 19.2% 118,755 27.0% 75,477 17.2% 41,535 9.5% 50,150 11.4%
Satis factory 22,395 1,339 6.0% 1,273 5.7% 3,853 17.2% 4,829 21.6% 4,950 22.1% 2,894 12.9% 3,256 14.5%
Poor 23,077 2,092 9.1% 2,565 11.1% 2,489 10.8% 2,774 12.0% 3,779 16.4% 3,346 14.5% 6,032 26.1%
DWELLING OWNERSHIP
Own 404,316 7,382 1.8% 23,489 5.8% 77,546 19.2% 117,580 29.1% 79,702 19.7% 44,592 11.0% 54,025 13.4%
Rent / Other 80,495 25,898 32.2% 19,523 24.3% 13,196 16.4% 8,779 10.9% 4,504 5.6% 3,183 4.0% 5,412 6.7%
2017 RESIDENTIAL SURVEY SECTION 10 ‐ HOUSEHOLD DEMOGRAPHICS ‐ REFERENCE TABLE 10.08
WEATHER ADJUSTED ANNUAL TOTAL ENERBY BILL(TAXES INCLUDED)
Centra Gas Manitoba Inc. 2019/20 General Rate Application Appendix 7.7
March 22, 2019 Page 183 of 228

176
10.09 Energy Burden
TOTAL
2% OR
LESS % 2%‐4% % 4%‐6% % 6%‐8% % 8%‐10% %
OVER
10% %
OVERALL 484,811 155,103 32.0% 170,533 35.2% 78,659 16.2% 35,824 7.4% 16,698 3.4% 27,993 5.8%
FUEL AREA
Winnipeg City 261,760 118,050 45.1% 94,427 36.1% 31,847 12.2% 9,815 3.7% 3,671 1.4% 3,950 1.5%
Gas Avai lable 140,021 27,066 19.3% 54,972 39.3% 29,277 20.9% 14,132 10.1% 5,992 4.3% 8,583 6.1%
No Gas Avai lable 83,030 9,986 12.0% 21,134 25.5% 17,536 21.1% 11,877 14.3% 7,036 8.5% 15,461 18.6%
DWELLING TYPE
Single Detached 373,568 90,464 24.2% 141,765 37.9% 68,265 18.3% 31,486 8.4% 15,271 4.1% 26,316 7.0%
Multi Attached 46,834 16,184 34.6% 16,885 36.1% 7,220 15.4% 3,642 7.8% 1,428 3.0% 1,475 3.1%
Apartment Sui te 64,409 48,454 75.2% 11,883 18.4% 3,174 4.9% 696 1.1% 0 0.0% 202 0.3%
BUILDING CODE ERA
2010‐2017 37,645 16,226 43.1% 13,401 35.6% 3,678 9.8% 1,736 4.6% 643 1.7% 1,962 5.2%
1990‐2009 89,181 27,931 31.3% 31,362 35.2% 14,306 16.0% 6,760 7.6% 2,676 3.0% 6,146 6.9%
1970‐1989 161,749 47,100 29.1% 57,774 35.7% 29,385 18.2% 11,880 7.3% 6,619 4.1% 8,991 5.6%
1950‐1969 110,314 39,193 35.5% 38,169 34.6% 16,952 15.4% 8,008 7.3% 2,861 2.6% 5,132 4.7%
Pre 1950 85,922 24,653 28.7% 29,826 34.7% 14,339 16.7% 7,441 8.7% 3,900 4.5% 5,763 6.7%
SPACE HEAT FUEL
Electric Heat 191,639 39,108 20.4% 56,490 29.5% 40,150 21.0% 21,871 11.4% 10,650 5.6% 23,371 12.2%
Natura l Gas Heat 249,938 82,101 32.8% 108,407 43.4% 37,032 14.8% 12,883 5.2% 5,362 2.1% 4,154 1.7%
Other Fuel 6,945 1,071 15.4% 2,667 38.4% 980 14.1% 1,071 15.4% 687 9.9% 469 6.7%
Shared (No Heat on Bi l l ) 36,289 32,823 90.4% 2,969 8.2% 497 1.4% 0 0.0% 0 0.0% 0 0.0%
PEOPLE PER HOUSEHOLD
One 124,779 39,197 31.4% 36,056 28.9% 22,322 17.9% 12,302 9.9% 5,651 4.5% 9,251 7.4%
Two 221,729 63,583 28.7% 86,068 38.8% 38,580 17.4% 15,524 7.0% 7,630 3.4% 10,342 4.7%
Three 60,069 24,187 40.3% 20,615 34.3% 7,138 11.9% 3,984 6.6% 1,473 2.5% 2,672 4.4%
Four 48,897 21,150 43.3% 17,005 34.8% 6,130 12.5% 1,901 3.9% 1,147 2.3% 1,563 3.2%
Five + 29,337 6,985 23.8% 10,788 36.8% 4,488 15.3% 2,114 7.2% 797 2.7% 4,165 14.2%
HOUSEHOLD INCOME
Less Than $25,000 59,481 6,339 10.7% 6,983 11.7% 7,846 13.2% 12,001 20.2% 8,026 13.5% 18,287 30.7%
$25,000 ‐ $49,999 137,082 20,641 15.1% 37,371 27.3% 43,961 32.1% 19,064 13.9% 7,431 5.4% 8,616 6.3%
$50,000 ‐ $74,999 123,824 27,079 21.9% 69,663 56.3% 20,868 16.9% 4,098 3.3% 1,026 0.8% 1,091 0.9%
$75,000 ‐ $99,999 66,780 23,068 34.5% 37,731 56.5% 5,215 7.8% 550 0.8% 216 0.3% 0 0.0%
$100,000 + 97,644 77,976 79.9% 18,786 19.2% 771 0.8% 112 0.1% 0 0.0% 0 0.0%
WINNIPEG LICO‐125 CLASS
Yes 158,987 17,060 10.7% 29,668 18.7% 43,487 27.4% 28,267 17.8% 14,522 9.1% 25,984 16.3%
No 325,824 138,043 42.4% 140,866 43.2% 35,172 10.8% 7,558 2.3% 2,177 0.7% 2,010 0.6%
INDIGENOUS SELF‐DECLARED ANCESTRY
Yes 51,429 10,369 20.2% 14,380 28.0% 8,792 17.1% 5,254 10.2% 2,908 5.7% 9,726 18.9%
No 409,630 140,071 34.2% 147,549 36.0% 63,564 15.5% 28,600 7.0% 12,699 3.1% 17,147 4.2%
Undeclared 23,751 4,663 19.6% 8,605 36.2% 6,303 26.5% 1,971 8.3% 1,091 4.6% 1,120 4.7%
FIRST NATION ON RESERVE
FIRST NATION ON RESERVE 15,456 317 2.0% 1,536 9.9% 2,438 15.8% 2,101 13.6% 1,504 9.7% 7,560 48.9%
BILL PAYMENT RATING
Excel lent 439,339 142,628 32.5% 159,023 36.2% 72,241 16.4% 31,587 7.2% 14,015 3.2% 19,844 4.5%
Satis factory 22,395 6,129 27.4% 7,499 33.5% 3,205 14.3% 1,631 7.3% 1,184 5.3% 2,747 12.3%
Poor 23,077 6,346 27.5% 4,011 17.4% 3,213 13.9% 2,606 11.3% 1,499 6.5% 5,402 23.4%
DWELLING OWNERSHIP
Own 404,316 114,492 28.3% 154,100 38.1% 70,675 17.5% 30,794 7.6% 14,266 3.5% 19,988 4.9%
Rent / Other 80,495 40,611 50.5% 16,433 20.4% 7,984 9.9% 5,030 6.2% 2,432 3.0% 8,005 9.9%
2017 RESIDENTIAL SURVEY SECTION 10 ‐ HOUSEHOLD DEMOGRAPHICS ‐ REFERENCE TABLE 10.09
WEATHER ADJUSTED PERCENT ENERGY INCOME BURDEN
Centra Gas Manitoba Inc. 2019/20 General Rate Application Appendix 7.7
March 22, 2019 Page 184 of 228

177
10.10 Weather Adjusted Percent Energy Income Burden
TOTAL
AVERAGE TOTAL ENERGY
BILL
AVERAGE ENERGY
BURDEN
OVERALL 484,811 $1,931 3.83%
FUEL AREA
Winnipeg City 261,760 $1,568 2.71%
Gas Avai lable 140,021 $2,262 4.35%
No Gas Avai lable 83,030 $2,517 6.48%
DWELLING TYPE
Single Detached 373,568 $2,220 4.26%
Multi Attached 46,834 $1,421 3.42%
Apartment Suite 64,409 $628 1.63%
BUILDING CODE ERA
2010‐2017 37,645 $1,927 3.16%
1990‐2009 89,181 $2,178 4.05%
1970‐1989 161,749 $1,904 3.97%
1950‐1969 110,314 $1,786 3.54%
Pre 1950 85,922 $1,912 4.02%
SPACE HEAT FUEL
Electric Heat 191,639 $2,272 5.20%
Natura l Gas Heat 249,938 $1,896 3.14%
Other Fuel 6,945 $1,459 4.83%
Shared (No Heat on Bi l l ) 36,289 $458 1.16%
PEOPLE PER HOUSEHOLD
One 124,779 $1,396 4.17%
Two 221,729 $1,968 3.77%
Three 60,069 $2,130 3.39%
Four 48,897 $2,393 3.11%
Five + 29,337 $2,750 5.03%
HOUSEHOLD INCOME
Less Than $25,000 59,481 $1,639 8.26%
$25,000 ‐ $49,999 137,082 $1,759 4.90%
$50,000 ‐ $74,999 123,824 $1,898 3.14%
$75,000 ‐ $99,999 66,780 $2,123 2.48%
$100,000 + 97,644 $2,260 1.43%
WINNIPEG LICO‐125 CLASS
Yes 158,987 $1,790 6.44%
No 325,824 $1,999 2.56%
INDIGENOUS SELF‐DECLARED ANCESTRY
Yes 51,429 $2,276 6.01%
No 409,630 $1,878 3.54%
Undeclared 23,751 $2,095 4.24%
FIRST NATION ON RESERVE
FIRST NATION ON RESERVE 15,456 $2,855 10.84%
BILL PAYMENT RATING
Excel lent 439,339 $1,906 3.64%
Satis factory 22,395 $2,110 4.91%
Poor 23,077 $2,233 6.45%
DWELLING OWNERSHIP
Own 404,316 $2,082 3.84%
Rent / Other 80,495 $1,171 3.81%
2017 RESIDENTIAL SURVEY SECTION 10 ‐ HOUSEHOLD DEMOGRAPHICS ‐ REFERENCE TABLE 10.10
WEATHER ADJUSTED PERCENT ENERGY INCOME BURDEN
Centra Gas Manitoba Inc. 2019/20 General Rate Application Appendix 7.7
March 22, 2019 Page 185 of 228
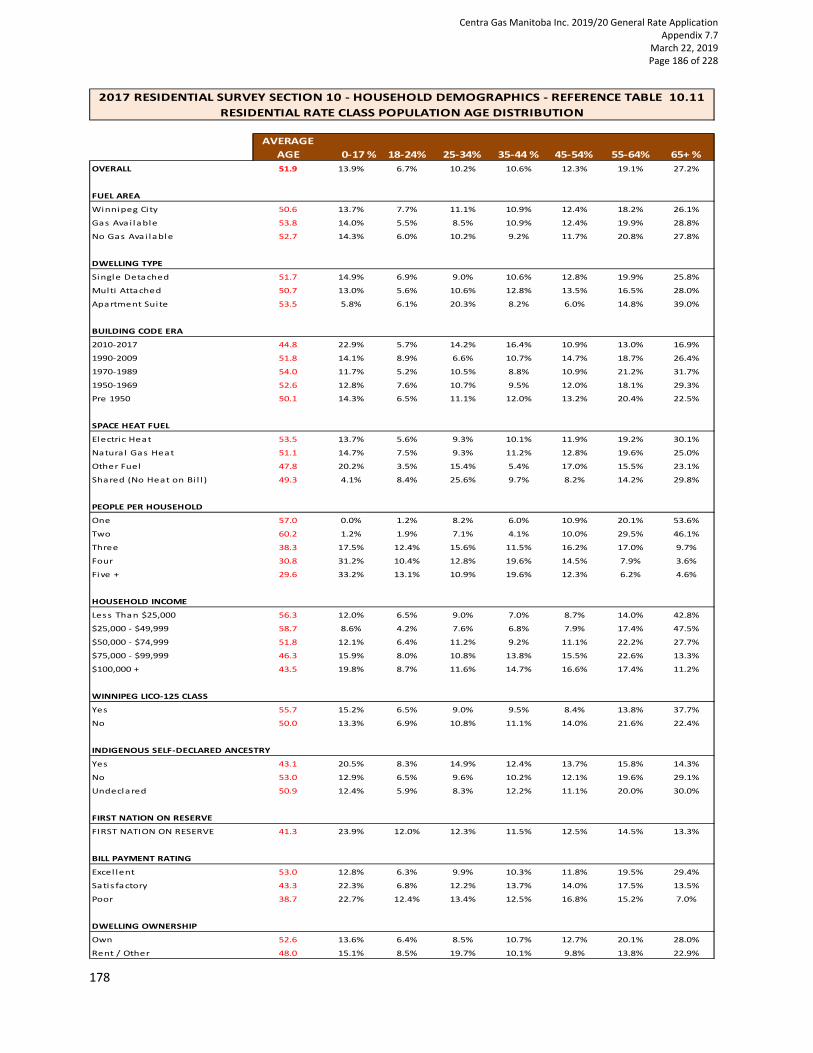
178
10.11 Residential Rate Class Population Age Distribution
AVERAGE
AGE 0‐17 % 18‐24% 25‐34% 35‐44 % 45‐54% 55‐64% 65+ %
OVERALL 51.9 13.9% 6.7% 10.2% 10.6% 12.3% 19.1% 27.2%
FUEL AREA
Winnipeg City 50.6 13.7% 7.7% 11.1% 10.9% 12.4% 18.2% 26.1%
Gas Avai lable 53.8 14.0% 5.5% 8.5% 10.9% 12.4% 19.9% 28.8%
No Gas Avai lable 52.7 14.3% 6.0% 10.2% 9.2% 11.7% 20.8% 27.8%
DWELLING TYPE
Single Detached 51.7 14.9% 6.9% 9.0% 10.6% 12.8% 19.9% 25.8%
Multi Attached 50.7 13.0% 5.6% 10.6% 12.8% 13.5% 16.5% 28.0%
Apartment Sui te 53.5 5.8% 6.1% 20.3% 8.2% 6.0% 14.8% 39.0%
BUILDING CODE ERA
2010‐2017 44.8 22.9% 5.7% 14.2% 16.4% 10.9% 13.0% 16.9%
1990‐2009 51.8 14.1% 8.9% 6.6% 10.7% 14.7% 18.7% 26.4%
1970‐1989 54.0 11.7% 5.2% 10.5% 8.8% 10.9% 21.2% 31.7%
1950‐1969 52.6 12.8% 7.6% 10.7% 9.5% 12.0% 18.1% 29.3%
Pre 1950 50.1 14.3% 6.5% 11.1% 12.0% 13.2% 20.4% 22.5%
SPACE HEAT FUEL
Electric Heat 53.5 13.7% 5.6% 9.3% 10.1% 11.9% 19.2% 30.1%
Natural Gas Heat 51.1 14.7% 7.5% 9.3% 11.2% 12.8% 19.6% 25.0%
Other Fuel 47.8 20.2% 3.5% 15.4% 5.4% 17.0% 15.5% 23.1%
Shared (No Heat on Bi l l ) 49.3 4.1% 8.4% 25.6% 9.7% 8.2% 14.2% 29.8%
PEOPLE PER HOUSEHOLD
One 57.0 0.0% 1.2% 8.2% 6.0% 10.9% 20.1% 53.6%
Two 60.2 1.2% 1.9% 7.1% 4.1% 10.0% 29.5% 46.1%
Three 38.3 17.5% 12.4% 15.6% 11.5% 16.2% 17.0% 9.7%
Four 30.8 31.2% 10.4% 12.8% 19.6% 14.5% 7.9% 3.6%
Five + 29.6 33.2% 13.1% 10.9% 19.6% 12.3% 6.2% 4.6%
HOUSEHOLD INCOME
Less Than $25,000 56.3 12.0% 6.5% 9.0% 7.0% 8.7% 14.0% 42.8%
$25,000 ‐ $49,999 58.7 8.6% 4.2% 7.6% 6.8% 7.9% 17.4% 47.5%
$50,000 ‐ $74,999 51.8 12.1% 6.4% 11.2% 9.2% 11.1% 22.2% 27.7%
$75,000 ‐ $99,999 46.3 15.9% 8.0% 10.8% 13.8% 15.5% 22.6% 13.3%
$100,000 + 43.5 19.8% 8.7% 11.6% 14.7% 16.6% 17.4% 11.2%
WINNIPEG LICO‐125 CLASS
Yes 55.7 15.2% 6.5% 9.0% 9.5% 8.4% 13.8% 37.7%
No 50.0 13.3% 6.9% 10.8% 11.1% 14.0% 21.6% 22.4%
INDIGENOUS SELF‐DECLARED ANCESTRY
Yes 43.1 20.5% 8.3% 14.9% 12.4% 13.7% 15.8% 14.3%
No 53.0 12.9% 6.5% 9.6% 10.2% 12.1% 19.6% 29.1%
Undeclared 50.9 12.4% 5.9% 8.3% 12.2% 11.1% 20.0% 30.0%
FIRST NATION ON RESERVE
FIRST NATION ON RESERVE 41.3 23.9% 12.0% 12.3% 11.5% 12.5% 14.5% 13.3%
BILL PAYMENT RATING
Excel lent 53.0 12.8% 6.3% 9.9% 10.3% 11.8% 19.5% 29.4%
Satis factory 43.3 22.3% 6.8% 12.2% 13.7% 14.0% 17.5% 13.5%
Poor 38.7 22.7% 12.4% 13.4% 12.5% 16.8% 15.2% 7.0%
DWELLING OWNERSHIP
Own 52.6 13.6% 6.4% 8.5% 10.7% 12.7% 20.1% 28.0%
Rent / Other 48.0 15.1% 8.5% 19.7% 10.1% 9.8% 13.8% 22.9%
2017 RESIDENTIAL SURVEY SECTION 10 ‐ HOUSEHOLD DEMOGRAPHICS ‐ REFERENCE TABLE 10.11
RESIDENTIAL RATE CLASS POPULATION AGE DISTRIBUTION
Centra Gas Manitoba Inc. 2019/20 General Rate Application Appendix 7.7
March 22, 2019 Page 186 of 228

179
SECTION 11 APPENDIX QUESTIONNARE BOOKLET
SECTION 11 APPENDIX
QUESTIONAIRE BOOKLET
Centra Gas Manitoba Inc. 2019/20 General Rate Application Appendix 7.7
March 22, 2019 Page 187 of 228

180
Centra Gas Manitoba Inc. 2019/20 General Rate Application Appendix 7.7
March 22, 2019 Page 188 of 228

Please mail this completed form in the postage paid self-addressed envelope provided or to:
RESIDENTIAL ENERGY USE SURVEY MARKET FORECAST DEPARTMENT
Manitoba Hydro7th Floor 360 Portage Avenue
Winnipeg, MB R3C 0G8
THANK YOU FOR YOUR TIME AND COOPERATION
*Manitoba Hydro is a licensee of the Trademark and Official Mark.
2017 Residential Energy Use Survey
Please answer the survey for the address shown BELOW. Return the completed questionnaire in the postage paid envelope provided.
Please answer the survey for the address shown on the FRONT COVER. Return the completed questionnaire in the postage paid envelope provided.
Dear Customer:Help us deliver the best service possible to you by completing the Manitoba Hydro 2017 Residential Energy Use Survey. By taking time to answer the following questions, you will help Manitoba Hydro assess the energy use characteristics of our residential customers. Your participation in this survey will enable us to better serve you and effectively plan for the future.All responses will be treated in the strictest confidence.
Available in accessible formats upon request.
Centra Gas Manitoba Inc. 2019/20 General Rate Application Appendix 7.7
March 22, 2019 Page 189 of 228

Your responses will only be used by Manitoba Hydro for its business purposes, such as the planning, development, implementation, administration, marketing, tracking, evaluation, and reporting, of its operations and programs. For inquiries concerning the collection of any personal information contained in this form or if you have any questions concerning this survey please contact:
204.360.3447(Weekdays 8:00 a.m. to 3:00 p.m.)
Outside Winnipeg, call collect.
Please return the completed questionnaire in the postage paid envelope provided, or mail to:
RESIDENTIAL ENERGY USE SURVEY MARKET FORECAST DEPARTMENTManitoba Hydro7th Floor 360 Portage AvenueWinnipeg, MB R3C 0G8
THANK YOU FOR YOUR TIME AND COOPERATION
THANK YOU FOR YOUR TIME AND COOPERATION
Centra Gas Manitoba Inc. 2019/20 General Rate Application Appendix 7.7
March 22, 2019 Page 190 of 228

What best describes this residence? 1 Single Family House (Detached) 6 Mobile Home/Trailer 2 Side by Side (Two Attached Units) 7 Rowhouse/Townhouse (Exterior Entrance)
3 Duplex (Upper Unit) 8 Apartment Suite or Condominium unit 4 Duplex (Lower Unit) 9 Cottage or Seasonal Residence 5 Triplex/Fourplex 10 Other: _________________
Do you OWN or RENT this residence? 1 Own/Buying 2 Rent/Lease 3 Band Housing 4 Other
How many STORIES is this residence (excluding basement area)? 1 1 storey 4 2 1/2 storey 7 Cab–Over 2 1 1/2 storey 5 Bi-level 8 Individual Suite/Condo Unit 3 2 storey 6 Split level 9 Other: __________
When was this residence originally BUILT?
1 2010–present 5 1970–1979 9 1930–1939 2 2000–2009 6 1960–1969 10 1920–1929 3 1990–1999 7 1950–1959 11 1919 or before 4 1980–1989 8 1940–1949 12 Do not know
What is the SIZE of this residence in square feet? (EXCLUDE BASEMENT AND GARAGE AREAS. ANSWER “5a”, IF POSSIBLE.)
a) Specify size if KNOWN: _____________ square feet. b) If UNKNOWN, choose the approximate size range in square feet.
1 Under 500 sq ft 6 1,301–1,500 sq ft 11 2,301–2,500 sq ft 2 501–700 sq ft 7 1,501–1,700 sq ft 12 2,501–2,700 sq ft 3 701–900 sq ft 8 1,701–1,900 sq ft 13 2,701–2,900 sq ft 4 901–1,100 sq ft 9 1,901–2,100 sq ft 14 2,901–3,100 sq ft 5 1,101–1,300 sq ft 10 2,101–2,300 sq ft 15 over 3,100 sq ft
Please answer all the questions by marking an “x” in the box(es) beside the appropriate answer OR print your answer in the space provided. If you are unsure of a particular answer, mark the “Do not know” box.
Section1 Your Residence
5
4
3
2
1
Centra Gas Manitoba Inc. 2019/20 General Rate Application Appendix 7.7
March 22, 2019 Page 191 of 228

How many of each type of WINDOWS are in this residence? (CHECK ONE FOR EACH WINDOW TYPE.)
None Less then 5 5 to 10 Over 10Single Pane 1 2 3 4
Dual Pane 1 2 3 4
Triple Pane 1 2 3 4
Storm Pane 1 2 3 4
Please indicate the level of insulation currently in your ATTIC:
1 No Attic 5 Fair (R-12 to R-19) 2 Excellent (R-50+) 6 Poor (R-0 to R-11) 3 Very Good (R-30 to R-49) 7 Do not know 4 Good (R-20 to R-29)
Please indicate the level of insulation currently in your EXTERIOR WALLS:
1 Excellent (R-25+) 4 Fair (R-8 to R-11) 2 Very Good (R-20 to R-24) 5 Poor (R-0 to R-7) 3 Good (R-12 to R-19) 6 Do not know
Please indicate which of the following best describes the BASEMENT (foundation) of this residence:
1 No Basement - Go to Question 10 5 Crawl Space 2 Slab on Grade 6 Partial and Crawlspace 3 Full Basement 7 Other: _________________ 4 Partial Basement 8 Do not know
a) What amount of this residence’s basement foundation walls are insulated? 1 No Insulation 4 Fully Insulated (90% or more) 2 Partially Insulated (up to 49%) 5 Do not know 3 Mostly Insulated (50% to 89%)
b) What type is the basement wall insulation? 1 No Insulation 5 Insulate Concrete Forms (ICF) 2 Fiberglass Batting 6 Other: _________________ 3 Rigid Foam Board 7 Do not know 4 Spray Foam
c) What amount of this residence’s basement area is finished? 1 Totally Unfinished (0%) 4 Fully Finished (90% or more) 2 Partially Finished (up to 49%) 5 Do not know 3 Mostly Finished (50% to 89%)
7
6
8
9
Centra Gas Manitoba Inc. 2019/20 General Rate Application Appendix 7.7
March 22, 2019 Page 192 of 228

Does this residence have any of the following problems?(CHECK ALL THAT APPLY.)
1 Lingering odours, cooking 1 Condensation in attic smells, stale air 1 Mold and mildew 1 High humidity in winter 1 Ice dams on roof 1 Low humidity in winter 1 Water leakage in basement 1 Window condensation 1 Other: _________________
In the last THREE YEARS, have any of the following upgrade projects been done at this residence? (CHECK ALL THAT APPLY.)
1 Replaced windows 1 Insulated basement or crawlspace 1 Insulated the exterior walls 1 Insulated the attic or ceiling 1 Caulked to reduce air leakage
What is the MAIN HEATING SYSTEM used to heat this residence? (CHECK ONLY ONE.)
1 Hi-efficiency Natural Gas (+ 90%) Central Forced Air Furnace (Available from 1984 – present) 2 Mid-efficiency Natural Gas (80–85%) Central Forced Air Furnace (Available from 1984 – 2009)
3 Standard-efficiency Natural Gas (65%) Central Forced Air Furnace (Last installed in 1992) 4 Natural Gas Boiler 10 Wood Stove/Furnace 5 Electric Baseboards 11 Propane Furnace 6 Electric Forced Air Furnace 12 Oil Furnace 7 Electric Boiler 13 Other: _________________ 8 Heat Pump - Geothermal 14 Do not know 9 Heat Pump - Air Source
What is the AGE of the main heating system?
1 0–3 years 4 10–12 years 7 21–25 years 2 4–6 years 5 13–15 years 8 Over 25 years 3 7–9 years 6 16–20 years 9 Do not know
10
11
1
2
Section2 Heating System
Centra Gas Manitoba Inc. 2019/20 General Rate Application Appendix 7.7
March 22, 2019 Page 193 of 228

Has this residence always been heated with the same space heating fuel? 1 Yes, always 2 No, previously heated with Natural Gas and now heating with Electricity 3 No, previously heated with Electricity and now heating with Natural Gas 4 No, previously heated with Propane or Wood or Coal or Oil and now heating with Electricity 5 Other: _________________ 6 Do not know
What other HEATING SYSTEMS are used to heat this residence? (CHECK ALL THAT APPLY.)
1 Electric Baseboards 1 Wood Stove 1 Electric Portable Heater 1 Wood Fireplace 1 Electric Fireplace 1 Other: _________________ 1 Natural Gas Fireplace 1 Do not know What type of THERMOSTAT controls the main heating system? 1 No Thermostat - Go to Question 10 5 Smart or Wi-fi Thermostat 2 Individual Unit or Room Control 6 Other: _________________ 3 Manual Central Control (dial or slider) 7 Do not know 4 Programmable Thermostat
How often do you TURN DOWN the temperature at night during the heating season? 1 Every Night 3 Occasionally 5 Temperature is programmed 2 Most Nights 4 Never 6 No Thermostat
If you have a programmable (7 day) thermostat, is it currently programmed and running on a setback schedule? 1 Do not have a programmable thermostat 2 Yes, it is programmed 3 No, it is not programmed
If you have a Smart or Wi-fi thermostat, do you use the remote features? 1 Do not have a SMART or WiFi thermostat 2 Yes, regularly control remotely 3 Yes, occasionally control remotely 4 No, do not control remotely
3
4
5
6
7
8
Centra Gas Manitoba Inc. 2019/20 General Rate Application Appendix 7.7
March 22, 2019 Page 194 of 228

Section3 Air Conditioning
Are there plans to install within the NEXT 12 MONTHS a Smart or Wi-fi thermostat at this residence? 1 Yes, definitely 3 No, already have one 2 Yes, maybe 3 No, not at all
Do you use a DEHUMIDIFIER? 1 Yes 2 No 3 Do not know
Do you use a HUMIDIFIER? 1 Yes 2 No 3 Do not know
Is there a HEAT RECOVERY VENTILATION SYSTEM (HRV) used to control the air quality at this residence? 1 No HRV System 3 Yes, but HRV is not operating 2 Yes, HRV is operating 4 Do not know
What type of AIR CONDITIONER is used to cool this residence? 1 No Air Conditioner _ Go to SECTION 4
2 Heat Pump 3 Window or Wall Air Conditioner 4 Central Air Conditioner
What is the age of the MAIN air conditioning system?
1 0–3 years 4 10–12 years 7 21–25 years 2 4–6 years 5 13–15 years 8 Over 25 years 3 7–9 years 6 16–20 years 9 Do not know
Is this the original air conditioning system installed at this residence or has it been replaced? 1 Yes, it is the original system 2 No, it has been replaced 3 Do not know
How often do you adjust the temperature at night during the cooling season? 1 Every night 3 Occasionally 5 Temperature is programmed 2 Most nights 4 Never 6 Do not know
10
9
1
2
3
4
11
12
Centra Gas Manitoba Inc. 2019/20 General Rate Application Appendix 7.7
March 22, 2019 Page 195 of 228

Is there a HOT WATER TANK used at this residence? 1 No Hot Water Tank _ Go to SECTION 5
2 Shared Central Supply (Serving two or more residences) _ Go to SECTION 5
3 Private Individual Hot Water Tank (Used solely by your household.)
4 Tankless Water Heater
What type of fuel is used to HEAT your WATER? 1 Electricity 4 Fuel Oil 7 Other: ______________ 2 Natural Gas 5 Wood 8 Do not know 3 Propane 6 Solar
What is the AGE of the water heater?
1 0–3 years 4 10–12 years 7 21–25 years 2 4–6 years 5 13–15 years 8 Over 25 years 3 7–9 years 6 16–20 years 9 Do not know
Has the water always been heated with the fuel indicated in Question 2? 1 Yes, always 2 No, previously heated with Natural Gas and now heating with Electricity 3 No, previously heated with Electricity and now heating with Natural Gas 4 No, previously heated with Propane and now heating with Electricity 5 No, other: _____________________________________________ 6 Do not know
On average, how many total showers are taken by your household per day? 1 None 4 Two 7 Five 2 Rarely shower 5 Three 8 Six or more 3 One 6 Four
Have any of the following been done to CONSERVE water and energy? (CHECK ALL THAT APPLY.)
1 Installed Energy Efficient Showerhead(s) (up to 1.6 gal/min) 1 Installed Energy Efficient Faucet Aerator(s) 1 Installed Water Heater Blanket/Insulation
1 Installed Energy Efficient Toilets (1.6 or less gal/flush)
1 Lowered Water Heater Temperature 1 Installed Pipe Wrap
5
1
6
2
3
4
Section4 Hot Water
Centra Gas Manitoba Inc. 2019/20 General Rate Application Appendix 7.7
March 22, 2019 Page 196 of 228
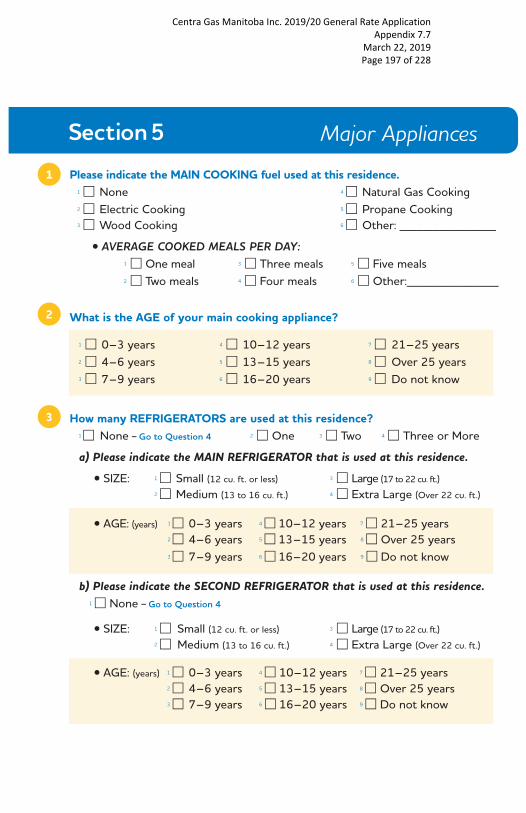
Section5 Major Appliances
Please indicate the MAIN COOKING fuel used at this residence. 1 None 4 Natural Gas Cooking 2 Electric Cooking 5 Propane Cooking 3 Wood Cooking 6 Other: _________________
• AVERAGE COOKED MEALS PER DAY: 1 One meal 3 Three meals 5 Five meals 2 Two meals 4 Four meals 6 Other:________________
What is the AGE of your main cooking appliance?
1 0–3 years 4 10–12 years 7 21–25 years 2 4–6 years 5 13–15 years 8 Over 25 years 3 7–9 years 6 16–20 years 9 Do not know
How many REFRIGERATORS are used at this residence? 1 None _ Go to Question 4 2 One 3 Two 4 Three or More
a) Please indicate the MAIN REFRIGERATOR that is used at this residence.
• SIZE: 1 Small (12 cu. ft. or less) 3 Large (17 to 22 cu. ft.) 2 Medium (13 to 16 cu. ft.) 4 Extra Large (Over 22 cu. ft.)
• AGE: (years) 1 0–3 years 4 10–12 years 7 21–25 years 2 4–6 years 5 13–15 years 8 Over 25 years 3 7–9 years 6 16–20 years 9 Do not know
b) Please indicate the SECOND REFRIGERATOR that is used at this residence. 1 None _ Go to Question 4
• SIZE: 1 Small (12 cu. ft. or less) 3 Large (17 to 22 cu. ft.) 2 Medium (13 to 16 cu. ft.) 4 Extra Large (Over 22 cu. ft.)
• AGE: (years) 1 0–3 years 4 10–12 years 7 21–25 years 2 4–6 years 5 13–15 years 8 Over 25 years 3 7–9 years 6 16–20 years 9 Do not know
1
2
3
Centra Gas Manitoba Inc. 2019/20 General Rate Application Appendix 7.7
March 22, 2019 Page 197 of 228

How many stand-alone FREEZERS are used at this residence?(DO NOT INCLUDE FREEZER COMPARTMENT OF YOUR REFRIGERATOR)
1 None _ Go to Question 5 2 One 3 Two 4 Three or More
a) Please indicate the MAIN stand-alone FREEZER that is used at this residence.
• SIZE: 1 Small (12 cu. ft. or less) 3 Large (17 to 22 cu. ft.) 2 Medium (13 to 16 cu. ft.) 4 Extra Large (Over 22 cu. ft.)
• AGE: (years) 1 0–3 years 4 10–12 years 7 21–25 years 2 4–6 years 5 13–15 years 8 Over 25 years 3 7–9 years 6 16–20 years 9 Do not know
b) Please indicate the SECOND stand-alone FREEZER that is used at this residence. 1 None _ Go to Question 5
• SIZE: 1 Small (12 cu. ft. or less) 3 Large (17 to 22 cu. ft.) 2 Medium (13 to 16 cu. ft.) 4 Extra Large (Over 22 cu. ft.)
• AGE: (years) 1 0–3 years 4 10–12 years 7 21–25 years 2 4–6 years 5 13–15 years 8 Over 25 years 3 7–9 years 6 16–20 years 9 Do not know
Is there an automatic DISHWASHER used at this residence? 1 No Automatic Dishwasher _ Go to Question 6 2 Yes
• AVERAGE LOADS PER WEEK: 1 1–3 loads 3 7–9 loads 5 Other:________________ 2 4–6 loads 4 Over 9 loads
• AGE: (years) 1 0–3 years 4 10–12 years 7 21–25 years 2 4–6 years 5 13–15 years 8 Over 25 years 3 7–9 years 6 16–20 years 9 Do not know
4
5
Centra Gas Manitoba Inc. 2019/20 General Rate Application Appendix 7.7
March 22, 2019 Page 198 of 228

Is there a CLOTHES WASHER used at this residence? 1 Do not have a Clothes Washer _ Go to Question 7
2 Use laundry facility outside the residence (e.g., apartment block laundry room or laundromat) _ Go to Question 7
3 Top Load Automatic Clothes Washer with agitator 4 Front Load or Top Load Automatic Clothes Washer without agitator 5 Other
• AVERAGE LOADS PER WEEK: 1 1–3 loads 3 7–9 loads 5 Other:________________ 2 4–6 loads 4 Over 9 loads
• AGE: (years) 1 0–3 years 4 10–12 years 7 21–25 years 2 4–6 years 5 13–15 years 8 Over 25 years 3 7–9 years 6 16–20 years 9 Do not know
Is there a CLOTHES DRYER used at this residence? 1 No Clothes Dryer _ Go to SECTION 6 2 Use laundry facility outside the residence (e.g., apartment block laundry room or laundromat) _ Go to SECTION 6
3 AUTOMATIC CLOTHES DRYER • DRYER FUEL: 1 Electricity 3 Propane 2 Natural Gas 4 Other: __________________
• AVERAGE LOADS PER WEEK: 1 1–3 loads 3 7–9 loads 5 Other:________________ 2 4–6 loads 4 Over 9 loads
• AGE: (years) 1 0–3 years 4 10–12 years 7 21–25 years 2 4–6 years 5 13–15 years 8 Over 25 years 3 7–9 years 6 16–20 years 9 Do not know
6
7
Centra Gas Manitoba Inc. 2019/20 General Rate Application Appendix 7.7
March 22, 2019 Page 199 of 228

What type and number of the following electronics are in USE at this residence? (CHECK ONE FOR EACH ELECTRONIC TYPE)
None One Two Three Four Five+Television 1 2 3 4 5 6 Set Top Box 1 2 3 4 5 6 DVD/Blu-ray 1 2 3 4 5 6 Gaming Console 1 2 3 4 5 6 Desktop Computer 1 2 3 4 5 6 Laptop Computer 1 2 3 4 5 6 Tablet 1 2 3 4 5 6 Cell Phone Charger 1 2 3 4 5 6
Do you have INTERNET ACCESS at this residence? 1 No 2 Yes, through home internet only 3 Yes, through mobile device only 4 Yes, through both home internet and mobile device
What telephone service is there at this residence? 1 No telephone service 2 Landline ONLY 3 Cell phone ONLY 4 BOTH Landline and cell phone
Approximately how many of each type of light bulbs do you have installed at this residence? (INCLUDING EXTERIOR LIGHTS BUT EXCLUDING SEASONAL OR HOLIDAY LIGHTS – CHECK ONE FOR EACH LIGHTING TYPE)
None 1-5 6-10 10-20 20-30 30+Incandescent 1 2 3 4 5 6 Halogen 1 2 3 4 5 6 Compact Fluorescent (CFL) 1 2 3 4 5 6 Light Emitting Diode (LED) 1 2 3 4 5 6 Tube Fluorescent 1 2 3 4 5 6
1
2
3
4
Section6 Electronics & Lighting
Centra Gas Manitoba Inc. 2019/20 General Rate Application Appendix 7.7
March 22, 2019 Page 200 of 228

5
6
Manitoba Hydro has offered a total of five Spring and Fall instant rebate promotions on LED bulbs at participating retailers since 2014.
a) Approximately how many LED bulbs in total did you purchase through all of the Manitoba Hydro’s instant rebate promotions? 1 None 4 6 to 10 7 20 to 30 2 1 to 5 5 10 to 20 5 30+
b) Approximately how many LED bulbs did you purchase while the Manitoba Hydro’s instant rebate promotions were NOT on? 1 None 4 6 to 10 7 20 to 30 2 1 to 5 5 10 to 20 5 30+
c) Did the Manitoba Hydro’s instant rebate promotions influence your decision to purchase LED bulbs? 1 I did not buy any LED bulbs 3 Somewhat influenced 2 Did not influence 4 Strongly influenced
d) If Manitoba Hydro did not offer the instant rebate promotion, would you have purchased the same number of LED bulbs? 1 Would not have purchased without the program 2 Would have purchased less without the program 3 Would have purchased the same amount 4 Have not purchased or installed any LED bulbs
Are there any strings of OUTDOOR SEASONAL or HOLIDAY lights in use at this residence? 1 No 3 Yes, Incandescent lights 2 Yes, LED lights 4 Yes, both LED and Incandescent lights
Centra Gas Manitoba Inc. 2019/20 General Rate Application Appendix 7.7
March 22, 2019 Page 201 of 228

Does this residence have a SWIMMING POOL? 1 No 3 Yes, outdoor above ground 2 Yes, indoor 4 Yes, outdoor below ground
a) POOL HEATING FUEL: 1 Not Heated 4 Ground Source 6 Propane Heater 2 Electric Heater Heat Pump 7 Solar Blanket 3 Air Source Heat Pump 5 Natural Gas Heater 8 Do not know
How many VEHICLES are usually plugged in by your household during the winter months? (NOVEMBER – MARCH)
1 None _ Go to SECTION 8 3 Two 5 Four or More 2 One 4 Three For your most COMMONLY used vehicle, please indicate your normal routine during the winter months. (NOVEMBER – MARCH)
a) PARKED IN: 1 Detached Garage 3 Carport/Shelter 5 Outside 2 Attached Garage 4 Underground Parkade
b) CAR TIMER FOR BLOCKHEATER: 1 Yes 2 No
c) INTERIOR CAR WARMER: 1 Yes 2 No
Please check all the Power Smart programs you have PARTICIPATED in while at your PRESENT RESIDENCE? (CHECK AS MANY AS APPLY.)
1 Affordable Energy Program 1 Appliance Rebate Program 1 Earth Power (Geothermal) Loan
1 Home Insulation Program 1 LED Light Bulb In-store Rebate Promotions 1 LED Light fixture or Lighting Controls In-store Rebate Promotions
1 Plug-in timers, power bars, or showerheads In-store Rebate Promotions
1 Weatherstripping or Window kits In-store Rebate Promotions 1 New Home Program 1 PAY AS YOU SAVE (PAYS) financing 1 Refrigerator Retirement Program 1 Residential Loan 1 Smart Thermostat Rebate Program 1 Water and Energy Saver Program (Free kit provided) 1 Solar Energy Program
2
1
1
3
Section7 Pools & Vehicles
Section8 PowerSmart Programs
Centra Gas Manitoba Inc. 2019/20 General Rate Application Appendix 7.7
March 22, 2019 Page 202 of 228

How influential were Manitoba Hydro’s Power Smart programs, rebates, and information material in your decision to do the following: (CHECK ONE BOX FOR EACH ITEM.)
Did Not Install/Buy
Did Not Influence
Somewhat Influenced
Strongly Influenced
Upgrade Home Insulation 1 2 3 4 Install New Heating System 1 2 3 4 Buy New Refrigerator 1 2 3 4 Buy New Freezer 1 2 3 4 Buy New Clothes Washer 1 2 3 4 Buy Smart WiFi Thermostat 1 2 3 4
What best describes what has been done in your current home to reduce energy use? 1 All that can be done 4 Not much has been done 2 Most of what can be done 5 Nothing has been done 3 About half of what can be done 6 Do not know
Please indicate how you or anyone in your household USUALLY pays the Manitoba Hydro bill? (CHECK ONLY ONE.)
1 In-Person - at a Manitoba Hydro office 6 By Telephone 2 In-Person - at a designated agency 7 Third Party Pays For Bill 3 By Mail (i.e. Band Council or Social Services) 4 On-Line 8 Other:________________ 5 Pre-Authorized Payment Plan 9 Do not know How often do you check your energy bill? 1 Every month 3 1 to 4 times a year 5 Do not know 2 Every 2 months 4 Never check my bill
Are you aware of Manitoba Hydro's MYBILL method of receiving bills by email? 1 Yes 2 No
Would you be interested in receiving your Manitoba Hydro bill by email? 1 Yes 3 Not sure 5 Have no internet access 2 No 4 Already receive monthly Hydro bill by email
In the last year, how many times did you access the Manitoba Hydro website? 1 Zero 2 1 to 5 3 6 to 10 4 Over 10
2
3
1
2
5
3
4
Section9 Bills & Rates
Centra Gas Manitoba Inc. 2019/20 General Rate Application Appendix 7.7
March 22, 2019 Page 203 of 228
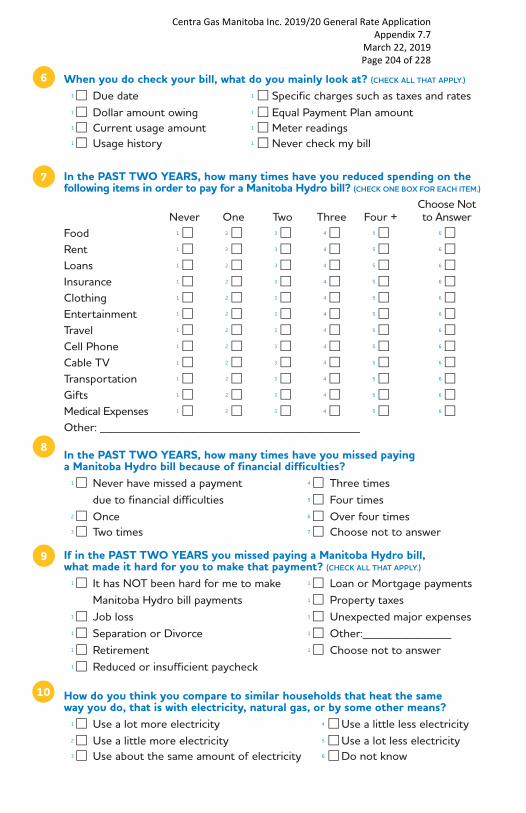
When you do check your bill, what do you mainly look at? (CHECK ALL THAT APPLY.)
1 Due date 1 Specific charges such as taxes and rates 1 Dollar amount owing 1 Equal Payment Plan amount 1 Current usage amount 1 Meter readings 1 Usage history 1 Never check my bill
In the PAST TWO YEARS, how many times have you reduced spending on the following items in order to pay for a Manitoba Hydro bill? (CHECK ONE BOX FOR EACH ITEM.)
Never One Two Three Four +Choose Not to Answer
Food 1 2 3 4 5 6 Rent 1 2 3 4 5 6 Loans 1 2 3 4 5 6 Insurance 1 2 3 4 5 6 Clothing 1 2 3 4 5 6 Entertainment 1 2 3 4 5 6 Travel 1 2 3 4 5 6 Cell Phone 1 2 3 4 5 6 Cable TV 1 2 3 4 5 6 Transportation 1 2 3 4 5 6 Gifts 1 2 3 4 5 6 Medical Expenses 1 2 3 4 5 6 Other: _______________________________________________
In the PAST TWO YEARS, how many times have you missed paying a Manitoba Hydro bill because of financial difficulties? 1 Never have missed a payment 4 Three times due to financial difficulties 5 Four times 2 Once 6 Over four times 3 Two times 7 Choose not to answer
If in the PAST TWO YEARS you missed paying a Manitoba Hydro bill, what made it hard for you to make that payment? (CHECK ALL THAT APPLY.)
1 It has NOT been hard for me to make 1 Loan or Mortgage payments Manitoba Hydro bill payments 1 Property taxes 1 Job loss 1 Unexpected major expenses 1 Separation or Divorce 1 Other:________________ 1 Retirement 1 Choose not to answer 1 Reduced or insufficient paycheck
How do you think you compare to similar households that heat the same way you do, that is with electricity, natural gas, or by some other means? 1 Use a lot more electricity 4 Use a little less electricity 2 Use a little more electricity 5 Use a lot less electricity 3 Use about the same amount of electricity 6 Do not know
10
6
7
8
9
Centra Gas Manitoba Inc. 2019/20 General Rate Application Appendix 7.7
March 22, 2019 Page 204 of 228

11
12
13
2
1
How do Manitoba Hydro’s residential electric rates compare to what other utilities charge in other provinces or states? 1 Rates are a lot higher 4 Rates are a little lower 2 Rates are a little higher 5 Rates are a lot lower 3 Rates are about the same 6 Do not know
The electric portion of your energy bill is determined by the amount of electricity you use which is measured in kilo-watt hours and the rate charged for each kilo-watt hour. What do you think Manitoba Hydro's residential electric rate per kilo-watt hour is? 1 It is the same regardless of the amount of electricity used each month 2 Rises to a higher price for any electricity used beyond a specific amount for that month 3 Drops to a lower price for any electricity used beyond a specific amount for that month 4 Do not know
Increasing rates after a certain level of usage is reached may encourage people to lower their energy use. What do you think of this idea? 1 I agree it would lower energy use and I support this idea 2 I agree it would lower energy use but I do not support this idea 3 I disagree it would lower energy use but I support this idea 4 I disagree it would lower energy use and I do not support this idea 5 Do not know
The following questions are very important in explaining energy usage. Please try to answer these questions. If you are uncomfortable in answering any of them, just mark the ‘Choose not to answer’ box.
Including yourself, how many persons usually live in your residence? 1 One (myself) 3 Three 5 Five 7 Seven or more 2 Two 4 Four 6 Six 8 Choose not to answer Please indicate what age group of people are usually living in your residence, (CHECK AS MANY AS APPLY.)
1 Under 18 years 1 35-44 years 1 65-74 years 1 18-24 years 1 45-54 years 1 75 and older 1 25-34 years 1 55-64 years 1 Choose not to answer
Section10 Household Demographics
Centra Gas Manitoba Inc. 2019/20 General Rate Application Appendix 7.7
March 22, 2019 Page 205 of 228

Do you identify yourself as an Indigenous person, that is a person of First Nations, Metis, or Inuit ancestry? 1 No 2 Yes, First Nations with Secure Certificate of Indian Status (SCIS) 3 Yes, First Nations with no Secure Certificate of Indian Status (SCIS)
4 Yes, Metis with Metis Citizenship Card 5 Yes, Metis with no Metis Citizenship Card 6 Yes, Inuit with Secure Certificate of Indian Status (SCIS) 7 Yes, Inuit with no Secure Certificate of Indian Status (SCIS) 8 Choose not to answer
What language other than English is spoken in your household? 1 English only 8 Michif 16 Polish 2 French 9 Oji-Cree 17 Russian 3 Anishinaabe 10 German 18 Portugese (Ojibway/Saulteaux) 11 Tagalog (Filipino) 19 Italian 4 Cree (Ininew) 12 Ukranian 20 Arabic 5 Dakota 13 Punjabi 21 Greek 6 Déné (Sayisi) 14 Spanish 22 Other:________________ 7 Inuktitut 15 Mandarin 23 Choose not to answer What is your approximate TOTAL ANNUAL HOUSEHOLD INCOME? (ALL SOURCES BEFORE TAXES)
1 Under $20,000 7 $50,000-$54,999 13 $80,000-$89,999 2 $20,000-$24,999 8 $55,000-$59,999 14 $90,000-$99,999
3 $25,000-$29,999 9 $60,000-$64,999 15 $100,000-$124,999 4 $30,000-$34,999 10 $65,000-$69,999 16 $125,000-$149,999
5 $35,000-$39,999 11 $70,000-$74,999 17 $150,000 or over 6 $40,000-$49,999 12 $75,000-$79,999 18 Choose not to answer
Please indicate the HIGHEST EDUCATION LEVEL attained by the head of household? 1 No certificate, diploma or degree 2 High school certificate or equivalent 3 Apprenticeship or trades certificate or diploma
4 College, CEGEP or other non-university certificate or diploma 5 University certificate or diploma below bachelor level 6 Bachelor's degree 7 Degree in medicine, dentistry, veterinary medicine or optometry 8 Master's degree 9 Earned doctorate 10 Other 11 Choose not to answer
4
5
6
3
Centra Gas Manitoba Inc. 2019/20 General Rate Application Appendix 7.7
March 22, 2019 Page 206 of 228
Your responses will only be used by Manitoba Hydro for its business purposes, such as the planning, development, implementation, administration, marketing, tracking, evaluation, and reporting, of its operations and programs. For inquiries concerning the collection of any personal informationcontained in this form or if you have any questions concerning this survey please contact:
204.360.3447(Weekdays 8:00 a.m. to 3:00 p.m.)
Outside Winnipeg, call collect.
Please return the completed questionnaire in the postage paid envelope provided, or mail to:
RESIDENTIAL ENERGY USE SURVEY MARKET FORECAST DEPARTMENTManitoba Hydro7th Floor 360 Portage AvenueWinnipeg, MB R3C 0G8
THANK YOU FOR YOUR TIME AND COOPERATION
THANK YOU FOR YOUR TIME AND COOPERATION
Centra Gas Manitoba Inc. 2019/20 General Rate Application Appendix 7.7
March 22, 2019 Page 207 of 228

Please mail this completed form in the postage paid self-addressed envelope provided or to:
RESIDENTIAL ENERGY USE SURVEY MARKET FORECAST DEPARTMENT
Manitoba Hydro7th Floor 360 Portage Avenue
Winnipeg, MB R3C 0G8
THANK YOU FOR YOUR TIME AND COOPERATION
*Manitoba Hydro is a licensee of the Trademark and Official Mark.
2017 Residential Energy Use Survey
Please answer the survey for the address shown BELOW. Return the completed questionnaire in the postage paid envelope provided.
Please answer the survey for the address shown on the FRONT COVER. Return the completed questionnaire in the postage paid envelope provided.
Dear Customer:Help us deliver the best service possible to you by completing the Manitoba Hydro 2017 Residential Energy Use Survey. By taking time to answer the following questions, you will help Manitoba Hydro assess the energy use characteristics of our residential customers. Your participation in this survey will enable us to better serve you and effectively plan for the future.All responses will be treated in the strictest confidence.
Available in accessible formats upon request.
Centra Gas Manitoba Inc. 2019/20 General Rate Application Appendix 7.7
March 22, 2019 Page 208 of 228

Please mail this completed form in the postage paid self-addressed envelope provided or to:
RESIDENTIAL ENERGY USE SURVEY MARKET FORECAST DEPARTMENT
Manitoba Hydro7th Floor 360 Portage Avenue
Winnipeg, MB R3C 0G8
THANK YOU FOR YOUR TIME AND COOPERATION
*Manitoba Hydro is a licensee of the Trademark and Official Mark.
2017 Residential Energy Use Survey
Please answer the survey for the address shown BELOW. Return the completed questionnaire in the postage paid envelope provided.
Please answer the survey for the address shown on the FRONT COVER. Return the completed questionnaire in the postage paid envelope provided.
Dear Customer:Help us deliver the best service possible to you by completing the 2017 Manitoba Hydro Energy Use Survey. By taking time to answer the following questions, you will help Manitoba Hydro assess the energy use characteristics of our residential customers. Your participation in this survey will enable us to better serve you and effectively plan for the future.All responses will be treated in the strictest confidence.
KinanaskomitinMiigwech KinanakominWopidaMashi’cho
Available in accessible formats upon request.
Centra Gas Manitoba Inc. 2019/20 General Rate Application Appendix 7.7
March 22, 2019 Page 209 of 228

Your responses will only be used by Manitoba Hydro for its business purposes, such as the planning, development, implementation, administration, marketing, tracking, evaluation, and reporting, of its operations and programs. For inquiries concerning the collection of any personal information contained in this form or if you have any questions concerning this survey please contact:
204.360.3447(Weekdays 8:00 a.m. to 3:00 p.m.)
Outside Winnipeg, call collect.
Please return the completed questionnaire in the postage paid envelope provided, or mail to:
RESIDENTIAL ENERGY USE SURVEY MARKET FORECAST DEPARTMENTManitoba Hydro7th Floor 360 Portage AvenueWinnipeg, MB R3C 0G8
THANK YOU FOR YOUR TIME AND COOPERATION
THANK YOU FOR YOUR TIME AND COOPERATION
Centra Gas Manitoba Inc. 2019/20 General Rate Application Appendix 7.7
March 22, 2019 Page 210 of 228

What best describes this residence? 1 Single Family House (Detached) 6 Mobile Home/Trailer 2 Side by Side (Two Attached Units) 7 Rowhouse/Townhouse (Exterior Entrance)
3 Duplex (Upper Unit) 8 Apartment Suite or Condominium unit 4 Duplex (Lower Unit) 9 Cottage or Seasonal Residence 5 Triplex/Fourplex 10 Other: _________________
Do you OWN or RENT this residence? 1 Own/Buying 2 Rent/Lease 3 Band Housing 4 Other
How many STORIES is this residence (excluding basement area)? 1 1 storey 4 2 1/2 storey 7 Cab–Over 2 1 1/2 storey 5 Bi-level 8 Individual Suite/Condo Unit 3 2 storey 6 Split level 9 Other: __________
When was this residence originally BUILT?
1 2010–present 5 1970–1979 9 1930–1939 2 2000–2009 6 1960–1969 10 1920–1929 3 1990–1999 7 1950–1959 11 1919 or before 4 1980–1989 8 1940–1949 12 Do not know
What is the SIZE of this residence in square feet? (EXCLUDE BASEMENT AND GARAGE AREAS. ANSWER “5a”, IF POSSIBLE.)
a) Specify size if KNOWN: _____________ square feet. b) If UNKNOWN, choose the approximate size range in square feet.
1 Under 500 sq ft 6 1,301–1,500 sq ft 11 2,301–2,500 sq ft 2 501–700 sq ft 7 1,501–1,700 sq ft 12 2,501–2,700 sq ft 3 701–900 sq ft 8 1,701–1,900 sq ft 13 2,701–2,900 sq ft 4 901–1,100 sq ft 9 1,901–2,100 sq ft 14 2,901–3,100 sq ft 5 1,101–1,300 sq ft 10 2,101–2,300 sq ft 15 over 3,100 sq ft
Please answer all the questions by marking an “x” in the box(es) beside the appropriate answer OR print your answer in the space provided. If you are unsure of a particular answer, mark the “Do not know” box.
Section1 Your Residence
5
4
3
2
1
Centra Gas Manitoba Inc. 2019/20 General Rate Application Appendix 7.7
March 22, 2019 Page 211 of 228

How many of each type of WINDOWS are in this residence? (CHECK ONE FOR EACH WINDOW TYPE.)
None Less then 5 5 to 10 Over 10Single Pane 1 2 3 4
Dual Pane 1 2 3 4
Triple Pane 1 2 3 4
Storm Pane 1 2 3 4
Please indicate the level of insulation currently in your ATTIC:
1 No Attic 5 Fair (R-12 to R-19) 2 Excellent (R-50+) 6 Poor (R-0 to R-11) 3 Very Good (R-30 to R-49) 7 Do not know 4 Good (R-20 to R-29)
Please indicate the level of insulation currently in your EXTERIOR WALLS:
1 Excellent (R-25+) 4 Fair (R-8 to R-11) 2 Very Good (R-20 to R-24) 5 Poor (R-0 to R-7) 3 Good (R-12 to R-19) 6 Do not know
Please indicate which of the following best describes the BASEMENT (foundation) of this residence:
1 No Basement - Go to Question 10 5 Crawl Space 2 Slab on Grade 6 Partial and Crawlspace 3 Full Basement 7 Other: _________________ 4 Partial Basement 8 Do not know
a) What amount of this residence’s basement foundation walls are insulated? 1 No Insulation 4 Fully Insulated (90% or more) 2 Partially Insulated (up to 49%) 5 Do not know 3 Mostly Insulated (50% to 89%)
b) What type is the basement wall insulation? 1 No Insulation 5 Insulate Concrete Forms (ICF) 2 Fiberglass Batting 6 Other: _________________ 3 Rigid Foam Board 7 Do not know 4 Spray Foam
c) What amount of this residence’s basement area is finished? 1 Totally Unfinished (0%) 4 Fully Finished (90% or more) 2 Partially Finished (up to 49%) 5 Do not know 3 Mostly Finished (50% to 89%)
7
6
8
9
Centra Gas Manitoba Inc. 2019/20 General Rate Application Appendix 7.7
March 22, 2019 Page 212 of 228
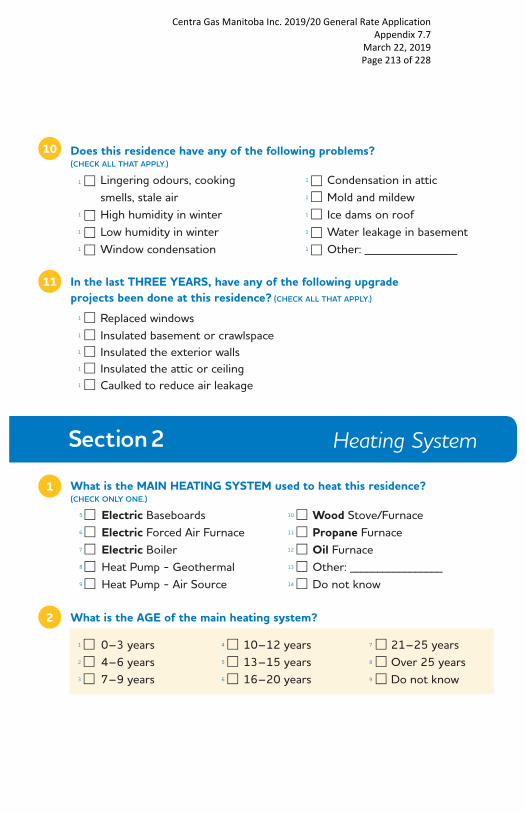
Does this residence have any of the following problems?(CHECK ALL THAT APPLY.)
1 Lingering odours, cooking 1 Condensation in attic smells, stale air 1 Mold and mildew 1 High humidity in winter 1 Ice dams on roof 1 Low humidity in winter 1 Water leakage in basement 1 Window condensation 1 Other: _________________
In the last THREE YEARS, have any of the following upgrade projects been done at this residence? (CHECK ALL THAT APPLY.)
1 Replaced windows 1 Insulated basement or crawlspace 1 Insulated the exterior walls 1 Insulated the attic or ceiling 1 Caulked to reduce air leakage
What is the MAIN HEATING SYSTEM used to heat this residence? (CHECK ONLY ONE.) 5 Electric Baseboards 10 Wood Stove/Furnace 6 Electric Forced Air Furnace 11 Propane Furnace 7 Electric Boiler 12 Oil Furnace 8 Heat Pump - Geothermal 13 Other: _________________ 9 Heat Pump - Air Source 14 Do not know
What is the AGE of the main heating system?
1 0–3 years 4 10–12 years 7 21–25 years 2 4–6 years 5 13–15 years 8 Over 25 years 3 7–9 years 6 16–20 years 9 Do not know
10
11
1
2
Section2 Heating System
Centra Gas Manitoba Inc. 2019/20 General Rate Application Appendix 7.7
March 22, 2019 Page 213 of 228

Has this residence always been heated with the same space heating fuel? 1 Yes, always 4 No, previously heated with Propane or Wood or Coal or Oil and now heating with Electricity 5 Other: _________________ 6 Do not know
What other HEATING SYSTEMS are used to heat this residence? (CHECK ALL THAT APPLY.)
1 Electric Baseboards 1 Wood Stove 1 Electric Portable Heater 1 Wood Fireplace 1 Electric Fireplace 1 Other: _________________ 1 Do not know What type of THERMOSTAT controls the main heating system? 1 No Thermostat - Go to Question 10 5 Smart or Wi-fi Thermostat 2 Individual Unit or Room Control 6 Other: _________________ 3 Manual Central Control (dial or slider) 7 Do not know 4 Programmable Thermostat
How often do you TURN DOWN the temperature at night during the heating season? 1 Every Night 3 Occasionally 5 Temperature is programmed 2 Most Nights 4 Never 6 No Thermostat
If you have a programmable (7 day) thermostat, is it currently programmed and running on a setback schedule? 1 Do not have a programmable thermostat 2 Yes, it is programmed 3 No, it is not programmed
If you have a Smart or Wi-fi thermostat, do you use the remote features? 1 Do not have a SMART or WiFi thermostat 2 Yes, regularly control remotely 3 Yes, occasionally control remotely 4 No, do not control remotely
3
4
5
6
7
8
Centra Gas Manitoba Inc. 2019/20 General Rate Application Appendix 7.7
March 22, 2019 Page 214 of 228

Section3 Air Conditioning
Are there plans to install within the NEXT 12 MONTHS a Smart or Wi-fi thermostat at this residence? 1 Yes, definitely 3 No, already have one 2 Yes, maybe 3 No, not at all
Do you use a DEHUMIDIFIER? 1 Yes 2 No 3 Do not know
Do you use a HUMIDIFIER? 1 Yes 2 No 3 Do not know
Is there a HEAT RECOVERY VENTILATION SYSTEM (HRV) used to control the air quality at this residence? 1 No HRV System 3 Yes, but HRV is not operating 2 Yes, HRV is operating 4 Do not know
What type of AIR CONDITIONER is used to cool this residence? 1 No Air Conditioner _ Go to SECTION 4
2 Heat Pump 3 Window or Wall Air Conditioner 4 Central Air Conditioner
What is the age of the MAIN air conditioning system?
1 0–3 years 4 10–12 years 7 21–25 years 2 4–6 years 5 13–15 years 8 Over 25 years 3 7–9 years 6 16–20 years 9 Do not know
Is this the original air conditioning system installed at this residence or has it been replaced? 1 Yes, it is the original system 2 No, it has been replaced 3 Do not know
How often do you adjust the temperature at night during the cooling season? 1 Every night 3 Occasionally 5 Temperature is programmed 2 Most nights 4 Never 6 Do not know
10
9
1
2
3
4
11
12
Centra Gas Manitoba Inc. 2019/20 General Rate Application Appendix 7.7
March 22, 2019 Page 215 of 228
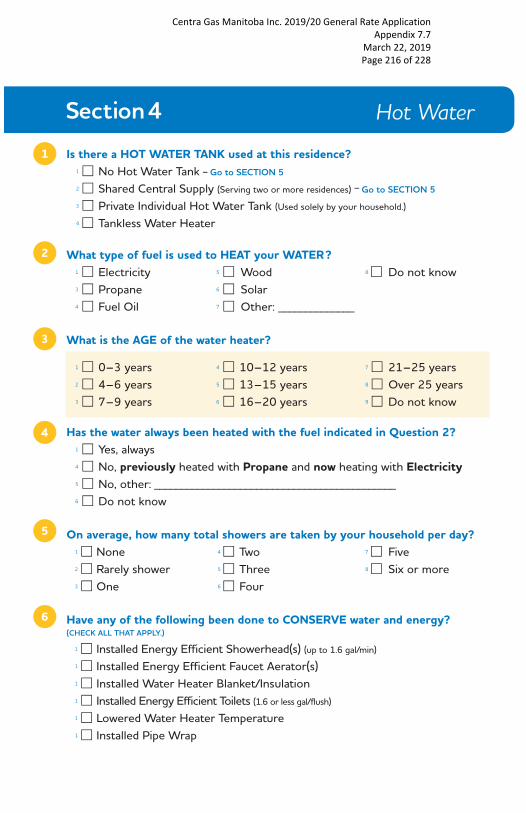
Is there a HOT WATER TANK used at this residence? 1 No Hot Water Tank _ Go to SECTION 5
2 Shared Central Supply (Serving two or more residences) _ Go to SECTION 5
3 Private Individual Hot Water Tank (Used solely by your household.)
4 Tankless Water Heater
What type of fuel is used to HEAT your WATER? 1 Electricity 5 Wood 8 Do not know 3 Propane 6 Solar 4 Fuel Oil 7 Other: ______________
What is the AGE of the water heater?
1 0–3 years 4 10–12 years 7 21–25 years 2 4–6 years 5 13–15 years 8 Over 25 years 3 7–9 years 6 16–20 years 9 Do not know
Has the water always been heated with the fuel indicated in Question 2? 1 Yes, always 4 No, previously heated with Propane and now heating with Electricity 5 No, other: _____________________________________________ 6 Do not know
On average, how many total showers are taken by your household per day? 1 None 4 Two 7 Five 2 Rarely shower 5 Three 8 Six or more 3 One 6 Four
Have any of the following been done to CONSERVE water and energy? (CHECK ALL THAT APPLY.)
1 Installed Energy Efficient Showerhead(s) (up to 1.6 gal/min) 1 Installed Energy Efficient Faucet Aerator(s) 1 Installed Water Heater Blanket/Insulation
1 Installed Energy Efficient Toilets (1.6 or less gal/flush)
1 Lowered Water Heater Temperature 1 Installed Pipe Wrap
5
1
6
2
3
4
Section4 Hot Water
Centra Gas Manitoba Inc. 2019/20 General Rate Application Appendix 7.7
March 22, 2019 Page 216 of 228

Section5 Major Appliances
Please indicate the MAIN COOKING fuel used at this residence. 1 None 5 Propane Cooking 2 Electric Cooking 6 Other: _________________ 3 Wood Cooking
• AVERAGE COOKED MEALS PER DAY: 1 One meal 3 Three meals 5 Five meals 2 Two meals 4 Four meals 6 Other:________________
What is the AGE of your main cooking appliance?
1 0–3 years 4 10–12 years 7 21–25 years 2 4–6 years 5 13–15 years 8 Over 25 years 3 7–9 years 6 16–20 years 9 Do not know
How many REFRIGERATORS are used at this residence? 1 None _ Go to Question 4 2 One 3 Two 4 Three or More
a) Please indicate the MAIN REFRIGERATOR that is used at this residence.
• SIZE: 1 Small (12 cu. ft. or less) 3 Large (17 to 22 cu. ft.) 2 Medium (13 to 16 cu. ft.) 4 Extra Large (Over 22 cu. ft.)
• AGE: (years) 1 0–3 years 4 10–12 years 7 21–25 years 2 4–6 years 5 13–15 years 8 Over 25 years 3 7–9 years 6 16–20 years 9 Do not know
b) Please indicate the SECOND REFRIGERATOR that is used at this residence. 1 None _ Go to Question 4
• SIZE: 1 Small (12 cu. ft. or less) 3 Large (17 to 22 cu. ft.) 2 Medium (13 to 16 cu. ft.) 4 Extra Large (Over 22 cu. ft.)
• AGE: (years) 1 0–3 years 4 10–12 years 7 21–25 years 2 4–6 years 5 13–15 years 8 Over 25 years 3 7–9 years 6 16–20 years 9 Do not know
1
2
3
Centra Gas Manitoba Inc. 2019/20 General Rate Application Appendix 7.7
March 22, 2019 Page 217 of 228
How many stand-alone FREEZERS are used at this residence?(DO NOT INCLUDE FREEZER COMPARTMENT OF YOUR REFRIGERATOR)
1 None _ Go to Question 5 2 One 3 Two 4 Three or More
a) Please indicate the MAIN stand-alone FREEZER that is used at this residence.
• SIZE: 1 Small (12 cu. ft. or less) 3 Large (17 to 22 cu. ft.) 2 Medium (13 to 16 cu. ft.) 4 Extra Large (Over 22 cu. ft.)
• AGE: (years) 1 0–3 years 4 10–12 years 7 21–25 years 2 4–6 years 5 13–15 years 8 Over 25 years 3 7–9 years 6 16–20 years 9 Do not know
b) Please indicate the SECOND stand-alone FREEZER that is used at this residence. 1 None _ Go to Question 5
• SIZE: 1 Small (12 cu. ft. or less) 3 Large (17 to 22 cu. ft.) 2 Medium (13 to 16 cu. ft.) 4 Extra Large (Over 22 cu. ft.)
• AGE: (years) 1 0–3 years 4 10–12 years 7 21–25 years 2 4–6 years 5 13–15 years 8 Over 25 years 3 7–9 years 6 16–20 years 9 Do not know
Is there an automatic DISHWASHER used at this residence? 1 No Automatic Dishwasher _ Go to Question 6 2 Yes
• AVERAGE LOADS PER WEEK: 1 1–3 loads 3 7–9 loads 5 Other:________________ 2 4–6 loads 4 Over 9 loads
• AGE: (years) 1 0–3 years 4 10–12 years 7 21–25 years 2 4–6 years 5 13–15 years 8 Over 25 years 3 7–9 years 6 16–20 years 9 Do not know
4
5
Centra Gas Manitoba Inc. 2019/20 General Rate Application Appendix 7.7
March 22, 2019 Page 218 of 228

Is there a CLOTHES WASHER used at this residence? 1 Do not have a Clothes Washer _ Go to Question 7
2 Use laundry facility outside the residence (e.g., apartment block laundry room or laundromat) _ Go to Question 7
3 Top Load Automatic Clothes Washer with agitator 4 Front Load or Top Load Automatic Clothes Washer without agitator 5 Other
• AVERAGE LOADS PER WEEK: 1 1–3 loads 3 7–9 loads 5 Other:________________ 2 4–6 loads 4 Over 9 loads
• AGE: (years) 1 0–3 years 4 10–12 years 7 21–25 years 2 4–6 years 5 13–15 years 8 Over 25 years 3 7–9 years 6 16–20 years 9 Do not know
Is there a CLOTHES DRYER used at this residence? 1 No Clothes Dryer _ Go to SECTION 6 2 Use laundry facility outside the residence (e.g., apartment block laundry room or laundromat) _ Go to SECTION 6
3 AUTOMATIC CLOTHES DRYER • DRYER FUEL: 1 Electricity 4 Other: __________________ 3 Propane
• AVERAGE LOADS PER WEEK: 1 1–3 loads 3 7–9 loads 5 Other:________________ 2 4–6 loads 4 Over 9 loads
• AGE: (years) 1 0–3 years 4 10–12 years 7 21–25 years 2 4–6 years 5 13–15 years 8 Over 25 years 3 7–9 years 6 16–20 years 9 Do not know
6
7
Centra Gas Manitoba Inc. 2019/20 General Rate Application Appendix 7.7
March 22, 2019 Page 219 of 228
What type and number of the following electronics are in USE at this residence? (CHECK ONE FOR EACH ELECTRONIC TYPE)
None One Two Three Four Five+Television 1 2 3 4 5 6 Set Top Box 1 2 3 4 5 6 DVD/Blu-ray 1 2 3 4 5 6 Gaming Console 1 2 3 4 5 6 Desktop Computer 1 2 3 4 5 6 Laptop Computer 1 2 3 4 5 6 Tablet 1 2 3 4 5 6 Cell Phone Charger 1 2 3 4 5 6
Do you have INTERNET ACCESS at this residence? 1 No 2 Yes, through home internet only 3 Yes, through mobile device only 4 Yes, through both home internet and mobile device
What telephone service is there at this residence? 1 No telephone service 2 Landline ONLY 3 Cell phone ONLY 4 BOTH Landline and cell phone
Approximately how many of each type of light bulbs do you have installed at this residence? (INCLUDING EXTERIOR LIGHTS BUT EXCLUDING SEASONAL OR HOLIDAY LIGHTS – CHECK ONE FOR EACH LIGHTING TYPE)
None 1-5 6-10 10-20 20-30 30+Incandescent 1 2 3 4 5 6 Halogen 1 2 3 4 5 6 Compact Fluorescent (CFL) 1 2 3 4 5 6 Light Emitting Diode (LED) 1 2 3 4 5 6 Tube Fluorescent 1 2 3 4 5 6
1
2
3
4
Section6 Electronics & Lighting
Centra Gas Manitoba Inc. 2019/20 General Rate Application Appendix 7.7
March 22, 2019 Page 220 of 228

5
6
Manitoba Hydro has offered a total of five Spring and Fall instant rebate promotions on LED bulbs at participating retailers since 2014.
a) Approximately how many LED bulbs in total did you purchase through all of the Manitoba Hydro’s instant rebate promotions? 1 None 4 6 to 10 7 20 to 30 2 1 to 5 5 10 to 20 5 30+
b) Approximately how many LED bulbs did you purchase while the Manitoba Hydro’s instant rebate promotions were NOT on? 1 None 4 6 to 10 7 20 to 30 2 1 to 5 5 10 to 20 5 30+
c) Did the Manitoba Hydro’s instant rebate promotions influence your decision to purchase LED bulbs? 1 I did not buy any LED bulbs 3 Somewhat influenced 2 Did not influence 4 Strongly influenced
d) If Manitoba Hydro did not offer the instant rebate promotion, would you have purchased the same number of LED bulbs? 1 Would not have purchased without the program 2 Would have purchased less without the program 3 Would have purchased the same amount 4 Have not purchased or installed any LED bulbs
Are there any strings of OUTDOOR SEASONAL or HOLIDAY lights in use at this residence? 1 No 3 Yes, Incandescent lights 2 Yes, LED lights 4 Yes, both LED and Incandescent lights
Centra Gas Manitoba Inc. 2019/20 General Rate Application Appendix 7.7
March 22, 2019 Page 221 of 228

How many VEHICLES are usually plugged in by your household during the winter months? (NOVEMBER – MARCH)
1 None _ Go to SECTION 8 3 Two 5 Four or More 2 One 4 Three For your most COMMONLY used vehicle, please indicate your normal routine during the winter months. (NOVEMBER – MARCH)
a) PARKED IN: 1 Detached Garage 3 Carport/Shelter 2 Attached Garage 5 Outside
b) CAR TIMER FOR BLOCKHEATER: 1 Yes 2 No
c) INTERIOR CAR WARMER: 1 Yes 2 No
Please check all the Power Smart programs you have PARTICIPATED in while at your PRESENT RESIDENCE? (CHECK AS MANY AS APPLY.)
1 Affordable Energy Program 1 Appliance Rebate Program 1 Earth Power (Geothermal) Loan
1 Home Insulation Program 1 LED Light Bulb In-store Rebate Promotions 1 LED Light fixture or Lighting Controls In-store Rebate Promotions
1 Plug-in timers, power bars, or showerheads In-store Rebate Promotions
1 Weatherstripping or Window kits In-store Rebate Promotions 1 New Home Program 1 PAY AS YOU SAVE (PAYS) financing 1 Refrigerator Retirement Program 1 Residential Loan 1 Smart Thermostat Rebate Program 1 Water and Energy Saver Program (Free kit provided) 1 Solar Energy Program
2
1
1
Section7 Vehicles
Section8 PowerSmart Programs
Centra Gas Manitoba Inc. 2019/20 General Rate Application Appendix 7.7
March 22, 2019 Page 222 of 228

How influential were Manitoba Hydro’s Power Smart programs, rebates, and information material in your decision to do the following: (CHECK ONE BOX FOR EACH ITEM.)
Did Not Install/Buy
Did Not Influence
Somewhat Influenced
Strongly Influenced
Upgrade Home Insulation 1 2 3 4 Install New Heating System 1 2 3 4 Buy New Refrigerator 1 2 3 4 Buy New Freezer 1 2 3 4 Buy New Clothes Washer 1 2 3 4 Buy Smart WiFi Thermostat 1 2 3 4
What best describes what has been done in your current home to reduce energy use? 1 All that can be done 4 Not much has been done 2 Most of what can be done 5 Nothing has been done 3 About half of what can be done 6 Do not know
Please indicate how you or anyone in your household USUALLY pays the Manitoba Hydro bill? (CHECK ONLY ONE.)
1 In-Person - at a Manitoba Hydro office 6 By Telephone 2 In-Person - at a designated agency 7 Third Party Pays For Bill 3 By Mail (i.e. Band Council or Social Services) 4 On-Line 8 Other:________________ 5 Pre-Authorized Payment Plan 9 Do not know How often do you check your energy bill? 1 Every month 3 1 to 4 times a year 5 Do not know 2 Every 2 months 4 Never check my bill
Are you aware of Manitoba Hydro's MYBILL method of receiving bills by email? 1 Yes 2 No
Would you be interested in receiving your Manitoba Hydro bill by email? 1 Yes 3 Not sure 5 Have no internet access 2 No 4 Already receive monthly Hydro bill by email
In the last year, how many times did you access the Manitoba Hydro website? 1 Zero 2 1 to 5 3 6 to 10 4 Over 10
2
3
1
2
5
3
4
Section9 Bills & Rates
Centra Gas Manitoba Inc. 2019/20 General Rate Application Appendix 7.7
March 22, 2019 Page 223 of 228

When you do check your bill, what do you mainly look at? (CHECK ALL THAT APPLY.)
1 Due date 1 Specific charges such as taxes and rates 1 Dollar amount owing 1 Equal Payment Plan amount 1 Current usage amount 1 Meter readings 1 Usage history 1 Never check my bill
In the PAST TWO YEARS, how many times have you reduced spending on the following items in order to pay for a Manitoba Hydro bill? (CHECK ONE BOX FOR EACH ITEM.)
Never One Two Three Four +Choose Not to Answer
Food 1 2 3 4 5 6 Rent 1 2 3 4 5 6 Loans 1 2 3 4 5 6 Insurance 1 2 3 4 5 6 Clothing 1 2 3 4 5 6 Entertainment 1 2 3 4 5 6 Travel 1 2 3 4 5 6 Cell Phone 1 2 3 4 5 6 Cable TV 1 2 3 4 5 6 Transportation 1 2 3 4 5 6 Gifts 1 2 3 4 5 6 Medical Expenses 1 2 3 4 5 6 Other: _______________________________________________
In the PAST TWO YEARS, how many times have you missed paying a Manitoba Hydro bill because of financial difficulties? 1 Never have missed a payment 4 Three times due to financial difficulties 5 Four times 2 Once 6 Over four times 3 Two times 7 Choose not to answer
If in the PAST TWO YEARS you missed paying a Manitoba Hydro bill, what made it hard for you to make that payment? (CHECK ALL THAT APPLY.)
1 It has NOT been hard for me to make 1 Loan or Mortgage payments Manitoba Hydro bill payments 1 Property taxes 1 Job loss 1 Unexpected major expenses 1 Separation or Divorce 1 Other:________________ 1 Retirement 1 Choose not to answer 1 Reduced or insufficient paycheck
How do you think you compare to similar households that heat the same way you do, that is with electricity, natural gas, or by some other means? 1 Use a lot more electricity 4 Use a little less electricity 2 Use a little more electricity 5 Use a lot less electricity 3 Use about the same amount of electricity 6 Do not know
10
6
7
8
9
Centra Gas Manitoba Inc. 2019/20 General Rate Application Appendix 7.7
March 22, 2019 Page 224 of 228

11
12
13
2
1
How do Manitoba Hydro’s residential electric rates compare to what other utilities charge in other provinces or states? 1 Rates are a lot higher 4 Rates are a little lower 2 Rates are a little higher 5 Rates are a lot lower 3 Rates are about the same 6 Do not know
The electric portion of your energy bill is determined by the amount of electricity you use which is measured in kilo-watt hours and the rate charged for each kilo-watt hour. What do you think Manitoba Hydro's residential electric rate per kilo-watt hour is? 1 It is the same regardless of the amount of electricity used each month 2 Rises to a higher price for any electricity used beyond a specific amount for that month 3 Drops to a lower price for any electricity used beyond a specific amount for that month 4 Do not know
Increasing rates after a certain level of usage is reached may encourage people to lower their energy use. What do you think of this idea? 1 I agree it would lower energy use and I support this idea 2 I agree it would lower energy use but I do not support this idea 3 I disagree it would lower energy use but I support this idea 4 I disagree it would lower energy use and I do not support this idea 5 Do not know
The following questions are very important in explaining energy usage. Please try to answer these questions. If you are uncomfortable in answering any of them, just mark the ‘Choose not to answer’ box.
Including yourself, how many persons usually live in your residence? 1 One (myself) 3 Three 5 Five 7 Seven or more 2 Two 4 Four 6 Six 8 Choose not to answer Please indicate what age group of people are usually living in your residence, (CHECK AS MANY AS APPLY.)
1 Under 18 years 1 35-44 years 1 65-74 years 1 18-24 years 1 45-54 years 1 75 and older 1 25-34 years 1 55-64 years 1 Choose not to answer
Section10 Household Demographics
Centra Gas Manitoba Inc. 2019/20 General Rate Application Appendix 7.7
March 22, 2019 Page 225 of 228

Do you identify yourself as an Indigenous person, that is a person of First Nations, Metis, or Inuit ancestry? 1 No 2 Yes, First Nations with Secure Certificate of Indian Status (SCIS) 3 Yes, First Nations with no Secure Certificate of Indian Status (SCIS)
4 Yes, Metis with Metis Citizenship Card 5 Yes, Metis with no Metis Citizenship Card 6 Yes, Inuit with Secure Certificate of Indian Status (SCIS) 7 Yes, Inuit with no Secure Certificate of Indian Status (SCIS) 8 Choose not to answer
What language other than English is spoken in your household? 1 English only 4 Cree (Ininew) 8 Michif 2 French 5 Dakota 9 Oji-Cree 3 Anishinaabe 6 Déné (Sayisi) 22 Other:________________ (Ojibway/Saulteaux) 7 Inuktitut 23 Choose not to answer What is your approximate TOTAL ANNUAL HOUSEHOLD INCOME? (ALL SOURCES BEFORE TAXES)
1 Under $20,000 7 $50,000-$54,999 13 $80,000-$89,999 2 $20,000-$24,999 8 $55,000-$59,999 14 $90,000-$99,999
3 $25,000-$29,999 9 $60,000-$64,999 15 $100,000-$124,999 4 $30,000-$34,999 10 $65,000-$69,999 16 $125,000-$149,999
5 $35,000-$39,999 11 $70,000-$74,999 17 $150,000 or over 6 $40,000-$49,999 12 $75,000-$79,999 18 Choose not to answer
Please indicate the HIGHEST EDUCATION LEVEL attained by the head of household? 1 No certificate, diploma or degree 2 High school certificate or equivalent 3 Apprenticeship or trades certificate or diploma
4 College, CEGEP or other non-university certificate or diploma 5 University certificate or diploma below bachelor level 6 Bachelor's degree 7 Degree in medicine, dentistry, veterinary medicine or optometry 8 Master's degree 9 Earned doctorate 10 Other 11 Choose not to answer
4
5
6
3
Centra Gas Manitoba Inc. 2019/20 General Rate Application Appendix 7.7
March 22, 2019 Page 226 of 228

Your responses will only be used by Manitoba Hydro for its business purposes, such as the planning, development, implementation, administration, marketing, tracking, evaluation, and reporting, of its operations and programs. For inquiries concerning the collection of any personal information contained in this form or if you have any questions concerning this survey please contact:
204.360.3447(Weekdays 8:00 a.m. to 3:00 p.m.)
Outside Winnipeg, call collect.
Please return the completed questionnaire in the postage paid envelope provided, or mail to:
RESIDENTIAL ENERGY USE SURVEY MARKET FORECAST DEPARTMENTManitoba Hydro7th Floor 360 Portage AvenueWinnipeg, MB R3C 0G8
THANK YOU FOR YOUR TIME AND COOPERATION
THANK YOU FOR YOUR TIME AND COOPERATION
Centra Gas Manitoba Inc. 2019/20 General Rate Application Appendix 7.7
March 22, 2019 Page 227 of 228

Please mail this completed form in the postage paid self-addressed envelope provided or to:
RESIDENTIAL ENERGY USE SURVEY MARKET FORECAST DEPARTMENT
Manitoba Hydro7th Floor 360 Portage Avenue
Winnipeg, MB R3C 0G8
THANK YOU FOR YOUR TIME AND COOPERATION
*Manitoba Hydro is a licensee of the Trademark and Official Mark.
2017 Residential Energy Use Survey
Please answer the survey for the address shown BELOW. Return the completed questionnaire in the postage paid envelope provided.
Please answer the survey for the address shown on the FRONT COVER. Return the completed questionnaire in the postage paid envelope provided.
Dear Customer:Help us deliver the best service possible to you by completing the 2017 Manitoba Hydro Energy Use Survey. By taking time to answer the following questions, you will help Manitoba Hydro assess the energy use characteristics of our residential customers. Your participation in this survey will enable us to better serve you and effectively plan for the future.All responses will be treated in the strictest confidence.
KinanaskomitinMiigwech KinanakominWopidaMashi’cho
Available in accessible formats upon request.
Centra Gas Manitoba Inc. 2019/20 General Rate Application Appendix 7.7
March 22, 2019 Page 228 of 228
![Energy and Buildings · 2020-08-04 · Residential Energy Consumption Survey (RECS) [12] and the Commercial Building Energy Consumption Survey (CBECS) [13] end use estimation. The](https://static.fdocuments.net/doc/165x107/5fade0385f15346d205efae6/energy-and-buildings-2020-08-04-residential-energy-consumption-survey-recs-12.jpg)


