Appendix 5.5A Offsite Consequences Analysis
15
DOCKETED Docket Number: 16 - AFC - 01 Project Title: Stanton Energy Reliability Center TN #: 214207 - 29 Document Title: Appendix 5.5A - Offsite Consequences Analysis Description: Application for Certification Vol. 2 Filer: Sabrina Savala Organization: Stanton Energy Reliability Center, LLC Submitter Role: Applicant Submission Date: 10/27/2016 10:23:29 AM Docketed Date: 10/26/2016
Transcript of Appendix 5.5A Offsite Consequences Analysis

DOCKETED
Docket Number: 16-AFC-01
Project Title: Stanton Energy Reliability Center
TN #: 214207-29
Document Title: Appendix 5.5A - Offsite Consequences Analysis
Description: Application for Certification Vol. 2
Filer: Sabrina Savala
Organization: Stanton Energy Reliability Center, LLC
Submitter Role: Applicant
Submission Date: 10/27/2016 10:23:29 AM
Docketed Date: 10/26/2016

Appendix 5.5A Offsite Consequences Analysis

Off - s i te Ammonia Consequence Ana lys i s
Hazardous Release Analysis
For The
Stanton Energy Reliability Center, LLC
Stanton, California
Prepared for
Stanton Energy Reliability Center, LLC 650 Bercut Drive, Suite A
Sacramento, CA. 95811
Prepared by
Atmospheric Dynamics, Inc.
October 2016

1
Offsite Consequence Analysis Stanton Energy Reliability Center Ammonia System
The Stanton Energy Reliability Center (project or SERC) is a proposed 98-megawatt (MW) (nominal annual average) natural gas-fired simple-cycle power plant. The project is planning to operate in a fashion similar to a peaking facility, with an expected capacity factor of 5 percent.
The SERC is required by both the Clean Air Act and the South Coast Air Quality Management District to install Best Available Control Technology to control emissions of criteria air pollutants from the combustion turbines. The new SERC turbines will incorporate Standard Annular Combustor technology with water injection into the combustor that reduce the formation of oxides of nitrogen (NOx), with such NOx emissions further reduced through the use of selective catalytic reduction (SCR). The SCR control system utilizes ammonia as the reduction medium in the presence of a catalyst. Two forms of ammonia may be used in currently designed SCR systems (i.e., anhydrous ammonia or aqueous ammonia). SERC is proposing to use aqueous ammonia in a less than or equal to 19.5 percent (by weight) solution. Aqueous ammonia is a water-based ammonia solution that can be mixed and delivered in a wide variety of solution ratios. Solution mix ratios less than or equal to 20 percent (weight basis) are the most common. Aqueous ammonia solutions typically have a boiling point of approximately 120 degrees Fahrenheit. When spilled, aqueous ammonia solutions will slowly vaporize, releasing ammonia vapors. According to data prepared for the California Energy Commission (CEC) by Ebasco (Ammonia Release Risk Mitigation Guidance for Power Plants-Draft Report, published in November 1989), when ammonia is diluted with water to solutions of less than or equal to 20 percent by volume, evaporation of ammonia gas from the fluid becomes negligible. The guidance further states that when ammonia is diluted with water at ambient temperatures to solutions less than 25 percent by weight, ammonia vapor pressure is reduced to atmospheric pressure (i.e., the evaporation of ammonia gas from the fluid would be negligible). A 19.5 percent solution of aqueous ammonia has an approximate vapor pressure of 190 millimeters of mercury (mmHg) at 77 degrees Fahrenheit.
Title 40 of the Code of Federal Regulations, Part 68 and the California Code of Regulations (CCR), Division 2, Chapter 4.5 regulate the potential accidental release of hazardous materials. CCR Article 8, Section 2770.5 includes tables of federally and state regulated substances, including threshold quantities for regulation under the accidental release prevention program. Because SERC will store ammonia in excess of 500 pounds, the facility is required to have a written Risk Management Plan (RMP) and to complete an Offsite Consequence Analysis (OCA). The complete RMP will be submitted to the Certified Unified Program Agency (CUPA) prior to aqueous ammonia being brought onsite.
Accidental releases of ammonia (all forms) in industrial use situations are rare. Statistics compiled on the normalized accident rates for RMP chemicals for the years 1994 through 1999 (from Chemical Accident Risks in U.S. Industry-A Preliminary Analysis of Accident Risk Data from U.S. Hazardous Chemical Facilities, J. C. Belke, Sept 2000) indicate that ammonia averages 0.017 accidental release per process per year, and 0.018 accidental release per million pounds stored per year. Data derived from The Center for Chemical Process Safety (1989) indicate the following accidental release scenarios and probabilities for ammonia in general:
2
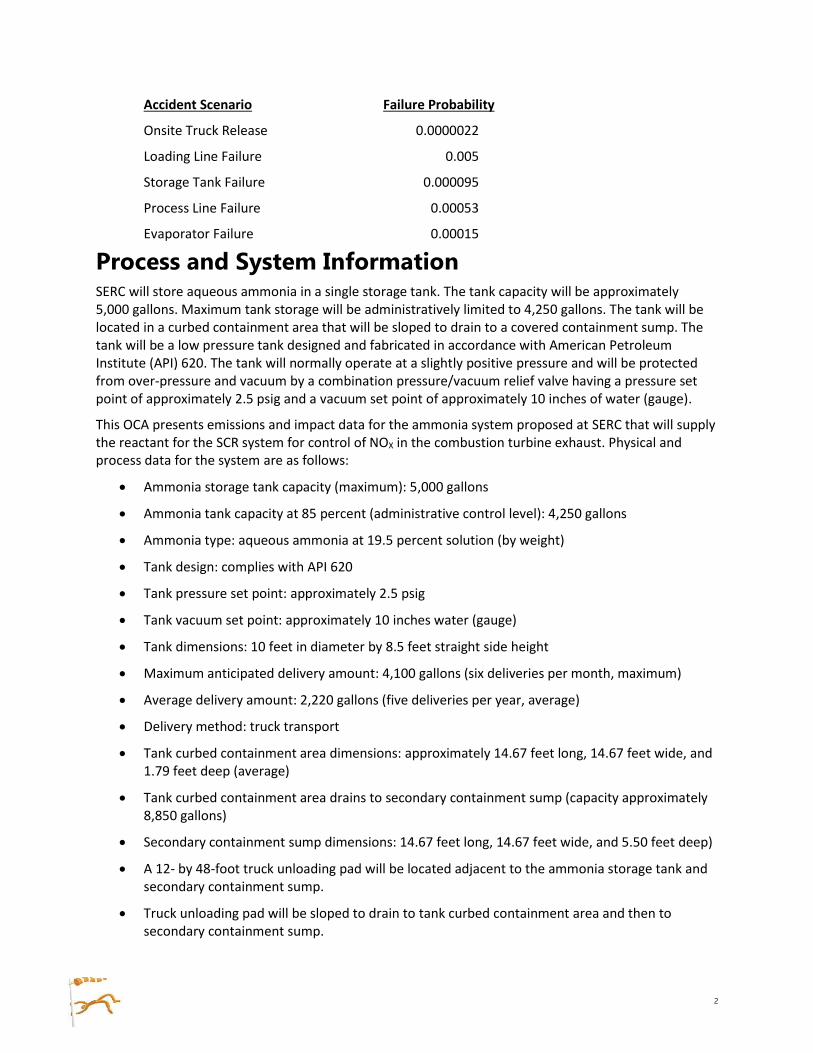
Accident Scenario Failure Probability
Onsite Truck Release 0.0000022
Loading Line Failure 0.005
Storage Tank Failure 0.000095
Process Line Failure 0.00053
Evaporator Failure 0.00015
Process and System Information SERC will store aqueous ammonia in a single storage tank. The tank capacity will be approximately 5,000 gallons. Maximum tank storage will be administratively limited to 4,250 gallons. The tank will be located in a curbed containment area that will be sloped to drain to a covered containment sump. The tank will be a low pressure tank designed and fabricated in accordance with American Petroleum Institute (API) 620. The tank will normally operate at a slightly positive pressure and will be protected from over-pressure and vacuum by a combination pressure/vacuum relief valve having a pressure set point of approximately 2.5 psig and a vacuum set point of approximately 10 inches of water (gauge).
This OCA presents emissions and impact data for the ammonia system proposed at SERC that will supply the reactant for the SCR system for control of NOX in the combustion turbine exhaust. Physical and process data for the system are as follows:
Ammonia storage tank capacity (maximum): 5,000 gallons
Ammonia tank capacity at 85 percent (administrative control level): 4,250 gallons
Ammonia type: aqueous ammonia at 19.5 percent solution (by weight)
Tank design: complies with API 620
Tank pressure set point: approximately 2.5 psig
Tank vacuum set point: approximately 10 inches water (gauge)
Tank dimensions: 10 feet in diameter by 8.5 feet straight side height
Maximum anticipated delivery amount: 4,100 gallons (six deliveries per month, maximum)
Average delivery amount: 2,220 gallons (five deliveries per year, average)
Delivery method: truck transport
Tank curbed containment area dimensions: approximately 14.67 feet long, 14.67 feet wide, and 1.79 feet deep (average)
Tank curbed containment area drains to secondary containment sump (capacity approximately 8,850 gallons)
Secondary containment sump dimensions: 14.67 feet long, 14.67 feet wide, and 5.50 feet deep)
A 12- by 48-foot truck unloading pad will be located adjacent to the ammonia storage tank and secondary containment sump.
Truck unloading pad will be sloped to drain to tank curbed containment area and then to secondary containment sump.

3
Number of drains to secondary containment sump: three
Drain dimensions: 2 feet wide by 0.5-foot-high (total drain area = 3 feet2)
An OCA was performed for the release scenario involving the complete failure and discharge of the storage tank contents into the secondary containment sump. This report addresses the emissions and impacts from a single California Accidental Release Prevention Program (CalARP) regulated substance at this facility: 19.5 percent aqueous ammonia. As stated in Section 2750.3 of the CalARP regulation, the worst-case release quantity is the greatest amount held in a single vessel.
For the worst-case release analysis, the entire 5,000-gallon contents of the vessel were assumed to be instantaneously spilled to form a liquid pool that drains to the secondary containment sump through three drains, each 2 feet by 0.5 foot (1 square foot). The rate of release to air was determined from the volatilization rate of the liquid pool in the sump vented by the three 2- by 0.5-foot drain holes.
Toxic Effects of Ammonia The odor threshold of ammonia is approximately 5 parts per million (ppm), and minor irritation of the nose and throat will occur at 30 to 50 ppm. Concentrations greater than 140 ppm will cause detectable effects on lung function, even for short-term exposure times (0.5 to 2 hours). At higher concentrations of 700 to 1,700 ppm, ammonia gas will cause severe effects; death occurs at concentrations of 2,000 to 7,000 ppm.
Toxic Endpoints Evaluated As part of this analysis, the toxic endpoint assigned by the CCR and the CalARP Administering Agency Guidance was used to quantify offsite impacts for the facility. This toxic endpoint (Te) ensures that calculated results over-predict the consequences of a release, to the benefit of the public. This analysis also considered several other Te values and averaging times per the CEC requirements. All of these values are as follows:
CalARP Te, 201 ppm1, 1-hour average
ERPG-2, 150 ppm2, 1-hour average
CEC level of concern (LOC), 75 ppm3, 30-minute average
The at-risk population number is the estimated number of people within the radius of the maximum downwind distance reached by the plume in all wind directions. The 19.5 percent aqueous ammonia distance is based on calculations using the U.S. Environmental Protection Agency (EPA) SCREEN3 dispersion model. The SCREEN3 model results, in conjunction with the EPA screening factors, are frequently used to estimate concentrations for short-term averages. The dispersion curves used in SCREEN3 and similar dispersion models such as ALOHA are based on the 10-minute average Turner workbook screening methods, which assign a Gaussian distribution based on the atmospheric stability.
1 The Toxic endpoint (Te) is the maximum concentration below which all individuals can be exposed for up to 1 hour without experiencing serious or life-threatening health effects.
2 Emergency Response Planning Guideline level 2 (EPRG-2) is the maximum airborne concentration below which nearly all individuals could be exposed for up to 1 hour without experiencing or developing irreversible or other serious health effects or symptoms that could impair an individual's ability to take protective action.
3 CEC LOC is the level at which a one-time exposure results in no serious adverse effects to the public. This value is one-half of the ERPG-2 level.

4
Because the release duration is 10 minutes, the SCREEN3 model is appropriate for determining the 30-minute and 1-hour averages. The toxic endpoint concentration from SCREEN3 is then used to quantify the offsite impacts of a release. In many cases, these concentrations are provided in units of ppm or milligrams per liter.
Sensitive Populations and Receptors CalARP requirements state that sensitive populations such as schools, hospitals, day-care centers, long-term health care facilities, prisons, residential areas, public use parks/recreational areas, and major commercial facilities located within the “at risk” area must be identified. These sensitive populations include individuals who could not remove themselves from the exposure area without assistance. The sensitive populations also include industrial installations that may have a hazardous process that cannot be immediately left unattended. SERC’s worst-case release scenario does not extend past the facility fence line. Therefore, no sensitive public receptors are located within the distance of the toxic endpoint from the facility. The site plan and tank pad (and sump) drawings can be found in Attachment 1. The aqueous ammonia tank (and openings from the secondary containment sump) is approximately 55.8 feet (17 meters) from the nearest facility boundary line (to the south).
A search of sensitive receptors within 500 feet of the facility fence line resulted in the following:
No schools were noted in the radius distance.
No hospitals were noted in the radius distance.
No nursing or convalescent homes were noted in the radius distance.
No day-care facilities were noted in the radius distance.
No parks or recreational sites were noted in the radius distance.
The site is surrounded by commercial/industrial development.
The nearest residence is approximately 487 feet east-southeast of the ammonia tank and sump area.
Worst-case Release Scenario Defined The CalARP regulations define the worst-case release scenario for toxic liquid releases as follows:
“For regulated toxic substances that are normally liquids at ambient temperature, the owner or operator shall assume that the quantity in the vessel or pipe…is spilled instantaneously to form a liquid pool.
The surface area of the pool shall be determined by assuming that the liquid spreads to 1-centimeter-deep unless passive mitigation systems are in place that serve to contain the spill and limit the surface area. Where passive mitigation is in place, the surface area of the contained liquid shall be used to calculate the volatilization rate.
If the release would occur onto a surface that is not paved or smooth, the owner or operator may take into account that actual surface characteristics.
The volatilization rate shall account for the highest daily maximum temperature occurring in the past three years, the temperature of the substance in the vessel, and the concentration of the substance if the liquid spilled is a mixture or solution.

5
The rate of release to air shall be determined from the volatilization rate of the liquid pool. The owner or operator may use the methodology in the RMP Offsite Consequence Analysis Guidance or any other publicly available techniques that account for the modeling conditions and are recognized by industry as applicable as part of current practices. Proprietary models that account for the modeling conditions may be used provided the owner or operator allows the implementing agency access to the model and describes model features and differences from publicly available models to local emergency planners upon request.”
For the worst-case scenario, it is assumed that the aqueous ammonia spills from the aqueous ammonia tank into the surrounding containment basin, and then drains immediately to the covered secondary containment sump through three drain holes that measure 24 by 6 inches. The sump is sized to contain the entire contents of the aboveground tank plus the rainfall from a 25-year, 24-hour storm event. Per the regulations, the covered sump acts as passive mitigation, containing the liquid and limiting the volatilization rate. The surface area of the contained liquid was used to calculate the volatilization rate. The surface area consists of the combined area of the three drain holes. The constrained surface area of the three drain holes was used to mitigate the release. The aqueous ammonia would drain into the covered sump in less than 60 seconds.
The vapor pressure of ammonia mixed in a water solution of 19.5 percent experiences a significant depression of volatilization. This fact underlies the EPA conclusion that emissions from a spill of aqueous ammonia should only have emissions calculated for the first 10 minutes after the release. The rate of volatilization after 10 minutes is insignificant. The average vapor pressure over 10 minutes of ammonia in a 19.5 percent aqueous ammonia solution is approximately 190 mmHG (3.67 psia) at the worst-case scenario wind speed of 1.5 meters per second (m/sec), according to the Risk Management Program Guidance for Offsite Consequence Analysis, EPA 550 B-99-009.
Methodology To calculate the evaporation rate, a series of equations is utilized. First Dm, the molecular diffusivity, is needed (shown in Equation 1, Molecular Diffusivity of Aqueous Ammonia Solution). Graham's Law was used to approximate the molecular diffusivity of the selected chemical in air, in m2/sec as follows:
Dm = D(H2O) * [Mw(H2O)/Mw(NH3)]1/2 (m2/s)
Where D(H2O) is the molecular diffusivity of water (2.4 x 10⁻⁵ m2/s at 8°C), Mw(H2O) is the molecular weight of water (18 kg/kmol), and Mw(chem) is the molecular weight of the selected chemical, in kg/kmol (17 kg/kmol for ammonia). The input values are as follows:
D(H2O) 0.000024 m2/sec
Mw(H2O) 18 kg/kmol
Mw(NH3) 17 kg/kmol
Dm = 0.000024 m2/sec * [18 kg/kmol /17 kg/kmol ]1/2
Dm = 2.4696 x10⁻⁵ m2/sec
Once the molecular diffusivity is calculated, it is utilized to calculate the Schmidt number (Sc). The laminar Sc, which is a unitless ratio, was estimated using Equation 2, Molecular Diffusivity of Aqueous Ammonia Solution:
Sc = (v/Dm)

6
Where v is the kinematic viscosity of the air, assumed to be 1.5 x 10⁻⁵ m2/s, and Dm is the molecular diffusivity of the selected chemical in air, in m2/sec. The input values are as follows:
v 0.000015 m2/sec
Dm(NH3) 2.4696 x10⁻⁵ m2/sec
Sc = (0.000015 m2/sec /2.4696 x10-5 m2/sec)
Sc = 0.6074 unitless
The Sc is then utilized to calculate Km, the mass transfer coefficient, which is the variable needed to complete the evaporation calculation. To find the mass transfer coefficient, Equation 3 is utilized:
Km = 0.0048 * U7/9 * Z-1/9 * Sc-2/3 (m/sec)
Where U is wind speed at a height of 10 m, in m/sec, Z is the pool diameter in the along-wind direction (m), and Sc is the laminar Sc for the selected chemical. Z is taken from the square root of the combined area of the three drain holes. The input values are as follows:
U 1.50 m/sec
Z 1.73 ft. (0.5279 m)
Sc 0.6074 unitless
Km = 0.0048 * (1.50 m/sec) 7/9 * (0.5279 m)-1/9 *(0.6074)-2/3
Km = 0.0098 m/sec
Equation 4 is used to estimate the evaporation rate:
E = A * Km * (Mw * Pv)/(R * T) (kg/s)
Where E is the evaporation rate in kg/s, A is the area of the combined three drain holes in m2; Km is the mass transfer coefficient in m/sec; Mw is the molecular weight of the ammonia in kg/kmol; Pv is the vapor pressure in Pa; R is the gas constant (8314 J/(kmol K)); and T is the ambient temperature in K. The input values are as follows:
A 3 ft2 (0.279 m2)
Km 0.0098 m/sec
MW(NH3) 17 kg/kmol
Pv 190 mmHG (25331.25 Pa)
R 8314.0 J/kmol K
T 312 K (highest daily temp, 102 F, 2004 for Anaheim)
E = 0.279 m2 * 0.0098 m/sec * (17 kg/kmol * 25331.25 Pa) / (8314.0 J/kmol K * 312 K )
E = 0.0004539 kg/sec (0.0603 lbs/min)
Equation 5 is used to estimate the emission rate:
Emission Rate = E/A (Total)
Where Emission Rate in lbs/min ft2, A is the area of the combined three drain holes in ft2, and E is the evaporation rate in lbs/min. The Emission Rate value is used when computing the endpoint distances in Screen3. The input values are as follows:

7
E 0.0603 lbs/min
A 3.0 ft2
Emission Rate = 0.0603 lbs/min / 3.0 ft2
Emission Rate = 0.0201 lbs/min ft2 (1.6344 g/s m2)
SCREEN3 was then used to model the worst-case release scenario. The area of the three drain holes is 3 ft2. This area is equivalent to a square opening 1.73 by 1.73 feet. The following parameters were used as the input for SCREEN3:
Length of Larger Side 0.5272 m (1.73 feet)
Length of Smaller Side 0.5272 m (1.73 feet)
Stability Class F
Wind Speed 1.5 m/sec
Release Rate 1.6344 g/sec/m2
As noted, SCREEN3 calculates concentrations as 1-hour values, but the model is based on 10-minute average concentrations, which is appropriate for the 10-minute release.
The evaporation of the fraction of the solution that is water is ignored because water is not a hazardous chemical.
The facility’s topography was classified as urban by using the following guidance:
Per 19 CCR Section 2750.2 (4) (e):
“Surface Roughness: The owner or operator shall use either urban or rural topography. Urban means that there are many obstacles in the immediate area; obstacles include buildings, or trees. Rural means that there are no buildings in the immediate area and the terrain is generally flat and unobstructed.”
SERC will utilize an active mitigation measure for the aqueous ammonia system by limiting the volume of the 19.5 percent aqueous ammonia in the tank to 85 percent; however, no active mitigation measures were implemented in this OCA analysis. The covered sump in the ammonia dike significantly reduces the surface area and evaporation rate. Therefore, secondary containment was accredited as passive mitigation.
Analysis Results Based on the analysis data presented above and the modeling results, the distances to the specified toxic endpoint values for the worst-case tank release scenario are as follows:
Distance to the CalARP Te: approximately 8.5m (28 feet)
Distance to the ERPG-2 Te: approximately 10m (33 feet)
Distance to the CEC LOC Te: approximately 13.5m (44 feet)
Table 1 presents the concentration values versus downwind distance as derived from the SCREEN3 modeling output file. Figure 1 presents these results in graphical form. Note that the distances for all of the specified toxic endpoints are within the facility fence line.

8
TABLE 1 NH3 Concentrations Based On Downwind Distance Offsite Consequence Analysis, Stanton Energy Resource Center Ammonia System
Downwind Distance in m (ft)
Downwind Concentration in µg/m3
Downwind Concentration in ppm
5 (16.4) 411,800 588
10 (32.8) 108,700 155
15 (49.2) 48,980 70
17 (55.8) * 38,260* 55
20 (65.6) 27,760 40
25 (82.0) 17,870 26
30 (98.4) 12,480 18
50 (164.1) 4,576 7
70 (229.7) 2,377 3
100 (328.1) 1195 2
*Modeled value for the south fence line.
Note: µg/m3 = microgram(s) per cubic meter
Conclusion The modeling indicates that no offsite impacts are expected to occur from the worst-case tank release scenario when compared to the three impact levels described above.

Figure 1Accidental Ammonia Release ScenarioStanton Energy Reliability Center

10
References “Appendix A: Table of Toxic Endpoints.” 19 CCR Division 2, Chapter 4.5. June 2004.
“California Accidental Release Prevention Program: Administering Agency Guidance Document.” January 2005.
El Cajon Energy Center, Hazard Assessment, Risk Management Professionals. November 2009.
“Perry’s Chemical Handbook,” Table 3-23.
Risk Management Program Guidance for Offsite Consequence Analysis, EPA 550-B-99-009. March 2009.
Risk Management Program Guidance for Offsite Consequence Analysis, EPA 550-B-99-009. Equation D-5 in Appendix D. March 2009.
Risk Management Program Guidance for Offsite Consequence Analysis, EPA 550-B-99-009, Exhibit B-3. April 1999.
SCREEN3, a single source Gaussian plume model developed by the U.S. Environmental Protection Agency. Available online: http://www.epa.gov/scram001/dispersion_screening.htm.

11
Attachment 1

12'
TOC +0'-0"
48'
TOC +0'-6"
TOC +0'-0"
14'-8"
31'-4"
TOC -0'-3"
TOC -1'-5"
6" HIGH X 2'-0" WIDE OPENING FROM TANK
CONTAINMENT AREA TO CONTAINMENT SUMP,
TYP. OF 3
TOC -0'-3"
TOC -0'-3"
SLOPE
ENCLOSED AMMONIA CONTAINMENT
SUMP WITH CURBED AREA ON ROOF
FOR AMMONIA TRANSFER PUMPS
14'-8"
TOC +0'-0"
TOC +0'-6"
AMMONIA TANK EQUIPMENT PAD
5000 GAL AMMONIA TANK
CURBED AMMONIA TANK
CONTAINMENT AREA
TOC -1'2"
TOC +0'6"
TOC +0'6"
TOC +0'-0"
DELIVERY TRUCK UNLOADING AREA
SLOPED TO TANK CONTAINMENT AREA
TOC +0'-0"
5'-6"
OPENING FROM TANK CONTAINMENT
AREA TO CONTAINMENT SUMP
TYP. OF 3
10'
5000 GAL AMMONIA TANK
8'-6"
SLO
PE
SLO
PE
SLO
PE
B
-
SCALE: =1'-0"
SECTIONNA
SCALE: =1'-0"
SECTIONN/A
A
-
SLO
PE
ALL ELEVATIONS RELATIVE TO THIS POINT
NO EXTERNAL REFERENCE ELEVATION
A
B
C
D
8 7 6 5 4 3 2
D
1
B
C
8 7 6 5 4 3
A
2 1
Phone: 916-492-9486 Fax: 916-880-5318650 Bercut Dr, Suite A - Sacramento, CA 95811Stanton Energy Reliability Center, LLC
PRELIMINARY