Appendix 4E – Preliminary Final Report for year ended 30 June … · 2016-08-30 · Appendix 4E...
25
Appendix 4E – Preliminary Final Report For the year ended 30 June 2016 Page 1 Appendix 4E – Preliminary Final Report for year ended 30 June 2016 for Wellard Limited (ABN 53 607 708 190) and subsidiaries Lodged with the ASX under Listing Rule 4.3A Contents Results for Announcement to the Market 2 Appendix 4E item 2 Preliminary Consolidated Statement of Comprehensive Income 8 Appendix 4E item 3 Preliminary Consolidated Statement of Financial Position 9 Appendix 4E item 4 Preliminary Consolidated Statement of Changes in Equity 10 Appendix 4E item 6 Preliminary Consolidated Statement of Cash Flows 11 Appendix 4E item 5 Supplementary Appendix 4E information 12 Appendix 4E item 6 to 13 This report covers Wellard Limited (Wellard or Company) and the entities it controlled during the financial year ended 30 June 2016 (Wellard Group or Group or Consolidated Group), for the financial year ended 30 June 2016 (FY 2016). The previous corresponding period is the year ended 30 June 2015 (FY 2015). The financial statements are presented in Australian dollars (unless otherwise stated). For personal use only
Transcript of Appendix 4E – Preliminary Final Report for year ended 30 June … · 2016-08-30 · Appendix 4E...

Appendix 4E – Preliminary Final Report For the year ended 30 June 2016
Page 1
Appendix 4E – Preliminary Final Report for year ended 30 June 2016 for Wellard Limited (ABN 53 607 708 190) and subsidiaries Lodged with the ASX under Listing Rule 4.3A
Contents Results for Announcement to the Market 2 Appendix 4E item 2 Preliminary Consolidated Statement of Comprehensive Income 8 Appendix 4E item 3 Preliminary Consolidated Statement of Financial Position 9 Appendix 4E item 4 Preliminary Consolidated Statement of Changes in Equity 10 Appendix 4E item 6 Preliminary Consolidated Statement of Cash Flows 11 Appendix 4E item 5 Supplementary Appendix 4E information 12 Appendix 4E item 6 to 13 This report covers Wellard Limited (Wellard or Company) and the entities it controlled during the financial year ended 30 June 2016 (Wellard Group or Group or Consolidated Group), for the financial year ended 30 June 2016 (FY 2016). The previous corresponding period is the year ended 30 June 2015 (FY 2015). The financial statements are presented in Australian dollars (unless otherwise stated).
For
per
sona
l use
onl
y

Appendix 4E – Preliminary Final Report For the year ended 30 June 2016
Page 2
RESULTS FOR ANNOUNCEMENT TO THE MARKET
A$ ‘000
30 June 2016
A$ ‘000
Revenue (Appendix 4E item 2.1)
Up 12% to 573,773
Profit/(Loss) after tax from ordinary activities attributable to members (Appendix 4E item 2.2)
Down (23,126) 11,739% to (23,323)
Net Profit/(Loss) after tax from ordinary activities attributable to members (Appendix 4E item 2.3)
Down (23,126) 11,739% to (23,323)
Dividends (Appendix 4E item 2.4)
Amount per security
Franked amount per security
It is not proposed to pay dividends for the year N/A N/A
Previous corresponding year – no dividend paid N/A N/A
Record date for determining entitlements to the dividends (Appendix 4E item 2.5)
Not applicable as no dividends declared.
Details of individual and total dividends or distributions and dividend or distribution payments (Appendix 4E item 7)
Not applicable as no dividends declared.
Details of dividend reinvestment plans (Appendix 4E item 8)
Not applicable as no dividends declared.
Audit status (Appendix 4E item 15)
This report is based on accounts which are in the process of being audited.
For
per
sona
l use
onl
y

Appendix 4E – Preliminary Final Report For the year ended 30 June 2016
Page 3
Wellard overview During the year, a restructure took place in preparation for the listing of the Wellard Group on the ASX. This resulted in a newly incorporated company, Wellard Limited, raising equity on the ASX to fund the purchase of several entities within the WGH Holdings Pty Ltd (WGH) (previously Wellard Group Holdings Pty Ltd) business that have previously operated together as a business. This Initial Public Offering (IPO) was completed and Wellard was admitted to the Official list of ASX Limited on 10 December 2015. The IPO Prospectus was dated 20 November 2015 (Prospectus). The IPO raised $298.9 million through the issuance of 215 million new fully paid ordinary shares in Wellard at an offer price of $1.39 per share.
The Wellard Group is a trader and exporter of live cattle from Australia, New Zealand and South America and a supplier of seaborne transportation for livestock globally. Wellard is also an exporter of live sheep and meat from Australia. Wellard sources livestock in markets where production is surplus to domestic requirements (including Australia, Brazil and Uruguay) and sells livestock and meat to customer markets where demand exceeds local production (including Indonesia, Vietnam, the Middle East, Turkey and China). Occasionally, Wellard charters its ships to third parties and earns freight income by carrying live animals on their behalf.
To support its operations, the Wellard Group owns or controls critical and specialist infrastructure at various stages of its supply chain including strategically located pre-export quarantine facilities, an abattoir, a feed mill and a fleet of purpose-built livestock transport vessels.
Explanation of revenue and profit/loss from ordinary activities after tax (Appendix 4E item 2.6) In FY 2016 the Wellard Group shipped:
• 424,972 head of slaughter, feeder and breeder cattle to customers in 9 countries; • 23,204 head of sheep to customers in 3 countries; and • 6,600 tonnes of sheep meat to customers in more than 12 countries.
In FY 2016 the Wellard Group:
• purchased 365,771 head of cattle and 23,204 head of sheep for live export; • purchased 361,087 head of sheep and processed them through its slaughter house facility Beaufort River
Meats; and • loaded and discharged 59 shipments of livestock.
Sales revenue increased 12% year-on-year in FY 2016 due mainly to higher volumes of cattle exported out of the Wellard Group’s supply bases in Australia and South America and due to the depreciation in the Australian dollar against the United States dollar.
For
per
sona
l use
onl
y

Appendix 4E – Preliminary Final Report For the year ended 30 June 2016
Page 4
The Prospectus contained financial forecasts. Set out below is a comparison of the Preliminary Statutory Net Profit after Tax (NPAT) to the Prospectus Statutory NPAT for FY 2016:
Preliminary Statutory A$ million
Prospectus Statutory A$ million
Variance A$ million
Revenue 573.8 607.4 (33.6)
Cost of Sales (484.9) (494.0) 9.1
Gross Margin 88.9 113.4 (24.5)
Other gains/(losses) (1.4) - (1.4)
Labour expenses and share based payments (37.6) (32.9) (4.7)
Repairs and maintenance (15.2) (3.5) (11.7)
Administration and other expenses (31.0) (34.4) 3.4
EBITDA 3.7 42.6 (38.9)
Depreciation and amortisation (20.8) (18.6) (2.2)
EBIT (17.1) 24.0 (41.1)
Net Interest expense (13.7) (12.7) (1.0)
Net profit/(loss) before tax (30.8) 11.3 (42.1)
Income tax benefit/(expense) 7.5 (2.3) 9.8
Net profit/(loss) after tax (23.3) 9.0 (32.3)
The Preliminary Gross Margin is below the Prospectus Gross Margin by $24.5 million due primarily to:
• Unprecedented wet winter weather in northern Australia and a continued depletion in the Australian herd size resulted in a significant tightening of supply of Australian cattle with prices reaching record highs in the second half of FY 2016. This combined with a reluctance from traditional South East Asian customers to accept further price increases significantly impacted revenue and gross margin. The impact was approximately $16.3 million;
• Actual sales volume below Prospectus forecast reduced Gross Margin by approximately $11.7 million with approximately $10.0 million due to the delay in commissioning of the MV Ocean Shearer and the impact of the twin crankshaft failures on the MV Ocean Swagman and MV Ocean Outback in FY 2016; and
• Depreciation in the Australian dollar against the United States dollar had a positive impact of approximately $3.1 million.
The Preliminary Other gains/(losses) is made up of:
• Net foreign exchange (losses) of $6.6 million; • Fair value gains on financial assets of $1.4 million; and • Net gain from change in fair value of biological assets of $3.8 million.
The Preliminary Labour expenses and share based payments is above the Prospectus Labour expenses and share based payments by $4.7 million due primarily to:
• $0.6 million payroll tax on the share based payment not included in the Prospectus figure; and • $4.0 million increase in labour costs due to a higher headcount for Brazil, Singapore and Perth.
The Preliminary Repairs and Maintenance expenses is above the Prospectus Repairs and Maintenance by $11.7 million due primarily to:
• $7.7 million for repairs arising from the twin crankshaft failures on the MV Ocean Swagman and MV Ocean Outback in FY 2016. This further impacted overall profitability by requiring the use of external vessels for several months to replace lost capacity, although both vessels successfully returned to normal operating
For
per
sona
l use
onl
y

Appendix 4E – Preliminary Final Report For the year ended 30 June 2016
Page 5
capability in the final quarter of FY 2016. Since year end an insurance claim (excluding deductibles) has been submitted to the insurer; and
• Other repairs and maintenance on the vessel fleet above forecast by $4.0 million due to the inclusion of expenses that would otherwise have been treated as operating expenses in cost of sales and bringing forward scheduled maintenance to better fit within the vessel’s port stoppage schedule.
The Preliminary Administration and Other expenses is below the Prospectus Administration and Other expenses by $ 3.4 million due primarily to:
• Unrealised/realised foreign exchange impact of $ 0.4 million; and • General reductions in admin expenses, consultants and lower IPO costs of approximately $3.0 million.
The Preliminary Depreciation and amortisation is above the Prospectus Depreciation and amortisation by $2.2 million due primarily to:
• Foreign exchange impact on depreciation of $0.6 million; and • Impairment of goodwill of $1.6 million.
The Preliminary Net Interest expense is above the Prospectus Net Interest expense by $1.0 million due primarily to:
• Foreign exchange impact on interest expense of $0.4 million; and • Increased interest cost of $0.6 million arising from earlier than forecast drawdown on debt facilities.
Reconciliation of Preliminary Statutory NPAT to Preliminary Pro forma NPAT In the Prospectus, Wellard disclosed a number of abnormal and extraordinary items in its reconciliation of forecast Statutory to Pro forma NPAT for FY 2016.
Set out below is a comparison of the Preliminary Statutory NPAT to the Preliminary Pro forma NPAT for FY 2016 for the Wellard Group:
Preliminary Statutory A$ million
Preliminary Pro forma A$ million
Pro forma adjustments
A$ million Revenue 573.8 573.8 -
Cost of Sales (484.9) (484.9) -
Gross Margin 88.9 88.9 -
Other gains/(losses) (1.4) (1.4) -
Labour expenses and share based payments (37.6) (18.9) 18.7
Repairs and maintenance (15.2) (15.2) -
Administration and other expenses (31.0) (14.7) 16.3
EBITDA 3.7 38.7 35.0
Depreciation and amortisation (20.8) (20.8) -
EBIT (17.1) 17.9 35.0
Net Interest expense (13.7) (6.1) 7.6
Net profit/(loss) before tax (30.8) 11.8 42.6
Income tax benefit/(expense) 7.5 3.0 (4.5)
Net profit/(loss) after tax (23.3) 14.8 38.1
For
per
sona
l use
onl
y

Appendix 4E – Preliminary Final Report For the year ended 30 June 2016
Page 6
Set out below are the pro forma adjustments incorporated in the reconciliation of Preliminary Statutory NPAT to the Preliminary Pro forma NPAT for FY 2016 for the Wellard Group:
A$ million Description
Preliminary Statutory NPAT (23.3)
Share based payments 18.6 One-off share issue by WGH at IPO and associated taxes to management
IPO transaction costs 8.2 One-off IPO listing costs
Debt restructuring costs 1.9 Write-off for previously recognised debt established costs due to subsequent restructuring activities undertaken in connection with the IPO
Realised FX losses on debt restructuring 6.1 Realised foreign currency losses on debt restructuring activities undertaken in connection with the IPO
Stamp duty 0.2 Stamp duty incurred on sale of subsidiaries in connection with restructuring activities as part of the IPO
Interest expense 7.6 Adjustment to reflect the net interest expense reflecting the post IPO debt profile
Tax expense (4.5) The net tax effect of the Pro forma adjustments
Pro forma adjustments 38.1
Preliminary Pro forma NPAT 14.8
Explanation of Debt and Working Capital The IPO was completed on 10 December 2015 and raised $298.9 million. These funds were utilised by Wellard as follows:
• purchase IPO subsidiaries from WGH Holdings Pty Ltd (WGH) for $188.8 million; • repay debt of $70 million; • pay JLA fees for the IPO of $8.8 million; and • working capital of $31.3 million.
Set out below is a summary of the net debt position at 30 June 2016:
$ million
Borrowings 203.5
Less: Cash and cash equivalents (31.9)
Net Debt 171.6
Net debt/(Net debt + equity) 48%
Included in total borrowings of $203.5 million is the new debt facility for MV Ocean Shearer of $79 million (U$59 million) which was finalised in the June quarter of FY 2016.
Net debt at 30 June 2016 was $171.6 million, a reduction from the previous period end of $235.6 million as a result of debt restructuring activities undertaken as part of the IPO but offset by the new debt facility for MV Ocean Shearer.
Refer to note 10 for further details about Borrowings.
For
per
sona
l use
onl
y
Appendix 4E – Preliminary Final Report For the year ended 30 June 2016
Page 7
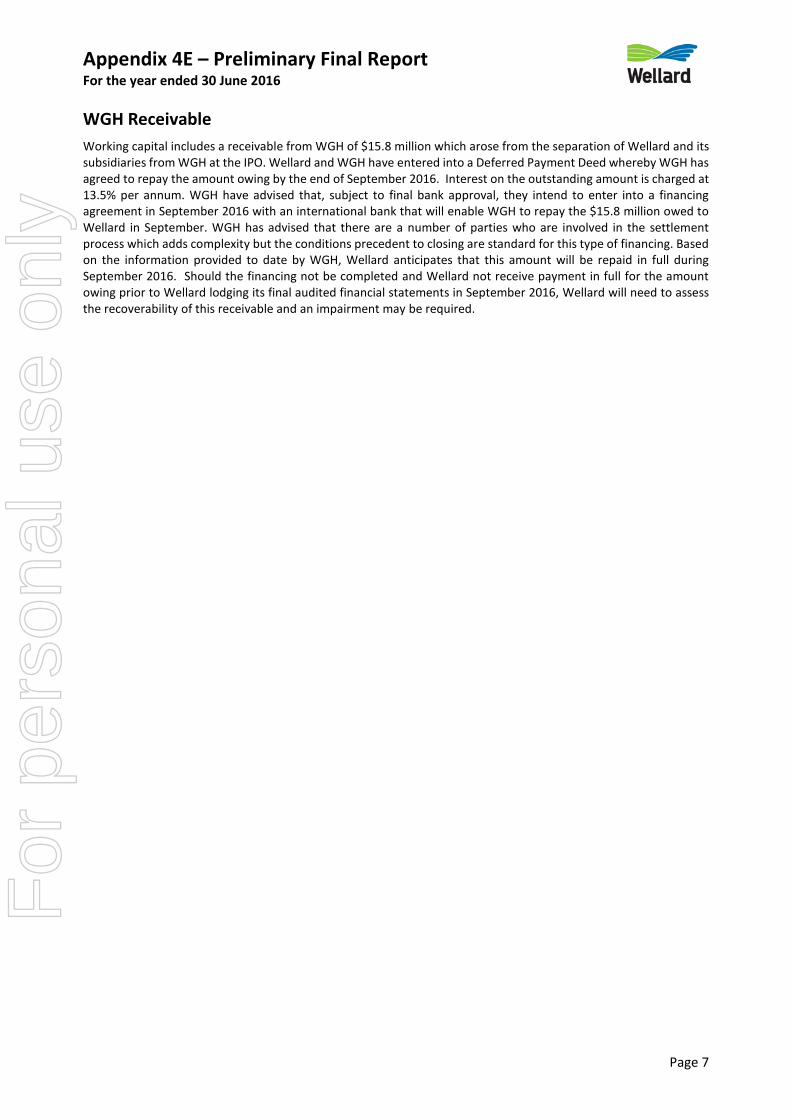
WGH Receivable
Working capital includes a receivable from WGH of $15.8 million which arose from the separation of Wellard and its subsidiaries from WGH at the IPO. Wellard and WGH have entered into a Deferred Payment Deed whereby WGH has agreed to repay the amount owing by the end of September 2016. Interest on the outstanding amount is charged at 13.5% per annum. WGH have advised that, subject to final bank approval, they intend to enter into a financing agreement in September 2016 with an international bank that will enable WGH to repay the $15.8 million owed to Wellard in September. WGH has advised that there are a number of parties who are involved in the settlement process which adds complexity but the conditions precedent to closing are standard for this type of financing. Based on the information provided to date by WGH, Wellard anticipates that this amount will be repaid in full during September 2016. Should the financing not be completed and Wellard not receive payment in full for the amount owing prior to Wellard lodging its final audited financial statements in September 2016, Wellard will need to assess the recoverability of this receivable and an impairment may be required.
For
per
sona
l use
onl
y

Appendix 4E – Preliminary Final Report For the year ended 30 June 2016
Page 8
PRELIMINARY CONSOLIDATED STATEMENT OF COMPREHENSIVE INCOME For the year ended 30 June 2016 (Appendix 4E item 3)
Note 2016 $’000
2015 $’000
Continuing Operations
Revenue 5(a) 573,773 512,106
Cost of sales 5(b) (484,874) (424,459)
Gross profit 88,899 87,647
Other gains/(losses) 5(c) (1,442) (6,348)
Finance costs 5(d) (13,718) (14,654)
Depreciation and amortisation expenses (20,789) (21,739)
Administration expenses 5(e) (16,937) (16,887)
Operating expenses 5(f) (36,265) (26,799)
Other expenses 5(g) (30,539) (3,419)
(Loss) from continuing operations before income tax (30,791) (2,199)
Income tax benefit 7 7,468 2,002
Net (loss) for the period after tax (23,323) (197)
Other comprehensive income/(loss)
Items that may be reclassified to profit or loss
(Loss)/gain from foreign currency translation (10,698) 17,308
Other comprehensive profit/(loss) for the period, net of tax (10,698) 17,308
Total comprehensive (loss)/profit for the period (34,021) 17,111
Cents
Cents
Loss per share for loss from continuing operations attributable to the ordinary equity holders of the company:
Basic loss per share 4 (6.4) (0.1)
Diluted loss per share 4 (6.4) (0.1)
The accompanying notes form an integral part of this preliminary consolidated statement of income.
For
per
sona
l use
onl
y

Appendix 4E – Preliminary Final Report For the year ended 30 June 2016
Page 9
PRELIMINARY CONSOLIDATED STATEMENT OF FINANCIAL POSITION As at 30 June 2016 (Appendix 4E item 4)
Note 2016 $'000
2015 $'000
Current Assets
Cash and cash equivalents 31,930 18,182
Trade and other receivables 70,463 228,421
Inventories 13,343 8,262
Biological assets 38,672 10,591
Derivative financial assets 1,369 -
Other assets 19,235 3,168
Total Current Assets 175,012 268,624
Non-Current Assets
Other assets 156 -
Property, plant and equipment 290,076 205,077
Intangible assets 4,562 3,125
Deferred tax assets 8,747 1,655
Total Non-Current Assets 303,541 209,857
Total Assets 478,553 478,481
Current Liabilities
Trade and other payables 59,397 85,683
Loans and borrowings 10 203,521 45,206
Provisions 1,272 948
Deferred revenue 21,104 11,188
Total Current Liabilities 285,294 143,025
Non-Current Liabilities
Loans and borrowings 10 - 208,538
Provisions 907 2,376
Deferred tax liability 3,597 338
Total Non-Current Liabilities 4,504 211,252
Total Liabilities 289,798 354,277
Net Assets 188,755 124,204
Equity
Issued capital 11 548,515 56,940
Reserves (390,251) 13,450
Retained earnings 12 30,491 53,814
Total Equity 188,755 124,204
The accompanying notes form an integral part of this preliminary consolidated statement of financial position.
For
per
sona
l use
onl
y

Appendix 4E – Preliminary Final Report For the year ended 30 June 2016
Page 10
PRELIMINARY CONSOLIDATED STATEMENT OF CHANGES IN EQUITY For the year ended 30 June 2016 (Appendix 4E item 6)
Issued Capital
Retained Earnings
Share Based
Other Reserves
Common Control
Total
$'000 $'000 $'000 $'000 $'000 $'000
Consolidated
Balance at 30 June 2014 56,940 54,011 - (3,858) - 107,093
(Loss) for the period - (197) - - (197)
Other comprehensive income - - - 17,308 - 17,308
Total comprehensive income for the period - (197) - 17,308 - 17,111
Balance at 30 June 2015 56,940 53,814 - 13,450 - 124,204
(Loss) for the period - (23,323) - - - (23,323)
Other comprehensive income - - (10,698) - (10,698)
Total comprehensive income for the period - (23,323) - (10,698) - (34,021)
Reverse existing capital resulting from restructure (56,940) - - - - (56,940)
Ordinary shares issued to existing shareholder 257,150 - - - - 257,150
Ordinary shares issued 298,850 - - - - 298,850
Costs relating to share issue net of tax (7,485) - - - - (7,485)
Share based payment reserve - - 18,014 - - 18,014
Common control reserve from restructure - - - - (411,017) (411,017)
Balance at 30 June 2016 548,515 30,491 18,014 2,752 (411,017) 188,755
The accompanying notes form an integral part of this preliminary consolidated statement of changes in equity.
Attributable to Owners
For
per
sona
l use
onl
y

Appendix 4E – Preliminary Final Report For the year ended 30 June 2016
Page 11
PRELIMINARY CONSOLIDATED STATEMENT OF CASH FLOWS
For the year ended 30 June 2016 (Appendix 4E item 5)
Note 2016 $’000
2015 $’000
Cash Flows from Operating Activities
Receipts from customers inclusive of GST 567,273 514,959
Payments to suppliers and employees inclusive of GST (571,729) (462,406)
Finance costs (15,538) (12,347)
Interest received 19 53
Income tax paid (21)
Net operating cash inflows/(outflows) 8 (19,996) 40,259
Cash Flows from Investing Activities
Proceeds from sale of property, plant & equipment 339 158
Purchase of property, plant and equipment (99,889) (34,587)
Cash advances on duties prepaid (7,624) -
Purchase of intangible assets (3,733) -
Net investing cash (outflows) (110,907) (34,429)
Cash Flows from Financing Activities
Net proceeds from issue of shares 290,028 -
Proceeds of IPO returned to former parent entity (188,228) -
Amounts received from/(paid) to related parties 96,252 (161,829)
Proceeds from borrowings 275,430 318,813
Repayments of borrowings (328,831) (154,971)
Net financing cash inflows 144,651 2,013
Net increase in cash held 13,748
7,843
Cash at the beginning of financial year 18,182 10,339
Cash at the end of financial year 31,930 18,182
The accompanying notes form an integral part of this preliminary consolidated statement of cash flow.
For
per
sona
l use
onl
y

Appendix 4E – Preliminary Final Report FOR THE YEAR ENDED 30 JUNE 2016
Page 12
SUPPLEMENTARY APPENDIX 4E INFORMATION
1. Statement of Significant Accounting Policies
This preliminary final report has been prepared in accordance with ASX Listing Rule 4.3A and the disclosure requirements of ASX Appendix 4E.
This report is to be read in conjunction with any public announcements made by Wellard Limited during the reporting period in accordance with the continuous disclosure requirements of the Corporations Act 2001 and Australian Securities Exchange Listing Rules.
The financial report, comprising the financial statements and notes of Wellard Limited and its controlled entities, complies with International Financial Reporting Standards (IFRS) as issued by the International Accounting Standards Board (IASB).
Where necessary, comparative figures have been adjusted to comply with the changes in presentation in the current period.
The principal accounting policies adopted in the preparation of the financial statements are consistent with those of the previous financial year and were set out in the report for the half-year ended 31 December 2015.
2. Going Concern
The financial statements have been prepared on the going concern basis, which contemplates the continuity of normal business activity and the realisation of assets and the settlement of liabilities in the normal course of business.
As set out in note 10, at 30 June 2016 Wellard had breached an undertaking in the working capital facility but has obtained a waiver and extension to the remedy period to 14 October 2016 before it will become an event of default. Notwithstanding that the Wellard Group was not in default with any debt facility at 30 June 2016 and no cross defaults have occurred, the application of AASB 101 to the working capital breach has meant a reclassification of borrowings of $158.9 million from non-current to current liabilities which results in a working capital deficiency of $110.3 million. In addition, it is likely that Wellard will breach certain financial covenants to be measured at 30 September 2016 and 31 December 2016 in the working capital and other secured loan facilities. Wellard has commenced discussions with the debt providers to seek either a waiver of the anticipated breaches of the financial covenants or an amendment to the financial covenants.
As set out on page 7, Wellard has a receivable owing by WGH of $15.8 million. WGH have advised that, subject to final bank approval, they intend to enter into a financing agreement in September 2016 that will enable WGH to repay the $15.8 million owed to Wellard in September. Should the financing not be completed and Wellard not receive payment in full for the amount owing prior to Wellard lodging its final audited financial statements in September 2016, this could have a material impact on its recoverable amount and Wellard’s forecast cash flows.
The Directors believe that there are reasonable grounds to believe that the use of the going concern basis remains appropriate as as there is an expectation that the Group:
• will be able to remedy the breach and the debt providers will either waive the anticipated breaches of certain financial covenants or amend the financial covenants; and
• will receive the the funds owing by WGH in September 2016.
Should Wellard or the Group be unable to achieve the matters set out above, a material uncertainty would exist that may cast significant doubt as to whether Wellard will be able to continue as a going concern and therefore, whether it will realise its assets and extinguish its liabilities in the normal course of business and at the amounts in this report.
This Preliminary Financial Report does not include adjustments relating to the recoverability and classification of recorded asset amounts, or to the amounts and classification of liabilities that might be necessary should the Wellard Group not continue as a going concern.
For
per
sona
l use
onl
y

Appendix 4E – Preliminary Final Report FOR THE YEAR ENDED 30 JUNE 2016
Page 13
3. Material factors affecting the Economic Entity for the Current Period
Refer to the Announcement to the Market attached and the following notes for discussion of the nature and amount of material items affecting revenue, expenses, assets, liabilities, equity or cash flows, where their disclosure is relevant in explaining the financial performance or position of the entity for the period.
4. Earnings per share (Appendix 4E item 14.1)
2016 Cents
2015 Cents
(a) Basic (Loss) Per Share
From continuing operations attributable to the ordinary equity holders of the company
(6.4) (0.1)
(b) Diluted (Loss) Per Share
From continuing operations attributable to the ordinary equity holders of the company
(6.4) (0.1)
2016 Number
2015 Number
Weighted average number of ordinary shares used as the denominator 364,121,889 320,415,827
Recognition and Measurement
Basic earnings per share is calculated by dividing:
• The profit attributable to the owners of the company, excluding any costs of servicing equity other than ordinary shares,
by
• The weighted average number of ordinary shares outstanding during the financial year, adjusted for bonus elements in ordinary shares issued during the year and excluding treasury shares.
Diluted earnings per share
Diluted earnings per share adjusts the figures used in the determination of basic earnings per share to take into account:
• The after income tax effect of interest and other financial costs associated with dilutive potential ordinary shares, and
• The weighted average number of additional ordinary shares that would have been outstanding assuming the conversion of all potential ordinary shares.
The number of ordinary shares outstanding has been adjusted retrospectively back to 1 July 2014 for the capital reconstruction, which occurred on 11 December 2015, as described in note 9. The comparative EPS balances have been recalculated accordingly.
For
per
sona
l use
onl
y
Appendix 4E – Preliminary Final Report FOR THE YEAR ENDED 30 JUNE 2016
Page 14
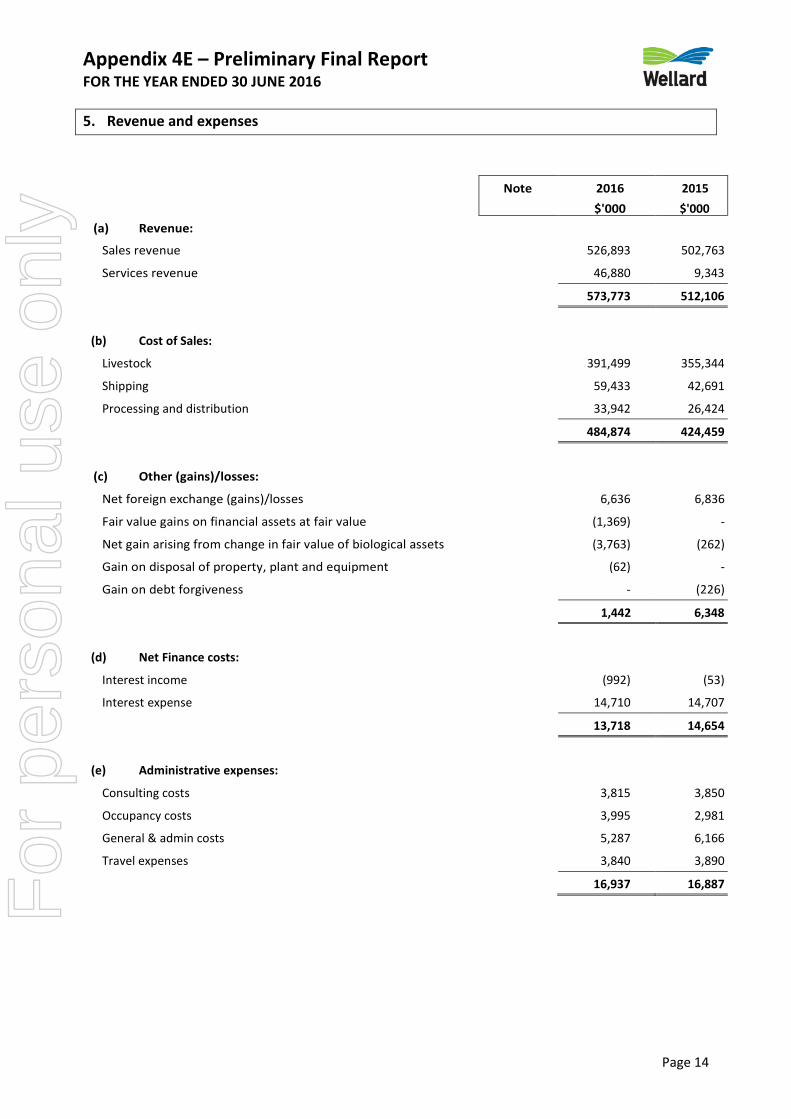
5. Revenue and expenses
Note 2016 $'000
2015 $'000
(a) Revenue:
Sales revenue 526,893 502,763
Services revenue 46,880 9,343
573,773 512,106
(b) Cost of Sales:
Livestock 391,499 355,344
Shipping 59,433 42,691
Processing and distribution 33,942 26,424
484,874 424,459
(c) Other (gains)/losses:
Net foreign exchange (gains)/losses 6,636 6,836
Fair value gains on financial assets at fair value (1,369) -
Net gain arising from change in fair value of biological assets (3,763) (262)
Gain on disposal of property, plant and equipment (62) -
Gain on debt forgiveness - (226)
1,442 6,348
(d) Net Finance costs:
Interest income (992) (53)
Interest expense 14,710 14,707
13,718 14,654
(e) Administrative expenses:
Consulting costs 3,815 3,850
Occupancy costs 3,995 2,981
General & admin costs 5,287 6,166
Travel expenses 3,840 3,890
16,937 16,887
For
per
sona
l use
onl
y

Appendix 4E – Preliminary Final Report FOR THE YEAR ENDED 30 JUNE 2016
Page 15
Note 2016 $'000
2015 $'000
(f) Operating expenses:
Bad and doubtful debts expense 1,524 3,194
Labour expense 4(h) 18,884 16,503
Motor vehicle expenses 677 748
Repairs & maintenance 15,180 6,354
36,265 26,799
(g) Other expenses: Restructuring costs 1,736 2,009
IPO transaction costs 7,474 -
Share based payment expense 18,644 -
Loan establishment costs 2,643 368
Loss on disposal of property, plant and equipment 42 1
Loss arising from write down of inventories - 1,041
30,539 3,419
(h) Labour expenses: Wages and salaries 14,841 13,302
Employee entitlements and on costs 1,925 1,740
Superannuation 895 824
Payroll tax 1,223 637
18,884 16,503
For
per
sona
l use
onl
y

Appendix 4E – Preliminary Final Report FOR THE YEAR ENDED 30 JUNE 2016
Page 16
6. Segment Information (Appendix 4E item 14.4)
The Group’s management has considered the reportable segments in which the Group will report in this financial statement and in the future.
As a result of this process, Wellard’s management has determined that Livestock Marketing, Export and Transportation represents the only reportable segment, including the marketing and export of cattle and sheep. These export activities have similar production and distribution channels, similar products and similar end customers, and as such aggregated and classified as one segment. Processed Meat Marketing & Export and Corporate Services are not considered to be reportable operating segments, and have been presented in an ‘other segments’ column.
These classifications are in accordance with AASB 8 guidelines.
Description of segments and principal activities
1. Livestock Marketing, Export and Transportation: This segment is engaged in the business of buying livestock from multiple sources for export to international markets and includes all the logistics and transport required to supply livestock to its customers.
2. Other Segments: This segment consists of Processing and Distribution as well as Corporate Services. Processing and Distribution is in the business of operating abattoirs as well as marketing of processed meat for export to international markets. The processed meat is sourced from the Beaufort River Meats abattoir, which is owned and operated by the Group, or procured from external suppliers. Corporate Services consists of a centralised support function which provides specialised services across several disciplines to the rest of the Group, including Human Resources, Finance and Payroll, Information Technology and Communication, Legal Services and the Board of Directors.
Management primarily uses a measure of earnings before interest, tax, depreciation and amortisation and non-recurring expenses ("EBITDA", see below) to assess the performance of the operating segments. However, management also receives financial information about segment revenue, interest expense, assets and liabilities on a monthly basis.
EBITDA
EBITDA excludes the effects of significant items of income and expenditure which may have an impact on the quality of the earnings such as restructuring costs, transactions costs relating to the IPO, and other non-recurring expenditure. It also excludes the effects of equity-settled share-based payments and unrealised foreign exchange gains and losses.
2016 2015
$'000 $'000
Revenue
Livestock Marketing and Export 535,880 482,621
Other Segments 37,893 29,485
573,773 512,106
EBITDA (see page 4 for reconciliation) Livestock Marketing and Export 35,761 35,871
Other Segments (32,051) (1,677)
3,710 34,194
For
per
sona
l use
onl
y

Appendix 4E – Preliminary Final Report FOR THE YEAR ENDED 30 JUNE 2016
Page 17
Geographical Information
Wellard operates in several geographical locations around the world spanning multiple continents for both procurement and sales of livestock.
External Revenues based on the origin Country of sale are as follows:
2016 2015
$'000 $'000
Australia 483,063 503,517
Singapore 40,676 7,995
Uruguay 37,540 -
Brazil 12,494 594
573,773 512,106
The non-current assets of the Group are located across the following locations:
2016 2015
$'000 $'000
Singapore 281,542 196,990
Australia 16,397 10,542
Brazil 660 653
Other 56 18
298,655 208,203
For
per
sona
l use
onl
y

Appendix 4E – Preliminary Final Report FOR THE YEAR ENDED 30 JUNE 2016
Page 18
7. Reconciliation of Income Tax expense/(benefit)
2016 $'000
2015 $'000
(a) Income tax (benefit)
Major components of income tax expense are:
Current tax (8,478) 1,259
Deferred tax 1,010 (1,369)
Prior year losses not previously brought to account - (1,892)
Income tax (benefit) reported in the income statement (7,468) (2,002)
(b) Numerical reconciliation
The prima facie tax on loss from ordinary activities before income tax is reconciled to the income tax as follows:
Prima facie tax payable on loss from ordinary activities before income tax at 30% (2015: 30%)
(9,236)
(659)
Add/(less) tax effect of: Other assessable items
Attributable foreign income 2,266 - Under provision for income tax in prior year - (1,891) Impairment of goodwill 486 Other non-allowable items 3,804 - Shared based payment 5,832 283 Transfer pricing adjustment 677 - IPO costs 1,196 -
5,025 (2,267) Less:
Tax effect of:
Other non-assessable items (1) 3
Effect of different rates of tax on overseas profit 12,494 (268)
12,493 (265)
Income tax (benefit) attributable to entity (7,468) (2,002)
For
per
sona
l use
onl
y

Appendix 4E – Preliminary Final Report FOR THE YEAR ENDED 30 JUNE 2016
Page 19
8. Reconciliation of Net Loss after Tax to cash flows from Operating activities (Appendix 4E item 5)
2016 2015
$'000 $'000
Reconciliation of net profit after tax to net cash flows from operations:
(Loss) after tax (23,323) (197)
(a) Non cash flows in profit:
Depreciation & amortisation 20,789 21,739
Income tax benefit (7,468) (2,002)
Non-controlling interest - 7
Bad and doubtful debts 1,523 2,968
Net loss/(gain) on disposal of property, plant and equipment (20) -
Net loss/(gain) on fair value of derivative (1,369) 1
Share based payments expenses 18,014 -
Change in fair value of inventories and biological assets (3,763) (211)
Asset write down - 1,041
Realised foreign exchange losses on loans 12,861 -
Unrealised foreign exchange (gains)/losses (5,796) 4,748
(b) Changes in assets and liabilities, net of the effects of purchase and
of subsidiaries
Change in trade and other receivables (158,125) 2,854
Change in trade and other receivables due to related parties 158,285 -
Change in inventories and biological assets (33,161) (327)
Change in other current assets (16,223) (1,676)
Change in other current assets due to related parties 3,865 -
Change in income tax receivable (253) 78
Change in net deferred tax assets/liabilities 2,175 (1,369) Change in trade and other payables (26,286) 12,446
Change in trade and other payables due to related parties 29,509 -
Change in deferred revenue 9,916 -
Change in provisions (1,146) 159
(19,996) 40,259
For
per
sona
l use
onl
y

Appendix 4E – Preliminary Final Report FOR THE YEAR ENDED 30 JUNE 2016
Page 20
9. Business Combinations (Appendix 4E item 10 and 11)
During the year, a restructure took place in preparation for the listing of the Group on the ASX. This resulted in a newly incorporated company, Wellard Limited, raising equity on the ASX to fund the purchase of several entities within the WGH (previously Wellard Group Holdings Pty Ltd) business that have previously operated together as a business.
The Directors elected to account for the restructure as a capital re-organisation rather than a business combination. In the Directors’ judgment, the continuation of the existing accounting values are consistent with the accounting that would have occurred if the assets and liabilities had already been in a structure suitable to IPO and most appropriately reflects the substance of the restructure.
As such, the consolidated financial statements of Wellard have been presented as a continuation of the pre-existing accounting values of assets and liabilities of the entities acquired as a result of the IPO process. Those entities being:
• Wellard Rural Exports Pty Ltd • Wellard Animal Processing Pty Ltd • Wellard Feeds Pty Ltd • Wellard NZ Ltd • Wellard Ships Pte Ltd • Wellard Singapore Pte Ltd • Ocean Drover Pte Ltd • Niuyang Express Pte Ltd • Wellard do Brasil Agronegocios Ltda
The Directors believe that this presentation is consistent with that of other similar IPO transactions in the Australian market. The international accounting standard setters (International Accounting Standards Board) may review accounting for common control transactions. If any changes are made and are required to be applied retrospectively, there remains the risk that the accounting treatment may need to be amended from that currently adopted. Acquisition accounting would require Wellard’s identifiable assets and liabilities to be fair valued by the new parent at the acquisition date in accordance with AASB 3 Business Combinations.
If the accounting treatment selected by the Directors had been acquisition accounting, the impact of the acquisition cannot be accurately determined at this time, as a formal purchase price allocation has not been carried out. Nevertheless, it would likely result in a material increase in:
• property, plant and equipment due to potential uplift to fair value and subsequent increased depreciation. • intangible asset balances and subsequent amortisation charges in the consolidated income statements
of the Group; and • goodwill balances and the resulting potential risk and quantum of goodwill impairment charges in future
periods.
The balance of any increase in net assets would be recorded as goodwill and not subject to amortisation. In addition, tax accounting is also likely to be materially different as a result of acquisition value accounting. The impact of acquisition accounting, should this subsequently be required by the IASB, is non-cash in nature and will not impact future cash flows. In addition, acquisition accounting in the consolidated financial statements of the Company should not impact the ability of the Group to pay future dividends, as the overall financial position of the parent entity, the Company, will be the determinant of whether or not dividends are able to be paid in future financial periods.
In addition to the purchase price, as the above entities were exiting the WGH consolidated group, repayments of intercompany loans were facilitated.
For
per
sona
l use
onl
y

Appendix 4E – Preliminary Final Report FOR THE YEAR ENDED 30 JUNE 2016
Page 21
Interests held in controlled entities is set out below:
Country of Percentage Owned incorporation 2016 2015
Parent Entity:
Wellard Limited Australia
Subsidiaries of Wellard Ltd:
Wellard Feeds Pty Ltd Australia 100 100
Wellard Rural Exports Pty Ltd Australia 100 100
Wellard Animal Production Pty Ltd Australia 100 100
Wellard NZ Ltd New Zealand 100 100
Wellard Ships Pte Ltd Singapore 100 100
Wellard Singapore Pte Ltd Singapore 100 -
Ocean Drover Pte Ltd Singapore 100 100
Ocean Shearer Pte Ltd Singapore 100 -
Niuyang Express Pte Ltd Singapore 100 100
Welltech Marine Pte Ltd Singapore 100 -
Wellard do Brasil Agronegocios Ltda Brazil 100 100
Portimor SA Uruguay 100 -
Wellana Uluslararasi Hayvancilik Anonim Sirketi Turkey 50 -
For
per
sona
l use
onl
y

Appendix 4E – Preliminary Final Report FOR THE YEAR ENDED 30 JUNE 2016
Page 22
10. Loans and Borrowings
Note 2016 $'000
2015 $'000
Current
Bank loans - secured 128,685 26,784
Finance leases - secured 69,963 10,430
Trade finance - unsecured 287 37
Other loans - unsecured 4,586 7,955
203,521 45,206
Non-current
Bank loans - secured - 139,509
Finance Leases - secured - 69,029
- 208,538
Total Current and Non-Current 203,521 253,744
Bank loans consist of an overdraft facility and three separate vessel finance agreements from financiers. The overdraft working capital facility is secured by a security interest to be granted by the Group over all of its acquired property. As at 30 June 2016, $40,000,000 of the working capital facility is undrawn. The vessel finance agreements are secured by the carrying amount of its pledged assets.
At 30 June 2016, the Group has finance lease arrangements, structured as sale and leaseback agreements. The finance lease arrangements are secured by the carrying amounts of its pledged assets. At various stages throughout the lease term, the Group will be entitled to buy back the vessels for an agreed price. The agreed purchase price reduces over the term of the lease. The Group is obliged to buy back both of the vessels for an agreed price at the expiry of the lease. The sale and leaseback agreements also include other terms such as undertakings, prepayment and events of default typical for agreements of this nature. Any breach of these undertaking or representations, or occurrence of the events of default, may lead to the cancellation of the sale and leaseback agreements, and either immediate re-delivery to the financier, or the balance of all lease and buy-back payments falling due and payable.
As at 30 June 2016 Wellard had breached an undertaking in the working capital facility but has obtained a waiver and extension to the remedy period to 14 October 2016 before it will become an event of default. The Wellard Group was not in breach or default with any other debt facility at 30 June 2016 and no cross defaults have occurred.
In addition, it is likely that Wellard will breach certain financial covenants to be measured at 30 September 2016 and 31 December 2016 in the working capital and other secured loan facilities. Wellard has commenced discussions with the debt providers to seek either a waiver of the anticipated breaches of the financial covenants or an amendment to the financial covenants.
Pursuant to AASB 101, as a consequence of the breach under the working capital facility at 30 June 2016, as Wellard did not have an unconditional right to defer settlement of amounts owing under the working capital facility for at least 12 months from 30 June 2016, all Bank Loans and Finance Leases have been disclosed as current liabilities as a cross default will occur under the other facilities if the breach is not remdied by 14 October 2016. As a consequence, the total value of Bank Loans and Finance Leases that have been included as current Borrowings is $158.9 million. F
or p
erso
nal u
se o
nly

Appendix 4E – Preliminary Final Report FOR THE YEAR ENDED 30 JUNE 2016
Page 23
11. Contributed Equity
2016 $'000
2015 $'000
Issued Capital
At beginning of reporting period 56,940 56,940
Restructure of Group:
Reverse existing capital resulting from restructure (56,940) -
Ordinary shares issued to existing shareholder 257,150 -
Ordinary shares issued 298,850 -
Costs related to issuing securities net of tax effect (7,485) -
At the end of reporting period 548,515 56,940
The Group has authorised share capital amounting to 400,000,000 ordinary shares issued and fully paid.
Movements in ordinary shares:
2016 2015
'000 '000 At the beginning of reporting period - -
Shares issued during year 400,000 -
At the end of reporting period 400,000 -
Terms and Conditions
Issued share capital consists of ordinary shares with equal voting rights.
Wellard Limited was registered in Western Australia on 10 September 2015 with 1,000 Shares being issued to WGH (999 Shares) and Camuna Pte Ltd (1 Share).
The following shares were issued during the 2016 Financial Year:
a) 215,000,000 Shares on 14 December 2015 to subscribers under Wellard’s IPO;
b) 159,999,000 Shares on 14 December 2015 to WGH in consideration for the transfer of the Wellard business and associated subsidiaries. 13,680,000 of these Shares were immediately transferred to current and past employees, consultants and others not part of the Wellard Group as a one-off IPO bonus. This bonus was provided by WGH, not Wellard, and the amount of the bonus provided to each participant was determined by WGH; and
c) 25,000,000 Shares on 14 December 2015 to Standard Chartered Private Equity Limited (SCPEL). The Shares issued to SCPEL formed part of the purchase price payable to WGH in relation to the purchase of the Wellard business, which were issued in part satisfaction of pre-existing obligations owed to SCPEL by WGH.
For
per
sona
l use
onl
y

Appendix 4E – Preliminary Final Report FOR THE YEAR ENDED 30 JUNE 2016
Page 24
12. Retained Earnings (Appendix 4E item 6)
2016 2015
$'000 $'000
Retained profit at the beginning of the year 53,814 54,011
Net (loss) (23,323) (197)
Dividends paid - -
Balance at the end of the year 30,491 53,814
13. Net Tangible Asset backing (Appendix 4E item 9)
30 June 2016 cps
30 June 2015 cps
Net tangible assets per share 49.2 37.4
14. Events after the balance date
Other than as set out elsewhere in this Preliminary Final Report, since the end of the financial year:
• Australian conditions remain weak as a result of the continued tightening of supply of Australian cattle. Cattle prices reached record highs in the second half of FY 2016. This combined with a reluctance from traditional South East Asian customers to accept further price increases continues to impact revenue and gross margin. Wellard has focused its attention on sourcing cattle in South America;
• Wellard has entered into a revised agreement to delay the delivery of the MV Ocean Kelpie to the third quarter of 2018 and changed the payment schedule to match the new delivery timetable;
• The Wellard Group has submitted its insurance claim (excluding deductibles) for the cost of repairs arising from the twin crankshaft failures on the MV Ocean Swagman and MV Ocean Outback during FY 2016; and
• Ms Sharon Warburton resigned as a non-executive Director of Wellard on 26 August 2016.
No other matters or circumstances have arisen since the end of the financial year which significantly affected or may significantly affect the operations of the Group, the results of these operations, or the state of affairs of the Group in future financial years.
15. Significant features of Operating Performance (Appendix 4E item 14.3)
Please refer to the Announcement to the Market.
For
per
sona
l use
onl
y

Appendix 4E – Preliminary Final Report FOR THE YEAR ENDED 30 JUNE 2016
Page 25
16. Trends in performance (Appendix 4E item 14.5)
Please refer to the Announcement to the Market.
17. Other factors that affected results in the Period or which are likely to affect results in the future (Appendix 4E item 14.6)
Please see below in addition to the Announcement to the Market.
Wellard’s ability to service the demand for cattle highlights the mobile nature of its assets which can be deployed to supply areas where demand is highest. In FY 2016 Wellard increased its shipping capacity by taking delivery of a fifth vessel, the MV Ocean Shearer, in May 2016. Wellard also commenced construction of sixth custom build livestock carrying vessel, the MV Ocean Kelpie, which is scheduled for completion in the third quarter of 2018. In addition, Wellard acquired parcels of land in Livingston, Northern Territory, and Condah, Victoria on which it plans to develop its own pre export quarantine facilities within the vicinity of the key Darwin and Portland ports.
Wellard has grown its international footprint in particular in South America, sourcing large numbers of livestock to diversify its sourcing partners and to satisfy demand in customer markets where geography and price makes this region preferable to fill the demand that exceeds local production. The potential introduction of live export protocols for South America with Wellard’s traditional South East Asian customer markets later in the year will further increase Wellard’s commitment to its South American supply base and allow Wellard to take advantage of the large size of its ships that are more efficient on long haul.
Wellard will also look to shortly re-commence supplying Sri Lanka with Australian dairy cattle under a contract with the Sri Lankan government.
Wellard has also secured and will continue to secure, profitable external charter when capacity availability allows, so that it can maximize the fleet utilization and maintain relations with existing customers.
Wellard is subject to risk factors that are both:
• specific to its business activities, including risks associated with its marketing and export activities, its shipping activities, political and regulatory risks and operational and financing risks; and
• of a more general nature, applicable to many listed companies and to the ownership of shares.
The material business risks faced by the Wellard Group that are likely to have an effect on the prospects of the Wellard Group are set out in the Prospectus. Each of the risks set out in the Prospectus could, in isolation or in combination, if they eventuate, have a material adverse impact on Wellard’s business, results of operations, financial condition, financial performance, prospects and share price. The selection of risks in the Prospectus was based on an assessment of a combination of the probability of the risk occurring and the impact of the risk if it did occur. The assessment was based on the knowledge of the Directors as at the Prospectus date, but there is no guarantee or assurance that the importance of risks will not change or other risks will not emerge. The risks set out in the Prospectus do not purport to list every risk that may be associated with an investment in Wellard shares now or in the future, and that the occurrence or consequences of some of the risks described in the Prospectus are partially or completely outside the control of Wellard, its Directors and management
For
per
sona
l use
onl
y