Appendix 4D 31Dec17 2016 Total Revenue 5.9% 856.5 808.7 Profit for the period after tax 4.7% 22.1...
36
Primary Health Care Limited Appendix 4D – Half-Year Report For the Half-Year ended 31 December 2017 SECTION PAGE Results for announcement to the market 4D - 1 Attachment A – 31 December 2017 Interim Financial Report 4D - 2 This half-year report should be read in conjunction with the 30 June 2017 annual financial report of Primary Health Care Limited. For personal use only
Transcript of Appendix 4D 31Dec17 2016 Total Revenue 5.9% 856.5 808.7 Profit for the period after tax 4.7% 22.1...
Primary Health Care Limited Appendix 4D – Half-Year Report For the Half-Year ended 31 December 2017
SECTION PAGE Results for announcement to the market 4D - 1 Attachment A – 31 December 2017 Interim Financial Report 4D - 2
This half-year report should be read in conjunction with the 30 June 2017 annual financial report of Primary Health Care Limited.
For
per
sona
l use
onl
y

Primary Health Care Limited Appendix 4D – Half-Year Report Results for announcement to the market For the Half-Year ended 31 December 2017
Page 4D - 1
2017 2016
Earnings per share ¢ per share ¢ per share
Basic and diluted earnings per share 4.2 4.0
Interim dividend 2, 3 5.1 4.8
1 Underlying profit excludes the impact of restructuring and strategic initiatives and non-recurring items. A full reconciliation between statutory profit and underlying profit is contained in the review of operations on page 10 of the Primary Health Care Limited interim financial report for the period ended 31 December 2017. 2 The 31 December 2017 Interim Dividend will be 100% franked at the corporate income tax rate (2016:100% franked at the corporate income tax rate). 3 The record date for determining entitlement to the interim dividend is 19 March 2018 and the dividend is payable on 27 March 2018.
$m %
Change
31 December
2017 Total
31 December
2016Total
Revenue 5.9% 856.5 808.7
Profit for the period after tax 4.7% 22.1 21.1
Profit attributable to members of the parent entity 4.7% 22.1 21.1
Underlying profit for the period after tax 1 5.0% 44.0 41.9
For
per
sona
l use
onl
y

Primary Health Care Limited Appendix 4D – Half-Year Report
Attachment A – Interim Financial Report For the Half-Year ended 31 December 2017
Page 4D - 2
CONTENTS PAGE Directors’ report 1 Review of operations 3 Auditor’s independence declaration 13 Independent auditor’s review report 14 Directors’ declaration 16 Condensed consolidated statement of profit or loss 17 Condensed consolidated statement of comprehensive income 18 Condensed consolidated statement of financial position 19 Condensed consolidated statement of changes in equity 20 Condensed consolidated cash flow statement 21 Notes to the consolidated financial statements 22
For
per
sona
l use
onl
y

Directors’ report For the Half-Year ended 31 December 2017
Primary Health Care Limited Appendix 4D – Half-Year Report December 2017 1
Your Directors present their report on the consolidated entity consisting of Primary Health Care Limited and the entities it controlled (referred to as “Primary”, “the Company”, or “the Group”) at the end of, or during, the half-year ended 31 December 2017. Directors The Directors of Primary during the half-year ended 31 December 2017 and up to the date of this report were: Mr Robert Ferguson Mr Brian Ball (retired 23 November 2017) Mr Gordon Davis Mr Robert Hubbard Dr Paul Jones Dr Errol Katz Dr Malcolm Parmenter (appointed 6 September 2017) Ms Arlene Tansey
Review of operations A review of operations of the Group during the half-year ended 31 December 2017, and the results of those operations, can be found on pages 3 to 12 of this Report. Subsequent event In December 2017 Imaging announced the acquisition of Brisbane Private Imaging. The transaction completed in January 2018 and the acquisition will be recognised by the Group in January 2018. Other than the above acquisition, there has not been any other matter or circumstance that has arisen since the end of the period that has significantly affected, the operations of the Group, the results of those operations, or the state of the affairs of the Group’s future financial periods. Dividend In respect of the half-year ended 31 December 2017, an interim dividend of 5.1 cents per share has been declared, 100% franked (31 December 2016: 4.8 cents per share, 100% franked). Non-IFRS Financial Information The review of operations attached to and forming part of this Directors’ Report includes a number of non-IFRS financial measures. These non-IFRS financial measures are used internally by management to assess the performance of Primary’s business and make decisions on the allocation of resources. The Directors have included the additional line item EBITDA (earnings before interest, tax, depreciation and amortisation) and EBIT (earnings before interest and tax) within the Financial Report as such presentation is necessary, in the Directors’ view, to be relevant to a full understanding of the Group’s financial performance. Rounding off of amounts Primary is an entity of the kind referred to in ASIC Corporations (Rounding in Financials/Directors’ Reports) Instrument 2016/191, dated 24 March 2016, and in accordance with that Corporations Instrument amounts in the Directors’ Report and the half-year financial report are rounded off to the nearest hundred thousand dollars, unless otherwise indicated. Auditor’s independence declaration The Auditor’s Independence Declaration is set out on page 13. F
or p
erso
nal u
se o
nly

Directors’ report For the Half-Year ended 31 December 2017
Primary Health Care Limited Appendix 4D – Half-Year Report December 2017 2
Signed in accordance with a resolution of the Directors made pursuant to s.306(3) of the Corporations Act 2001. On behalf of the Directors
Malcolm Parmenter Managing Director & Chief Executive Officer Sydney 16 February 2018
For
per
sona
l use
onl
y

Review of Operations For the Half-Year ended 31 December 2017
Primary Health Care Limited Appendix 4D – Half-Year Report December 2017 3
The results for Primary Health Care (“Primary”) for the six months ended 31 December 2017 (“1H 2018”) are set out in this review of operations compared to the six months ended 31 December 2016 (“1H 2017”).
KEY HIGHLIGHTS
Primary has solid building blocks for the future in its people, culture and unique footprint of assets An experienced executive leadership team is in place to lead the company forward Primary has initiatives underway in all divisions to deliver profitable growth. In Medical Centres a new strategic
initiative, Project Leapfrog, aims to evolve the operating model Revenue for 1H 2018 was up 5.9% and Underlying NPAT was up 5.0% Pathology’s revenue was up 5.8% and EBIT 3.1%, with its Approved Collection Centre (ACC) costs increasing
at a lower rate than revenue as a result of disciplined rental negotiations Imaging’s revenue was up 10.1% and EBIT 14.7%, underpinned by its strategy to focus on the hospital sector,
Primary medical centres and high-end specialised imaging sites Free cash flow was nearly double 1H 2017
EXECUTIVE SUMMARY
Year ended $M
31 December2017
31 December 2016
31 December 2017
31 December 2016
Performance Underlying 1 Reported
Revenue 856.5 808.7 856.5 808.7 EBIT 81.3 81.9 61.6 61.1 NPAT 44.0 41.9 22.1 21.1 Dividend cps 5.1 4.8 As at $M
31 December 2017
31 December 2016
Financial position Free cash flow 2 45.7 23.9
Group performance Primary's revenue for 1H 2018 was up 5.9% and underlying NPAT was up 5.0%. Improved EBIT contributions from Pathology, Imaging and corporate offset a decline in Medical Centres where
an evolution of the model has a new strategic focus under Project Leapfrog. EBIT increased 3.8% adjusting for the impact of both Health & Co and Primary’s new greenfield centres which
are in ramp-up. This reflects the high level of new sites coming online in FY 2018 3. Free cash flow2 improved from $23.9 million to $45.7 million mainly through reduced capital expenditure, lower
tax payments and lower interest costs. This enabled the group to fund its restructuring and strategic initiatives and dividend requirements while improving its net debt position.
Primary’s reported results include $19.7 million of non-underlying items which relate to current restructuring and investment in strategic initiatives.
An interim dividend of 5.1 cps, 100% franked, has been approved, representing a payout ratio of 60% of Underlying NPAT.
Divisional performance and strategic initiatives Pathology, Primary’s largest division, delivered revenue growth of 5.8%. Importantly, its EBIT contribution
increased by 3.1% in 1H 2018 with its Approved Collection Centre (“ACC”) costs increasing at a lower rate than revenue as a result of disciplined rental negotiations.
Top-line diversification and growth, on-going ACC optimisation and infrastructure upgrades remain core initiatives in Pathology.
1 Underlying performance reflects Primary’s core trading performance. In 1H 2018 it excludes the impact of costs associated with
business restructuring and strategic initiatives, and non-recurring items. Refer section titled “Reconciliation of reported and underlying performance”.
2 Free Cash Flow is defined as operating less investing cash flow before capital recycling inflows. Refer section titled “Cash Flow”. 3 This adjusts for three-year ramp-up costs of greenfield sites and the start-up costs in Health & Co. Refer section titled “Greenfield
sites”.
For
per
sona
l use
onl
y
Review of Operations For the Half-Year ended 31 December 2017
Primary Health Care Limited Appendix 4D – Half-Year Report December 2017 4
Primary Medical Centres underlying EBIT was down $4.9 million, or $2.6 million after adjusting for the greenfield centres coming online. The division is just over half way through a five-year program to transition GPs onto different contract models following the ATO ruling in 2015. During the period, GP recruitment remained ahead of 1H 2017 and retention was on par with industry norms.
Additional investments were made around recruiting and supporting GPs, and expanding consumer service offerings.
Significantly, new strategic initiatives focus on improving GP numbers and productivity. These are underpinned by Project Leapfrog which aims to evolve the operating model through introducing appointments and other work practices that benefit consumers and GPs, offering a diversification of services, and driving operational efficiencies at a clinic level through modernisation and digitisation.
Health & Co recorded a loss of $2.5 million reflecting the ramp-up of capabilities in this division as it committed to a more ambitious M&A program to deliver a meaningful footprint of GP clinics.
Imaging reported another strong EBIT performance increasing by 14.7%, underpinned by its strategy to focus on the hospital sector, Primary medical centres and high-end specialised imaging sites.
Imaging’s strategic focus on the hospital channel drove the acquisition of Brisbane Private Imaging in the period. The Northern Beaches Hospital contract is seen as a core step in improving the division’s brand, while investment in a new information and picture communication system (“iCAR”) will deliver better services to referrers.
Group strategy Primary aims to improve people’s health and wellbeing through a commitment to excellence in consumer-
centered care. The Group is developing its purpose, mission and values statements and a review of branding will follow to better align the brand to the current strategic initiatives.
Primary has solid building blocks for the future in its people, culture, and unique footprint of assets including large-scale clinics.
Primary has a number of initiatives underway in all divisions to deliver profitable growth. Investment in top-line growth strategies and capabilities, improvement in healthcare practitioner (HCP) and employee engagement, and better integration of services under a whole-of-Primary approach remain priorities across the divisions.
Specifically in Medical Centres a major strategic initiative, Project Leapfrog, aims to evolve the operating model into one where Primary is the preferred place for GPs to work and where care is delivered when, where and how consumers want it.
As the country enters a period of significant change in healthcare, with technology increasingly enabling people to better manage their health and access services, Primary aims to be at the forefront of this change, with an enhanced digital presence, tools and marketing. Investment in the key platforms in Medical Centres and Imaging are due for completion over the next two years, while Pathology is reviewing a new laboratory information system with a 3-5 year implementation horizon. Investment is also being undertaken to modernise support functions.
Outlook The policy settings in the short-term are positive but funding pressures will remain for the industry and Primary
will continue to drive diversification, targeting mixed billing, specialty Pathology services and national contracts with Government and major partners.
Australia is at an important juncture in the delivery of healthcare services. Increasingly, the drivers of cost, convenience and technology will see a shift in consumer demands for better ways to access care.
Primary aims to influence policy debate and to lead the change in healthcare delivery. In Medical Centres, new strategies will create a substantial shift in the value proposition and put Primary at
the forefront of the industry, with a Workplace of Choice environment, attracting broader demographic of GP, while consumers will encounter an enhanced range of services.
Primary considers this change process will take time to come to fruition but will deliver substantial benefits.
FY 2018 Guidance Primary confirmed its Underlying NPAT guidance of $92 million to $97 million for FY 2018.
F
or p
erso
nal u
se o
nly
Review of Operations For the Half-Year ended 31 December 2017
Primary Health Care Limited Appendix 4D – Half-Year Report December 2017 5
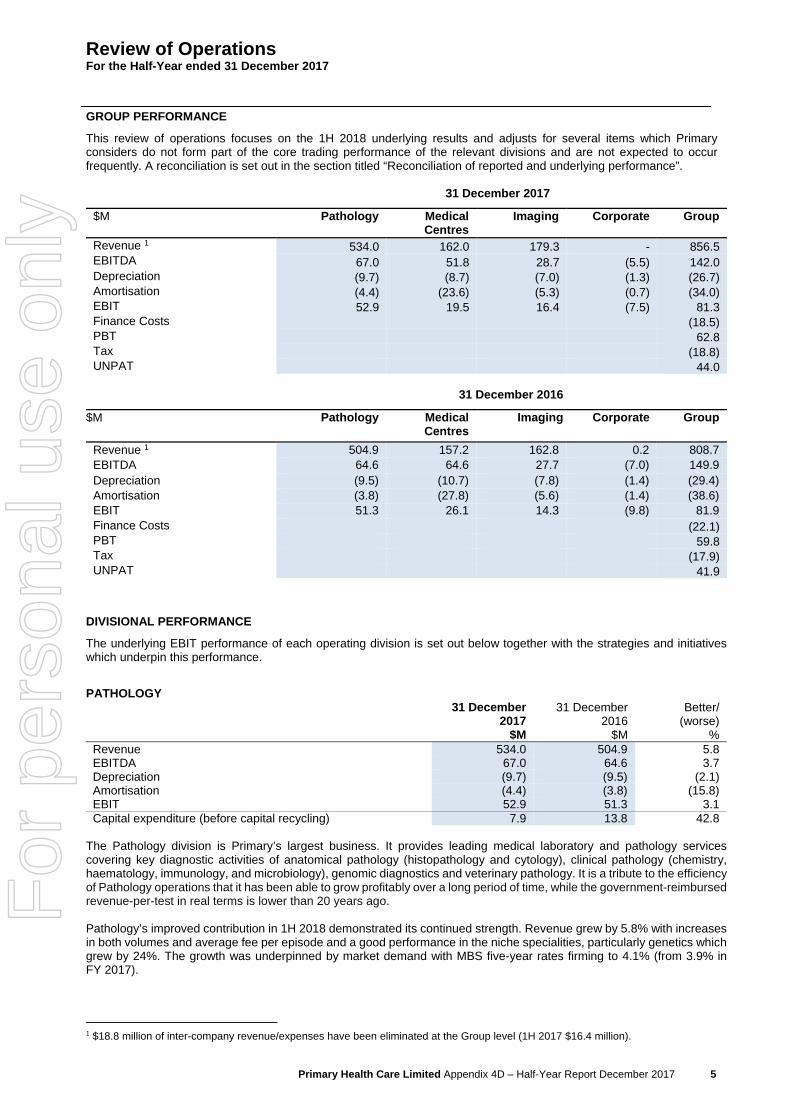
GROUP PERFORMANCE
This review of operations focuses on the 1H 2018 underlying results and adjusts for several items which Primary considers do not form part of the core trading performance of the relevant divisions and are not expected to occur frequently. A reconciliation is set out in the section titled “Reconciliation of reported and underlying performance”.
31 December 2017
$M Pathology Medical Centres
Imaging Corporate Group
Revenue 1 534.0 162.0 179.3 - 856.5 EBITDA 67.0 51.8 28.7 (5.5) 142.0 Depreciation (9.7) (8.7) (7.0) (1.3) (26.7) Amortisation (4.4) (23.6) (5.3) (0.7) (34.0) EBIT 52.9 19.5 16.4 (7.5) 81.3 Finance Costs (18.5) PBT 62.8 Tax (18.8) UNPAT 44.0
31 December 2016
$M Pathology Medical Centres
Imaging Corporate Group
Revenue 1 504.9 157.2 162.8 0.2 808.7 EBITDA 64.6 64.6 27.7 (7.0) 149.9 Depreciation (9.5) (10.7) (7.8) (1.4) (29.4) Amortisation (3.8) (27.8) (5.6) (1.4) (38.6) EBIT 51.3 26.1 14.3 (9.8) 81.9 Finance Costs (22.1) PBT 59.8 Tax (17.9) UNPAT 41.9
DIVISIONAL PERFORMANCE
The underlying EBIT performance of each operating division is set out below together with the strategies and initiatives which underpin this performance.
PATHOLOGY 31 December
2017 $M
31 December 2016
$M
Better/ (worse)
% Revenue 534.0 504.9 5.8 EBITDA 67.0 64.6 3.7 Depreciation (9.7) (9.5) (2.1) Amortisation (4.4) (3.8) (15.8) EBIT 52.9 51.3 3.1 Capital expenditure (before capital recycling) 7.9 13.8 42.8
The Pathology division is Primary’s largest business. It provides leading medical laboratory and pathology services covering key diagnostic activities of anatomical pathology (histopathology and cytology), clinical pathology (chemistry, haematology, immunology, and microbiology), genomic diagnostics and veterinary pathology. It is a tribute to the efficiency of Pathology operations that it has been able to grow profitably over a long period of time, while the government-reimbursed revenue-per-test in real terms is lower than 20 years ago. Pathology’s improved contribution in 1H 2018 demonstrated its continued strength. Revenue grew by 5.8% with increases in both volumes and average fee per episode and a good performance in the niche specialities, particularly genetics which grew by 24%. The growth was underpinned by market demand with MBS five-year rates firming to 4.1% (from 3.9% in FY 2017).
1 $18.8 million of inter-company revenue/expenses have been eliminated at the Group level (1H 2017 $16.4 million).
For
per
sona
l use
onl
y

Review of Operations For the Half-Year ended 31 December 2017
Primary Health Care Limited Appendix 4D – Half-Year Report December 2017 6
EBIT was up by 3.1% to $52.9 million. Importantly, a reduction in ACC rental cost as a percentage of revenue was achieved in 1H 2018, due to a focus on disciplined rental negotiations. This did not impact revenue growth. EBIT expansion would have been around 8% if not for the impact of the completed divestment of the old-Healthscope collection centres in Queensland and northern New South Wales. Additional costs in consumables were incurred driven by higher rates of coning and growth in higher-value tests with higher cost consumables. Cash flow: Pathology continued to contribute to the Group’s cash position. There was a 42.8% reduction in divisional capital expenditure in 1H 2018. However this is expected to normalise in 2H 2018. Strategy Growth: Further top-line growth in Pathology will be organic, through enhancing the whole-of-Primary approach to service line development, growing the medical centre footprint, focusing on optimising hospital contracts, and partnering with specialists who drive a high volume of pathology testing. In 1H 2018, genetics and vet pathology operations performed strongly and the focus is on further developing the histopathology operations. ACCs: Rental pressures are an issue facing every pathology operator in the competitive domestic market. Following more clarity around rent regulation, the division is focusing on margin optimisation of its ACC network with the emphasis on improvements in service levels to reduce leakage and disciplined rental negotiations to reduce rental costs. This has already delivered a benefit in the first half of the year. Efficient, flexible infrastructure to drive improved outcomes: Pathology continues to drive productivity gains in the laboratories. Pathology is currently assessing equipment needs in the serum work area aiming to improve efficiencies, increase automation and continually adopt leading clinical methodologies. Pathology is reviewing options for a new laboratory information system which will drive gains in standardisation and throughput while a tandem review of pre-analytical processes will look at further efficiencies in activities around the collection and handling of samples before they reach the major testing lines. Stakeholder engagement: Pathology is focussing on ongoing improvements to employee engagement and communication, in particular with front-line staff. Primary is working with the other major providers to establish an industry body to negotiate with one voice with the Government. This is a change from the past and should put the industry on a stronger footing. Pathology and Imaging are working with the Government to upload data to the Government’s My Health Records. Primary continues to assess potential opportunities in South East Asia.
MEDICAL CENTRES
Medical Centres can be analysed as follows: 31 December 2017 31 December 2016
$M Primary Medical Centres
Health & Co MedicalCentres
Primary Medical Centres
Health & Co MedicalCentres
Revenue 159.3 2.7 162.0 157.0 0.2 157.2 EBITDA 54.3 (2.5) 51.8 65.4 (0.8) 64.6 Depreciation (8.7) - (8.7) (10.7) - (10.7) Amortisation (23.6) - (23.6) (27.8) - (27.8) EBIT 22.0 (2.5) 19.5 26.9 (0.8) 26.1
Medical Centres are central to Primary’s integrated health services strategy and drive value to the rest of the Group, with GPs being the gatekeepers of referrals throughout the healthcare system.
For
per
sona
l use
onl
y

Review of Operations For the Half-Year ended 31 December 2017
Primary Health Care Limited Appendix 4D – Half-Year Report December 2017 7
PRIMARY MEDICAL CENTRES 31 December
2017 $M
31 December 2016
$M
Better/ (worse)
% Revenue 159.3 157.0 1.5 EBITDA 54.3 65.4 (17.0) Depreciation (8.7) (10.7) 18.7 Amortisation (23.6) (27.8) 15.1 EBIT 22.0 26.9 (18.2) HCP capital expenditure 16.1 17.2 6.4
The division is just over halfway through a five-year process to transition GPs and other HCPs onto different contract models following the Australian Tax Office ruling in 2015. Flexible, capital-light contract models have been introduced appealing to a wider cohort of GPs and delivering a more capital efficient approach to recruitment. To balance the value proposition, the revenue sharing arrangements have increased in favour of the GP and the division is also seeing reduced but more sustainable working hours for the average GP. The results for 1H 2018 reflect the costs of this repositioning with the contribution in the division declining by $4.9 million or 18.2%. Overall GP recruitment in the period remained ahead of 1H 2017. 67 GPs were recruited and 50 departed, of which 20 left due to clinic closures and terminations by Primary under its quality reset program. By 31 December 2017, Primary had 1,055 GPs practising in its centres. The retention rates, excluding clinic closures and quality reset, have improved and are now on a par with industry norms. The pipeline going into the second half of the year was strong. Importantly, the strategic initiatives outlined below build on improving GP numbers and productivity. In 1H 2018, the cohort of FTE GPs (calculated on a 40 hour week) grew from 922 to 958. Gross billings rose from $206.5 million to $212.2 million. However Primary’s average share of revenue declined in line with share offered under the new contract models and this drove a decrease in GP revenue of 5.4% to $87.7 million. Overall the division’s revenue grew from $157.0 million to $159.3 million with improvements, for example in dental and IVF, more than offsetting the decline in GP revenue. EBIT contracted by $4.9 million compared to 1H 2017, or $2.6 million after adjusting for the greenfield centres coming online. The division invested in HCP recruitment, nursing capabilities and other support services for HCPs, and in employee engagement. The division also expanded its service offerings in dental, occupational health and integrated care. While these initiatives are increasing costs in the near-term, they represent an investment in the future. Cash flow: Capital expenditure on upfront payments to HCPs was $16.1 million compared to $17.2 million in the prior comparable period. It is around half the costs in 1H 2016 when the new models had just been introduced. Of the GP cohort 94% of new FTE GPs elected for ‘no-upfront’ contracts with the majority of the capital spend on re-signing of existing GPs. Strategy Recruitment: Recruitment of new GPs continues to be a key focus, in particular in areas where patient demand exceeds GP numbers. Primary is in a good situation with spare capacity in the centres and patient demand. However, it is not the absolute numbers of GPs that is paramount but the recruitment of the right GPs into the right centres. This includes ensuring Primary has quality GPs in its centres who will support and enhance the commitment to excellence in healthcare. Contracts with GPs have been enhanced by shortening the length, simplifying the content and removing most legal restraints. Primary is committed to providing an environment in which GPs want to work and where restraints become irrelevant. Primary also offers opportunities for GPs to work in the centres while undertaking activities outside of Primary or pursuing special clinical interests within Primary. The structure of the recruitment team has been transformed with a new head of recruitment and more internal recruiters. They are now an integral part of the local operations teams and know the skills-set they are looking for in each centre. This enables them to better deliver the right GP to the right centre. The environment offered to GPs is also in the process of improving under Project Leapfrog. Project Leapfrog: Primary has a unique portfolio of large-scale clinics of remarkable size, location, accessibility and range of services. These centres are evolving and developing new ways to deliver care how, when and where patients want it, supported by technology that makes accessing care simple.
For
per
sona
l use
onl
y

Review of Operations For the Half-Year ended 31 December 2017
Primary Health Care Limited Appendix 4D – Half-Year Report December 2017 8
Project Leapfrog will be a multi-year program to overhaul the operating model in Medical Centres, to bring them up-to-date and to change the value proposition. Project Leapfrog will support GP recruitment as GPs will have the ability to build their practice through an appointment system and this will pave the way for selected private billing. Appointments will lead to a better model to service patients, utilise GP capacity and improve clinical outcomes. An enhanced consumer experience will look to attract and retain patients including increased service offerings, enhanced online access, and comfortable, modern facilities. Finally online technology will reduce in-clinic processes while a re-engineering of the practice workflows should considerably improve efficiency and drive revenue, with doctors able to do more in their days. The CEO of Medical Centres, Dr Tim Haggett, has extensive experience in pioneering this sort of model of medical care and consumer-centric service delivery. PMS: A new practice management system will reduce the time GPs need to spend at their computers for each consultation. It will also help deliver the strategies in Project Leapfrog. Clinical Institute: Primary’s thriving Clinical Institute has 59 GP registrars for the first semester in 2018 working across 35 of the centres with more centres due to be accredited next semester. It is also providing over 3,500 sessions to university medical students across the country and working with the GP Registrars Australia on a national series of education and clinical events. This is an invaluable pipeline of young GPs who want a career where they can be supported by up-to-date technology, build a patient base and achieve a work-life balance. Growth: The growth story for Medical Centres will come from having the right GPs in the right centres under the new model which will make these centres more attractive to GPs with appointments and mixed billings. An enhanced consumer experience and more efficient work practices will drive improvements. Growth will also come from a better integration of services to reduce leakage and optimise value under a whole-of-Primary approach. In terms of expansion, growth will come from the four new greenfield centres which will roll out this financial year. These centres are expected to make good returns once they have ramped up. Medical Centres will also grow its footprint through M&A activity. Specialists: Primary already contracts with a significant number of specialists and there is an opportunity to grow in specialist medicine beyond simply having them provide services in the centres. The same applies to the dental business which is one of the top four dental operations in the country, with over 120 dentists working at Primary centres. The division is already growing its revenue which was up by 9% in the period, with a fee-per-hour well above industry averages.
The IVF business model is already disrupting its sector. IVF will be opening its fourth clinic in Perth this year. Primary has appointed a new Head of IVF and sees opportunities for future growth including larger laboratories, more clinics and more targeted marketing. Primary is also working closely with the Government in its Healthcare Home trials for chronically-ill patients, with 12 Primary centres to commence trials in FY 2018.
HEALTH & CO
31 December2017
$M
31 December 2016
$M
Better/ (worse)
% Revenue 2.7 0.2 EBITDA (2.5) (0.8) Depreciation - - Amortisation - - EBIT (2.5) (0.8) Capital expenditure (before capital recycling) 3.1 8.3 62.7
Primary announced the diversification of its Medical Centres business into the bespoke practice market in 1H 2017. Health & Co offers a tailored service to established GP clinics. In 1H 2018 Health & Co recorded a loss of $2.5 million. Clinics in the network recorded 100% retention of existing GPs and successful recruitment of new GPs. The increased loss reflects the ramp-up of capabilities in an emerging division which is committed to a much more ambitious M&A program. This represents an investment in the future.
For
per
sona
l use
onl
y

Review of Operations For the Half-Year ended 31 December 2017
Primary Health Care Limited Appendix 4D – Half-Year Report December 2017 9
IMAGING
31 December2017
$M
31 December 2016
$M
Better/ (worse)
%Revenue 179.3 162.8 10.1 EBITDA 28.7 27.7 3.6 Depreciation (7.0) (7.8) 10.3 Amortisation (5.3) (5.6) 5.4 EBIT 16.4 14.3 14.7 HCP capital expenditure 1.8 2.1 14.3 Capital expenditure (before capital recycling) 10.3 16.8 38.7
Primary’s Imaging division, Healthcare Imaging Services, partners with 112 independent radiologists to undertake a full range of medical imaging services including cardiac, neurology, vascular, musculoskeletal and dental imaging. The division operates a network of 142 sites. Imaging grew the net revenue year on year by 10.1%, driven by the hospital segment, up 14.0%, and Medical Centres, up 9.9%. Ongoing focus on CT and MRI modalities resulted in revenue growth of 13.3% and 14.1%, respectively. Revenue growth was underpinned by market demand with MBS five-year rates firming to 6.3% (from 6.1% in FY 2017). Imaging reported another good EBIT performance increasing by 14.7% to $16.4m, underpinned by its strategy to focus on the hospital sector, Primary medical centres and high-end specialised sites. Adjusting for new centre ramp-up, EBIT increased 16.8% on 1H 2017. Cash flow: Imaging continued to invest in new sites and technology with growth capital expenditure on Kawana, Northern Beaches Hospital and iCAR. However overall it reduced its total capital expenditure by 38.7% and remained self-funding. Strategy Portfolio alignment: In December 2017 Imaging announced the acquisition of Brisbane Private Imaging which has a 15-year lease in the 150-bed hospital and brings into the group four high quality radiologists. The Northern Beaches Hospital contract in New South Wales is a core component of the strategy and will build the division’s reputation. It is due to commence in October 2018. Operational excellence: Imaging continues to focus on operational improvements, with key initiatives around employee engagement, whole-of-Primary optimisation, and development of improved offerings to referrers. iCAR is the first step on the business technology road map. Under iCAR, Imaging will introduce a new radiology information system (“RIS”) and a new picture archiving and communication solution (“PACS”). Together, these platforms will deliver significant efficiencies across the network of sites and enhance the way the division interacts with referrers and their patients.
CORPORATE
31 December2017
$M
31 December 2016
$M
Better/ (worse)
%EBITDA (5.5) (7.0) 21.4 Depreciation (1.3) (1.4) 7.1 Amortisation (0.7) (1.4) 50.0 EBIT (7.5) (9.8) 23.5
The 1H 2018 improvement in EBITDA reflected the savings from the July 2017 streamlining of the corporate head office. The full year impact will amount to approximately $3 million in pre-tax annualised savings.
GREENFIELD SITES
Underlying results incorporate a number of greenfield sites which are expected to deliver profitable growth when they are mature. Corrimal, Brisbane IVF, and River City Imaging were opened in FY 2017 and four new medical centres, an IVF clinic and day surgery, and an imaging site are opening in FY 2018. Primary assumes a three-year ramp-up for greenfield sites. Health & Co is also in ramp-up phase. Underlying EBIT was up 3.8% and Underlying NPAT was up 11.8% compared to the first half of 2017, when adjusted for the margin compression from greenfields and Health & Co, as follows:
For
per
sona
l use
onl
y

Review of Operations For the Half-Year ended 31 December 2017
Primary Health Care Limited Appendix 4D – Half-Year Report December 2017 10
31 December2017
$M
31 December 2016
$M
Better/ (worse)
% EBIT 81.3 81.9 (0.7) New centres / Health & Co 5.8 2.0 Adjusted EBIT 87.1 83.9 3.8
RECONCILIATION OF REPORTED AND UNDERLYING PERFORMANCE
The financial report sets out the reported results for Primary for 1H 2018. Underlying results reflect the trading results of the business, adjusted for key restructuring and strategic initiatives and one-off items.
$M 31 December 2017
31 December 2016
Reported EBIT 61.6 61.1Restructuring – redundancies & other termination payments 5.8 2.1 Technology strategic initiatives 5.9 1.4 Other strategic initiatives 4.6 3.8 Business set-up costs 1.4 2.4
Restructuring and strategic initiatives 17.7 9.7 Non-recurring items 2.0 11.1 Underlying EBIT 81.3 81.9
Restructuring costs of $5.8 million relate to the leadership changes and changes to the corporate structure introduced by Dr Parmenter, including the devolution of responsibility for change programs to the operating divisions. At this stage, no significant further changes are expected. Strategic initiatives include $5.9 million in IT costs and a further $4.6 million in Group strategic projects, designed to modernise infrastructure and support systems including in Finance, Property and HR. These investments are expected to reap future benefits.
OTHER P&L ITEMS
FINANCE COSTS
Total finance costs in 1H 2018 were $18.5 million, down 16.3% from $22.1 million in 1H 2017. The savings were predominately due to a lower weighted average cost of debt compared to 1H 2017, and a lower average debt balance.
TAX EXPENSE
Group reported income tax expense for 1H 2018 is set out below.
$M 31 December 2017
31 December 2016
Profit before tax 43.1 39.0 Income tax (21.0) (17.9) Net (loss)/profit after tax 22.1 21.1
The reported tax expense for 1H 2018 of $21.0 million equated to an overall effective tax rate of 48.7% and was $8.1 million above a prima facie tax expense calculated at 30% of profit before tax. The increase was primarily due to the $4.2 million permanent tax difference associated with amortisation of healthcare practice acquisitions prior to 30 June 2015. There will be additional accounting tax expense while these acquisitions continue to be amortised, as follows:
$M 1H 2018 2H 2018 FY 2019 FY 2020
Additional accounting tax expense 4.2 3.6 5.1 2.3 Primary’s expectation is that the Group’s effective tax rate will revert to 30% in the long term once the above amortisation is fully charged, assuming the current structure and nature of the business. As a result, an effective tax rate of 30% has been adopted for underlying results.
DIVIDENDS
The directors have approved an interim dividend of 5.1 cps 100% franked (1H 2017: 4.8 cps 100% franked). The interim dividend equates to a payout ratio of 60% of UNPAT. This ratio was set to reflect the company’s growth strategy.
For
per
sona
l use
onl
y

Review of Operations For the Half-Year ended 31 December 2017
Primary Health Care Limited Appendix 4D – Half-Year Report December 2017 11
CASH FLOW
Group cash flow for 1H 2018 is set out below in comparison to 1H 2017:
AS AT $M
31 December 2017 31 December 2016 Movement $
Operating cash flows 105.2 90.4 14.8 Payments for PP&E, HCPs, intangibles (59.5) (66.5) 7.0 Free cash flow 45.7 23.9 21.8 Capital recycling 1.0 5.9 (4.9) Dividends (30.2) (33.4) 3.2 Debt repayment or borrowings / finance costs (4.0) 18.0 (22.0) Net increase in cash held 12.5 14.4 (1.9) Opening cash 95.5 82.3 13.2 F/X - 0.1 (0.1) Closing cash 108.0 96.8 11.2
The $45.7 million free cash flow includes:
$14.8 million increased operating cash flows primarily driven by lower interest and tax payments, $6.6 million lower spend in HCP acquisitions, $1.8 million lower spend in property, plant and equipment, Offset by $1.4 million increased spend in intangibles.
It should be noted that 54% of the capital expenditure above related to growth capital expenditure, including:
Acquiring private billing clinics under the Health & Co brand, and 4 new medical centres, Perth IVF and day surgery and Kawana Imaging Centre opening in FY 2018.
Importantly, the group funded $19.7 million in restructuring and strategic initiatives, $30.2 million in dividends and decreased its net debt during the period.
BALANCE SHEET AND NET DEBT
The Group had $3.1 billion in assets, including $2.3 billion in goodwill, and $1.9 billion of shareholders equity as 31 December 2017. The Group has a net current asset deficiency of $56.9 million (FY 2017 $65.1 million). However, the Group generates significant operating cash flows and has access to unused financing facilities which can be drawn on. Group net debt at 31 December 2017 was $770.6 million compared to $784.2 million in FY 2017, analysed as follows:
AS AT $M
31 December 2017
30 June 2017
Movement $
Bank and finance debt 878.6 879.7 1.1 Cash (108.0) (95.5) 12.5 Net debt 770.6 784.2 13.6 Bank gearing ratio (covenant <3.5x) 2.52x 2.51x Bank interest ratio (covenant >3.0x) 8.78x 7.86x Gearing (net debt: net debt + equity) 29.3% 29.6%
On 20 December 2017 Primary announced the extension and amendment of its syndicated bank debt facility reducing its facility limit by $125.0 million and extending the maturity date of the facility. The first tranche of the facility of $500.0 million is due to mature in January 2021 and the second of $625.0 million in January 2023. As part of the transaction all unamortised borrowing costs ($1.5 million) relating to the first tranche were expensed. The bank gearing ratio for the syndicated bank facility at 31 December 2017 was 2.52x compared to a ceiling covenant requirement of 3.5x. The bank interest ratio was at 8.78x, well above the floor of 3.0x. The divisions have shown discipline in only spending what they generate. At the group level, the main focus is to balance competing capital demands between acquisitions, greenfields expansion, investing in essential infrastructure, and dividends.
For
per
sona
l use
onl
y

Review of Operations For the Half-Year ended 31 December 2017
Primary Health Care Limited Appendix 4D – Half-Year Report December 2017 12
STRATEGIC INITIATIVES
Primary aims to improve people’s health and wellbeing through a commitment to excellence in consumer-centered care. Primary currently has a number of initiatives underway in all divisions to deliver profitable growth. Investment in capabilities and growth strategies, improvement in employee engagement, and better integration of services to optimise synergies remain priorities across the divisions. Specific initiatives are set out in detail in the relevant divisional sections. Importantly, in Medical Centres Project Leapfrog aims to deliver an improvement in the GP cohort, diversification of service offerings and operational efficiencies. As the country enters a period of significant change in healthcare, with technology increasingly enabling people to better manage their health and access services, Primary aims to be at the forefront of this change, with an enhanced digital presence, tools and marketing. Major technology investments underway, or in planning, include:
Clinical and practice management system (PMS) – a new clinical and practice management software system to upgrade current infrastructure across Primary’s Medical Centres.
Imaging Core Application Refresh (iCAR) – integrated digital systems that will improve the way the Imaging division interacts with referrers and their patients.
Pathology Laboratory Information System (LIS) – an upgrade of the division’s current infrastructure platforms is in planning, with a strategic review of future business requirements commenced.
IT infrastructure – modernisation and upgrades to the networks, data centres and connectivity.
OUTLOOK
The long-term drivers for healthcare remain positive. There is strong underlying demand for healthcare in Australia, underpinned by a growing and ageing population, increasing chronic and complex conditions, rising patient expectations and expanding wealth per capita. The Federal Budget in May 2017 and other announcements have given Primary a greater degree of certainty around the Government’s healthcare policy settings. However with Government healthcare costs on the increase, funding pressures will remain for the industry and the private sector providers must be agile. Primary will continue to drive diversification of revenue, targeting mixed billing, specialty Pathology services and national contracts with Government and major partners. Australia is at an important juncture in the delivery of healthcare services. Increasingly, the drivers of cost, convenience and technology will see a shift in consumer demands for better ways to access care. Primary aims both to influence policy debate and to lead the change in healthcare delivery, with the scale, the people and the drive to deliver this. The services Primary provides are becoming increasingly important in this context. In Medical Centres, new strategies will create a substantial shift in the value proposition and put Primary at the forefront of the industry, with a ‘Workplace of Choice’ environment to attract a broader demographic of GP, while consumers will encounter an enhanced range of services and better service delivery. Primary believes that, while the change program has further progress to make, the targeted outcomes are expected to deliver substantial benefits and the pathway for sustainability and growth.
FY 2018 GUIDANCE
Primary confirmed its Underlying NPAT guidance of $92 million to $97 million for FY 2018. F
or p
erso
nal u
se o
nly

A member firm of Ernst & Young Global Limited
Liability limited by a scheme approved under Professional Standards Legislation
Ernst & Young 200 George Street Sydney NSW 2000 Australia GPO Box 2646 Sydney NSW 2001
Tel: +61 2 9248 5555 Fax: +61 2 9248 5959 ey.com/au
Auditor’s Independence Declaration to the Directors of Primary Health Care Limited
As lead auditor for the review of Primary Health Care Limited for the half-year ended 31 December 2017, I declare to the best of my knowledge and belief, there have been:
a) no contraventions of the auditor independence requirements of the Corporations Act 2001 in relation to the review; and
b) no contraventions of any applicable code of professional conduct in relation to the review.
This declaration is in respect of Primary Health Care Limited and the entities it controlled during the financial period. Ernst & Young Douglas Bain Partner Sydney 16 February 2018
For
per
sona
l use
onl
y

A member firm of Ernst & Young Global Limited
Liability limited by a scheme approved under Professional Standards Legislation
Ernst & Young 200 George Street Sydney NSW 2000 Australia GPO Box 2646 Sydney NSW 2001
Tel: +61 2 9248 5555 Fax: +61 2 9248 5959 ey.com/au
Independent Auditor's Review Report to the Members of Primary Health Care Limited
Report on the Half-Year Financial Report
Conclusion
We have reviewed the accompanying half-year financial report of Primary Health Care Limited (the Company) and its subsidiaries (collectively the Group), which comprises the condensed statement of financial position as at 31 December 2017, the condensed statement of comprehensive income, condensed statement of changes in equity and condensed statement of cash flows for the half-year ended on that date, notes comprising a summary of significant accounting policies and other explanatory information, and the directors’ declaration.
Based on our review, which is not an audit, nothing has come to our attention that causes us to believe that the half-year financial report of the Group is not in accordance with the Corporations Act 2001, including:
a) giving a true and fair view of the consolidated financial position of the Group as at 31 December 2017 and of its consolidated financial performance for the half-year ended on that date; and
b) complying with Accounting Standard AASB 134 Interim Financial Reporting and the Corporations Regulations 2001.
Directors Responsibility for the Half-Year Financial Report
The directors of the Company are responsible for the preparation of the half-year financial report that gives a true and fair view in accordance with Australian Accounting Standards and the Corporations Act 2001 and for such internal control as the directors determine is necessary to enable the preparation of the half-year financial report that is free from material misstatement, whether due to fraud or error.
Auditor’s Responsibility
Our responsibility is to express a conclusion on the half-year financial report based on our review. We conducted our review in accordance with Auditing Standard on Review Engagements ASRE 2410 Review of a Financial Report Performed by the Independent Auditor of the Entity, in order to state whether, on the basis of the procedures described, anything has come to our attention that causes us to believe that the half-year financial report is not in accordance with the Corporations Act 2001 including: giving a true and fair view of the Group’s consolidated financial position as at 31 December 2017 and its consolidated financial performance for the half-year ended on that date; and complying with Accounting Standard AASB 134 Interim Financial Reporting and the Corporations Regulations 2001. As the auditor of the Group, ASRE 2410 requires that we comply with the ethical requirements relevant to the audit of the annual financial report.
A review of a half-year financial report consists of making enquiries, primarily of persons responsible for financial and accounting matters, and applying analytical and other review procedures. A review is substantially less in scope than an audit conducted in accordance with Australian Auditing Standards and consequently does not enable us to obtain assurance that we would become aware of all significant matters that might be identified in an audit. Accordingly, we do not express an audit opinion.
For
per
sona
l use
onl
y
A member firm of Ernst & Young Global Limited
Liability limited by a scheme approved under Professional Standards Legislation
Independence
In conducting our review, we have complied with the independence requirements of the Corporations Act 2001.
Ernst & Young
Douglas Bain Vida Virgo Engagement Partner Engagement Partner Sydney 16 February 2018
For
per
sona
l use
onl
y
Directors’ declaration For the Half-Year ended 31 December 2017
Primary Health Care Limited Appendix 4D – Half-Year Report December 2017 16
The Directors declare that: (a) in the Directors’ opinion, the attached financial statements and notes are in accordance with the Corporations Act
2001, including section 304 (compliance with Accounting Standards) and section 305 (true and fair view); and (b) in the Directors’ opinion, there are reasonable grounds to believe that the Company will be able to pay its debts
as and when they become due and payable. This declaration is made in accordance with a resolution of the Directors made pursuant to section 303(5) of the Corporations Act 2001. On behalf of the Directors
Malcolm Parmenter Managing Director & Chief Executive Officer Sydney, 16 February 2018
For
per
sona
l use
onl
y

Condensed consolidated statement of profit or loss For the Half-Year ended 31 December 2017
Notes to the financial statements are included on pages 22 to 33
Primary Health Care Limited Appendix 4D – Half-Year Report December 2017 17
31
December2017
31December
2016 Note $M $M
Revenue 856.5 808.7
Employee benefits expense 409.2 374.3
Property expenses 127.1 122.2
Consumables 96.5 86.0
Other expenses 101.4 97.1
Depreciation 26.7 29.4
Amortisation of intangibles 34.0 38.6
Earnings before interest and tax 61.6 61.1
Finance costs 3 18.5 22.1
Profit before tax 43.1 39.0
Income tax expense 4 21.0 17.9
Profit for the period 22.1 21.1
Attributable to:
Equity holders of Primary Health Care Limited 22.1 21.1
Non-controlling interest – –
Profit for the period 22.1 21.1
2017 2016
Earnings per share Cents per
share Cents per
share
Basic and diluted earnings per share 4.2 4.0
For
per
sona
l use
onl
y
Condensed consolidated statement of comprehensive income For the Half-Year ended 31 December 2017
Notes to the financial statements are included on pages 22 to 33
Primary Health Care Limited Appendix 4D – Half-Year Report December 2017 18
31
December 2017
$M
31December
2016$M
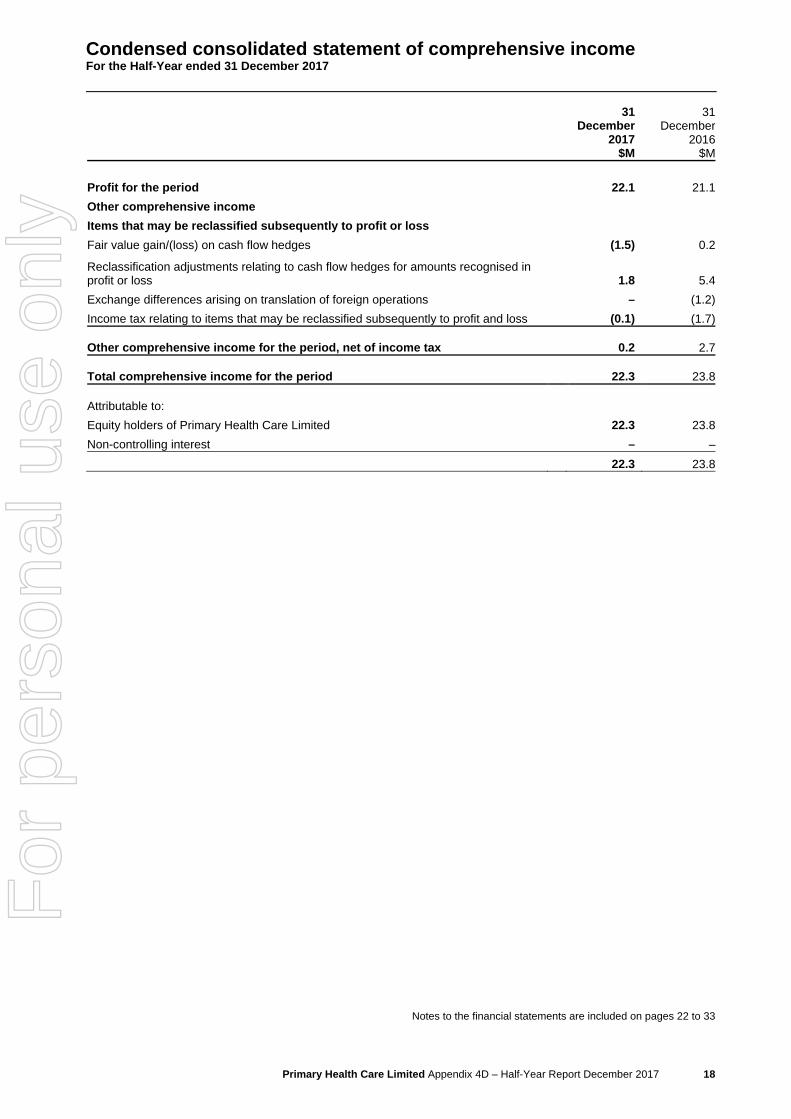
Profit for the period 22.1 21.1
Other comprehensive income
Items that may be reclassified subsequently to profit or loss
Fair value gain/(loss) on cash flow hedges (1.5) 0.2
Reclassification adjustments relating to cash flow hedges for amounts recognised in profit or loss 1.8 5.4
Exchange differences arising on translation of foreign operations – (1.2)
Income tax relating to items that may be reclassified subsequently to profit and loss (0.1) (1.7) Other comprehensive income for the period, net of income tax 0.2 2.7 Total comprehensive income for the period 22.3 23.8 Attributable to:
Equity holders of Primary Health Care Limited 22.3 23.8
Non-controlling interest – –
22.3 23.8
For
per
sona
l use
onl
y

Condensed consolidated statement of financial position As at 31 December 2017
Notes to the financial statements are included on pages 22 to 33
Primary Health Care Limited Appendix 4D – Half-Year Report December 2017 19
As at Note
31 December
2017 $M
30 June 2017
$M Current assets Cash 108.0 95.5 Receivables 132.0 136.2 Consumables 24.9 25.1 Tax receivable – 9.7 Total current assets 264.9 266.5 Non-current assets Receivables 2.7 3.8 Goodwill 5 2,319.7 2,315.5 Property, plant and equipment 6 295.7 299.0 Other intangible assets 7 154.5 166.6 Other financial assets 12.9 11.9 Deferred tax asset 46.9 50.8 Total non-current assets 2,832.4 2,847.6 Total assets 3,097.3 3,114.1 Current liabilities Payables 211.9 225.2 Provisions 106.7 105.3 Other financial liabilities 1.6 0.8 Interest bearing liabilities 0.2 0.3 Tax payable 1.4 – Total current liabilities 321.8 331.6 Non-current liabilities Payables 8.8 7.9 Provisions 24.8 26.1 Interest bearing liabilities 8 878.4 879.4 Total non-current liabilities 912.0 913.4 Total liabilities 1,233.8 1,245.0 Net assets 1,863.5 1,869.1
Equity Issued capital 11 2,423.2 2,422.8 Reserves 14.0 10.5 Accumulated losses (573.7) (565.7) Equity attributable to equity holders 1,863.5 1,867.6 Non-controlling interest – 1.5 Total equity 1,863.5 1,869.1
For
per
sona
l use
onl
y

Condensed consolidated statement of changes in equity For the Half-Year ended 31 December 2017
Notes to the financial statements are included on pages 22 to 33
Primary Health Care Limited Appendix 4D – Half-Year Report December 2017 20
$M
Issued capital
Investments revaluation
reserve
Cash flow
hedge reserve
Foreign currency
translation reserve
Share-based
payments reserve
Other reserves
Accumulated losses
Attributable to owners
of the parent
Non-controlling
interest Total
Balance at 1 July 2017 2,422.8 7.5 (0.6) (1.0) 4.6 – (565.7) 1,867.6 1.5 1,869.1
Profit for the period – – – – – – 22.1 22.1 – 22.1 Exchange differences arising on translation of foreign operations – – – – – – – – – – Fair value gain/(loss) on cash flow hedges – – (1.5) – – – – (1.5) – (1.5) Reclassification adjustments relating to cash flow hedges recognised in profit or loss – – 1.8 – – – – 1.8 – 1.8
Income tax relating to components of other comprehensive income – – (0.1) – – – – (0.1) – (0.1) Total comprehensive income for the period – – 0.2 – – – 22.1 22.3 – 22.3 Payment of dividends – – – – – – (30.2) (30.2) – (30.2) Share based payments – – – – 2.6 – – 2.6 – 2.6
Transfers – – – – (0.1) – 0.1 – – – Acquisition of non-controlling interest – – – – – 1.2 – 1.2 (1.5) (0.3) Share issued via Short Term Incentive Plan 0.4 – – – (0.4) – – – – – Balance at 31 December 2017 2,423.2 7.5 (0.4) (1.0) 6.7 1.2 (573.7) 1,863.5 – 1,863.5
$M
Issued capital
Cash flow hedge
reserve
Foreign currency
translation reserve
Share-based
payments reserve
Retained earnings
Attributable to owners of
the parent
Non-controlling
interest Total
Balance at 1 July 2016 2,422.8 (8.0) 0.7 2.1 8.5 2,426.1 1.6 2,427.7
Profit for the period – – – – 21.1 21.1 – 21.1 Exchange differences arising on translation of foreign operations – – (1.2) – – (1.2) – (1.2) Fair value gain/(loss) on cash flow hedges – 0.2 – – – 0.2 – 0.2 Reclassification adjustments relating to cash flow hedges recognised in profit or loss – 5.4 – – – 5.4 – 5.4
Income tax relating to components of other comprehensive income – (1.7) – – – (1.7) – (1.7) Total comprehensive income for the period – 3.9 (1.2) – 21.1 23.8 – 23.8 Payment of dividends – – – – (33.4) (33.4) – (33.4) Share based payments – – – 1.4 – 1.4 – 1.4
Transfers – – – (0.7) 0.7 – – – Balance at 31 December 2016 2,422.8 (4.1) (0.5) 2.8 (3.1) 2,417.9 1.6 2,419.5
For
per
sona
l use
onl
y

Condensed consolidated cash flow statement For the Half-Year ended 31 December 2017
Notes to the financial statements are included on pages 22 to 33
Primary Health Care Limited Appendix 4D – Half-Year Report December 2017 21
Note
31 December
2017 $M
31 December 2016
$M
Cash flows from operating activities Receipts from customers 889.2 839.8 Payments to suppliers and employees (762.2) (702.9) Gross cash flows from operating activities 127.0 136.9 Interest paid (16.3) (20.6) Net income tax paid (6.0) (26.2) Interest received 0.5 0.3 Net cash provided by operating activities 13(b) 105.2 90.4
Cash flows from investing activities Payment for Medical Centre healthcare practitioners (16.1) (17.2) Payment for Imaging healthcare practitioners (1.5) (2.1) Payment for Medical Centre practices & subsidiaries (3.1) (8.3) Payments for property plant and equipment (31.1) (32.9) Proceeds from the sale of property plant and equipment 1.0 8.0 Payments for other intangibles (7.4) (5.5) Net payments for other subsidiaries acquired (0.3) (0.5) Payment relating to sale of subsidiary – (2.1) Net cash used in investing activities (58.5) (60.6)
Cash flows from financing activities Repayment of borrowings and finance lease liabilities (0.2) (1.6) Proceeds from borrowings – 20.0 Dividends paid 12 (30.2) (33.4) Other finance costs paid (3.8) (0.4) Net cash used in financing activities (34.2) (15.4) Net increase in cash held 12.5 14.4
Cash at the beginning of the period 95.5 82.3 Effect of exchange rate movements on cash held in foreign currencies – 0.1 Cash at the end of the period 13(a) 108.0 96.8
For
per
sona
l use
onl
y

Notes to the consolidated financial statements For the Half-Year ended 31 December 2017
Primary Health Care Limited Appendix 4D – Half-Year Report December 2017 22
1. Significant accounting policies Primary Health Care Limited (“Primary”) is a for-profit entity domiciled in Australia. These financial statements represent the condensed consolidated financial statements of Primary for the half-year ended 31 December 2017 and comprises Primary and its subsidiaries (together referred to as “the consolidated entity” or “the Group”). Statement of compliance This half-year financial report is a general purpose financial report prepared in accordance with the Corporations Act 2001 and AASB 134 Interim Financial Reporting. Compliance with AASB 134 ensures compliance with International Financial Reporting Standard IAS 34 Interim Financial Reporting. This financial report does not include all of the notes normally included within the annual financial report and should be read in conjunction with the 30 June 2017 annual financial report of Primary Health Care Limited. Basis of preparation This half-year financial report has been prepared on the basis of historical cost, except for the revaluation of certain financial instruments. Cost is based on the fair values of the consideration given in exchange for assets. All amounts are presented in Australian dollars. The accounting policies and methods of computation adopted in the preparation of the half-year financial report are consistent with those adopted and disclosed in the Group’s annual report for the financial year ended 30 June 2017. These accounting policies are consistent with Australian Accounting Standards and with International Financial Reporting Standards. New accounting standards and accounting standards issued but not yet applied A number of new accounting standards and interpretations have been published that are not yet effective for the interim 31 December 2017 reporting period. The Group has elected not to early adopt these new standards or amendments in the financial report. These include: AASB 9 Financial Instruments
AASB 15 Revenue from Contracts with Customers
AASB 16 Leases
The Group continues to assess the impact of these standards and amendments on the financial report. Please refer to the Group’s annual report for the financial year ended 30 June 2017 for further details. Non-controlling interest On 8 September 2017, Primary Health Care Ltd acquired the remaining 23% ownership interest in North Coast Nuclear Medicine (QLD) Pty Ltd making it a wholly owned subsidiary of the Group. There are no further non-controlling interests for the Group. Net current liability position The Group has a net current asset deficiency of $56.9 million (30 June 2017: $65.1 million). The Group generates significant operating cash flows and had access to $240.0 million of unused financing facilities at the end of the reporting period which can be drawn if required. Rounding of amounts Primary is an entity of the kind referred to in ASIC Corporations (Rounding in Financial/Directors’ Report) Instrument 2016/191, dated 24 March 2016, and in accordance with that Corporations Instrument amounts in the financial report are rounded off to the nearest hundred thousand dollars, unless otherwise indicated. Comparative information Where necessary, comparative amounts have been reclassified and repositioned for consistency with current period disclosures.
For
per
sona
l use
onl
y

Notes to the consolidated financial statements For the Half-Year ended 31 December 2017
Primary Health Care Limited Appendix 4D – Half-Year Report December 2017 23
2. Segment information Operating segments are identified based on the way that the CEO and Board of Directors (also known as the chief operating decision makers) regularly review the financial performance of the business to assess performance and determine the allocation of resources. For internal management reporting purposes, the Group is organised into the following three divisions or operating segments:
Operating segment Activity
Pathology This division provides pathology services.
Medical Centres This division provides a range of services and facilities to general practitioners, specialists, dentists, IVF specialists and other health care providers operating in the bulk billing and private billing sectors.
Imaging This division provides imaging and scanning services from stand-alone imaging sites, hospitals and from within the consolidated entity’s medical centres.
The other category comprises corporate functions. The Group operates predominantly in Australia. Intersegment
The Medical Centres division charges the Group’s Imaging and Pathology divisions a fee for use of its facilities and services. These charges are eliminated on consolidation. Presentation of segment revenue and results Segment revenues and segment results are presented on an underlying basis. Underlying results for the six months ended 31 December 2017 and 31 December 2016 exclude the impact of non-underlying items relating to:
Items associated with restructuring and strategic initiatives; and
Non-recurring items.
For
per
sona
l use
onl
y

Notes to the consolidated financial statements For the Half-Year ended 31 December 2017
Primary Health Care Limited Appendix 4D – Half-Year Report December 2017 24
2. Segment information (continued) Underlying
31 December 2017
Pathology Medical
Centres Imaging Other Total
$M $M $M $M $M
Segment Revenue 534.0 162.0 179.3 – 875.3
Intersegment sales (18.8)
Total Revenue 856.5
EBITDA 1 67.0 51.8 28.7 (5.5) 142.0
Depreciation 9.7 8.7 7.0 1.3 26.7
Amortisation of intangibles 4.4 23.6 5.3 0.7 34.0
EBIT 2 52.9 19.5 16.4 (7.5) 81.3
Finance costs 18.5
Profit before tax 62.8
Income tax expense 3 18.8
Profit for the period 44.0
31 December 2016
Pathology Medical
Centres Imaging Other Total
$M $M $M $M $M
Segment Revenue 504.9 157.2 162.8 0.2 825.1
Intersegment sales (16.4)
Total Revenue 808.7
EBITDA 1 64.6 64.6 27.7 (7.0) 149.9
Depreciation 9.5 10.7 7.8 1.4 29.4
Amortisation of intangibles 3.8 27.8 5.6 1.4 38.6
EBIT 2 51.3 26.1 14.3 (9.8) 81.9
Finance costs 22.1
Profit before tax 59.8
Income tax expense 3 17.9
Profit for the period 41.9 1. EBITDA is a non-statutory profit representing earnings before interest, tax, depreciation and amortisation. 2. EBIT is a non-statutory profit representing earnings before interest and tax. 3. Underlying income tax is calculated as 30% of underlying profit before tax.
For
per
sona
l use
onl
y

Notes to the consolidated financial statements For the Half-Year ended 31 December 2017
Primary Health Care Limited Appendix 4D – Half-Year Report December 2017 25
2. Segment information (continued)
Reconciliation of underlying result to statutory profit before tax:
Segment Result
31 December 2017
$M
31 December 2016
$M
Total underlying profit before tax 62.8 59.8
Restructuring and strategic initiatives (17.7) (9.7)
Non-recurring items (2.0) (11.1)
Total statutory profit before tax 43.1 39.0 Further information on the reconciliation between reported and underlying performance can be found in the review of operations on pages 3 to 12.
For
per
sona
l use
onl
y

Notes to the consolidated financial statements For the Half-Year ended 31 December 2017
Primary Health Care Limited Appendix 4D – Half-Year Report December 2017 26
3. Finance costs
31 December
2017 $M
31 December
2016 $M
Interest expense 15.7 20.4
Amortisation of borrowing costs 2.8 1.7
18.5 22.1 On 20 December 2017 Primary announced the extension and amendment of its syndicated bank debt facility reducing its facility limit by $125.0 million and extending the maturity date of the facility. The first tranche of the facility of $500.0 million is due to mature in January 2021 and the second of $625.0 million in January 2023. As part of the transaction all unamortised borrowing costs ($1.5 million) relating to the first tranche were expensed.
4. Income tax expense
31 December
2017 $M
31
December 2016
$M
The prima facie income tax expense on the pre-tax accounting profit reconciles to the income tax expense in the financial statements as follows:
Profit before tax 43.1 39.0
Income tax calculated at 30% (2016: 30%) 12.9 11.7
Tax effect of amounts which are not deductible (taxable) in calculating taxable income:
Amortisation of healthcare practitioner contractual relationships intangible 4.2 6.4
Other items 2.9 –
7.1 6.4
Under/(over) provision in prior years 1.0 (0.2)
Income tax expense 21.0 17.9 ATO objection decisions – years 2003-2007 The Commissioner of Taxation is currently in the process of considering Primary’s objections for the years ended 30 June 2003 to 2007 (“Objections”) in relation to medical practice acquisitions after Primary received favourable decisions in both the Administrative Appeals Tribunal and Full Federal Court of Australia to treat the Objections as if they had been lodged within the required time period. No amounts have been recognised in relation to this matter in either the current or comparative periods.
For
per
sona
l use
onl
y
Notes to the consolidated financial statements For the Half-Year ended 31 December 2017
Primary Health Care Limited Appendix 4D – Half-Year Report December 2017 27
5. Goodwill
31
December 2017
$M
30 June 2017
$M
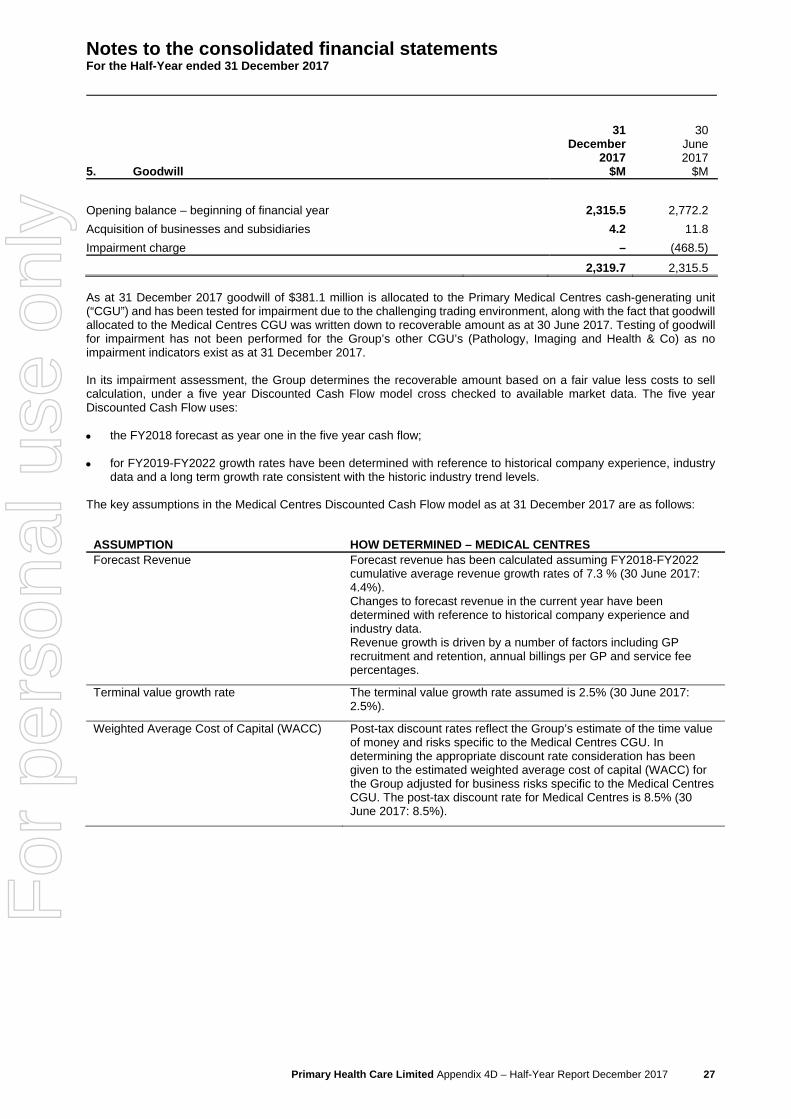
Opening balance – beginning of financial year 2,315.5 2,772.2
Acquisition of businesses and subsidiaries 4.2 11.8
Impairment charge – (468.5)
2,319.7 2,315.5 As at 31 December 2017 goodwill of $381.1 million is allocated to the Primary Medical Centres cash-generating unit (“CGU”) and has been tested for impairment due to the challenging trading environment, along with the fact that goodwill allocated to the Medical Centres CGU was written down to recoverable amount as at 30 June 2017. Testing of goodwill for impairment has not been performed for the Group’s other CGU’s (Pathology, Imaging and Health & Co) as no impairment indicators exist as at 31 December 2017. In its impairment assessment, the Group determines the recoverable amount based on a fair value less costs to sell calculation, under a five year Discounted Cash Flow model cross checked to available market data. The five year Discounted Cash Flow uses: the FY2018 forecast as year one in the five year cash flow; for FY2019-FY2022 growth rates have been determined with reference to historical company experience, industry
data and a long term growth rate consistent with the historic industry trend levels. The key assumptions in the Medical Centres Discounted Cash Flow model as at 31 December 2017 are as follows:
ASSUMPTION HOW DETERMINED – MEDICAL CENTRES Forecast Revenue Forecast revenue has been calculated assuming FY2018-FY2022
cumulative average revenue growth rates of 7.3 % (30 June 2017: 4.4%).
Changes to forecast revenue in the current year have been determined with reference to historical company experience and industry data. Revenue growth is driven by a number of factors including GP recruitment and retention, annual billings per GP and service fee percentages.
Terminal value growth rate The terminal value growth rate assumed is 2.5% (30 June 2017: 2.5%).
Weighted Average Cost of Capital (WACC) Post-tax discount rates reflect the Group’s estimate of the time value of money and risks specific to the Medical Centres CGU. In determining the appropriate discount rate consideration has been given to the estimated weighted average cost of capital (WACC) for the Group adjusted for business risks specific to the Medical Centres CGU. The post-tax discount rate for Medical Centres is 8.5% (30 June 2017: 8.5%).
For
per
sona
l use
onl
y

Notes to the consolidated financial statements For the Half-Year ended 31 December 2017
Primary Health Care Limited Appendix 4D – Half-Year Report December 2017 28
5. Goodwill (continued)
Sensitivity analysis Sensitivity analysis has been conducted on the assumptions above to assess the effect on the recoverable amount of changes in the key assumptions. The following table sets out the change in each of the key assumptions that would be required in order for the carrying value of the Medical Centres CGU to equal the recoverable amount.
Increase/(decrease) in assumptions required for recoverable amount
to equal carrying amount
CGU Revenue growth per
annum Terminal value
growth rate WACC
Medical Centres (0.6%) (0.9%) 0.7%
For
per
sona
l use
onl
y

Notes to the consolidated financial statements For the Half-Year ended 31 December 2017
Primary Health Care Limited Appendix 4D – Half-Year Report December 2017 29
6. Property, plant and equipment
31 December 2017 $M
Leasehold Improvement
Plant and Equipment
Asset under construction Total
Net book value
Opening balance 172.3 96.2 30.5 299.0 Additions 2.2 5.8 16.0 24.0 Capitalisation of assets under construction 6.8 2.4 (9.2) –
Disposals (0.1) (0.5) – (0.6) Depreciation expense (13.1) (13.6) – (26.7)
Closing balance 168.1 90.3 37.3 295.7
Cost 409.1 415.9 37.3 862.3
Accumulated depreciation (241.0) (325.6) – (566.6)
Closing balance 168.1 90.3 37.3 295.7
31 December 2016 1 $M
Leasehold Improvement
Plant and Equipment
Asset under construction
Total
Net book value
Opening balance 208.3 115.0 18.9 342.2 Additions 6.2 12.6 14.7 33.5 Capitalisation of assets under construction 6.2 3.2 (9.4) –
Disposals (5.5) (0.3) (3.1) (8.9) Depreciation expense (12.8) (16.6) – (29.4)
Closing balance 202.4 113.9 21.1 337.4
Cost 408.3 479.5 21.1 908.9
Accumulated depreciation (205.9) (365.6) – (571.5)
Closing balance 202.4 113.9 21.1 337.4
1. Comparative information has been provided for the 6 months ended 31 December 2016 in order to provide a meaningful comparison for movements in property, plant and equipment during the 6 month period. Comparative information for the 12 months ended 30 June 2017 can be found in the Group’s 2017 annual report.
For
per
sona
l use
onl
y

Notes to the consolidated financial statements For the Half-Year ended 31 December 2017
Primary Health Care Limited Appendix 4D – Half-Year Report December 2017 30
7. Other intangible assets
31 December 2017 $M
HCP Contractual
Relationship IT Software Licences
Intangible Under
Construction Total
Net book value
Opening balance 115.4 35.9 7.4 7.9 166.6
Additions 14.9 0.9 – 6.1 21.9
Capitalisation of intangible assets under construction – 5.6 – (5.6) –
Amortisation expense (26.0) (7.7) (0.3) – (34.0)
Closing balance 104.3 34.7 7.1 8.4 154.5
Cost 304.8 126.2 35.5 8.4 474.9
Accumulated amortisation (200.5) (91.5) (28.4) – (320.4)
Closing balance 104.3 34.7 7.1 8.4 154.5
31 December 2016 1 $M
HCP Contractual
Relationship IT Software Licences
Intangible Under
Construction
Total
Net book value
Opening balance 164.9 38.8 8.5 8.5 220.7
Additions 20.4 1.1 – 4.4 25.9
Capitalisation of intangible assets under construction – 8.1 – (8.1) –
Disposals (2.5) (0.3) (0.2) (0.5) (3.5)
Amortisation expense (31.2) (6.9) (0.5) – (38.6)
Closing balance 151.6 40.8 7.8 4.3 204.5
Cost 410.4 150.1 35.5 4.3 600.3
Accumulated amortisation (258.8) (109.3) (27.7) – (395.8)
Closing balance 151.6 40.8 7.8 4.3 204.5 1. Comparative information has been provided for the 6 months ended 31 December 2016 in order to provide a meaningful
comparison for movements in intangibles during the 6 month period. Comparative information for the 12 months ended 30 June 2017 can be found in the Group’s 2017 annual report.
For
per
sona
l use
onl
y

Notes to the consolidated financial statements For the Half-Year ended 31 December 2017
Primary Health Care Limited Appendix 4D – Half-Year Report December 2017 31
The fair value of the non-current interest bearing liabilities approximates the carrying amount of gross bank loans disclosed above.
10. Contingent liabilities There were no material changes in contingent liabilities since 30 June 2017.
No. of No. of
11. Issued capital
Shares31
December 2017
000’s
Shares 30
June 2017
000’s
31 December
2017 $M
30 June 2017
$M
Opening balance 521,433 521,433 2,422.8 2,422.8
Shares issued via Short Term Incentive Plan 90 – 0.4 –
Closing balance 521,523 521,433 2,423.2 2,422.8
12. Dividends on equity instruments
31 December
2017 Cents per
share
31 December
2016 Cents per
share
31 December
2017 $M
31 December
2016 $M
Recognised amounts
Final dividend – previous financial year 5.8 6.4 30.2 33.4
Total dividends paid 5.8 6.4 30.2 33.4
Unrecognised amounts
Interim dividend – current financial period 5.1 4.8 The Directors have approved the payment of an interim dividend of 5.1cps 100% franked, to the holders of fully paid ordinary shares, the record date being 19 March 2018 and payable on 27 March 2018. The Dividend Reinvestment Plan (DRP) and Bonus Share Plan (BSP) have been suspended effective 16 February 2016 until further notice. The final dividend for the year ended 30 June 2017 was 100% franked (2016: 100% franked).
8. Interest-bearing liabilities
31 December
2017 $
30 June 2017
$
Non-current
Gross bank loans 885.0 885.0
Unamortised borrowing costs (6.6) (5.6)
878.4 879.4
9. Net tangible asset
31 December
2017 $
30 June 2017
$
Net tangible asset per share (1.26) (1.27)
For
per
sona
l use
onl
y

Notes to the consolidated financial statements For the Half-Year ended 31 December 2017
Primary Health Care Limited Appendix 4D – Half-Year Report December 2017 32
13. Notes to the cash flow statement
31 December
2017 $M
31 December
2016 $M
(a) Reconciliation of cash
For the purposes of the cash flow statement, cash includes cash on hand and in banks, net of outstanding bank overdrafts. Cash at the end of the period as shown in the cash flow statement is reconciled to the related items in the statement of financial position as follows:
Cash 108.0 96.8 (b) Reconciliation of profit from ordinary activities after related income tax to net cash
flows from operating activities
Profit attributable to equity holders 22.1 21.1
Depreciation of plant and equipment 26.7 29.4
Amortisation of intangibles 34.0 38.6
Amortisation of borrowing costs 2.8 1.7
Share based payments expense 2.6 1.4
Non-cash expenses 0.6 1.0
Increase/(decrease) in liabilities;
Trade payables and accruals (4.2) 0.9
Provisions 0.1 4.7
Tax payable 1.4 –
Decrease/(increase) in assets;
Consumables 0.2 (1.8)
Receivables and prepayments 5.3 0.2
Income tax and deferred taxes 13.6 (6.8) Net cash provided by operating activities 105.2 90.4
For
per
sona
l use
onl
y

Notes to the consolidated financial statements For the Half-Year ended 31 December 2017
Primary Health Care Limited Appendix 4D – Half-Year Report December 2017 33
14. Subsequent events In December 2017 Imaging announced the acquisition of Brisbane Private Imaging. The transaction completed in January 2018 and the acquisition will be recognised by the Group in January 2018. Other than the above acquisition, there has not been any other matter or circumstance that has arisen since the end of the period that has significantly affected, the operations of the Group, the results of those operations, or the state of the affairs of the Group’s future financial periods.
For
per
sona
l use
onl
y