Appendix 14.A. Topographic Data for Hydraulic Models
104
SINCLAIR KNIGHT MERZ PAGE 91 Appendix 14.A. Topographic Data for Hydraulic Models
Transcript of Appendix 14.A. Topographic Data for Hydraulic Models

SINCLAIR KNIGHT MERZ PAGE 91
Appendix 14.A. Topographic Data for Hydraulic Models

SINCLAIR KNIGHT MERZ PAGE 92
Table A.14 - Spatial Data Used in the Floodplain Model Construction
Data Description Use
PCC 1m contours 1m contours for Porirua urban areas
showing elevation
Contours supplied to PCC from Terralink
International Ltd, 26thJuly 2005
Contours were captured using
Photogrammetry with ground control and
generally have an accuracy of +/- 1m
Data won’t account for recent earthworks
in major subdivisions
Primary source of elevation data for
the floodplain DEM for the Mike21
component of the hydraulic model
Delineation of sub-catchment
boundaries
PCC 5m contours 5m contours for Porirua rural areas
showing elevation.
Contours supplied to PCC from Terralink
International Ltd, 26thJuly 2005
Contours were captured using
Photogrammetry with ground control and
generally have an accuracy of +/- 3.5m
Contours are recorded as being 98%
complete and data won’t account for
recent earthworks in major subdivisions.
Secondary source of elevation data for
the floodplain DEM for the Mike21
component of the hydraulic model
Delineation of sub-catchment
boundaries
PCC Rural Aerial Photographs Colour aerial photos of Porirua rural district
Photos were flown in February 2005 at
1:2500 using a colour camera
Accuracy of photos is generally +/-7.5m
but worse in hilly areas
Delineation of modelled stream
channel
Model background
PCC Urban Aerial Photographs Colour aerial photos of Porirua urban
district using r27 series and r26 series tiles
Photos were flown by NZAM Ltd. in
January 2009 at 1:500 using a vexel
colour digital camera
Accuracy of photos is generally +/-1.3m
but worse in hilly areas
Delineation of modelled stream
channel
Model background

SINCLAIR KNIGHT MERZ PAGE 93
Appendix 14.B. Rainfall Isohyet Report
B.1 Introduction
Meteorological and hydrological analyses were undertaken to provide up-to-date information for input to road drainage and waterway crossing design.
In 2008 SKM updated the 24-hour storm isohyet maps for the Kapiti Coast District Council. This report presents the data and analyses carried out to extend these isohyet maps south to Wellington.
The study comprised:
Collection of daily and sub-daily rainfall data recorded at all the rainfall stations in the study area
Analysis to determine period and completeness of the rainfall records
Extraction of daily, and where data is available 24-hour, annual maximum rainfall depth time series for each rainfall record
Determine suitable factor to adjust daily rainfall maxima to 24-hour maxima
Regional statistical analysis of annual maximum 24-hour rainfall to determine rainfall depths for return periods of 2, 5, 10, 20, 50 and 100-years for all rainfall stations
Impact of projected climate change on return period rainfall for 2090 time horizon
Preparation of isohyet maps for each return period and current and 2090 climate change scenarios.
Analyses have been carried out to determine the temporal distribution of storm rainfall in the Region that will be used to disaggregate the 24-hour rainfall depths. Accordingly it was not required to analyse shorter duration rainfall as part of this study.

SINCLAIR KNIGHT MERZ PAGE 94
B.2 Rainfall Data
Daily and sub-daily rainfall data was obtained from the Greater Wellington Regional Council and from the National Institute of Water and Atmospheric Research, New Zealand (NIWA) CliFlo database. The stations are listed in Table B together with their location and length of record.
B.2.1 Selection of Rainfall Records
Analyses were carried out to determine the years and extent of missing data in each record. Annual maxima for these years were accepted if:
The maximum occurs at approximately the same time as at least one of the other stations in the area
Periods of missing data did not coincide with the maxima recorded at other nearby stations.
On this basis the number of annual maxima that could be used in the rainfall analysis was determined for each record.
Usually records with less than 15 years of data are considered too short for meaningful statistical analysis. This study is to extend the storm isohyets determined for the Kapiti Coast Region (SKM 2008) south to Wellington. Rainfall records with as few as 13 years of data were used in that study because of the poor distribution of longer records. These records now have 14 years of data and were retained in the dataset.
The rainfall stations listed in Table B are divided into northern and southern geographical regions. The boundary between the regions was set at the southern extent of the isohyets generated for the Kapiti Coast study coinciding with the rainfall station at Paekakariki Hill. This data was included in the regional analysis for both the northern and southern regions.
Table B1 - List of Rainfall Stations
Station Name StationType1
AgentNumber
Network Number
Location RecordLength(Years)
NumberAnnualMaxima Latitude Longitude
Northern Region Arawhata D 3461 E15012 -41.006 175.13 34 24
Kapakapanui P 3329 E05914 -40.926 175.163 14 14
Kapiti Island D 3144 E04891 -40.855 174.932 45 36
MacIntosh 59201 -40.917 175.309
Manakau D 3302 E05722 -40.72 175.216 35 34
Mangaone Transmission Lines P - E05813 -40.836 175.170 14 14
Mt Holdsworth Lodge D 2460 D05944 -40.908 175.476 24 15
Oriwa P 3305 57302 -40.750 175.349 18 15
Otaki 1 D 3296 E05711 -40.764 175.145 77 72
Otaki East D 3299 E05714 -40.76 175.169 13 (12)0
Otaki River at Depot D/P 7362 E05716 -40.770 175.144 26 20
Otaki Temuera St D 3298 E05713 -40.76 175.134 16 14
Paekakariki Hill D 3341 E14091 -41.018 174.98 54 52
Paraparaumu Aero D/P 3145 E04991 -40.907 174.984 59 57
Paraparaumu Aero Aws D 8567 E04994 -40.907 174.984 52 52
Reikorangi D 3327 E05912 -40.903 175.11 35 31

SINCLAIR KNIGHT MERZ PAGE 95
Station Name StationType1
AgentNumber
Network Number
Location RecordLength(Years)
NumberAnnualMaxima Latitude Longitude
Northern Region Taungata P 58201 -40.812 175.255 16 14
Te Horo Longcroft D 3308 E05811 -40.817 175.148 40 39
Te Horo, Jonelle D 7387 E05717 -40.79 175.158 17 15
Titahi Bay T. Plant D 3353 E1418F -41.114 174.817 17 (9)0
Waikanae Waterworks D/P 3307 E05802 -40.889 175.072 38 37
Warwicks P 3322 E05907 -40.957 175.077 28 24

SINCLAIR KNIGHT MERZ PAGE 96
Station Name StationType1
AgentNumber
Network Number
Location RecordLength(Years)
NumberAnnualMaxima Latitude Longitude
Southern Region
Blue Gum Spur P 150010 -41.048 175.019 29 16
Makara 3386 E14273 -41.253 174.694 21 21
Mill Creek Reservoir P 141812 -41.148 174.796 24 19
Paekakariki Hill D 3341 E14091 -41.018 174.98 54 52
Putaputaweta P 150006 -41.012 175.005 7 (6)0
Seton Nossiter Park 142811 -41.210 174.816 18 14
Taupo Stream at Whenua Tapu 140806 -41.056 174.875 19 18
Wellington Aero D 3445 E14387 -41.322 174.804 11 (11)0
Wellington Buckle St D 3431 E14370 -41.3 174.783 7 (7)0
Wellington Glenside D 3401 E14287 -41.208 174.811 7 (7)0
Wellington Kelburn Aws D/P 25354 E1427P -41.285 174.768 4 (4)0
Wellington Newlands D 3400 E14286 -41.233 174.817 4 (4)0
Wellington Newlands D 3402 E14288 -41.229 174.827 2 (2)0
Wellington Rongotai D 3444 E14386 -41.321 174.801 13 (13)0
Wellington, Bowen St D 3389 E14276 -41.283 174.783 2 (2)0
Wellington, Karori D 3392 E14279 -41.284 174.737 2 (2)0
Wellington, Kelburn P 3385 E14272 -41.286 174.767 50 48
Wellington, Knowles Obs D 3383 E14270 -41.283 174.783 7 (6)0
Wellington, Thorndon D 3391 E14278 -41.283 174.783 16 16
Linden D 3355 E14181 -41.181 174.831 33 30
Belmont D 3365 E14191 -41.167 174.900 25 0
Tawa D 3352 E1418E -41.157 174.829 19 17
Judgeford D 3373 E14199 -41.123 174.941 31 22
Moonshine D 3473 E1510D -41.102 175.003 11 (8)0
Annual maximum 24-hour rainfall was extracted from the continuous pluviograph records using the Hilltop data management software used by Greater Wellington Regional Council. The output from this software provides the annual maxima and also identifies years where the data is incomplete and the periods of missing data.
The records for stations where data is read daily were analysed using custom software that extracted the maximum daily rainfall for each year of record and listed the periods of missing data together with the number of days with missing data in each year of record. Daily rainfall measurements are made at the same time each day whereas the 24-hour maximum rainfall can start at any time of the day. Accordingly, the daily maxima need to be adjusted to compensate for the fixed time span. For the Kapiti study (SKM 2008), daily rainfall was factored by 1.16 (obtained from work published by Dwyer and Reed in 1995). The suitability of this factor was reviewed by comparing annual 24-hour maxima and daily maxima for the continuous records. The results showed that the ratio between 24-hour and daily maxima varied between 1.00 and 1.77 with an average of 1.15. Accordingly a factor of 1.16 is reasonable for the region and was retained for this study.
SINCLAIR KNIGHT MERZ PAGE 97
B.3 Frequency Analysis
B.3.1 Frequency Distribution
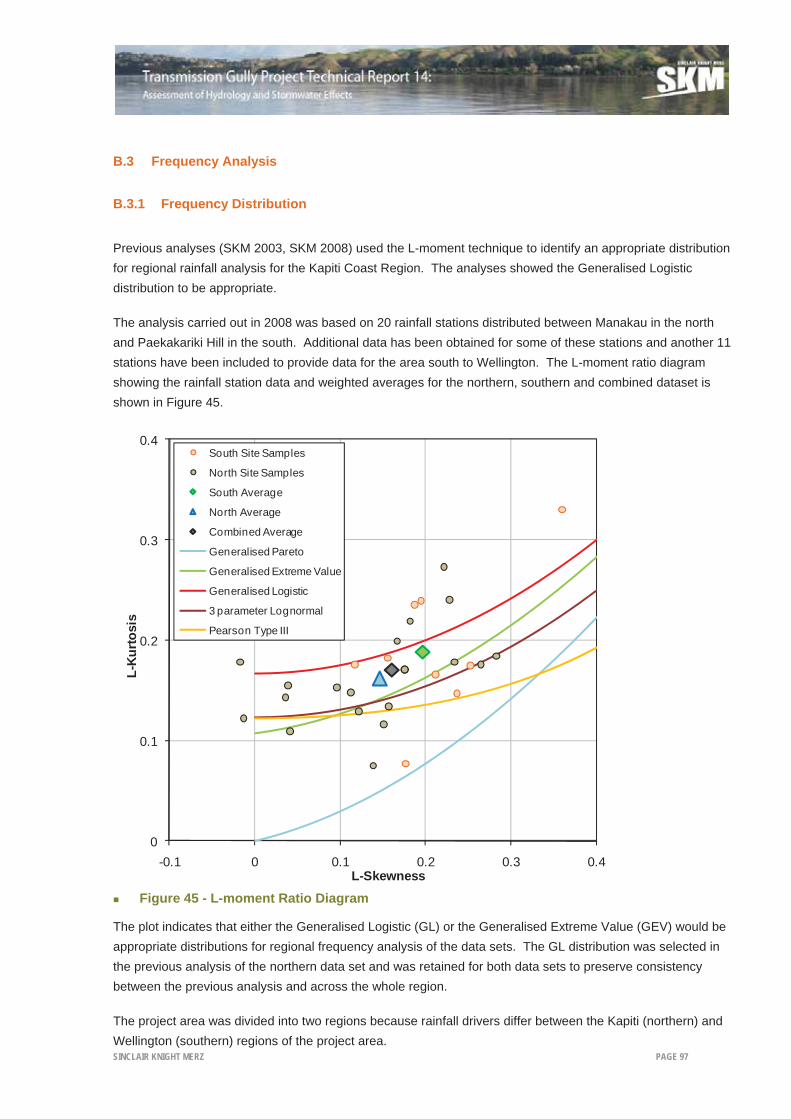
Previous analyses (SKM 2003, SKM 2008) used the L-moment technique to identify an appropriate distribution for regional rainfall analysis for the Kapiti Coast Region. The analyses showed the Generalised Logistic distribution to be appropriate.
The analysis carried out in 2008 was based on 20 rainfall stations distributed between Manakau in the north and Paekakariki Hill in the south. Additional data has been obtained for some of these stations and another 11 stations have been included to provide data for the area south to Wellington. The L-moment ratio diagram showing the rainfall station data and weighted averages for the northern, southern and combined dataset is shown in Figure 45.
Figure 45 - L-moment Ratio Diagram
The plot indicates that either the Generalised Logistic (GL) or the Generalised Extreme Value (GEV) would be appropriate distributions for regional frequency analysis of the data sets. The GL distribution was selected in the previous analysis of the northern data set and was retained for both data sets to preserve consistency between the previous analysis and across the whole region.
The project area was divided into two regions because rainfall drivers differ between the Kapiti (northern) and Wellington (southern) regions of the project area.
0
0.1
0.2
0.3
0.4
-0.1 0 0.1 0.2 0.3 0.4
L-Ku
rtosi
s
L-Skewness
South Site Samples
North Site Samples
South Average
North Average
Combined Average
Generalised Pareto
Generalised Extreme Value
Generalised Logistic
3 parameter Lognormal
Pearson Type III

SINCLAIR KNIGHT MERZ PAGE 98
Regional parameters for the Generalised Logistic distribution were determined using the RegFreq software. The regional parameters were calculated as the average of the individual station parameters weighted according to the number of annual maxima in the respective record. These parameters are listed in Table 15.
Table 15 - Regional Parameters for the Generalised Logistic Distribution
Parameter Parameter Value North South
Location parameter ( ) 0.9625 0.9445
Scale parameter ( ) 0.1548 0.1641
Shape parameter (k) -0.1438 -0.1967
B.3.2 Estimation of Storm Rainfall
The Generalised Logistic distribution was used to estimate 24-hour storm rainfall for a range of recurrence intervals at each of the rainfall stations used in the analysis. These rainfall depths are summarised in Table 16. The values for Paekakariki Hill are the average of the values determined in the northern and southern region analysis.
Table 16 - 24-Hour Storm Rainfall Estimated Using the Generalised Logistic Distribution
Site Name 24-hour storm rainfall (mm) for Average Recurrence Interval (years) 2 5 10 20 50 100
Northern Region Arawhata 130.1 162.1 184.1 206.7 239.1 266.2
Kapakapanui 118.5 147.7 167.7 188.3 217.8 242.5
Kapiti Island 74.5 92.9 105.5 118.4 137.0 152.5
Manakau 71.4 89.1 101.1 113.6 131.4 146.2
Mangaone 96.1 119.8 136.0 152.7 176.7 196.7
McIntosh 225.1 280.6 318.6 357.8 413.9 460.8
Mt Holdsworth 106.6 132.9 150.9 169.4 196.0 218.2
Oriwa 248.9 310.3 352.3 395.6 457.7 509.5
Otaki 1 57.6 71.8 81.5 91.6 105.9 117.9
Otaki Depot 62.3 77.6 88.1 99.0 114.5 127.4
Otaki Temuera 70.1 87.4 99.2 111.4 128.9 143.5
Paekakariki Hill 84.6 106.7 122.3 138.7 162.9 183.6
Paraparaumu Aero 66.0 82.3 93.4 104.9 121.3 135.1
Reikorangi 95.9 119.6 135.8 152.5 176.4 196.4
Te Horo Longcroft 78.4 97.8 111.0 124.7 144.2 160.5
Te Horo Jonelle 77.3 96.3 109.4 122.8 142.1 158.1
Taungata 150.2 187.3 212.6 238.8 276.2 307.5
Waikanae 77.8 97.0 110.2 123.7 143.1 159.3
Warwicks 134.0 167.1 189.7 213.0 246.4 274.3
Southern Region
Blue Gum Spur 118.8 151.7 175.5 201.1 239.5 272.9
Judgeford 67.1 85.7 99.2 113.6 135.3 154.2
Linden 80.1 102.2 118.3 135.5 161.4 183.9

SINCLAIR KNIGHT MERZ PAGE 99
Site Name 24-hour storm rainfall (mm) for Average Recurrence Interval (years) 2 5 10 20 50 100
Makara 81.1 103.5 119.8 137.3 163.4 186.3
Mill Creek Reservoir 68.8 87.8 101.6 116.4 138.6 158.0
Paekakariki Hill 84.6 106.7 122.3 138.7 162.9 183.6
Whenua Tapu 63.8 81.5 94.3 108.0 128.7 146.6
Wellington, Thorndon 73.0 93.2 107.8 123.6 147.1 167.7
Seton Nossiter Park 65.4 83.5 96.6 110.7 131.8 150.2
Salamanca 74.2 94.8 109.7 125.7 149.7 170.6
Tawa 68.5 87.5 101.3 116.1 138.2 157.5
Comparisons were made between the storm rainfall determined for the 2008 update and the current study to assess the impact of additional years of data in some records and omission of three records that were previously used because of their record length. Storm rainfall depths increased by 3.5%, 2.3% and 1.6% for the stations at Warwicks, Manakau and Te Horo Longcroft respectively. For the other stations the difference is less than 0.2%.
B.3.3 Climate Change
The Ministry for the Environment published a guidance manual for Local Government in New Zealand for assessing the expected impact of climate change in May 2008 (MfE 2008). These guidelines were used to estimate the impact that climate change is likely to have on storm rainfall in the Wellington Region at 2040 and 2090 time horizons.
Percentage adjustments to storm rainfall per degree C change in temperature were obtained from Table 5.2 of the guideline and applied to the 2040 and 2090 projected increase in temperature for the Wellington Region of 0.9ºC and 2.1ºC obtained from Table 2.2 and Table 2.3 respectively. Factors for adjusting current storm rainfall to the 2040 and 2090 time horizons are listed in Table 17.
Table 17 - Climate Change Factors for 2040 and 2090 Time Horizons
Return Interval (Years)
2 5 10 20 50 100
Table 5.2 (adjustment to rainfall per 1ºC of warming) 4.3% 5.4% 6.3% 7.2% 8.0% 8.0%
Climate change Factor 2040 1.039 1.049 1.057 1.065 1.072 1.072
Climate change Factor 2090 1.090 1.113 1.132 1.151 1.168 1.168
Projected storm rainfall for the 2040 and 2090 time horizons were calculated using the factors in Table 17 and are summarised in Table 18 and Table 19 respectively.
Table 18 - 24-hour Storm Rainfall 2040 Time Horizon
Site Name 24-Hour Storm Rainfall (mm) for Average Recurrence Interval (years)
2 5 10 20 50 100
Northern Region Arawhata 135.1 170.0 194.5 220.1 256.4 285.4
Kapakapanui 123.0 154.9 177.2 200.5 233.5 259.9
Kapiti Island 77.4 97.4 111.5 126.1 146.9 163.5

SINCLAIR KNIGHT MERZ PAGE 100
Site Name 24-Hour Storm Rainfall (mm) for Average Recurrence Interval (years)
2 5 10 20 50 100
Manakau 74.2 93.4 106.9 120.9 140.8 156.8
Mangaone 99.8 125.6 143.7 162.6 189.4 210.8
McIntosh 233.8 294.3 336.7 381.0 443.7 493.9
Mt Holdsworth 110.7 139.3 159.4 180.4 210.1 233.9
Oriwa 258.5 325.4 372.3 421.3 490.6 546.2
Otaki 1 59.8 75.3 86.2 97.5 113.5 126.4
Otaki Depot 64.7 81.4 93.1 105.4 122.7 136.6
Otaki Temuera 72.8 91.6 104.8 118.6 138.1 153.8
Paekakariki Hill 87.7 111.9 129.5 148.3 175.8 198.7
Paraparaumu Aero 68.5 86.2 98.7 111.7 130.0 144.8
Reikorangi 99.7 125.4 143.5 162.4 189.1 210.5
Te Horo Longcroft 81.5 102.5 117.3 132.7 154.6 172.1
Te Horo Jonelle 80.2 101.0 115.6 130.7 152.3 169.5
Taungata 156.0 196.4 224.7 254.2 296.1 329.6
Waikanae 80.9 101.8 116.4 131.7 153.4 170.8
Warwicks 139.2 175.2 200.5 226.8 264.2 294.1
Southern Region Blue Gum Spur 123.4 159.1 185.5 214.2 256.7 292.6
Judgeford 69.7 89.9 104.8 121.0 145.0 165.3
Linden 83.2 107.2 125.0 144.3 173.0 197.2
Makara 84.2 108.6 126.6 146.2 175.2 199.7
Mill Creek Reservoir 71.4 92.1 107.4 124.0 148.6 169.4
Paekakariki Hill 87.8 111.9 129.2 147.7 174.6 196.8
Whenua Tapu 66.3 85.5 99.6 115.0 137.9 157.2
Wellington, Thorndon 75.8 97.7 114.0 131.6 157.7 179.8
Seton Nossiter Park 67.9 87.5 102.1 117.9 141.3 161.0
Salamanca 77.1 99.4 115.9 133.8 160.4 182.8
Tawa 71.2 91.8 107.0 123.6 148.1 168.8
Table 19 - 24-Hour Storm Rainfall 2090 Time Horizon
Site Name 24-hour Storm Rainfall (mm) for Average Recurrence Interval (years)
2 5 10 20 50 100 Northern Region
Arawhata 141.8 180.5 208.4 238.0 279.3 310.9 Kapakapanui 129.2 164.4 189.9 216.8 254.4 283.2 Kapiti Island 81.2 103.4 119.4 136.3 160.0 178.1 Manakau 77.9 99.2 114.5 130.7 153.4 170.8 Mangaone 104.8 133.4 154.0 175.8 206.3 229.7 McIntosh 245.4 312.4 360.8 411.9 483.4 538.2 Mt Holdsworth 116.2 147.9 170.8 195.0 228.9 254.8 Oriwa 271.4 345.5 398.9 455.4 534.6 595.1 Otaki 1 62.8 80.0 92.3 105.4 123.7 137.7
Otaki Depot 67.9 86.4 99.8 113.9 133.7 148.8
Otaki Temuera 76.4 97.3 112.3 128.2 150.5 167.5
Paekakariki Hill 92.0 118.8 138.8 160.4 191.6 216.4

SINCLAIR KNIGHT MERZ PAGE 101
Site Name 24-hour Storm Rainfall (mm) for Average Recurrence Interval (years)
2 5 10 20 50 100 Paraparaumu Aero 71.9 91.6 105.7 120.7 141.7 157.7
Reikorangi 104.6 133.2 153.8 175.6 206.0 229.4
Te Horo Longcroft 85.5 108.9 125.7 143.5 168.4 187.5
Te Horo Jonelle 84.2 107.2 123.8 141.4 165.9 184.7
Taungata 163.8 208.5 240.8 274.9 322.6 359.2
Waikanae 84.9 108.0 124.8 142.4 167.2 186.1
Warwicks 146.1 186.0 214.8 245.2 287.8 320.4
Southern Region Blue Gum Spur 129.5 168.9 198.7 231.5 279.7 318.8
Judgeford 73.2 95.4 112.3 130.8 158.0 180.1
Linden 87.3 113.8 133.9 156.0 188.5 214.8
Makara 88.4 115.3 135.6 158.0 190.9 217.6
Mill Creek Reservoir 75.0 97.8 115.0 134.0 161.9 184.5
Paekakariki Hill 92.2 118.8 138.5 159.7 190.2 214.4
Whenua Tapu 69.6 90.7 106.8 124.4 150.3 171.3
Wellington, Thorndon 79.6 103.8 122.1 142.3 171.8 195.9
Seton Nossiter Park 71.3 93.0 109.4 127.4 153.9 175.5
Salamanca 80.9 105.5 124.2 144.7 174.8 199.2
Tawa 74.7 97.5 114.7 133.6 161.4 183.9

SINCLAIR KNIGHT MERZ PAGE 102
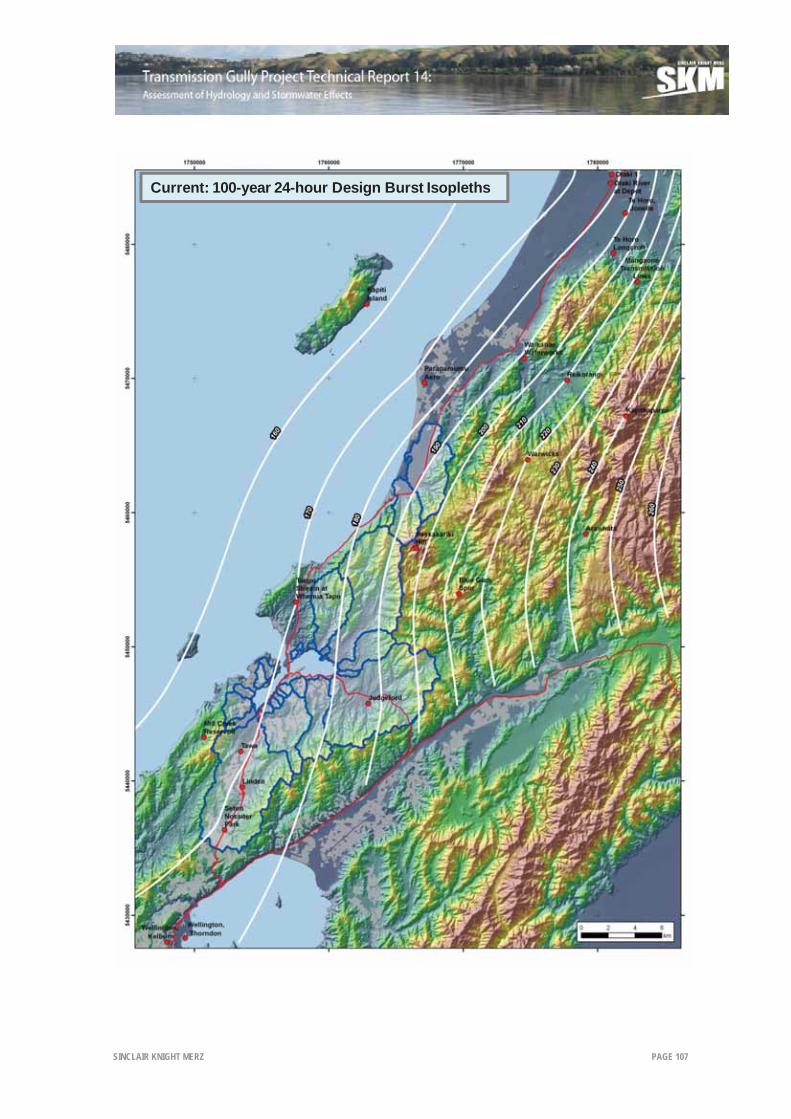
B.4 24-hour Design Burst Isopleths
B.4.1 Current (No Climate Change)
Current: 2-year 24-hour Design Burst Isopleths

SINCLAIR KNIGHT MERZ PAGE 103
Current: 5-year 24-hour Design Burst Isopleths

SINCLAIR KNIGHT MERZ PAGE 104
Current: 10-year 24-hour Design Burst Isopleths

SINCLAIR KNIGHT MERZ PAGE 105
Current: 20-year 24-hour Design Burst Isopleths

SINCLAIR KNIGHT MERZ PAGE 106
Current: 50-year 24-hour Design Burst Isopleths
SINCLAIR KNIGHT MERZ PAGE 107
Current: 100-year 24-hour Design Burst Isopleths
SINCLAIR KNIGHT MERZ PAGE 108
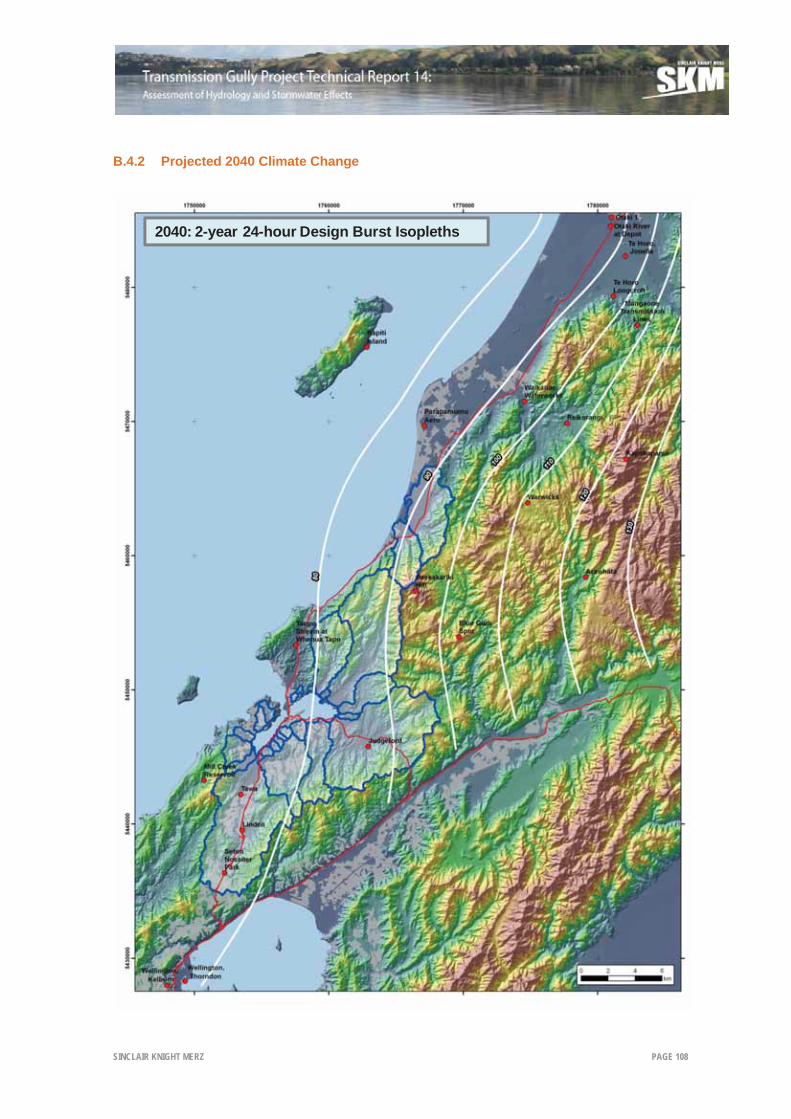
B.4.2 Projected 2040 Climate Change
2040: 2-year 24-hour Design Burst Isopleths
SINCLAIR KNIGHT MERZ PAGE 109
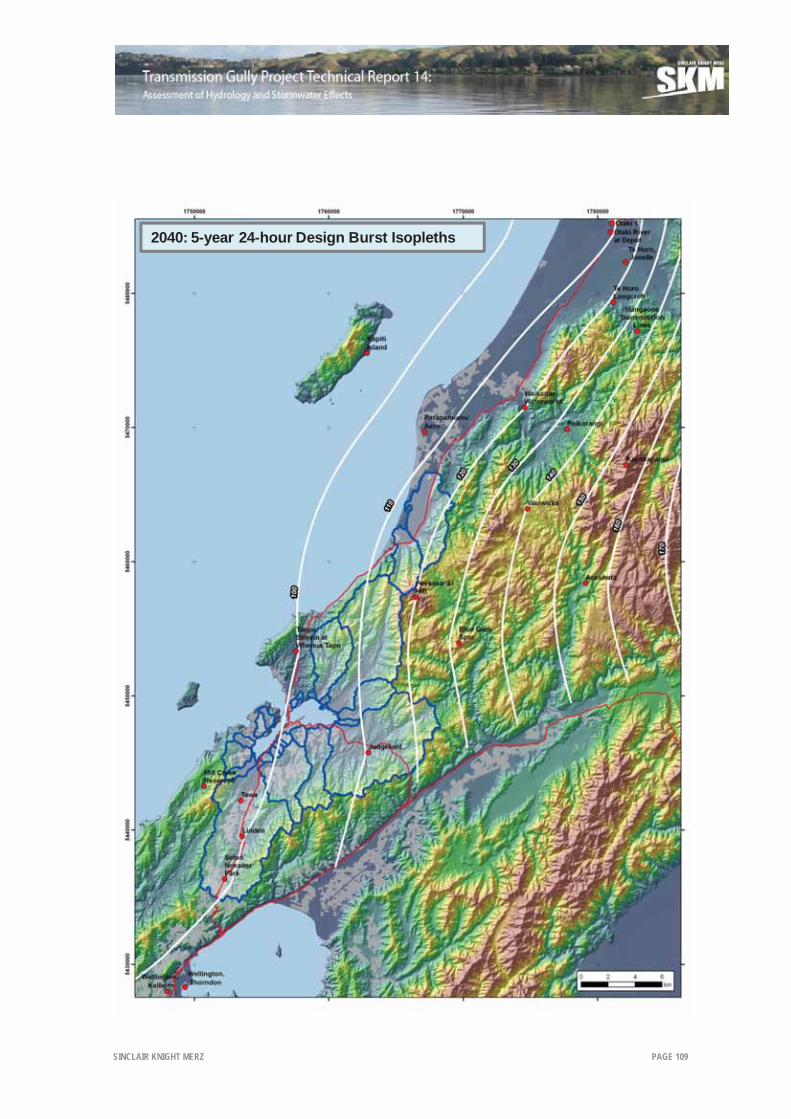
2040: 5-year 24-hour Design Burst Isopleths

SINCLAIR KNIGHT MERZ PAGE 110
2040: 10-year 24-hour Design Burst Isopleths

SINCLAIR KNIGHT MERZ PAGE 111
2040: 20-year 24-hour Design Burst Isopleths

SINCLAIR KNIGHT MERZ PAGE 112
2040: 50-year 24-hour Design Burst Isopleths

SINCLAIR KNIGHT MERZ PAGE 113
2040: 100-year 24-hour Design Burst Isopleths

SINCLAIR KNIGHT MERZ PAGE 114
B.4.3 Projected 2090 Climate Change
2090: 2-year 24-hour Design Burst Isopleths

SINCLAIR KNIGHT MERZ PAGE 115
2090: 5-year 24-hour Design Burst Isopleths
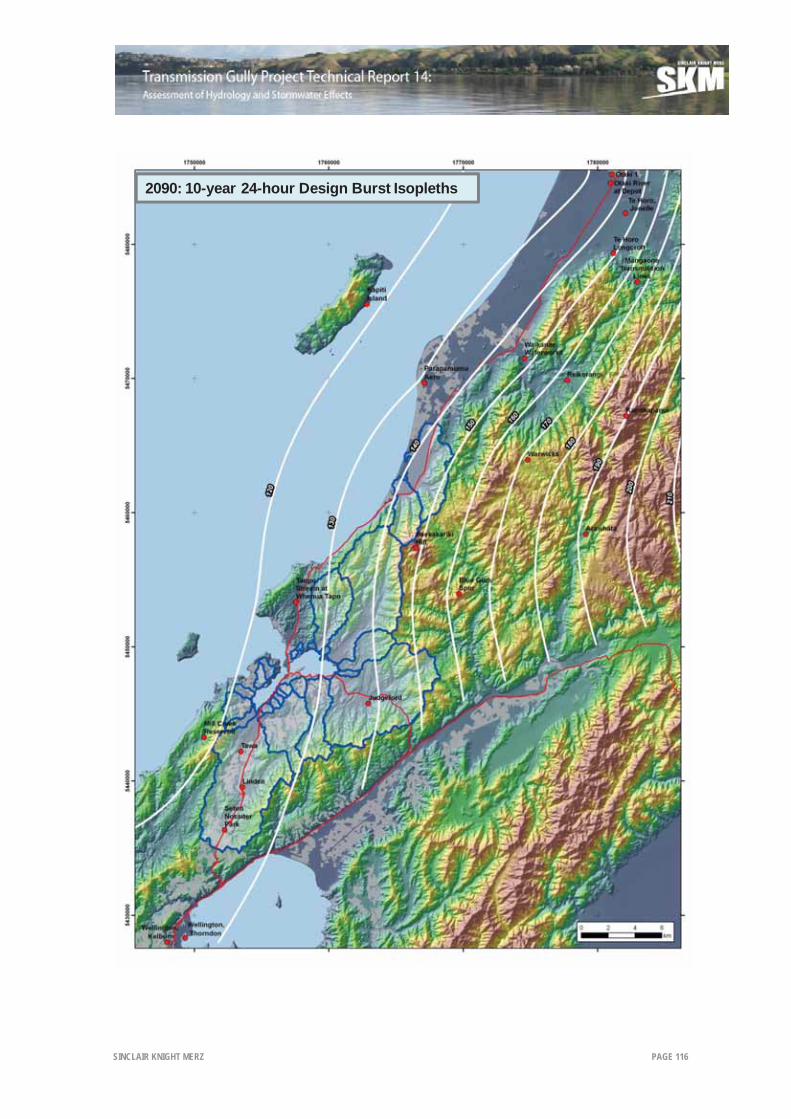
SINCLAIR KNIGHT MERZ PAGE 116
2090: 10-year 24-hour Design Burst Isopleths

SINCLAIR KNIGHT MERZ PAGE 117
2090: 20-year 24-hour Design Burst Isopleths

SINCLAIR KNIGHT MERZ PAGE 118
2090: 50-year 24-hour Design Burst Isopleths

SINCLAIR KNIGHT MERZ PAGE 119
2090: 100-year 24-hour Design Burst Isopleths

SINCLAIR KNIGHT MERZ PAGE 120
Appendix 14.C. Flood Frequency Analysis
This Appendix describes the methodology for flood frequency analysis.
The GetDat software was used to carry out flood frequency analysis on the annual peak flow data for the three streamflow gauges.
Plots showing the General Extreme Value (GEV), General Logistic (GLO), Gumbel (GUM) and Log-Pearson 3 (LP3) distributions together with the input data are presented in Figure 46 to Figure 48 for the Pauatahanui, Porirua and Horokiri respectively.
Based on inspection of the plots the GLO distribution was selected for each of the data sets as most representative of the flood distribution. The flood peaks for the three catchments, based on the GLO distribution are listed in Table 1.
Figure 46 - Pauatahanui Flood Distributions

SINCLAIR KNIGHT MERZ PAGE 121
Figure 47 - Porirua Flood Distributions
Figure 48 - Horokiri Flood Distributions

SINCLAIR KNIGHT MERZ PAGE 122
Table 1 - Summary of ARI floods (Generalised Logistic Distribution)
ARI
(Years)
Peak Discharge (m3/s)
Horokiri Pauatahanui Porirua
2 26 39 32
5 43 52 44
10 55 61 53
15 64 66 59
20 70 70 64
25 75 72 67
30 80 75 70
50 94 82 79
75 106 88 87
100 116 92 93
200 142 102 109
SINCLAIR KNIGHT MERZ PAGE 123
Appendix 14.D. Calibration Results
D.1 Horokiri Catchment
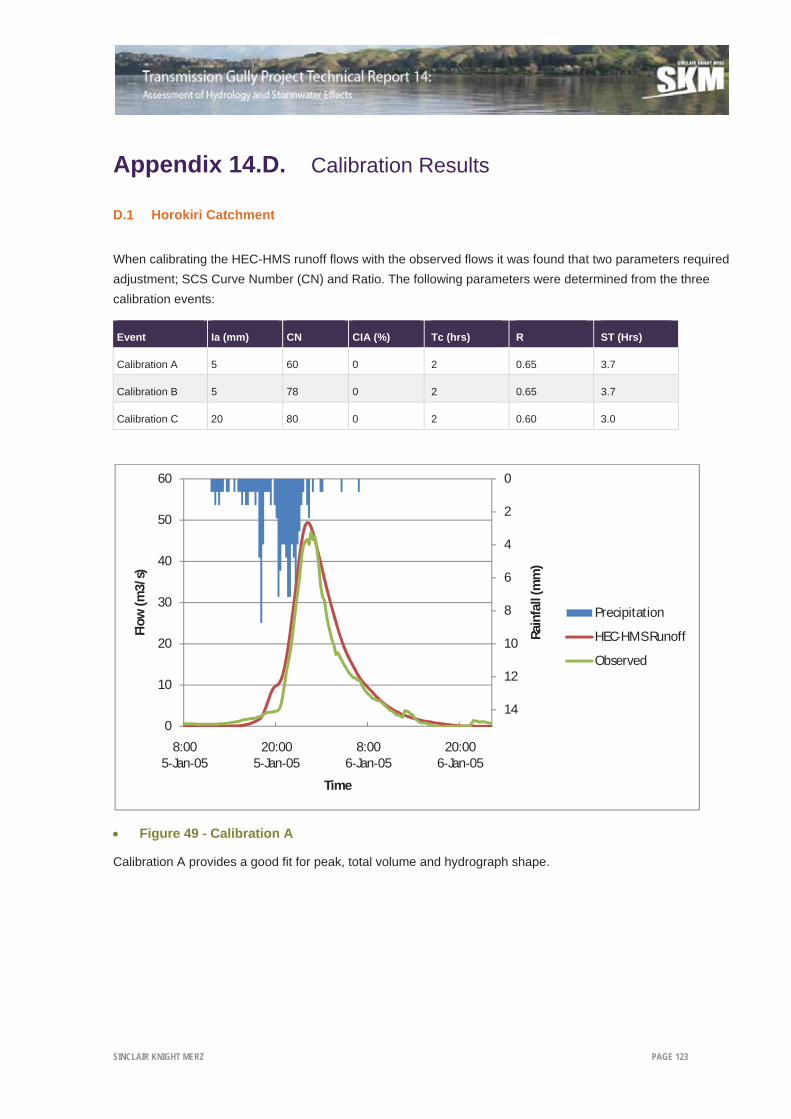
When calibrating the HEC-HMS runoff flows with the observed flows it was found that two parameters required adjustment; SCS Curve Number (CN) and Ratio. The following parameters were determined from the three calibration events:
Event Ia (mm) CN CIA (%) Tc (hrs) R ST (Hrs)
Calibration A 5 60 0 2 0.65 3.7
Calibration B 5 78 0 2 0.65 3.7
Calibration C 20 80 0 2 0.60 3.0
Figure 49 - Calibration A
Calibration A provides a good fit for peak, total volume and hydrograph shape.
0
2
4
6
8
10
12
140
10
20
30
40
50
60
8:005 Jan 05
20:005 Jan 05
8:006 Jan 05
20:006 Jan 05
Rain
fall
(mm
)
Flow
(m3/
s)
Time
Precipitation
HEC HMS Runoff
Observed

SINCLAIR KNIGHT MERZ PAGE 124
Figure 50 - Calibration B
Calibration B provides a good fit for peak and a reasonably good fit for total volume and shape. It can be seen that the simulation slightly underestimates both the rising and receding limb of the hydrograph. This is possibly due to the significant baseflow component which is not being directly modelled.
Figure 51 - Calibration C
0
2
4
6
8
10
12
140
5
10
15
20
25
30
35
40
2:0015 Feb 04
14:0015 Feb 04
2:0016 Feb 04
14:0016 Feb 04
Rain
fall
(mm
)
Flow
(m3/
s)
Time
Precipitation
HEC HMS Runoff
Observed
0
2
4
6
8
10
12
140
10
20
30
40
50
60
70
80
0:003 Oct 03
12:003 Oct 03
0:004 Oct 03
12:004 Oct 03
0:005 Oct 03
12:005 Oct 03
Rain
fall
(mm
)
Flow
(m3/
s)
Time
Precipitation
HEC HMS Runoff
Observed

SINCLAIR KNIGHT MERZ PAGE 125
Calibration C uses a higher initial abstraction in order to accurately model the rising limb of the hydrograph. The peak and general shape of the hydrograph is fits well, the underestimation of the receding limb is possibly due to underrepresentation of rainfall in the catchment.
Using these three calibration events the following conservative catchment characteristics were set:
Catchment Ia (mm) CN CIA (%) Tc (hrs) R ST (Hrs)
Horokiri 5 80 0 2 0.65 3.7
Two validation events were simulated using the set catchment characteristics. We expected the validation events to be more variable, largely due to the fact that the rainfall for these events was more localised and therefore less likely to be well reflected, in both depth and/or distribution, by the surrounding rain gauges.
Figure 52 - Validation D
Validation D depicts an event that is essentially two events over a short period of time. It is shown that the first event is simulated reasonably accurately whereas the second event is overestimated. This overestimation is due to HEC-HMS simulating initial losses only for the first event and not the second as well as a possibility of an overrepresentation of rainfall in the catchment for the second event.
0
2
4
6
8
10
12
140
5
10
15
20
25
30
35
40
45
0:00
…
12:0
0…
0:00
…
12:0
0…
0:00
…
12:0
0…
Rain
fall
(mm
)
Flow
(m3/
s)
Time
Precipitation
HEC HMS Runoff
Observed

SINCLAIR KNIGHT MERZ PAGE 126
Figure 53 - Validation E
Validation E shows a simulation of a small event. It can be seen that the shape of the simulated flow is reasonable however it is difficult to determine if the volume of rainfall is accurately represented. This validation is poor but at least simulated flows are conservative. With the quality of the calibration events it is felt the calibrated numbers should stand.
D.2 Pauatahanui Catchment
When calibrating the HEC-HMS runoff flows with the observed flows it was found that two parameters required adjustment; SCS Curve Number (CN) and Ratio. The following parameters were determined from the three calibration events:
Event Ia (mm) CN CIA (%) Tc (hrs) R ST (Hrs)
Calibration V 5 73 0 1.7 0.65 3.0
Calibration W 5 55 0 1.7 0.65 3.0
Calibration X 5 73 0 1.7 0.65 3.0
0
2
4
6
8
10
12
140
5
10
15
20
25
30
35
40
12:0030 Aug 09
0:0031 Aug 09
12:0031 Aug 09
0:001 Sep 09
12:001 Sep 09
Rain
fall
(mm
)
Flow
(m3/
s)
Time
Precipitation
HEC HMS Runoff
Observed

SINCLAIR KNIGHT MERZ PAGE 127
Figure 54 - Calibration V
Calibration V shows a good fit for peak, total volume and shape. There is a slight under representation in the receding limb of the hydrograph possibly due to baseflow inaccuracies.
Figure 55 - Calibration W
0
2
4
6
8
10
12
140
10
20
30
40
50
60
70
8:005 Jan 05
20:005 Jan 05
8:006 Jan 05
20:006 Jan 05
Rain
fall
(mm
)
Flow
(m3/
s)
Time
Precipitation
HEC HMS Runoff
Observed
0
2
4
6
8
10
12
140
10
20
30
40
50
60
70
2:0015 Feb 04
14:0015 Feb 04
2:0016 Feb 04
14:0016 Feb 04
Rain
fall
(mm
)
Flow
(m3/
s)
Time
Precipitation
HEC HMS Runoff
Observed

SINCLAIR KNIGHT MERZ PAGE 128
Calibration W shows a good fit for peak however the shape of the observed flow is somewhat ‘fatter’ than the simulation. An increase in both CN and R could produce a better fit in this situation however a fit to peak only was viewed as acceptable.
Figure 56 - Calibration X
Calibration X shows a good fit in all aspects, peak, volume and shape, with only a slight preceding flow peak not becoming pronounced in the rainfall distribution.
Using these three calibration events the following catchment characteristics were set:
Catchment Ia (mm) CN CIA (%) Tc (hrs) R ST (Hrs)
Pauatahanui 5 75 0 1.7 0.65 3.0
Two validation events were simulated using the set catchment characteristics. Again we expected the validation events to be more variable due to the fact that the rainfall for these events was more localised and therefore less likely to be well reflected, in both depth and/or distribution, by the surrounding rain gauges.
0
2
4
6
8
10
12
140
10
20
30
40
50
60
70
80
0:003 Oct 03
12:003 Oct 03
0:004 Oct 03
12:004 Oct 03
0:005 Oct 03
12:005 Oct 03
Rain
fall
(mm
)
Flow
(m3/
s)
Time
Precipitation
HEC HMS Runoff
Observed

SINCLAIR KNIGHT MERZ PAGE 129
Figure 57 - Validation Y
Validation Y depicts a slight underestimation of peak and a slightly fatter shape in the runoff response. The observed response is also delayed. These differences can be explained by the rainfall not quite representing what occurred in the catchment both in terms of timing and rainfall peak.
Figure 58 - Validation Z
Validation Z shows an excellent fit with observed data only tending to be slightly conservative with the estimation of flow peak.
0
2
4
6
8
10
12
140
10
20
30
40
50
60
70
12:0020 Dec 82
0:0021 Dec 82
12:0021 Dec 82
20:006 Jan 05
Rain
fall
(mm
)
Flow
(m3/
s)
Time
Precipitation
HEC HMS Runoff
Observed
0
2
4
6
8
10
12
140
10
20
30
40
50
60
0:0023 Jul 09
12:0023 Jul 09
0:0024 Jul 09
20:006 Jan 05
Rain
fall
(mm
)
Flow
(m3/
s)
Time
Precipitation
Runoff
Observed

SINCLAIR KNIGHT MERZ PAGE 130
Based on the calibration and validation results we have decided to retain the calibrated catchment characteristics.
D.3 Summary
The calibration of design storm parameters is considered to be acceptable although it highlights the wide variability of runoff response that can occur from any given rainfall event. The rainfall depths estimate is likely to be the single greatest variable and in the future the analysis would benefit from more rainfall gauges in the upper catchments.
Initially assessed runoff volumes were in the right order of magnitude hence CN numbers only needed to be adjusted slightly however more storage exists in the catchment than had been previously assessed and hence storage R values were increased. Times of concentration were found to be calculated accurately as well as initial abstraction.
Final calibrated catchment characteristics used for the three catchments are summarised in Table 8.
Table 8 - Calibrated Model Parameters in HEC-HMS
Catchment
Name
Area
(km2)
Initial
Abstraction
(mm)
SCS Curve No Impervious
Area
Tc (hr) Ratio
Horokiri 28.7 5 80 0 2.0 0.65
Pauatahanui 38.3 5 75 0 1.7 0.65
Porirua 40.0 4 78 16 2.6 0.65

SINCLAIR KNIGHT MERZ PAGE 131
Appendix 14.E. Hydraulic Assessment Methodology
E.1 Introduction
This report describes in further detail the methodology, assumptions, sensitivity analysis, calibration and verification of the 1D-2D combined hydraulic modelling of the Pauatahanui, Horokiri and Te Puka/Wainui Streams.
E.2 Model Construction
E.2.1 Mike11 Base Model Construction & Assumptions
Using aerial photography the open channels within each of the study areas were schematised for the one dimensional modelling of the channel network. The dimensions and characteristics of structures and channel shape were specified based on cross-section survey data collected and supplied by Opus International Consultants (Opus) for this investigation.
Key structures such as culverts and bridges were represented in the 1D model using the software standard culvert/weir method. Where the length of the structure exceeded the maximum distance between cross-sections (dx max) the structure entrance was represented with a Mike11 culvert structure to take into account entry head losses and the remainder of the structure was represented by closed cross-sections. Inlet head loss coefficients for all modelled culverts have been based on the typical values as found in Austroads (1994), which provides standard entry conditions based on inlet design. For bridges the selection of the factor for the coefficient of contraction was based on the ratio of the bridge opening to the floodplain width. Typically on the constrained floodplains under investigation the contraction coefficient is between 0.1 and 0.3.
To model the effects of channel roughness, resistance values were selected based on the guidelines in Hicks &Mason (1998). The majority of the stream reaches have been modelled using Manning’s roughness coefficient of 0.035.
E.2.2 Mike21 Base Model Construction & Assumptions
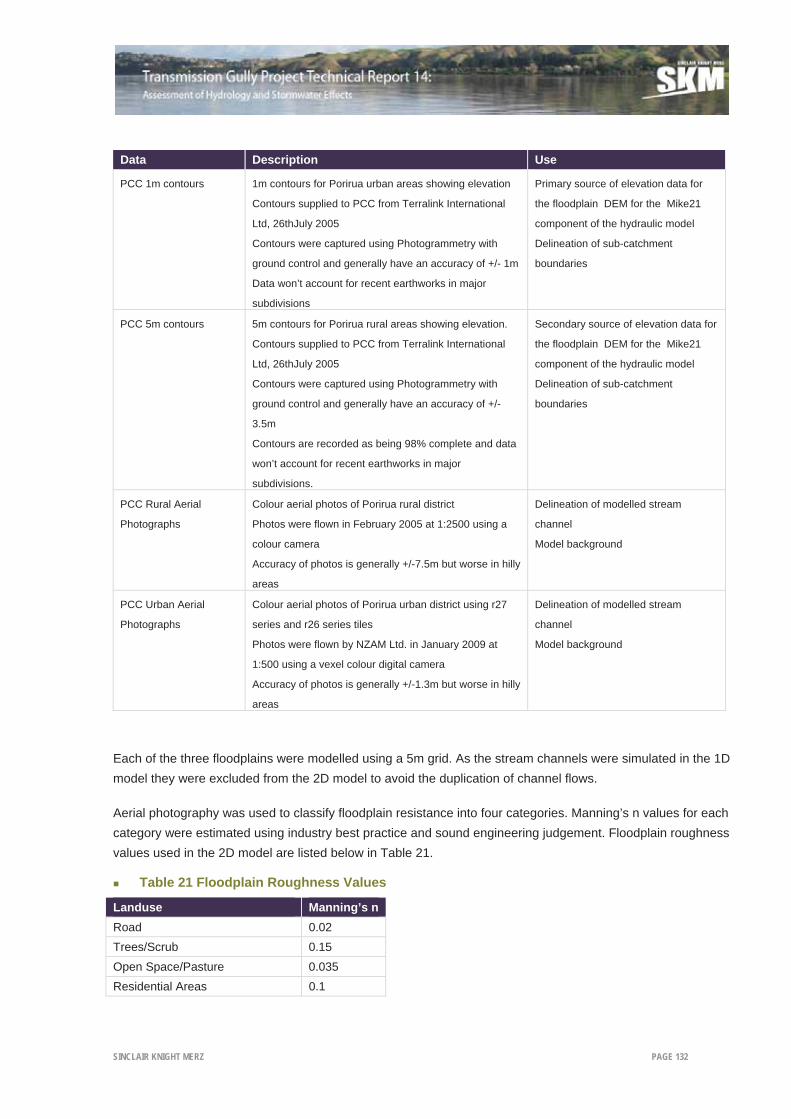
The 2D model bathymetry was prepared from the best available topographic information at the time. The quality of the topographic data varied for each of the study areas but was generally either derived from LiDAR or high resolution contour information supplied by the local authorities including Kapiti Coast District Council (KCDC) and Porirua City Council (PCC). A summary of the topographic data provided is included in Table 20.
Table 20 - Spatial Data Used in the Floodplain Model Construction
Data Description Use
SINCLAIR KNIGHT MERZ PAGE 132
Data Description Use
PCC 1m contours 1m contours for Porirua urban areas showing elevation
Contours supplied to PCC from Terralink International
Ltd, 26thJuly 2005
Contours were captured using Photogrammetry with
ground control and generally have an accuracy of +/- 1m
Data won’t account for recent earthworks in major
subdivisions
Primary source of elevation data for
the floodplain DEM for the Mike21
component of the hydraulic model
Delineation of sub-catchment
boundaries
PCC 5m contours 5m contours for Porirua rural areas showing elevation.
Contours supplied to PCC from Terralink International
Ltd, 26thJuly 2005
Contours were captured using Photogrammetry with
ground control and generally have an accuracy of +/-
3.5m
Contours are recorded as being 98% complete and data
won’t account for recent earthworks in major
subdivisions.
Secondary source of elevation data for
the floodplain DEM for the Mike21
component of the hydraulic model
Delineation of sub-catchment
boundaries
PCC Rural Aerial
Photographs
Colour aerial photos of Porirua rural district
Photos were flown in February 2005 at 1:2500 using a
colour camera
Accuracy of photos is generally +/-7.5m but worse in hilly
areas
Delineation of modelled stream
channel
Model background
PCC Urban Aerial
Photographs
Colour aerial photos of Porirua urban district using r27
series and r26 series tiles
Photos were flown by NZAM Ltd. in January 2009 at
1:500 using a vexel colour digital camera
Accuracy of photos is generally +/-1.3m but worse in hilly
areas
Delineation of modelled stream
channel
Model background
Each of the three floodplains were modelled using a 5m grid. As the stream channels were simulated in the 1D model they were excluded from the 2D model to avoid the duplication of channel flows.
Aerial photography was used to classify floodplain resistance into four categories. Manning’s n values for each category were estimated using industry best practice and sound engineering judgement. Floodplain roughness values used in the 2D model are listed below in Table 21.
Table 21 Floodplain Roughness Values
Landuse Manning’s n Road 0.02 Trees/Scrub 0.15 Open Space/Pasture 0.035 Residential Areas 0.1

SINCLAIR KNIGHT MERZ PAGE 133
E.3 Pauatahanui Stream
The Pauatahanui Stream drains a catchment of approximately 42km2 on the eastern side of the Pauatahanui inlet. The catchment, shown in Figure 59, is bordered by the Collins and Ration Stream catchments to the north and the Duck Creek catchment to the west. The modelling investigation focussed on the catchment area surrounding the Transmission Gully Highway proposed alignment. This area is highlighted by the red square in Figure 59.
Figure 59 - Pauatahanui Catchment & Area of Modelling Investigation
The upper Pauatahanui catchment has numerous steep sided valleys which converge and drain northwest out onto the Pauatahanui floodplain. The total fall over the catchment is greater than 400m, with the peak elevation in the upper catchment in the vicinity of 450m above Mean Sea Level (MSL) and the lower catchment at MSL.
This hydraulic modelling investigation focussed on the lower catchment where the topography opens out from a gorge environment to the Pauatahanui Stream floodplain.
The upper catchment is predominately a mixture of rural pasture land and forestry. As the lower catchment opens up the land use becomes a mixture of rural pasture land, residential and commercial. The residential suburb of Whitby lies on the western boundary and at the northern boundary is Pauatahanui Village.
Crown Copyright reserved

SINCLAIR KNIGHT MERZ PAGE 134
E.3.1 Transmission Gully Project Main Alignment
The Project route through the Pauatahanui Catchment is shown in Figure 60. In relation to the chainages of the scheme design the section of highway located between Chainage 16,200 and Chainage 19,900 are within the Pauatahanui Catchment.
Figure 60 - Proposed Transmission Gully Alignment and Designation
A significant interchange is proposed between the Transmission Gully Highway and State Highway 58 (SH58). This interchange is intended to be located on the floodplain of the stream. Furthermore a “lay down area” to facilitate the highway construction and a weigh station are being investigated at this location. The interchange has been identified as a potential consenting “hotspot” on the proposed alignment, due to the significant footprint of the proposed road and its potential impacts on the Pauatahanui stream.
E.3.2 Pauatahanui Stream Model
The reach of stream channel that was modelled is shown in Figure 14.5. The hydraulic model starts adjacent to the sawmill on SH58 (Paremata-Haywards Road) and extends c3.4km downstream to the Pauatahanui Inlet.

SINCLAIR KNIGHT MERZ PAGE 135
Figure 61 - Modelled Reach of the Pauatahanui Stream
In the upper extent of the model the channel is located in a narrow steep sided gorge. The stream is constrained as it runs adjacent to SH58 until the topography levels out downstream of the Bradey Road Bridge. Downstream of Bradey Road the grade of the stream flattens out as it skirts the western perimeter of the floodplain before passing beneath SH58 at Paremata Rd and the Paremata Rd bridge adjacent to Pauatahanui Villages, and finally into the Pauatahanui arm of Porirua Harbour.
E.3.2.1 Topographic Survey
The lower reach of the Pauatahanui Stream is already crossed by four major structures. As shown in Figure 14.5, SH58 has two bridges while the other two bridges are located on Paremata Road (near Pauatahanui Village) and Bradey Road. The deck and soffit levels of all four structures were surveyed as well as the abutment locations.

SINCLAIR KNIGHT MERZ PAGE 136
Twenty-one cross-sections of the stream were picked up in the survey. The cross sections picked up the channel invert and spot heights between the true left bank and true right bank. Where possible a cross section was surveyed immediately upstream of the bridges to allow accurate representation of the channel at these hydraulic constraints in the stream model.
E.3.3 Pauatahanui Catchment Hydrology
For hydrological inputs into the hydraulic model the Pauatahanui catchment was divided into 10 sub-catchments (refer to Figure 62). The inflow from each sub catchment was extracted from the HEC HMS hydrological model as a discharge time series. Peak flows from the sub-catchments in both the pre construction and the post construction scenario are detailed in Table 22.
Table 22 - Peak Flows – Pauatahanui Hydraulic Model Hydrology
Catchment
Pre Construction Situation Post Construction Situation 10-Year Storm
(Q10)100-Year Storm
Including the Impacts of Climate Change
(Q100cc)
10-Year Storm (Q10)
100-Year Storm Including the Impacts
of Climate Change (Q100cc)
M11Paua1 86.1 197.7 86.1 197.7
M11Paua2 1.1 2.7 1.1 2.7
M11Paua3 0.7 1.7 0.7 1.7
M11Paua4 3.3 7.4 3.3 7.4
M11Paua5 1.5 3.6 1.5 3.6
M11Paua6 0.9 2.2 0.9 2.2
M11Paua7 1.0 2.4 1.2 2.6
M11Paua8 1.8 4.0 2.0 4.2
M11Paua9 3.2 7.3 3.2 7.3
M11Paua10 1.0 2.2 1.0 2.2
Total inflows 100.6 231.2 101 231.6

SINCLAIR KNIGHT MERZ PAGE 137
Figure 62 - Pauatahanui Stream Sub Catchments Calibration
The return period of the rainfall was determined by analysis of the rainfall gauges in the region. Calibration and verification of the catchment characteristics and storm shape in the hydrological model was undertaken based on analysis of specific rainfall events combined with the corresponding data from the Greater Wellington
Crown Copyright reserved

SINCLAIR KNIGHT MERZ PAGE 138
Regional Council (GWRC) flow gauge at Pauatahanui gorge. The hydrological calibration is provided in Appendix 14.E. This analysis was used to develop the inflow hydrographs for the hydraulic model.
The analysis of the gauge data at Pauatahanui gorge indicates that the hydraulic model is likely to be overestimating the flooding for the lower order rainfall events. This is due to the storage in the upper catchment, especially in the area surrounding the golf course, which has not been included in the hydraulic model. However, due to the limited record period of the flow gauge it is difficult to determine if the hydraulic model is also overestimating the flooding in extreme rainfall events such as the 100 year storm event. In larger events the storage in the upper catchment is less likely to influence flows lower down. For this reason a conservative approach was taken and the inflows from the hydrological analysis were not scaled back to account for the storage in the upper catchment.
To provide further confidence in the hydraulic model the results were compared to the model results of previous flood studies in this area. In 2005 Connell Wagner completed flood hazard mapping for PCC on the Pauatahanui stream between the golf course on SH58 and the Pauatahanui Inlet. This work was prompted by flooding of a number of residential properties in January 2005. In this study a 1D hydraulic model of the stream was used to produce flood hazard extents for the 10 year and 100 year storm events without freeboard. As this model was only constructed in 1D the extent of the modelled floodplain was limited to that of the topographic survey undertaken. Because of this the mapping highlighted areas of “unidentifiable flooding”, or areas outside the model extent with the potential to be inundated by stream overflows.
As a coarse verification measure the predicted flood extents for the Transmission Gully investigation were compared with that of the 2005 study. This comparison was coarse as different modelling packages and methodologies were used in the two studies. However, the predicted flooding extents match well between the two studies. Where there are differences they can be explained by either the different approaches to modelling or the differing areas of investigation, as illustrated in Figure 63 and Figure 64.

SINCLAIR KNIGHT MERZ PAGE 139
Figure 63 - Comparison of Flooding Extents Between the 2005 Study and the Current Project: 100-Year Event

SINCLAIR KNIGHT MERZ PAGE 140
Figure 64 - Comparison of Flooding Extents between the 2005 Study and the Current Project: 10-Year Event
E.3.4 Sensitivity Analysis
To assess the impacts of changes in the model variables, a sensitivity analysis was undertaken on two key modelling parameters that could impact the results and alter the outcomes of the analysis. These variables were the downstream tidal boundary and the inflow hydrographs.
SINCLAIR KNIGHT MERZ PAGE 141
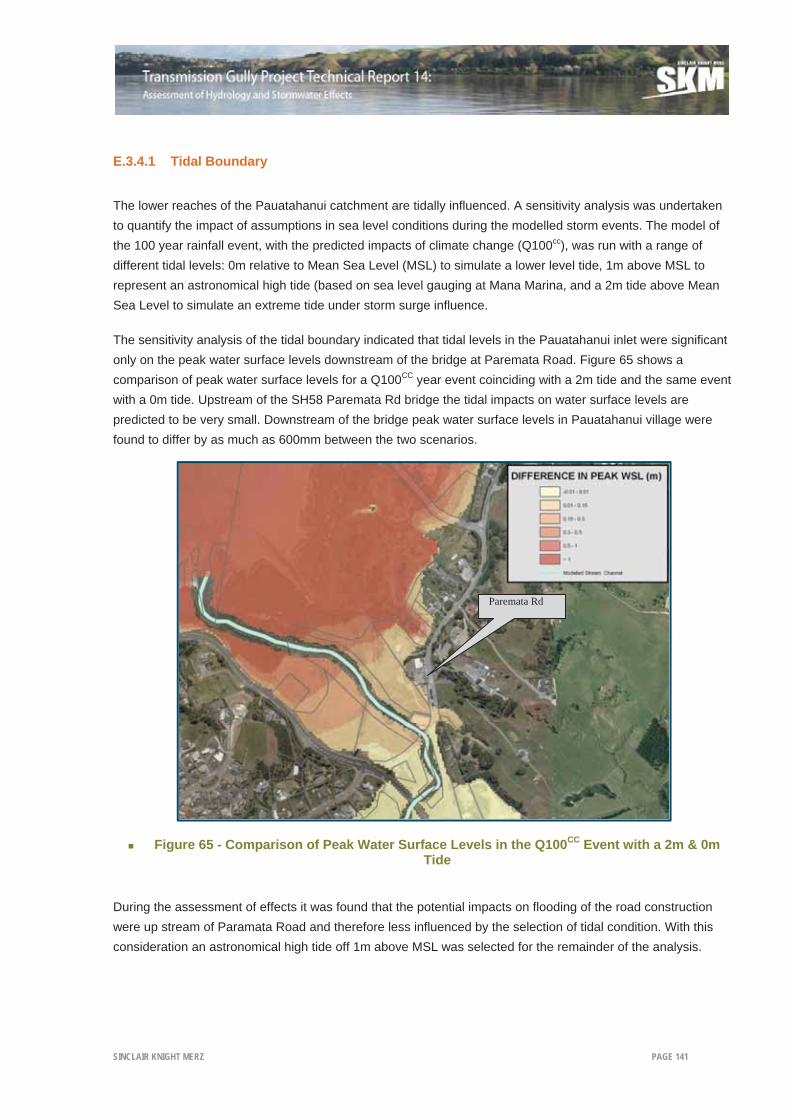
E.3.4.1 Tidal Boundary
The lower reaches of the Pauatahanui catchment are tidally influenced. A sensitivity analysis was undertaken to quantify the impact of assumptions in sea level conditions during the modelled storm events. The model of the 100 year rainfall event, with the predicted impacts of climate change (Q100cc), was run with a range of different tidal levels: 0m relative to Mean Sea Level (MSL) to simulate a lower level tide, 1m above MSL to represent an astronomical high tide (based on sea level gauging at Mana Marina, and a 2m tide above Mean Sea Level to simulate an extreme tide under storm surge influence.
The sensitivity analysis of the tidal boundary indicated that tidal levels in the Pauatahanui inlet were significant only on the peak water surface levels downstream of the bridge at Paremata Road. Figure 65 shows a comparison of peak water surface levels for a Q100CC year event coinciding with a 2m tide and the same event with a 0m tide. Upstream of the SH58 Paremata Rd bridge the tidal impacts on water surface levels are predicted to be very small. Downstream of the bridge peak water surface levels in Pauatahanui village were found to differ by as much as 600mm between the two scenarios.
Figure 65 - Comparison of Peak Water Surface Levels in the Q100CC Event with a 2m & 0m Tide
During the assessment of effects it was found that the potential impacts on flooding of the road construction were up stream of Paramata Road and therefore less influenced by the selection of tidal condition. With this consideration an astronomical high tide off 1m above MSL was selected for the remainder of the analysis.
Paremata Rd

SINCLAIR KNIGHT MERZ PAGE 142
E.3.4.2 Oversized Events
The hydraulic model’s sensitivity to hydrological inputs was tested by running an oversized hydrological event. The oversized event inflow hydrographs were created by increasing the 100 year flood event including the predicted impacts of climate change (100cc), by half again. The results from the oversized event and the 100cc
year ARI event were compared using the model of the pre construction situation. This analysis revealed that the predicted inundation extents in the oversized event did not increase greatly from the 100 year storm event but there were significant increase in the peak water surface levels. Water surface levels upstream of Bradey Road were predicted to increase by between 0.5m and 1m as were water surface levels in the pasture land upstream of the SH58 bridge at Paremata Rd. The lower catchment in the vicinity of Pauatahanui Village was predicted to experience increase in peak water surface levels of between 150mm and 300mm. This comparison influenced the selection of freeboard levels for the proposed bridge design.
E.4 Horokiri Stream
The Horokiri Stream drains a catchment of approximately 33km2 on the eastern side of the Pauatahanui Inlet. The catchment, shown in Figure 66 , is bordered by the Ration Stream catchment to the south, Kakaho Stream catchment to the west and the Te Puka Stream catchment to the north.

SINCLAIR KNIGHT MERZ PAGE 143
Figure 66 Location of Horokiri Catchment
The main stream channel begins at the Wainui Saddle and drains south out into the Pauatahanui arm of the Porirua Harbour. There is significant fall over the catchment with the peak elevation in the upper catchment in the vicinity of 500m above Mean Sea Level (MSL) and the lower catchment (at the southern end) at MSL.
In the upper catchment the steep sided valleys on the western catchment boundary are predominantly forested, whereas, on the eastern boundary the land use is predominantly pasture. As the lower catchment opens up onto the Horokiri Stream floodplain the major land use is rural pasture with pockets of residential dwellings. The majority of dwellings are located on the true right bank of the Horokiri Stream and have private access bridges crossing to Paekakariki Hill Road that runs on the true left bank of the stream.
Crown Copyright reserved

SINCLAIR KNIGHT MERZ PAGE 144
E.4.1 Transmission Gully Project Main Alignment
The Transmission Gully Project route will traverse the upper Horokiri catchment as shown in Figure 14.16. The road alignment runs adjacent to the stream for approximately seven kilometres (scheme design chainages 5,300m to 12,600m) and will cross the main stream channel three times:
Bridge No. 4, scheme design chainage 8,450m
Bridge No. 6, scheme design chainage 9,720m
Bridge No. 8, scheme design chainage 11,750m.
In the upper catchment, the construction of earth fill embankments to support the new highway will require some permanent diversions of the main stream channel.
Figure 67 - Main Alignment in the Horokiri Catchment
Bridge No. 8
Bridge No. 6
Bridge No. 4

SINCLAIR KNIGHT MERZ PAGE 145
E.4.2 Horokiri Stream Model
The reach of the stream channel that has been modelled is shown above in Figure 66 and Figure 14.16. The hydraulic model incorporates c14km of the main stream channel beginning near the Wainui Saddle and extending down to the Pauatahanui Inlet. The hydraulic model also included a reach of the main tributary branch of the stream. This tributary drains the eastern catchment before draining to the main stream channel south of Paekakariki Hill Road. The majority of the modelled channel network is constrained by the steep sided valley topography of the catchment. Only in the reach c1.5km upstream of the Pauatahanui Inlet does the topography open out onto a wide floodplain.
E.4.2.1 Topographic Survey
The majority of the structures crossing the Horokiri stream are located south of Paekakariki Hill Road. Two major culverts pass beneath Paekakariki Hill Road and a triple box culvert passes beneath Grays Road near the stream mouth. The stream is also crossed by numerous private access bridges connecting residential properties on the true right bank with Paekakariki Hill Road on the true left bank of the stream. It was not considered practical to survey all the structures in the stream so only the three major crossings and 14 of the private access bridges identified as being significant hydraulic constraints were surveyed.
Thirty-four cross sections of the stream were picked up in the survey. The cross sections picked up the channel invert and spot heights between the true left bank and true right bank. Where possible a cross section was surveyed immediately upstream of a bridge to allow accurate representation of the channel at these hydraulic constraints in the stream model.
E.4.3 Horokiri Catchment Hydrology
To create hydrological inputs for the hydraulic model, the Horokiri catchment has been subdivided into 15 sub catchments (refer to Figure 68).The inflow from each sub catchment was extracted from the HEC HMS hydrological model as a discharge time series. Peak flows from the sub catchments in both the current pre and the post construction scenario are detailed in Table 23.
Table 23 - Peak Flows – Horokiri Hydraulic Model Hydrology
Catchment Pre-Construction Situation Post-Construction Situation
10-Year Storm(Q10)
100-Year Storm Including the
Impacts of Climate Change (Q100cc)
10-Year Storm (Q10)
100-Year Storm Including the
Impacts of Climate Change
(Q100cc)
M11Horo1 18.7 31.5 18.7 31.5
M11Horo2 1.1 1.9 1.1 2.0
M11Horo3 1.8 3.4 1.9 3.4
M11Horo4 2.0 3.8 2.1 3.8
M11Horo6 2.2 4.1 2.2 4.1
M11Horo8 5.2 9.9 5.3 10.0

SINCLAIR KNIGHT MERZ PAGE 146
Catchment Pre-Construction Situation Post-Construction Situation
10-Year Storm(Q10)
100-Year Storm Including the
Impacts of Climate Change (Q100cc)
10-Year Storm (Q10)
100-Year Storm Including the
Impacts of Climate Change
(Q100cc)
M11Horo9 5.1 9.4 5.2 9.5
M11Horo10 4.3 7.4 4.3 7.4
M11Horo11 2.6 4.4 2.6 4.4
M11Horo12 12.3 22.2 12.4 22.3
M11Horo13 1.2 2.0 1.2 2.1
M11Horo15 1.0 1.7 1.0 1.7
M11Horo18 2.0 3.3 2.0 3.4
M11Horo21 3.7 6.2 3.7 6.2
M11Horo26 7.9 13.1 7.9 13.1
Total Inflows 71.1 124.2 71.5 124.7

SINCLAIR KNIGHT MERZ PAGE 147
Figure 68 - Horokiri Stream Hydraulic Model Catchments
SINCLAIR KNIGHT MERZ PAGE 148
E.4.3.1 Calibration
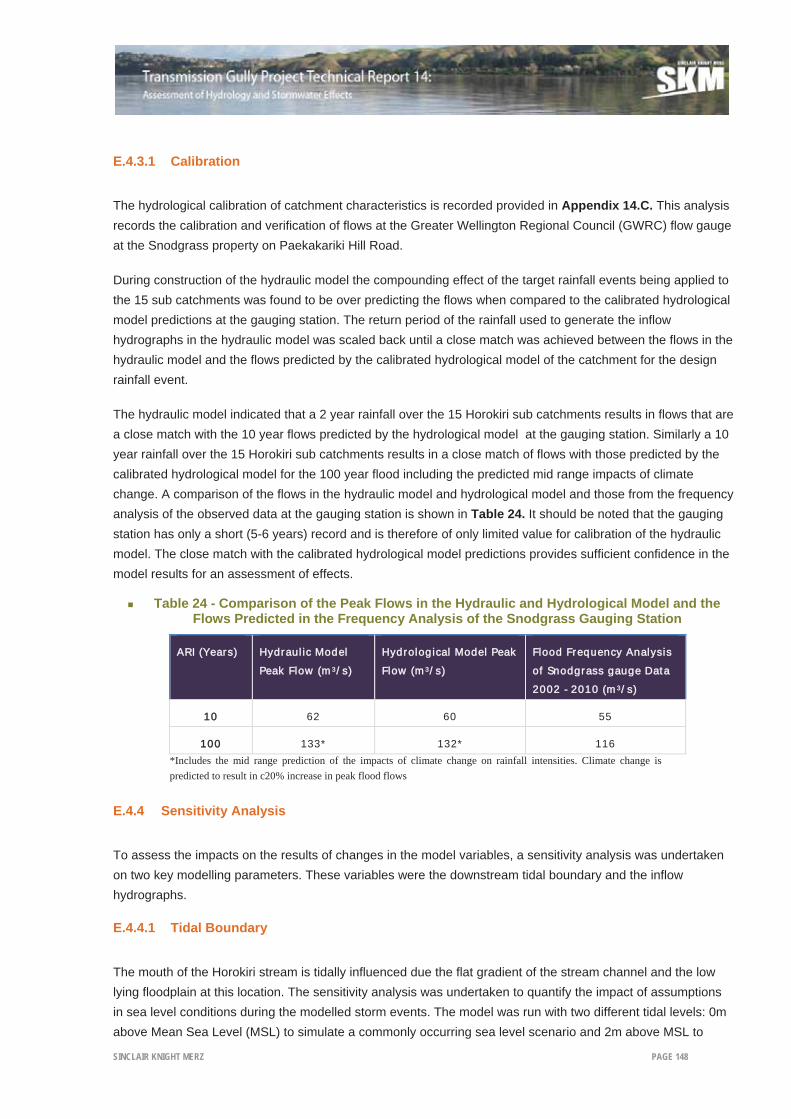
The hydrological calibration of catchment characteristics is recorded provided in Appendix 14.C. This analysis records the calibration and verification of flows at the Greater Wellington Regional Council (GWRC) flow gauge at the Snodgrass property on Paekakariki Hill Road.
During construction of the hydraulic model the compounding effect of the target rainfall events being applied to the 15 sub catchments was found to be over predicting the flows when compared to the calibrated hydrological model predictions at the gauging station. The return period of the rainfall used to generate the inflow hydrographs in the hydraulic model was scaled back until a close match was achieved between the flows in the hydraulic model and the flows predicted by the calibrated hydrological model of the catchment for the design rainfall event.
The hydraulic model indicated that a 2 year rainfall over the 15 Horokiri sub catchments results in flows that are a close match with the 10 year flows predicted by the hydrological model at the gauging station. Similarly a 10 year rainfall over the 15 Horokiri sub catchments results in a close match of flows with those predicted by the calibrated hydrological model for the 100 year flood including the predicted mid range impacts of climate change. A comparison of the flows in the hydraulic model and hydrological model and those from the frequency analysis of the observed data at the gauging station is shown in Table 24. It should be noted that the gauging station has only a short (5-6 years) record and is therefore of only limited value for calibration of the hydraulic model. The close match with the calibrated hydrological model predictions provides sufficient confidence in the model results for an assessment of effects.
Table 24 - Comparison of the Peak Flows in the Hydraulic and Hydrological Model and the Flows Predicted in the Frequency Analysis of the Snodgrass Gauging Station
ARI (Years) Hydraulic Model
Peak Flow (m3/s)
Hydrological Model Peak
Flow (m3/s)
Flood Frequency Analysis
of Snodgrass gauge Data
2002 - 2010 (m3/s)
10 62 60 55
100 133* 132* 116
*Includes the mid range prediction of the impacts of climate change on rainfall intensities. Climate change is predicted to result in c20% increase in peak flood flows
E.4.4 Sensitivity Analysis
To assess the impacts on the results of changes in the model variables, a sensitivity analysis was undertaken on two key modelling parameters. These variables were the downstream tidal boundary and the inflow hydrographs.
E.4.4.1 Tidal Boundary
The mouth of the Horokiri stream is tidally influenced due the flat gradient of the stream channel and the low lying floodplain at this location. The sensitivity analysis was undertaken to quantify the impact of assumptions in sea level conditions during the modelled storm events. The model was run with two different tidal levels: 0m above Mean Sea Level (MSL) to simulate a commonly occurring sea level scenario and 2m above MSL to

SINCLAIR KNIGHT MERZ PAGE 149
simulate an extreme sea level including storm surge and wave setup. These levels were selected following a review of tidal water surface levels from Porirua Harbour.
The sensitivity analysis of the sea level boundary indicated that tidal levels only influenced peak water surface levels within about 500m of the stream mouth. Over the majority of the modelled stream network, tidal boundary conditions in the Pauatahanui Inlet were predicted to have no significant impact on peak water surface levels in the stream channel and on the floodplain and therefore little influence on the assessment of hydraulic effects. With this consideration, a mid range boundary condition of 1m above MSL was selected for hydraulic modelling of the pre and post road construction scenarios.
E.4.4.2 Oversized Events
The hydraulic model’s sensitivity to hydrological inputs was tested by running it with an oversized hydrological event and comparing it to the bridge design event. To create the oversized event inflow hydrographs for the hydraulic model, the 100 year storm rainfall including the mid range prediction of climate change was applied across all sub catchments. This resulted in over double the predicted flows for a 100 year flood at the gauging station.
The results of the oversized event revealed significant increases in flooding extents and peak water surface levels over the majority of the modelled stream network. Upstream of Paekakariki Hill Road peak water surface levels were predicted to increase by up to 500mm, while in the lower catchment, downstream of Paekakariki Hill Road, water surface levels were, in places, found to have increased by greater than 1m.
As the Transmission Gully Highway only crosses the Horokiri Stream upstream of Paekakariki Hill Road, this oversized event provided some confidence in the selection of a minimum of 600mm freeboard, from the TransitBridge Manual, when sizing the three proposed bridge crossings.
E.5 Te Puka and Wainui Stream
The topography traversed by the Te Puka and Wainui Streams is typical of the Kapiti Region. The steep upper catchment drops down onto an undulating dune environment. This change in grade between the hills and the coastal zone, combined with the restrictions as the stream runs through the dunes, has resulted in historical flooding problems for the developed land surrounding the stream. For this reason, and the difficulty of constructing a highway through the steep sided valley, these streams have been classified as critical streams and have been investigated in detail to identify the effects of the Transmission Gully Project.
SINCLAIR KNIGHT MERZ PAGE 150
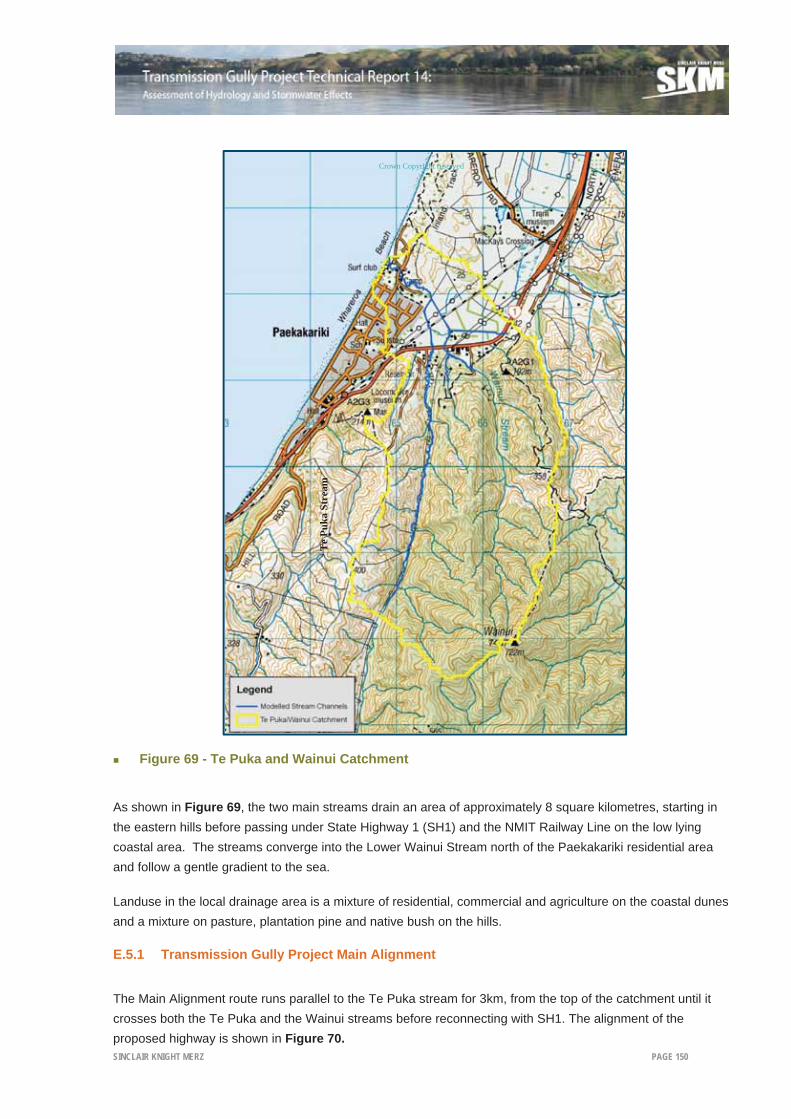
Figure 69 - Te Puka and Wainui Catchment
As shown in Figure 69, the two main streams drain an area of approximately 8 square kilometres, starting in the eastern hills before passing under State Highway 1 (SH1) and the NMIT Railway Line on the low lying coastal area. The streams converge into the Lower Wainui Stream north of the Paekakariki residential area and follow a gentle gradient to the sea.
Landuse in the local drainage area is a mixture of residential, commercial and agriculture on the coastal dunes and a mixture on pasture, plantation pine and native bush on the hills.
E.5.1 Transmission Gully Project Main Alignment
The Main Alignment route runs parallel to the Te Puka stream for 3km, from the top of the catchment until it crosses both the Te Puka and the Wainui streams before reconnecting with SH1. The alignment of the proposed highway is shown in Figure 70.
Te
Puka
Str
eam
Crown Copyright reserved

SINCLAIR KNIGHT MERZ PAGE 151
Figure 70 - Proposed Transmission Gully Alignment and Designation
In this catchment the construction of the highway is complicated by the steep sides of the Te Puka valley. To construct the highway it is likely that in places the earthworks will encroach on to the existing stream, resulting in a number of stream diversions. The hydraulic model has been used to assist in the design of the diversions and identify changes in the stream hydraulics. The model has also been used to appropriately locate and size the stream crossings to help avoid or reduce impacts on the waterway.
E.5.2 Te Puka and Wainui Stream Model
The reaches of the stream channels that were hydraulically modelled are shown above in Figure 70. Almost the full length of the Te Puka has been modelled from the saddle between the Horokiri and Te Puka valleys down to the coast. Only the lower reaches of the Wainui Stream have been modelled as the new highway encroaches on the stream much lower in its catchment.

SINCLAIR KNIGHT MERZ PAGE 152
While a coupled 1D/2D model was used, the steep sides of the Te Puka valley mean that much of the upper catchment was modelled only in the 1D model of the stream. It was only when the floodplain opens out near the coast that flooding spilled out onto the 2D model.
E.5.2.1 Topographic Survey
There are seven major structures on the Te Puka / Wainui Stream including various tributaries that pass through culverts under the State highway and railway line, a weir on the main channel west of the highway and the bridge at the southern entrance to QE2 Park. The dimensions of each structure were surveyed as part of this project (see Figure 71).
Figure 71 - Major Structures on the Te Puka / Wainui Stream
28 cross sections of the stream were picked up in the survey. The cross sections picked up the channel invert and spot heights between the true left bank and true right bank. Where possible a cross section was surveyed immediately upstream of the bridges to allow accurate representation of the channel at these hydraulic constraints in the stream model.
E.5.3 Te Puka and Wainui Catchment Hydrology
For the hydrological inputs into the hydraulic model the Te Puka catchment has been subdivided into 25 sub catchments (see Figure 72). The inflow from each sub catchment was extracted from the hydrological model as a discharge time series for entry into the hydraulic model. Peak flows from the sub catchments in both the pre and post construction scenario are detailed in Table 25.

SINCLAIR KNIGHT MERZ PAGE 153
Table 25 - Peak Flows – Te Puka MikeFlood Hydrology
Catchment Pre- Construction Situation Post- Construction Situation
10- Year Storm
(Q10)
100- Year Storm
Including the Impacts
of Climate Change
(Q100cc)
10- Year Storm
(Q10)
100- Year Storm
Including the Impacts of
Climate Change (Q100cc)
M11Wain1 5.2 11.2 5.2 11.2
M11Wain2 1.5 3.1 1.6 3.2
M11Wain3 1.7 3.3 1.7 3.3
M11Wain4 0.7 1.3 0.7 1.3
M11Wain5 2.2 4.9 2.2 4.9
M11Wain6 0.8 1.6 0.8 1.6
M11Wain7 4.0 8.4 4.0 8.4
M11Wain8 0.7 1.5 0.8 1.5
M11Wain9 0.9 1.9 1.0 1.9
M11Wain10 1.1 2.2 1.1 2.2
M11Wain11 0.7 1.4 0.7 1.4
M11Wain12 1.1 2.2 1.1 2.2
M11Wain13 13.4 28.4 13.4 28.4
M11Wain14 1.0 2.2 1.1 2.2
M11Wain15 0.8 1.8 0.9 1.8
M11Wain16 0.7 1.6 0.7 1.6
M11Wain17 1.3 2.8 1.4 2.9
M11Wain18 1.6 3.3 1.6 3.3
M11Wain19 0.9 1.9 0.9 1.9
M11Wain20 0.8 1.9 0.8 1.9
M11Wain21 0.4 0.9 0.4 0.9
M11Wain22 0.2 0.4 0.2 0.4
M11Wain23 0.8 2.0 0.8 2.1
M11Wain24 0.1 0.3 0.1 0.3
M11Wain25 0.2 0.5 0.2 0.5
Total 42.8 91 43.4 91.3

SINCLAIR KNIGHT MERZ PAGE 154
Figure 72 - Te Puka and Wainui Streams Sub Catchments
Note: The catchment, in the northern residential area of Paekakariki, is drained by a long section of stormwater pipe that has not been included in the model. Given the topography and size of the stormwater system it is not considered that this catchment will contribute significantly to the stream flows.

SINCLAIR KNIGHT MERZ PAGE 155
E.5.3.1 Calibration
Very little calibration information was available for either the Te Puka or the Wainui Streams. As neither stream was gauged the calibration has relied on historical flood records to confirm the sensibility of the results. The flood extents were compared with Kapiti Coast District Councils flood records database which records flood damage to buildings. The model extents have also been confirmed as being in line with the experience of Kapiti Coast District Council Stormwater Asset Managers who have a detailed understanding of the flooding issues in this catchment.
A conservative approach to the modelling of runoff from the stream catchment has been taken. The 100 and 10 year rainfall events were used on each of the sub-catchments. With this assumption it is possible that at the lower end of the model the peak water levels are likely to be overestimating the flooding for the return period event being modelled.
E.5.4 Sensitivity Analysis
To assess the impacts of changes in the model variables, a sensitivity analysis was undertaken on two key modelling parameters that could impact the results and alter the outcomes of the analysis. These variables were the downstream tidal boundary and the inflow hydrographs.
E.5.4.1 Tidal Boundary
The lower reaches of the catchment are tidally influenced. The sensitivity analysis was undertaken to quantify the impact of assumptions in sea level conditions during the modelled storm events. The model of the 100 year storm event was run with two different tidal levels: an oscillating sea level to simulate an astronomical tide and the same boundary raised by 1.5m to account for storm surge, wave setup and the predicted impacts of climate change.
The modelling results showed that the sea level conditions had very little impact on the catchment flooding in high rainfall events. The reason for this largely relates to the bridge at the southern entrance to QE2 Park. This bridge is a constraint to high flows that masks the influence of the sea level.
E.5.4.2 Oversized Events
The oversized event inflow hydrographs were created by increasing the 100 year flood event, including the mid range predictions of climate change, by half again. This was used to assess the hydraulic model’s sensitivity to variations in hydrological inputs. A comparison of the 100cc year flood flows and the oversized event is shown in Figure 73. These results show that as the floodplain opens up between the hills and the dunes there is up to 500mm difference in flood levels. Flooding on residential property, the highway and the railway is increased by 100-200mm. This provides a measure of confidence in the appropriateness of the freeboard allowance required in the NZTA Bridge Manual that culverts and bridges must convey the 100 year flows with a maximum water depth of 500mm below the carriageway level.

SINCLAIR KNIGHT MERZ PAGE 156
Figure 73 - Comparison of Peak Water Surface Levels Between a 100-Year Event and an Oversized Event

SINCLAIR KNIGHT MERZ PAGE 157
Appendix 14.F. Culvert Catchment Assessment
Table 26 - Culvert Catchment Characteristics
MainCatchment Sub-catchment
Loss Rate Method - SCS Curve Number
Runoff Method - Clark's Unit Hydrograph Q10CC Q100CC
Area(km²)
Initial Abstraction CN CIA
(%) Tc
(Hrs) RatioStorageCoefficie
nt (R) Wainui Wainui 1 0.1 5 78 0 0.26 0.65 0.48 0.841 1.531
Wainui Wainui 2 0.18 5 74 0 0.2 0.65 0.37 1.579 2.963
Wainui Wainui 3 2.64 5 78 0 0.26 0.65 0.48 22.596 41.211
Wainui Wainui 4 0.21 5 79 0 0.28 0.65 0.52 1.719 3.091
Wainui TePuka 1 3.14 5 79 0 0.21 0.65 0.39 29.405 53.441
Wainui TePuka 2 0.09 5 84 0 0.2 0.65 0.38 0.958 1.661
Wainui TePuka 3 0.09 5 84 0 0.26 0.65 0.47 0.86 1.489
Wainui TePuka 4 0.03 5 84 0 0.24 0.65 0.44 0.295 0.51
Wainui TePuka 5 0.1 5 85 0 0.25 0.65 0.47 0.976 1.675
Wainui TePuka 6 0.02 5 84 0 0.17 0.65 0.31 0.237 0.411
Wainui TePuka 7 0.05 5 84 0 0.23 0.65 0.42 0.501 0.865
Wainui TePuka 8 0.08 5 85 0 0.24 0.65 0.44 0.803 1.377
Wainui TePuka 9 0.08 5 84 0 0.24 0.65 0.45 0.779 1.347
Wainui TePuka 10 0.15 5 84 0 0.23 0.65 0.43 1.488 2.57
Wainui TePuka 11 0.04 5 85 0 0.25 0.65 0.46 0.394 0.678
Wainui TePuka 12 0.07 5 84 0 0.28 0.65 0.51 0.64 1.109
Wainui TePuka 13 0.07 5 85 0 0.16 0.65 0.3 0.856 1.472
Wainui TePuka 14 0.03 5 84 0 0.17 0.65 0.31 0.356 0.617
Wainui TePuka 15 0.02 5 85 0 0.21 0.65 0.39 0.213 0.367
Horokiri Horokiri 1 4.48 5 76 0 0.28 0.65 0.51 34.291 63.793
Horokiri Horokiri 2 0.09 5 85 0 0.17 0.65 0.32 1.073 1.844
Horokiri Horokiri 3 0.1 5 85 0 0.24 0.65 0.45 0.989 1.704
Horokiri Horokiri 4 0.12 5 84 0 0.24 0.65 0.44 1.176 2.041
Horokiri Horokiri 5 0.04 5 85 0 0.2 0.65 0.37 0.44 0.759
Horokiri Horokiri 6A 0.02 5 85 0 0.17 0.65 0.31 0.242 0.416
Horokiri Horokiri 6B 0.01 5 84 0 0.17 0.65 0.31 0.119 0.206
Horokiri Horokiri 7 0.17 5 85 0 0.21 0.65 0.4 1.781 3.08
Horokiri Horokiri 8 0.01 5 85 0 0.17 0.65 0.31 0.121 0.208
Horokiri Horokiri 9 0.05 5 85 0 0.18 0.65 0.33 0.586 1.009
Horokiri Horokiri 10 0.03 5 84 0 0.19 0.65 0.35 0.334 0.58
Horokiri Horokiri 11 0.04 5 85 0 0.24 0.65 0.45 0.397 0.683
Horokiri Horokiri 12 0.06 5 85 0 0.22 0.65 0.42 0.611 1.055

SINCLAIR KNIGHT MERZ PAGE 158
MainCatchment Sub-catchment
Loss Rate Method - SCS Curve Number
Runoff Method - Clark's Unit Hydrograph Q10CC Q100CC
Area(km²)
Initial Abstraction CN CIA
(%) Tc
(Hrs) RatioStorageCoefficie
nt (R) Horokiri Horokiri 13 0.05 5 84 0 0.18 0.65 0.33 0.575 0.998
Horokiri Horokiri 14 0.03 5 84 0 0.22 0.65 0.41 0.303 0.528
Horokiri Horokiri 15 0.15 5 72 0 0.21 0.65 0.4 1.185 2.264
Horokiri Horokiri 16 0.15 5 70 0 0.22 0.65 0.41 1.114 2.146
Horokiri Horokiri 17 0.07 5 70 0 0.16 0.65 0.3 0.619 1.193
Horokiri Horokiri 18 0.1 5 69 0 0.2 0.65 0.37 0.771 1.503
Horokiri Horokiri 19 0.09 5 69 0 0.18 0.65 0.33 0.743 1.444
Horokiri Horokiri 20 0.04 5 69 0 0.16 0.65 0.3 0.347 0.676
Horokiri Horokiri 21 0.55 5 77 0 0.35 0.65 0.64 3.809 7.017
Horokiri Horokiri 21A 0.11 5 79 0 0.23 0.65 0.42 0.998 1.811
Horokiri Horokiri 22 0.06 5 82 0 0.26 0.65 0.47 0.554 0.982
Horokiri Horokiri 23 0.03 5 82 0 0.19 0.65 0.36 0.318 0.565
Horokiri Horokiri 24 1.06 5 80 0 0.56 0.65 1.04 6.125 11.099
Horokiri Horokiri 25 11.28 5 79 0 0.67 0.65 1.25 54.94 100.861
Horokiri Horokiri 26 0.03 5 81 0 0.17 0.65 0.31 0.335 0.599
Horokiri Horokiri 27 0.03 5 84 0 0.17 0.65 0.32 0.35 0.613
Horokiri Horokiri 28 0.05 5 81 0 0.17 0.65 0.31 0.556 0.991
Horokiri Horokiri 29 0.03 5 80 0 0.17 0.65 0.31 0.327 0.587
Horokiri Horokiri 30 0.01 5 83 0 0.17 0.65 0.31 0.116 0.203
Horokiri Horokiri 31 0.01 5 83 0 0.17 0.65 0.31 0.114 0.203
Horokiri Horokiri 32 0.01 5 83 0 0.17 0.65 0.31 0.114 0.203
Horokiri Horokiri 33 0.04 5 82 0 0.17 0.65 0.31 0.449 0.802
Horokiri Horokiri 34 0.02 5 71 0 0.19 0.65 0.36 0.163 0.316
Horokiri Horokiri 35 0.05 5 77 0 0.19 0.65 0.35 0.473 0.882
Horokiri Horokiri 36 0.06 5 79 0 0.22 0.65 0.41 0.536 0.988
Horokiri Horokiri 37 0.04 5 84 0 0.2 0.65 0.37 0.424 0.749
Horokiri Horokiri 38 0.03 5 85 0 0.17 0.65 0.31 0.357 0.623
Ration Ration 1 0.47 5 83 0 0.29 0.65 0.54 4.05 7.198
Ration Ration 2 0.02 5 85 0 0.18 0.65 0.34 0.228 0.398
Ration Ration 3 0.12 5 84 0 0.33 0.65 0.61 0.973 1.725
Ration Ration 4 0.01 5 84 0 0.21 0.65 0.39 0.103 0.181
Ration Ration 5 0.03 5 84 0 0.18 0.65 0.33 0.339 0.598
Ration Ration 6 0.01 5 82 0 0.2 0.65 0.37 0.102 0.183
Ration Ration 7 1.49 5 82 0 0.22 0.65 0.41 14.459 25.762
Ration Ration 8 0.29 5 83 0 0.17 0.65 0.31 3.316 5.889

SINCLAIR KNIGHT MERZ PAGE 159
MainCatchment Sub-catchment
Loss Rate Method - SCS Curve Number
Runoff Method - Clark's Unit Hydrograph Q10CC Q100CC
Area(km²)
Initial Abstraction CN CIA
(%) Tc
(Hrs) RatioStorageCoefficie
nt (R) Ration Ration 9 0.05 5 84 0 0.27 0.65 0.5 0.446 0.802
Ration Ration 10 1.08 5 83 0 0.5 0.65 0.92 6.78 12.151
Ration Ration 10a 0.02 5 85 0 0.32 0.65 0.59 0.168 0.269
Ration Ration 11 0.08 5 85 0 0.17 0.65 0.31 0.924 1.614
Ration Ration 12 0.02 5 84 0 0.28 0.65 0.52 0.173 0.306
Ration Ration 13 0.13 5 83 0 0.29 0.65 0.53 1.085 1.938
Ration Ration 14 0.05 5 85 0 0.31 0.65 0.57 0.41 0.73
Pauatahanui Pauatahanui 1 0.28 5 79 0 0.31 0.65 0.57 2.013 3.767
Pauatahanui Pauatahanui 2 0.15 5 79 0 0.25 0.65 0.47 1.205 2.255
Pauatahanui Pauatahanui 3 0.01 5 80 0 0.24 0.65 0.45 0.084 0.155
Pauatahanui Pauatahanui 4 0.01 5 81 0 0.26 0.65 0.49 0.082 0.151
Pauatahanui Pauatahanui 5 0.03 5 81 0 0.22 0.65 0.41 0.266 0.486
Pauatahanui Pauatahanui 6 0.11 5 80 0 0.31 0.65 0.57 0.801 1.494
Pauatahanui Pauatahanui 7 39.09 5 75 0 1.48 0.65 2.75 104.792 200.123
Pauatahanui Pauatahanui 8 0.14 5 78 0 0.27 0.65 0.50 0.9722 1.8409
Pauatahanui Pauatahanui 9 0.03 2 77 55 0.24 0.65 0.45 0.286 0.487
Duck Duck 1 0.01 5 78 0 0.17 0.65 0.31 0.093 0.178
Duck Duck 2 0.02 5 74 4 0.17 0.65 0.31 0.174 0.339
Duck Duck 3 0.02 5 78 5 0.17 0.65 0.31 0.19 0.357
Duck Duck 4 0.01 5 82 0 0.17 0.65 0.31 0.102 0.187
Duck Duck 5 0.02 5 82 0 0.17 0.65 0.31 0.204 0.374
Duck Duck 6 0.03 5 82 0 0.17 0.65 0.31 0.305 0.561
Duck Duck 7 0.39 5 82 0 0.35 0.65 0.66 2.656 4.951
Duck Duck 8 0.13 5 84 0 0.27 0.65 0.49 1.087 1.969
Duck Duck 9 0.18 5 84 0 0.28 0.65 0.52 1.458 2.642
Duck Duck 10 0.09 5 85 0 0.25 0.65 0.47 0.787 1.411
Duck Duck 11 1.83 5 84 0 0.29 0.65 0.54 14.475 26.474
Duck Duck 12 0.84 5 84 0 0.19 0.65 0.36 8.258 14.929
Duck Duck 13 0.02 5 85 0 0.22 0.65 0.4 0.185 0.336
Duck Duck 14 0.21 5 85 0 0.27 0.65 0.5 1.76 3.185
Duck Duck 15 0.39 5 85 0 0.24 0.65 0.44 3.473 6.267
Duck Duck 16 0.01 5 85 0 0.19 0.65 0.36 0.098 0.18
Duck Duck 17 0.01 4 84 21 0.17 0.65 0.31 0.113 0.199
Duck Duck 18 5.72 5 84 1 0.63 0.65 1.17 29.096 53.008
Duck Duck 19 0.02 5 70 0 0.18 0.65 0.34 0.145 0.296

SINCLAIR KNIGHT MERZ PAGE 161
Table 27 - Culvert Details
Culvert ID Culvert sub-catchment
Chainage(m)
U/S Invert level (m)
D/S Invert Level (m)
CulvertLength (m) Culvert Diameter (mm) Type of fish
passage required
W1 Wainui 1 1525 16 10 155 1050 Std Design
W2 Wainui 2 1630 16 10 109 1050 Std Design
W3 Wainui 3 2100 19 18 96 Two 3m (W) x 2.5m (H) box culverts
Std Design
W4 Wainui 4 2250 27 18 95 900 Std Design
BSN 3 Te Puka 1 2750 Refer to Schedule of Bridges
T3 Te Puka 3 3075 84 65 91 1050 None
T4 Te Puka 4 3300 98 80 69 600 New Design
T5 Te Puka 5 3475 115 95 56 1050 None
T6 Te Puka 6 3725 134 124 58 600 None
T7 Te Puka 7 3900 148 117 72 900 None
T8 Te Puka 8 4025 152.5 121 85 1050 None
T9 Te Puka 9 4300 178 140 85 1050 None
T10 Te Puka 10 4475 178 150 93 1200 Std Design
T15 Te Puka 15 4575 205 164 84 600 None
T11 Te Puka 11 4775 220 184 80 600 None
T12 Te Puka 12 4875 220.5 185 65 1050 None
T13 Te Puka 13 5025 236.5 218 58 1050 None
T14 Te Puka 14 5200 276 222 245 900 None
H2 Horokiri 2 5375 276 254 266 1050 Std Design
H3 Horokiri 3 5650 257 251 51 1050 New Design
H4 Horokiri 4 5825 247.5 235 72 1050 New Design
H5 Horokiri 5 5930 244 229 69 750 None
H6A Horokiri 6A 6075 236 225 61 600 None
H6B Horokiri 6B 6150 232 218 54 600 None
H7 Horokiri 7 6275 226 218 84 1350 Std Design
H8 Horokiri 8 6400 223 200 73 600 None
H9 Horokiri 9 6575 217 196 57 900 None
H10 Horokiri 10 6625 215 195 58 600 None
H11 Horokiri 11 6675 206 182 80 750 None
H12 Horokiri 12 6850 203 190 64 900 None
H13 Horokiri 13 7050 182 168 72 900 None
H14 Horokiri 14 7250 174 157 93 600 None
H15 Horokiri 15 7400 168 154 96 1200 New Design
H16 Horokiri 16 7675 158 148 68 1200 New Design
H17 Horokiri 17 8000 144 130 64 900 None
H18 Horokiri 18 8150 134 125 44 1050 New Design

SINCLAIR KNIGHT MERZ PAGE 162
Culvert ID Culvert sub-catchment
Chainage(m)
U/S Invert level (m)
D/S Invert Level (m)
CulvertLength (m) Culvert Diameter (mm) Type of fish
passage required
H19 Horokiri 19 8375 120 119.5 51 900 New Design
BSN 4 Horokiri 1 8550 Refer to Schedule of Bridges
H21A Horokiri 21A 8850 109 108.5 50 1200 None
H22 Horokiri 22 9000 108 107.5 45 900 None
H23 Horokiri 23 9150 104 103.5 33 600 None
H24 Horokiri 24 9325 98 95 64 3m (W) x 2.5m (H) box culvert
Std Design
BSN 6 Horokiri 21 9750 Refer to Schedule of Bridges
H26 Horokiri 26 9925 79.5 75 52 600 None
H27 Horokiri 27 10175 78 74 74 600 None
H29 Horokiri 29 10550 70.5 68 66 900 None
H30 Horokiri 30 10750 69 64 74 600 None
H31 Horokiri 31 10800 69 64 74 600 None
H32 Horokiri 32 11125 63 59 73 600 None
H33 Horokiri 33 11250 56 54 63 900 None
BSN 8 Horokiri 25 11775 Refer to Schedule of Bridges
BSN 9 Horokiri 25 n/a Refer to Schedule of Bridges
H34 Horokiri 34 12025 59.5 59 41 600 None
H35 Horokiri 35 12125 62 59 49 900 None
H36 Horokiri 36 12200 63.5 55 96 900 None
H37 Horokiri 37 12400 69 62 81 750 None
BSN 11 Ration 1 12840 Refer to Schedule of Bridges
R2 Ration 2 13000 92.5 89 33 750 None
R3 Ration 3 13100 92.5 86 89 1050 Std Design
R4 Ration 4 13250 95.5 95 50 600 None
R5 Ration 5 13400 91.5 81 113 600 None
R6 Ration 6 13450 88.5 83 86 600 None
R7 Ration 7 13550 84.5 78 136 3000 Std Design
R8 Ration 8 13900 81.5 78 74 1600 Std Design
R9 Ration 9 13950 83.5 80 72 750 None
R10 Ration 10 14775 48 44 125 2100 Std Design
R10A Ration 10a 14650 58 54 110 600 None
R11 Ration 11 15075 49.5 39 133 1200 None
R12 Ration 12 15350 55.5 48 126 600 None
R13 Ration 13 15600 56.5 51 109 1200 Std Design
R14 Ration 14 15800 53.5 44 153 900 None
C1 Collins 1 16125 58.5 58 88 750 None
Pa1 Pauatahanui 1 16700 28 22 107 1200 None

SINCLAIR KNIGHT MERZ PAGE 163
Culvert ID Culvert sub-catchment
Chainage(m)
U/S Invert level (m)
D/S Invert Level (m)
CulvertLength (m) Culvert Diameter (mm) Type of fish
passage required
Pa2 Pauatahanui 2 16875 27.5 23 81 1200 Std Design
Pa3 Pauatahanui 3 17000 29 28.5 55 600 None
Pa4 Pauatahanui 4 17175 18 17 63 600 None
Pa5 Pauatahanui 5 17350 13.5 2 128 600 None
Pa6 Pauatahanui 6 17475 6 4 40 1050 Std Design
Pa6A Pauatahanui 6a 17475 6 4 40 1050 None
BSN 15 Pauatahanui 7 17675 Refer to Schedule of Bridges
Pa8 Pauatahanui 8 18225 51.5 51 52 1200 None
Pa9 Pauatahanui 9 18450 65.5 64 78 600 None
D17 Duck 17 19550 99 93 62 600 None
D19 Duck 19 n/a 66 65 45 600 None
D20 Duck 20 n/a 79 66 70 600 None
D21 Duck 21 n/a 89 83 46 600 None
D22 Duck 22 n/a 98.5 84 63 600 None
D23 Duck 23 n/a 86.5 79 91 900 None
D24 Duck 24 n/a 92.5 79 95 750 None
D25 Duck 25 n/a 109.5 100 48 600 None
D26 Duck 26 n/a 102 99 44 600 None
D1 Duck 1 19950 105.5 62 195 600 None
D2 Duck 2 20100 95.5 70 141 600 None
D3 Duck 3 20200 95.5 70 128 600 None
D4 Duck 4 20375 93 66 113 600 None
D5 Duck 5 20525 90.5 81 74 600 None
D6 Duck 6 20600 87.5 57 154 600 None
D7 Duck 7 20650 88 62 164 1600 Std Design
D8 Duck 8 21000 94.5 76 119 1050 New Design
D9 Duck 9 21225 95.5 82 167 1200 New Design
D10 Duck 10 21425 107.5 91 109 1050 None
BSN 29 Duck 18 n/a Refer to Schedule of Bridges
BSN 17 n/a 21600 Refer to Schedule of Bridges
BSN 18 n/a 21950 Refer to Schedule of Bridges
D13 Duck 13 22450 141 135 62 600 None
D14 Duck 14 22700 142.5 140 76 1350 Std Design
BSN 19 Duck 15 22850
D16 Duck 16 23050 172 170 49 600 None
DM1* n/a n/a 79.3 76.6 10 Replace as existing Std Design
DM2* n/a n/a 90.0 90.0 10 Replace as existing Std Design
DM3* n/a n/a 84.6 84.3 10 Replace as existing Std Design

SINCLAIR KNIGHT MERZ PAGE 164
Culvert ID Culvert sub-catchment
Chainage(m)
U/S Invert level (m)
D/S Invert Level (m)
CulvertLength (m) Culvert Diameter (mm) Type of fish
passage required
DM4* n/a n/a 90.1 90.0 10 Replace as existing Std Design
DM5* n/a n/a 90.4 90.0 10 Replace as existing Std Design
DM6* n/a n/a 115.0 114.5 15 Replace as existing Std Design
DM7* n/a n/a 129.2 126.3 15 Replace as existing Std Design
DM8* n/a n/a 136.1 135.3 12 Replace as existing Std Design
BSN 20 Kenepuru 1 23650 Refer to Schedule of Bridges
K2 Kenepuru 2 24475 151 146 39 600 None
K3 Kenepuru 3 24625 146.5 145.5 82 600 None
K4 Kenepuru 4 24700 141.5 122 53 600 None
K5 Kenepuru 5 24850 133.5 121 72 900 None
K6 Kenepuru 6 24875 135 112 67 600 None
K7 Kenepuru 7 25100 123.5 109 83 975 None
K8 Kenepuru 8 25200 116 115 49 600 None
K9 Kenepuru 9 25325 115 105 54 1200 New Design
BSN 21 Kenepuru 10 25825 Refer to Schedule of Bridges
BSN 22 Porirua 1 26050 Refer to Schedule of Bridges
Po2 Porirua 2 26200 45.5 36.5 73 600 None
Po3 Porirua 3 26325 54 44 84 825 None
Po4 Porirua 4 26425 58 44 115 900 None
Po5 Porirua 5 26775 45.5 39.5 149 1200 None
Po6 Porirua 6 27000 10.5 9.1 140 975 None
* Replacing existing culverts on grade to allow fish passage, as detailed in Technical Report 11

SINCLAIR KNIGHT MERZ PAGE 165
Table 28 – Temporary Access Culverts Requirements
Catchment Area(ha)
Rainfall Ccoefficient
Intensity (mm/hr)
Tc (hours)
Q2Peak
FishPassage
Required?
Final Culvert
Size(mm)
Or Box Culvert
TC1 317 88 0.35 31 0.58 9.4 Y 3060 3000*1900
TC2 6 86 0.35 41 0.33 0.2 600
TC3 8 86 0.35 45 0.27 0.3 600
TC4 10 86 0.35 44 0.28 0.4 Alternative 750
TC5 3 86 0.35 49 0.23 0.1 600
TC6 220 88 0.35 31 0.57 6.7 Y 2550
TC7 219 88 0.35 31 0.57 6.6 Y 2550
TC8 8 86 0.35 47 0.25 0.4 750
TC9 195 88 0.35 32 0.55 6.0 Y 2300
TC10 37 88 0.35 43 0.31 1.5 Y 1500
TC11 85 88 0.35 42 0.32 3.5 Y 1950
TC12 15 87 0.35 43 0.30 0.6 900
TC13 7 86 0.35 46 0.26 0.3 Y 900
TC14 44 87 0.35 41 0.34 1.7 Y 1500
TC15 64 87 0.35 31 0.55 1.9 Y 1650
TC16 17 86 0.35 44 0.28 0.7 Y 1200
TC17 114 87 0.35 31 0.55 3.5 Y 1950
TC18 30 88 0.35 42 0.32 1.3 1050
TC19 155 87 0.35 30 0.60 4.5 Y 2300
TC20 6 86 0.35 51 0.22 0.3 600
TC21 214 87 0.35 30 0.60 6.2 Y 2300
TC22 219 87 0.35 30 0.60 6.4 Y 2300
TC23 225 87 0.35 30 0.60 6.5 Y 2300
TC24 226 87 0.35 30 0.60 6.6 Y 2300
TC25 241 87 0.35 25 0.82 5.9 Y 2300
TC26 2 87 0.35 50 0.23 0.1 600
TC27 3 87 0.35 50 0.23 0.2 600
TC28 314 87 0.35 24 0.93 7.2 Y 2550
TC29 453 87 0.35 23 0.97 10.2 Y 3060 3000*1900
TC30 5 87 0.35 47 0.26 0.2 600
TC31 105 88 0.35 34 0.48 3.4 Y 1950
TC32 640 87 0.35 20 1.25 12.5 Y 3060 3000*2200
TC33 4 86 0.35 44 0.28 0.2 600

SINCLAIR KNIGHT MERZ PAGE 166
Catchment Area(ha)
Rainfall Ccoefficient
Intensity (mm/hr)
Tc (hours)
Q2Peak
FishPassage
Required?
Final Culvert
Size(mm)
Or Box Culvert
TC34 2 85 0.35 44 0.28 0.1 600
TC35 1059 87 0.35 18 1.57 18.4 Y 3000*2800
TC36 22 85 0.35 39 0.35 0.8 Y 1200
TC37 3 84 0.35 40 0.32 0.1 Y 750
TC38 1 84 0.35 47 0.24 0.0 Y 600
TC39 50 85 0.35 33 0.46 1.6 Y 1500
TC40 51 85 0.35 33 0.46 1.7 Y 1500
TC41 113 84 0.35 28 0.63 3.1 Y 1800
TC42 7 83 0.35 39 0.33 0.3 600
TC43 3 83 0.35 39 0.33 0.1 600
TC44 13 83 0.35 38 0.34 0.5 Y 1050
TC45 3 82 0.35 41 0.29 0.1 600
TC46 3 82 0.35 41 0.30 0.1 600
TC47 1 82 0.35 44 0.26 0.1 600
TC48 19 82 0.35 36 0.38 0.7 900
TC49 10 81 0.35 39 0.32 0.4 750
TC50 576 78 0.35 21 0.92 11.9 Y 3060 3000*2100
TC51 0 76 0.35 47 0.20 0.0 600
TC52 2 76 0.35 40 0.27 0.1 600
TC53 1 76 0.35 44 0.22 0.0 600
TC54 1 76 0.35 45 0.22 0.0 600
TC55 1 76 0.35 45 0.21 0.0 600
TC56 1 76 0.35 44 0.22 0.0 600
TC57 3 75 0.35 40 0.26 0.1 Y 750
TC58 40 75 0.35 34 0.35 1.3 Y 1350
TC59 1 75 0.35 43 0.23 0.1 600
TC60 4 75 0.35 39 0.28 0.2 600
TC61 11 75 0.35 35 0.34 0.4 750

SINCLAIR KNIGHT MERZ PAGE 160
MainCatchment Sub-catchment
Loss Rate Method - SCS Curve Number
Runoff Method - Clark's Unit Hydrograph Q10CC Q100CC
Area(km²)
Initial Abstraction CN CIA
(%) Tc
(Hrs) RatioStorageCoefficie
nt (R) Duck Duck 20 0.03 5 72 0 0.22 0.65 0.4 0.206 0.415
Duck Duck 21 0.01 5 72 0 0.23 0.65 0.43 0.067 0.134
Duck Duck 22 0.02 4 74 29 0.2 0.65 0.36 0.181 0.333
Duck Duck 23 0.09 5 83 1 0.24 0.65 0.44 0.771 1.41
Duck Duck 24 0.05 5 84 0 0.23 0.65 0.44 0.428 0.79
Duck Duck 25 0.03 5 85 0 0.23 0.65 0.43 0.265 0.48
Duck Duck 26 0.03 5 84 0 0.21 0.65 0.4 0.27 0.494
Collins Collins 1 0.04 5 84 0 0.26 0.65 0.48 0.356 0.638
Kenepuru Kenepuru 1 1.49 5 94 0 0.38 0.65 0.71 12.038 20.391
Kenepuru Kenepuru 10 0.04 5 88 0 0.2 0.65 0.36 0.41 0.711
Kenepuru Kenepuru 2 0.02 5 83 0 0.22 0.65 0.4 0.173 0.321
Kenepuru Kenepuru 3 0.03 5 82 0 0.19 0.65 0.36 0.273 0.502
Kenepuru Kenepuru 4 0.03 5 82 0 0.23 0.65 0.44 0.244 0.449
Kenepuru Kenepuru 5 0.06 5 94 0 0.28 0.65 0.52 0.571 0.95
Kenepuru Kenepuru 6 0.01 5 92 0 0.19 0.65 0.35 0.113 0.19
Kenepuru Kenepuru 7 0.09 5 92 0 0.3 0.65 0.56 0.792 1.34
Kenepuru Kenepuru 8 0.02 5 94 0 0.17 0.65 0.31 0.249 0.41
Kenepuru Kenepuru 9 0.16 5 94 0 0.34 0.65 0.63 1.373 2.284
Porirua Porirua 1 0.39 5 89 2 0.17 0.65 0.31 4.44 7.584
Porirua Porirua 2 0.02 2 91 54 0.17 0.65 0.32 0.248 0.402
Porirua Porirua 3 0.05 4 91 25 0.18 0.65 0.34 0.56 0.963
Porirua Porirua 4 0.1 5 92 9 0.29 0.65 0.54 0.906 1.509
Porirua Porirua 5 0.24 5 84 0 0.39 0.65 0.73 1.536 2.784
Porirua Porirua 6 0.13 5 78 0 0.29 0.65 0.54 0.824 1.626
Porirua Porirua 7 0.83 4 76 10 0.4 0.65 0.74 4.633 8.703

SINCLAIR KNIGHT MERZ PAGE 167
Appendix 14.G. Culvert Catchments

P.M
GR
RE
VIE
WN
oD
ATE
DE
SIG
NR
EV'
DP.
DIR
APP
'DAM
EN
DM
EN
T
The
conc
epts
and
info
rmat
ion
cont
aine
din
this
doc
umen
t are
the
copy
right
of
Sinc
lair
Kni
ght M
erz
Ltd.
Use
or
copy
ing
of th
e do
cum
ent i
n w
hole
or i
npa
rt w
ithou
t the
writ
ten
perm
issi
on o
fSi
ncla
ir K
nigh
t Mer
z Lt
d. c
onst
itute
san
infri
ngem
ent o
f cop
yrig
ht.
DE
SIG
NED
DR
AW
N
PRO
JEC
T
CLI
EN
T
DA
TE
DE
SIG
N R
EVI
EW
RE
VIE
WE
DPR
OJE
CT
MA
NAG
ER
PRO
JEC
T D
IRE
CTO
RAP
PR
OV
ED
SCAL
E
TITL
E
SKM
PR
OJE
CT
No
DR
AW
ING
No
AMD
T
CH
EC
KD
RA
FTIN
G
FILENAME:PLOT DATE:
CO
PYR
IGH
T
FEDCBA
A3
87
65
43
21
FD EB CA
12
34
56
78
Leve
l 12,
May
fair
Hou
seP5
4 Th
e Te
rrace
PPO
Box
10-
283,
Wel
lingt
onPN
EW
ZEA
LAN
DPT
el +
64 4
473
426
5PF
ax +
64 4
473
336
9
WD
1
BSN
3
TD2
TD3
! (T5! (T4
! (T3
! (W1
! (W2
! (W3
! (W4
Wai
nui 3
Wai
nui 4
Wai
nui 2
Wai
nui 1
TePu
ka 5
TePu
ka 2
TePu
ka 3
TePu
ka 4
TePu
ka 6
[
CU
LVE
RT
CAT
CH
ME
NTS
SH
EE
T 1
NEW
ZE
ALA
ND
TR
ANSP
OR
T AG
EN
CY
TRA
NS
MIS
SIO
N G
ULL
Y P
RO
JEC
TTE
CH
NIC
AL
RE
PO
RT
14
1:8,
000
AE
0377
8
Leve
l 3, 8
6 C
usto
mho
use
Qua
yS
JB CM
M
JULY
201
1
Leve
l 3, 8
6 cu
stom
hous
e Q
uay
Wel
lingt
on 6
011
PO B
ox 1
0-28
3, W
ellin
gton
614
3NE
W Z
EALA
ND
Tel +
64 4
473
426
5Fa
x +6
4 4
473
3369
13
26
9
4
78
5
010
020
030
040
050
0 m
Brid
ges
( BS
N1
etc)
( **D
1 et
c)
( **1
etc
)
Stre
am D
iver
sion
s
Con
tour
s 2m
Prop
osed
Cul
vert
s
no fi
sh p
assa
ge re
quire
d
fish
pass
age
requ
ired
alte
rnat
ive
fish
pass
age
requ
ired
Roa
d C
atch
men
ts
I:\AENVW\Projects\AE03778\Deliverables\Final Collated Report WS4\Delivered June 2011\Appendix G\MXD's
TG A
LIG
NM
EN
T AS
AT
09 S
EP
TEM
BE
R 2
010
A

P.M
GR
RE
VIE
WN
oD
ATE
DE
SIG
NR
EV'
DP.
DIR
APP
'DAM
EN
DM
EN
T
The
conc
epts
and
info
rmat
ion
cont
aine
din
this
doc
umen
t are
the
copy
right
of
Sinc
lair
Kni
ght M
erz
Ltd.
Use
or
copy
ing
of th
e do
cum
ent i
n w
hole
or i
npa
rt w
ithou
t the
writ
ten
perm
issi
on o
fSi
ncla
ir K
nigh
t Mer
z Lt
d. c
onst
itute
san
infri
ngem
ent o
f cop
yrig
ht.
DE
SIG
NED
DR
AW
N
PRO
JEC
T
CLI
EN
T
DA
TE
DE
SIG
N R
EVI
EW
RE
VIE
WE
DPR
OJE
CT
MA
NAG
ER
PRO
JEC
T D
IRE
CTO
RAP
PR
OV
ED
SCAL
E
TITL
E
SKM
PR
OJE
CT
No
DR
AW
ING
No
AMD
T
CH
EC
KD
RA
FTIN
G
FILENAME:PLOT DATE:
CO
PYR
IGH
T
FEDCBA
A3
87
65
43
21
FD EB CA
12
34
56
78
Leve
l 12,
May
fair
Hou
seP5
4 Th
e Te
rrace
PPO
Box
10-
283,
Wel
lingt
onPN
EW
ZEA
LAN
DPT
el +
64 4
473
426
5PF
ax +
64 4
473
336
9
Leve
l 12,
May
fair
Hou
se54
The
Ter
race
PO B
ox 1
0-28
3, W
ellin
gton
NEW
ZEA
LAN
DTe
l +64
4 4
73 4
265
Fax
+64
4 47
3 33
69
HD
2
HD
1
TD4
! (H2! (T1
4
! (T10
! (T15
! (T12
! (T8! (T9
! (T7! (T6
! (H4
! (T11
! (H3
! (T13
! (H8! (H5
! (H6A
! (H6B
! (H7
TePu
ka 1
Wai
nui 3
Hor
okiri
7
TePu
ka 1
0
Hor
okiri
4H
orok
iri 3
Hor
okiri
2
TePu
ka 9
TePu
ka 8
TePu
ka 5
TePu
ka 1
2
TePu
ka 1
3
TePu
ka 7
TePu
ka 1
1
Hor
okiri
5
TePu
ka 1
4
Hor
okiri
9
TePu
ka 6
TePu
ka 1
5
Hor
okiri
6A
Hor
okiri
8H
orok
iri 6
B
Hor
okiri
10
PLA
NS
ET
1C
ULV
ER
T C
ATC
HM
EN
TSS
HE
ET
2
NEW
ZE
ALA
ND
TR
ANSP
OR
T AG
EN
CY
TRAN
SMIS
SIO
N G
ULL
Y PR
OJE
CT
TEC
HN
ICAL
REP
OR
T 14
1:8,
000
AE03
778
Leve
l 3, 8
6 C
usto
mho
use
Qua
ySJ
B
CM
M
JULY
201
11
32
6
9
47
8
5
[
010
020
030
040
050
0 m
Brid
ges
( BS
N1
etc)
( **D
1 et
c)
( **1
etc
)
Stre
am D
iver
sion
s
Con
tour
s 2m
Prop
osed
Cul
vert
s
no fi
sh p
assa
ge re
quire
d
fish
pass
age
requ
ired
alte
rnat
ive
fish
pass
age
requ
ired
Roa
d C
atch
men
ts
I:\AENVW\Projects\AE03778\Deliverables\Final Collated Report WS4\Delivered June 2011\Appendix G\MXD's
TG A
LIG
NM
EN
T AS
AT
09 S
EP
TEM
BE
R 2
010
A

P.M
GR
RE
VIE
WN
oD
ATE
DE
SIG
NR
EV'
DP.
DIR
APP
'DAM
EN
DM
EN
T
The
conc
epts
and
info
rmat
ion
cont
aine
din
this
doc
umen
t are
the
copy
right
of
Sinc
lair
Kni
ght M
erz
Ltd.
Use
or
copy
ing
of th
e do
cum
ent i
n w
hole
or i
npa
rt w
ithou
t the
writ
ten
perm
issi
on o
fSi
ncla
ir K
nigh
t Mer
z Lt
d. c
onst
itute
san
infri
ngem
ent o
f cop
yrig
ht.
DE
SIG
NED
DR
AW
N
PRO
JEC
T
CLI
EN
T
DA
TE
DE
SIG
N R
EVI
EW
RE
VIE
WE
DPR
OJE
CT
MA
NAG
ER
PRO
JEC
T D
IRE
CTO
RAP
PR
OV
ED
SCAL
E
TITL
E
SKM
PR
OJE
CT
No
DR
AW
ING
No
AMD
T
CH
EC
KD
RA
FTIN
G
FILENAME:PLOT DATE:
CO
PYR
IGH
T
FEDCBA
A3
87
65
43
21
FD EB CA
12
34
56
78
Leve
l 12,
May
fair
Hou
seP5
4 Th
e Te
rrace
PPO
Box
10-
283,
Wel
lingt
onPN
EW
ZEA
LAN
DPT
el +
64 4
473
426
5PF
ax +
64 4
473
336
9
Leve
l 12,
May
fair
Hou
se54
The
Ter
race
PO B
ox 1
0-28
3, W
ellin
gton
NEW
ZEA
LAN
DTe
l +64
4 4
73 4
265
Fax
+64
4 47
3 33
69
HD
4H
D5
HD
3B
SN4
! (H24
! (H11
! (H15
! (H14
! (H10
! (H12
! (H17
! (H16
! (H13
! (H18
! (H19
! (H21
A
! (H23
! (H22
! (H9
Hor
okiri
1H
orok
iri 2
5
Hor
okiri
24
Hor
okiri
21
Hor
okiri
15
Hor
okiri
16
Hor
okiri
21A
Hor
okiri
18
Hor
okiri
19
Hor
okiri
17
Hor
okiri
22
Hor
okiri
12
Hor
okiri
13
Hor
okiri
20
Hor
okiri
11
Hor
okiri
14
Hor
okiri
23
Hor
okiri
10
Hor
okiri
9
PLA
NS
ET
1C
ULV
ER
T C
ATC
HM
EN
TSS
HE
ET
3
NEW
ZE
ALA
ND
TR
ANSP
OR
T AG
EN
CY
TRAN
SMIS
SIO
N G
ULL
Y PR
OJE
CT
TEC
HN
ICAL
REP
OR
T 14
1:8,
000
AE03
778
Leve
l 3, 8
6 C
usto
mho
use
Qua
ySJ
B
CM
M
JULY
201
13
12
6
9
4
78
5
I:\AENVW\Projects\AE03778\Deliverables\Final Collated Report WS4\Delivered June 2011\Appendix G\MXD's
[
010
020
030
040
050
0 m
Brid
ges
( BS
N1
etc)
( **D
1 et
c)
( **1
etc
)
Stre
am D
iver
sion
s
Con
tour
s 2m
Prop
osed
Cul
vert
s
no fi
sh p
assa
ge re
quire
d
fish
pass
age
requ
ired
alte
rnat
ive
fish
pass
age
requ
ired
Roa
d C
atch
men
ts
TG A
LIG
NM
EN
T AS
AT
09 S
EP
TEM
BE
R 2
010
A

P.M
GR
RE
VIE
WN
oD
ATE
DE
SIG
NR
EV'
DP.
DIR
APP
'DAM
EN
DM
EN
T
The
conc
epts
and
info
rmat
ion
cont
aine
din
this
doc
umen
t are
the
copy
right
of
Sinc
lair
Kni
ght M
erz
Ltd.
Use
or
copy
ing
of th
e do
cum
ent i
n w
hole
or i
npa
rt w
ithou
t the
writ
ten
perm
issi
on o
fSi
ncla
ir K
nigh
t Mer
z Lt
d. c
onst
itute
san
infri
ngem
ent o
f cop
yrig
ht.
DE
SIG
NED
DR
AW
N
PRO
JEC
T
CLI
EN
T
DA
TE
DE
SIG
N R
EVI
EW
RE
VIE
WE
DPR
OJE
CT
MA
NAG
ER
PRO
JEC
T D
IRE
CTO
RAP
PR
OV
ED
SCAL
E
TITL
E
SKM
PR
OJE
CT
No
DR
AW
ING
No
AMD
T
CH
EC
KD
RA
FTIN
G
FILENAME:PLOT DATE:
CO
PYR
IGH
T
FEDCBA
A3
87
65
43
21
FD EB CA
12
34
56
78
Leve
l 12,
May
fair
Hou
seP5
4 Th
e Te
rrace
PPO
Box
10-
283,
Wel
lingt
onPN
EW
ZEA
LAN
DPT
el +
64 4
473
426
5PF
ax +
64 4
473
336
9
Leve
l 12,
May
fair
Hou
se54
The
Ter
race
PO B
ox 1
0-28
3, W
ellin
gton
NEW
ZEA
LAN
DTe
l +64
4 4
73 4
265
Fax
+64
4 47
3 33
69
BSN
8
BSN
9
BSN
6
! (H36
! (H32
! (H37
! (H30
! (H29
! (H34
! (H27
! (H26
! (H33
! (H31
! (H35
Hor
okiri
25
Rat
ion
1
Hor
okiri
36
Hor
okiri
21
Hor
okiri
28
Hor
okiri
33
Hor
okiri
27
Hor
okiri
26
Hor
okiri
29
Hor
okiri
31
Hor
okiri
35
Hor
okiri
37
Hor
okiri
38
Hor
okiri
34
Hor
okiri
32
Hor
okiri
30
Hor
okiri
24
NEW
ZE
ALA
ND
TR
ANSP
OR
T AU
THO
RIT
YTR
ANSM
ISSI
ON
GU
LLY
PRO
JEC
TTE
CH
NIC
AL R
EPO
RT
14
1:8,
000
AE03
778
Leve
l 3, 8
6 C
usto
mho
use
Qua
ySJ
B
CM
M
JULY
201
1
PLA
NS
ET
1C
ULV
ER
T C
ATC
HM
EN
TSS
HE
ET
41
32
6
9
4
78
5
I:\AENVW\Projects\AE03778\Deliverables\Final Collated Report WS4\Delivered June 2011\Appendix G\MXD's
[
010
020
030
040
050
0 m
Brid
ges
( BS
N1
etc)
( **D
1 et
c)
( **1
etc
)
Stre
am D
iver
sion
s
Con
tour
s 2m
Prop
osed
Cul
vert
s
no fi
sh p
assa
ge re
quire
d
fish
pass
age
requ
ired
alte
rnat
ive
fish
pass
age
requ
ired
Roa
d C
atch
men
ts
TG A
LIG
NM
EN
T AS
AT
09 S
EP
TEM
BE
R 2
010
A

P.M
GR
RE
VIE
WN
oD
ATE
DE
SIG
NR
EV'
DP.
DIR
APP
'DAM
EN
DM
EN
T
The
conc
epts
and
info
rmat
ion
cont
aine
din
this
doc
umen
t are
the
copy
right
of
Sinc
lair
Kni
ght M
erz
Ltd.
Use
or
copy
ing
of th
e do
cum
ent i
n w
hole
or i
npa
rt w
ithou
t the
writ
ten
perm
issi
on o
fSi
ncla
ir K
nigh
t Mer
z Lt
d. c
onst
itute
san
infri
ngem
ent o
f cop
yrig
ht.
DE
SIG
NED
DR
AW
N
PRO
JEC
T
CLI
EN
T
DA
TE
DE
SIG
N R
EVI
EW
RE
VIE
WE
DPR
OJE
CT
MA
NAG
ER
PRO
JEC
T D
IRE
CTO
RAP
PR
OV
ED
SCAL
E
TITL
E
SKM
PR
OJE
CT
No
DR
AW
ING
No
AMD
T
CH
EC
KD
RA
FTIN
G
FILENAME:PLOT DATE:
CO
PYR
IGH
T
FEDCBA
A3
87
65
43
21
FD EB CA
12
34
56
78
Leve
l 12,
May
fair
Hou
seP5
4 Th
e Te
rrace
PPO
Box
10-
283,
Wel
lingt
onPN
EW
ZEA
LAN
DPT
el +
64 4
473
426
5PF
ax +
64 4
473
336
9
Leve
l 12,
May
fair
Hou
se54
The
Ter
race
PO B
ox 1
0-28
3, W
ellin
gton
NEW
ZEA
LAN
DTe
l +64
4 4
73 4
265
Fax
+64
4 47
3 33
69
RD
1
RD
2
RD
3
BSN
11
! (R10
! (R7! (R9
! (R5! (R8
! (R11
! (R12
! (R10
a
! (R13
! (R3! (R2
! (R4! (R6
Rat
ion
10
Paua
taha
nui 7
Rat
ion
7
Rat
ion
1R
atio
n 8
Rat
ion
3
Rat
ion
13R
atio
n 11
Rat
ion
9
Rat
ion
5
Rat
ion
2
Rat
ion
12R
atio
n 10
a
Rat
ion
6R
atio
n 4
Hor
okiri
38
Rat
ion
14
Rat
ion
14
NEW
ZE
ALA
ND
TR
ANSP
OR
T AG
EN
CY
TRAN
SMIS
SIO
N G
ULL
Y PR
OJE
CT
TEC
HN
ICAL
REP
OR
T 14
1:8,
000
AE03
778
Leve
l 3, 8
6 C
usto
mho
use
Qua
ySJ
B
CBL
JULY
201
1
PLA
NS
ET
1C
ULV
ER
T C
ATC
HM
EN
TSS
HE
ET
51
32
6
9
4
78
5
[
010
020
030
040
050
0 m
Brid
ges
( BS
N1
etc)
( **D
1 et
c)
( **1
etc
)
Stre
am D
iver
sion
s
Con
tour
s 2m
Prop
osed
Cul
vert
s
no fi
sh p
assa
ge re
quire
d
fish
pass
age
requ
ired
alte
rnat
ive
fish
pass
age
requ
ired
Roa
d C
atch
men
ts
I:\AENVW\Projects\AE03778\Deliverables\Final Collated Report WS4\Delivered June 2011\Appendix G\MXD's
TG A
LIG
NM
EN
T AS
AT
09 S
EP
TEM
BE
R 2
010
A

P.M
GR
RE
VIE
WN
oD
ATE
DE
SIG
NR
EV'
DP.
DIR
APP
'DAM
EN
DM
EN
T
The
conc
epts
and
info
rmat
ion
cont
aine
din
this
doc
umen
t are
the
copy
right
of
Sinc
lair
Kni
ght M
erz
Ltd.
Use
or
copy
ing
of th
e do
cum
ent i
n w
hole
or i
npa
rt w
ithou
t the
writ
ten
perm
issi
on o
fSi
ncla
ir K
nigh
t Mer
z Lt
d. c
onst
itute
san
infri
ngem
ent o
f cop
yrig
ht.
DE
SIG
NED
DR
AW
N
PRO
JEC
T
CLI
EN
T
DA
TE
DE
SIG
N R
EVI
EW
RE
VIE
WE
DPR
OJE
CT
MA
NAG
ER
PRO
JEC
T D
IRE
CTO
RAP
PR
OV
ED
SCAL
E
TITL
E
SKM
PR
OJE
CT
No
DR
AW
ING
No
AMD
T
CH
EC
KD
RA
FTIN
G
FILENAME:PLOT DATE:
CO
PYR
IGH
T
FEDCBA
A3
87
65
43
21
FD EB CA
12
34
56
78
Leve
l 12,
May
fair
Hou
seP5
4 Th
e Te
rrace
PPO
Box
10-
283,
Wel
lingt
onPN
EW
ZEA
LAN
DPT
el +
64 4
473
426
5PF
ax +
64 4
473
336
9
Leve
l 12,
May
fair
Hou
se54
The
Ter
race
PO B
ox 1
0-28
3, W
ellin
gton
NEW
ZEA
LAN
DTe
l +64
4 4
73 4
265
Fax
+64
4 47
3 33
69
PAD
3
PAD
1
PAD
4B
SN15
! (R14
! (Pa5
! (Pa1
! (R13
! (Pa2
! (Pa9
! (C1
! (Pa8
! (Pa4
! (Pa6a
! (Pa3
! (Pa6
PAD
2
Paua
taha
nui 7
Paua
taha
nui 1
Paua
taha
nui 2
Paua
taha
nui 6
Paua
taha
nui 8
Rat
ion
13
Col
lins
1R
atio
n 14
Paua
taha
nui 5
Paua
taha
nui 3
Paua
taha
nui 4
Paua
taha
nui 9
NEW
ZE
ALA
ND
TR
ANSP
OR
T AG
EN
CY
TRAN
SMIS
SIO
N G
ULL
Y PR
OJE
CT
TEC
HN
ICAL
REP
OR
T 14
1:8,
000
AE03
778
Leve
l 3, 8
6 C
usto
mho
use
Qua
ySJ
B
CM
M
JULY
201
1
PLA
NS
ET
1C
ULV
ER
T C
ATC
HM
EN
TSS
HE
ET
61
32
6
9
47
8
5
I:\AENVW\Projects\AE03778\Deliverables\Final Collated Report WS4\Delivered June 2011\Appendix G\MXD's
[
010
020
030
040
050
0 m
Brid
ges
( BS
N1
etc)
( **D
1 et
c)
( **1
etc
)
Stre
am D
iver
sion
s
Con
tour
s 2m
Prop
osed
Cul
vert
s
no fi
sh p
assa
ge re
quire
d
fish
pass
age
requ
ired
alte
rnat
ive
fish
pass
age
requ
ired
Roa
d C
atch
men
ts
TG A
LIG
NM
EN
T AS
AT
09 S
EP
TEM
BE
R 2
010
A

P.M
GR
RE
VIE
WN
oD
ATE
DE
SIG
NR
EV'
DP.
DIR
APP
'DAM
EN
DM
EN
T
The
conc
epts
and
info
rmat
ion
cont
aine
din
this
doc
umen
t are
the
copy
right
of
Sinc
lair
Kni
ght M
erz
Ltd.
Use
or
copy
ing
of th
e do
cum
ent i
n w
hole
or i
npa
rt w
ithou
t the
writ
ten
perm
issi
on o
fSi
ncla
ir K
nigh
t Mer
z Lt
d. c
onst
itute
san
infri
ngem
ent o
f cop
yrig
ht.
DE
SIG
NED
DR
AW
N
PRO
JEC
T
CLI
EN
T
DA
TE
DE
SIG
N R
EVI
EW
RE
VIE
WE
DPR
OJE
CT
MA
NAG
ER
PRO
JEC
T D
IRE
CTO
RAP
PR
OV
ED
SCAL
E
TITL
E
SKM
PR
OJE
CT
No
DR
AW
ING
No
AMD
T
CH
EC
KD
RA
FTIN
G
FILENAME:PLOT DATE:
CO
PYR
IGH
T
FEDCBA
A3
87
65
43
21
FD EB CA
12
34
56
78
Leve
l 12,
May
fair
Hou
seP5
4 Th
e Te
rrace
PPO
Box
10-
283,
Wel
lingt
onPN
EW
ZEA
LAN
DPT
el +
64 4
473
426
5PF
ax +
64 4
473
336
9
Leve
l 12,
May
fair
Hous
e54
The
Ter
race
PO B
ox 1
0-28
3, W
ellin
gton
NEW
ZEA
LAN
DTe
l +64
4 4
73 4
265
Fax
+64
4 47
3 33
69
BSN
29
! (D1
! (D2
! (D9
! (D6
! (D24
! (D10
! (D8
! (D7
! (D5
! (D20
! (D22
! (D17
! (D25
! (D4
! (D19
! (D26
! (D21
! (D3
! (D23
Duc
k 18
Paua
taha
nui 7
Duc
k 7
Duc
k 23
Duc
k 8
Duc
k 9
Duc
k 24D
uck
26
Duc
k 25
Duc
k 6
Duc
k 10
Duc
k 3D
uck
20 Duc
k 2
Duc
k 22 D
uck
19
Duc
k 21
Duc
k 11
Duc
k 5
Duc
k 1
Paua
taha
nui 8
Paua
taha
nui 9
Duc
k 4
Duc
k 17
NEW
ZE
ALA
ND
TR
AN
SPO
RT
AG
ENC
YTR
ANSM
ISSI
ON
GU
LLY
PRO
JEC
TTE
CH
NIC
AL R
EPO
RT
14
1:8,
000
AE03
778
Leve
l 3, 8
6 C
usto
mho
use
Qua
ySJ
B
CM
M
JULY
201
1
PLA
NSE
T 1
CU
LVER
T C
ATC
HM
ENTS
SHEE
T 7
13
26
9
4
78
5
[
010
020
030
040
050
0 m
Brid
ges
( BSN
1 et
c)
( **D
1 et
c)
( **1
etc
)
Stre
am D
iver
sion
s
Con
tour
s 2m
Prop
osed
Cul
vert
s
no fi
sh p
assa
ge re
quire
d
fish
pass
age
requ
ired
alte
rnat
ive
fish
pass
age
requ
ired
Roa
d C
atch
men
ts
I:\AENVW\Projects\AE03778\Deliverables\Final Collated Report WS4\Delivered June 2011\Appendix G\MXD's
TG A
LIG
NM
ENT
AS
AT 0
9 SE
PTE
MBE
R 2
010
A

P.M
GR
RE
VIE
WN
oD
ATE
DE
SIG
NR
EV'
DP.
DIR
APP
'DAM
EN
DM
EN
T
The
conc
epts
and
info
rmat
ion
cont
aine
din
this
doc
umen
t are
the
copy
right
of
Sinc
lair
Kni
ght M
erz
Ltd.
Use
or
copy
ing
of th
e do
cum
ent i
n w
hole
or i
npa
rt w
ithou
t the
writ
ten
perm
issi
on o
fSi
ncla
ir K
nigh
t Mer
z Lt
d. c
onst
itute
san
infri
ngem
ent o
f cop
yrig
ht.
DE
SIG
NED
DR
AW
N
PRO
JEC
T
CLI
EN
T
DA
TE
DE
SIG
N R
EVI
EW
RE
VIE
WE
DPR
OJE
CT
MA
NAG
ER
PRO
JEC
T D
IRE
CTO
RAP
PR
OV
ED
SCAL
E
TITL
E
SKM
PR
OJE
CT
No
DR
AW
ING
No
AMD
T
CH
EC
KD
RA
FTIN
G
FILENAME:PLOT DATE:
CO
PYR
IGH
T
FEDCBA
A3
87
65
43
21
FD EB CA
12
34
56
78
Leve
l 12,
May
fair
Hou
seP5
4 Th
e Te
rrace
PPO
Box
10-
283,
Wel
lingt
onPN
EW
ZEA
LAN
DPT
el +
64 4
473
426
5PF
ax +
64 4
473
336
9
Leve
l 12,
May
fair
Hou
se54
The
Ter
race
PO B
ox 1
0-28
3, W
ellin
gton
NEW
ZEA
LAN
DTe
l +64
4 4
73 4
265
Fax
+64
4 47
3 33
69
BSN
20
BSN
19
BSN
18
BSN
17
DD
1
KD
1
! (K5
! (D14
! (K4 ! (K
2
! (D16
! (D13
! (K3
Ken
epur
u 1
Duc
k 15
Duc
k 12
Duc
k 14
Duc
k 11
Ken
epur
u 5
Ken
epur
u 4
Ken
epur
u 3
Ken
epur
u 2
Duc
k 13
Ken
epur
u 7
Duc
k 16
Ken
epur
u 6
Duc
k 10
NEW
ZE
ALA
ND
TR
ANSP
OR
T AU
THO
RIT
YTR
ANSM
ISSI
ON
GU
LLY
PRO
JEC
TTE
CH
NIC
AL R
EPO
RT
14
1:8,
000
AE03
778
Leve
l 3, 8
6 C
usto
mho
use
Qua
ySJ
B
CM
M
JULY
201
1
PLA
NS
ET
1C
ULV
ER
T C
ATC
HM
EN
TSS
HE
ET
81
32
6
9
4
78
5
I:\AENVW\Projects\AE03778\Deliverables\Final Collated Report WS4\Delivered June 2011\Appendix G\MXD's
TG A
LIG
NM
EN
T AS
AT
09 S
EP
TEM
BE
R 2
010
[
010
020
030
040
050
0 m
Brid
ges
( BS
N1
etc)
( **D
1 et
c)
( **1
etc
)
Stre
am D
iver
sion
s
Con
tour
s 2m
Prop
osed
Cul
vert
s
no fi
sh p
assa
ge re
quire
d
fish
pass
age
requ
ired
alte
rnat
ive
fish
pass
age
requ
ired
Roa
d C
atch
men
ts
A

P.M
GR
RE
VIE
WN
oD
ATE
DE
SIG
NR
EV'
DP.
DIR
APP
'DAM
EN
DM
EN
T
The
conc
epts
and
info
rmat
ion
cont
aine
din
this
doc
umen
t are
the
copy
right
of
Sinc
lair
Kni
ght M
erz
Ltd.
Use
or
copy
ing
of th
e do
cum
ent i
n w
hole
or i
npa
rt w
ithou
t the
writ
ten
perm
issi
on o
fSi
ncla
ir K
nigh
t Mer
z Lt
d. c
onst
itute
san
infri
ngem
ent o
f cop
yrig
ht.
DE
SIG
NED
DR
AW
N
PRO
JEC
T
CLI
EN
T
DA
TE
DE
SIG
N R
EVI
EW
RE
VIE
WE
DPR
OJE
CT
MA
NAG
ER
PRO
JEC
T D
IRE
CTO
RAP
PR
OV
ED
SCAL
E
TITL
E
SKM
PR
OJE
CT
No
DR
AW
ING
No
AMD
T
CH
EC
KD
RA
FTIN
G
FILENAME:PLOT DATE:
CO
PYR
IGH
T
FEDCBA
A3
87
65
43
21
FD EB CA
12
34
56
78
Leve
l 12,
May
fair
Hou
seP5
4 Th
e Te
rrace
PPO
Box
10-
283,
Wel
lingt
onPN
EW
ZEA
LAN
DPT
el +
64 4
473
426
5PF
ax +
64 4
473
336
9
Leve
l 12,
May
fair
Hou
se54
The
Ter
race
PO B
ox 1
0-28
3, W
ellin
gton
NEW
ZEA
LAN
DTe
l +64
4 4
73 4
265
Fax
+64
4 47
3 33
69
BSN
22
PoD
1
BSN
21 KD
2
PoD
2
! (Po4
! (Po2
! (Po6
! (K7
! (Po3
! (Po5
! (K8! (K9
! (K6
Porir
ua 7
Porir
ua 1
Porir
ua 5
Porir
ua 6
Ken
epur
u 9
Porir
ua 4
Ken
epur
u 7
Porir
ua 3
Ken
epur
u 8
Ken
epur
u 10
Porir
ua 2
Ken
epur
u 6
Ken
epur
u 5
NEW
ZE
ALA
ND
TR
ANSP
OR
T AU
THO
RIT
YTR
ANSM
ISSI
ON
GU
LLY
PRO
JEC
TTE
CH
NIC
AL R
EPO
RT
14
1:8,
000
AE03
778
Leve
l 3, 8
6 C
usto
mho
use
Qua
ySJ
B
CM
M
JULY
201
1
PLA
NS
ET
1C
ULV
ER
T C
ATC
HM
EN
TSS
HE
ET
91
32
6
9
4
78
5
[
010
020
030
040
050
0 m
Brid
ges
( BS
N1
etc)
( **D
1 et
c)
( **1
etc
)
Stre
am D
iver
sion
s
Con
tour
s 2m
Prop
osed
Cul
vert
s
no fi
sh p
assa
ge re
quire
d
fish
pass
age
requ
ired
alte
rnat
ive
fish
pass
age
requ
ired
Roa
d C
atch
men
ts
I:\AENVW\Projects\AE03778\Deliverables\Final Collated Report WS4\Delivered June 2011\Appendix G\MXD's
TG A
LIG
NM
EN
T AS
AT
09 S
EP
TEM
BE
R 2
010
A

SINCLAIR KNIGHT MERZ PAGE 168
Appendix 14.H. Maps

!(5
!(8
!(3
!(1
!(7!(6
!(2
!(4
Level 3, 86 Customhouse Quay, Wellington 6011,
PO Box 10-283, Wellington 6143NEW ZEALAND
Tel +64 4 473 4265Fax +64 4 473 3369
COPYRIGHT
No DATE DRAWN AMENDMENT
CLIENT
PROJECT
DRAWN
DESIGNED
DATE
DESIGN REVIEW
REVIEWEDPROJECT MANAGER
APPROVEDPROJECT DIRECTOR
TITLE
SCALE @ A3 SKM PROJECT No DRAWING No AMDT
[
The concepts and information containedin this document are the copyright ofSinclair Knight Merz Ltd. Use or copying of the document in whole or inpart without the written permission ofSinclair Knight Merz Ltd. constitutesan infringement of copyright.
MAP 1CATCHMENT LAND COVER
NEW ZEALAND TRANSPORT AGENCY
TRANSMISSION GULLY PROJECTTECHNICAL REPORT 14
1:100,000 AE03778
SJB
CMM
MAY 2011
Land cover
bare
bush
crops
fallow
parkland/gardens
pasture/grassland
plantation forest
water
wetland
urban
Existing Roads
Proposed Road
0 1 2 3 4km
Catchments
Whareroa
Te Puka / Wainui
Horokiri
Ration
Pauatahanui
Duck
Kenepuru
Porirua
!(1
!(6!(5!(4!(3!(2
!(7!(8
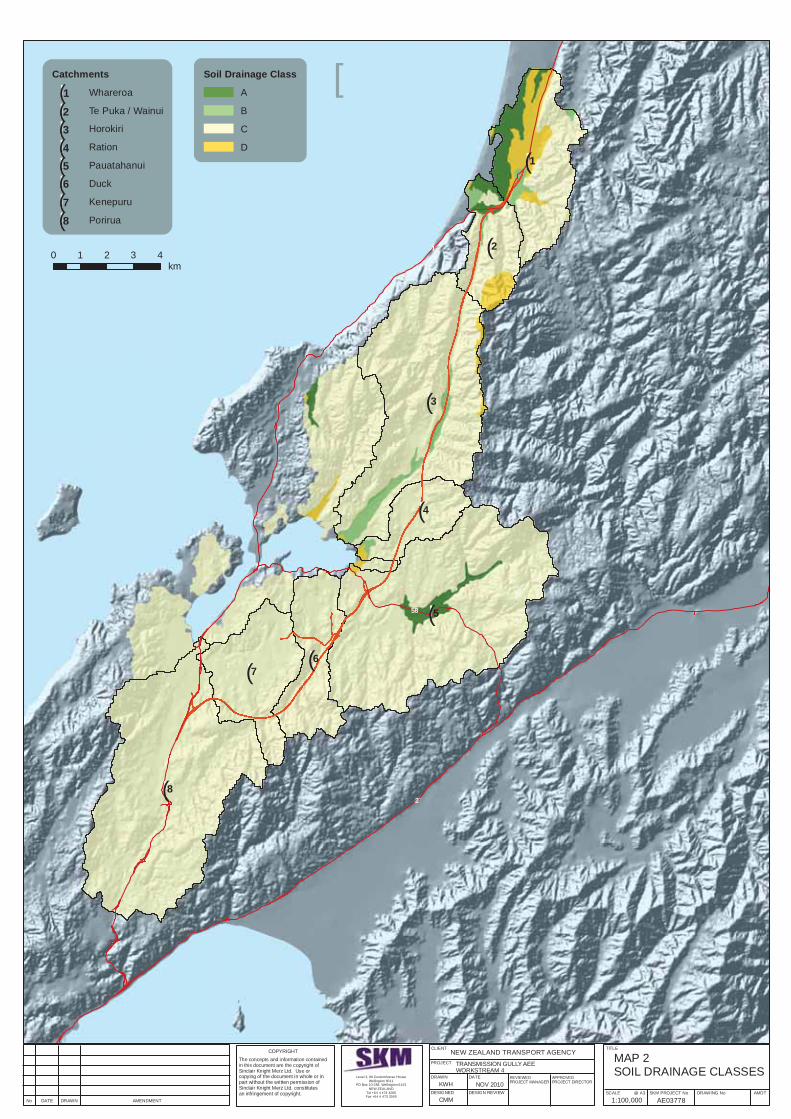
!(5
!(8
!(3
!(1
!(7!(6
!(2
!(4
··
1
··
58
··
2
Level 3, 86 Customhouse HouseWellington 6011
PO Box 10-283, Wellington 6143NEW ZEALAND
Tel +64 4 473 4265Fax +64 4 473 3369
COPYRIGHT
No DATE DRAWN AMENDMENT
CLIENT
PROJECT
DRAWN
DESIGNED
DATE
DESIGN REVIEW
REVIEWEDPROJECT MANAGER
APPROVEDPROJECT DIRECTOR
TITLE
SCALE @ A3 SKM PROJECT No DRAWING No AMDT
[
The concepts and information containedin this document are the copyright ofSinclair Knight Merz Ltd. Use or copying of the document in whole or inpart without the written permission ofSinclair Knight Merz Ltd. constitutesan infringement of copyright.
MAP 2SOIL DRAINAGE CLASSES
NEW ZEALAND TRANSPORT AGENCY
TRANSMISSION GULLY AEEWORKSTREAM 4
1:100,000 AE03778
KWH
CMM
NOV 2010
Soil Drainage Class
A
B
C
D
0 1 2 3 4km
Catchments
Whareroa
Te Puka / Wainui
Horokiri
Ration
Pauatahanui
Duck
Kenepuru
Porirua
!(1
!(6!(5!(4!(3!(2
!(7!(8

!(5
!(8
!(3
!(1
!(7!(6
!(2
!(4
··
1
··
58
··
2
Level 3, 86 Customhouse Quay, Welli ngton 6011,
PO Box 10-283, Wellington 6143NEW ZEALAND
Tel +64 4 473 4265Fax +64 4 473 3369
COPYRIGHT
No DATE DRAWN AMENDMENT
CLIENT
PROJECT
DRAWN
DESIGNED
DATE
DESIGN REVIEW
REVIEWEDPROJECT MANAGER
APPROVEDPROJECT DIRECTOR
TITLE
SCALE @ A3 SKM PROJECT No DRAWING No AMDT
[
The concepts and information containedin this document are the copyrig ht ofSinclair Kn ight M erz Ltd. Use or copying of the document in whole o r inpart without t he written pe rmission ofSinclair Kn ight M erz Ltd. constitutesan infr ingement of copyright.
MAP 3STREAM CATCHMENTS
NEW ZEALAND TRANSPORT AGENCY
TRANSMISSION GULLY AEEWORKSTREAM 4
1:100,000 AE03778
SJB
CMM
NOV 2010
Streams
State Highways
Proposed Road Alignment
0 1 2 3 4 5km
CatchmentsWhareroa 1572 Ha
Te Puka / Wainui 830 Ha
Horokiri 3306 Ha
Ration 680 Ha
Pauatahanui 4170 Ha
Duck 1030 Ha
Kenepuru 1265 Ha
Porirua 4107 Ha
!(1
!(6!(5!(4!(3!(2
!(7!(8
Te O
nepoto B
ay
Pauatahanui
Wellington Harbour
Pukerua Bay
Titahi Bay
Wha
rero
a
Bea
ch
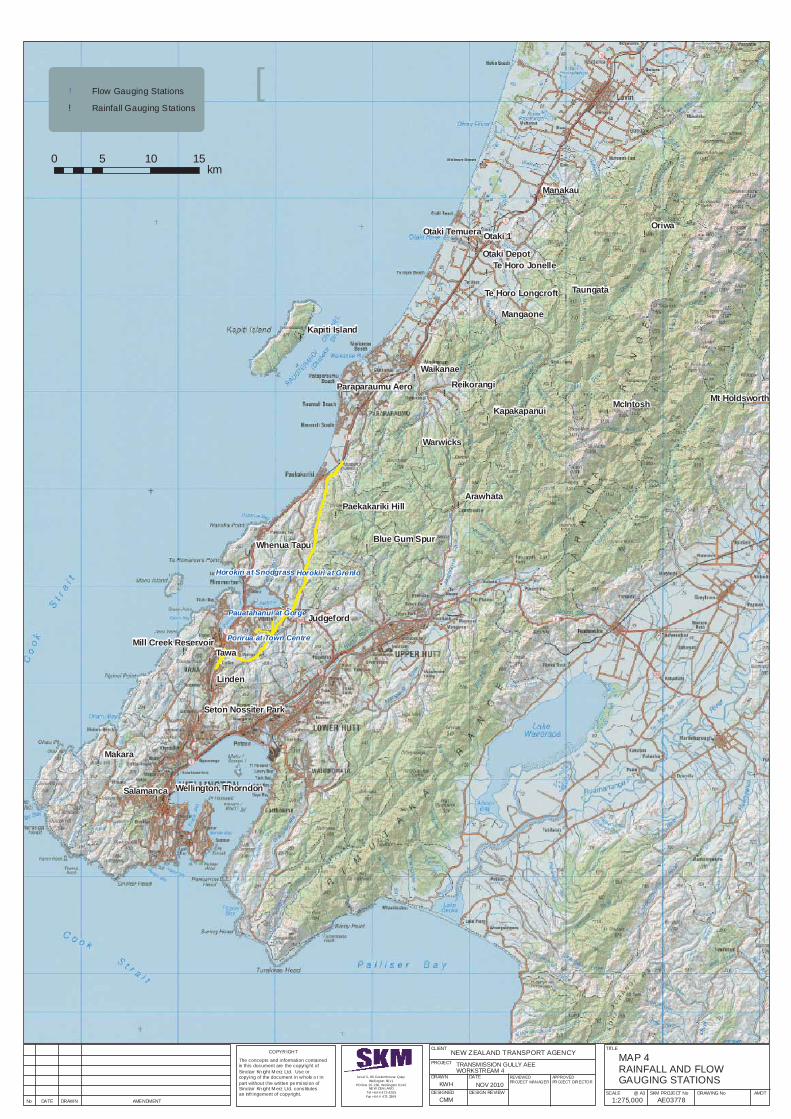
!
!
!
!
!
!
!
!!
!
!
! !
!!
!
!
!
!
!
!
!
!
! !
!
!
!
!
!
!
!!
Tawa
Oriwa
Linden
Makara
Otaki 1
Manakau
McIntosh
Warwicks
Waikanae
Taungata
Mangaone
Arawhata
Judgeford
Salamanca
Reikorangi
Whenua Tapu
Otaki Depot
Kapakapanui
Blue Gum Spur
Otaki Temuera
Mt Holdsworth
Kapiti Island
Te Horo Jonelle
Paraparaumu Aero
Paekakariki Hill
Te Horo Longcroft
Seton Nossiter Park
Wellington, Thorndon
Mill Creek Reservoir
Horokiri at Grenlo
Pauatahanui at Gorge
Horokiri at Snodgrass
Porirua at Town Centre
[! Flow Gauging Stations
! Rainfall Gauging Stations
0 5 10 15km
Level 3, 86 Customhouse QuayWelli ngton 6011
PO Box 10-283, Wellington 6143NEW ZEALAND
Tel +64 4 473 4265Fax +64 4 473 3369
COPYRIGHT
No DATE DRAWN AMENDMENT
CLIENT
PROJECT
DRAWN
DESIGNED
DATE
DESIGN REVIEW
REVIEWEDPROJECT MANAGER
APPROVEDPROJECT DIRECTOR
TITLE
SCALE @ A3 SKM PROJECT No DRAWING No AMDT
The concepts and information containedin this document are the copyrig ht ofSinclair Kn ight M erz Ltd. Use or copying of the document in whole o r inpart without t he written pe rmission ofSinclair Kn ight M erz Ltd. constitutesan infr ingement of copyright.
MAP 4RAINFALL AND FLOW GAUGING STATIONS
NEW ZEALAND TRANSPORT AGENCY
TRANSMISSION GULLY AEEWORKSTREAM 4
1:275,000 AE03778
KWH
CMM
NOV 2010

SH 58
BRAD
EY R
OAD
JOSEPH BANKS DRIVE
LANYON PLACE
GRAYS ROAD
PAR
EMATA H
AYWAR
DS R
OAD
VOYAGER WAY
SH 58
Level 3, 86 Customhouse QuayWellington 6011
PO Box 10-283, Wellington 6143NEW ZEALAND
Tel +64 4 473 4265Fax +64 4 473 3369
COPYRIGHT
No DATE DRAWN AMENDMENT
CLIENT
PROJECT
DRAWN
DESIGNED
DATE
DESIGN REVIEW
REVIEWEDPROJECT MANAGER
APPROVEDPROJECT DIRECTOR
TITLE
SCALE @ A3 SKM PROJECT No DRAWING No AMDT
The concepts and information containedin this document are the copyright ofSinclair Knight Merz Ltd. Use or copying of the document in whole or inpart without the written permission ofSinclair Knight Merz Ltd. constitutesan infringement of copyright.
MAP 5APAUATAHANUI PEAKINUNDATION DEPTHS
NEW ZEALAND TRANSPORT AGENCYTRANSMISSION GULLY PROJECTTECHNICAL REPORT 14
1:5,000 AE03778
KWH
CMM
MAY 2011
[
0 100 200 300m
FILE
NA
ME
: I:\
AE
NV
W\P
roje
cts\
AE
0377
8\D
eliv
erab
les\
Fina
l Col
late
d R
epor
t WS
4\M
aste
r\Pla
n S
et\M
XD
s\M
ap6a
_Pau
atah
anui
_Inu
ndat
ionP
eak_
Q10
.mxd
Modelled Stream Channel
0 - 0.15
0.15 - 0.3
0.3 - 0.5
0.5 - 0.75
0.75 - 1
>1
Existing Q10Inundation (m)
Buildings At Risk
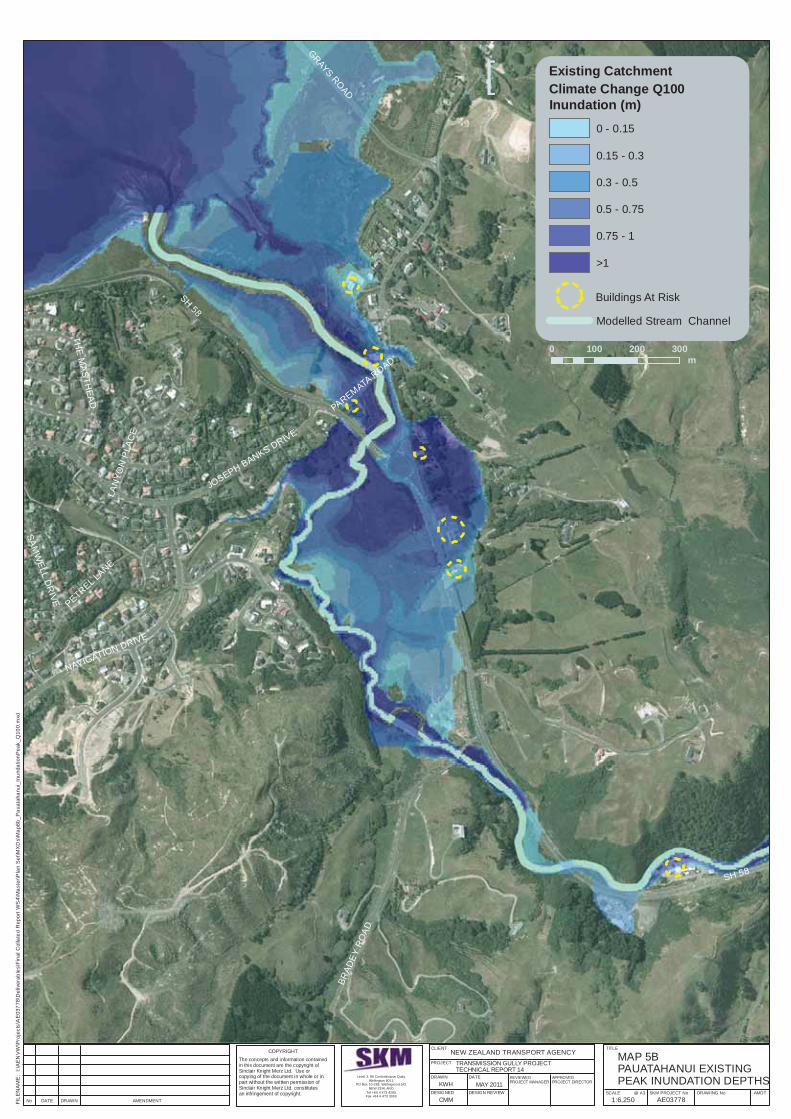
SH 58
BRAD
EY R
OAD
GRAYS ROAD
JOSEPH BANKS DRIVE
NAVIGATION DRIVE
SAMW
ELL DR
IVE
LAN
YON
PLA
CE
THE M
AS
THEA
D
PETREL LANE
PAREMATA ROAD
SH 58
Level 3, 86 Customhouse QuayWellington 6011
PO Box 10-283, Wellington 6143NEW ZEALAND
Tel +64 4 473 4265Fax +64 4 473 3369
COPYRIGHT
No DATE DRAWN AMENDMENT
CLIENT
PROJECT
DRAWN
DESIGNED
DATE
DESIGN REVIEW
REVIEWEDPROJECT MANAGER
APPROVEDPROJECT DIRECTOR
TITLE
SCALE @ A3 SKM PROJECT No DRAWING No AMDT
The concepts and information containedin this document are the copyright ofSinclair Knight Merz Ltd. Use or copying of the document in whole or inpart without the written permission ofSinclair Knight Merz Ltd. constitutesan infringement of copyright.
NEW ZEALAND TRANSPORT AGENCYTRANSMISSION GULLY PROJECTTECHNICAL REPORT 14
1:6,250 AE03778
KWH
CMM
MAY 2011
[
0 100 200 300m
FILE
NA
ME
: I:\
AE
NV
W\P
roje
cts\
AE
0377
8\D
eliv
erab
les\
Fina
l Col
late
d R
epor
t WS
4\M
aste
r\Pla
n S
et\M
XD
s\M
ap6b
_Pau
atah
anui
_Inu
ndat
ionP
eak_
Q10
0.m
xd
MAP 5BPAUATAHANUI EXISTING PEAK INUNDATION DEPTHS
Modelled Stream Channel
0 - 0.15
0.15 - 0.3
0.3 - 0.5
0.5 - 0.75
0.75 - 1
>1
Climate Change Q100Inundation (m)
Buildings At Risk
Existing Catchment

SH 58
BRAD
EY R
OAD
JOSEPH BANKS DRIVE
LANYON PLACE
GRAYS ROAD
PAR
EMATA H
AYWAR
DS R
OAD
VOYAGER WAY
SH 58
Level 3, 86 Customhouse QuayWellington 6011
PO Box 10-283, Wellington 6143NEW ZEALAND
Tel +64 4 473 4265Fax +64 4 473 3369
COPYRIGHT
No DATE DRAWN AMENDMENT
CLIENT
PROJECT
DRAWN
DESIGNED
DATE
DESIGN REVIEW
REVIEWEDPROJECT MANAGER
APPROVEDPROJECT DIRECTOR
TITLE
SCALE @ A3 SKM PROJECT No DRAWING No AMDT
The concepts and information containedin this document are the copyright ofSinclair Knight Merz Ltd. Use or copying of the document in whole or inpart without the written permission ofSinclair Knight Merz Ltd. constitutesan infringement of copyright.
MAP 6APAUATAHANUI FLOOD RISK
NEW ZEALAND TRANSPORT AGENCY
TRANSMISSION GULLY PROJECTTECHNICAL REPORT 14
1:5,000 AE03778
KWH
CMM
MAY 2011
[
0 100 200 300m
FILE
NA
ME
: I:\
AE
NV
W\P
roje
cts\
AE
0377
8\D
eliv
erab
les\
Fina
l Col
late
d R
epor
t WS
4\M
aste
r\Pla
n S
et\M
XD
s\M
ap7a
_Pau
atah
anui
_Flo
odR
isk_
Q10
.mxd
Modelled Stream Channel
0 - 0.15
0.15 - 0.3
0.3 - 0.5
0.5 - 0.75
0.75 - 1
>1
Q10 Inundation (m)With Project
Proposed Bridge
Proposed Road Alignment
Proposed Laydown Area
Flood Mitigation Measures
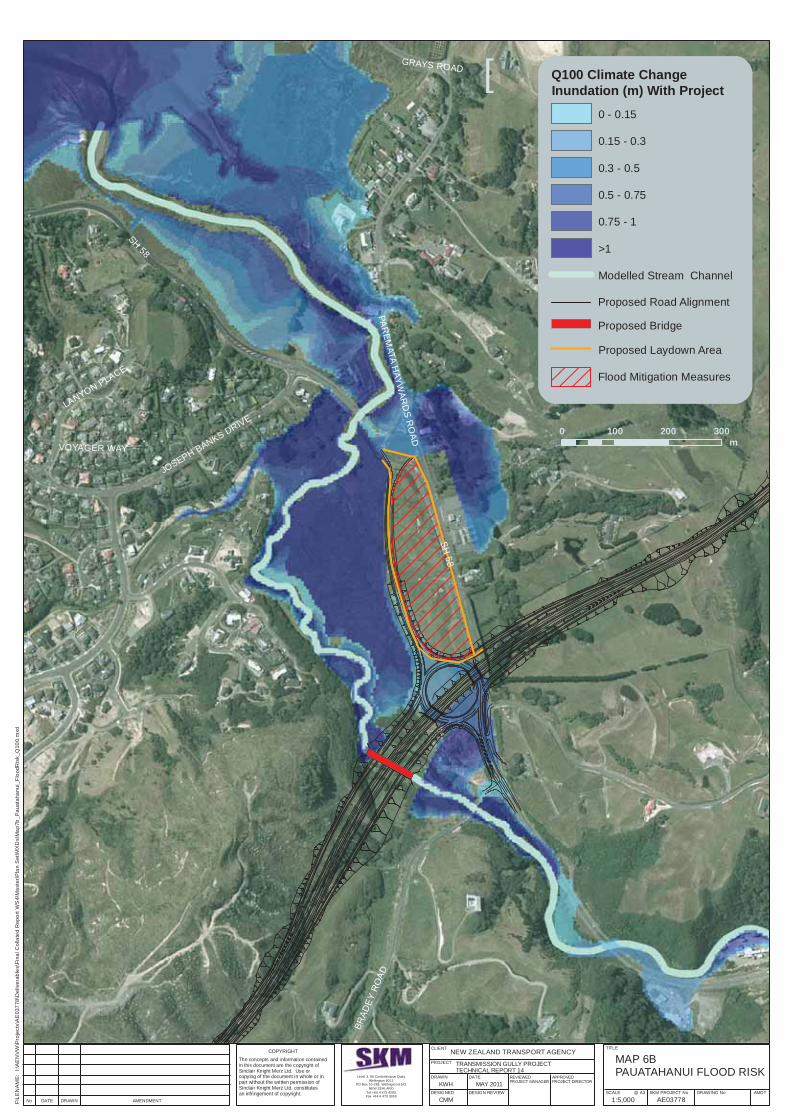
SH 58
BRAD
EY R
OAD
JOSEPH BANKS DRIVE
LANYON PLACE
GRAYS ROAD
PAR
EMATA H
AYWAR
DS R
OAD
VOYAGER WAY
SH 58
Level 3, 86 Customhouse QuayWellington 6011
PO Box 10-283, Wellington 6143NEW ZEALAND
Tel +64 4 473 4265Fax +64 4 473 3369
COPYRIGHT
No DATE DRAWN AMENDMENT
CLIENT
PROJECT
DRAWN
DESIGNED
DATE
DESIGN REVIEW
REVIEWEDPROJECT MANAGER
APPROVEDPROJECT DIRECTOR
TITLE
SCALE @ A3 SKM PROJECT No DRAWING No AMDT
The concepts and information containedin this document are the copyright ofSinclair Knight Merz Ltd. Use or copying of the document in whole or inpart without the written permission ofSinclair Knight Merz Ltd. constitutesan infringement of copyright.
MAP 6BPAUATAHANUI FLOOD RISK
NEW ZEALAND TRANSPORT AGENCY
TRANSMISSION GULLY PROJECTTECHNICAL REPORT 14
1:5,000 AE03778
KWH
CMM
MAY 2011
[
0 100 200 300m
FILE
NA
ME
: I:\
AE
NV
W\P
roje
cts\
AE
0377
8\D
eliv
erab
les\
Fina
l Col
late
d R
epor
t WS
4\M
aste
r\Pla
n S
et\M
XD
s\M
ap7b
_Pau
atah
anui
_Flo
odR
isk_
Q10
0.m
xd
Modelled Stream Channel
0 - 0.15
0.15 - 0.3
0.3 - 0.5
0.5 - 0.75
0.75 - 1
>1
Q100 Climate ChangeInundation (m) With Project
Proposed Bridge
Proposed Road Alignment
Proposed Laydown Area
Flood Mitigation Measures

17
86
13
8890
17
92
SH 58
BRAD
EY R
OAD
JOSEPH BANKS DRIVE
LANYON PLACE
GRAYS ROAD
PAR
EMATA H
AYWAR
DS R
OAD
VOYAGER WAY
SH 58
Level 3, 86 Customhouse QuayWellington 6011
PO Box 10-283, Wellington 6143NEW ZEALAND
Tel +64 4 473 4265Fax +64 4 473 3369
COPYRIGHT
No DATE DRAWN AMENDMENT
CLIENT
PROJECT
DRAWN
DESIGNED
DATE
DESIGN REVIEW
REVIEWEDPROJECT MANAGER
APPROVEDPROJECT DIRECTOR
TITLE
SCALE @ A3 SKM PROJECT No DRAWING No AMDT
The concepts and information containedin this document are the copyright ofSinclair Knight Merz Ltd. Use or copying of the document in whole or inpart without the written permission ofSinclair Knight Merz Ltd. constitutesan infringement of copyright.
MAP 7COMPARISON OF PEAK WATERLEVELS IN PAUATAHANUI
NEW ZEALAND TRANSPORT AGENCY
TRANSMISSION GULLY PROJECTTECHNICAL REPORT 14
1:5,000 AE03778
KWH
CMM
MAY 2011
[
0 100 200 300m
FILE
NA
ME
: I:\
AE
NV
W\P
roje
cts\
AE
0377
8\D
eliv
erab
les\
Fina
l Col
late
d R
epor
t WS
4\M
aste
r\Pla
n S
et\M
XD
s\M
ap8_
Pau
atah
anui
_Com
paris
on_Q
100.
mxd
Modelled Stream Channel
Q100 Difference in PeakWater Surface Level (m)
Proposed Bridge
Proposed Road Alignment
Proposed Laydown Area
Flood Mitigation Measures
-0.15 - -0.01
Incr
ease
Dec
reas
e < -1-1 - -0.5-0.5 - -0.3-0.3 - -0.15
0.01 - 0.150.15 - 0.30.3 - 0.50.5 - 1> 1
Negatively Impacted Properties with Address90
With Project

Level 3, 86 Customhouse QuayWellington 6011
PO Box 10-283, Wellington 6143NEW ZEALAND
Tel +64 4 473 4265Fax +64 4 473 3369
COPYRIGHT
No DATE DRAWN AMENDMENT
CLIENT
PROJECT
DRAWN
DESIGNED
DATE
DESIGN REVIEW
REVIEWEDPROJECT MANAGER
APPROVEDPROJECT DIRECTOR
TITLE
SCALE @ A3 SKM PROJECT No DRAWING No AMDT
The concepts and information containedin this document are the copyright ofSinclair Knight Merz Ltd. Use or copying of the document in whole or inpart without the written permission ofSinclair Knight Merz Ltd. constitutesan infringement of copyright.
MAP 8AHOROKIRI PEAKINUNDATION DEPTHSUPPER CATCHMENT
NEW ZEALAND TRANSPORT AGENCY
TRANSMISSION GULLY PROJECTTECHNICAL REPORT 14
1:10,000 AE03778
KWH
CMM
MAY 2011
[
0 200 400 600m
FILE
NA
ME
: I:\
AE
NV
W\P
roje
cts\
AE
0377
8\D
eliv
erab
les\
Fina
l Col
late
d R
epor
t WS
4\M
aste
r\Pla
n S
et\M
XD
s\M
ap9a
_Hor
okiri
_Inu
ndat
ionP
eak_
Q10
_UP
PE
R.m
xd
Modelled Stream Channel
Existing Q10
Proposed Designation
0 - 0.15
0.15 - 0.3
0.3 - 0.5
0.5 - 1
> 1
Inundation (m)

PAEK
AKA
RIKI H
ILL RO
AD
Level 3, 86 Customhouse QuayWellington 6011
PO Box 10-283, Wellington 6143NEW ZEALAND
Tel +64 4 473 4265Fax +64 4 473 3369
COPYRIGHT
No DATE DRAWN AMENDMENT
CLIENT
PROJECT
DRAWN
DESIGNED
DATE
DESIGN REVIEW
REVIEWEDPROJECT MANAGER
APPROVEDPROJECT DIRECTOR
TITLE
SCALE @ A3 SKM PROJECT No DRAWING No AMDT
The concepts and information containedin this document are the copyright ofSinclair Knight Merz Ltd. Use or copying of the document in whole or inpart without the written permission ofSinclair Knight Merz Ltd. constitutesan infringement of copyright.
MAP 8BHOROKIRI PEAKINUNDATION DEPTHSMID CATCHMENT
NEW ZEALAND TRANSPORT AGENCY
TRANSMISSION GULLY PROJECTTECHNICAL REPORT 14
1:10,000 AE03778
KWH
CMM
MAY 2011
[
0 200 400 600m
FILE
NA
ME
: I:\
AE
NV
W\P
roje
cts\
AE
0377
8\D
eliv
erab
les\
Fina
l Col
late
d R
epor
t WS
4\M
aste
r\Pla
n S
et\M
XD
s\M
ap9b
_Hor
okiri
_Inu
ndat
ionP
eak_
Q10
_MID
.mxd
Modelled Stream Channel
Existing Q10
Proposed Designation
0 - 0.15
0.15 - 0.3
0.3 - 0.5
0.5 - 1
> 1
Inundation (m)

PAEK
AKAR
IKI H
ILL
RO
AD
GRAYS ROAD
Level 3, 86 Customhouse QuayWellington 6011
PO Box 10-283, Wellington 6143NEW ZEALAND
Tel +64 4 473 4265Fax +64 4 473 3369
COPYRIGHT
No DATE DRAWN AMENDMENT
CLIENT
PROJECT
DRAWN
DESIGNED
DATE
DESIGN REVIEW
REVIEWEDPROJECT MANAGER
APPROVEDPROJECT DIRECTOR
TITLE
SCALE @ A3 SKM PROJECT No DRAWING No AMDT
The concepts and information containedin this document are the copyright ofSinclair Knight Merz Ltd. Use or copying of the document in whole or inpart without the written permission ofSinclair Knight Merz Ltd. constitutesan infringement of copyright.
MAP 8CHOROKIRI PEAKINUNDATION DEPTHSLOWER CATCHMENT
NEW ZEALAND TRANSPORT AGENCY
TRANSMISSION GULLY PROJECTTECHNICAL REPORT 14
1:10,000 AE03778
KWH
CMM
MAY 2011
[
0 200 400 600m
FILE
NA
ME
: I:\
AE
NV
W\P
roje
cts\
AE
0377
8\D
eliv
erab
les\
Fina
l Col
late
d R
epor
t WS
4\M
aste
r\Pla
n S
et\M
XD
s\M
ap9c
_Hor
okiri
_Inu
ndat
ionP
eak_
Q10
_LO
WE
R.m
xd
Modelled Stream Channel
Existing Q10Inundation (m)
Proposed Designation
0 - 0.15
0.15 - 0.3
0.3 - 0.5
0.5 - 1
> 1
Buildings At Risk

Level 3, 86 Customhouse QuayWellington 6011
PO Box 10-283, Wellington 6143NEW ZEALAND
Tel +64 4 473 4265Fax +64 4 473 3369
COPYRIGHT
No DATE DRAWN AMENDMENT
CLIENT
PROJECT
DRAWN
DESIGNED
DATE
DESIGN REVIEW
REVIEWEDPROJECT MANAGER
APPROVEDPROJECT DIRECTOR
TITLE
SCALE @ A3 SKM PROJECT No DRAWING No AMDT
The concepts and information containedin this document are the copyright ofSinclair Knight Merz Ltd. Use or copying of the document in whole or inpart without the written permission ofSinclair Knight Merz Ltd. constitutesan infringement of copyright.
MAP 8DHOROKIRI PEAKINUNDATION DEPTHSUPPER CATCHMENT
NEW ZEALAND TRANSPORT AGENCY
TRANSMISSION GULLY PROJECTTECHNICAL REPORT 14
1:10,000 AE03778
KWH
CMM
MAY 2011
[
0 200 400 600m
Modelled Stream Channel
Climate Change Q100
Proposed Designation
0 - 0.15
0.15 - 0.3
0.3 - 0.5
0.5 - 1
> 1
Inundation (m)
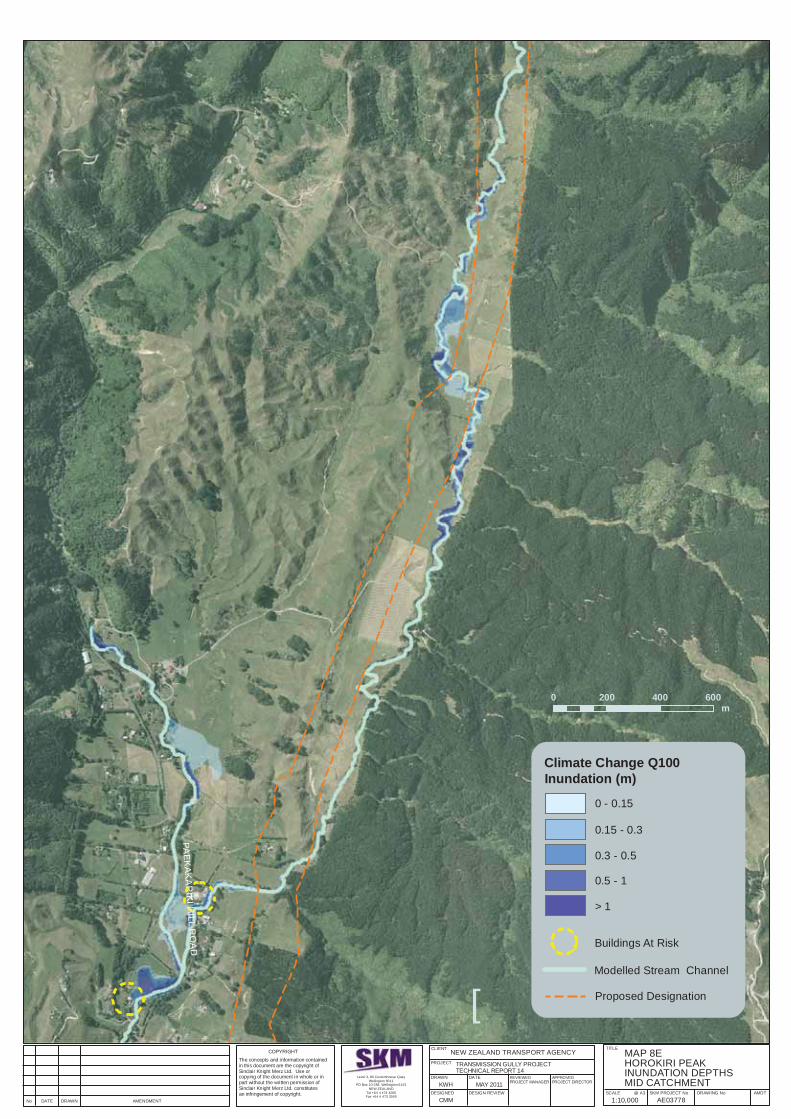
PAEK
AKA
RIKI H
ILL RO
AD
Level 3, 86 Customhouse QuayWellington 6011
PO Box 10-283, Wellington 6143NEW ZEALAND
Tel +64 4 473 4265Fax +64 4 473 3369
COPYRIGHT
No DATE DRAWN AMENDMENT
CLIENT
PROJECT
DRAWN
DESIGNED
DATE
DESIGN REVIEW
REVIEWEDPROJECT MANAGER
APPROVEDPROJECT DIRECTOR
TITLE
SCALE @ A3 SKM PROJECT No DRAWING No AMDT
The concepts and information containedin this document are the copyright ofSinclair Knight Merz Ltd. Use or copying of the document in whole or inpart without the written permission ofSinclair Knight Merz Ltd. constitutesan infringement of copyright.
MAP 8EHOROKIRI PEAKINUNDATION DEPTHSMID CATCHMENT
NEW ZEALAND TRANSPORT AGENCY
TRANSMISSION GULLY PROJECTTECHNICAL REPORT 14
1:10,000 AE03778
KWH
CMM
MAY 2011
[
0 200 400 600m
Modelled Stream Channel
Climate Change Q100Inundation (m)
Proposed Designation
0 - 0.15
0.15 - 0.3
0.3 - 0.5
0.5 - 1
> 1
Buildings At Risk

PAEK
AKAR
IKI H
ILL
RO
AD
GRAYS ROAD
Level 3, 86 Customhouse QuayWellington 6011
PO Box 10-283, Wellington 6143NEW ZEALAND
Tel +64 4 473 4265Fax +64 4 473 3369
COPYRIGHT
No DATE DRAWN AMENDMENT
CLIENT
PROJECT
DRAWN
DESIGNED
DATE
DESIGN REVIEW
REVIEWEDPROJECT MANAGER
APPROVEDPROJECT DIRECTOR
TITLE
SCALE @ A3 SKM PROJECT No DRAWING No AMDT
The concepts and information containedin this document are the copyright ofSinclair Knight Merz Ltd. Use or copying of the document in whole or inpart without the written permission ofSinclair Knight Merz Ltd. constitutesan infringement of copyright.
MAP 8FHOROKIRI PEAKINUNDATION DEPTHSLOWER CATCHMENT
NEW ZEALAND TRANSPORT AGENCY
TRANSMISSION GULLY PROJECTTECHNICAL REPORT 14
1:10,000 AE03778
KWH
CMM
MAY 2011
[
0 200 400 600m
Modelled Stream Channel
Climate Change Q100Inundation (m)
Proposed Designation
0 - 0.15
0.15 - 0.3
0.3 - 0.5
0.5 - 1
> 1
Buildings At Risk

SH 1
TILL
EY R
OAD
WEL
LING
TON
RO
AD
TE MITI STREET
APER
AHAM
A ST
REET
TARAWA STREET
HAUM
IA S
TREE
T
MUTU ROAD
MIRIONA GROVE
Level 3, 86 Customhouse QuayWellington 6011
PO Box 10-283, Wellington 6143NEW ZEALAND
Tel +64 4 473 4265Fax +64 4 473 3369
COPYRIGHT
No DATE DRAWN AMENDMENT
CLIENT
PROJECT
DRAWN
DESIGNED
DATE
DESIGN REVIEW
REVIEWEDPROJECT MANAGER
APPROVEDPROJECT DIRECTOR
TITLE
SCALE @ A3 SKM PROJECT No DRAWING No AMDT
The concepts and information containedin this document are the copyright ofSinclair Knight Merz Ltd. Use or copying of the document in whole or inpart without the written permission ofSinclair Knight Merz Ltd. constitutesan infringement of copyright.
MAP 9ATE PUKA / WAINUI PEAKINUNDATION DEPTHS
NEW ZEALAND TRANSPORT AGENCYTRANSMISSION GULLY PROJECTTECHNICAL REPORT 14
1:6,000 AE03778
KWH
CMM
MAY 2011
[
0 100 200 300 400m
Modelled Stream Channel
Existing Q10
Proposed Designation
0 - 0.15
0.15 - 0.3
0.3 - 0.5
0.5 - 1
> 1
Inundation (m)

SH 1
TILL
EY R
OAD
WEL
LING
TON
RO
AD
TE MITI STREET
APER
AHAM
A ST
REET
TARAWA STREET
HAUM
IA S
TREE
T
MUTU ROAD
MIRIONA GROVE
Level 3, 86 Customhouse QuayWellington 6011
PO Box 10-283, Wellington 6143NEW ZEALAND
Tel +64 4 473 4265Fax +64 4 473 3369
COPYRIGHT
No DATE DRAWN AMENDMENT
CLIENT
PROJECT
DRAWN
DESIGNED
DATE
DESIGN REVIEW
REVIEWEDPROJECT MANAGER
APPROVEDPROJECT DIRECTOR
TITLE
SCALE @ A3 SKM PROJECT No DRAWING No AMDT
The concepts and information containedin this document are the copyright ofSinclair Knight Merz Ltd. Use or copying of the document in whole or inpart without the written permission ofSinclair Knight Merz Ltd. constitutesan infringement of copyright.
MAP 9BTE PUKA / WAINUI PEAKINUNDATION DEPTHS
NEW ZEALAND TRANSPORT AGENCYTRANSMISSION GULLY PROJECTTECHNICAL REPORT 14
1:6,000 AE03778
KWH
CMM
MAY 2011
[
0 100 200 300 400m
Modelled Stream Channel
Climate Change Q100
Proposed Designation
0 - 0.15
0.15 - 0.3
0.3 - 0.5
0.5 - 1
> 1
Inundation (m)