APPENDICES - NASA · Why? Correct or incorrect? Why? Effective or ineffective? Why? Relevant or...
50
APPENDICES Meteorology Activities for Grades 5-9 83 NP-2006-08-97-LaRC
Transcript of APPENDICES - NASA · Why? Correct or incorrect? Why? Effective or ineffective? Why? Relevant or...

APPENDICES
Meteorology Activities for Grades 5-9 83 NP-2006-08-97-LaRC

Meteorology Activities for Grades 5-9 84 NP-2006-08-97-LaRC

APPENDIX I: Suggestions for Maximizing the Use of Learner-Designed Activities
We planned this guide to facilitate the move from teacher-centered learning to more student-centered learning. Here are some suggestions and explanations in using the various sections of each chapter. However, the educator should feel free to determine how these suggestions are best used for students under her/his guidance. Our suggestions should augment, rather than supplant, the creative abilities of teachers.
Think About This!
This section is a type of advanced organizer to be used by the teacher with students to prepare students for in-depth thought and to create a mindset for the activity to follow. Often, this section makes use of events or situations that are common experiences for the learner. At times, the learner is asked to think about next steps to develop further an experience or activity that he/she just completed. The teachers are encouraged to substitute an advanced organizer they feel fits the situation.
Probing Further
This section is intended to facilitate deeper thought about the experience or activity performed. The learner is encouraged to think beyond the simple outcome to which factors might affect the outcomes and make the experience more complex. Further, the learner might need to conduct additional investigations to verify his/her conclusions.
Objectives For The Learner
This section identifies and provides examples of student objectives for the four essentials of inquiry. It is strongly suggested that the four essentials of inquiry be addressed in each activity. In the case of guided and open inquiry, the examples are more hypothetical because the objectives in these types of activities will need to be determined by input from learner and teacher alike.
Preparation
This section provides the educator with some aspects of classroom management. If the activity is confirmation-verification or structured inquiry, assistance is in the form of listing and explaining needed materials and equipment. If the activity is guided or open inquiry, suggestions have more to do with how the teacher anticipates possible activity design and prepares materials and equipment to accommodate the learner’s potential direction. It is important to become more experienced with guided and open inquiry learning.
Meteorology Activities for Grades 5-9 85 NP-2006-08-97-LaRC

Examining The Results
Important guidance is provided for the teacher to bring effective closure to an activity or experience. This guidance is in the form of questions that can facilitate learners’ rethinking important steps in the activity or experience. The teacher is provided some possible resolutions to the questions. These are italicized and should not be seen by the learner. The educator should feel free to accept suggested solutions put forth by the student that are supported by data gathered in the activity or experience.
Conclusion
Examples are provided for the teacher that seem to flow naturally from the questions asked and the data gathered to support the learner’s conclusions. An important consideration is nurturing of the scientific habits of mind, such as careful observations, respect for data, insistence on verification, and conducting experiments safely.
Going Further
This section provides the educator suggestions to challenge the learner to go beyond the current activity or experience to further verify results, probe more deeply. or to take the outcome to another level of inquiry.
Challenge
This section is designed for the teacher to raise new issues. It is intended to encourage the learner to take a different perspective on the same issue that has been discussed or investigated. This perspective might yield additional insight into the issue.
Background For The Teacher
Where concepts are more advanced, in-depth or additional information about subjects under investigation are provided.
Meteorology Activities for Grades 5-9 86 NP-2006-08-97-LaRC

Four Levels of Questions
Introduction to the Four Levels of Questions
These questions are a modification and elaboration of the work of Dennis Palmer Wolf, specifically from “The Art of Questioning” Academic Connections: pp. 1-7, Winter 1987 and the work found in the PBS series “Learning Science Through Inquiry.”
The “stem” of questions helps the teacher of learning raise or lower a question’s level. Low level questions are characterized by getting at specific facts or definitions with stems such as, “who did it” and “when did it occur.” As the learner becomes more experienced with inquiry learning, a question’s level can be raised to analysis, interpretation, evaluation and opinion questions. Thus, the learner is challenged by changing the stem, for example, to “if this result occurs, what might be the consequence?” The following stems are designed to help the teacher of learning raise the inquiry level by seeing how the level is changed as the stem is changed.
Level 1. Summarizing/Definition/Fact Questions
What is the definition of ...?Who did ...?When did ... occur?How much/many ...?What is an example of ...?
Level 2. Analysis/Interpretation Questions
How did ... occur?Why does ... occur?What are the reasons for ...?What are types of ...?How does ... function?How does the process occur?What are my own examples of ...?What causes ... to occur?What results when ... occurs?What is the relationship between ... and ...?How is ... similar to/different from ...?How does... affect or apply to...?What does ... mean?What conclusions can be drawn from ... information?What is (are) the problem(s), conflict(s), issue(s)?What are possible solutions/resolutions to these problems, conflicts, issues?What is the main argument or thesis of an author?How is this argument developed?What evidence, proof, support is offered?What are other theories, arguments from other authors?
Meteorology Activities for Grades 5-9 87 NP-2006-08-97-LaRC
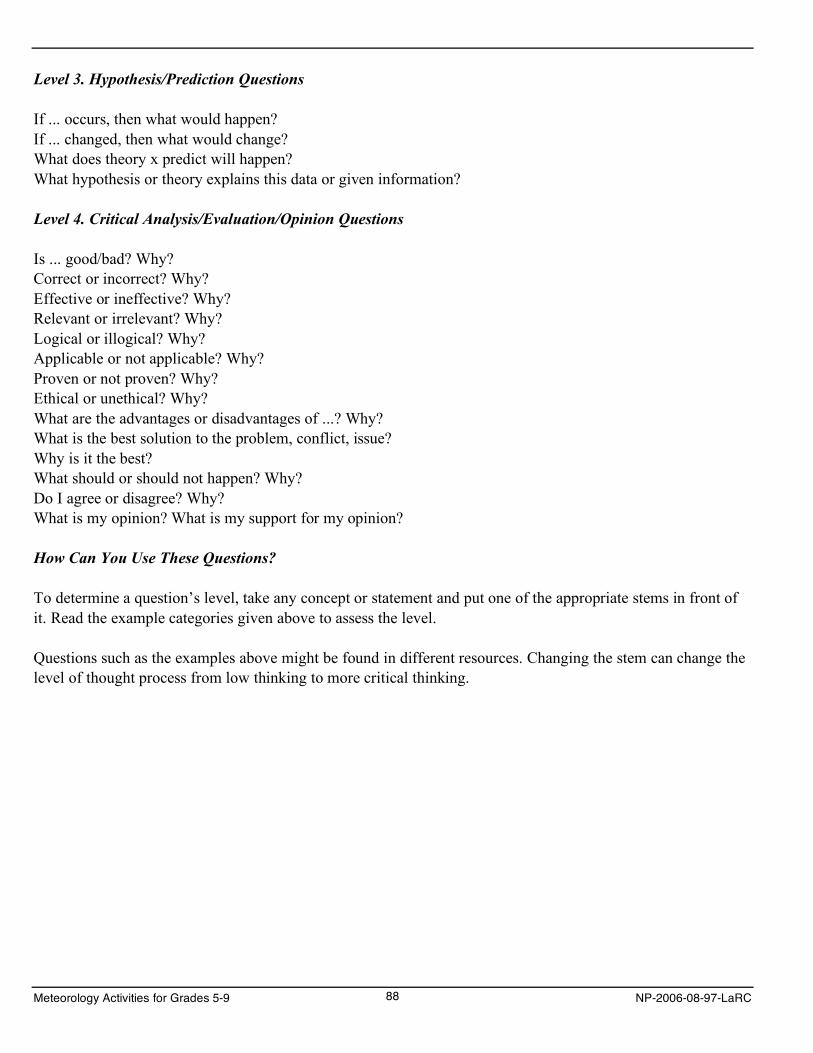
Level 3. Hypothesis/Prediction Questions
If ... occurs, then what would happen?If ... changed, then what would change?What does theory x predict will happen?What hypothesis or theory explains this data or given information?
Level 4. Critical Analysis/Evaluation/Opinion Questions
Is ... good/bad? Why?Correct or incorrect? Why?Effective or ineffective? Why?Relevant or irrelevant? Why?Logical or illogical? Why?Applicable or not applicable? Why?Proven or not proven? Why?Ethical or unethical? Why?What are the advantages or disadvantages of ...? Why?What is the best solution to the problem, conflict, issue?Why is it the best?What should or should not happen? Why?Do I agree or disagree? Why?What is my opinion? What is my support for my opinion?
How Can You Use These Questions?
To determine a question’s level, take any concept or statement and put one of the appropriate stems in front of it. Read the example categories given above to assess the level.
Questions such as the examples above might be found in different resources. Changing the stem can change the level of thought process from low thinking to more critical thinking.
Meteorology Activities for Grades 5-9 88 NP-2006-08-97-LaRC

APPENDIX II: Selected Weather Adages
The higher the clouds the better the weather.High clouds indicate fine weather will prevail.Lower clouds mean rain.
If all stars are out at night,it will be a nice day tomorrow.
When dew is on the grass,no rain will come to pass.
A setting red sun means it’ll be hot tomorrow.If the sun goes pale to bed ’twill rain tomorrow.
Red sky at night, sailors’ delight.Red sky in morning, sailors take warning.
The evening red and morning grayare sure signs of a fine day,but evening gray and morning redwill bring rain upon your head.
If red the sun begin his race,be sure the rain will fall apace.if red the sun set in gray,the next will be a rainy day.
When clouds look like rocks and towers,the Earth will be refreshed by showers.
If clouds look as if scratched by a hen,get ready to reef your topsails then.
Herringbone sky, neither too wet nor too dry. (Cirrus clouds have a herringbone pattern.)
Mackerel sky, not 24 hours dry.
Mackerel sky, storm is nigh.
Mackerel sky, mackerel sky — never long wet, never long dry.
Mackerel skies and mares’ tails make ships carry shortened sails.
Mares’ tails mean storms and gales.
Horses’ manes and mares’ tails, sailors soon shall shorten sails.
If clouds are gathering thick and fast, keep sharp look out for sail and mast, but if they slowly onward crawl, shoot your lines, nets and trawl.
Meteorology Activities for Grades 5-9 89 NP-2006-08-97-LaRC

When the wind is blowing in the NorthNo fisherman should set forth,When the wind is blowing in the East,’Tis not fit for man nor beast,When the wind is blowing in the SouthIt brings the food over the fish’s mouth,When the wind is blowing in the West,That is when the fishing is best!
No weather is ill, if the wind be still.
Every wind has its weather.
Yellow sky at sunset, wind in the morrow.
Rainbow in the morning,travelers take warning;rainbow at night,traveler's delight.
Rainbow in the eastern sky,the morrow will be dry.Rainbow in the west that gleams,rain falls in streams.
Grasshoppers chirp louder and louder the hotter it gets.
If wooly fleeces deck the heavenly way, be sure no rain will mar a summer's day.
When bees are out flying, there will be fair weather. When they stay close to the hive, rain is coming. (Bees do not swarm before a storm.)
March comes in like a lion, goes out like a lamb.
March winds bring April showers.
April showers bring May flowers.
Find more adages at these Web sites: http://users.tpg.com.au/sharenet/wea/forecast.html http://www.moonsmuses.com/weatherlore.html
Meteorology Activities for Grades 5-9 90 NP-2006-08-97-LaRC

APPENDIX III: The Scientific Habits of Mind* and Conceptual Themes Addressed in This Publication
Scientific Habits of Mind
The work of the 1966 Education Policies Commission serves as the foundation for addressing the “scientific habits of mind” found in this publication. “In 1966, the Education Policies Commission, recognizing the key role that could be played by science education in developing the ability to think, published a document, Education and the Spirit of Science, which emphasized science not so much as a body of accumulated knowledge but as a way of thinking, a spirit of rational inquiry driven by a belief in its efficiency and by a restless curiosity to know and understand.”
While the commission recognized that no scientist may fully exemplify the spirit of science and no work can be completely objective, it is clear that the following key values underlie science as an enterprise:
• Longing to know and understand • Questioning all things • Searching for data and their meanings • Demanding verification • Respecting logic • Considering the premises • Considering the consequences
It is believed that the more objective nature of these listed scientific habits of mind will encourage and enable educators to better nurture their development in learners.
Conceptual Themes
Conceptual themes used effectively can set specific content in a broad context to enable learners to better understand how the natural and human-designed worlds are organized, change and interrelate, thus enabling a better transfer and application of knowledge. In this publication, the first-level conceptual themes are inter-disciplinary so as to provide curriculum developers appropriate links across disciplines.
Three broad first-level conceptual themes used in this publication are:
• Organization • Change • Interrelationships
*Lawson, 1995.
Meteorology Activities for Grades 5-9 91 NP-2006-08-97-LaRC

Meteorology Activities for Grades 5-9 92 NP-2006-08-97-LaRC

APPENDIX IV: Specific National Science Education Standards Addressed In This Publication
Unifying Concepts and Processes Standard
“Conceptual and procedural schemes unify science disciplines and provide students with powerful ideas to help them understand the natural world. Because of the underlying principles embodied in this standard, the understandings and abilities described here are repeated in the other content standards. Unifying concepts and processes include:
• Systems, order, and organization. • Evidence, models, and explanation. • Change, constancy, and measurement. • Evolution and equilibrium. • Form and function.”
Science As Inquiry Standards
“In the vision presented by the Standards, inquiry is a step beyond “science as a process,” in which students learn skills, such as observation, inference, and experimentation. The new vision includes the “processes of science” and requires that students combine processes and scientific knowledge as they use scientific reasoning and critical thinking to develop their understanding of science. Engaging students in inquiry helps students develop:
• Understanding of scientific concepts. • An appreciation of “how we know” what we know in science. • Understanding of the nature of science. • Skills necessary to become independent inquirers about the natural world. • The dispositions to use the skills, abilities, and attitudes associated with science.”
Science As Content Standards
As a result of their activities in grades 5-8 all students should develop an understanding of • Structure of the Earth system. • Water evaporates from the Earth’s surface, rises, cools as it rises to higher elevations,
condenses as rain or snow and falls to the surface.• The atmosphere is a mixture of nitrogen, oxygen, and trace gases that include water
vapor.• Clouds, formed by condensation of water vapor, affect weather and climate. • Global patterns of atmospheric movement influence local weather. • The sun is the major source of energy for phenomena on the Earth’s surface, such as
the movement of air masses and winds.• As the number of parts of a system increases, the number of possible interactions between pairs of parts
increases much more rapidly.
Meteorology Activities for Grades 5-9 93 NP-2006-08-97-LaRC

The Nature of Technology
Standard 1: Students will develop an understanding of the characteristics and scope of technology.
Standard 2: Students will develop an understanding of the core concepts of technology.
Standard 3: Students will develop an understanding of the relationships among technologies and theconnections between technology and other fields of study.
Technology and Society
Standard 4: Students will develop an understanding of the cultural, social, economic, and political effects of technology.
Standard 5: Students will develop an understanding of the effects of technology on the environment.
Standard 6: Students will develop an understanding of the role of society in the development and use of technology.
Standard 7: Students will develop an understanding of the influence of technology on history.
Design
Standard 8: Students will develop an understanding of the attributes of design.
Standard 9: Students will develop an understanding of engineering design.
Standard 10: Students will develop an understanding of the role of troubleshooting, research and development, invention and innovation, and experimentation in problem solving.
Abilities for a Technological World
Standard 11: Students will develop abilities to apply the design process.
Standard 12: Students will develop abilities to use and maintain technological products and systems.
Standard 13: Students will develop abilities to assess the impact of products and systems.
The Designed World
Standard 16: Students will develop an understanding of and be able to select and use energy and power technologies.
Standard 17: Students will develop an understanding of and be able to select and use information and communication technologies.
Standard 20: Students will develop an understanding of and be able to select and use construction technologies.
Meteorology Activities for Grades 5-9 94 NP-2006-08-97-LaRC

Meteorology Activities for Grades 5-9 NP-2006-08-97-LaRC 95
APPENDIX V: Web Sites for Enhancing the Understanding of Weather The following Web sites have been selected to enhance understanding of the activities presented in this booklet. Some are selected because they give more specific information about the essential knowledge and context for meteorology. Others provide additional insight into the tools and apparatus for measuring aspects of meteoro-logical factors. You should feel free to add to this list of Web sites. Inquiry Learning Networking for Leadership, Inquiry and Systemic Thinking (NLIST) http://www.nlistinquiryscience.com NASA Weather Materials On-line Lessons and Resources http://nasaexplores.nasa.gov General Weather Information http://www.nasa.gov/audience/foreducators/topnav/materials/listbytype/By_Type_Guides_landingpage.html The Case of the Phenomenal Weather (Release Date: April 10, 2002) http://scifiles.larc.nasa.gov/episodes.html Wild Weather Adventure Game http://spaceplace.nasa.gov/en/kids/goes/wwa El Niño http://spaceplace.nasa.gov/en/kids/topex_make1.shtml The Earth Observing System http://eospso.gsfc.nasa.gov Tropical Rainfall Measuring Mission (TRMM) http://trmm.gsfc.nasa.gov/education_dir/education.html TRMM Data Products http://trmm.gsfc.nasa.gov/data_dir/data.html The CERES S’COOL Project http://asd-www.larc.nasa.gov/SCOOL NASA/NOAA Cloud Chart http://science-edu.larc.nasa.gov/cloud_chart NASA’s CloudSat Mission http://www.nasa.gov/mission_pages/cloudsat/main/index.html
Meteorology Activities for Grades 5-9 NP-2006-08-97-LaRC 96
Weather Resources USA Today Education Online: Science Of Weather http://www.usatoday.com/educate/scienceofweather/index.htm Weather and Climate Information http://www.globe.gov/cgi-bin/resourceroom.cgi?parentid=25&lang=en&nav=1 NOAA Education Resources http://www.education.noaa.gov NOAA Jetstream — an Online School for Weather http://www.srh.noaa.gov/srh/jetstream The Weather Channel http://www.weather.com/index.html The Weather Channel Kids http://www.theweatherchannelkids.com National Severe Storms Laboratory http://www.nssl.noaa.gov/edu Skywatchers http://www.on.ec.gc.ca/skywatchers/index_e.html Science of Weather http://www.usatoday.com/educate/scienceofweather/index.htm Optics for Kids http://www.opticalres.com/kidoptx_f.html#LightBasics Converting Between Fahrenheit and Celsius Temperature Scales http://www.usatoday.com/weather/wtempcf.htm Folklore Folklore Weather Forecasting http://tww.id.au/wea/weather.html Weather Lore & Why http://en.wikipedia.org/wiki/Weather_lore

Meteorology Activities for Grades 5-9 NP-2006-08-97-LaRC 97
Eardrums and Changes In Pressure Cabin Pressurization http://en.wikipedia.org/wiki/Cabin_pressurization Gas Collections Within the Body http://www.pilotfriend.com/aeromed/medical/ascent_descent.htm Traveling in the Mountains and Ear Drum Pressure http://answers.google.com/answers/threadview?id=764673 The Boiling Point of Water Under Pressure http://www.sfsite.com/fsf/2001/pmpd0110.htm Boiling Water http://astro.uchicago.edu/cara/southpole.edu/boil.html Boiling Point Chart http://www.apo.nmsu.edu/site/directory/kloomis/bpH2O.html The International Boiling Point Project http://www.k12science.org/curriculum/boilproj/index.html Patterns, Change, and Expressions: Part C, Graphing Change http://www.phschool.com/math/awsm/algebra/alg0201.html Chapter 2 Answers: Patterns, Change, and Expressions: Part C, Graphing Change http://www.phschool.com/math/awsm/algebra/alg02ans.html Humidity and Moisture in the Air Water Science for Schools: The Water Cycle http://ga.water.usgs.gov/edu/watercycle.html Aviation Weather http://virtualskies.arc.nasa.gov/weather/tutorial/tutorial4.html Observing Moisture http://www.miamisci.org/hurricane/moisture.html Water Vapor, Humidity, Dewpoint and Relationship to Precipitation http://www.crh.noaa.gov/lmk/soo/docu/humidity.php Snow and Winter Storms http://www.oswego.edu/wscp/SNOW.htm

Meteorology Activities for Grades 5-9 NP-2006-08-97-LaRC 98
Weather Prediction and Meteorological Instruments Make Your Own Weather Station http://sln.fi.edu/weather/todo/todo.html Meteorological Instruments http://www.infoplease.com/encyclopedia/1metinst.html?mail-10-28 Setting Up Your Weather Station http://www.weatheroffice.pyr.ec.gc.ca/skywatchers/teachersGuide/tg_chap01_e.html Wind in Your Socks — Construct a Wind Sock http://nasaexplores.nasa.gov/show_k4_teacher_st.php?id=030106102836 Building a Psychrometer http://school.discovery.com/lessonplans/activities/weatherstation/airwaterboth.html Using a Psychrometric Chart to Describe Air Properties http://www.continentalconsulting.net/news_detail.php?NewsArticleID=3 Dry Bulb, Wet Bulb and Dew Point Temperature http://www.engineeringtoolbox.com/dry-wet-bulb-dew-point-air-d_682.html Wet-Bulb Temperature http://en.wikipedia.org/wiki/Wet-bulb_temperature Hygrometer http://en.wikipedia.org/wiki/Hygrometer Data Analysis and Measurement: a Head, Above the Clouds http://connect.larc.nasa.gov/programs/2000-2001/ahead_clouds.html STORM-E Weather Simulator http://storme.cet.edu/ Suggestions About Weather Modification http://www.space.com/scienceastronomy/051031_mystery_monday.html Severe Weather Severe Weather Primer http://www.nssl.noaa.gov/primer Beaufort Scale http://en.wikipedia.org/wiki/Beaufort_scale Beaufort Wind Scale http://www.spc.noaa.gov/faq/tornado/beaufort.html

Meteorology Activities for Grades 5-9 NP-2006-08-97-LaRC 99
Hurricanes What is a Hurricane? http://www.nationalgeographic.com/forcesofnature/interactive/index.html?section=h Mystery of Hurricane Formation http://earthobservatory.nasa.gov/Newsroom/NasaNews/2005/2005092320505.html How Do Hurricanes Form? http://spaceplace.nasa.gov/en/kids/goes/hurricanes/index.shtml How Hurricanes Work http://www.miamisci.org/hurricane/howhurrwork.html Saffir-Simpson Hurricane Scale http://en.wikipedia.org/wiki/Saffir-Simpson_Hurricane_Scale Make Your Own Hurricane http://www.nationalgeographic.com/forcesofnature/interactive/index.html?section=h Hurricane Tracking http://www.hurricanetrack.com NASA’s Hurricane Resource Page http://www.nasa.gov/mission_pages/hurricanes/main/index.html Looking At Hurricanes http://learners.gsfc.nasa.gov/mediaviewer/sat_super Hurricane Birth Through Death Animation and Story http://learners.gsfc.nasa.gov/mediaviewer/birth_hurr Hurricane Education http://www.nasa.gov/vision/earth/lookingatearth/hurricane_educ_links.html NOAA Costly Hurricanes http://www.nhc.noaa.gov/pastcost.shtml The 2006 Hurricane Season Was Near Normal http://earthobservatory.nasa.gov/Newsroom/NasaNews/2007/2007011824146.html

Meteorology Activities for Grades 5-9 NP-2006-08-97-LaRC 100
Tornadoes All About Tornadoes http://www.livescience.com/tornadoes Tornadoes In the Southern United States http://earthobservatory.nasa.gov/NaturalHazards/natural_hazards_v2.php3?img_id=13506 Tornado Information for Kids http://www.fema.gov/kids/tornado.htm Twister: The Tornado Story http://whyfiles.org/013tornado/index.html Tornadoes Are Earth’s Most Violent Storms http://www.usatoday.com/weather/resources/2006-04-03-tornado-basics_x.htm Severe Weather and Natural Disasters http://teacher.scholastic.com/activities/wwatch/tornadoes/index.htm Tornadoes On The Sun http://apod.gsfc.nasa.gov/apod/ap980429.html Spotting Tornadoes From Space http://science.nasa.gov/headlines/y2000/ast01may_1m.htm The Fujita Pearson Tornado Scale http://www.fema.gov/kids/fscale.htm The Fujita Scale http://en.wikipedia.org/wiki/Fujita_scale The Fujita Scale http://www.tornadoproject.com/fscale/fscale.htm The Fujita Scale as It Relates to the Beaufort and Saffir-Simpson Scales http://www.windows.ucar.edu/tour/link=/earth/Atmosphere/tornado/fujita.html

Meteorology Activities for Grades 5-9 NP-2006-08-97-LaRC 101
Severe Weather Preparedness National Hurricane Center http://www.nhc.noaa.gov/HAW2/english/intro.shtml Hurricane Warning http://www.hurricanewarning.org American Red Cross http://www.redcross.org Federal Emergency Management Agency (FEMA) http://www.fema.gov Pacific Disaster Center http://www.pdc.org Clouds Head In The Clouds (Cloudspotter Wheel) http://www.srh.weather.gov/srh/jetstream/synoptic/ll_clouds1.htm Cloud Classifications (Sky Watcher Chart) http://www.srh.noaa.gov/srh/jetstream/synoptic/clouds_max.htm NASA/NOAA Cloud Chart http://science-edu.larc.nasa.gov/cloud_chart One-page Cloud ID Chart http://asd-www.larc.nasa.gov/SCOOL/Cloud_ID.html Cloud Appreciation Society Cloud Gallery http://www.cloudappreciationsociety.org/gallery/index.php?x=browse&category=39&pagenum=1>http://www.cloudappreciationsociety.org/gallery/index.php?x=browse&category=39&pagenum=1 An Illustration of Cloud Types http://forspaciousskies.com U.S. Postal Service Postage Stamps Illustrating Cloud Types http://www.lightwatcher.com/chemtrails/Cloudscapes.html

Meteorology Activities for Grades 5-9 NP-2006-08-97-LaRC 102
Careers in Meteorology Careers in Atmospheric Research and Applied Meteorology http://www.ametsoc.org/pubs/careers.html Careers In Meteorology http://www.theweatherchannelkids.com/weather-ed/careers-in-meteorology National Weather Service Careers http://www.weather.gov/careers.php About Meteorology Career Options http://www.nssl.noaa.gov/faq/faq_careers.php Meteorology Graduate School Programs http://www.gradschools.com/listings/menus/meteorology_menu.html American Meteorological Society Career Center http://www.ametsoc.org/careercenter/index.html Careers In Meteorology http://www.black-collegian.com/career/career-reports/meteorology2006-2nd.shtml Careers In Weather http://www.usatoday.com/weather/resources/askjack/wacareer.htm
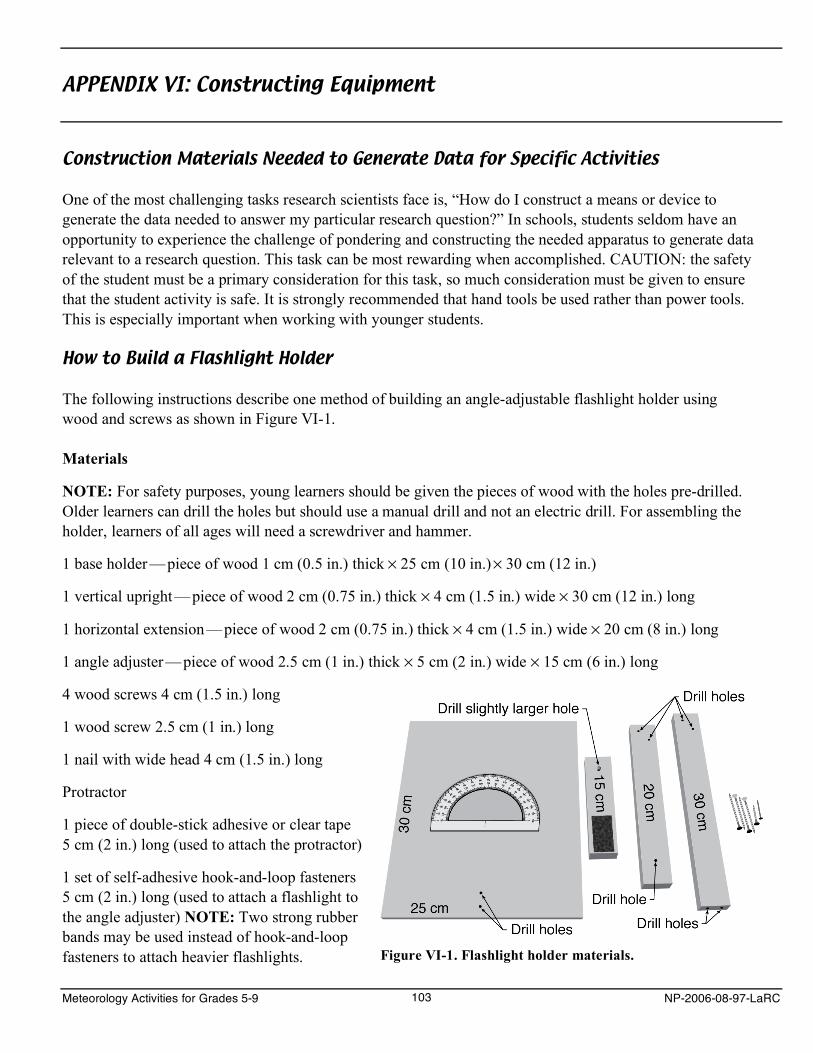
APPENDIX VI: Constructing Equipment
Construction Materials Needed to Generate Data for Specific Activities
One of the most challenging tasks research scientists face is, “How do I construct a means or device to generate the data needed to answer my particular research question?” In schools, students seldom have an opportunity to experience the challenge of pondering and constructing the needed apparatus to generate data relevant to a research question. This task can be most rewarding when accomplished. CAUTION: the safety of the student must be a primary consideration for this task, so much consideration must be given to ensure that the student activity is safe. It is strongly recommended that hand tools be used rather than power tools. This is especially important when working with younger students.
How to Build a Flashlight Holder
The following instructions describe one method of building an angle-adjustable flashlight holder using wood and screws as shown in Figure VI-1.
Materials
NOTE: For safety purposes, young learners should be given the pieces of wood with the holes pre-drilled. Older learners can drill the holes but should use a manual drill and not an electric drill. For assembling the holder, learners of all ages will need a screwdriver and hammer.
1 base holder —piece of wood 1 cm (0.5 in.) thick × 25 cm (10 in.) × 30 cm (12 in.)
1 vertical upright —piece of wood 2 cm (0.75 in.) thick × 4 cm (1.5 in.) wide × 30 cm (12 in.) long
1 horizontal extension —piece of wood 2 cm (0.75 in.) thick × 4 cm (1.5 in.) wide × 20 cm (8 in.) long
1 angle adjuster —piece of wood 2.5 cm (1 in.) thick × 5 cm (2 in.) wide × 15 cm (6 in.) long
4 wood screws 4 cm (1.5 in.) long
1 wood screw 2.5 cm (1 in.) long
1 nail with wide head 4 cm (1.5 in.) long
Protractor
1 piece of double-stick adhesive or clear tape 5 cm (2 in.) long (used to attach the protractor)
1 set of self-adhesive hook-and-loop fasteners 5 cm (2 in.) long (used to attach a flashlight to the angle adjuster) NOTE: Two strong rubber bands may be used instead of hook-and-loop fasteners to attach heavier flashlights. Figure VI-1. Flashlight holder materials.
Meteorology Activities for Grades 5-9 103 NP-2006-08-97-LaRC

Assembling the Holder
On the base, draw a line perpendicular to the edge at the halfway point of the narrower edge. Along that line, mark two points 1.5 cm (0.5 in.) and 3 cm (1.25 in.) from the edge of the board. Drill holes at these two points. The locations of all holes are shown in Figure VI-1.
Drill two holes 1.5 cm (0.75 in.) apart into one end (the bottom) of the vertical upright. At the other end, on the flat side, drill two holes, one 1.5 cm (0.5 in.) and another 3 cm (1 in.) in from both the end and side.
Drill one hole 2 cm (0.75 in.) in from one end and centered along the centerline of the angle adjuster. This hole should be slightly larger that the other holes to allow the angle adjuster to move freely but snugly on the screw. Using the self-adhesive backing, attach one part the hook-and-loop fastener to the other end of the angle adjuster. Attach the other part of the hook-and-loop fastener to a flashlight.
Lay the horizontal extension flat on a table. Place the top end of the vertical upright on top of the horizontal extension, with the vertical upright perpendicular to the horizontal extension and with the corners aligned. Using two of the 4 cm (1.5 in.) screws, screw the vertical upright to the horizontal extension.
At the other end of the horizontal extension, lay the angle adjuster perpendicular to the horizontal extension, placing the end with the hole approximately 3 cm (1.25 in.) from the end of the horizontal extension. Using the 2.5 cm (1 in.) screw, screw the angle adjuster to the horizontal extension. Make sure that the angle adjuster is loose enough to be rotated on the screw.
Using two 4 cm (1.5 in.) screws, attach the vertical upright to the base. The completed flashlight holder is shown in Figure VI-2.
Using double-stick tape, attach the protractor to the vertical angle adjuster with the 0° line lined up with the centerline of the angle adjuster and the point where the 90° line aligns with the 0° line centered over the screw (Figure VI-3). Adjust the vertical angle adjuster so that the 90° mark on the protractor aligns with the centerline of the horizontal extension. Hammer the nail into the horizontal extension so that it touches the protractor at that point.
Attach a flashlight to the vertical angle adjuster.
Figure VI-2. Completed flashlight holder.
Figure VI-3. Completed flashlight holder.
Meteorology Activities for Grades 5-9 104 NP-2006-08-97-LaRC

How to Build a Tornado in a Box (TIB) or Cyclone in a Box (CIB)
A cardboard Tornado In a Box (vortex device) can be constructed using the materials shown in Figure VI-4. Plywood may also be used to construct a TIB/CIB as shown in Chapter 13.
Materials
1 cardboard box 40 cm (16 in.) wide × 40 cm (16 in.) long × 60 cm (24 in.) high (size can vary but sides must be of equal dimensions)
Figure VI-4. TIB/CIB materials.
3 sheets of clear acrylic (or heavy clear plastic) 35 cm (14 in.) × 35 cm (14 in.) × 50 cm (20 in.) (or that fit the size of the cardboard box)
1 metal or cardboard cylinder 7.5 cm (3 in.) in diameter × 30 cm (12 in.) length (such as a metal or cardboard food can with the top and bottom cut out)
Black paint
Masking tape and staples
Metal pan 20 cm (8 in.) in diameter × 5 cm (2 in.) deep (such as a cake pan)
Assembling the TIB/CIB
With the long axis of the box in a vertical position, cut out windows in three sides of the box, leaving about 5 cm (2 in.) of cardboard at each edge. On the fourth side, cut a door, that can be opened and taped shut. Paint the inside of the door and the cardboard that surrounds it black.
Cut a slit from top to bottom 2 cm (0.75 in.) wide and approximately 1.5 cm (0.5 in.) from the right edge of the box on each of the four sides.
Tape or staple the plastic sheets over the windows making certain not to block the vertical slits.
On the top center of the box, cut a hole 7.5 cm (3 in.) in diameter to fit the metal or cardboard Figure VI-5. Completed TIB/CIB.
Meteorology Activities for Grades 5-9 105 NP-2006-08-97-LaRC

cylinder. Position the cylinder over the hole and tape it securely into the hole leaving approximately 25 cm (10 in.) of length extending above the top of the box to form a chimney.
After the box is constructed, place the 8-inch pan on the floor of the box so that heated water can be poured into it.
The completed TIB/CIB is shown in Figure VI-5.
Meteorology Activities for Grades 5-9 106 NP-2006-08-97-LaRC

APPENDIX VII: Additional Activities
The following activities have been included for use by the teacher in further facilitating interest in the study of meteorology. These activities can be used without modification, modified by learner or teacher or in other ways as best determined by the teacher for best meeting the needs of the learner.
Most of these activities fall within the confirmation-verification and structured-inquiry categories. Since the learner has come to understand the different levels of inquiry, one challenge could be to have them modify the activities to make them more challenging by adding the necessary directions to make them guided and/or open-inquiry types.
NOTE: Some of these activities are modified and credit-cited and others have been used unmodified and credit-cited.
Meteorology Activities for Grades 5-9 107 NP-2006-08-97-LaRC

Meteorology Activities for Grades 5-9 108 NP-2006-08-97-LaRC

Cloud Wheel
Dennis Cain, NOAA Weather Service, NWS Southern Region HQ, Fort Worth, Texas.
Meteorology Activities for Grades 5-9 109 NP-2006-08-97-LaRC

Meteorology Activities for Grades 5-9 110 NP-2006-08-97-LaRC
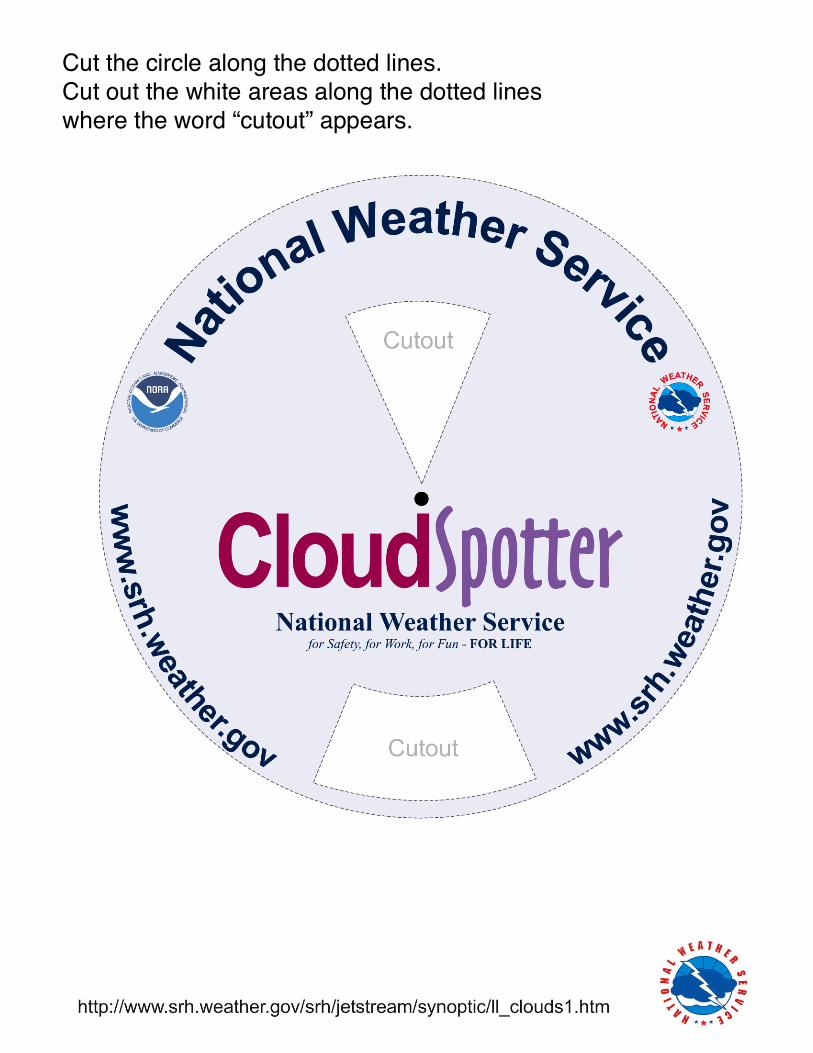
Cut the circle along the dotted lines.Cut out the white areas along the dotted lineswhere the word “cutout” appears.

Meteorology Activities for Grades 5-9 NP-2006-08-97-LaRC 112

Cut the circle along the dotted lines.Poke a hole in the center of both circles, push a paper fastener through the holes and bend the ends of the fastener.

Meteorology Activities for Grades 5-9 114 NP-2006-08-97-LaRC

The Mysterious Snake
Decorate the spiral snake found below. Cut out the circle, and then carefully cut along the spiral line. Poke a small hole in the center of the snake’s head and tie a piece of thread through it. Hang the snake over a lamp that is turned off. Observe what happens. Next turn on the lamp and observe what happens.
What do you observe happening?
The snake hung over the lamp that is not turned on probably stayed motionless. When the lamp is turned on, the snake will probably spin.
Can you explain why this happened?
When the lamp was turned on, it heated the air above it. The hot air, being less dense, rose. This rising air rushed against and flowed over the underside of the snake causing it to spin.
Meteorology Activities for Grades 5-9 115 NP-2006-08-97-LaRC

Meteorology Activities for Grades 5-9 116 NP-2006-08-97-LaRC

How Often Should I Measure the Weather? For Middle School Students John Pickle Science Education Consultant [email protected] March 6, 2006
Goal: Explore how trends observed in weather data changes with several sampling rates and strategies.
Activity: Calculate and compare differences in daily weather statistics when using different sampling rates of the same data
Math Topics: Statistics to Describe Patterns in Temperature, Moisture and Pressure - Interpretation of tables and graphs - Average over day, maximum, minimum, and range
Introduction Many of today’s weather instruments can be run automatically by a computer. Data can be measured and saved at very short time intervals and at any time of day. But what happens when you don’t have fancy electronic weather instruments? Will you still be able to have useful weather records if you don’t measure every 5 minutes?
What is the least number of measurements needed to have accurate details of the weather? If you or a friend have an automated weather station, think of an experiment you can do to measure how often you should measure.
Here is one experiment you could do.
Experiment For a complete day, 24 hours, measure the temperature, dewpoint temperature, relative humidity, and air pressure as often as your instruments can accomplish. In this case, the weather station could make measurements every 15 minutes.
Question: If measurements were made every 15 minutes for a complete day, how many measurements will be made?
Procedure: Using a copy of the complete set data, eliminate every other measurement so you have one measurement every 30 minutes. Make a copy of this new data and eliminate every other measurement, resulting in one measurement per hour. Repeat this so you have data sets ranging from 96 to 3 measurements per day. The amount of time between a series of measurements should be the same throughout the day.
Question: By halving the number of observations for each data set, how many data sets will you have if you start with 96 measurements per day in the first data set and the final data set has 3 measurements per day.
Meteorology Activities for Grades 5-9 117 NP-2006-08-97-LaRC
Question: In order to have 3 equally spaced measurements throughout the day, how much time must occur between each measurement?
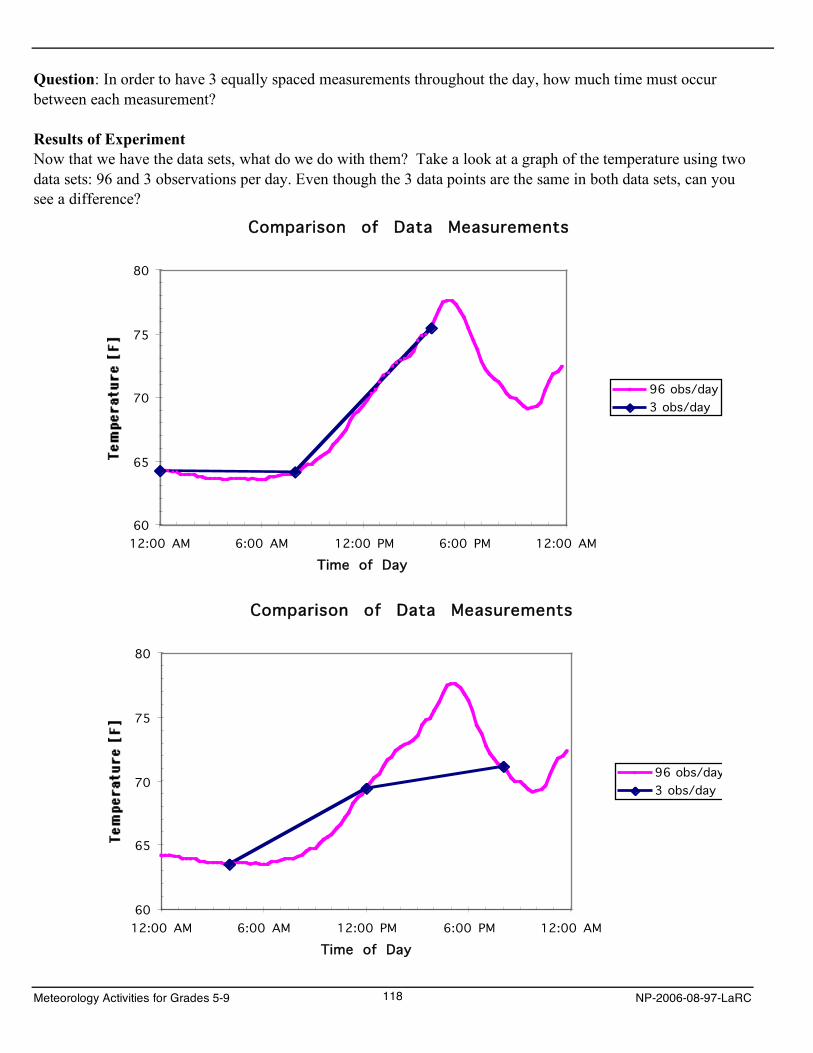
Results of Experiment Now that we have the data sets, what do we do with them? Take a look at a graph of the temperature using two data sets: 96 and 3 observations per day. Even though the 3 data points are the same in both data sets, can you see a difference?
Comparison of Data Measurements
60
65
70
75
80
12:00 AM 6:00 AM 12:00 PM 6:00 PM 12:00 AM
Time of Day
96 obs/day
3 obs/day
Comparison of Data Measurements
60
65
70
75
80
12:00 AM 6:00 AM 12:00 PM 6:00 PM 12:00 AM
Time of Day
96 obs/day
3 obs/day
Meteorology Activities for Grades 5-9 118 NP-2006-08-97-LaRC

Question: Even though the 3 observations per day have 8 hours between observations, is there another way to distribute the data so it is spread more equally throughout the day starting and ending at midnight?
The next challenge is to numerically describe each set of data with one number to find out how different they are from each other. What would you use? There is no difference between data points where data exists for both data sets being compared. Rather, the differences occur where one data set has data and the other doesn’t. What single number describes a characteristic of a data set?
First attempt, try comparing daily averages of values for the different data sets. The following table is a comparison of the average values for temperature, dew point temperature, relative humidity, and air pressure for the 6 data sets. “Obs” means observation or measurement of the weather conditions at a particular time.
Time Number of Temperature Dew-Point RH Pressure Spacing of Obs Obs Per Day Average Average Average Average
15 min 96 68.6 66.6 93.6 1017.2 30 min 48 68.5 66.5 93.5 1017.2 1 hour 24 68.5 66.4 93.5 1017.3 2 hour 12 68.3 66.2 93.3 1017.4 4 hour 6 67.3 65.6 94.6 1018.0 8 hour 3 67.9 66.0 94.0 1017.9
Question: What is the range of average values of the 4 variables for the 6 data sets? Hint: The range is the maximum value minus the minimum observed value.
The range of average values for the 4 variables is not very much. The average values tend to differ more from the rest of the averages when there are fewer measurements. But is it worth making the extra measurements for an average value that differs by one degree in temperature, one percent relative humidity, or one millibar of pressure?
Try another number that describes a series of numbers to see if this is affected by the spacing of measurements over time. Examine the observed range in values for the different data sets. Do the ranges differ more than the averages when there are fewer points?
Time Spacing Number of Temperature Dew-Point RH Pressure [hour] Obs Per Day Range Range Range Range 0.25 96 14.1 8.8 21.0 4.0 0.5 48 14.1 8.4 21.0 3.9 1 24 14.1 7.7 20.0 3.9 2 12 12.8 7.1 20.0 3.8 4 6 12.0 7.1 15.0 2.9 8 3 11.4 6.5 15.0 2.9
Meteorology Activities for Grades 5-9 119 NP-2006-08-97-LaRC

Question: What is the range of these values for the 6 data sets? Is this a larger difference than observed for the average values?
Activity: Plot the range of temperature, dew point temperature, relative humidity, or pressure to examine what happens when fewer measurements are made over time. Describe any observed trends.
Why do relative humidity and temperature have a larger daily range than dew point and pressure? Both temperature and relative humidity are most effected by the heating of the sun; dew point and pressure do not change much during the day because they vary more with the character of air masses (large pools of air that move across the globe slowly changing properties).
Activity: But are these values very large? Compare the ranges to those of the largest observed range by calculating the percent range of the values:
Percent Range = 100* (Range / Maximum Range)
Activity: Study the graphs and tables you have generated, and decide what is an adequate rate of sampling the weather.
Meteorology Activities for Grades 5-9 120 NP-2006-08-97-LaRC

APPENDIX VIII: Beaufort Scale of Wind Speed
Beaufort Number
WMO* Description
Effects Observed On Land Wind Speed, mph (km/hr)
0 Calm Smoke rises <1 mph (<1 km/hr)
1 Light Air Smoke drifts 1-3 mph (1-5 km/hr)
2 Slight Breeze Leaves rustle; wind vanes move 4-7 mph (6-11 km/hr)
3 Gentle Breeze Leaves and twigs move 8-12 mph (12-19 km/hr)
4 Moderate Breeze Branches move; flags flap 13-18 mph (20-28 km/hr)
5 Fresh Breeze Small trees sway; white caps on water 19-24 mph (29-38 km/hr)
6 Strong Breeze Large branches move; flags beat 25-31 mph (39-49 km/hr)
7 Moderate Gale Whole trees move; flags extend 32-38 mph (50-61 km/hr)
8 Fresh Gale Twigs break; walking is difficult 39-46 mph (62-74 km/hr)
9 Strong Gale Signs, antennae blow down 47-54 mph (75-88 km/hr)
10 Whole Gale Trees uproot 55-63 mph (89-102 km/hr)
11 Storm Much general damage 64-75 mph (103-117 km/hr)
12 Hurricane Widespread destruction >75 mph (>117 km/hr)
*World Meteorological Organization
Beaufort Wind Scale Mobile Aeronautics Education Laboratory Weather Workstation
The Beaufort Scale or Beaufort Wind Force Scale is a system for estimating wind strengths without the use of instruments, based on the effects wind has on the physical environment. The behavior of smoke, waves, trees, etc., is rated on a 13 point scale of 0 (calm) to 12 (hurricane). The scale was devised in 1805 by the British naval commander, later admiral, Sir Francis Beaufort (1774-1875). A further set of numbers (13-17) for very strong winds was added by the US Weather Bureau in 1955. The Beaufort Scale, as originally drawn up, made no reference to the speed of the wind and various attempts have been made to correlate the two.
The scale is not often used today as more direct methods are used by meteorologists to measure wind speed. However, it is still useful in estimating wind speeds, especially when anemometers are not available.
Meteorology Activities for Grades 5-9 121 NP-2006-08-97-LaRC

Beaufort number 0 – Calm Wind speeds: less than 1 knot (<1 mph; <1 kph; <0.3 mps) At sea: Sea like a mirror, calm
Sea disturbance number: 0 Probable wave height: flat (0 ft; 0 m)
On land: Smoke rises vertically Notes: Boring, boring, boring...
Beaufort number 1 – Light Air Wind speeds: 1-3 knots (1-3 mph; 1-5 kph; 0.3-1.5 mps) At sea: Ripples with the appearance of scales are formed but without foam crests
Sea disturbance number: 0 Probable wave height: 5-10 cm (2-4 in) (0 ft; 0 m)
On land: Direction of wind shown by smoke drift, but not by vanesNotes: Yachts just have steerage way
Beaufort number 2 – Light Breeze Wind speeds: 4-6 knots (4-7 mph; 6-11 kph; 1.6-3.3 mps) At sea: Small wavelets, still short but more pronounced;
crests have a glassy appearance and do not break Sea disturbance number: 1Probable wave height: 10-15 cm (4-6 in); (0-1 ft; 0-0.3 m)
On land: Wind felt on face; leaves rustle; ordinary vane moved by wind Notes: Wind fills sails of yacht, which then may move at 1-2 knots
Beaufort number 3 – Gentle BreezeWind speeds: 7-10 knots (8-12 mph; 12-19 kph; 3.4-5.4 mps)
At sea: Large wavelets; crests begin to break; foam of glassy appearance; perhaps scattered white horses Sea disturbance number: 2 Probable wave height: 60 cm (2 ft); (1-2 ft; 0.3-0.6 m)
On land: Leaves and small twigs in constant motion; wind extends light flagNotes: Yachts start to careen and travel at 3-4 knots
Beaufort number 4 – Moderate Breeze Wind speeds: 11-16 knots (13-18 mph; 20-28 kph; 5.5-7.9 mps) At sea: Small waves, becoming longer; fairly frequent white crests
Sea disturbance number: 3 Probable wave height: 1 m (3.5 ft); (2-4 ft; 0.6-1.2 m)
On land: Raises dust and loose paper; small branches are moved Notes: Good working breeze for yachts; carry all sail with good list
Meteorology Activities for Grades 5-9 122 NP-2006-08-97-LaRC

Beaufort number 5 – Fresh Breeze Wind speeds: 17-21 knots (19-24 mph; 29-38 kph; 8.0-10.7 mps) At sea: Moderate waves taking a more pronounced long form;
many white caps are formed; chance of some spray Sea disturbance number: 4Probable wave height: 2 m (6-7 ft); (4-8 ft; 1.2-2.4 m)
On land: Small trees in leaf begin to sway; crested wavelets form on inland watersNotes: Yachts shorten sail
Beaufort number 6 – Strong Breeze Wind speeds: 22-27 knots (25-31 mph; 39-49 kph; 10.8-13.8 mps) At sea: Large waves begin to form; the white foam crests are more extensive everywhere;
probably some spray Sea disturbance number: 5Probable wave height: 3 m (9-10 ft); (8-13 ft; 2.4-4 m)
On land: Large branches in motion; whistling heard in telegraph wires; umbrellas used with difficulty Notes: Yachts with double reef in mainsail; care required when fishing
Beaufort number 7 – Near Gale / Moderate GaleWind speeds: 28-33 knots (32-38 mph; 50-61 kph; 13.9-17.1 mps)
At sea: Sea heaps up and white foam from the breaking waves begins to be blown in streaksalong the direction of the wind Sea disturbance number: 6Probable wave height: 4 m (13-14 ft); (13-20 ft; 4-6 m)
On land: Whole trees in motion; inconvenience felt when walking against windNotes: Yachts remain in harbor, those at sea “lie to”
Beaufort number 8 – Gale / Fresh GaleWind speeds: 34-40 knots (39-46 mph; 62-74 kph; 17.2-20.7 mps)
At sea: Moderately high waves of greater length; edges crests begin to break into spindrift;the foam is blown in well-marked streaks along the direction of the windSea disturbance number: 6Probable wave height: 5.5 m (18 ft); (13-20 ft; 4-6 m)
On land: Breaks twigs off trees; generally impedes progressNotes: All yachts make for harbor if possible
Beaufort number 9 – Strong Gale Wind speeds: 41-47 knots (47-54 mph; 75-88 kph; 20.8-24.4 mps) At sea: High waves; dense streaks of foam along the direction of wind;
crests of waves begin to topple, tumble and roll over; spray may affect visibility Sea disturbance number: 6 Probable wave height: 7 m (23 ft); (13-20 ft; 4-6 m)
On land: Slight structural damage occurs (chimney post and slates removed)
Meteorology Activities for Grades 5-9 123 NP-2006-08-97-LaRC
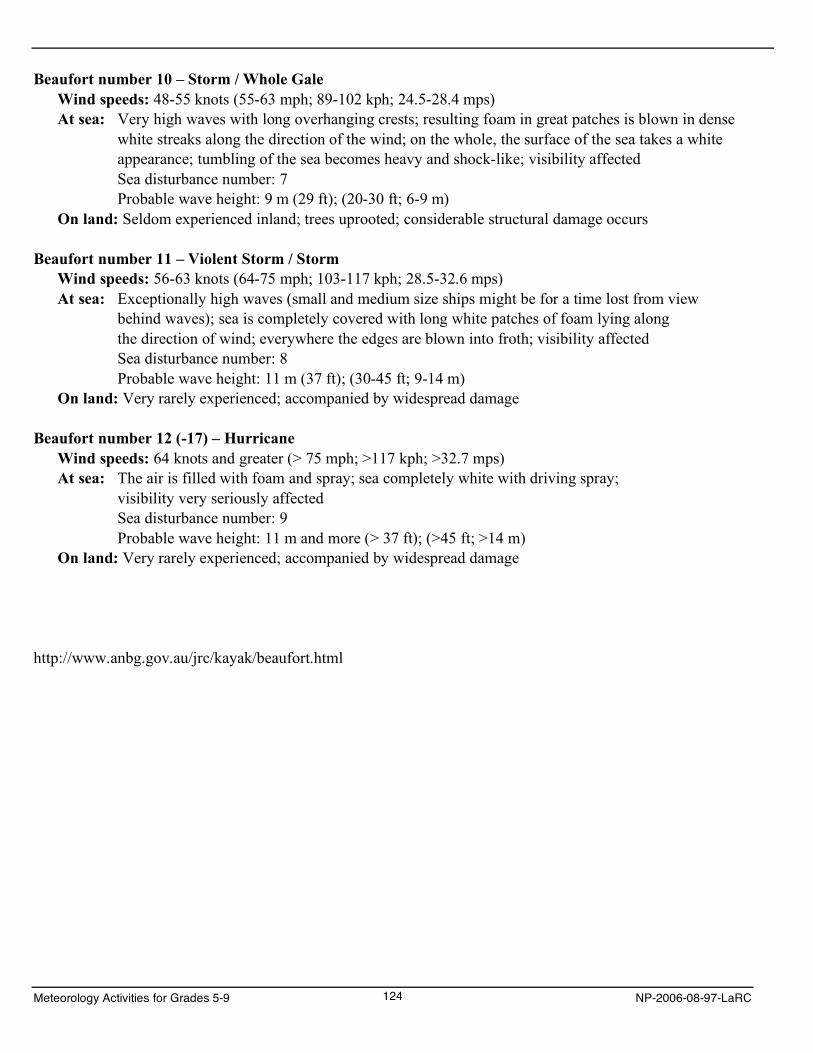
Beaufort number 10 – Storm / Whole Gale Wind speeds: 48-55 knots (55-63 mph; 89-102 kph; 24.5-28.4 mps) At sea: Very high waves with long overhanging crests; resulting foam in great patches is blown in dense
white streaks along the direction of the wind; on the whole, the surface of the sea takes a white appearance; tumbling of the sea becomes heavy and shock-like; visibility affected Sea disturbance number: 7 Probable wave height: 9 m (29 ft); (20-30 ft; 6-9 m)
On land: Seldom experienced inland; trees uprooted; considerable structural damage occurs
Beaufort number 11 – Violent Storm / Storm Wind speeds: 56-63 knots (64-75 mph; 103-117 kph; 28.5-32.6 mps) At sea: Exceptionally high waves (small and medium size ships might be for a time lost from view
behind waves); sea is completely covered with long white patches of foam lying along the direction of wind; everywhere the edges are blown into froth; visibility affected Sea disturbance number: 8 Probable wave height: 11 m (37 ft); (30-45 ft; 9-14 m)
On land: Very rarely experienced; accompanied by widespread damage
Beaufort number 12 (-17) – Hurricane Wind speeds: 64 knots and greater (> 75 mph; >117 kph; >32.7 mps) At sea: The air is filled with foam and spray; sea completely white with driving spray;
visibility very seriously affected Sea disturbance number: 9 Probable wave height: 11 m and more (> 37 ft); (>45 ft; >14 m)
On land: Very rarely experienced; accompanied by widespread damage
http://www.anbg.gov.au/jrc/kayak/beaufort.html
Meteorology Activities for Grades 5-9 124 NP-2006-08-97-LaRC
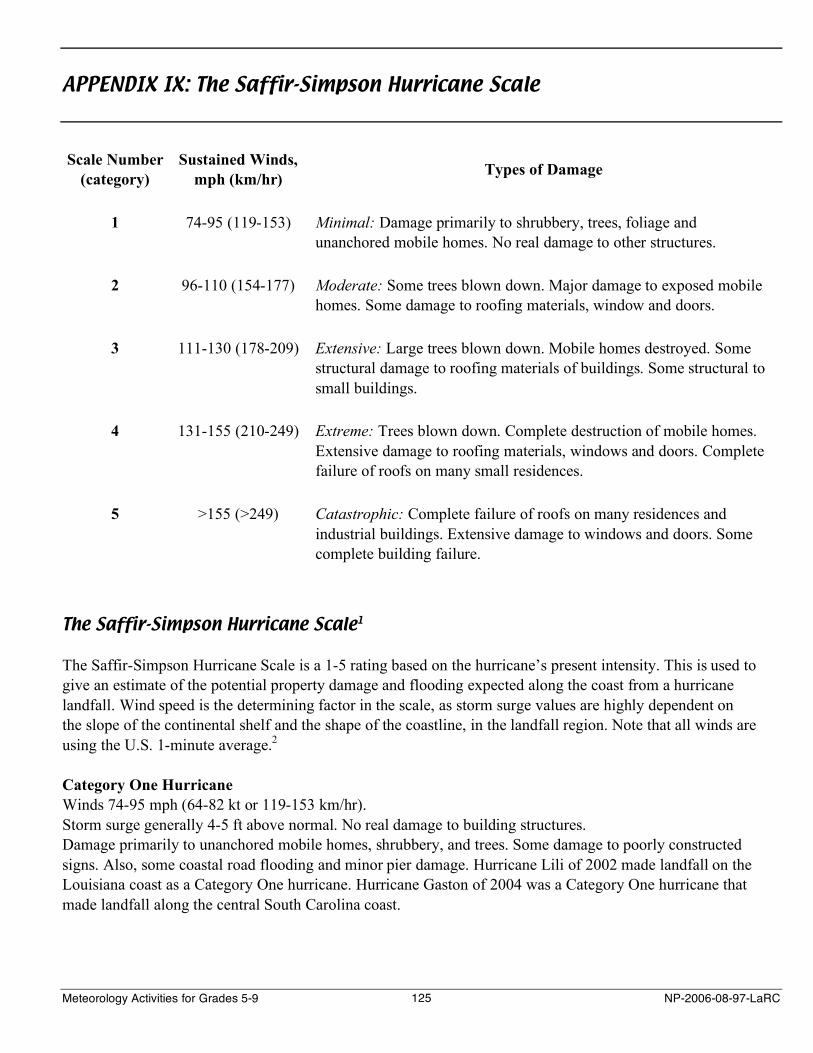
APPENDIX IX: The Saffir-Simpson Hurricane Scale
Scale Number (category)
Sustained Winds, mph (km/hr) Types of Damage
1 74-95 (119-153) Minimal: Damage primarily to shrubbery, trees, foliage and unanchored mobile homes. No real damage to other structures.
2 96-110 (154-177) Moderate: Some trees blown down. Major damage to exposed mobile homes. Some damage to roofing materials, window and doors.
3 111-130 (178-209) Extensive: Large trees blown down. Mobile homes destroyed. Some structural damage to roofing materials of buildings. Some structural to
small buildings.
4 131-155 (210-249) Extreme: Trees blown down. Complete destruction of mobile homes. Extensive damage to roofing materials, windows and doors. Complete
failure of roofs on many small residences.
5 >155 (>249) Catastrophic: Complete failure of roofs on many residences and industrial buildings. Extensive damage to windows and doors. Some complete building failure.
The Saffir-Simpson Hurricane Scale1
The Saffir-Simpson Hurricane Scale is a 1-5 rating based on the hurricane’s present intensity. This is used to give an estimate of the potential property damage and flooding expected along the coast from a hurricane landfall. Wind speed is the determining factor in the scale, as storm surge values are highly dependent on the slope of the continental shelf and the shape of the coastline, in the landfall region. Note that all winds are using the U.S. 1-minute average.2
Category One Hurricane Winds 74-95 mph (64-82 kt or 119-153 km/hr). Storm surge generally 4-5 ft above normal. No real damage to building structures. Damage primarily to unanchored mobile homes, shrubbery, and trees. Some damage to poorly constructed signs. Also, some coastal road flooding and minor pier damage. Hurricane Lili of 2002 made landfall on the Louisiana coast as a Category One hurricane. Hurricane Gaston of 2004 was a Category One hurricane that made landfall along the central South Carolina coast.
Meteorology Activities for Grades 5-9 125 NP-2006-08-97-LaRC
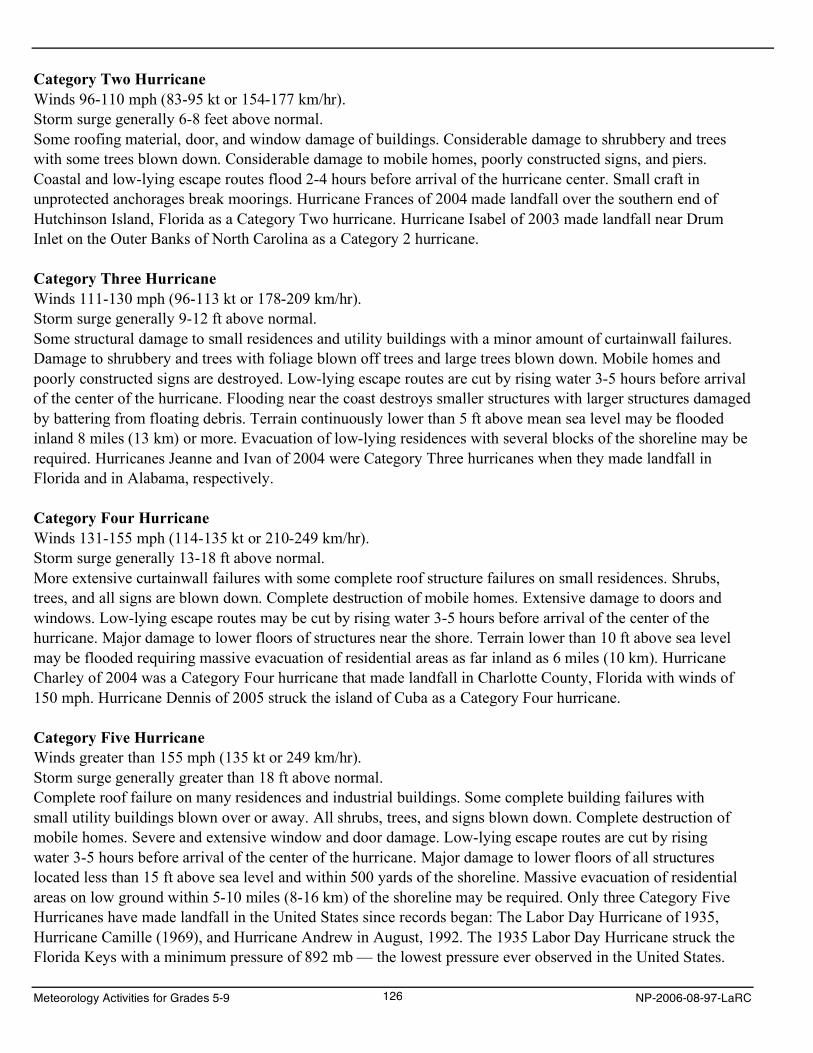
Category Two Hurricane Winds 96-110 mph (83-95 kt or 154-177 km/hr).Storm surge generally 6-8 feet above normal.Some roofing material, door, and window damage of buildings. Considerable damage to shrubbery and treeswith some trees blown down. Considerable damage to mobile homes, poorly constructed signs, and piers.Coastal and low-lying escape routes flood 2-4 hours before arrival of the hurricane center. Small craft in unprotected anchorages break moorings. Hurricane Frances of 2004 made landfall over the southern end ofHutchinson Island, Florida as a Category Two hurricane. Hurricane Isabel of 2003 made landfall near DrumInlet on the Outer Banks of North Carolina as a Category 2 hurricane.
Category Three Hurricane Winds 111-130 mph (96-113 kt or 178-209 km/hr). Storm surge generally 9-12 ft above normal. Some structural damage to small residences and utility buildings with a minor amount of curtainwall failures. Damage to shrubbery and trees with foliage blown off trees and large trees blown down. Mobile homes and poorly constructed signs are destroyed. Low-lying escape routes are cut by rising water 3-5 hours before arrival of the center of the hurricane. Flooding near the coast destroys smaller structures with larger structures damaged by battering from floating debris. Terrain continuously lower than 5 ft above mean sea level may be flooded inland 8 miles (13 km) or more. Evacuation of low-lying residences with several blocks of the shoreline may be required. Hurricanes Jeanne and Ivan of 2004 were Category Three hurricanes when they made landfall in Florida and in Alabama, respectively.
Category Four Hurricane Winds 131-155 mph (114-135 kt or 210-249 km/hr). Storm surge generally 13-18 ft above normal. More extensive curtainwall failures with some complete roof structure failures on small residences. Shrubs, trees, and all signs are blown down. Complete destruction of mobile homes. Extensive damage to doors and windows. Low-lying escape routes may be cut by rising water 3-5 hours before arrival of the center of the hurricane. Major damage to lower floors of structures near the shore. Terrain lower than 10 ft above sea level may be flooded requiring massive evacuation of residential areas as far inland as 6 miles (10 km). Hurricane Charley of 2004 was a Category Four hurricane that made landfall in Charlotte County, Florida with winds of 150 mph. Hurricane Dennis of 2005 struck the island of Cuba as a Category Four hurricane.
Category Five Hurricane Winds greater than 155 mph (135 kt or 249 km/hr). Storm surge generally greater than 18 ft above normal. Complete roof failure on many residences and industrial buildings. Some complete building failures with small utility buildings blown over or away. All shrubs, trees, and signs blown down. Complete destruction of mobile homes. Severe and extensive window and door damage. Low-lying escape routes are cut by rising water 3-5 hours before arrival of the center of the hurricane. Major damage to lower floors of all structures located less than 15 ft above sea level and within 500 yards of the shoreline. Massive evacuation of residential areas on low ground within 5-10 miles (8-16 km) of the shoreline may be required. Only three Category Five Hurricanes have made landfall in the United States since records began: The Labor Day Hurricane of 1935, Hurricane Camille (1969), and Hurricane Andrew in August, 1992. The 1935 Labor Day Hurricane struck the Florida Keys with a minimum pressure of 892 mb — the lowest pressure ever observed in the United States.
Meteorology Activities for Grades 5-9 126 NP-2006-08-97-LaRC

Hurricane Camille struck the Mississippi Gulf Coast causing a 25-foot storm surge, which inundated Pass Christian. Hurricane Andrew of 1992 made landfall over southern Miami-Dade County, Florida causing 26.5 billion dollars in losses—at that time, the costliest hurricane on record. In addition, Hurricane Wilma of 2005 was a Category Five hurricane at peak intensity and is the strongest Atlantic tropical cyclone on record with a minimum pressure of 882 mb.
Hurricane Katrina was the costliest and one of the deadliest hurricanes in the history of the United States. It was the sixth-strongest Atlantic hurricane ever recorded and the third-strongest hurricane on record that made landfall in the United States. Katrina formed on August 23 during the 2005 Atlantic hurricane season and caused devastation along much of the north-central Gulf Coast of the United States. The most severe loss of life and property damage occurred in New Orleans, which flooded as the levee system failed catastrophically, in many cases hours after the storm had moved inland. The hurricane caused severe destruction across the entire Mississippi coast and into Alabama, as far as 100 miles (160 km) from the storm's center. Katrina was the eleventh tropical storm, fifth hurricane, third major hurricane, and second Category 5 hurricane of the 2005 Atlantic season.3
Hurricane Rita was the fourth-most intense Atlantic hurricane ever recorded and the most intense tropical cyclone ever observed in the Gulf of Mexico. Rita caused $11.3 billion in damage on the U.S. Gulf Coast in September 2005.[1] Rita was the seventeenth named storm, tenth hurricane, fifth major hurricane, and third Category 5 hurricane of the 2005 Atlantic hurricane season.3
The National Hurricane Center will create three and five day forecast cones for tropical systems.1
This graphic shows a 3-day forecast cone for Hurricane Katrina issued by the National Hurricane Center on August 27, 2005 at 10 p.m. CDT. This display shows an approxi-mate representation of coastal areas under a hurri-cane warning (red), hurricane watch (pink) and tropical storm warning (blue). The orange circle indicates the current position of the center of Hurricane Katrina. The black line and dots show the National Hurricane Center (NHC) forecast track of the center at the times indicated. The letter inside the dot indicates the
Meteorology Activities for Grades 5-9 127 NP-2006-08-97-LaRC

____________________________
NHC’s forecast intensity for that time. It should be noted not to focus on the skinny black line in the center of the cone and assume that it represents the exact track of the hurricane. Because of a margin of forecast error, the hurricane could be anywhere within the forecast cone within the time periods noted.
NHC forecast tracks of the center can be in error; the average track forecast errors in recent years were used to construct the areas of uncertainty for the 3 days (solid white area). There is also uncertainty in the NHC intensity forecasts.
It is also important to realize that a tropical cyclone is not a point. Their effects can span many hundreds of miles from the center. The area experiencing hurricane force (one-minute average wind speeds of at least 74 mph) and tropical storm force (one-minute average wind speeds of 39-73 mph) winds can extend well beyond the white areas shown enclosing the most likely track area of the center.
1Erik Salna Project Coordinator Meteorologist, AMS, NWA Disaster Survival House and Hurricane Warning! 1345 FAU Research Park Boulevard Deerfield Beach, Florida 33441 [email protected] http://www.hurricanewarning.org
2NOAA/ National Weather Service National Centers for Environmental Prediction National Hurricane Center Tropical Prediction Center 11691 SW 17th Street Miami, Florida, 33165-2149 USA http://www.nhc.noaa.gov
3Wikipedia http://www.wikipedia.org
Meteorology Activities for Grades 5-9 128 NP-2006-08-97-LaRC

APPENDIX X: The Fujita Scale for Tornado Damage
Fujita Tornado Damage Scale
Developed in 1971 by T. Theodore Fujita of the University of Chicago.
Scale Wind Estimate,* mph (km/hr) Typical Damage
F0 < 73 (117) Light damage. Some damage to chimneys; branches broken off trees; shallow-rooted trees pushed over; sign boards damaged.
F1 73-112 (117-180) Moderate damage. Peels surface off roofs; mobile homes pushed offfoundations or overturned; moving autos blown off roads.
F2 113-157 (181-253) Considerable damage. Roofs torn off frame houses; mobile homesdemolished; boxcars overturned; large trees snapped or uprooted; light-object missiles generated; cars lifted off ground.
F3 158-206 (254-332) Severe damage. Roofs and some walls torn off well-constructed houses;trains overturned; most trees in forest uprooted; heavy cars lifted off theground and thrown.
F4 207-260 (333-418) Devastating damage. Well-constructed houses leveled; structures with weakfoundations blown away some distance; cars thrown and large missilesgenerated.
F5 261-318 (419-512) Incredible damage. Strong frame houses leveled off foundations and swept away; automobile-sized missiles fly through the air in excess of 100 meters(109 yds); trees debarked; incredible phenomena will occur.
*IMPORTANT NOTE ABOUT F-SCALE WINDS: Do not use F-scale winds literally. These precise wind speed numbers are actually guesses and have never been scientifically verified. Different wind speeds may cause similar-looking damage from place to place — even from building to building. Without a thorough engineering analysis of tornado damage in any event, the actual wind speeds needed to cause that damage are unknown.
Enhanced Fujita Scale (EF) for Tornado Damage
An update to the original Fujita Scale by a team of meteorologists and wind engineers, was implemented in the U.S. on February 1, 2007. The Enhanced F-scale still is a set of wind estimates (not measurements) based on
Meteorology Activities for Grades 5-9 129 NP-2006-08-97-LaRC

damage. It uses three-second gusts estimated at the point of damage based on a judgment of 8 levels of damage to 28 indicators. These estimates vary with height and exposure. Important: The 3-second gust is not the same wind as in standard surface observations. Standard measurements are taken by weather stations in open exposures, using a directly measured, “one minute mile” speed.
EF Number
Wind Speed, 3 Second Gust, mph (km/hr)
Potential damage
0 65-85 (105–137) Light damage. Peels surface off some roofs; some damage to gutters or siding; branches broken off trees; shallow-rooted trees pushed over. Confirmed tornadoes with no reported damage (i.e. those that remain in open fields) are always rated EF0.
1 86-110 (138–178) Moderate damage. Roofs severely stripped; mobile homes overturned or badly damaged; loss of exterior doors; windows and other glass broken.
2 111-135 (179–218) Considerable damage. Roofs torn off well-constructed houses; foundations of frame homes shifted; mobile homes completely destroyed; large trees snapped or uprooted; light-object missiles generated; cars lifted off ground.
3 136-165 (219-266) Severe damage. Entire stories of well-constructed houses destroyed; severe damage to large buildings such as shopping malls; trains overturned; trees debarked; heavy cars lifted off the ground and thrown; structures with weak foundations blown away some distance.
4 166-200 (267–322) Devastating damage. Well-constructed houses and whole frame houses completely leveled; cars thrown and small missiles generated.
5 Over 322 Total destruction. Strong frame houses leveled off foundations and swept away; automobile-sized missiles fly through the air in excess of 109 yd (100 m); steel reinforced concrete structure badly damaged; high-rise buildings have significant structural deformation; incredible phenomena will occur. A recent one occurred in Parkersburg, Iowa on May 25, 2008 and leveled half the city.
http://www.spc.noaa.gov/faq/tornado/ NOAA/National Weather Service National Centers for Environmental Prediction Storm Prediction Center 120 David L. Boren Blvd. Norman, OK 73072 U.S.A.
Meteorology Activities for Grades 5-9 130 NP-2006-08-97-LaRC

APPENDIX XI: Bookmarks
http://asd-www.larc.nasa.gov/new_AtSC/outreach.htmlPlease feel free to download, print and enjoy these beautiful and educational resources.
• Clouds Bookmark (2MB, pdf)
• Firesat Bookmark (2MB, pdf)
• GTE Bookmark (5MB, pdf)
• Ozone Bookmark (2MB, pdf)
• Volcano Bookmark (2MB, pdf)
Meteorology Activities for Grades 5-9 131 NP-2006-08-97-LaRC

Meteorology Activities for Grades 5-9 132 NP-2006-08-97-LaRC