Appendice DR1 analytical methods Rezeau FINAL · 2016-07-08 · 4 55 complete analytical procedure...
14
1 GSA Data Repository 2016203 Temporal and genetic link between incremental pluton assembly and pulsed porphyry Cu-Mo formation in accretionary orogens Rezeau et al. Analytical methods 1 Major elements whole-rock geochemistry 2 The thirty igneous rock samples from the Meghri–Ordubad pluton selected for dating were analysed for 3 whole rock geochemistry. The samples were crushed using a steel jaw crusher and subsequently a 4 hydraulic press and finally powdered to <70 μm using a mortar agate mill. Major elements were 5 analysed on fused lithium tetraborate (Li 2 B 4 O 7 ) glass beads by X-ray fluorescence (XRF) using a 6 Philips PW 2400 spectrometer at the University of Lausanne, Switzerland. The 2σ uncertainties are 7 <1%, except for MgO and K 2 O <3%, based on repeated measurements of the BHVO-1, NIM-N and 8 NIM-G standards. 9 10 In situ U-Pb zircon dating by LA-ICP-MS 11 The thirty igneous rock samples selected for dating were initially crushed, milled to <0.3 mm and 12 processed using a gravity separation Wilfley table, a Frantz magnetic separator and a density separation 13 in diiodomethane liquid at 3,32 g.mL -1 . Zircon grains were handpicked under a binocular microscope, 14 and subsequently mounted in epoxy and polished. Zircon grains textures were revealed by 15 cathodoluminescence images using a scanning electron microscope JEOL JSM7001F and CamScan 16 MV2300 at the Institute of Earth Sciences of the University of Geneva and Lausanne, respectively. 17 In-situ U-Pb dating of zircon by laser ablation inductively coupled plasma mass spectrometry (LA-ICP- 18 MS) was carried out using an UP-193FX excimer laser ablation system interfaced to an ELEMENT XR 19 sector field, single-collector ICP mass spectrometer at the Institute of Earth Sciences of the University 20 of Lausanne. The operating conditions of the ablation system included a spot size of 35 m, a repetition 21 rate of 5 Hz, and an on-sample energy density of ~3 J/cm 2 per pulse. The measurement protocol and 22
Transcript of Appendice DR1 analytical methods Rezeau FINAL · 2016-07-08 · 4 55 complete analytical procedure...

1
GSA Data Repository 2016203
Temporal and genetic link between incremental pluton assembly and pulsed porphyry Cu-Mo formation in accretionary orogens
Rezeau et al.
Analytical methods 1
Major elements whole-rock geochemistry 2
The thirty igneous rock samples from the Meghri–Ordubad pluton selected for dating were analysed for 3
whole rock geochemistry. The samples were crushed using a steel jaw crusher and subsequently a 4
hydraulic press and finally powdered to <70 μm using a mortar agate mill. Major elements were 5
analysed on fused lithium tetraborate (Li2B4O7) glass beads by X-ray fluorescence (XRF) using a 6
Philips PW 2400 spectrometer at the University of Lausanne, Switzerland. The 2σ uncertainties are 7
<1%, except for MgO and K2O <3%, based on repeated measurements of the BHVO-1, NIM-N and 8
NIM-G standards. 9
10
In situ U-Pb zircon dating by LA-ICP-MS 11
The thirty igneous rock samples selected for dating were initially crushed, milled to <0.3 mm and 12
processed using a gravity separation Wilfley table, a Frantz magnetic separator and a density separation 13
in diiodomethane liquid at 3,32 g.mL-1. Zircon grains were handpicked under a binocular microscope, 14
and subsequently mounted in epoxy and polished. Zircon grains textures were revealed by 15
cathodoluminescence images using a scanning electron microscope JEOL JSM7001F and CamScan 16
MV2300 at the Institute of Earth Sciences of the University of Geneva and Lausanne, respectively. 17
In-situ U-Pb dating of zircon by laser ablation inductively coupled plasma mass spectrometry (LA-ICP-18
MS) was carried out using an UP-193FX excimer laser ablation system interfaced to an ELEMENT XR 19
sector field, single-collector ICP mass spectrometer at the Institute of Earth Sciences of the University 20
of Lausanne. The operating conditions of the ablation system included a spot size of 35 m, a repetition 21
rate of 5 Hz, and an on-sample energy density of ~3 J/cm2 per pulse. The measurement protocol and 22

2
details related to the mass spectrometer optimisation are outlined in Ulianov et al. (2012). A GJ-1 23
standard zircon with an ID-TIMS 206Pb/238U age of 600.5±0.4 Ma (Schaltegger et al., unpublished; in 24
Boekhout et al., 2012) was used for the standardisation of the relative sensitivity factor. For the 25
accuracy control, the Plešovice standard was employed (Sláma et al., 2008). Raw intensity vs. time data 26
were reduced in LAMTRACE (Jackson, 2008). Only homogeneous time resolved 206Pb/238U and 27
207Pb/235U spectra corresponding to one single isotope abundance ratio per ablation are reported in this 28
study. Weighted mean ages and concordia diagrams were obtained using Isoplot (Ludwig, 2008). 29
The mean age (i.e. crystallization age) is calculated from all concordant zircon population. Based on the 30
probability density estimate curve and the mean square weighted deviation (MSWD), some samples 31
exhibit subpopulations (see Figure 1, samples n°1, 13, 14, 15, 17, 21, 23, 27, 28 and 30; Table DR2), 32
and we only considered the younger subpopulation to represent the crystallization age, the older 33
subpopulation interpreted as antecrystic or inherited zircons for adjacent rocks (Miller et al., 2007). 34
Reported errors (2 SD) in Figure 1 are named “internal” and “external” errors. The “internal” error 35
corresponds to the analytical uncertainties from the sample measurement, while the “external” error 36
includes the propagation of analytical uncertainties from the sample measurement and the 37
reproducibility of the measurements on the primary standard GJ-1 (Fig. 1). 38
39

3
40
Figure 1: Reproducibility of the GJ1 standard including all analytical sessions carried out over 18 months. 41
42
Re-Os isotopes in molybdenite 43
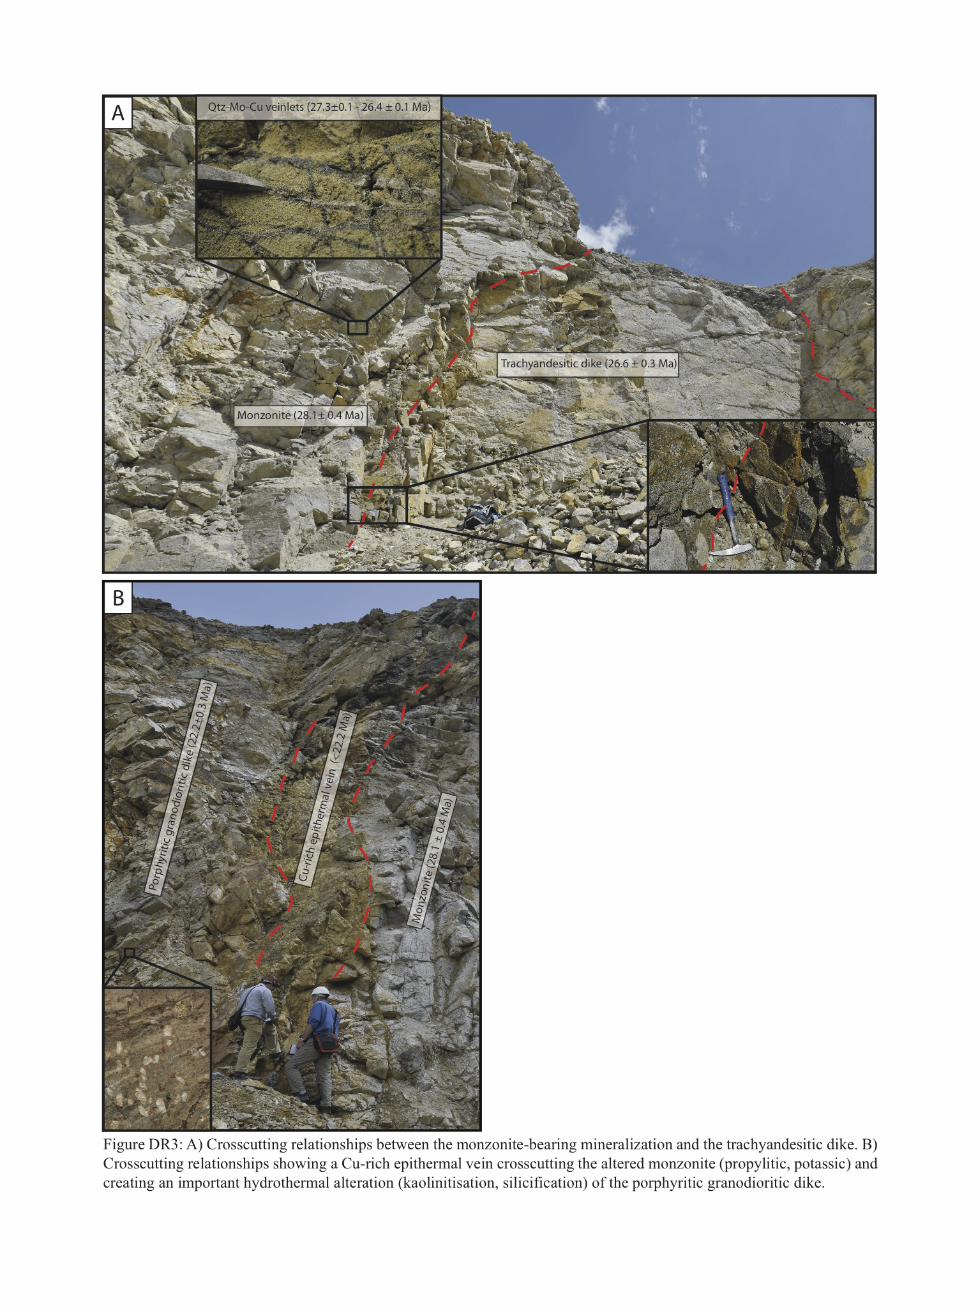
Samples forRe‐Osdating inmolybdenitewere selected fromvariousCu‐Moporphyrydeposits44
throughout the Meghri‐Ordubad pluton (see Figs. 1 and 2; Table DR3). Sample RO280‐2_N245
corresponds to a stockwork‐like veinletmainly filled by quartz‐chalcopyrite‐molybdenite from46
Agarak deposit, whereas samples RO812‐3_Ankaser_N72p and RO812‐7_Aigedzor_NRM‐056047
were selected from quartz‐molybdenite stockwork‐like veinlets from Hanqasar and Aygedzor,48
respectively. Six samples from quartz‐molybdenite (RO280‐1_NI) and quartz‐chalcopyrite‐49
molybdenite (RO758‐5_KJ1509, RO596‐2_KJ‐13‐25A, RO612‐10_KJ‐13‐25A, RO391‐2_KJ‐10‐13A,50
and RO758‐6_KJ15X1) stockwork‐like veinlets were collected from the giant Kadjaran Cu‐Mo51
deposit(seeFigs.1and2;TableDR3).Grainsizeofmolybdenitevariesfrom500mto2mm.52
Analyses were performed in the Laboratory for Sulfide and Source Rock Geochronology and53
Geochemistry in the Durham Geochemistry Center at the University of Durham (UK). The54
4
completeanalyticalprocedureforRe‐OsdeterminationsisdescribedinSelbyandCreaser(2004)55
andSelbyetal.(2007),anditisbrieflydescribedbelow.Molybdenitesamplesweredissolvedand56
equilibratedwithaknownamountof185ReandisotopicallynormalOsininverseaqua‐regia(2:157
16NHNO3and12NHCl,3mL)at240°Cfor24hinaCariustube.RheniumandOswereisolated58
and purified by solvent extraction, microdistillation, and anion exchange chromatography, and59
analyzed by negative thermal ionization mass spectrometry (N‐TIMS) on a Fisher Scientific60
TRITONmassspectrometerusingFaradaycollectors.TotalproceduralblanksforReandOs,are61
2.2±0.5pgand0.1±0.03pg,respectively,withan187Os/188Osblankcompositionof0.24±0.0562
(n=3).RheniumandOsconcentrationsandRe‐Osmolybdenitedateuncertaintiesarepresented63
at the2σ level,which includestheuncertainties inReandOsmassspectrometermeasurement,64
spike and standard Re and Os isotope compositions, and calibration uncertainties of 185Re and65
187Os.Becauseamixed185ReandOstracersolutionisused,uncertaintiesinweightsofsampleand66
tracer solution do not affect the calculated age, and are not considered. However, sample and67
tracersolutionweightuncertaintiesareconsideredindeterminingtheuncertaintyintheReand68
187Osconcentrations.Uncertaintywithandwithoutthe187Redecayconstant(Smoliaretal.,1996;69
Selbyetal.,2007)isalsoconsidered(TableDR4).70
71
In situ zircon Hf isotope analyses 72
In-situ Hf isotope analyses were carried out at the University of Geneva on a Teledyne - Photon 73
Machines “Analyte G2” laser system equipped with a two volume “HelEx-2” ablation cell (d'Abzac et 74
al. 2014) and coupled to a Thermo « Neptune Plus » MC-ICP-MS. Ablation was performed over 35 μm 75
spots at a fluence of ~6J.cm-2 and a repetition rate of 5Hz. Ablated particles were carried through a ~1.5 76
m PTFE tubing using a ~0.6 L.min-1 He gas flow (99.999% purity) and mixed with ~2.4 mL.min-1 N2 77
and ~1 L.min-1 Ar before entering the plasma torch. Measurements were performed at low mass 78
resolution (~450) over 120 × 1s cycles using the following cup configuration: 171Yb (L4), 173Yb (L3), 79
174(Yb+Hf) (L2), 175Lu (L1), 176(Hf+Yb+Lu) (C), 177Hf (H1), 178(Hf+Ta) (H2), 179Hf (H3), 181Ta (H4). 80

5
Blanks were acquired following the same method as samples, without ablation, every ca. 10 analyses. 81
Reference zircons Plešovice (Sláma et al., 2008) and Temora-2 (Woodhead and Hergt, 2005) were 82
measured after every 5 to 8 unknowns. Plešovice and Temora-2 zircons reach respective 83
0.282479±0.000027 (n=89) and 0.282670±0.000036 (n=98) over 10 months and 6 measurements 84
sessions (see details in Table DR 3). These values show a slight offset from the reference values to 85
which the sample data are normalized. Instrument tuning is then performed so that this offset is (i) as 86
small as possible (<1 εHf) and (ii) similar within uncertainty for all the different reference materials 87
used. This insures that the correction is accurately made for various trace elements concentrations 88
potentially generating oxide species in the ICP torch and for different amounts of 176Yb that need to be 89
corrected (see below). 90
Data reduction was conducted after acquisition by proceeding to a blank subtraction, removing the 91
isobaric interference of 176Lu and 176Yb on mass 176 (e.g. Fisher et al., 2011) and correcting the 92
resulting 176Hf/177Hf ratio for mass bias using an exponential law (Albarede et al., 2004). The mass bias 93
coefficients βYb and βHf were calculated from the measured 173Yb/171Yb and 179Hf/177Hf with the 94
reference values 173Yb/171Yb=1.1234 (Thirlwall and Anczkiewicz, 2004) and 179Hf/177Hf=0.7325 95
(Patchett and Tatsumoto, 1981) respectively. We used βYb to correct for Lu mass bias (Yuan et al., 96
2008) and the 176Lu interference was corrected using 176Lu/175Lu=0.02645 (Thirlwall and Anczkiewicz, 97
2004). The isobaric interference of 176Yb is potentially high in zircons and was evaluated using 98
176Yb/173Yb=0.786954 (Thirlwall and Anczkiewicz, 2004). Correction for 176Hf in-growth due to 176Lu 99
β--decay has been calculated (Iizuka and Hirata, 2005) using λ176Lu=1.87×10⁻¹¹ year-1 (Söderlund et 100
al., 2004) and the age determined in this study by U-Pb dating on zircon. The data are expressed as εHf 101
units following: 102
εHf = (176Hf ⁄ 177Hf)measured / (176Hf ⁄ 177Hf)CHUR - 1 × 10000 103
with the reference “CHUR” value of 0.282785 is taken from Bouvier et al. (2008). 104
105

6
In situ zircon O isotope analyses 106
Oxygen isotopes measurements were carried out on a different zircon sample set than those used for 107
LA-ICPMS U-Pb zircon dating but their cathodoluminescence patterns are very consistent from one 108
zircon sample set to another from the same crushed sample. The U-Pb weighted mean dates are 109
considered to be representative enough to accurately trace the source evolution over 30 Ma (Table 110
DR2). 111
Sample preparation and secondary ion mass spectrometry (SIMS) were carried out at the Canadian 112
Centre for Isotopic Microanalysis (CCIM) at the University of Alberta. Polished zircon mid-sections of 113
unknowns and zircon reference materials were exposed within a 25 mm diameter epoxy mount (M1323) 114
using diamond grits. The mount was cleaned with a lab soap solution, and de-ionized H2O. Prior to 115
scanning electron microscopy (SEM), the mount was coated with 5 nm of high-purity Au. SEM 116
characterization was carried out with a Zeiss EVO MA15 instrument equipped with a high-sensitivity, 117
broadband cathodoluminescence (CL) detector. Beam conditions were 15kV and 2 nA sample current. 118
A further 25 nm of Au was subsequently deposited on the mount prior to SIMS analysis. 119
Oxygen isotopes (18O, 16O) in zircon were analyzed using a Cameca IMS 1280 multicollector ion 120
microprobe. A 133Cs+ primary beam was operated with impact energy of 20 keV and beam current of ~ 121
2.5 nA. The ~12 µm diameter probe was rastered (18 x 18 µm) for 75 s prior to acquisition, and then 5 122
x 5 µm during acquisition, forming rectangular analyzed areas ~15 x 18 µm across and ~2 µm deep. 123
The normal incidence electron gun was utilized for charge compensation. Negative secondary ions 124
were extracted through 10 kV into the secondary (Transfer) column. Transfer conditions included a 122 125
µm entrance slit, a 5 x 5 mm pre-ESA (field) aperture, and 100x sample magnification at the field 126
aperture, transmitting all regions of the sputtered area. No energy filtering was employed. The 127
mass/charge separated oxygen ions were detected simultaneously in Faraday cups L’2 (16O-) and H’2 128
(18O-) at mass resolutions (m/∆m at 10%) of 1950 and 2250, respectively. Secondary ion count rates for 129
16O- and 18O- were typically ~2.5 x 10⁹ and 5 x 10⁶ counts/s utilizing 1010 Ω and 1011 Ω amplifier 130
7
circuits, respectively. Faraday cup baselines were measured at the start of the analytical session. A 131
single analysis took 250 s, including pre-analysis rastering, automated secondary ion tuning, and 75 s of 132
continuous peak counting. 133
Instrumental mass fractionation (IMF) was monitored by repeated analysis of a zircon primary reference 134
material (RM), S0081 (UAMT1) with δ18O VSMOW = +4.87 (R. Stern, unpublished laser fluorination 135
data from Ilya Bindeman, University of Oregon) and a secondary zircon RM, S0022 (TEM2) zircon 136
with δ18O VSMOW = +8.2 ‰ (Black et al., 2004). One analysis of the primary and secondary RM was 137
taken after every 4 and 12 unknowns, respectively. Spot analyses of unknowns totalled 280. The data 138
set of 18O-/16O- for S0081 zircon for each of two analytical sessions (N = 45, 51) was processed 139
collectively for each session, yielding standard deviations of 0.10‰ and 0.07‰, following correction 140
for systematic within-session drift (≤0.4 ‰). Overall IMF was +1.1 ‰ for both sessions. The 141
individual spot uncertainties at 95% confidence for δ18OVSMOW reported include errors relating to within-142
spot counting statistics, between-spot (geometric) effects, and correction for instrumental mass 143
fractionation, and average ± 0.19 ‰. Results for multiple spots on multiple grains of the secondary 144
RM, S0022, gave session mean values for δ18OVSMOW = +8.20 ±0.04 (MSWD = 0.79; N = 18, standard 145
deviation = 0.08‰) and +8.19 ±0.05 (MSWD = 0.56; N = 15, standard deviation = 0.07‰). 146
147
References : 148
Albarede, F., Telouk, P., Blichert-Toft, J., Boyet, M., Agranier, A., and Nelson, B., 2004, Precise and 149
accurate isotopic measurements using multiple-collector ICPMS: Geochimica and Cosmochimica Acta 150
v. 68, p. 2725-2744, doi:10.1016/j.gca.2003.11.024. 151
Black, L. P., Kamo, S. L., Allen, C. M., Davis, D., Aleinikoff, J. N., Valley, J. W., Mundil, R., 152
Campbell, I. H., Korsch, R. J., Williams, I. S., and Foudoulis, C., 2004, Improved 206Pb/238U microprobe 153
geochronology by the monitoring of a trace-element-related matrix effect; SHRIMP, ID-TIMS, ELA-154
8
ICP-MS and oxygen isotope documentation for a series of zircon standards: Chemical Geology, v. 205, 155
p. 115-140, doi:10.1016/j.chemgeo.2004.01.003. 156
Boekhout F., Spikings R., Sempere T., Chiaradia M., Ulianov A. and Schaltegger U., 2012, Mesozoic 157
arc magmatism along the southern Peruvian margin during Gondwana breakup and dispersal: Lithos, v. 158
146, p. 48-64, doi:10.1016/j.lithos.2012.04.015. 159
Bouvier, A., Vervoort, J. D., and Patchett, P. J., 2008, The Lu–Hf and Sm–Nd isotopic composition of 160
CHUR: Constraints from unequilibrated chondrites and implications for the bulk composition of 161
terrestrial planets: Earth and Planetary Science Letters, v. 273, p. 48-57, doi:10.1016/j.epsl.2008.06.010. 162
d'Abzac, F.-X., Czaja, A. D., Beard, B. L., Schauer, J. J., and Johnson, C. M., 2014, Iron Distribution in 163
Size-Resolved Aerosols Generated by UV-Femtosecond Laser Ablation: Influence of Cell Geometry 164
and Implications for In Situ Isotopic Determination by LA-MC-ICP-MS: Geostandards and 165
Geoanalytical Research, v.38, p. 293-309, doi:10.1111/j.1751-908X.2014.00281.x. 166
Fisher, C. M., Hanchar, J. M., Samson, S. D., Dhuime, B., Blichert-Toft, J., Vervoort, J. D., and Lam, 167
R., 2011, Synthetic zircon doped with hafnium and rare earth elements: A reference material for in situ 168
hafnium isotope analysis: Chemical Geology, v.286, p. 32-47, doi:10.1016/j.chemgeo.2011.04.013. 169
Iizuka, T. and Hirata, T., 2005, Improvements of precision and accuracy in in situ Hf isotope 170
microanalysis of zircon using the laser ablation-MC-ICPMS technique: Chemical Geology, v.220, p. 171
121-137, doi:10.1016/j.chemgeo.2005.03.010. 172
Jackson, S., 2008, LAMTRACE data reduction software for LA-ICP-MS. Laser ablation ICP-MS in the 173
Earth sciences: Current practices and outstanding issues: Mineralogical Association of Canada, Short 174
Course Series 40, p. 305-307. 175
Ludwig, K.R., 2008, User’s Manual for Isoplot 3.70: A geochronological toolkit for Microsoft Excel: 176
Berkeley Geochronology Center, Special Publication 4, 77 p. 177
9
Miller, J.S., Matzel, J.P., Miller, C.F., Burgess, S.D., and Miller, R.B., 2007, Zircon growth and 178
recycling during the assembly of large, composite arc plutons. Journal of Volcanology and Geothermal 179
Research, v. 167, p. 282–299, doi: 10.1016/j.jvolgeores.2007.04.019. 180
Patchett, P. J. and Tatsumoto, M., 1981, A routine high-precision method for Lu-Hf isotope 181
geochemistry and chronology: Contributions to Mineralogy and Petrology, v.75, p. 263-267, 182
doi:10.1007/BF01166766. 183
Pearce, N.J., Perkins, W.T., Westgate, J.A., Gorton, M.P., Jackson, S.E., Neal, C.R., and Chenery, S.P., 184
1997, A compilation of new and published major and trace element data for NIST SRM610 and NIST 185
SRM612 glass reference materials: Geostandards, Newsletter 21, p. 115–144, doi:10.1111/j.1751-186
908X.1997.tb00538.x. 187
Selby,D.,andCreaser,R.A.,2004,MacroscaleNTIMSandmicroscaleLA‐MC‐ICP‐MSRe‐Osisotopic188
analysis ofmolybdenite: Testing spatial restrictions for reliable Re‐Os age determinations, and189
implicationsforthedecouplingofReandOswithinmolybdenite:GeochimicaetCosmochimica190
Acta,v.68,p.3897–3908,doi:10.1016/j.gca.2004.03.022.191
Selby,D.,Creaser,R.A.,Stein,H.J.,Markey,R.J.,andHannah,J.L.,2007,Assessmentofthe187Re192
decayconstantaccuracyandprecision:Crosscalibrationofthe187Re‐187OsmolybdeniteandU‐Pb193
zircon chronometers: Geochimica et Cosmochimica Acta, v. 71, p.1999–2013,194
doi:10.1016/j.gca.2007.01.008.195
Sláma, J., Košler, J., Condon, D. J., Crowley, J. L., Gerdes, A., Hanchar, J. M., Horstwood, M. S. A., 196
Morris, G. A., Nasdala, L., Norberg, N., Schaltegger, U., Schoene, B., Tubrett, M. N., and Whitehouse, 197
M. J., 2008, Plešovice zircon - A new natural reference material for U–Pb and Hf isotopic 198
microanalysis: Chemical Geology, v.249, p. 1-35, doi:10.1016/j.chemgeo.2007.11.005. 199

10
Smoliar,M.I.,Walker,R.J.,andMorgan,J.W.,1996,Re‐OsisotopeconstraintsontheageofGroup200
IIA, IIIA, IVA, and IVB iron meteorites: Science, v. 271, p. 1099–1102, doi:201
10.1126/science.271.5252.1099.202
Söderlund, U., Patchett, P. J., Vervoort, J. D., and Isachsen, C. E., 2004, The 176Lu decay constant 203
determined by Lu–Hf and U–Pb isotope systematics of Precambrian mafic intrusions: Earth and 204
Planetary Science Letters, v. 219, p. 311-324, doi:10.1016/S0012-821X(04)00012-3. 205
Thirlwall, M. F. and Anczkiewicz, R., 2004, Multidynamic isotope ratio analysis using MC–ICP–MS 206
and the causes of secular drift in Hf, Nd and Pb isotope ratios: International Journal of Mass 207
Spectrometry, v.235, p.59-81, doi:10.1016/j.ijms.2004.04.002. 208
Ulianov A., Muntener O., Schaltegger U. and Bussy F., 2012, The data treatment dependent variability 209
of U-Pb zircon ages obtained using mono-collector, sector field, laser ablation ICP-MS: Journal of 210
Analytical Atomic Spectrometry, v.27, p. 663-676, doi:10.1039/C2JA10358C. 211
Woodhead, J. D. and Hergt, J. M., 2005, A Preliminary Appraisal of Seven Natural Zircon Reference 212
Materials for In Situ Hf Isotope Determination: Geostandards and Geoanalytical Research, v.29, p. 183-213
195, doi:10.1111/j.1751-908X.2005.tb00891.x. 214
Yuan, H. L., Gao, S., Dai, M. N., Zong, C. L., Günther, D., Fontaine, G. H., Liu, X. M., and Diwu, 215
C., 2008, Simultaneous determinations of U–Pb age, Hf isotopes and trace element compositions of 216
zircon by excimer laser-ablation quadrupole and multiple-collector ICP-MS: Chemical Geology, 217
v.247, p. 100-118, doi:10.1016/j.chemgeo.2007.10.003.218

ARABIAN PLATFORM
EURASIAN PLATFORM
Caspian sea
Meghri-Ordubad pluton
Blacksea
30°N
GC
LC
Lut
Makran
AlborzUDVZ
SSZZagros
suture zone
E. Pontides
40°N 60°N
E. Anatolia
Porphyry Cu±Mo±Au deposits
CretaceousMiocene EoceneOligocene > 100 Mt resources
< 100 Mt resources
Figure DR1: Distribution of porphyry Cu±Mo±Au deposits grouped by ages and sizes along the Afro-Arabian collision zone located in the central Tethyan metallogenic belt. Locations and ages of porphyry deposits are derived principally from Singer et al. (2008), with updated information from Aghazadeh et al. (2015) and Richards (2015). Suture zones and struc-tures are derived from Mouthereau et al. (2012) and the topographic relief background map from ETOPO1 (1'×1' resolu-tion) Global Relief data (http://www.ngdc.noaa.gov). Abbreviations are Greater Caucasus (GC), Lesser Caucasus (LC), Sanandaj-Sirjan Zone (SSZ) and Urumieh-Dokhtar Volcanic Zone (UDVZ).

Figure DR2: a) Total Alkali Silica (TAS) diagram (Le Maître et al.,1989). b) K2O vs. SiO2 Harker diagram (Pecerillo and Taylor, 1976). c) Mg# vs. SiO2 Harker diagram. d) Al2O3 vs. SiO2 Harker diagram. e) Ni vs. Cr. f) Sr/Y vs. Y.
a b
c d
fe
0
4
8
12
Na2O + K
2O (w
t%)
40 45 50 55 60 65 70 75
SiO2 (wt%)
Gabbro
Alkalicgabbro
Monzogabbro
Diorite
Monzodiorite
Syenite
Granite
Granodiorite
Monzonite
TonaliteGabbroic Diorite
Quartz
Monzonite
Late Oligocene -‐ Early Miocene Late Eocene -‐ Middle Oligocene Middle Eocene
12
16
20
24Al
2O3 (w
t%)
40 45 50 55 60 65 70 75
SiO2 (wt%)
0.2
0.4
0.6
0.8
Mg #
40 45 50 55 60 65 70 75
SiO2 (wt%)
0
20
40
60
80
100
0 10 20 30 40 50
Sr/Y
Y (ppm)
“Adakitic” field
Volcanic arc field1
10
100
1000
Ni (pp
m)
0 1 10 100 1000
Cr (ppm)
0
2
4
6
8
K2O (w
t%)
40 45 50 55 60 65 70 75
SiO2 (wt%)
Low-‐K series
Medium-‐K series
High-‐K series

REFERENCES
Aghazadeh, M., Hou, Z., Badrzadeh, Z., and Zhou, L., 2015, Temporal–spatial distribution and tectonic setting of porphyry copper deposits in Iran: Constraints from zircon U–Pb and molybdenite Re–Os geochronology: Ore Geology Reviews, v. 70, p. 385-406, doi:10.1016/j.oregeorev.2015.03.003.
Le Maitre, R. W. B., Dudek, P., Keller, A., Lameyre, J., Le Bas, J., Sabine, M.J., Schmid, P.A., Sorensen, R., Streckeisen, H., Woolley, A. and Zanettin, A.R., 1989, A classification of igneous rocks and glossary of terms: Recommendations of the International Union of Geological Sciences, Subcommission on the Systematics of Igne-ous Rocks: Blackwell Scientific Publications, Oxford, 193 p.
Mouthereau, F., Lacombe, O. and Vergés, J., 2012, Building the Zagros collisional orogen: timing, strain distribu-tion and the dynamics of Arabia/Eurasia plate convergence: Tectonophysics, v. 532, p. 27-60, doi:10.1016/j.tec-to.2012.01.022.
Pecerillo, A., and Taylor, S.R., 1976, Geochemistry of Eocene calc-alkaline volcanic rocks from the Kastamanou area, northern Turkey: Contributions to Mineralogy and Petrology, v. 58, p. 63–81, doi: 10.1007/BF00384745.
Richards, J.P., 2015, Tectonic, magmatic, and metallogenic evolution of the Tethyan orogen: from subduction to collision: Ore Geology Review, v. 70, p. 323-345, doi: 10.1016/j.oregeorev.2014.11.009.
Singer, D. A., Berger, V. I., Moring, B. C., 2008, Porphyry copper deposits of the world: database and grade and tonnage models: U.S. Geological Survey Open-File Report 2008-1155, 45 p. (http://pubs.usgs.gov/of/2008/1155/).
TABLES DR1-5
2016203-Tables DR1-D5.xlsx