Apparent solubilities of commercially pure and oxygen-doped
36
APPARENT SOLUBILITIES OF COMMERCIALLY PURE A N D NIOBIUM I N LIQUID POTASSIUM OXYGEN-DOPED TANTALUM AND by Stephan Stecwa Lewis Research Center Cleveland, Ohio 4413 5 NATIONAL AERONAUTICS AND SPACE ADMINISTRATION WASHINGTON, D. C. JULY 1970 https://ntrs.nasa.gov/search.jsp?R=19700022835 2019-04-06T07:45:49+00:00Z
Transcript of Apparent solubilities of commercially pure and oxygen-doped
APPARENT SOLUBILITIES OF COMMERCIALLY PURE A N D
NIOBIUM I N LIQUID POTASSIUM OXYGEN-DOPED TANTALUM AND
by Stephan Stecwa
Lewis Research Center Cleveland, Ohio 4413 5
N A T I O N A L A E R O N A U T I C S A N D S P A C E A D M I N I S T R A T I O N W A S H I N G T O N , D . C. J U L Y 1970
https://ntrs.nasa.gov/search.jsp?R=19700022835 2019-04-06T07:45:49+00:00Z
TECH LIBRARY KAFB, NM
2. Government Access ion No. I 1. Report No. NASA TN D-5875
APPARENT SOLUBILITIES OF COM- 4. T i t l e and Subt i t le
MERCIALLY PURE AND OXYGEN-DOPED TANTALUM AND NIOBIUM IN L1QUJ.D POTASSIUM
Stephan Stecura
Lewis R e s e a r c h Center National Aeronaut ics and Space Adminis t ra t ion Cleveland, Ohio 441 35
7. Author(s)
9. Performing Orgonizat ion Name and Address
12. Sponsoring Agency Name and Address National Aeronaut ics and Space Adminis t ra t ion Washington, D. C. 20546
15. Supplementary No tes
3. Recipient ’s Cata log No.
5. Report Date July 1970
6. Performing Organization Code
8. Performing Organizat ion Report No. E- 5615
IO. Work U n i t No. 129-03.
1. Contract or Grant No.
~
13. Type o f Report and Per iod Caverod
Technical Note
14. Sponsoring Agency Code
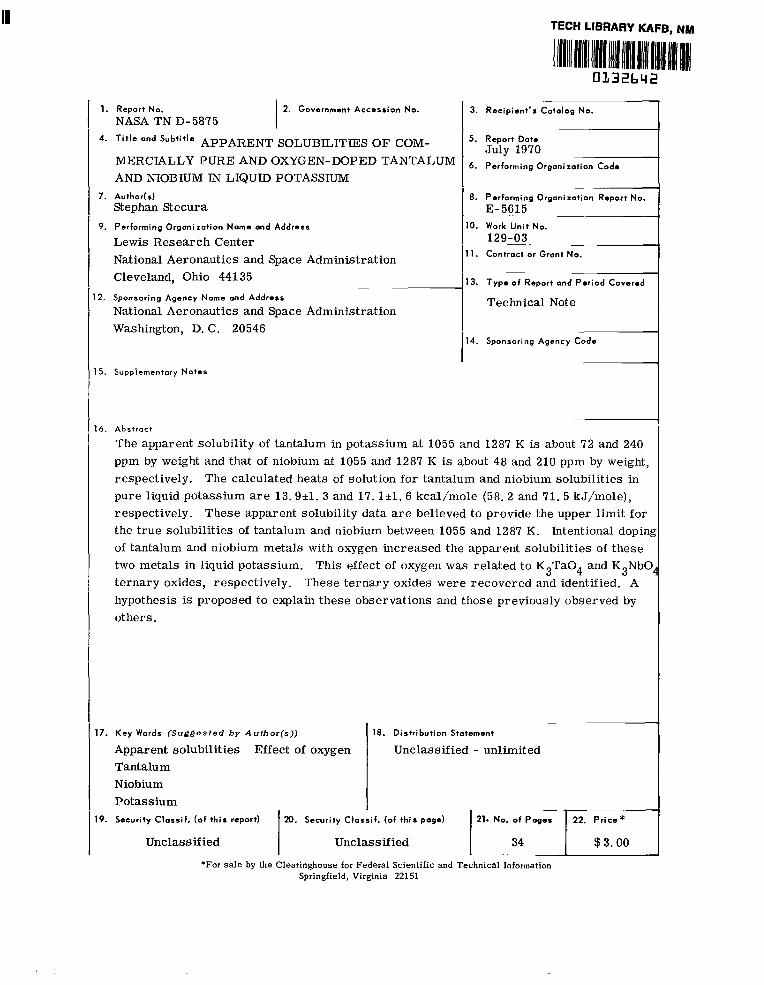
16. Abstract
The apparent solubili ty of tantalum in potass ium a t 1055 and 1287 K is about 72 and 240 ppm by weight and that of niobium at 1055 and 1287 K is about 48 and 210 ppm by weight., respect ively. The calculated hea ts of solut ion f o r tantalum and niobium solubili t ies in pu re liquid potass ium are 13.9+1. 3 and 17. l+l. 6 kcal /mole (58.2 and 71. 5 kJ/mole) , respec t ive ly . T h e s e apparent solubili ty da ta are believed t o provide the upper l imi t fo r the t r u e solubili t ies of tantalum and niobium between 1055 and 1287 K. of tantalum and niobium meta l s with oxygen increased the apparent solubili t ies of t hese two me ta l s in liquid potassium. t e r n a r y oxides, respec t ive ly . These t e r n a r y oxides w e r e r ecove red and identified. A hypothesis is proposed to explain these observa t ions and those previously observed by o thers .
Intentional dopinl
This effect of oxygen was r e l a t ed to K3Ta04 and K3Nb0
17. Key Wards (Suggested b y Author ( s ) )
Apparent so lubi l i t i es Effect of oxygen Tantalum Niobium P o t a s s i u m
18. D is t r ibu t ion Statement
Unclassif ied - unlimited
19. Security Classi f . ( o f t h i s report) 20. Security Classi f . (o f t h i s page) 21. No. o f Pages 22. P r i c e *
Unclassif ied 1 - - 3 4 1 $3.00
Springfield, Virginia 22151
I Unclassif ied
*For sale by the Clearinghouse for Federa l Scient i f ic and Technica l Information
APPARENT SOLUBILITIES OF COMMERCIALLY PURE AND OXYGEN-DOPED
TANTALUM AND NIOBIUM IN LIQUID POTASSIUM
by Stephan Stecura
Lewis Research Center
SUMMARY
The apparent solubilities of commercially pure tantalum (Ta) and niobium (Nb) in liquid potassium containing less than 15 ppm by weight of oxygen were studied between 1055 and 1287 K. The apparent solubilities of these two metals in liquid potassium are represented by the relations
3048*276 T I log wt ppm Ta = 4.7510.24 -
} for 1055 to 1287 K
J 37 39i343 T
log wt ppm Nb = 5.23k0.30 -
where T is the absolute temperature. The calculated heats of solution for tantalum and niobium apparent solubilities in liquid potassium a r e 1 3 . 9 4 . 3 and 17. 1 k l . 6 kilocalories per mole (58.2 and 71.5 kJ/mole), respectively. The apparent solubility values for com- mercially pure tantalum and niobium metals in liquid potassium a r e believed to have been influenced by oxygen. parent solubility values obtained herein provide an upper limit for the true solubilities of tantalum and niobium in liquid potassium. A method that is considered to be a more ac- curate one for obtaining the true solubility data for tantalum and niobium in liquid potas- sium is studying the kinetics of the solution as a function of oxygen concentration.
The effect of oxygen in tantalum and niobium metals on their apparent solubilities in liquid potassium was studied between 1063 and 1268 K. Tantalum and niobium concentra- tions in liquid potassium increase with an increase in their oxygen concentrations. increased apparent solubilities of tantalum and niobium in potassium are related to the formation of K3Ta04 and K3Nb04 ternary oxides, respectively. These ternary oxides were recovered and identified. A hypothesis is proposed to explain these observations and those previously observed by others. It is proposed that oxygen in the refractory metal and in the liquid potassium diffuses toward the tantalum-potassium or niobium- potassium interface and forms tantalum or niobium oxides, which then react with potas- sium to form the K3Ta04 or K3Nb04 ternary oxide. The ternary oxide then dissolves in 1 iquid pot ass ium .
However, this oxygen influence is believed to be small. The ap-
The
INTROD U CTI ON
One of the prime concerns in the development of advanced Rankine-type space power systems is the corrosion resistance of refractory metals o r alloys to alkali metals at high temperatures. In such space power systems, potassium is of interest as a thermo- dynamic working fluid. Tantalum and niobium alloys a r e being considered as the con- tainer materials for potassium at high temperatures (ref. 1).
corrosion behavior. Although several studies on the resistance of refractory metals and alloys to corrosion by liquid potassium have been made (refs. 2 to 4), few quantitative solubility data are available. (refs. 5 to 7) show a high degree of scatter, which can be attributed at least in part to the effects of interstitial impurities such as oxygen, nitrogen, and carbon. The effect of oxygen on the solubilities of refractory metals is especially critical (refs. 2, 5, and 8 to 10).
The purpose of this study was to obtain data for tantalum and niobium solubilities in liquid potassium. Data were also obtained for the effect of oxygen on these solubilities. The apparent solubilities and the effect of oxygen on the apparent solubilities of tantalum and niobium in liquid potassium were studied between 1055 and 1287 K by a rotatable- capsule method (refs. 9 and 11).
Solubility data are necessary to interpret corrosion data and to assist in predicting
The limited data reported for tantalum and niobium
APPARATUS, MATERIALS, AND PROCEDURE
The data presented in this report were determined after allowing tantalum and nio- bium crucibles (which were the sources of both solutes and oxygen) to be in contact with high-purity potassium for 24 hours at the desired temperature. test time, the furnace was inverted and cooled to room temperature. Nickel capsules in which the crucibles and potassium had been sealed were opened, and the potassium con- taining the solute was removed for analysis.
At the end of the 24-hour
Apparatus
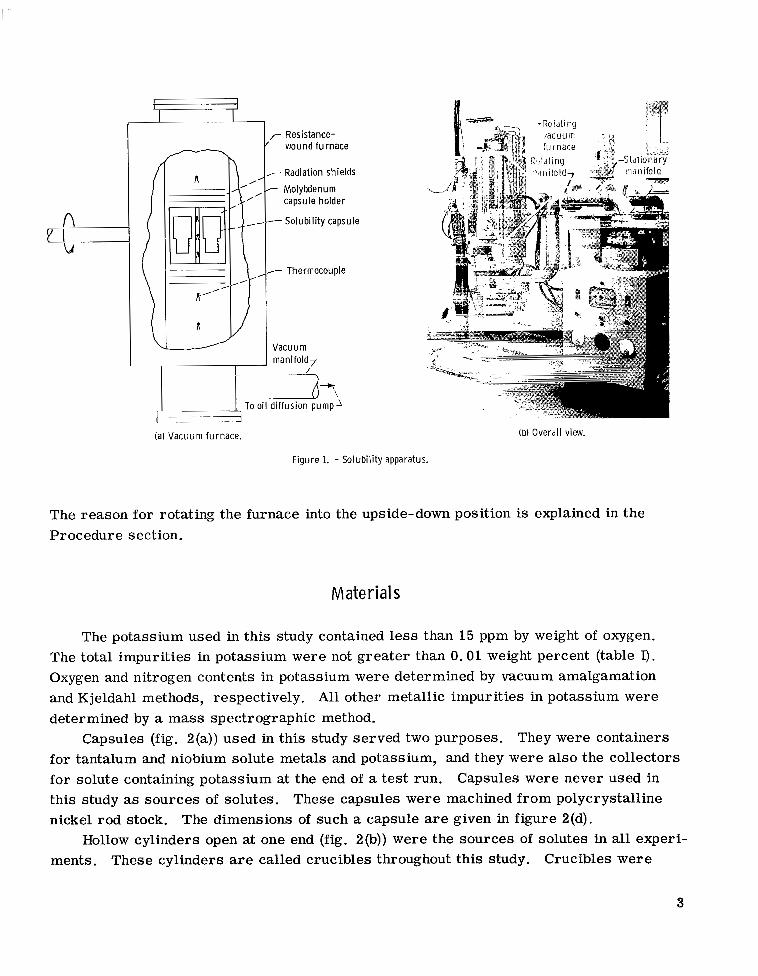
Tantalum and niobium metals were studied between 1055 and 1287 K. The furnace used in obtaining the data was the same as that previously described by Stecura (ref. 9) and Swisher (ref. 11). A schematic diagram of the solubility furnace and a photograph of the equipment used in this study a re shown in figure 1. This furnace can be inverted. 1
2
I
A YI
LA
I I
7 Resistance- wound furnace
- Radiation shields
- Molybdenum capsule holder
-Solubi l i ty capsule
Thermocouple
Vacuum manifold7
/
(b) Overdll view.
The reason for rotating the furnace into the upside-down position is explained in the Procedure section.
Materials
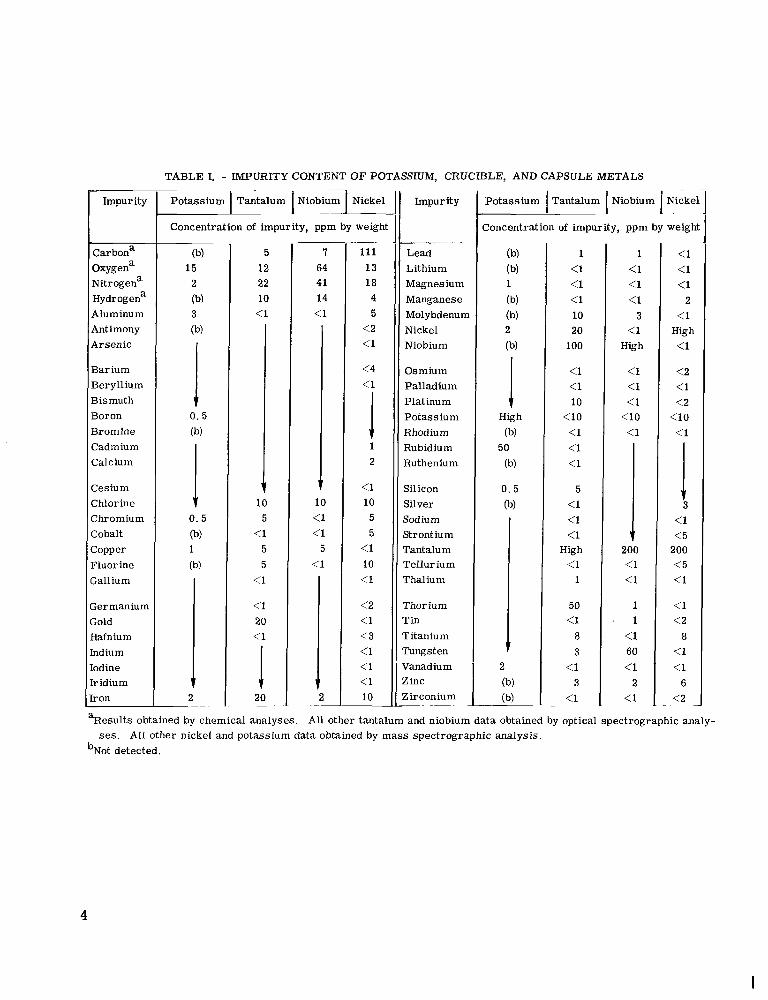
The potassium used in this study contained less than 15 ppm by weight of oxygen. The total impurities in potassium were not greater than 0.01 weight percent (table I). Oxygen and nitrogen contents in potassium were determined by vacuum amalgamation and Kjeldahl methods, respectively. All other metallic impurities in potassium were determined by a mass spectrographic method.
for tantalum and niobium solute metals and potassium, and they were also the collectors for solute containing potassium at the end of a test run. Capsules were never used in this study as sources of solutes. These capsules were machined from polycrystalline nickel rod stock. The dimensions of such a capsule are given in figure 2(d).
Hollow cylinders open at one end (fig. 2(b)) were the sources of solutes in all experi- ments.
Capsules (fig. 2(a)) used in this study served two purposes. They were containers
These cylinders are called crucibles throughout this study. Crucibles were
3
Impurity
Concentration of impurity, ppm
Carbona Oxygena Nitrogen" Hydrogena Aluminum Antimony Arsenic
Barium Beryllium Bismuth Boron Bromine Cadmium Calcium
Cesium Chlorine Chromium Cobalt Copper Fluorine ;allium
2ermanium ;old Hafnium hdium [odine kidium ron
by weight __ 111 13 Lithium
TABLE I. - IMPURITY CONTENT OF POTASSIUM, CRUCTBLE, AND CAPSULE METALS
Magnesium Manganese Molybdenum Nickel Niobium
Osmium Palladium Platinum Potassium Rhodium Rubidium Ruthenium
Silicon Silver Sodium Strontium Tantalum Tellurium T haliu m
Thorium Tin Titanium Tungsten Vanadium
Zirconium 1 zinc
~~~ . ~~
1
I
i a 4 5
<2 <1
<4 (1
I 1
2
<1 10 5 5
<1 10 <1
<2 <1 (3 <1 <1 (1 10
-
Concentration of impurity, ppm by weigh
1 <1 <1 <1 10 20 100
<1 <1 10
<10 <1 <1 <1
5 <1 <1 <1
High <1
1
50 <1
a 3
<1 3
(1
<1 <1 <1 2
<1 High <1
<2 <1 <2
<lo <1
1 3
<1 <5 200 <5 <1
<1 <2
a <1 <1 6
<2
%esults obtained by chemical analyses. All other tantalum and niobium data obtained by optical spectrographic analy-
bNot detected. ses. All other nickel and potassium data obtained by mass spectrographic analysis.
4
I
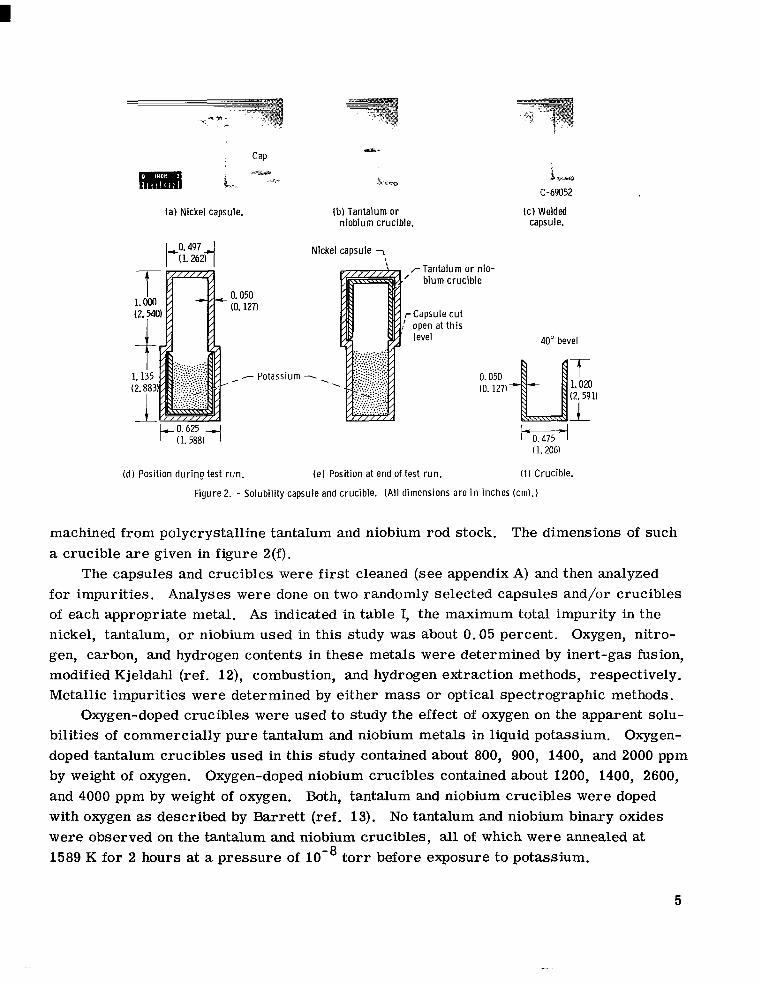
(a) Nickel capsule. (b) Tantalum or niobium crucible.
Nickel capsule 7 !
r Tantalum or nio- b ium crucible
0.050 (0.127)
, - Potassium - .
-Capsule cu t open at this level
0.050 (0. 127)
L,, C-69052
(c) Welded capsule.
40" bevel
t 1. om
T1) ( d ) Position d u r i n g test run. (e ) Position at end of test run. ( f ) Crucible.
Figure2. - Solubil ity capsule and crucible. (Al l dimensions are i n inches (cm).)
machined from polycrystalline tantalum and niobium rod stock. a crucible a r e given in figure 2(f).
The capsules and crucibles were first cleaned (see appendix A) and then analyzed for impurities. of each appropriate metal. As indicated in table I, the maximum total impurity in the nickel, tantalum, or niobium used in this study was about 0.05 percent. gen, carbon, and hydrogen contents in these metals were determined by inert-gas fusion, modified Kjeldahl (ref. 12), combustion, and hydrogen extraction methods, respectively. Metallic impurities were determined by either mass or optical spectrographic methods.
Oxygen-doped crucibles were used to study the effect of oxygen on the apparent solu- bilities of commercially pure tantalum and niobium metals in liquid potassium. Oxygen- doped tantalum crucibles used in this study contained about 800, 900, 1400, and 2000 ppm by weight of oxygen. Oxygen-doped niobium crucibles contained about 1200, 1400, 2600, and 4000 ppm by weight of oxygen. Both, tantalum and niobium crucibles were doped with oxygen as described by Barrett (ref. 13). No tantalum and niobium binary oxides were observed on the tantalum and niobium crucibles, all of which were annealed at 1589 K for 2 hours at a pressure of
The dimensions of such
Analyses were done on two randomly selected capsules and/or crucibles
Oxygen, nitro-
to r r before exposure to potassium.
5
ll11lll1111lIll I 1 I
P rocedu re
Apparent -. solubility - studies. - The procedure used in determining the apparent solu- bilities of pure and oxygen-doped tantalum and niobium metals in liquid potassium was the same as that described in references 9 and 11. The nickel capsules were filled with about 1.2kO. 08 grams of potassium in a vacuum chamber at a pressure of 5X10⁻⁶ torr . The crucibles were placed in the capsules, which were capped and electron beam welded at a pressure of about 5X10m6 torr . Then the capsules containing the tantalum or niobium crucibles and the potassium were placed into the furnace in the position shown in fig- u re 2(d). In all experiments, capsules containing crucibles and potassium were heated at the desired temperatures at a pressure of to r r . Temperatures were measured with platinum - platinum-13-percent-rhodium thermocouples. Over a period of 96 hours, the maximum temperature variation along the capsule walls inside the molybdenum holder was 4 at 1287 K. The estimated accuracy of the recorded capsule temperature was about *8 at 1287 K.
upside-down position at the desired temperature. The rotation of the furnace to the upside-down position is necessary because the potassium containing tantalum or niobium in solution must be collected in a different metal container (e. g., the nickel capsule used in this study), as shown in figure 2(e). This permits the quantitative recovery of the tan- talum o r niobium that precipitates from potassium during cooling of the furnace to room temperature. After cooling to room temperature, the capsules were cut open at almost the middle, as indicated in figure 2(e). Solute-containing potassium was dissolved in butyl alcohol, and the inside walls of the smaller diameter sections of the nickel cap- sules were leached with hydrochloric acid to remove tantalum and niobium that precipi- tated from potassium on cooling to room temperature. The butyl alcohol and hydro- chloric acid solutions were combined, and potassium was converted to potassium chloride in the manner described in reference 9. The concentrations of tantalum and niobium in the potassium chloride samples from the experiments using the undoped metals were determined by spectrophotometric analyses (ref. 14). are estimated to be *8 percent. Concentrations of tantalum and niobium in potassium chloride samples from the experiments using oxygen-doped metals were determined by X-ray fluorescence analyses. The accuracies of X-ray fluorescence analyses are esti- mated to be 510 percent.
Separation of ternary ~ oxides from liquid potassium. - The ternary oxides of potassium-tantalum-oxygen and potassium-niobium-oxygen systems were recovered only in the experiments in which oxygen-doped tantalum and niobium metals were used. These ternary oxides were recovered in the product separation apparatus described by Gahn (ref. 15). From the experiments in which oxygen-doped crucibles were used,
At the end of a test run, the capsules were inverted by rotating the furnace to the
The accuracies of these analyses
6
I
selected capsules were transferred to the product separation apparatus and cut open. Potassium heated to 598 K was evaporated from each of the capsules in 2 to 3 hours. Each capsule, now containing only the ternary oxide residue, was put into the transfer chamber of the product separation apparatus and transferred to an argon-filled glove box. In the glove box, some of the ternary oxide residue was put into X-ray capillary tubes for X-ray diffraction analysis. The rest of the ternary oxide residue was put into glass vials to be analyzed for potassium and tantalum or niobium contents.
RESULTS AND DISCUSSION
Apparent Solubi l i t ies of Commercial ly Pure Tantalum and Niobium
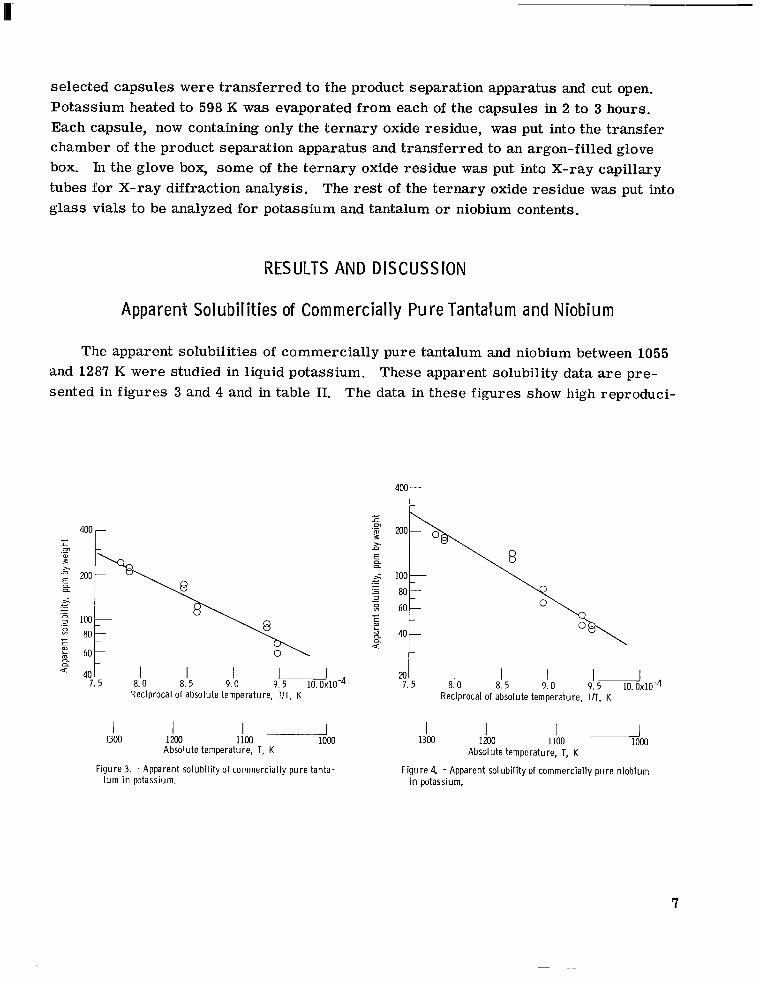
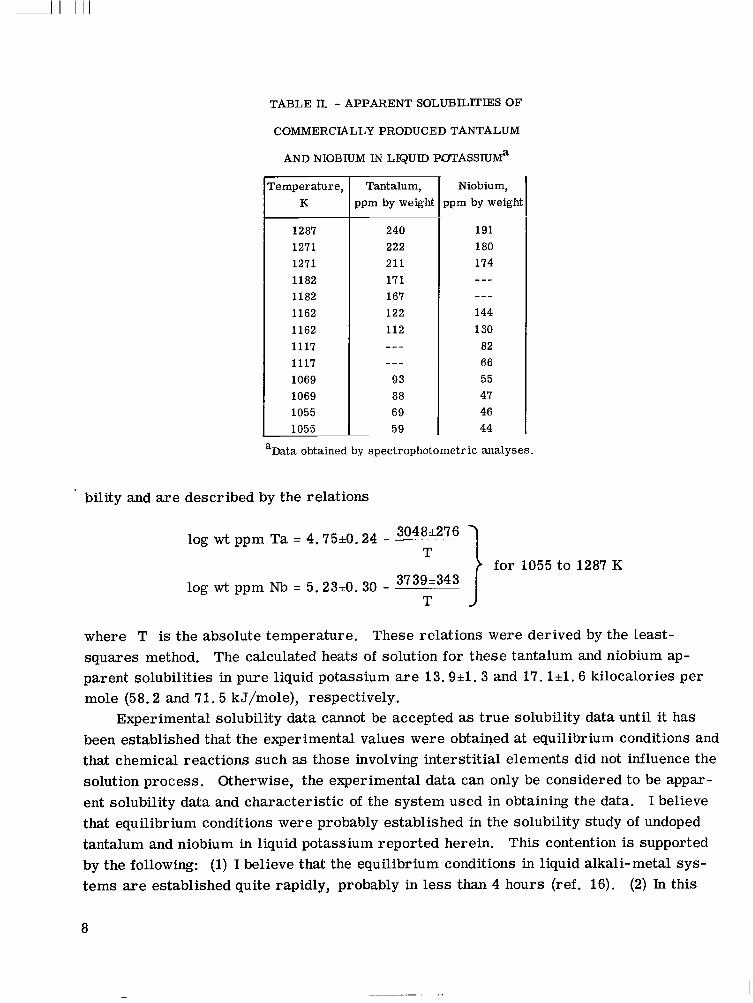
The apparent solubilities of commercially pure tantalum and niobium between 1055 and 1287 K w e r e studied in liquid potassium. These apparent solubility data a r e pre- sented in figures 3 and 4 and in table 11. The data in these figures show high reproduci-
400
Reciprocal of absolute temperature, UT. K
a 9 .5 10.0~10-4
I 9.0
I 7. 5 8.0 8. 5
Reciprocal of absolute temperature, UT. K
L
c 5 100- ._ - - B 80- - 3 - W 60-
- 40 -
-
I 1 9 . 5 io. 0x10-4
I 9.0
I 8.5
201 I 7.5 8.0
Reciprocal of absolute temperature, UT, K
I 1 1100 1000 1100 1000
I 1200
I 1300
I I I 1200
Absolute temperature, T, K
Figure 3. - Apparent solubility of commercially pure tanta-
I 1300
Absolute temperature, T, K Figure 4 - Apparent solubility of commercially pure niobium
lum i n potassium. in potassium.
7
1 - I I1 IIIIIII I I
TABLE II. - APPARENT S0LUBILl”IES OF
COMMERCIALLY PRODUCED TANTALUM
AND NIOBIUM IN LIQUID POTASSIUM~
’emperahre, K
1287 1271 1271 1182 1182 1162 1162 1117 1117 1069 1069 1055 1055
Tantalum, ppm by weight
240 222 211 1 7 1 167 122 112 --- _ _ _
93 88 69 59
Niobium, ipm by weight
191 180 174 --- _ _ _ 144 130
82 66 55 47 46 44
“Data obtained by spectrophotometric analyses.
bility and a r e described by the relations
for 1055 to 1287 K
304 8*276 T
log wt ppm Ta = 4.75-10.24 -
3739*343 T J log w t ppm N b = 5.23+0.30 -
where T is the absolute temperature. These relations were derived by the least- squares method. The calculated heats of solution for these tantalum and niobium ap- parent solubilities in pure liquid potassium are 13.94. 3 and 17. l*l. 6 kilocalories per mole (58.2 and 71. 5 kJ/mole), respectively.
Experimental solubility data cannot be accepted as t rue solubility data until it has been established that the experimental values were obtained at equilibrium conditions and that chemical reactions such as those involving interstitial elements did not influence the solution process. Otherwise, the experimental data can only be considered to be appar- ent solubility data and characteristic of the system used in obtaining the data. I believe that equilibrium conditions were probably established in the solubility study of undoped tantalum and niobium in liquid potassium reported herein. This contention is supported by the following: (1) I believe that the equilibrium conditions in liquid alkali-metal sys- tems are established quite rapidly, probably in less than 4 hours (ref. 16). (2) In this
8
I
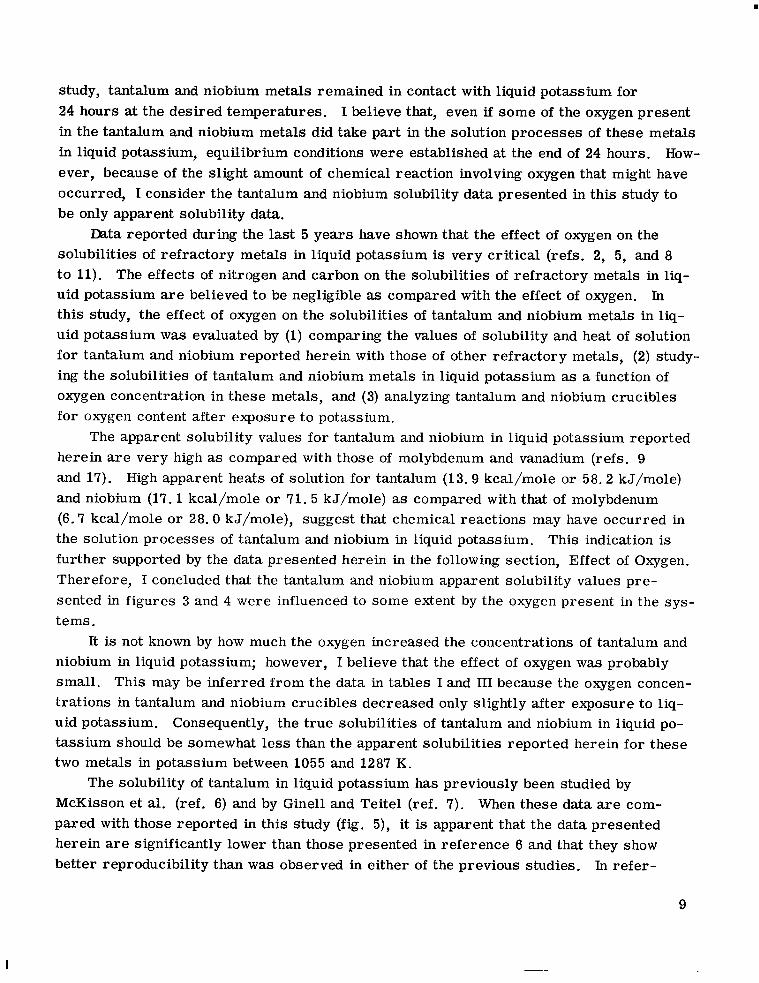
study, tantalum and niobium metals remained in contact with liquid potassium for 24 hours at the desired temperatures. I believe that, even if some of the oxygen present in the tantalum and niobium metals did take part in the solution processes of these metals in liquid potassium, equilibrium conditions were established at the end of 24 hours. How- ever, because of the slight amount of chemical reaction involving oxygen that might have occurred, I consider the tantalum and niobium solubility data presented in this study to be only apparent solubility data.
solubilities of refractory metals in liquid potassium is very critical (refs. 2, 5, and 8 to 11). uid potassium are believed to be negligible as compared with the effect of oxygen. In this study, the effect of oxygen on the solubilities of tantalum and niobium metals in liq- uid potassium was evaluated by (1) comparing the values of solubility and heat of solution for tantalum and niobium reported herein with those of other refractory metals, (2) study- ing the solubilities of tantalum and niobium metals in liquid potassium as a function of oxygen concentration in these metals, and (3) analyzing tantalum and niobium crucibles for oxygen content after exposure to potassium.
herein are very high as compared with those of molybdenum and vanadium (refs. 9 and 17). High apparent heats of solution for tantalum (13.9 kcal/mole or 58.2 kJ/mole) and niobium (17.1 kcal/mole or 71.5 kJ/mole) as compared with that of molybdenum (6.7 kcal/mole o r 28.0 kJ/mole), suggest that chemical reactions may have occurred in the solution processes of tantalum and niobium in liquid potassium. further supported by the data presented herein in the following section, Effect of Oxygen. Therefore, I concluded that the tantalum and niobium apparent solubility values pre- sented in figures 3 and 4 were influenced to some extent by the oxygen present in the sys- tems.
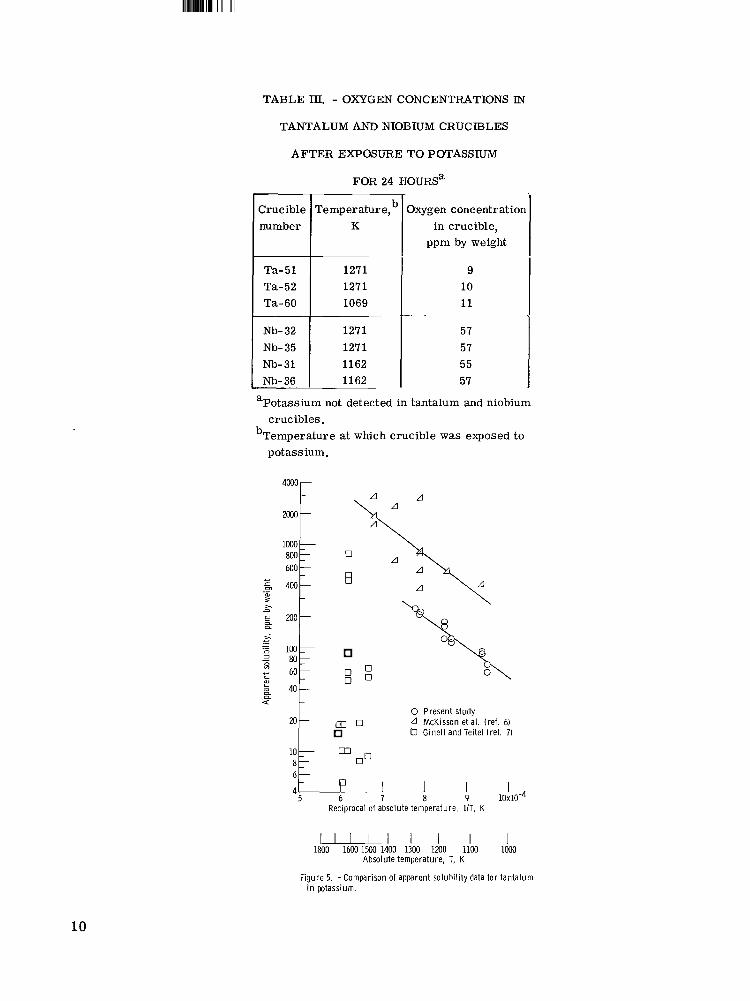
It is not known by how much the oxygen increased the concentrations of tantalum and niobium in liquid potassium; however, I believe that the effect of oxygen was probably small. This may be inferred from the data in tables I and III because the oxygen concen- trations in tantalum and niobium crucibles decreased only slightly after exposure to liq- uid potassium. Consequently, the true solubilities of tantalum and niobium in liquid po- tassium should be somewhat less than the apparent solubilities reported herein for these two metals in potassium between 1055 and 1287 K.
The solubility of tantalum in liquid potassium has previously been studied by McKisson et al. (ref. 6) and by Ginell and Teitel (ref. 7). When these data a r e com- pared with those reported in this study (fig. 5), it is apparent that the data presented herein are significantly lower than those presented in reference 6 and that they show better reproducibility than was observed in either of the previous studies. In refer-
Data reported during the last 5 years have shown that the effect of oxygen on the
The effects of nitrogen and carbon on the solubilities of refractory metals in liq-
The apparent solubility values for tantalum and niobium in liquid potassium reported
This indication is
9
I
111l1111ll1111l1lIIIl I II I I1 I
Crucible number
Ta- 5 1 Ta-52 Ta-60
Nb- 32 Nb- 35 Nb-31 Nb- 36
TABLE JII. - OXYGEN CONCENTRATIONS IN
b Temperature, K
1271 1271 1069
1271 1271 1162 1162
TANTALUM AND NIOBIUM CRUCIBLES
AFTER EXPOSURE TO POTASSIUM
FOR 24 HOURS"
Oxygen concentratior in crucible,
ppm by weight
9 10 11
57 57 55 57
aPotassium not detected in tantalum and niobium
bTemperature at which crucible was exposed to crucibles.
potassium.
Z 4 a a a Q
20
10 8
m u
m 00
0 Present study McKisson et al. (ref. 61
0 Ginell and Teitel (ref. 71
4 1 I I 9 10~10-4 6L 5 6 7 I 8
Reciprocal of absolute temperature, UT, K
U I I I I I 1800 1600 1500 1400 1300 1200 1100 1MX)
Absolute temperature, T, K
Figure 5. - Comparison of apparent solubility data for tantalum in potassium.
10

erence 6, the authors calculated the heat of solution for tantalum to be 13.2 kilocalories per mole (55.2 kJ/mole). Their value for the heat of solution is in good agreement with the calculated heat of solution (13.9 kcal/mole o r 58.2 kJ/mole) reported in this study; however, I cannot offer a definite explanation for the higher apparent solubility values reported by them or for the very high degree of scatter in the data reported by Ginell and Teitel.
(ref. 5), McKisson et al. (ref. 6), and Ginell and Teitel (ref. 7). The comparison be- tween the data reported in this study and those reported by the aforementioned authors is shown in figure 6. It is apparent that the data reported herein and those reported by Gine l l and Teitel show good reproducibility. have extensive scattering.
The solubility values for niobium reported by Ginell and Teitel are very low (fig. 6); however, the heat of solution for niobium in liquid potassium that I calculated from their data is about 54 kilocalories per mole (226 kJ/mole) and not 5.4 kilocalories per mole
The solubility of niobium was previously studied by Cleary, Blecherman, and Corliss
The data reported by the other authors
V
V
V
V A A V
A
0 Present study v Cleary, Blecherman, and Corliss (ref. 5) A McKisson et al. (ref. 6) 0 Ginell and Teitel (ref. 7)
6 I 7 I 8 I I 10?10-4 Reciprocal of absolute temperature, UT, K
11
I
Ill11 lIllll111llllIllllll1lll11llllll1ll I I I I
(22.6 kJ/mole) as reported by these authors. This very high value for the heat of solu- tion for niobium in liquid potassium would indicate a definite chemical reaction, probably involving oxygen. In addition, T cannot explain why Ginell and Teitel could not obtain the same reproducibility in the tantalum solubility data as they did in the niobium solubility data. I observed a strong similarity in the data for tantalum and niobium in liquid potas- sium, On the basis of the generally similar chemical behavior of these group V ele- ments, T believe that the behavior observed in this study is more consistent.
Recently, the solubilities in potassium of tantalum from three tantalum alloys and of niobium from two niobium alloys were studied between 1473 and 1890 K by Eichelberger, McKisson, and Johnson (ref. 10). ment, such as zirconium, hafnium, or titanium, in the refractory metal substantially re - duces the apparent solubility of refractory metal. The effect was attributed to the strong affinity of the gettering element for oxygen.
They calculated that the presence of a gettering ele-
Effect of Oxygen
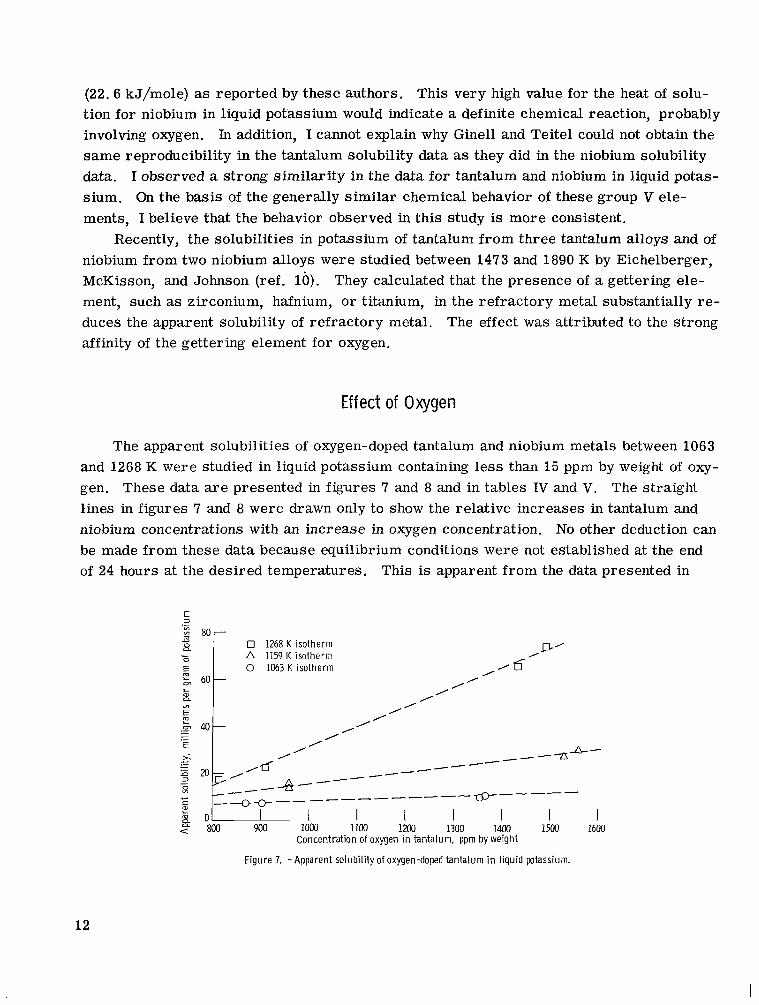
The apparent solubilities of oxygen-doped tantalum and niobium metals between 1063 and 1268 K were studied in liquid potassium containing less than 15 ppm by weight of oxy- gen. The straight kines in figures 7 and 8 were drawn only to show the relative increases in tantalum and niobium concentrations with an increase in oxygen concentration. be made f rom these data because equilibrium conditions were not established at the end of 24 hours at the desired temperatures. This is apparent from the data presented in
These data are presented in figures 7 and 8 and in tables IV and V.
No other deduction can
E 3 .- 2 80 B L 0 A 1159 K isotherm E 0 1063 K isotherm & 60
m c
0 1268 K isotherm P-’ I
06 I m
I0 0 L al P 0
I’ I
I .- /
E I
- - .- &-
c 5 /-/--% ___--- e----- -*+ __--- -----
- 520 - 3 /--
5: --- P O 2 800 900 1000 1100 1203 1300 14(Kl 1500 1600
c
a L m 1 I I I I I
Concentration of oxygen in tantalum, ppm by weight
Figure 7. -Apparent solubil ity of oxygen-doped tantalum in l iquid potassium.
12
35
s .- : 30
B
E 25
a
m c
L 0
E m I aJ
E g .- - - .- E i, c ._ 3 0 v1
c c
-
z 10
P
Q - 0 -
0 1268 K isotherm A 1159 K isotherm 0
I’ 0 1063 K isotherm I”
I I I I I I I I
I’ I’
/&-- I SI’ 4’
/--
//-----
/
A -/-- ’ /-
0 ---- A co-- A- --o---------
-
-
-
20-
15-
-
51 I I I I I I I U 2500 2700 2900 2100 2300 1500 1700 1900 1100 1300
Concentration of oxygen i n niobium, ppm by weight
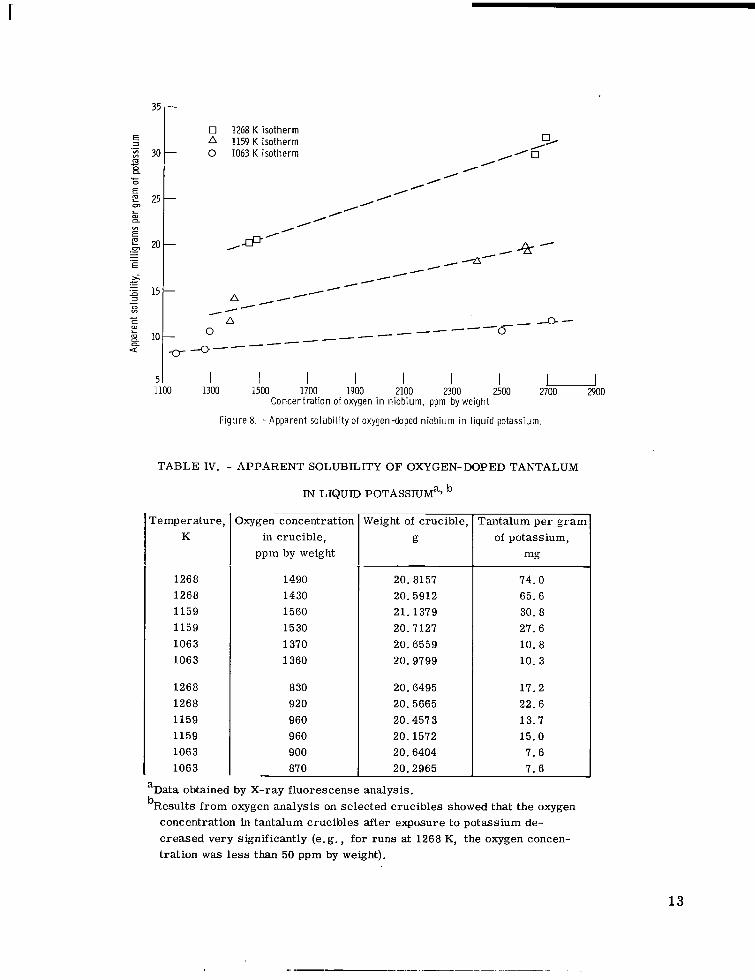
Figure 8. -Apparent solubil ity of oxygen-doped niobium i n l iquid potassium.
TABLE IV. - APPARENT SOLUBILITY OF OXYGEN-DOPED TANTALUM
IN LIQUID POTASSIUM~~
Temperature, K
1268 1268 1159 1159 1063 1063
1268 1268 1159 1159 1063 1063
3xygen concentration in crucible,
ppm by weight
1490 1430 1560 1530 1370 1360
830 920 960 960 900 87 0 - ~__________
Weight of crucible, g
20. 8157 20.5912 21.1379 20.7127 20.6559 20.9799
20.6495 20.5665 20.4573 20.1572 20.6404 20.2965
rantalum per grarr of potassium,
mg
74.0 65.6 30. 8 27.6 10.8 10.3
17.2 22.6 13.7 15.0 7.6 7.6
aData obtained by X-ray fluorescense analysis. bResults f rom oxygen analysis on selected crucibles showed that the oxygen
concentration in tantalum crucibles after exposure t o potassium de- creased very significantly (e. g. , for runs at 1268 K, the oxygen concen- tration was l e s s than 50 ppm by weight).
13

I Ill1111111111 I I I I
TABLE V. - APPARENT SOLUBILITY OF OXYGEN-DOPED
NIOBTUM IN LIQUID POTASSTUM~~
r emp er atur e K
1268 1268 1159 1159 1159 1063 1063
1268 1268 1159 1159 1063 1063 1063
Ixygen concentration in crucible,
ppm by weight
2650 2690 2620 2600 2400 2510 2710
1460 1490 1400 1380 1270 1290 1160
~~
Veight of crucible,
g
10.0662 10.2040 9.9992 9.9247
10.5911 10.0057 10.0495
9.8866 10.5967 10.1105 9.9981
10.3104 10.6234 10.8259 -
Niobium per gran of potassium,
mg
30.0 32.0 19.6 20.0 18.4 10.8 12.1
20.3 20.6 14.2 11.8
8.7 10. 8
8. z - "Data obtained by X-ray fluorescence analysis, bResults f rom oxygen analysis on selected crucibles showed that oxygen
concentration in niobium crucibles after exposure to potassium de- creased very significantly (e. g., for runs at 1268 K, the oxygen con- centration was less than 100 ppm by weight).
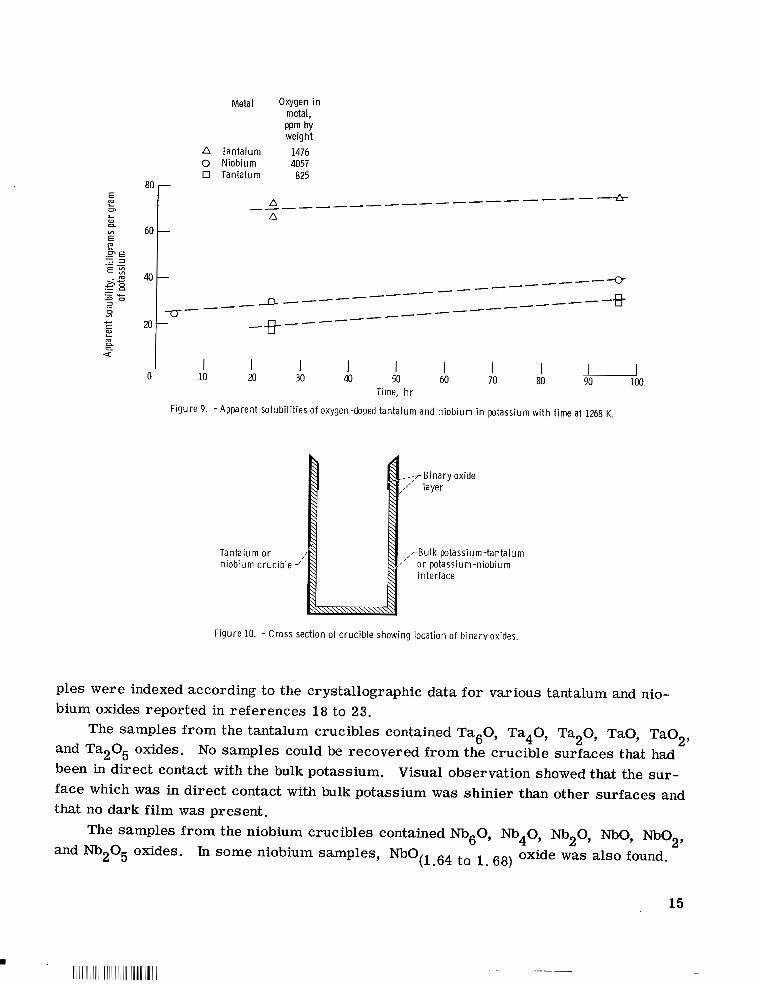
figure 9, which shows that tantalum and niobium concentrations in liquid potassium were increasing with exposure time, even at the end of 90 hours.
be assumed to be due to the diffusion of oxygen from the tantalum and niobium metals. X-ray diffraction patterns were obtained for the tantalum and niobium samples scraped from the inside and outside crucible surfaces that have not been in direct contact with the bulk potassium. The exact locations on the crucibles from which these tantalum and niobium samples were scraped off a r e shown in figure 10. The recovery of samples from the inside and outside crucible surfaces is described in appendix B. The tantalum sam- ples were recovered from the surfaces of tantalum crucibles that had been doped to oxy- gen levels between 790 and 2170 ppm by weight and exposed to potassium at temperatures from 1063 to 1328 K for 13 to 96 hours. The niobium samples were recovered from the surfaces of niobium crucibles that had been doped to oxygen levels between 1300 and 4280 ppm by weight and exposed to potassium at temperatures from 1063 to 1328 K for 24 hours. The X-ray diffraction patterns obtained for these tantalum and niobium sam-
The increases in the concentrations of tantalum and niobium in liquid potassium must
14
80 E 2
0
Metal O W e n in metal, PPm by weight
A Tantalum 1476 0 Niobium 4057 0 Tantalum 825
-
A n
_ _ _ _ _ _ _ _ c _ _ _ _ _ _ _ _ _ _ --*
100 I
90 I
80 I
70 I
60 I
50 I
40 I
30 I
20 I
10 Time, hr
Figure 9. -Apparent solubi l i t ies of oxygen-doped tantalum and niobium in potassium with time at 1268 K.
Tantalum o r niobium crucible
_+-Binary oxide ,,‘ layer
, rBulk potassium-tantalum J ’ o r potassium-niobium
interface
Figure 10. -Cross section of crucible showing location of binaryoxides.
ples were indexed according to the crystallographic data for various tantalum and nio- bium oxides reported in references 18 to 23.
and Ta205 oxides. been in direct contact with the bulk potassium. face which was in direct contact with bulk potassium was shinier than other surfaces and that no dark film was present.
The samples from the niobium crucibles contained Nb60, Nb40, Nb20, NbO, Nb02, and Nb205 oxides. T i some niobium samples, NbO(1.64 to
The samples from the tantalum crucibles contained Ta60, Ta40, Ta20, TaO, Ta02, No samples could be recovered from the crucible surfaces that had
Visual observation showed that the sur-
6s) oxide was also found.
15
I1 IIIII Ill1 I I l l I IIIIIII I I I Ill llllIl1l111 IIIIII I .. . . . . . ... -
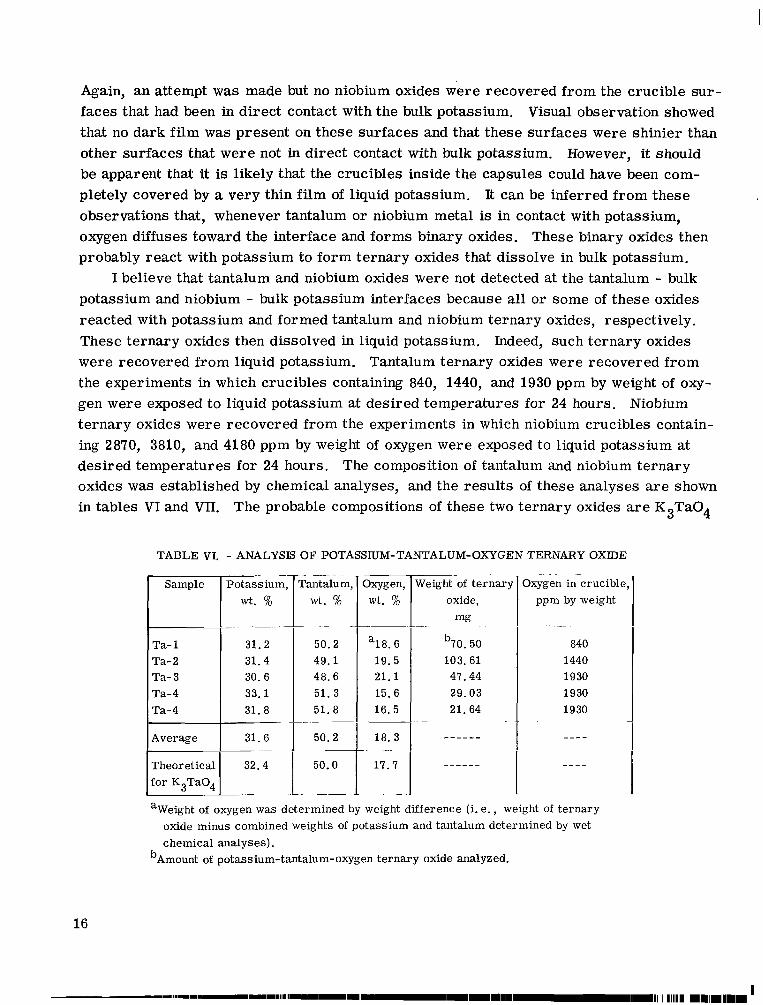
Again, an attempt was made but no niobium oxides were recovered from the crucible sur- faces that had been in direct contact with the bulk potassium. Visual observation showed that no dark film was present on these surfaces and that these surfaces were shinier than other surfaces that were not in direct contact with bulk potassium. However, it should be apparent that it is likely that the crucibles inside the capsules could have been com- pletely covered by a very thin film of liquid potassium. It can be inferred from these observations that, whenever tantalum o r niobium metal is in contact with potassium, oxygen diffuses toward the interface and forms binary oxides. These binary oxides then probably react with potassium to form ternary oxides that dissolve in bulk potassium.
I believe that tantalum and niobium oxides were not detected at the tantalum - bulk potassium and niobium - bulk potassium interfaces because all o r some of these oxides reacted with potassium and formed tantalum and niobium ternary oxides, respectively. These ternary oxides then dissolved in liquid potassium. Indeed, such ternary oxides were recovered from liquid potassium. Tantalum ternary oxides were recovered from the experiments in which crucibles containing 840, 1440, and 1930 ppm by weight of oxy- gen were exposed to liquid potassium at desired temperatures for 24 hours. Niobium ternary oxides were recovered from the experiments in which niobium crucibles contain- ing 2870, 3810, and 4180 ppm by weight of oxygen were exposed to liquid potassium at desired temperatures for 24 hours. The composition of tantalum and niobium ternary oxides was established by chemical analyses, and the results of these analyses a r e shown in tables VI and VTT. The probable compositions of these two ternary oxides are K3Ta04
TABLE VI. - ANALYSIS OF POTASSIUM-TANTALUM-OXYGEN TERNARY OXlDE
Sample
Ta- 1 Ta- 2 Ta- 3 Ta-4 Ta- 4
Average
Theoretical for K3Ta04
- .. - ~
Potassium wt. %
-. ~
31.2 31.4 30.6 33.1 31. a
~
31.6
32.4 __ _ _ ~
~
-
rantalum, wt. %
_ _ _ _ .
50.2 49.1
51. 3 48.6
51. a _ - ~
50.2
50.0 __
-
“18.6 19.5 21.1 15.6 16.5
18. 3
17.7 .
~
Weight of ternary oxide,
mg
b70. 50 103.61 47.44 29.03 21.64
-.
._
.
Oxygen in crucible, ppm by weight
a40 1440 1930 1930 1930
__- -
“Weight of oxygen was determined by weight difference (i. e. , weight of ternary oxide minus combined weights of potassium and tantalum determined by wet chemical analyses).
bAmount of potassium-tantalum-oxygen ternary oxide analyzed.
16
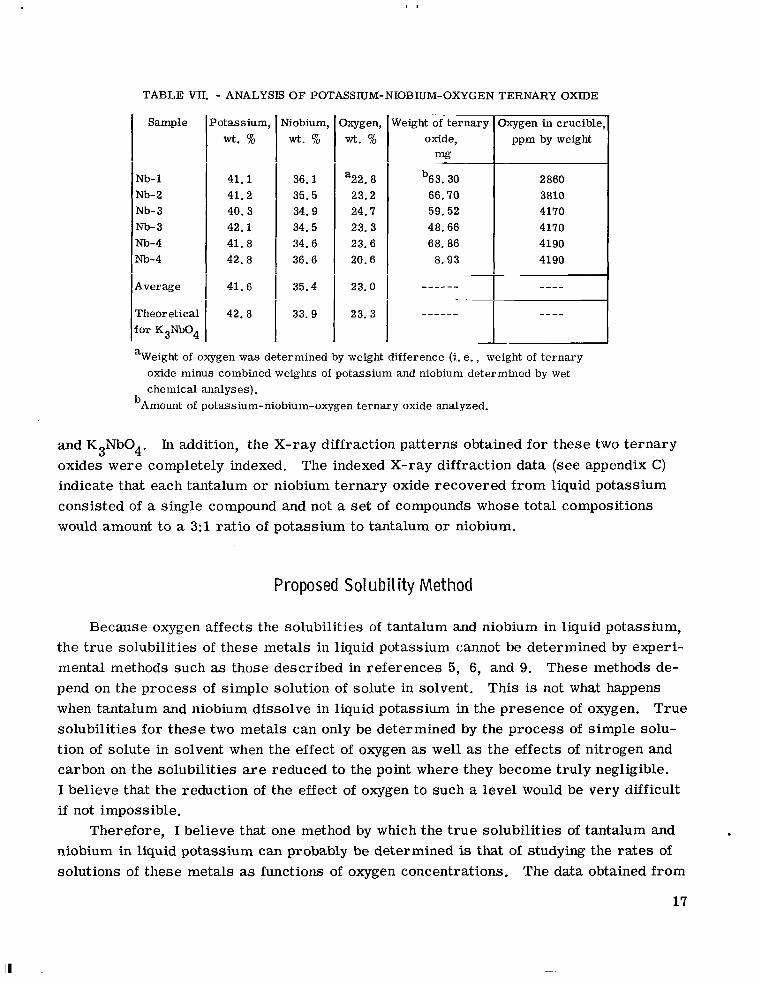
TABLE VII. - ANALYSIS OF POTASSIUM-NIOBIUM-OXYGEN TERNARY OXIDE
Sample
Nb- 1 m- 2 Nb- 3 Nb- 3 Nb-4 Nb-4
Average
Theoretical for K3Nb04
I
? ot as s ium, wt. %
41.1 41.2 40.3 42.1 41.8 42. 8
41.6
42.8
Viobium, wt. %
36.1 35.5 34.9 34.5 34.6 36.6
35.4
33. 9
%!Zen, wt. %
'22.8 23.2 24.7 23. 3 23.6 20.6
23.0
23. 3
Weight of oxygen was determined by weight difference (i. e., weight of ternary oxide minus combined weights of potassium and niobium determined by wet chemical analyses).
a
bAmount of potassium-niobium-oxygen ternary oxide analyzed.
and K3Nb04. oxides were completely indexed. The indexed X-ray diffraction data (see appendix C) indicate that each tantalum or niobium ternary oxide recovered from liquid potassium consisted of a single compound and not a set of compounds whose total compositions would amount to a 3:l ratio of potassium to tantalum o r niobium.
Tn addition, the X-ray diffraction patterns obtained for these two ternary
Proposed Solubility Method
Because oxygen affects the solubilities of tantalum and niobium in liquid potassium, the true solubilities of these metals in liquid potassium cannot be determined by experi- mental methods such as those described in references 5, 6, and 9. These methods de- pend on the process of simple solution of solute in solvent. when tantalum and niobium dissolve in liquid potassium in the presence of oxygen. True solubilities for these two metals can only be determined by the process of simple solu- tion of solute in solvent when the effect of oxygen as well as the effects of nitrogen and carbon on the solubilities are reduced to the point where they become truly negligible. I believe that the reduction of the effect of oxygen to such a level would be very difficult if not impossible.
Therefore, I believe that one method by which the t rue solubilities of tantalum and niobium in liquid potassium can probably be determined is that of studying the rates of solutions of these metals as functions of oxygen concentrations.
This is not what happens
The data obtained from
17
I I llll111l1l1111l11lllIl I I I I
Oxygen concen- trat ion
Time, t
Temper- a ture
Time, hr Oxygen concentration
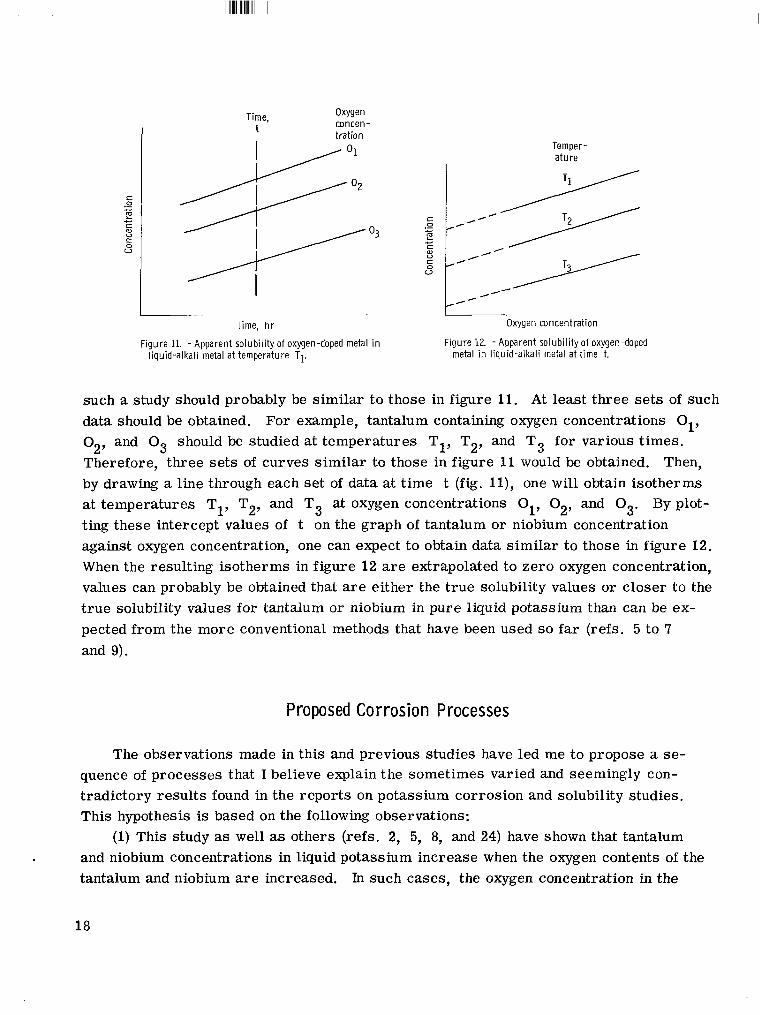
Figure 11. -Apparent solubi l i ty of oxygen-doped metal in Figure 12. -Apparent solubi l i ty of oxygen-doped liquid-alkali metal at temperature T1. metal in liquid-alkali metal at t ime t.
such a study should probably be similar t o those in figure 11. At least three sets of such data should be obtained. For example, tantalum containing oxygen concentrations 01, 02, and O3 should be studied at temperatures T1, T2, and T3 for various times. Therefore, three se t s of curves similar to those in figure 11 would be obtained. Then, by drawing a line through each set of data at time t ( f ig . ll), one will obtain isotherms at temperatures T1, T2, and T3 at oxygen concentrations 0 02, and 03. By plot- ting these intercept values of t on the graph of tantalum or niobium concentration against oxygen concentration, one can expect to obtain data similar to those in figure 12. When the resulting isotherms in figure 12 a r e extrapolated to zero oxygen concentration, values can probably be obtained that a r e either the t rue solubility values or closer to the t rue solubility values for tantalum o r niobium in pure liquid potassium than can be ex- pected from the more conventional methods that have been used s o far (refs. 5 to 7 and 9).
1’
Proposed Corrosion Processes
The observations made in this and previous studies have led me to propose a se- quence of processes that I believe explain the sometimes varied and seemingly con- tradictory results found in the reports on potassium corrosion and solubility studies. This hypothesis is based on the following observations:
(1) This study as well as others (refs. 2, 5, 8, and 24) have shown that tantalum and niobium concentrations in liquid potassium increase when the oxygen contents of the tantalum and niobium are increased. In such cases, the oxygen concentration in the
18
tantalum and niobium metals has been reduced. (2) In a like manner, when oxygen concentration in the potassium is increased, con-
centrations of tantalum and niobium in liquid potassium increase (refs. 2 and 24). (3) Tantalum and niobium ternary oxides have been recovered from the liquid potas-
sium (this study and ref. 8). (4) Tantalum and niobium binary oxides have been recovered from the metal surfaces
after exposure to potassium at high temperatures (this study and ref. 2). The observations stated in points 1, 2, and 3 suggest, as has been previously pro-
posed, that tantalum (or niobium), potassium, and oxygen somehow react at the metal- liquid interface to form a ternary oxide that dissolves in the potassium. The only thermodynamic requirement for such a reaction is that the free energy of formation for the ternary oxide be more negative than either of the binary oxides.
exposure to potassium injects an apparent thermodynamic anomaly that must be ex- plained. It is apparent from points 1, 2, and 3 that oxygen must diffuse both within the solid metal and within the liquid potassium toward the solid-liquid interface. The pro- posed lower free energy of formation for the ternary oxide can explain this increase in the concentration of tantalum or niobium in liquid potassium, but it cannot explain the presence of tantalum or niobium binary oxides. Furthermore, on the basis of f ree en- ergies of formation for tantalum, niobium, and potassium oxides and/or the free energy of oxygen solution in these metals (refs. 2, 25, and 26), oxygen should not diffuse out of tantalum or niobium toward the interface.
However, the presence of a binary oxide on the surface of tantalum or niobium after
I propose that the real driving force is provided, not by the low free energies of for- mation for the ternary oxides, but by the lowering of the free energies of formation for the tantalum and niobium binary oxides at the interface. at the interface is due to a surface interaction energy at the tantalum- or niobium- potassium interface. with potassium to form ternary oxides at the interface. 1 iquid pot ass iu m.
niobium in potassium in the presence of oxygen can probably be described by this se- quence of events. Immediately on exposure of tantalum or niobium to potassium, the interaction at the interface between tantalum (or niobium) and potassium lowers the free energy of formation of the tantalum oxides (or niobium oxides), thus setting up oxygen activity gradients within the tantalum (or niobium) and potassium. These activity gra- dients are the driving force for oxygen diffusion toward the interface. On arrival at the interface, the oxygen combines with tantalum or niobium to form a tantalum or niobium binary oxide. These binary oxides then probably react with potassium, and possibly with additional oxygen arriving at the interface, to form the ternary oxides. The ternary
This lowering of f ree energies
Therefore, the binary oxides are formed first, and then they react Ternary oxides then dissolve in
Therefore, it is proposed that the corrosion (or apparent solubility) of tantalum or
19
oxide then dissolves in liquid potassium, thereby preventing its accumulation at the interface. or niobium oxides could be expected, which should result in a layered sequence of oxides typical of a metal-oxygen diffusion couple. Effective removal of these oxides could not be accomplished since there was no bulk potassium with which they could react. Indeed, as pointed out in this study in the section Effect of Oxygen, tantalum and niobium oxides of various stoichiometries have been recovered.
In locations where there is no bulk liquid potassium, a buildup of tantalum
The basic requirement for this sequence to occur would be a lowering of the free energies of formation of tantalum o r niobium oxides at the tantalum- or niobium- potassium interface due to an interaction of tantalum or niobium with potassium. Unfor- tunately, this interaction energy at the tantalum- o r niobium-potassium interface cannot be calculated because no surface tension data a r e known to be available for these two systems. Such an interaction could satisfactorily account for the diffusion of oxygen out of potassium and tantalum or niobium toward the interface. The recovery of tantalum and niobium oxides from the crucible surfaces and also the recovery of tantalum and niobium ternary oxides from potassium tend to suggest that elemental or ionic oxygen in these metals was probably not transferred directly to the potassium. Oxygen probably is transferred to potassium as a part of a compound that is formed at the interface and then is dissolved in potassium.
CONCLUDING REMARKS
The apparent solubilities and the effect of oxygen on the apparent solubilities of tan- talum (Ta) and niobium (Nb) were studied between 1055 and 1287 K in liquid potassium. The potassium used in all the experiments performed in this study contained less than 15 ppm by weight of oxygen.
The true solubilities of tantalum and niobium in liquid potassium cannot be deter- mined by experimental methods that depend on the process of simple solution of solute in solvent. Therefore, I was only able to obtain the apparent solubility values for tanta- lum and niobium in liquid potassium. However, I believe that the oxygen effect on the apparent solubility values reported herein was small. Therefore, the true solubility values for tantalum and niobium in liquid potassium should be somewhat lower than those reported in this study. and 1287 K can be represented by the relations: log wt ppm Ta = (4. 7 5 4 . 2 4 ) - (3048*276)/T and log wt ppm Nb = ( 5 . 2 3 4 . 3 0 ) - (3739&343)/T, respectively. parent heats of solution for tantalum and niobium in liquid potassium are 1 3 . 9 4 . 3 and 17. l k l . 6 kilocalories per mole (58 .2 and 7 1 . 5 kJ/mole), respectively.
The apparent solubilities of tantalum and niobium between 1055
The ap-
Tantalum and niobium concentrations in liquid potassium increase with the increase
20
of oxygen concentrations in these two metals. the following sequence of events to explain the observations reported herein and those previously reported by others: (a) the diffusion of oxygen out of tantalum and niobium metals and potassium toward the tantalum- and niobium-potassium interfaces, (b) the formation of tantalum and niobium binary oxides at the interface, (c) the reaction of these binary oxides with potassium to form ternary oxides, and (d) the dissolution of these ternary oxides in liquid potassium.
were not in contact with bulk liquid potassium. Tantalum and niobium ternary oxides were recovered from liquid potassium and identified by chemical analyses to be K3Ta04 and K3Nb04, respectively. were completely indexed.
lum and niobium in liquid potassium is that of studying the kinetics of the solution as a function of oxygen concent rat ion.
From the available data, I have inferred
Tantalum and niobium binary oxides were recovered from the metal surfaces that
X-ray diffraction patterns for both of these ternary oxides
I believe that a more accurate method of obtaining the true solubility data for tanta-
Lewis Research Center, National Aeronautics and Space Administration,
Cleveland, Ohio, April 21, 1970, 129-03.
21
I 1 I lIIllll1lll1ll1lll11 Ill1 I1 1111 Ill I1 I I
APPENDIX A
PREPARATION OF CRUCIBLES AND CAPSULES
The tantalum and niobium crucibles and nickel capsules were ultrasonically cleaned in a fluorinated hydrocarbon and then ultrasonically cleaned in a detergent. Subsequent cleaning procedures for crucibles or capsules of each metal were different and are de- scribed in the following sections.
Tantalum
Tantalum crucibles, after being rinsed with distilled water, were etched for 2 to The etchant solution was 55 parts concentrated sul-
Finally, the crucibles were rinsed several times with dis-
5 seconds at room temperature. furic acid, 25 parts of 70-percent-by-weight nitric acid, and 20 parts of 49-percent-b~- weight hydrofluoric acid. tilled water and dried under vacuum.
N iobi u m
Niobium crucibles, after being rinsed with distilled water, were placed into 49- percent-by-weight hydrofluoric acid for 2 to 5 minutes at room temperature until the metal started to wet. The crucibles were then etched for 1 to 2 minutes at room tem- perature. The etchant solution was 20 parts of 49-percent-by-weight hydrofluoric acid, 20 parts of 70-percent-by-weight nitric acid, and 60 parts distilled water. Finally, the crucibles were rinsed several times with distilled water and dried under vacuum.
Nickel
Nickel capsules, after being rinsed several times with distilled water, were etched at 363 K for 1/2 to 1 minute. The etchant solution was 30 parts of 70-percent-by-weight nitric acid, 10 parts of concentrated orthophosphoric acid, 10 parts of concentrated sul- furic acid, and 50 parts of glacial acetic acid. The capsules were rinsed several times with distilled water and dried under vacuum.
22
APPENDIX B
RECOVERY OF OXIDE FILM SAMPLES FROM SURFACES OF OXYGEN-
DOPED CRUCIBLES AFTER TESTING
Samples for X-ray diffraction analyses were recovered from outside and inside sur - faces of tantalum and niobium crucibles. These surfaces had not been in contact with bulk liquid potassium during testing. When the capsules were opened, the crucibles were removed and placed in absolute ethyl alcohol for about 5 minutes. Only crucibles that contained little or no potassium, as confirmed by the presence of little or no reac- tion with absolute ethyl alcohol, were used for oxide film recovery.
The crucibles were then transferred to glass vials containing distilled water and were left there for 30 to 40 minutes to dissolve any potassium tantalate or potassium niobate that might have been present on the walls of the crucibles. rinsed several times with distilled water and again put into vials containing absolute ethyl alcohol. After about a 30-minute soaking, the crucibles were rinsed several t imes with absolute ethyl alcohol and then several times with acetone.
The result- ing samples were put into X-ray capillary tubes, and X-ray diffraction patterns were ob- tained using Cu K O radiation.
The crucibles were
The outer and inner walls of the crucibles were scraped with a spatula.
23
APPENDIX C
CRYSTALLOGRAPHIC MODIFICATIONS OF K3Ta04 AND K3Nb04
Tantalum and niobium ternary oxides were prepared by exposing oxygen-doped tan- talum and niobium metals to potassium at desired temperatures for 24 hours. The ter- nary'oxides were separated from excess potassium at 598 K in a product separation ap- paratus described by Gahn (ref. 15). The composition of these ternary oxides was determined by chemical analyses, and the data a r e presented in tables VI and VII. The recovered tantalum and niobium ternary oxides were K3Ta04 and K3Nb04, respectively. The same ternary oxide for tantalum was recovered from potassium by Hickam (ref. 8). Hickam also obtained an X-ray diffraction pattern but did not index it. This pattern is in very good agreement with the X-ray diffraction data obtained in this study (table VI@. Tantalum ternary oxide (K3Ta04) was previously also prepared by Reisman et al. (ref. 27) in a differential thermogravimetric apparatus. Their partial and un-indexed X-ray diffraction data for M3Ta04 a r e in very good agreement with the data obtained in this study (table VIII). Niobium ternary oxide (K3Nb04) was previously prepared by Guerchais in a thermogravimetric apparatus (ref. 28). X-ray diffraction data a r e also in very good agreement with the data obtained in this study (table IX).
Although all these workers reported tantalum or niobium ternary oxides, they did not index their X-ray diffraction patterns in order to establish that their X-ray data were obtained for pure compounds. It is possible that two or more ternary oxides o r even potassium oxide and tantalum o r niobium oxides could be present in such a ratio that the results of chemical analyses would tend to confirm a 3:l ratio of potassium to tantalum o r potassium to niobium found in K3Ta04 or K3Nb04. It is because of this uncertainty that I have decided to index the X-ray diffraction data obtained in this study.
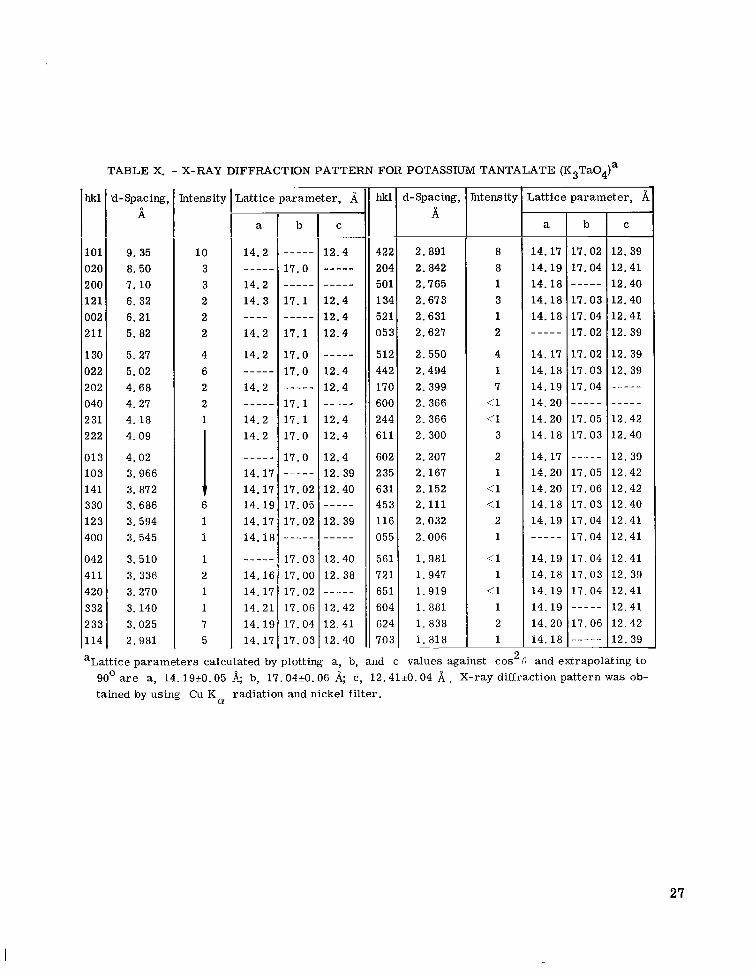
The X-ray diffraction data obtained in this study for tantalum and niobium ternary oxides were indexed by the Hesse-Lipson procedure and also by Ito's methods (ref. 29). The indexed X-ray diffraction data are presented in tables X and XI. All experimental d-spacing values for K3Ta04 and K3Nb04 were indexed. Both of these ternary oxides belong to the orthorhombic system. The lattice parameter values for K3Ta04 are a, 14.1950.05 A; b, 17.04+0.06 A; and c, 12.4150.04 8. for K3Nb04 a r e a, 12.0550.04 A; b, 14.3450.05 A; and c, 10.50kO. 03 A.
for tantalum and niobium recovered in this study can be considered to be single com- pounds that probably contain minor amounts of impurities that were not detected. further safely be assumed that the X-ray diffraction data reported in references 8, 26, and 27 were also single compounds with minor amounts of impurities.
These partial and un-indexed
The lattice parameter values
On the basis of the complete indexing of X-ray diffraction data, the ternary oxides
It can
24

TABLE Vm. - COMPARISON OF X-RAY DIFFRACTION
PATTERNS FOR TANTALUM TERNARY OXIDE (K3Ta04)
resent study Hickam (ref. 8) 1 Reisman et al. (ref. 27
Interplanar distance, d, A I ’
9.35 8. 50 7.10 6.32 6 . 2 1
5. 82 5.27 5.02 4.68 4.27
4 . 1 8 4 .09 4.02 3.966 3. 872
3.686 3.594 3.545 3.510 3. 336
3.270 3.140 3.025 2.981 2.891
2.842 2.765 2.673 2.631 2.627
2.550 2.494 2.399 2.366 2.300
2.207 2.167 2.152 2.111 2.032
2.006 1.981 1.947 1.919
al. 881 _----
_ _ _ _ - 2.56 2.48 2.40
2.27
2.22 2.17 _ _ _ _ _ 2.12 2.07
2.01 1.992 1.951 1.920 1.897
bl. 883
__-- 6. 36 6.10
5. 96 5. 32 5 .03 4.61 4.27
4.13 __-- 4.02 3. 92
3.73
3. 54
_ _ - -
_ - - - _ _ _ _ 3. 18 3.06 2.99 2.88
2. 81 __- -
2. 56
2.40
aplus many additional l ines below 1.881 A. bPlus 70 additional lines below 1. 883
25
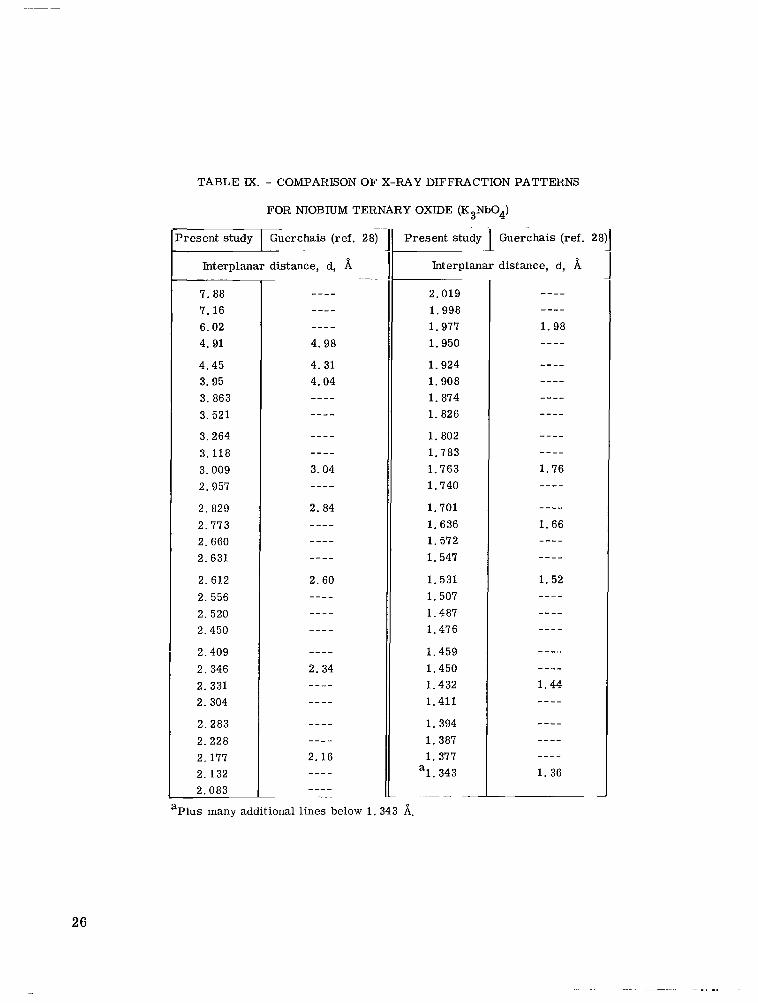
TABLE M. - COMPAREON OF X-RAY DIFFRACTION PATTERNS
FOR NIOBIUM TERNARY OXIDE (K3Nb04) . . ~
W s t u d y T e r c h a i s (ref. 28)
Interplanar distance, d, A ~.
7.88 7.16 6.02 4.91
4.45 3.95 3.863 3.521
3.264 3. 118 3.009 2.957
2. 829 2.773 2. 660 2.631
2.612 2. 556 2.520 2.450
2.409 2. 346 2. 331 2.304
2.283 2.228 2.177 2.132 2.083
Present study I Guerchais (ref. 2t I
Interplanar distance, d, h
aPlus many additional lines below 1. 343 A,
2.019 1.998 1.977 1.950
1.924 1.908 1.874 1.826
1.802 1.783 1.763 1.740
1.701 1.636 1.572 1.547
1.531 1.507 1.487 1.476
1.459 1.450 1.432 1.411
1.394 1.387 1.377 1.343 a
~- ~
26
hkl
101 020 200 121 002 211
130 022 202 040 2 31 222
013 103 141 3 30 123 400
042 411 420 332 233 114
’ABLE X. - X-RAY DIFFRACTION PATTERN FOR POTASSIUM TANTALATE (K3Ta04)’
d-Spacing, b
9.35 8. 50 7.10 6. 32 6.21 5.82
5.27 5.02 4.68 4.27 4.18 4.09
4.02 3.966 3.872 3.686 3.594 3.545
3.510 3.336 3.270 3.140 3.025 2.981
htensity
10 3 3 2 2 2
4 6 2 2 1
6 1 1 i
1 2 1 1 7 5
Lattice parameter, ;i
a
14.2 ----- 14.2 14. 3 _ _ _ _ 14.2
14.2 -_--- 14.2 -__ - - 14.2 14.2
_ _ _ _ - 14.17 14.17 14.19 14.17 14. € E
-_ -_- 14. l e 14.17 14.21 14.19 14.17
- b
_ _ _ _ _ 17.0 _-_-- 17.1 _-_-- 17.1
17.0 17.0 ----- 17.1 17.1 17.0
17.0 ----- 17.02 17.05 17.02 _ _ _ _ _ 17.03 17.00 17.02 17.06 17.04 17.03
C
12.4 ----- ____- 12.4 12.4 12.4
-___- 12.4 12.4
12.4 12.4
12.4 12.39 12.40
12.39
_ _ _ _ -
_ _ _ _ _
_ _ _ _ _ 12.40 12.38 _ _ _ _ _ 12.42 12.41 12.40
-
hkl
~
422 204 501 134 521 053
512 442 170 600 244 611
602 235 631 453 1 1 6 055
561 721 651 604 624 703
~
d- Spac ing, ii
2.891 2.842 2.765 2.673 2.631 2.627
2.550 2.494 2.399 2. 366 2. 366 2. 300
2.207 2.167 2.152 2.111 2.032 2.006
1.981 1.947 1.919 1. 881 1.838 i. 818
htensity
8 8 1 3 1 2
4 1 7
(1 (1
3
2 1
(1 <1
2 1
<1 1
<1 1 2 1
2 aLattice parameters calculated by plotting a, b, and c values against cos
Lattice parameter, ii
a
14.17 14.19 14.18 14.18 14.18 _ _ _ _ _ 14.17 14.18 14.19 14.20 14.20 14.18
14.17 14.20 14.20 14.18 14.19 _ _ _ _ _ 14.19 14.18 14.19 14.19 14.20 14.18
b
17.02 17.04 ----- 17.03 17.04 17.02
17.02 17.03 17.04 _ _ _ _ _ 17.05 17.03
_ _ _ _ _ 17.05 17.06 17.03 17.04 17.04
17.04 17.03 17.04 _ _ _ _ _ 17.06 __-- -
C
12.39 12.41 12.40 12.40 12.41 12.39
12.39 12.39 __-- - _ _ _ _ _ 12.42 12.40
12.39 12.42 12.42 12.40 12.41 12.41
12.41 12.39 12.41 12.41 12.42 12.39
and extrapolating to 90’ a r e a, 14.1910.05 A; b, 17.04+0.06 A; c, 12.41+0.04 A . X-ray diffraction pattern was ob- tained by using CLI K radiation and nickel f i l ter . a
27
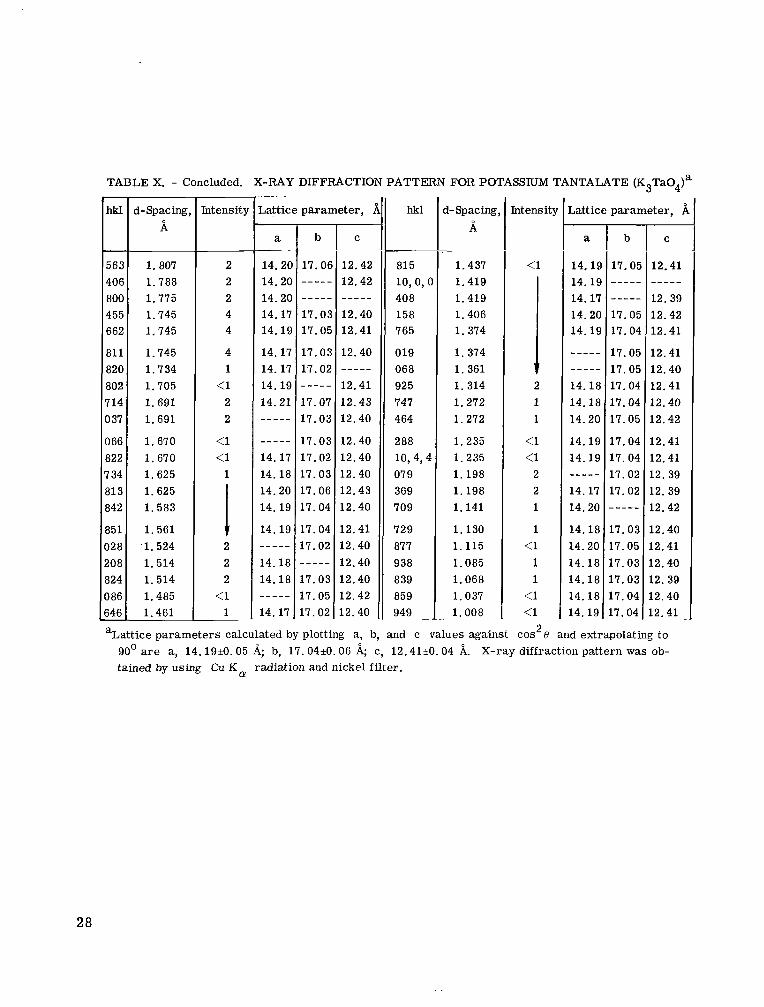
TABLE X. - Concluded. X-RAY DIFFRACTION PATTERN FOR POTASSTUM TANTALATE (K3Ta04)a - hkl
- 56: 402 80C 45E 66.2
811 82C 802 714 137
I66 522 7 34 31 3 342
351 128 308 324 186 346 -
d-Spacing A
1.807 1.788 1.775 1.745 1.745
1.745 1.734 1.705 1.691 1.691
1.670 1.670 1.625 1.625 1.583
1.561 .l. 524 1.514 1.514 1.485 1.461
htensi
2 2 2 4 4
4 1
<1 2 2
<1 <1
1
2 1 2 2
<1 1
~~ ~
Jattice parameter, I - a
14.21 14.2C 14.2C 14.17 14.15
14.17 14.17 14.19 14.21 _---- _---- 14.17 14.18 14.20 14. 19
14.19
14.18 14.18
14. 17
- b
17. Oe ----- - - -__ 17.03 17.05
17.03 17.02 _-- -_ 17.07 17.03
17.03 17.02 17.03 17.06 17.04
17.04 17.02 ___-_ 17.03 17.05 17.02
C
12,42 12.42 ----- 12.40 12.41
12.40 ----- 12.41 12.43 12.40
12.40 12.40 12.40 12.43 12.40
12.41 12.40 12.40 12.40 12.42 12.40
hkl
81 5 10,0, ( 408 158 765
019 068 925 747 464
288 10,4,4 07 9 369 709
729 877 938 839 859 949 -
d-Spacing A
1.437 1.419 1.419 1.406 1.374
1.374 1.361 1.314 1.272 1.272
1.235 1.235 1.198 1.198 1.141
1.130 1.115 1.085 1.068 1.037 1.008
k a t t i c e parameters calculated by plotting a, b, and c values against
htensi t j ,attice parameter, i - a
14. l! 14.16 14.15 14.2C 14. l h
----- - _ _ _ _ 14.1E 14.18 14.20
14.19 14.19 _---- 14.17 14.20
14.18 14.20 14.18 14.18 14.18 14.19
- b
17, OE ----_ ----- 17.05 17.04
17.05 17.05 17.04 17.04 17.05
17.04 17.04 17.02 17.02
.7.03
.7.05
.7.03
.7.03
.7.04 7.04
C
12.41
12.39 12.42 12.41
12.41 12.40 12.41 12.40 12.42
12.41 12.41 12.39 12.39 12.42
12.40 12.41 12.40 12.39 12.40 12.41
_ _ _ _ _
2 cos B and extrapolating to 90' are a, 14.19iO. 05 A; b, 17.04iO. 06 8; c, 12.41i0.04 8. tained by using Cu K O radiation and nickel filter.
X-ray diffraction pattern was ob-
28
. .

-
hkl
-
101 020 200 211 130 202
310 231 141 312 400 042
033 420 242 004 402 233
114 424 204 501 350 -
b
----- 14.3 ----- 14.3 14.4 _---_
14.33 14. 31 14.33 14. 36 - - - - -
14. 32
14.36 14.31 14. 35 _---- - -_-- 14.33
14.30 14. 31 -_ -__ ----- 14.32
TABLE XI. - X-RAY DIFFRACTION PATTERN FOR POTASSIUM NIOBATE (K3Nb04)a
C
10.5 ----- ----- 10.5 ----- 10.5 ----- 12.49 10.50 10.52 - - - - - 10.49
10.52 ----- 10.52 10.52 I O . 50 10.50
10.48 10.49 10.51 10.50 -----
d-Spacing, htensi ty
7.88 7.16 6.02 4.91 4.45 3.95
3.863 3.521 3.264 3.118 3.009 2.957
2.829 2.773 2.660 2.631 2.612 2.556
2.520 2.450 2.409 2.346 2. 331
10 5 2 6 2 1
4 2 6 6
10 10
5 3 2 4 3 1
(1 2 3 3 3
Lattice parameter, ii 11 hkl a
12.0
12.0 12.0 12.1 12.0
12.04 12.03 12.04 12.06 12.04
-----
_ _ _ _ _ - -___
12.03 12.06 --_-- 12.04 12.04
12.02 12.02 12.05 12.03 12.03
440 224 521 062 352 253
170 244 3 34 404 611 0 35
424 602 631 325 453 514
552 026 701 226 046
~
1-Spacing, ii
2.304 2.283 2.228 2.177 2.132 2.083
2.019 1.998 1.998 1.977 1.950 1.924
1.908 1. 874 1.826 1. 802 1.783 1.763
1.740 1.701 1.701 1.636 1.572
Intensity
2 3 7 2 1 3
1 1 1 4 2 1
2
6 I 1
1 3 3 2 3
~
n
Lattice parameter, A
a
12.04 12.05 12.03 ----- 12.04 12.05
12.05 12.05 12.05 12.03 €2.03 - _ _ _ _
12.05 12.04 12.07 12.05 12.02 12.06
12.04 _ _ _ _ _ 12.07 12.04 - _ _ _ _
b
14.33 14.34 14.32 14.35 14.34 14.35
14. 34 14.33 14. 34 ----- 14.31 14.34
14.35 ----_ 14.36 14.34 14. 31 14.35
14.34 14. 34 -_---
14.33 14. 32 -
C
----- 10.51 10.49 10.51 10.50 10.51
----- 10.50 10.51 10.50 €0.49 10.51
10.50 10.50 10.52 10.50 10.49 10.51
10.50 10.51 10.52 10.50 10.49
"Lattice parameters calculated by plotting a, b, and c values against cos"8 and extrapolating to 90' a r e a, 12.05*0.04 h; b, 14. 34iO. 05 h; c, 10.50iO.03 A. X-ray diffraction pattern was obtained by using Cu K a radiation and nickel filter.
29

I IIIlllll1llll11l I
30
TABLE XI. - Concluded. X-RAY DIFFRACTION PATTERN FOR POTASSIUM NIOBATE (K3Nb04)a - hkl
- 7 32 70: 741 80C 554
722 65 2 455 820 750
644 127 545 0 37 831
066 724 466 635 840
7 34 5 1 3 342 35 1 564 304 118 -
+Spacing 4
1.547 1.547 1.531 1.507 1.507
1.507 1.487 1.476 1.476 1.476
1.459 1.459 1.450 1.432 1.423
1.411 1.411 1.394 1.387 1.387
1.377 1.377 1.343 1.322 1.322 1.306 1.300
kitensit ~~
Lattice parameter,
a
12.01 12.0' 12.0: 12.01 12.0:
12.0: 12.0: 12.04 12. o i 12.0:
12. Of 12.0: 12. Of
12.04
-----
----- 12.05 12.04 12.02 12.04
12.04 12.05 12.05 12.04 12.01 12.04 12.04
b
14.31
14.3(
14. 31
14. 31 14. 3; 12.3: 14. 3€ 14. 34
14. 35 14. 34 14.37 14.35 14. 35
14. 33 14. 34 14. 33 14. 32 14. 33
14.33 14. 34 14. 34 !4.34 .4.29
----_
.2.34
_=i__
C
10.51 10.53 10.48
10.49
10.48 10.49 LO. 50
-----
_---- _----
LO. 52 LO. 51 LO. 52 LO. 5 1 LO. 5 1
10. 50 .O. 51 .O. 50 .o. 49
0.50 0.51 0.51 0.50 0.47 0.50 0.50
hkl
- 9 3( 754 77: 46t 37t
22t 85 04t 33E 952
774 01s 961 219 806
855 963 954 972 846
747 916 776 718 8 37 7 38
l-Spacing 4
1.287 1.287 1.278 1.278 1.262
1.262 1.244 1.234 1.207 1.183
1.177 1.165 1.160 1.142 1.142
1.124 1.108 1.101 1.095 1.087
1.079 1.062 1.052 1.041 1.037 1.020
Intens it:
2 i
<1 i
1 1
2 1 2
< 1
2 1 1 1
< 1
1
"
Lattice parameter, I
a
12.0: 12. O! 12.01 12.0' 12.01
12.04 12.0:
12.04 12. Of
12.04
----_
----_ 12.04 12.04 12.05
12.03 12.05 12.04 12.04 12.04
12.04 12.06 12.04 12.04 .2.03 .2.04
b
14.3: 14. 3E 14.3: 14.3: 14.3:
14.3: 14.32 14.34 14.39 14. 35
14. 33 14.36 14.33 14. 33 _----
14.32 14.35 L4. 34 14.33 14.34
.4.34
.4. 36
.4. 32 4.33 4. 32 4.34
C
----- 10.51 10.50 10.50 10.50
LO. 50 LO. 49 LO. 5 1 LO. 50 LO. 5 1
LO. 50 LO. 52 LO. 50 .O. 50 .O. 5 1
.o. 49
.O. 51
.O. 50 0.50 0.50
0. 50 0.52 0.50 0. 50 0.49 0.50
"Lattice parameters calculated by plotting a, b, and c values against cosLB and extrapolating to 90' a r e a, 12.05+0.04 4; b, 14.34iO. 05 A; c, 1 0 . 5 0 4 . 0 3 A. X-ray diffraction pattern was ob- tained by using Cu Ka radiation and nickel filter.
I I I I I I I I I I I I I I I I I .-----..-..111111111111.1 1111.. I 1 I1 I 1 1111 11111111 I I 1 I I II II 111 I I I l l I I I I I
REFER EN CES
1. Anon. : Space Power Systems Advanced Technology Conference. 1966.
NASA SP-131,
2. Litman, Arnold, P. : The Effect of Oxygen on the Corrosion of Niobium by Liquid Potassium. Rep. ORNL-3751, Oak Ridge National Lab., July 1965.
3. Scheuermann, Coulson M. ; and Barrett, Charles A. : Compatibility of Columbium and Tantalum Tubing Alloys with Refluxing Potassium. NASA TN D-3429, 1966.
4. Jansen, D. H. ; and Hoffman, E. E. : Niobium-l%Zirconium, Natural-Circulation, Boiling-Potassium Corrosion Loop Test. Rep. ORNL- 3603, Oak Ridge National Lab., May 1964.
5. Cleary, R. E.; Blecherman, S. S.; and Corliss, J. E. : Solubility of Refractory Metals in Lithium and Potassium. Nov. 1965.
Rep. TIM-850, Pratt & Whitney Aircraft,
6. McKisson, R. L. et al. : Solubility Studies of U l t r a Pure Transition Elements in Ultra Pure Alkali Metals. NASA CR-610, 1966.
7. Ginell, W. S. ; and Teitel, R. J. : Determination of the Solubility of Transition Metals in Molten Potassium. Rep. SM-48883, Douglas Aircraft Co., Dec. 1965.
8. Hickam, C. William, Jr. : Corrosion Product of the Tantalum-Interstitial Oxygen- Potassium System at 1800' F (1255' K). NASA TN D-4213, 1967.
9. Stecura, Stephan: Solubilities of Vanadium, Titanium, and Zirconium in Liquid Potassium. NASA TN D-5093, 1969.
10. Eichelberger, R. L. ; McKisson, R. L.; and Johnson, B. G. : Solubility of Refrac- tory Metals and Alloys in Potassium and in Lithium. NASA CR-1371, 1969.
11. Swisher, James H. : Solubility of Iron, Nickel, and Cobalt in Liquid Potassium and Effect of Oxygen Gettering Agents on Iron Solubility. NASA TN D-2734, 1965,
12. Kallmann, Silve; Hobart, Everett W. ; Oberthin, Hans K.; and Brienza, Walter C., Jr, : Determination of Traces of Nitrogen in Refractory Metals and Alloys by Hydro- fluoric Acid - Phosphoric Acid - Potassium Dichromate Decomposition and Tndo- phenol Photometry. Anal. Chem., vol. 40, no. 2, Feb. 1968, pp. 332-335.
13. Barrett, Charles A. : Controlled Oxygen Additions to Refractory Metals. NASA TM X-1799, 1969.
14. Kolthoff, I. M. ; and Elving, Philip J., eds. : Treatise on Analytical Chemistry. Part TI, Vol. 6. Interscience Publ., 1964.
31
15. Gahn, Randall F. : Technique for Recovery of Alkali-Metal Reaction Products. NASA TN D-4310, 1968.
16. Kovacina, T. A.; and Miller, R. R. : The Solubility of Nickel in Sodium by a Tracer Technique.
17. Stecura, Stephan: Solubilities of Molybdenum and Tungsten in Liquid Potassium.
Nucl. Sci. Eng., vol. 10, no. 2, June 1961, pp. 163-166.
NASA TN D-5504, 1969.
18. Lehovec, K. : Lattice Structure of p-Ta205. J. Less-Common Metals, vol. 7,
19. Brauer, G. ; Muller, Horst; und Kuhner, G. : Oxide der Tieftemperaturoxydation
no. 6, Dee. 1964, pp. 397-410.
von Niob und Tantal. J. Less-Common Metals, vol. 4, no. 6, Dee. 1962, pp. 533-546.
20. Norman, N. : Metallic Oxide Phases of Niobium and Tantalum. I. X-ray Tnvestiga- tions. J. Less-Common Metals, vol. 4, no. 1, Feb. 1962, pp. 52-61.
21. Lapitskii, A. V.; Simanov, Y. P.; and Artamonova, E. P. : The Formation of Lower Oxides of Niobium and Tantalum in Some Reactions of Reduction and Oxidation. Russ. J. Inorg. Chem., vol. 2, no. 1, 1957, pp. 122-141.
22. Klechkovskaya, V. V. ; Troitskaya, N. V. ; and Pinsker, Z. G. : Electron Diffrac- tion Study of One of the Cubic Oxides of Niobium. Soviet Phys. Crystall., vol. 10, no. 1, July-Aug. 1965, pp. 28-35.
23. Steeb, Siegfried; and Renner, Jorg: Ermittlung der Struktur von Niobsuboxid (Nb40) mit Elektronenbeugung.
Program, Quarterly Progress Report for Period Ending June 30, 1968. Rep. ORNL-4330, Oak Ridge National Lab., Nov. 1968, pp. 142-146.
Z. Metallkde, vol. 56, no. 8, 1965, pp. 531-534.
24. Patriarca, P. ; and Harms, W. O., Comps. : Fuels and Materials Development
25. Wicks, C. E.; and Block, F. E. : Thermodynamic Properties of 65 Elements - Their Oxides, Halides, Carbides, and Nitrides. Department of Interior, 1963.
26. Glassner, Alvin: The Thermochemical Properties of the Oxides, Fluorides, and Chlorides to 2500' K. Rep. ANL-5650, Argonne National Lab., 1957.
27. Reisman, Arnold; Holtzberg, Frederic; Berkenblit, Melvin; and Berry, Margaret: Reactions of the Group VB Pentoxides with Alkali Oxides and Carbonates, III. Thermal and X-ray Phase Diagrams of the System K 2 0 o r K2C03 with Ta205. J. Am. Chem. Soc., vol. 78, no. 18, Sept. 20, 1956, pp. 4514-4520.
Bulletin 605, Bureau of Mines,
32
28. Guerchais, Jacques E. : Reactions Entre L'oxyde de Niobium et le Carbonate de Potassium par Voie Seche; Hydrolyse des Produits Obtenus (m). de France, Bulletin 1962, pp. 103-107.
Societe Chimique
29. Azhoff, Leonid V. ; and Buerger, Martin J. : The Powder Method in X-ray Crystallography. McGraw-Hill Book Co., Inc., 1958.
NASA-Langley, 1970 - 17 E-5615 33
I
NATIONAL AERONAUTICS AND SPACE ADMINISTRATION
WASHINGTON, D. C. 20546
OFFICIAL BUSINESS FIRST CLASS MAIL
POSTAGE A N D FEES PAID NATIONAL AERONAUTICS A N D
SPACE ADMINISTRATION
POSTMASTER: If Undeliverable (Section 158 Postal Manual) Do Not Return
"The neronnntical nitd spnce nctivities of the Uizited Stntes shall be conducted so us t o colatribute . . . t o the expniisioiz of human knozul- edge of phenomena ia the ntin osphere nitd space. T h e Ad~iiiiaistmtioii shnll proride for the widest Iwncticnble nizd nppropriate dissemiiintjoii of iaf oriuntioa conceriaiiig its nctizities and the resnlts thewof."
-NATIONAL~AERONAUTICS A N D SPACE ACT OF 1958
NASA SCIENTIFIC AND TECHNICAL PUBLICATIONS
TECHNICAL REPORTS: Scientific and technical information considered important, complete, and a lasting contribution to existing knowledge.
TECHNICAL NOTES: Informalion' less broad in scope but nevertheless of importance as a contribution to existing knowledge.
TECHNICAL MEMORANDUMS: Information receiving limited distribution because of preliminary data, security classifica- tion, or other reasons.
TECHNICAL TRANSLATIONS: Information published in a foreign language considered to merit NASA distribution in English.
SPECIAL PUBLICATIONS: Information derived from or of value to NASA activities. ,
Publications include conference proceedings, monographs, data compilations, handbooks, sourcebooks, and special bibliographies.
TECHNOLOGY UTILIZATION PUBLICATIONS: Informati& on technology used by NASA that may be of particular interest in commercial and other non-aerospace applications. Publications include Tech Briefs,
and Technology Surveys.
CONTRACTOR REPORTS: Scientific and technical information generated under a NASA contract or grant and considered an important contribution to existing knowledge.
Uti~izdtion Reports and Notes,
Details on fhe availability of these publications may be obtained from:
SCIENTIFIC AND TECHNICAL INFORMATION DIVISION
NATIONAL AERONAUTICS AND SPACE ADMINISTRATION Washington, D.C. 20546