apex tannery ltd
38
Comprehensive Income Statement Particulars Sales Less: Cost of Goods Sold Freight and forwarding Gross Profit Operating Expenses Administration expenses Marketing expenses Director remurnation Legal and audit fee Depreciation Operating Profit Bank Interest and Charges Other income Point on sale of investment Profit for the year Provision for WPPF Net Profit Before tax Provision for Tax Net Profit After Tax Cash dividend Balance transferred to balance sheet
description
Valuation Model
Transcript of apex tannery ltd
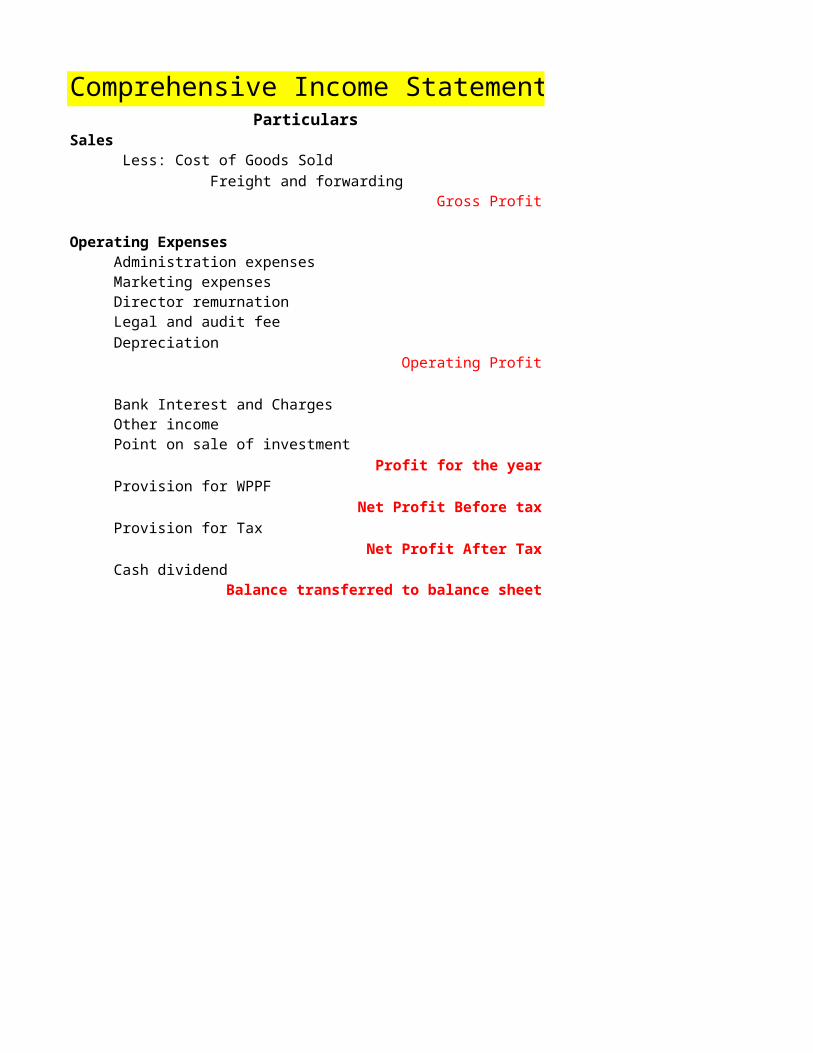
Comprehensive Income StatementParticulars 2007-2008
Sales 2,580,774,000.00 Less: Cost of Goods Sold 2,350,980,000.00 Freight and forwarding 63,577,000.00
Gross Profit 166,217,000.00
Operating Expenses Administration expenses 17,890,000.00 Marketing expenses 70,736,000.00 Director remurnation 5,040,000.00 Legal and audit fee 326,000.00 Depreciation 5,161,000.00
Operating Profit 67,064,000.00
Bank Interest and Charges 52,693,000.00 Other income 18,003,000.00 Point on sale of investment
Profit for the year 32,374,000.00 Provision for WPPF 1,541,000.00
Net Profit Before tax 30,833,000.00 Provision for Tax 6,136,000.00
Net Profit After Tax 24,697,000.00 Cash dividend 25,908,000.00
Balance transferred to balance sheet -1,211,000.00

2008-2009 2009-2010 2010-20111,625,358,000.00 1,723,639,000.00 2,515,867,000.001,407,705,000.00 1,411,005,000.00 2,215,622,000.00
47,655,000.00 59,115,000.00 75,199,000.00169,998,000.00 253,519,000.00 225,046,000.00
20,095,000.00 22,324,000.00 26,760,000.0048,193,000.00 40,184,000.00 60,063,000.00
5,040,000.00 6,090,000.00 6,090,000.00420,000.00 420,000.00 421,000.00
4,205,000.00 4,573,000.00 6,394,000.0092,045,000.00 179,928,000.00 125,318,000.00
48,770,000.00 30,436,000.00 42,482,000.0033,056,000.00 38,642,000.00 42,491,000.0092,142,000.00
168,473,000.00 188,134,000.00 125,327,000.008,019,000.00 8,954,000.00 5,966,000.00
160,454,000.00 179,180,000.00 119,361,000.0013,662,000.00 36,327,000.00 22,518,000.00
146,792,000.00 142,853,000.00 96,843,000.0025,908,000.00 32,004,000.00 38,100,000.00
120,884,000.00 110,849,000.00 58,743,000.00

2011-20123,067,208,000.002,733,678,000.00
62,373,000.00271,157,000.00
32,918,000.0076,118,000.00
6,840,000.00420,000.00
6,044,000.00148,817,000.00
53,433,000.0043,193,000.00
138,577,000.006,596,000.00
131,981,000.0024,305,000.00
107,676,000.004,572,000.00
103,104,000.00

Statement of Financial PositionParticulars 2007-2008
Assets Non current Assets: PPE 161,336,000 Investments 7,750,000 Deferred Tax Assets
Total Non current Assets 169,086,000
Current Assets: Inventories 1,159,127,000 Trade and other receivables 180,835,000 Advances, Deposits and Prepayments 56,962,000 Cash and Cash -equivalent 2,370,000
Total Current Assets 1,399,294,000 Total Property and Assets 1,568,380,000
Equity and Liability Shareholders’ equity: Share Capital 152,400,000 Share Premium 425,333,000 Dividend Equalization Fund Reatined Earnings 76,455,000 Fair Valuation surplus of investment
Non current Liabilities 6,700,000
Retirement benefit obligation
Current Liabilities 27,200,000
Short term loan 173,649,000 Working Capital loan 469,910,000 Trade Deficits 194,707,000 Other Payables 22,405,000 Provisions for income tax 19,621,000 Total equity and liabilites 1,568,380,000
Total Equity 654188000.00Number of outstanding shares
LTL
Current portion of LTL

2008-2009 2009-2010 2010-2011 2011-2012
147,069,000 152,810,000 209,719,000 241,175,0002845000 3,845,000 7,261,000 39,014,000232,000 710,000 1,528,000 2,957,000
150,146,000 157,365,000 218,508,000 283,146,000
830,099,000 552,549,000 752,537,000 790,040,000189,350,000 252,615,000 195,323,000 177,758,000
72,757,000 84,046,000 119,173,000 127,829,000278,629,000 43,835,000 327,759,000 217,802,000
1,370,835,000 933,045,000 1,394,792,000 1,313,429,000 1,520,981,000 1,090,410,000 1,613,300,000 1,596,575,000
152,400,000 152,400,000 152,400,000 152,400,000 425,333,000 425,333,000 425,333,000 425,333,000 44,888,000 44,888,000 44,888,000 44,888,000 123,815,000 234,664,000 293,407,000 355,363,000
34,600,000
31,858,000 37,275,000 45,570,000 58,142,000
6,790,000 155,728,000 175,761,000 457,694,000 100,585,000 404,843,000 433,029,000 66,183,000 20,774,000 13,420,000 14,488,000 22,270,000 26,443,000 23,474,000 18,394,000 34,022,000 48,048,000 34,204,000 59,938,000 1,520,981,000 1,090,410,000 1,613,300,000 1,596,575,000
746436000.00 857285000.00 916028000.00 1012584000.0015240000

PARTICULARS 2007-08 2008-09 2009-10
Sales growth -0.37020522 0.06046729AvergeNormalized
Cost of Goods Sold 0.91095927 0.86608919 0.81861979Average
Freight and forwarding 0.02463486 0.02931969 0.03429662Average
Administration expenses 0.00693203 0.01236343 0.01295167Average
Marketing expenses 0.02740883 0.02965070 0.02331347Average
Director remurnation 0.00195290 0.00310086 0.00353322Average
Legal and audit fee 0.00012632 0.00025840 0.00024367Average
Depreciation 0.03198914 0.02859202 0.02992605Average
Growth of Other Income 0.83613842 0.16898596Average
Bank Interest and charges 0.02041752 0.03000570 0.01765799Average
Cash Dividend Payout ratio 1.04903430 0.17649463 0.22403450Average
Tax 0.19900756 0.08514590 0.20274026Average
PPE growth -0.08843036 0.03903610Average
Investment growth -0.63290323 0.35149385AverageNormalized

Deffered tax assets growth 2.06034483AverageNormalized
Inventories 0.44913929 0.51071764 0.32057119AverageNormalized
Trade and other receivables 0.07007006 0.11649741 0.14655911AverageNormalized
Advances, Deposits and Prepayments 0.02207167 0.04476368 0.04876079Average
Working Capital loan 0.18208103 0.28159581 0.05835619Average
Trade Deficits 0.07544520 0.04071903 0.01205241Average
Other Payables 0.00868150 0.01370160 0.01534138AverageNormalized
Provision for WPPF 0.00059711 0.00493368 0.00519482Average
Provision for Income Tax 0.19900756 0.08514590 0.20274026Average

2010-11 2011-12 2012-2013 2013-14 2014-15 2015-16
0.45962525 0.219145530.09225821 0.09225821 0.09225821 0.09225821 0.09225821
0.12 0.12 0.12 0.12 0.12
0.88065943 0.891259410.87351742 0.87351742 0.87351742 0.87351742 0.87351742
0.02988989 0.020335430.02769530 0.02769530 0.02769530 0.02769530 0.02769530
0.01063649 0.010732240.01167096 0.01167096 0.01167096 0.01167096 0.01167096
0.02387368 0.024816710.02541364 0.02541364 0.02541364 0.02541364 0.02541364
0.00242064 0.002230040.00282119 0.00282119 0.00282119 0.00282119 0.00282119
0.00016734 0.000136930.00020159 0.00020159 0.00020159 0.00020159 0.00020159
0.03048842 0.025060640.02851678 0.02851678 0.02851678 0.02851678 0.02851678
0.09960665 0.016521150.28031304 0.28031304 0.28031304 0.28031304 0.28031304
0.01688563 0.017420730.02 0.02 0.02 0.02 0.02
0.39342028 0.042460720.38 0.38 0.38 0.38 0.380.35 0.35 0.35 0.35 0.35
0.18865459 0.184155300.17194072 0.17194072 0.17194072 0.17194072 0.17194072
0.37241673 0.149991180.11825341 0.11825341 0.11825341 0.11825341 0.11825341
0.88842653 4.373089111.24502656 1.24502656 1.24502656 1.24502656 1.245026560.35000000 0.25000000 0.25000000 0.25000000 0.25000000

1.15211268 0.935209421.38255564 1.38255564 1.38255564 1.38255564 1.382555640.25000000 0.25000000 0.25000000 0.25000000 0.25000000
0.29911637 0.257576270.36742415 0.36742415 0.36742415 0.36742415 0.367424150.25000000 0.25000000 0.25000000 0.25000000 0.25000000
0.07763646 0.057954340.09374348 0.09374348 0.09374348 0.09374348 0.093743480.15000000 0.15000000 0.15000000 0.15000000 0.15000000
0.04736856 0.041676010.04092814 0.04092814 0.04092814 0.04092814 0.04092814
0.16091590 0.141180190.16051202 0.16051202 0.16051202 0.16051202 0.16051202
0.00533415 0.004723510.01570727 0.01570727 0.01570727 0.01570727 0.01570727
0.00933038 0.005996980.01109259 0.01109259 0.01109259 0.01109259 0.011092590.01500000 0.01500000 0.01500000 0.01500000 0.01500000
0.00237135 0.002150490.01524745 0.01524745 0.01524745 0.01524745 0.01524745
0.18865459 0.184155300.17194072 0.17194072 0.17194072 0.17194072 0.17194072

2016-17
0.092258210.12
0.87351742
0.02769530
0.01167096
0.02541364
0.00282119
0.00020159
0.02851678
0.28031304
0.02
0.380.35
0.17194072
0.11825341
1.245026560.25000000

1.382555640.25000000
0.367424150.25000000
0.093743480.15000000
0.04092814
0.16051202
0.01570727
0.011092590.01500000
0.01524745
0.17194072

Assumptoin Made:I assume the tax rate to be 27.5%.From our calculation, i see that extreme fall in 2008-09 tends to make the average growth rate abnornmal. To normalize the affairs it is assumed that sale growth rate will 10% each year. It is stated that the company will give 35% cash dividend of the par share price which is Tk 1.00 for follwing years.To normalize the affairs it is assumed that there will be no adjustment in WPPF.In annual report of this company i found that the firm has no interest income.The risk free rate is based on the 91 day T bill rate. The rate is 8.25 %.To normalize the situation several other factors are also normalized.

Proforma Comprehensive Income StatementParticulars 2011-2012
Sales 3,067,208,000.00 Less: Cost of Goods Sold 2,733,678,000.00 Freight and forwarding 62,373,000.00
Gross Profit 271,157,000.00
Operating Expenses Administration expenses 32,918,000.00 Marketing expenses 76,118,000.00 Director remurnation 6,840,000.00 Legal and audit fee 420,000.00 Depreciation 6,044,000.00
Operating Profit 148,817,000.00
Bank Interest and Charges 53,433,000.00 Other income 43,193,000.00
Profit for the year 138,577,000.00 Provision for WPPF 6,596,000.00
Net Profit Before tax 131,981,000.00 Provision for Tax 24,305,000.00
Net Profit After Tax 107,676,000.00 Cash dividend 4,572,000.00
Balance transferred to balance sheet 103,104,000.00

2012-2013 2013-2014 2014-2015 2015-2016
3,435,272,960.00 3,847,505,715.20 4,309,206,401.02 4,826,311,169.153,000,770,772.77 3,360,863,265.50 3,764,166,857.36 4,215,866,880.24
95,140,917.79 106,557,827.93 119,344,767.28 133,666,139.35339,361,269.44 380,084,621.77 425,694,776.39 476,778,149.55
40,092,921.55 44,904,072.14 50,292,560.79 56,327,668.0987,302,781.50 97,779,115.28 109,512,609.12 122,654,122.21
9,691,553.94 10,854,540.41 12,157,085.26 13,615,935.50692,504.15 775,604.65 868,677.20 972,918.47
7,690,826.96 8,600,293.49 9,617,307.54 10,754,586.97193,890,681.33 217,170,995.80 243,246,536.47 272,452,918.32
70,345,846.51 78,787,348.09 88,241,829.86 98,830,849.4455,300,561.31 70,802,029.98 90,648,762.52 116,058,793.08
178,845,396.13 209,185,677.69 245,653,469.13 289,680,861.9552,379,162.13 58,664,661.58 65,704,420.97 73,588,951.49
126,466,234.01 150,521,016.11 179,949,048.16 216,091,910.4721,744,695.26 25,880,691.80 30,940,568.81 37,154,998.55
104,721,538.74 124,640,324.31 149,008,479.35 178,936,911.9136,652,538.56 43,624,113.51 52,152,967.77 62,627,919.1768,069,000.18 81,016,210.80 96,855,511.58 116,308,992.74

2016-2017
5,405,468,509.444,721,770,905.87
149,706,076.08533,991,527.50
63,086,988.26137,372,616.88
15,249,847.761,089,668.68
12,026,353.57305,166,052.35
110,690,551.37148,591,586.65
343,067,087.6282,419,625.67
260,647,461.9544,815,912.13
215,831,549.8275,541,042.44
140,290,507.38

Statement of Financial PositionParticulars 2011-2012
Assets Non current Assets: PPE 241,175,000 Investments 39,014,000 Deferred Tax Assets 2,957,000
Total Non current Assets 283,146,000
Current Assets: Inventories 790,040,000 Trade and other receivables 177,758,000 Advances, Deposits and Prepayments 127,829,000 Cash and Cash -equivalent 217,802,000
Total Current Assets 1,313,429,000 Total Property and Assets 1,596,575,000
Equity and Liability Shareholders’ equity: Share Capital 152,400,000 Share Premium 425,333,000 Dividend Equalization Fund 44,888,000 Reatined Earnings 355,363,000 Fair Valuation surplus of investment 34,600,000
Non current Liabilities Retirement benefit obligation 58,142,000
Current Liabilities Working Capital loan 433,029,000 Trade Deficits 14,488,000 Other Payables 18,394,000 Provisions for income tax 59,938,000 Total equity and liabilites 1,596,575,000
Equity 1,012,584,000

2012-2013 2013-2014 2014-2015 2015-2016 2016-2017
269,694,767 301,587,093 337,250,796 377,131,853 421,728,981 48,767,500 60,959,375 76,199,219 95,249,023 119,061,279 3,696,250 4,620,313 5,775,391 7,219,238 9,024,048 322,158,517 367,166,780 419,225,405 479,600,115 549,814,308
858,818,240 961,876,429 1,077,301,600 1,206,577,792 1,351,367,127 450,115,616 504,129,490 564,625,029 632,380,032 708,265,636 3,893,941 4,361,214 4,884,560 5,470,707 6,127,192 49,301,854 82,991,318 50,107,106 21,813,885 1,537,747 1,362,129,651 1,553,358,451 1,696,918,294 1,866,242,416 2,067,297,701 1,684,288,167 1,920,525,231 2,116,143,699 2,345,842,531 2,617,112,010
152,400,000 152,400,000 152,400,000 152,400,000 152,400,000 425,333,000 425,333,000 425,333,000 425,333,000 425,333,000 4,488,000 44,888,000 44,888,000 44,888,000 44,888,000 423,432,000 504,448,211 601,303,723 717,612,715 857,903,223
31,858,000 37,275,000 45,570,000 58,142,000
551,402,604 617,570,916 691,679,426 774,680,957 867,642,672 53,958,774 60,433,827 67,685,886 75,808,192 84,905,175 51,529,094 57,712,586 64,638,096 72,394,668 81,082,028 21,744,695 25,880,692 30,940,569 37,154,999 44,815,912 1,684,288,167 1,920,525,231 2,116,143,699 2,345,842,531 2,617,112,010

Date Monthly Closing -Apex Tannery Ltd. DGEN 30/12/2012 74.95 4219.31 29/11/2012 79.40 4210.58 31/10/2012 84.23 4493.92 30/09/2012 91.49 4544.41 30/08/2012 94.54 4446.87 30/07/2012 90.31 4159.17
28/06/2012 104.51 4572.8831/05/2012 105.17 4734.3330/04/2012 113.18 5098.9029/03/2012 115.72 4990.3229/02/2012 101.72 4695.4131/01/2012 95.21 4153.96
29/12/2011 120.34 5257.61 30/11/2011 1262.62 5268.55 30/10/2011 1020.99 5036.50
29/09/2011 1295.20 5910.2025/08/2011 1373.94 6212.0031/07/2011 1538.50 6459.6230/06/2011 1379.71 6117.2331/05/2011 1362.92 5758.2628/04/2011 1588.52 6050.8531/03/2011 1532.08 6352.1028/02/2011 1058.28 5203.0831/01/2011 1622.78 7484.2330/12/2010 1806.90 8290.4130/11/2010 2088.39 8602.4431/10/2010 2079.50 7957.1230/09/2010 1781.75 7097.3831/08/2010 1756.16 6657.9729/07/2010 1774.41 6342.7630/06/2010 1485.49 6153.6830/05/2010 1435.84 6107.8129/04/2010 1433.39 5654.8831/03/2010 1355.04 5582.3328/02/2010 1348.39 5560.5631/01/2010 1360.89 5367.1130/12/2009 1180.87 4535.5326/11/2009 1168.87 4380.9529/10/2009 1141.48 3364.2630/09/2009 1146.39 3083.8931/08/2009 1096.04 2941.2830/07/2009 1301.80 2914.5330/06/2009 1227.60 3010.2605/07/2009 1033.12 2572.18

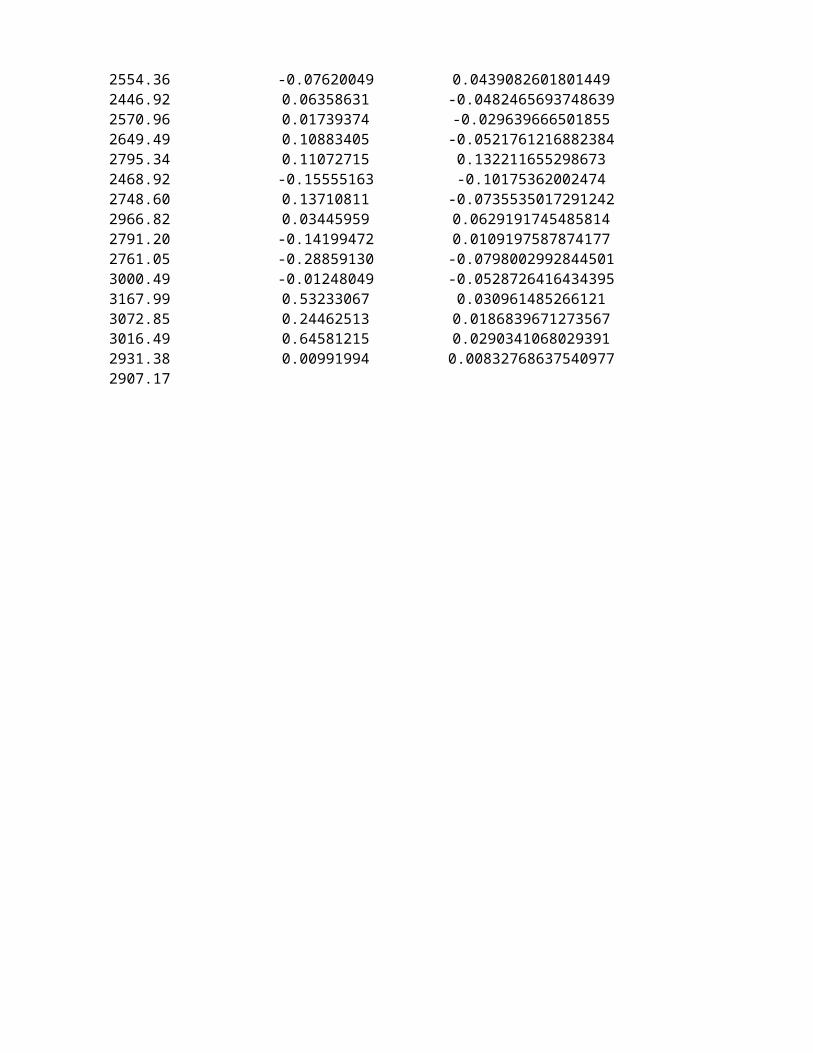
30/04/2009 1001.14 2554.3631/03/2009 1083.72 2446.9226/02/2009 1018.93 2570.9629/01/2009 1001.51 2649.4930/12/2008 903.21 2795.3430/11/2008 813.17 2468.9230/10/2008 962.96 2748.6025/09/2008 846.85 2966.8231/08/2008 818.64 2791.2031/07/2008 954.12 2761.0530/06/2008 1341.17 3000.4929/05/2008 1358.12 3167.9930/04/2008 886.31 3072.8531/03/2008 712.11 3016.4928/02/2008 432.68 2931.3831/01/2008 428.43 2907.17
Covariance 0.00897312Variance of market return 0.00921710
Beta 0.97352999Market return 0.01Market return yearly 0.13

Apex Tannery Ltd.'s Return DGEN Return-0.05604534 0.00207398194779988-0.05734299 -0.0630494021045755-0.07935293 -0.0111094771854771-0.03226148 0.0219336664710010.04683867 0.0691733189684053-0.13587217 -0.0904706855137078-0.00627555 -0.0341029613306849-0.07077222 -0.0714998550943509-0.02194953 0.02175796278941160.13763272 0.06280948664799240.06837517 0.130344023624624-0.20882500 -0.209913360089555-0.90469025 -0.002078097543880070.23666246 0.0460749012549049-0.21171248 -0.147829844526531-0.05730964 -0.0485825565313752-0.10696133 -0.03833444394761990.11508940 0.05597127058410510.01231914 0.0623399192091266-0.14201899 -0.04835379985547340.03683881 -0.04742621410758880.44770760 0.220833797593175-0.34785985 -0.304793373020598-0.10189828 -0.0972427322653523-0.13478804 -0.03627226693821760.00427507 0.08109969436177920.16711099 0.1211348413076370.01457157 0.0659975938611919-0.01028511 0.04969603138066080.19449475 0.03072632961089950.03457906 0.007510056796134770.00170923 0.08009542200718680.05782117 0.01299636531699130.00493181 0.0039150733019695-0.00918517 0.03604360633562580.15244692 0.1833479218525730.01026633 0.03528458439379590.02399516 0.302203159089963-0.00428301 0.09091439707641980.04593810 0.0484856933035956-0.15805807 0.00917815222351460.06044314 -0.03180123976002070.18824532 0.1703146747117230.03194358 0.00697630717674866

-0.07620049 0.04390826018014490.06358631 -0.04824656937486390.01739374 -0.0296396665018550.10883405 -0.05217612168823840.11072715 0.132211655298673-0.15555163 -0.101753620024740.13710811 -0.07355350172912420.03445959 0.0629191745485814-0.14199472 0.0109197587874177-0.28859130 -0.0798002992844501-0.01248049 -0.05287264164343950.53233067 0.0309614852661210.24462513 0.01868396712735670.64581215 0.02903410680293910.00991994 0.00832768637540978

Risk-free rate 0.0825Market return 0.13Beta 0.97352999293668Cost of equity 0.12995624036228Cost of debt 0.02After tax cost of debt 0.01484619688484
Total market value of equity 1,798,800,000Book value of debt 580,604,316Weight of equity 0.75598753347811Weight of debt 0.24401246652189
WACC 0.10186795473
Outstanding share 24,000,000last market price 74.95

Particulars 2011-2012 2012-13
Inventories 790,040,000 843482200 Trade and other receivables 177,758,000 442077837.059137 Advances, Deposits and Prepayments 127,829,000 3824406.4115229Non-cash current asset 1095627000 1289384443.47066
Trade Deficits 4,488,000 52995224.354685 Other Payables 18,394,000 50608932 Provisions for income tax 59,938,000 22824942.9536539Non- STD Current liabilities 82,820,000 126429099.308339
Working capital 1012807000 1162955344.16232Change in WC 150148344.162321

2013-14 2014-15 2015-16 2016-17
927830420 1020613462 1122674808.2 1234942289.02486285620.765051 534914182.84156 588405601.125712 647246161.238284206847.05267519 4627531.7579427 5090284.93373698 5599313.42711071418322887.81773 1560155176.5995 1716170694.25945 1887787763.6854
58294746.7901535 64124221.469169 70536643.6160857 77590307.97769455669825.2 61236807.72 67360488.492 74096537.3412
26098918.3702576 30912923.369977 36580137.7382622 44006458.353654140063490.360411 156273952.55915 174477269.846348 195693303.67255
1278259397.45732 1403881224.0404 1541693424.4131 1692094460.0128115304053.294994 125621826.58304 137812200.372748 150401035.59975
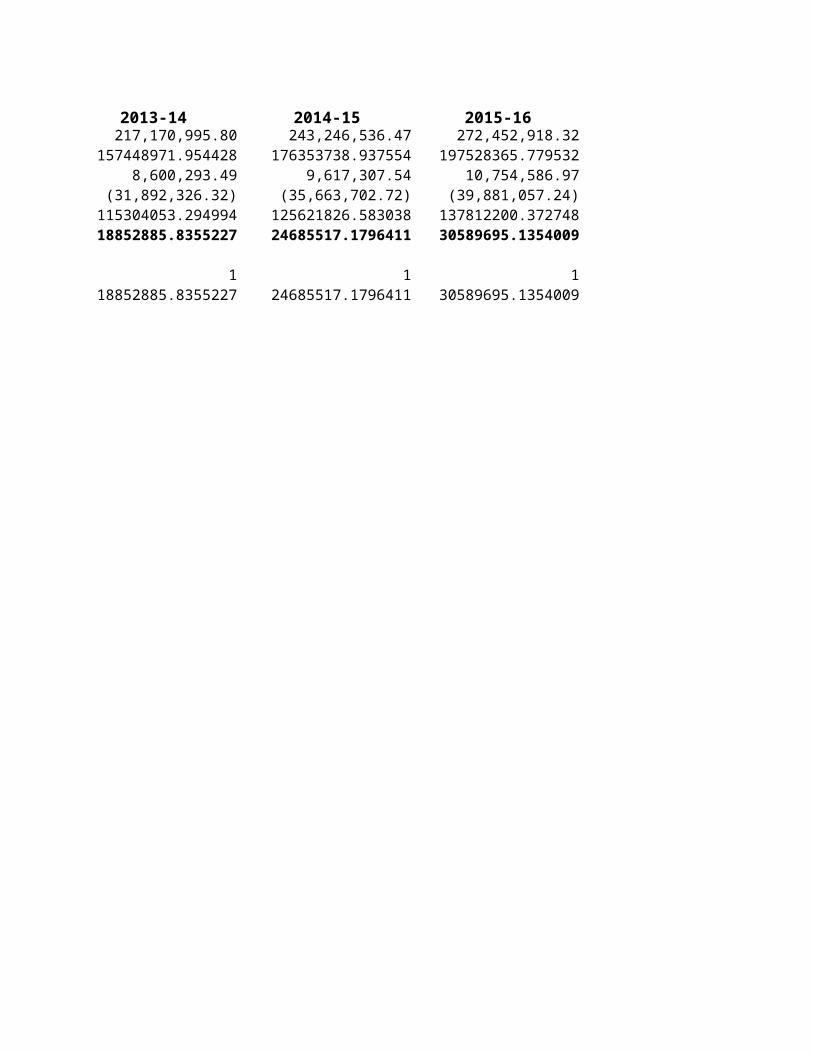
Free Cash Flow and ValuationParticulars 2012-13 2013-14EBIT 193,890,681.33 217,170,995.80EBIT (1-tax rate) 140570743.96592 157448971.954428Depreciation 7,690,826.96 8,600,293.49Capital expenditure (28,519,766.61) (31,892,326.32)Change in NWC 150148344.16232 115304053.294994Free cashflow -30406539.841516 18852885.8355227
Present value discount factor 0.9075497619343 1Present value of free cashflow -27595447.994414 18852885.8355227Terminal value
Enterprise value 561660074.60546Cash 217,802,000Interest-bearing debt 433,029,000 Equity value 346433074.60546Value per share 22.731829042353

2014-15 2015-16 2016-17243,246,536.47 272,452,918.32 305,166,052.35
176353738.937554 197528365.779532 221245387.9526389,617,307.54 10,754,586.97 12,026,353.57
(35,663,702.72) (39,881,057.24) (44,597,128.33)125621826.583038 137812200.372748 150401035.59974524685517.1796411 30589695.1354009 38273577.5960037 39039049.1479237
1 1 124685517.1796411 30589695.1354009 38273577.5960037
476853846.853309

Textile IndustrySL. Market ratios Apex Tannery Ltd. Apex S Prime textile Tallu
1 Price earning multiple 7.46 74.212 Price to book value per share 0.94 1.783 Price to par value per share 2.89 7.505 Price to sales per share 0.79 0.596 Price to cash flow per share 12.55 10.997 Price to NAV per share 0.94 1.78
Relative va 37.69

Textile IndustrySquare Average Prime tex relative
7.46 7.530.94 51.422.89 28.900.79 29.66
12.55 53.760.94 54.86

Five factor DuPont analysis2008 2009 2010 2011
Operating profit margin 0.043 0.092 0.045Asset turnover 1.07 1.58 1.56Interest burden 1.44 1.20 1.55Tax burden 0.91 0.80 0.81Financial leverage 2.04 1.27 1.76ROE 12.39% 17.67% 15.43%
What if analysis2009 2010 2011
Operating profit margin 0.043 0.043 0.043Asset turnover 1.07 1.58 1.56Interest burden 1.44 1.20 1.55Tax burden 0.91 0.80 0.81Financial leverage 2.04 1.27 1.76ROE 12.39% 8.36% 14.97%
2009 2010 2011Operating profit margin 0.043 0.092 0.045Asset turnover 1.07 1.07 1.07Interest burden 1.44 1.20 1.55Tax burden 0.91 0.80 0.81Financial leverage 2.04 1.27 1.76ROE 12.39% 11.95% 10.57%
2009 2010 2011Operating profit margin 0.043 0.092 0.045Asset turnover 1.07 1.58 1.56Interest burden 1.44 1.44 1.44Tax burden 0.91 0.80 0.81Financial leverage 2.04 1.27 1.76ROE 12.39% 21.08% 14.28%
2009 2010 2011Operating profit margin 0.043 0.092 0.045Asset turnover 1.07 1.58 1.56Interest burden 1.44 1.20 1.55Tax burden 0.91 0.91 0.91Financial leverage 2.04 1.27 1.76ROE 12.39% 20.28% 17.40%
2009 2010 2011Operating profit margin 0.043 0.092 0.045Asset turnover 1.07 1.58 1.56Interest burden 1.44 1.20 1.55Tax burden 0.91 0.80 0.81

Financial leverage 2.04 2.04 2.04ROE 12.39% 28.31% 17.85%
Five factor DuPont analysis20120.0311.921.680.821.58
12.96%
What if analysis20120.0431.921.680.821.58
17.97%
20120.0311.071.680.821.58
7.21%
20120.0311.921.440.821.58
11.08%
20120.0311.921.680.911.58
14.54%
20120.0311.921.680.82

2.0416.75%