
APEC-WW Economy Report: INDIA 2010 -...
15
1 1.0 APEC-WW Economy Report: INDIA 2010 Ajay Gairola 1 , Ravi Kumar Sharma 2 and K. Mohan 3 1 Assoc. Prof. in Civil Engg, 2,3 Research Scholars, Centre of Excellence in Disaster Mitigation & Management Indian Institute of Technology Roorkee -247667 INDIA ABSTRACT The pedestrian comfort and safety are functions of the wind induced forces. The key parameters to quantify the comfort criteria in India are relative humidity, air temperature and air quality. Countries have developed the comfort criteria with significant differences. The content of this paper presents a country report in Indian context. While the first part highlights the Indian standards and monitoring the out- door air quality, the second part focuses on research initiative between Centre of Excellence in Disaster Mitigation and Management at Indian Institute of Technology Roorkee India and the University of Auckland New Zealand. Keywords: - : Air Pollution, Public health, Land use, legal framework, National Air Monitoring Program, pedestrian comfort, comfort criteria, tall buildings, landscaping 1.0 INTRODUCTION The Government of India for the first time will now have a uniform health-based National Ambient Air Quality Standard (NAAQS), discontinuing the old practice of setting air quality standards for different land use classes like residential and industrial. Area classification based on land –use has been done away with so that industrial areas have to conform to the same standards as those for residential areas. The new ambient air quality standards, revised after a gap of 15 years, provide a legal framework for the control of air pollution and the protection of public health and any citizen can approach the court demanding better air quality. Assessment of wind amplification and stagnation zones in the vicinity of tall buildings and the mitigation of unpleasant winds with the aid of soft and hard landscaping materials form the focus of this study. A summary on study of pedestrian level wind environment in the vicinity of tall building has been presented. This research effort is a continuation of that reported at the APEC-WW in Taiwan, 2009 by Richard G.J. Flay in the New Zealand Economy Report. This study is being conducted by K.Mohan, a Research Scholar at the Centre of Excellence in Disaster Mitigation and Management at IIT Roorkee, India, in collaboration with the University of Auckland. The wind tunnel tests using the erosion technique were carried out by Mohan at the de Bray Wind tunnel at the University of Auckland under the guidance of Richard Flay. The research program of Mohan at Indian Institute of Technology Roorkee is supervised by Gairola, Mukherjee & Kwatra. 2.0 AMBIENT AIR QUALITY 2.1 Introduction To provide legislative support for air quality protection, the Central Pollution Control Board (CPCB) New Delhi, recognized the need to review the air quality criteria/standards. The review of the previous NAAQS and inclusion of new parameters was undertaken by the CPCB in association with the Indian Institute of 1 Presently on deputation as Member Secretary, Uttarakhand Environment Protection and Pollution Control Board, Dehradoon, India
Transcript of APEC-WW Economy Report: INDIA 2010 -...

1
1.0 APEC-WW Economy Report: INDIA 2010
Ajay Gairola1, Ravi Kumar Sharma2 and K. Mohan3 1Assoc. Prof. in Civil Engg, 2,3Research Scholars,
Centre of Excellence in Disaster Mitigation & Management Indian Institute of Technology Roorkee -247667 INDIA
ABSTRACT
The pedestrian comfort and safety are functions of the wind induced forces. The key parameters to quantify the comfort criteria in India are relative humidity, air temperature and air quality. Countries have developed the comfort criteria with significant differences. The content of this paper presents a country report in Indian context. While the first part highlights the Indian standards and monitoring the out- door air quality, the second part focuses on research initiative between Centre of Excellence in Disaster Mitigation and Management at Indian Institute of Technology Roorkee India and the University of Auckland New Zealand. Keywords: - : Air Pollution, Public health, Land use, legal framework, National Air Monitoring Program, pedestrian comfort, comfort criteria, tall buildings, landscaping 1.0 INTRODUCTION The Government of India for the first time will now have a uniform health-based National Ambient Air Quality Standard (NAAQS), discontinuing the old practice of setting air quality standards for different land use classes like residential and industrial. Area classification based on land –use has been done away with so that industrial areas have to conform to the same standards as those for residential areas. The new ambient air quality standards, revised after a gap of 15 years, provide a legal framework for the control of air pollution and the protection of public health and any citizen can approach the court demanding better air quality.
Assessment of wind amplification and stagnation zones in the vicinity of tall buildings and the mitigation of unpleasant winds with the aid of soft and hard landscaping materials form the focus of this study. A summary on study of pedestrian level wind environment in the vicinity of tall building has been presented. This research effort is a continuation of that reported at the APEC-WW in Taiwan, 2009 by Richard G.J. Flay in the New Zealand Economy Report. This study is being conducted by K.Mohan, a Research Scholar at the Centre of Excellence in Disaster Mitigation and Management at IIT Roorkee, India, in collaboration with the University of Auckland. The wind tunnel tests using the erosion technique were carried out by Mohan at the de Bray Wind tunnel at the University of Auckland under the guidance of Richard Flay. The research program of Mohan at Indian Institute of Technology Roorkee is supervised by Gairola, Mukherjee & Kwatra.
2.0 AMBIENT AIR QUALITY 2.1 Introduction To provide legislative support for air quality protection, the Central Pollution Control Board (CPCB) New Delhi, recognized the need to review the air quality criteria/standards. The review of the previous NAAQS and inclusion of new parameters was undertaken by the CPCB in association with the Indian Institute of
1 Presently on deputation as Member Secretary, Uttarakhand Environment Protection and Pollution Control Board, Dehradoon, India

2
Technology (IIT), Kanpur. The Proposal for revision in NAAQS was deliberated upon extensively and has been notified under the Environment (Protection) Act, 1986 on 16.11.2009 by the Ministry of Environment and Forests. The CPCB has initiated the process of harmonizing it’s notification under the Air Act, 1981 with the revised notification so as to ensure the efficient implementation of the new standards. These revised Standards include initiatives that have been developed in consonance with global best practices and in keeping with the latest advancements in technology and research. Some of the salient features include:
Area classification based on land-use has been done away with so that industrial areas have to conform to the same standards as residential areas.
The standards shall be applicable uniformly with the exception of stringent standards for NO2 and SO2 in the ecologically sensitive area.
The previous standards for residential area have been uniformly applied for fine particulate matter (PM10), Carbon Monoxide and Ammonia. More stringent limits for Lead, SO2 and NO2 have been prescribed even for residential areas.
Suspended particulate matter (SPM) as parameter has been replaced by fine particulate matter (PM 2.5) which is more relevant for public health.
Other new parameters, such as Ozone, Arsenic, Nickel, Benzene and Benzo (a) Pyrene (BaP) have been included for the first time under NAAQS based on CPCB/IIT Kanpur research, World Health Organisation guidelines and EU limits and practices.
Though Mercury has not been notified as part of these revised standards, the Ministry is conscious of the need to monitor the same. Research and development in standards setting and standardization of monitoring protocols for mercury is still in progress internationally. As a result, it may be noted that even the most progressive regimes in this regard, those of the member countries of the European Union, Have not included ‘mercury’ in their ambient air quality standards. In furtherance of these Standards, the Central Pollution Control Board, New Delhi (CPCB) is in the process of creating a roadmap for the generation of maintenance of database, monitoring of required infrastructure and for the development of protocols. The ministry is also in the process of developing additional support systems of enforcement such as the National Environment Protection Authority (NEPA) and the National Green Tribunal (NGT) to ensure the effective enforcement of the standards. (Source: Press Information Bureau, PIB)
2.2 Execution of Air Quality Monitoring
The Central Pollution Control Board, New Delhi (CPCB) is executing a nation-wide programme of ambient air quality monitoring known as National Air Monitoring Programme (NAMP). The programme was started in the year 1984-85 from Agra and Anpara in Uttar Pradesh and gradually the network has been extended to various parts of the country.
Under the National Air Monitoring Programme (NAMP), the Central Pollution Control Board (CPCB) with the assistant of 26 State Pollution Control Board (SPCBs) in respective States, 5 Pollution control Committees (PCCs) in various UTs along with the National Environment Engineering Research Institute, Nagpur (NEERI), a laboratory of Council for Scientific and Industrial Research) is monitoring ambient air quality through 363 stations in 139 cities as on 30.11.2009 across the country.

3
National Environment Engineering Research Institute (NEERI), Nagpur has been operating a nation-wide air quality monitoring network since 1991. This programme, sponsored by the Central Pollution Control Board, has been instrumental in forming a database to study the long-term air quality trends for health-related critical pollutants, such as suspended particulate matter (SPM), respiratory particulate matter (RPM), sulphur dioxide (SO2), nitrogen dioxide (NO2), ammonia (NH3), hydrogen sulphide (H2S), polycyclic aromatic hydrocarbons (PAHs) and toxic trace metals. The monitoring is carried out as per the National Ambient Air Quality Standards/ Procedures. The RPM samples are chemically analyzed to determine concentrations of toxic trace metals and PAHs. The meteorology data is collected from India Meteorological Department (IMD). The air quality database has been formed for six Indian cities, viz, Chennai, Delhi, Hyderabad, Kolkata, Mumbai and Nagpur pertaining to 2008.
2.3 National Ambient Air Quality Monitoring Programme (NAMP) and Prameters :
N.A.M.P. started in 1984 with 7 stations in Agra and Anpara. Presently 424 operating stations in 175 cities/towns.
Parameters being monitored SO2, NO2, RSPM (PM10), SPM at all stations. Trace Metals, PAHs, NH3 in few cities; BTX, Ozone monitoring conducted in Delhi and some major cities Following parameters need to be monitored :
o PM2.5, Benzo(a) Pyrene, o Carbon Monixide
2.4 What will change with revised air quality standards?
National Ambient Air Quality Standards are the limits for levels of air pollutants with an adequate margin of safety to protect the public health, vegetation and property.
The important changes are:
Air quality assessment will now be done on the basis of five new parameters - Ozone, Arsenic, Nickel, Benzene, Benzopyrene - that have been included for the first time under NAAQS.
Area classification based on land-use has been done away with so that industrial areas have to conform to the same air pollution standards as residential areas.
Act as a whistleblower for automobile companies as it will compel them to switch to fuel efficient engineering.
The standards shall be applicable uniformly with the exception of stringent standards for nitrogen dioxide and sulphur dioxide in nine ecologically sensitive areas in the country to protect the rare and endangered flora and fauna.
The standard for nitrogen oxide has been made more stringent, from the existing 60 microgramme per cubic metre, it has been tightened down to 40 microgramme per cubic metre.
The standards have brought two deadly pollutants - PM 2.5 and ozone - within the ambit of regulation. Both of these have begun to rise in cities. Delhi, particularly, has already begun to experience ozone pollution.
Suspended Particulate matter as parameter has been replaced by fine particulate matter (PM 2.5) which is more relevant for public health.
PM 2.5 are tiny particles in the air that reduce visibility and cause the air to appear hazy when levels are elevated. Exposure to fine particles can cause health effects such as eye, nose, throat and

4
lung irritation, coughing, sneezing, runny nose and shortness of breath. It can also affect lung function and worsen medical conditions such as asthma and heart disease.
Enforcement agencies - National Green Tribunal (NGT) and National Environment Protection Authority (NEPA) - are being formed to ensure effective enforcement of the standards.
Fig-1: Growth of National Air Quality Monitoring Stations in India [4]
Fig.2 : NAMP Network at a Glance [4]
Existing stations (sanctioned) 604
Operating stations 424
Target on XIth five year plan 700
Target on XIIth five year plan 1000
Proposal Required for new stations (within next F.Y. 2010-2011 & 2011-2012)
150
Road Map to achieve target 2010-2012
604+150=754

5
National Ambient Air Quality Standards (NAAQS) of India
Pollutants Time
Weighted Average
Concentration in Ambient Air (g/m3)
Method of Measurement
Pre-Revision NAAQS
Revised NAAQS (w.e.f. Nov. 2009)
Sensitive Areas
Industrial
areas
Residential, Rural and
other Areas
Industrial, Residential, Rural and
other Areas
Ecologically Sensitive
Areas
Sulphur Dioxide
Annual 15 80 60 * 50 20 -Improved West and Gaeke method
-Ultravoilet flurescenece
24 hrs 30 120 80 ** 80 80
Nitrogen Dioxide
Annual 15 80 60 * 40 30 -Modified Jacob and Hochheiser modified (Na-Arsenite)
-Chemiluminescence) 24 hrs 30 120 80 ** 80 80
Suspended
particulate
matter (SPM)
Annual 70 360 140
--
--
-High-volume sampling
(average flow rate not
less than 1.1m3 /min) 24 hours
100
500
200
-- --
Particulate Matter(size
less than 10μm) or
PM10
Annual -- -- -- 60 60 -Gravimetri
-TOCM
-Beta-attenuation 24 hours
-- -- -- 100
100
Particulate Matter(size
less than 2.5μm) or
PM2.5
Annual --
--
--
* 40
40
-Gravimetri
-TOCM
-Beta-attenuation 24 hours
-- -- -- ** 60 60
PM10 Annual 50 120 60 * -Respirable particulate
matter sampler 24 hours 75 150 100 ** -- --
Lead
Annual 0.50 1.0 0.75 * 0.50 0.50 -AAS/ICP method after sampling on EPA 2000or equivalents filter paper
-ED-XRF using Teflon filter
24 hours
--
--
--
**
1.0
1.0
Contd…….

6
Table Contd……
Carbon
Monoxide
(mg /m3)
24 hrs 0.75 1.5 1.0 ** -- -- -Non-dispersive infrared
(NDIR) spectroscopy
8 hrs 1.0 5.0 2.0 ** 02 02
1 hr 2.0 10.0 4.0 * 04 04
Ammonia Annual 400 * 100 -Chemiluminescence
- Indophenol blue method 24 hrs 100 ** 400
Ozone (O3) `8 hrs -- -- -- * 100 100 -UV photometric
-Chemilminescence
-Chemical method 1hr -- -- -- ** 180 180
Benzene
(C66H6)
Annual -- -- -- * 05 05 -Gas Chromatgraphy based continuous analyze
-Adsorption and Desorption followed by GC analysis
Benzo(a) Pyrene(BaP)-
Particular Phase only
Annual -- -- -- * 01 01 -Solvent extraction followed by HPLC/GC analysis
Arsenic (AS) ng/m3
Annual -- -- -- * 06 06 -AAAS/ICP method after sampling on EMP 2000 or equivalent filter paper
Nickel (Ni) ng/m3
Annual -- -- -- * 20 20 -AAAS/ICP method after sampling on EMP 2000 or equivalent filter paper
* Annual arithmetic mean of minimum 104 measurements in a year at a particular site taken twice a week 24 hourly at uniform intervals.
** 24 hourly or 08 hourly or 01 hourly monitored values, as applicable, shall be complied with 98% of the time in a year. 2% of the time, they may exceed the limits but not on two consecutive days of monitoring Note: - Whenever and wherever monitoring results on two consecutive days of monitoring exceed the limits
specified above for the respective category, it shall be considered adequate reason to institute regular or continuous monitoring and further investigation.

7
3.0 PEDESTRIAN LEVEL WIND ENVIRONMENT IN THE VICINITY OF TALL
BUILDINGS
3.1 Introduction
Tall buildings, which are being constructed all around the world today in response to social and economic needs not only increase a city’s image but also satisfy the increasing demand for city-center office space.
Tall buildings also affect the surrounding pedestrian-level wind environment by diverting high speed upper level winds to ground level which in turn can affect the safety and comfort of the users frequenting these buildings and the surrounding areas.
Low wind speeds on the other hand also provide reasons for concern as such areas may lead to poor outdoor wind ventilation and aid in the mixing of pollutants.
3.2 Field Surveys
A survey of some tall buildings in Dwaraka, Delhi, Ghaziabad, Greater Noida and Gurgaon was carried out to examine the potential for wind speed amplification in several tall buildings. Most of the tall buildings in India have soft storeys which are a source of potential threat from the seismic point of view. In many tall residential buildings balconies are provided at the corners which are normally areas which attract strong winds.
Wind speed amplification ( as high as 9 to 10m/s) was recorded at the base of several tall hotel buildings of around 35 stories in Mumbai and in the vicinity of tall apartment buildings ( 7 to 8m/s) by one of the authors (3) using a hand held anemometer. These studies though not supported by wind data from nearby metereological stations however give a rough idea of the problems that could occur in the base of tall buildings which are mushrooming all over the country, especially Mumbai, Gurgaon etc.
Photo.1 Apartment buildings at Dwaraka, Photo.2 Office buildings in Nehru Place New Delhi New Delhi
POTENTIAL FOR WIND SPEED AMPLIFICATION DUE TO GAP EFFECT

8
Photo. 3 Tall buildings at Ghaziabad Photo.4 Wind damage to parapet of tall building
Photo.5 Views of tall buildings at Hiranandani Gardens, Mumbai where winds speeds of more than 7m/s were recorded.
9
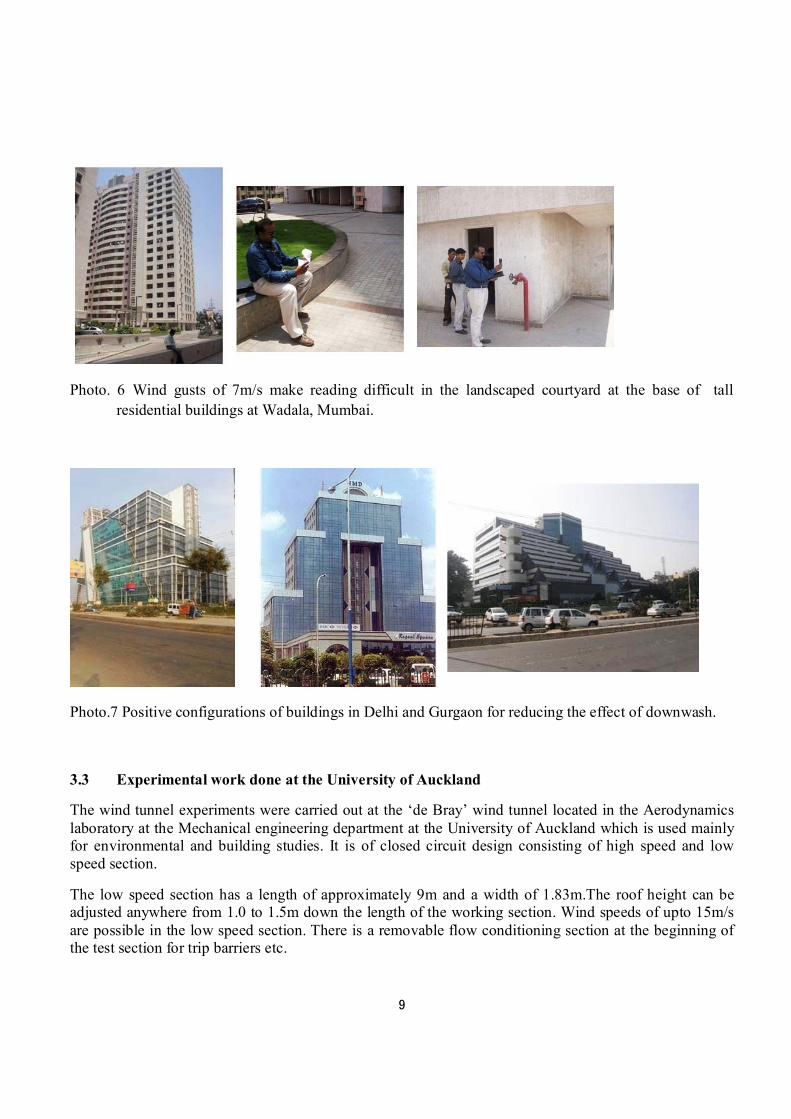
Photo. 6 Wind gusts of 7m/s make reading difficult in the landscaped courtyard at the base of tall residential buildings at Wadala, Mumbai.
Photo.7 Positive configurations of buildings in Delhi and Gurgaon for reducing the effect of downwash.
3.3 Experimental work done at the University of Auckland
The wind tunnel experiments were carried out at the ‘de Bray’ wind tunnel located in the Aerodynamics laboratory at the Mechanical engineering department at the University of Auckland which is used mainly for environmental and building studies. It is of closed circuit design consisting of high speed and low speed section.
The low speed section has a length of approximately 9m and a width of 1.83m.The roof height can be adjusted anywhere from 1.0 to 1.5m down the length of the working section. Wind speeds of upto 15m/s are possible in the low speed section. There is a removable flow conditioning section at the beginning of the test section for trip barriers etc.

10
Photo. 8 Conceptual sketch of cluster of tall Photo. 9 Viewof model (scale1:400) buildings
Photo.10 Upstream( left) and downstream( right) views of model in wind tunnel with the addition of bran
3.4 Experimental Procedure and Analysis
The image processing system, developed by Eaddy (1), was used for the present study. The pedestrian wind tests consisted of ground level investigations of wind conditions using erodible bran flakes as a wind speed indicator. At the UoA bran is used as the erodible material as it completely covers the test regions so that image processing can be used to determine cleared areas. The model is painted black to provide optimum contrast with the erodible material.(Photo)
As a first step the threshold velocity of bran UWT,E i.e. the velocity at which bran sprinkled on the turntable floor erodes ( without the building model) is found. The threshold velocity of bran as reported by Flay [6,10] is around 2.5m/s.
In the second step, the building model is placed on the turntable and the floor of the model is covered with a uniform layer of bran. The wind tunnel speed is increased in steps and the bran erosion that occurs at each step is allowed to reach a steady state. The eroded areas are photographed by a Charge coupled camera mounted on the ceiling of the wind tunnel.

11
After the building model is placed in the wind tunnel and the wind tunnel speed is increased from zero, the first bran erosion occurs at the operating speed U WT,1, which is less than UWT,E ( threshold speed of bran). This happens since wind speeds at ground level get amplified by the presence of the buildings. This increase in wind speed is given by the ratio UWT,E / U WT,1 i.e. the local amplification factor which Beranek terms as discomfort parameter.[17]. Areas where the first signs of erosion occur (erosion contours greater than 1) are areas with wind speed amplification and erosion contours with discomfort parameter less than 0.52 may be seen as areas of wind speed stagnation.
The results of the wind tunnel tests were combined with long term (Delhi-Palam) meteorological data and analyzed by computer to predict the percentage of time that various wind speeds are likely to be exceeded in the vicinity of the proposed neighborhood model. The image processing system automatically performs the analysis outlined by Flay [2] producing colour images that contain the pedestrian wind categories, for each test situation.
Photo.11 Wind amplification zones for 300 occur in the corners and behind the shorter building located in the wake of the tall building.
Photo:12 Stagnation zones with varying heights of tall block in central cluster. (Left: 54m high, Right: 160m high)

12
Photo. 13 Erosion patterns after the addition of mitigation features
Photo.14 Without mitigation measures Photo.15 After mitigation measures- Wind direction 300
Photo.16 Without mitigation measures Photo. 17 With mitigation measures- Wind direction 600

13
4.0 SUMMARY
The Government has recently revised the National Ambient Air Quality Standards (NAAQS) and limits for 12 pollutants have been notified. Area classification based on land –use has been done away with so that industrial areas have to conform to the same standards as those for residential areas. The annual average norms for Lead, Nitrogen Dioxide (NO2), Arsenic, Nickel, Benzene and Benzo(a ) Pyrene in ambient air are at par with the European Union norms. However, the norms for Particulate Matter having size less than 10 micron (PM10 ) and Particulate Matter having size less than 2.5 micron (PM2..5) are more relaxed than EU norms. Indian norms for Carbon Monoxide, Ozone and Sulphur Dioxide (SO2) are more stringent than EU norms. Ammonia is additionally included in our NAAQS.
Several parametric studies were carried out by varying the height of the tall building in the central cluster and also with different configurations of blocks in the central cluster. Areas of wind speed amplification and stagnation for eight wind directions in each case have been identified. Photos show how the location of speed up zones shift with change in wind direction. The stagnation zones for different wind directions and configurations have been identifies. These would be areas of poor ventilation.
Several authors have studied the role of mitigation measures in buildings and their environs [1,2,3,5,9,13,16]. The role of hard and soft landscape features such as fences and trees and the effect of the addition of a podium and canopy to two tall buildings in the central cluster has been studied. The study has shown that the addition of such mitigation measures can reduce the effect of wind amplification. (Photos) Further through the strategic placement of landscaping elements such as trees wind speed could also be enhanced in areas of poor ventilation [15].
5.0 CONCLUSION India for the first time will now have a uniform health-based National Ambient Air Quality Standard (NAAQS), discontinuing the old practice of setting air quality standards for different land use classes like residential and industrial. The new ambient air quality standards, revised after a gap of 15 years, provide a legal framework for the control of air pollution and the protection of public health.
For architects and planners it becomes important to know whether the wind environment in the vicinity of tall buildings is conducive for pedestrian related activities. In the event of the occurrence of adverse wind conditions mitigation measures in the form of hard and soft landscape and architectural elements could help ameliorate excessive wind speeds and enhance wind speeds in poorly ventilated areas.
Wind tunnel investigations would help architects make an assessment of the wind environment to avoid expensive modifications at a later date. The scour technique coupled with the image processing system gives a visual representation of areas of wind speed amplification and stagnation over large areas. This would help architects and developers in taking informed decisions with regard to pedestrian comfort especially in the vicinity of tall buildings.
ACKNOWLEDGEMENT
The work of Central Pollution Control Board (CBCP) New Delhi, National Environmental Engineering Research Institute (NEERI) Nagpur and Indian Institute of Technology Kanpur is duly acknowledged.

14
The guidance provided by Richard G.J. Flay, Director, Yatch Research Unit and Deputy Head, Department of Mechanical Engineering, University of Auckland, New Zealand for carrying out this study is gratefully acknowledged.
Financial assistance provided by the University of Auckland, New Zealand; Centre of Excellence in Disaster Mitigation & Management, Indian Institute of Technology Roorkee, Council of Architecture, New Delhi, India and Piloo Mody College of Architecture, Cuttack India for carrying out this study is gratefully acknowledged.
6.0 REFERENCES
1. http://www.epa.gov/ttn/atw/allabout.hrml
2. http://www.neeri.res.in
3. http://www.cpcb.nic.in
4. Kamyotra, J.S., (Member Secretary, CPCB presentation agenda item no.3.0), 56th Conference of Chairmen/Member Secretaries of Pollution Control Boards / Committees at New Delhi, August 2010.
5. Mohan K., Gairola Ajay and Mukherjee Mahua, Strategies for Mitigating the Adverse Effects of Pedestrian Level Winds in the Vicinity of Tall Buildings, National Research Conference on Disaster Mitigation in Housing in India: An Agenda For Future, Vol 1, March19-20, 2010, IIT Roorkee, Roorkee
6. Mohan K., Flay R.G.J, Gairola A., Mukherjee M., Guha T., Erosion Tests for Assessing Wind Speed Amplification in the Vicinity of Tall Buildings, National Research Conference on Disaster Mitigation in Housing in India: An Agenda For Future, Vol. 1, March19-20, 2010, IIT Roorkee, Roorkee.
7. Gautam, Sant Prasad, Central Pollution Control Board, New Delhi, India, Notification no.B-29016/20/90/PCI-L dated 18th November, 2009.
8. McCardle R.D., (2008) Wind Tunnel Investigations of erosion and point measurements to determine wind comfort levels- Project Report 2008-ME%), Department of Mechanical Engineering, University of Auckland.
9. Mohan K., Role of Vegetation and Landscaping in Wind Control in and Around Buildings, Proceedings of Second National Conference on Wind Engineering (NCWE-04), Nagpur, India, February12-14
10. Eaddy M. and Flay R.G.J., Image Processing applied to pedestrian level wind investigations, IPENZ Transactions, Vol.25, No.1/EMCH, 1998
11. Stathopoulos T., Wind effects on low buildings shielded by trees, Wind Engineering, Thomas Telford, London, 1993, pp113-122.
12. Livesey et al, (1992) Enhanced Scour Tests to Evaluate Pedestrian Level Winds, Journal of Wind Engineering and Industrial Aerodynamics, 41-44,pp 2265-2276

15
13. Uematsu et al, (1992), Effects of the Corner Shapes of High-rise Buildings on the Pedestrian-Level Wind Environment with Consideration for Mean and Fluctuating Wind Speeds, Journal of Wind Engineering and Industrial Aerodynamics, 41-44, pp2301-2312
14. Flay R.G.J., Wind Environment Measurements and Acceptance Criteria developed at the University of Auckland, In: Proceedings of the Tenth Australasian Fluid Mechanics Conference- University of Melbourne, Melbourne, Australia, 11-15 Dec. 1989.
15. Beranek, W.Jk (1984), Wind Environment Around Building Configurations, Hron, 29 (1), pp 33-70.
16. Beranek W.J. and Koten Van, Visual Techniques for the Determination of Wind Environment, Journal of Industrial Aerodynamics 4, (1979), pp 295-306.
17. R.M.Aysnsley, W.Melbourne and B.J.Vickerey, Architectural Aerodynamics, Applied Science Publishers, 1977.
18. Gerhardt H.J. and Kramer C., Wind Climate in City-centres: Pedestrian Comfort versus accumulation of pollutants.


![APEC Connectivity Blueprint[2] - espas.euespas.eu/orbis/sites/default/files/generated/document/en/APEC... · APEC CONNECTIVITY BLUEPRINT FOR 2015-2025 ... Engagement with APEC Business](https://static.fdocuments.net/doc/165x107/5affac897f8b9a54578b773e/apec-connectivity-blueprint2-espas-connectivity-blueprint-for-2015-2025-.jpg)