APEC Renewable Energy Forecast · 2019-11-09 · In 2016, APEC generated 56% of global renewable...
20
APEC Renewable Energy Forecast Alexey Kabalinskiy | Victor Martinez, Researcher The 53 th Meeting of APEC Expert Group on Renewable Energy Technologies (EGNRET) Seoul, South Korea, 23 Oct 2019 Challenges from RE side to achieved APEC energy goals
Transcript of APEC Renewable Energy Forecast · 2019-11-09 · In 2016, APEC generated 56% of global renewable...

APEC Renewable Energy Forecast
Alexey Kabalinskiy | Victor Martinez, Researcher
The 53th Meeting of APEC Expert Group on Renewable Energy Technologies (EGNRET)Seoul, South Korea, 23 Oct 2019
Challenges from RE side to achieved APEC energy goals

What does APERC’s Outlook do?
Challenges faced by APEC economies:
▪ Affordably meet growing energy demand▪ Reduce negative energy-related
environmental impacts
▪ Enhance energy security and resilience
APERC’s 7th Edition Outlook aims to answer:
▪ What would energy demand, supply, and emissions in APEC look like in 2050, based on present practices?
▪ How can we achieve global decarbonisation goals?
▪ How would acting on such goals change future energy demand, supply, investment, or security?
2
APEC primary energy supply mix [%]

The “Outline” slide is optional.They are recommended for long presentations, but not for the shorter ones.
Renewables modelling in the 7th Edition
• Integrated renewables analysis into Demand and Power models;
• Improved policy analysis, incorporate technical limits etc.;
• Expanded list of renewable technologies: separated large, medium, small and pumped hydro; onshore and offshore wind; and introduced concentrated solar power and marine energy;
• Improved hourly demand and generation data (load curves) to quantify the impacts of variable renewables in Electricity;
• Assessed potential for renewable heating and cooling;
• Based on historical data availability biomass is counted as traditional in Residential and Commercial buildings and Agricultural and non-specified.

Scenarios
4
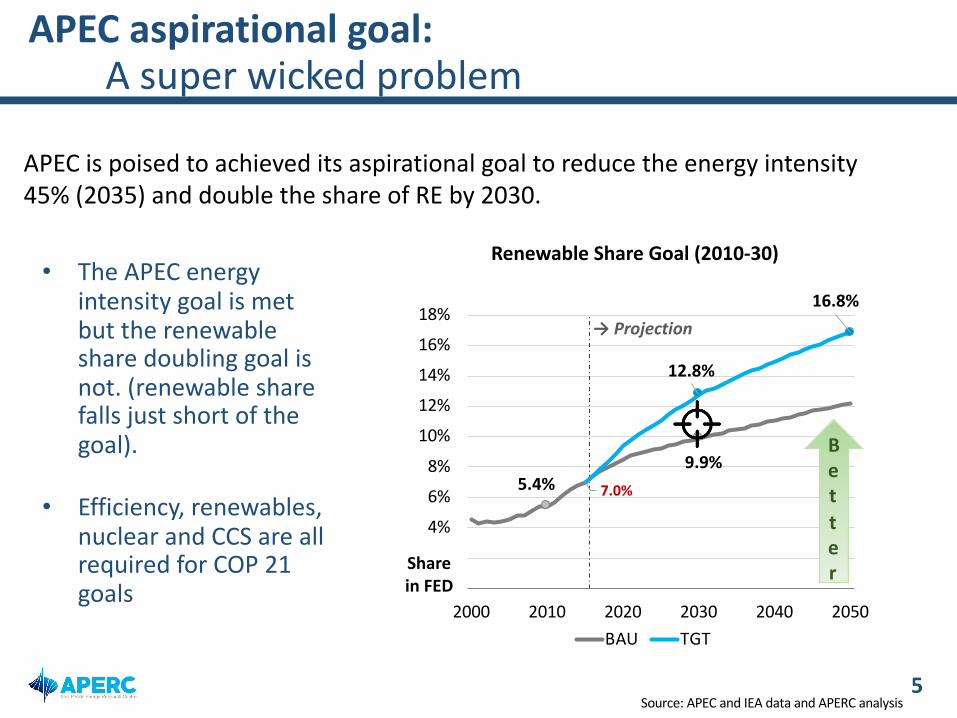
APEC is poised to achieved its aspirational goal to reduce the energy intensity 45% (2035) and double the share of RE by 2030.
Source: APEC and IEA data and APERC analysis
APEC aspirational goal:A super wicked problem
5
• The APEC energy intensity goal is met but the renewable share doubling goal is not. (renewable share falls just short of the goal).
• Efficiency, renewables, nuclear and CCS are all required for COP 21 goals
5.4%9.9%
7.0%
12.8%
16.8%
0%
2%
4%
6%
8%
10%
12%
14%
16%
18%
2000 2010 2020 2030 2040 2050
Sharein FED
Renewable Share Goal (2010-30)
BAU TGT
→ Projection
Better

In 2016, APEC generated 56% of global renewable energy (TWh)
6
• In 2000-16, APEC generated 49% to 56% of global renewables electricity.
• Key drivers have been hydro and wind generation.
Sources: IRENA (2018), APERC analysis.
0
1 000
2 000
3 000
4 000
5 000
6 000
2000
HYDR
O
SOLA
R
WIN
D
BIO
-EN
ERGY
GEO
-TH
ERM
AL
TIDA
L
2016
TWh
TIDALGEOTHERMALBIOENERGYWINDSOLARHYDROWorld

Share of renewables grows in all scenarios
7
• The doubling goal is NOT achieved in BAU, and energy sector is dominated by fossil fuels;
• In TGT, accelerated development of renewables achieve the goal in 2025.
Sources: IEA (2018), APERC analysis.
15.8%
24.9%
12.8%
16.8%
5.4%
12.2%
0%
5%
10%
15%
20%
25%
30%
35%
0
1 000
2 000
3 000
4 000
5 000
6 000
7 000
2000 2010 2020 2030 2040 2050
Shar
e of
rene
wab
les
Mtoe
Other
Heat
Electricity (non-renewable)
Electricity (renewable)
Renewables (modern)
Renewables (traditional)
Gas
Oil
Coal
RE share in 2DC (right axis)
RE share in TGT (right axis)
RE share in BAU (right axis)
→ Projection
APEC Final Demand in BAU share of renewables

Slightly more renewables in the TGT Scenario
Energy efficiency and renewables in the BAU and TGT, 2010-30
Final energy demand falls (mainly transport), but renewable supply increases (mainly solar), which has a two-fold impact on the doubling goal.
Sources: APERC analysis and IEA (2018). 8

To reach the renewables doubling goal, APEC needs to add an average 119 GW of renewable capacity (excluding pumped hydro) each year from 2016 to 2030, a 25% increase on the average additions in the BAU.
9Sources: APERC analysis and IEA (2018).
25% more renewable capacity additions needed per year in TGT
Generation capacity by fuel, TGT to BAU, 2016-50

Electricity drives renewable development
10
• In BAU, renewable electricity more than triples and accounts for 70%,• In TGT, combination of energy efficiency and modest RE growth, helps achieve the
doubling goal,• In 2DC, Electricity decarbonisation drives renewables demand.
Sources: IEA (2018), APERC analysis.
Renewables by sector, 2000-50 Sectoral renewables index, 2010-30
-
500
1 000
1 500
2 000
BAU TGT 2DC
2000 2010 2050
Mtoe
Agricultureand otherElectricity
Buildings
Transport
Industry
→Projection
0
1
2
3
4
5
6
7
2010
2030
Industry
2010
2030
Transport
2010
2030
Buildings
2010
2030
Electricity
2010
2030
Agriculture and other
Index(2010=1)
0
1
2
3
4
5
6
7
2010
2030
Industry
BAU
TGT
2DC

To meet the 2DC pathway, RE would need to increased and its requires consolidated efforts by all APEC economies.
11
For the electricity sector, the deployment of a range of technologies, including VRE is needed.
0
1 000
2 000
3 000
4 000
5 000
6 000
7 000
8 000
9 000
10 000
2016 2020 2030 2040 2050GW
Capacity
Coal Coal w/ CCS Oil Gas
Gas w/ CCS Nuclear Hydro Wind
Bioenergy Bioenergy w/ CCS Solar Geothermal & others
Storage Net imports
→ Projection
0
4 000
8 000
12 000
16 000
20 000
2016 2020 2030 2040 2050TWh
Generation
→ Projection• Electricity generation from VRE in 2DC reaches 31% at 2050.
• Emission reduction is achieved by installed solar PV and wind power instead of fossil fuel-based power plants.
Power capacity [GW] and electricity generation [TWh] by fuel, 2016-50

To reach the renewables doubling goal, APEC needs to add an average 119 GW of renewable capacity (excluding pumped hydro) each year from 2016 to 2030, a 25% increase on the average additions in the BAU.
12
25% more RE capacity additions in TGT
Sources: APERC analysis and IEA (2018).
30%
41%
51%
49%
58%
53%
60%
0
2 000
4 000
6 000
8 000
10 000
Foss
il
Nuc
lear RE
Foss
il
Nuc
lear RE
Foss
il
Nuc
lear RE
Foss
il
Nuc
lear RE
Foss
il
Nuc
lear RE
Foss
il
Nuc
lear RE
2030 2050 2030 2050 2030 2050
2016 BAU TGT 2DC
GW
Installed capacity by fuel, 2016-50 Storage
Geothermal &othersSolar
Bioenergy
Wind
Hydro
Nuclear
Gas
Oil
Coal
BAU TGT 2DC

APEC renewable electricity generation share grows
13
• In BAU, the share of renewable electricity grows from 21% to 32%;
• In TGT, electricity demand is 16% below BAU and the share reaches 39%;
• In 2DC, carbon-free electricity is 76%; 58% is RE, driven by wind and biomass.
21%
28%
32%
34%
39%
41%58%
0
5 000
10 000
15 000
20 000
25 000Fo
ssil
Nuc
lear RE
Foss
il
Nuc
lear RE
Foss
il
Nuc
lear RE
Foss
il
Nuc
lear RE
Foss
il
Nuc
lear RE
Foss
il
Nuc
lear RE
2030 2050 2030 2050 2030 2050
2016 BAU TGT 2DC
TWh
Electricity generation by fuel, 2016-50Geothermal &othersSolar
Bioenergy
Wind
Hydro
Nuclear
Gas
Oil
Coal
BAU TGT 2DC Sources: IEA (2018), APERC analysis

Estimating solar potential in buildings
14
• Solar photovoltaic (PV) potential exceeds 4 500 TWh, or 395 Mtoe, in 2050.
• MAX HEAT is a case with maximised solar heating deployment. Solar water heating could supply over
30% of residential demand.
Source: APERC analysis.
0
1 000
2 000
3 000
4 000
5 000
BAU TGT 2DC MAXHEAT
2016 2050
TWh
Solar PV potential, 2016-50
Solar PV inServices
Solar PV inResidential
0
200
400
600
800
1 000
BAU TGT 2DC MAXHEAT
2016 2050
TWh
Solar hot water potential, 2016-50
Solar hotwater inServices
Solar hotwater inResidential

Electricity decarbonises the most in 2DC
15
• In TGT, electricity accounts for 37% of CO2 reduction followed by transport (36%).
• In 2DC, the sector decarbonises the most (-91%), contributing nearly 2/3 of the total.
0
5 000
10 000
15 000
20 000
2016 BAU2050
- TGT2050
- 2DC2050
MtCO2
APEC CO2 emissions, by sector, 2016-2050
Buildings
Industry
Transport
E_Own
Electricity
Sources: IEA (2018) and APERC analysis.

From the policymakers' side, increasing renewable deployment requires
16
• A strong institutional framework to support policies and specific energy targets: i.e., carbon neutrality policy.
• Tender process (auctions) to support the entrance and uptake of renewables.
• Easy access and priority for small-scale renewables developers• Utility obligations/quotas (share) for modern renewables. • Net-metering/ Net-billing implementation for end users.• Gradually incorporation of carbon-tax and associated environmental
policies to boost competitiveness.• Reliability and adequacy in the power system need to be addressed:
Flexibility is required to maximize the efficient integration of VRE.

The energy transition is an opportunity to increase the role of renewables in the energy mix but there is not a single recipe.
17
• New trends and technological advances/disruptions.• Improved technical-economics modeling of energy systems• Working with local communities• Strength education in energy, economy and related subjects.• New financial and market mechanisms for low-carbon technologies.• Economical alternatives to carbon-intensive technologies and potential
phase-out of inefficient power plants i.e., subcritical coal power plants.• Direct and indirect effects of decarbonization policies on jobs local
communities in the short and mid-term.
A dynamic policy is needed to articulate:

18
New Outlook is underway…
We have been providing data and analysis from the Outlook to support policy actions from the economies, and we open to suggestions to improve the 8th Edition of the Outlook.

https://aperc.ieej.or.jp/https://aperc.ieej.or.jp/publications/reports/outlook.php
Thank you!
19

The “Outline” slide is optional.They are recommended for long presentations, but not for the shorter ones.
20
Further related Work Decarbonization roadmap
This is an opportunity to review the outcomes of the document: “Filling the Gap to Double Renewable Energy in the APEC Region” and update its objectives.
• Incorporating an additional perspective toward carbon neutrality, i.e., a multidisciplinary approach.
• Efficient integration of variable renewable energy.• Carbon consequences of investment decisions, i.e., tipping
points of gas investment who may affect emissions targets. • Roadmap periodicity and flexibility.


![APEC Connectivity Blueprint[2] - espas.euespas.eu/orbis/sites/default/files/generated/document/en/APEC... · APEC CONNECTIVITY BLUEPRINT FOR 2015-2025 ... Engagement with APEC Business](https://static.fdocuments.net/doc/165x107/5affac897f8b9a54578b773e/apec-connectivity-blueprint2-espas-connectivity-blueprint-for-2015-2025-.jpg)