APAS MONTHLY - Ashvin Parekh Advisory Services LLP Monthly_May 2019.pdf · opens allotment ‘on...
33
2019 Volume 5 THIS MONTH Season’s greetings! In this issue, Mr. Amit Tandon, Founder & MD, IiAS, has presented his thoughts on ‘Corporate Governance: The Journey to 4G’. We thank Mr. Amit Tandon for his contribution to the APAS Monthly. This month, the APAS column presents its views on ‘Impact of US-China and US-Iran relations’. The economic indicators showed mixed performance. Manufacturing PMI fell to an 8-month low of 51.8 in April from 52.6 in March. India’s annual infrastructure output in April grew at 2.6%. India's Index of Industrial Production (IIP) slowed to a 21-month low of 0.1% in March. PMI services fell to a 7-month low of 51 in April from 52 in March, while composite PMI dipped to 51.7 in April from 52.7 in March. CPI inflation rose to a 6-month high of 2.92% in April from 2.86% in March. WPI inflation slipped to 3.07% in April from 3.18% in March. The Gross Domestic Product (GDP) growth rate for the fourth quarter (January-March) of 2018-19 slipped to a 20-quarter low of 5.8%. For the full year 2018-19, GDP slumped to a 5-year low of 6.8%. The Reserve Bank of India (RBI) released Second Bi-monthly Monetary Policy Statement, 2019-20. The RBI notified the revised Voluntary Retention Route for Investments by Foreign Portfolio Investors (FPIs) and opened allotment ‘on tap’. The RBI also released guidelines on Extension of Timings for Customer Transactions on Real Time Gross Settlement (RTGS) System. APAS MONTHLY
Transcript of APAS MONTHLY - Ashvin Parekh Advisory Services LLP Monthly_May 2019.pdf · opens allotment ‘on...
2019
Volume 5
THIS MONTH
Season’s greetings!
In this issue, Mr. Amit Tandon, Founder & MD, IiAS, has presented his thoughts on ‘Corporate
Governance: The Journey to 4G’. We thank Mr. Amit Tandon for his contribution to the APAS
Monthly.
This month, the APAS column presents its views on ‘Impact of US-China and US-Iran relations’.
The economic indicators showed mixed performance. Manufacturing PMI fell to an 8-month low of
51.8 in April from 52.6 in March. India’s annual infrastructure output in April grew at 2.6%. India's
Index of Industrial Production (IIP) slowed to a 21-month low of 0.1% in March. PMI services fell to
a 7-month low of 51 in April from 52 in March, while composite PMI dipped to 51.7 in April from
52.7 in March. CPI inflation rose to a 6-month high of 2.92% in April from 2.86% in March. WPI
inflation slipped to 3.07% in April from 3.18% in March.
The Gross Domestic Product (GDP) growth rate for the fourth quarter (January-March) of 2018-19
slipped to a 20-quarter low of 5.8%. For the full year 2018-19, GDP slumped to a 5-year low of 6.8%.
The Reserve Bank of India (RBI) released Second Bi-monthly Monetary Policy Statement, 2019-20.
The RBI notified the revised Voluntary Retention Route for Investments by Foreign Portfolio
Investors (FPIs) and opened allotment ‘on tap’. The RBI also released guidelines on Extension of
Timings for Customer Transactions on Real Time Gross Settlement (RTGS) System.
APAS
MONTHLY
The Insurance Regulatory and Development Authority of India (IRDAI) released guidelines on
Reconciliation of Co-Insurers Balance from ETASS. IRDAI also released guidelines on Preparation
of Financial statements for FY 2019-20 and Onwards.
Ministry announced PM-KISAN Scheme extension to include all eligible farmer families irrespective
of the size of land holdings. Ministry also announced Pension scheme to secure lives of 5 crore farmers
in three years.
Securities Exchange Board of India (SEBI) released norms on Participation of Mutual Funds in
Commodity Derivatives Market in India.
We hope that this APAS Monthly is insightful. We welcome your inputs and thoughts and encourage
you to share them with us.
Ashvin parekh
On the cover
GUEST COLUMN
Mr. Amit Tandon Founder & MD IiAS Corporate Governance: The Journey to 4G
ECONOMY
➢ Index of Industrial Production – March
➢ Inflation update – April
➢ PMI update – April
➢ Core Sector – April
➢ GDP – Q4 – FY 18-19
APAS COLUMN
Impact of US-China and US-Iran relations
INSURANCE ➢ Reconciliation of Co-Insurers Balance from ETASS
➢ Preparation of Financial Statements for FY 2019-20
and Onwards
INFRASTRUCTURE & OTHER
GOVT. INITIATIVES
➢ PM-KISAN Scheme extension to include all eligible
farmer families irrespective of the size of land
holdings
➢ Pension scheme to secure lives of 5 crore farmers in
three years
BANKING
➢ Second Bi-monthly Monetary Policy Statement, 2019-20
Resolution of the Monetary Policy Committee (MPC),
Reserve Bank of India
➢ RBI notifies the revised Voluntary Retention Route for
Investments by Foreign Portfolio Investors (FPIs) and
opens allotment ‘on tap’
➢ Real Time Gross Settlement (RTGS) System – Extension of
Timings for Customer Transactions
CAPITAL MARKETS SNAPSHOT
➢ CNX Nifty, BSE Sensex, India VIX, $/₹, GIND 10Y
CAPITAL MARKETS
➢ Participation of Mutual Funds in Commodity
Derivatives Market in India
ECONOMIC DATA SNAPSHOT
➢ Global GDP, CPI, Current account balance, budget
balance, Interest rates

It is convenient to characterize telecom technology from 1G (voice), to 2G (SMS, MMS), 3G (data, mobile
internet), 4G (videoconferencing, mobile TV, gaming). We can similarly label India’s corporate governance
(CG) journey, which is described below:
First generation
India’s journey began in 1997 with the Confederation of Indian Industry setting up a task force, under Rahul
Bajaj, to look at CG. This was within five years of the UK setting up "The Committee on the Financial Aspects
of Corporate Governance," since known as the Cadbury Committee - after its chairman Adrian Cadbury, to
look at ‘the arrangement of company boards and accounting systems to mitigate corporate governance risks
and failures.’ The final CII report, with a quirky title ‘Desirable Corporate Governance: A Code’ was presented
a year later, in 1998 and it introduced the concept of CG to Indian markets. The committee did not define CG
and instead focused on a few elements – transparency, disclosures, boards, etc. It did recognize that
‘corporate governance goes far beyond company law’ – something that is usually forgotten.
A year later, SEBI formed a committee with Kumar Mangalam Birla in the chair. Its recommendations focused
on two aspects, focusing on Boards’ responsibilities and pushing for better disclosures. It introduced the audit
committee, the board composition with the need for independent directors. It highlighted the need for
quarterly reporting and the annual report containing an MD&A section.
Importantly, most of the recommendations were presented as mandatory - enforced on companies in a
phased manner - as the committee was of the view that ‘a statutory rather than a voluntary code would be
far more purposive and meaningful’.
These recommendations, better known as Clause 49, were incorporated into the listing agreement and rolled
out between 2000 and 2003.
Corporate Governance:
The Journey to 4G Mr. Amit Tandon Founder & MD IiAS
Second Generation
Even as the Listing Agreement was being adopted Enron and a number of other accounting scandals rocked
the US corporate establishment. The US quickly overhauled their accounting rules and investor protection
oversight through the Sarbanes-Oxley Act of 2002.
This resulted in a series of reviews of the CG landscape in India. First the Naresh Chandra Committee, with a
strong focus on the accounting framework – auditors, their appointment, fees, audit committees etc.). This
was followed by the 2003 Narayan Murthy Committee tasked to review the progress of the Kumar Mangalam
Committee and strengthen disclosures and then the 2005 JJ Irani Committee, to look at CG in the context of
the proposed revision to the Companies Act, 1956. The recommendations broadened the remit of what was
included in governance eg. risk management, related party transactions and deepened our understanding of
issues.
Third Generation
The next wave of reforms hit after the Satyam scam in 2009. While industry viewed Satyam as one-off and
cautioned against over-regulation, a series of regulatory changes, including the appointment of a qualified
CFO, timelines on disclosures and rotation of auditor (albeit voluntary) were brought in.
Satyam was important because it highlighted the primacy of good governance practices. Till the scam
happened governance had remained an amorphous idea. Satyam quantified the cost of its failure.
Fourth generation
The fourth generation of CG are driven by two specific themes: The first is the emphatic use of regulation to
enforce governance practices; the other is in empowering different stakeholders to assert their rights.
The Companies Act 2013, implemented in 2014 has completely modernized corporate law in India. It is far
more current that half-a-century-old predecessor and focuses very strongly on the corporate governance
agenda and in aligning these to the G20-OECD guidelines.
Some of what has been incorporated includes:
• Roles and responsibilities of the board
• Definition of an independent director
• Granular disclosures regarding CEO compensation
• Mandatory auditor rotation
• Tenure of independent directors
• E-voting
• Approval of related party transactions by the audit committee, and of majority of minority
shareholders under specified situations
• 2% of profits to be spent on Corporate Social Responsibility (comply or explain)
• One woman director on the board
• Permits class-action suits against the board
• National Financial Reporting Authority
Some of these like a mandatory woman director, and auditor rotation or on CSR spend are generating a global
debate.
This period also saw the listing guidelines being replaced by Listing Obligation and Disclosure Requirements
Regulation 2015 (LODR): The LODR is the consolidation of the compliance requirements by every listed entity
into one single document across various types of securities listed on a stock exchange. While many of the
requirements are aligned with the Companies Act 2013, there are several provisions that are more stringent.
The SEBI Committee on Corporate Governance, chaired by Uday Kotak, also examined CG Practices. Its
recommendations were aimed at achieving the dual objective of shareholder protection and long-term value
creation. The proposals covered a diverse set of items and push corporates towards improving board
effectiveness, enhancing oversight over group entities, tightening control over related party transactions,
providing timely disclosures, increasing focus on audit quality, and facilitating investor participation. The
proposed recommendations were grounded in market realities, and benchmark governance practices with
local and global practices.
Stepping back and looking at the arc of regulatory changes, three elements stand out. One, initially regulators
viewed CG as something you cannot regulate and have usually prescribing best practices. Companies pushed
back citing the letter, and not spirit of then law. It is only then that CG practices have had to be codified. Two,
regulations have increasingly come rely on disclosure as an enforcement tool: publicly disseminating
information will create comparability, thereby fostering an environment of competitive behavior that serves
shareholders and the corporate governance agenda. In addition, they propagate robust internal controls to
provide stronger oversight over on reign in the promoters. Three, there is a shift in thinking about how better
governance will be achieved. In the first blush regulations dealt with the rights and responsibilities of
companies. Today the focus is on the rights of stakeholders, as witnessed by the adopting of Stewardship
Codes by institutional investors.
In telecom, we are now gearing up to a transition to 5G. In a parallel move, I expect focus to shift to ESG –
environment, social and governance. This will be the next upgrade for regulators, investors and companies.
*Views are personal. Neither APAS nor any of its employees endorse any view, product or services mentioned in the article
US-China
On May 10, the US raised tariffs from 10% to 25% on USD 200 billion worth of imports from China and is
threatening tariffs on an additional USD 325 billion worth of Chinese goods. China retaliated by promising to
raise tariffs further on USD 60 billion in US exports.
Renewed talks of escalating tariffs and trade tensions between the US and China unnerved markets in India.
Indian benchmarks ended down for the ninth consecutive session on Monday, May 13, 2019. On the same
day, the rupee slipped to an over-two-month-low as foreign funds extended their share sale. With the latest
string of losses, the Sensex has equalled its nine-session losing streak in February this year. Nifty equalled its
2011 losing streak with this fall.
However, India was not alone in this fall. Global stock markets have tumbled after the US threat to impose
new tariffs on Chinese exports. As on May 13, the month-to-date change in the various indices was: China
Shcomp (-5.67%), India Sensex (-4.97%), Japan Nikkei (-4.8%), South Korea Kospi (-5.65%), Singapore STI (-
4.88%) and Hong Kong HSI (-3.87%).
The impact on US producers with significant exposure to Chinese markets was also captured in stock market
valuations. The equity price performance of US companies with high sales to China underperformed relative
to the US businesses exposed to other international markets, after retaliatory tariffs by China were
implemented.
There could be implications for the world at large. With Chinese goods being taxed at a higher rate in the US,
other countries can pitch in and fill the gap. This opens up opportunities for other exporters, including India.
India needs to make use of this opportunity to significantly enhance its exports.
To substantively benefit from this situation, India requires a strategic approach to convert this opportunity
into a major gain. India needs to focus on becoming a new powerhouse as a global hub for exports, with a
major positive impact on competitiveness and job creation. India needs to take its vision of ease of doing
business and Make in India to the next level.
At the same time, China is likely to get more aggressive with exports and the world should watch out for
dumping of goods as it seeks to regain markets. There is also a possibility of China depreciating its currency
Impact of US-China and
US-Iran relations
so as to get a competitive edge, like in 2015. This would have ramifications for other countries as China has
enough power to move the currencies.
Meanwhile, US government also intends to terminate India’s designation as a beneficiary developing country
under the Generalised System of Preference (GSP) programme. However, a group of 25 influential American
lawmakers has urged the US Trade Representative not to terminate the GSP programme with India, saying
the country’s companies seeking to expand their exports to India could be affected. The final decision of the
US remains to be seen.
Overall, the repercussions can be – more volatility in both commodity prices and currencies as the trade war
escalates. Global trade would get more volatile and also affect investment flows.
US-Iran
In another development from the US, on May 2, the Trump administration brought to an end the waiver the
US had granted to 8 countries, including India, of sanctions on imports of oil from Iran.
Even with the waivers, sanctions had significantly reduced global oil supply. According to the International
Energy Agency, Iran’s oil exports had fallen to 1.1 million barrels per day in March 2019, as compared with 2.3
million barrels in June 2018, just after the US sanctions were announced.
That shortfall worsened an oil supply situation that was already affected by a host of other factors. One was
the political standoff in Venezuela, which drastically reduced production in and exports from there. Another
factor was Saudi Arabia, which decided to join other OPEC nations and enter into an alliance with Russia and
10 other non-OPEC countries to cut production and hold back from the market more than half a million barrels
of crude every day. In little more than a year, the spot price of Brent crude rose from around USD 45 a barrel
to around USD 85 a barrel.
The removal of Iranian oil from India’s energy sourcing basket may have major implications, given that India
has been a major importer of Iranian oil. India imported 23.5 million tonnes in 2018-19 from Iran. India would
need to come up with options that offer terms as attractive as those offered by Iran, including 60-day credit,
free insurance and shipping. Finding an alternative supplier at competitive terms quickly for India may be
tough.
While Saudi Arabia, UAE and other OPEC countries would likely fill the gap created by lower Iranian exports,
it would come at the cost of a significant reduction in the spare capacity and also increase the risks of a
potential conflict in the Middle East.
Oil prices are expected to rise in the foreseeable future. That is not likely to be good news for the government
that is taking control now. The price of India’s crude import basket, which was in decline, has been rising since
the end of last year.
While consumption of crude and petroleum products in India has been continually rising, touching 212 billion
tonnes in 2018-19, the share of net imports in consumption has hovered around 93% for the last 4 years.
So, the trade and current account deficits on India’s balance of payments are expected to widen, creating
uncertainty among foreign investors even when the political landscape cleared. There is also the possibility of
higher inflation, as the effects of higher oil prices pass through.
As mentioned earlier, the threat of the US-China trade war can be converted into an opportunity by India to
increase its exports. Increasing exports would bring in more foreign exchange for India. This foreign exchange
could then be used by India to purchase oil from alternative sources.
-APAS
IIP (Index of Industrial Production) – March
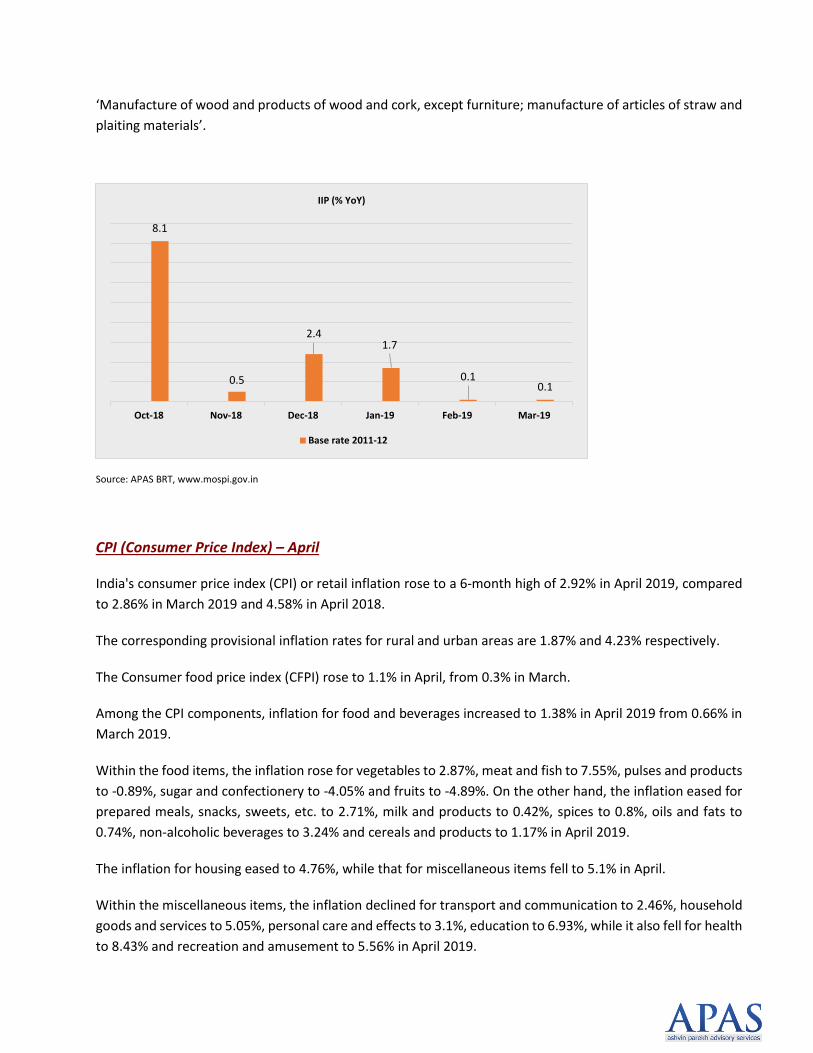
Index of Industrial Production (IIP) or factory output for the month of March 2019 slowed to a 21-month low
of 0.1%, compared to 0.1% in February 2019 and 5.3% in March 2018.
The General Index for the month of March 2019 stands at 140.2, which is 0.1% lower as compared to that in
March 2018.
The growth slowed, mainly due to a slowdown in consumption and investment.
The cumulative growth for the period April-March 2018-19 over the corresponding period of last year stood
at 3.6%, as against 4.4% last year.
As per Use-based classification, the growth rates in March 2019 over March 2018 are 2.5% in primary goods,
(-) 8.7% in capital goods, (-) 2.5% in intermediate goods and 6.4% in infrastructure/construction goods.
Consumer durables and non-durables have recorded growth rates of (-) 5.1% and 0.3% respectively.
The manufacturing sector, which constitutes 77.63% of the index, contracted by 0.4% in March, compared to
5.7% growth last year.
Electricity generation grew by 2.2% in March, compared to 5.9% last year.
Mining sector output grew 0.8% in March, compared to 3.1% last year.
In terms of industries, 12 out of 23 industry groups in the manufacturing sector have shown decline in March
2019 from March 2018.
The industry group ‘Manufacture of furniture’ has declined most by 24.6%, followed by 18.5% in ‘Manufacture
of other transport equipment’ and 15.3% in ‘Manufacture of fabricated metal products, except machinery and
equipment’.
On the other hand, the industry group ‘Manufacture of tobacco products’ has shown the highest growth of
13.5%, followed by 10.6% in ‘Manufacture of computer, electronic and optical products’ and 9.3% in
ECONOMY
‘Manufacture of wood and products of wood and cork, except furniture; manufacture of articles of straw and
plaiting materials’.
Source: APAS BRT, www.mospi.gov.in
CPI (Consumer Price Index) – April
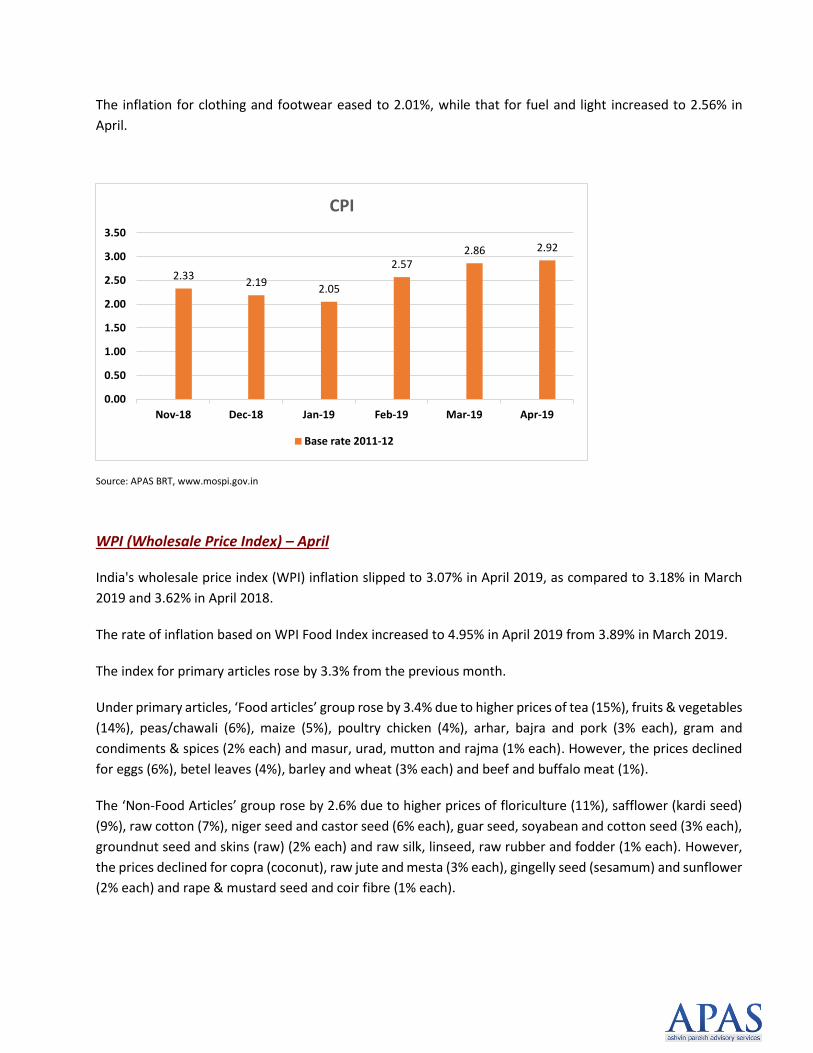
India's consumer price index (CPI) or retail inflation rose to a 6-month high of 2.92% in April 2019, compared
to 2.86% in March 2019 and 4.58% in April 2018.
The corresponding provisional inflation rates for rural and urban areas are 1.87% and 4.23% respectively.
The Consumer food price index (CFPI) rose to 1.1% in April, from 0.3% in March.
Among the CPI components, inflation for food and beverages increased to 1.38% in April 2019 from 0.66% in
March 2019.
Within the food items, the inflation rose for vegetables to 2.87%, meat and fish to 7.55%, pulses and products
to -0.89%, sugar and confectionery to -4.05% and fruits to -4.89%. On the other hand, the inflation eased for
prepared meals, snacks, sweets, etc. to 2.71%, milk and products to 0.42%, spices to 0.8%, oils and fats to
0.74%, non-alcoholic beverages to 3.24% and cereals and products to 1.17% in April 2019.
The inflation for housing eased to 4.76%, while that for miscellaneous items fell to 5.1% in April.
Within the miscellaneous items, the inflation declined for transport and communication to 2.46%, household
goods and services to 5.05%, personal care and effects to 3.1%, education to 6.93%, while it also fell for health
to 8.43% and recreation and amusement to 5.56% in April 2019.
8.1
0.5
2.41.7
0.10.1
Oct-18 Nov-18 Dec-18 Jan-19 Feb-19 Mar-19
IIP (% YoY)
Base rate 2011-12
The inflation for clothing and footwear eased to 2.01%, while that for fuel and light increased to 2.56% in
April.
Source: APAS BRT, www.mospi.gov.in
WPI (Wholesale Price Index) – April
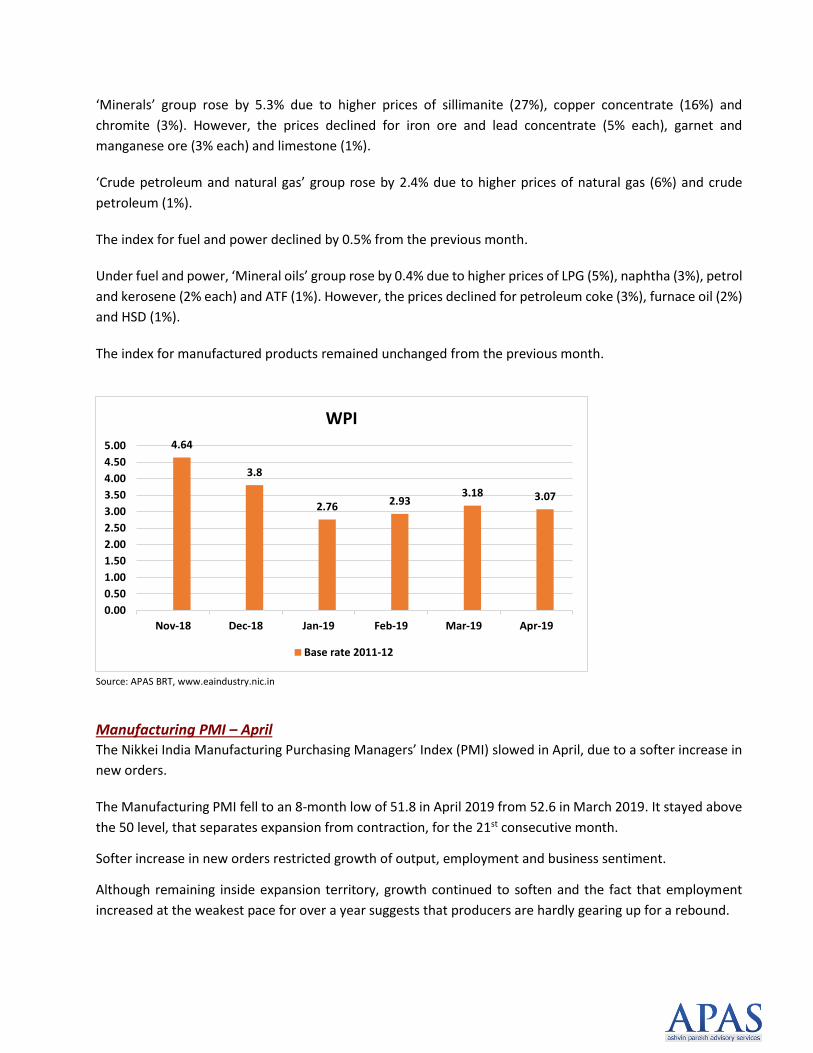
India's wholesale price index (WPI) inflation slipped to 3.07% in April 2019, as compared to 3.18% in March
2019 and 3.62% in April 2018.
The rate of inflation based on WPI Food Index increased to 4.95% in April 2019 from 3.89% in March 2019.
The index for primary articles rose by 3.3% from the previous month.
Under primary articles, ‘Food articles’ group rose by 3.4% due to higher prices of tea (15%), fruits & vegetables
(14%), peas/chawali (6%), maize (5%), poultry chicken (4%), arhar, bajra and pork (3% each), gram and
condiments & spices (2% each) and masur, urad, mutton and rajma (1% each). However, the prices declined
for eggs (6%), betel leaves (4%), barley and wheat (3% each) and beef and buffalo meat (1%).
The ‘Non-Food Articles’ group rose by 2.6% due to higher prices of floriculture (11%), safflower (kardi seed)
(9%), raw cotton (7%), niger seed and castor seed (6% each), guar seed, soyabean and cotton seed (3% each),
groundnut seed and skins (raw) (2% each) and raw silk, linseed, raw rubber and fodder (1% each). However,
the prices declined for copra (coconut), raw jute and mesta (3% each), gingelly seed (sesamum) and sunflower
(2% each) and rape & mustard seed and coir fibre (1% each).
2.332.19
2.05
2.572.86 2.92
0.00
0.50
1.00
1.50
2.00
2.50
3.00
3.50
Nov-18 Dec-18 Jan-19 Feb-19 Mar-19 Apr-19
CPI
Base rate 2011-12
‘Minerals’ group rose by 5.3% due to higher prices of sillimanite (27%), copper concentrate (16%) and
chromite (3%). However, the prices declined for iron ore and lead concentrate (5% each), garnet and
manganese ore (3% each) and limestone (1%).
‘Crude petroleum and natural gas’ group rose by 2.4% due to higher prices of natural gas (6%) and crude
petroleum (1%).
The index for fuel and power declined by 0.5% from the previous month.
Under fuel and power, ‘Mineral oils’ group rose by 0.4% due to higher prices of LPG (5%), naphtha (3%), petrol
and kerosene (2% each) and ATF (1%). However, the prices declined for petroleum coke (3%), furnace oil (2%)
and HSD (1%).
The index for manufactured products remained unchanged from the previous month.
Source: APAS BRT, www.eaindustry.nic.in
Manufacturing PMI – April The Nikkei India Manufacturing Purchasing Managers’ Index (PMI) slowed in April, due to a softer increase in
new orders.
The Manufacturing PMI fell to an 8-month low of 51.8 in April 2019 from 52.6 in March 2019. It stayed above
the 50 level, that separates expansion from contraction, for the 21st consecutive month.
Softer increase in new orders restricted growth of output, employment and business sentiment.
Although remaining inside expansion territory, growth continued to soften and the fact that employment
increased at the weakest pace for over a year suggests that producers are hardly gearing up for a rebound.
4.64
3.8
2.76 2.933.18 3.07
0.00
0.50
1.00
1.50
2.00
2.50
3.00
3.50
4.00
4.50
5.00
Nov-18 Dec-18 Jan-19 Feb-19 Mar-19 Apr-19
WPI
Base rate 2011-12
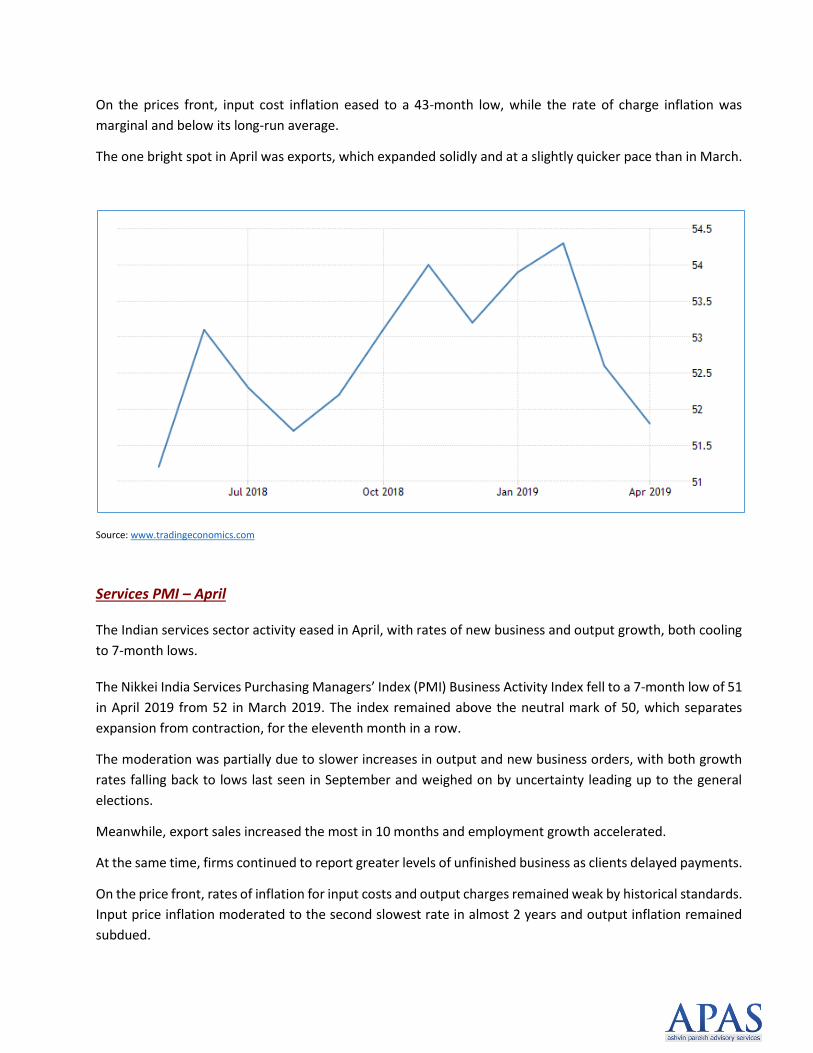
On the prices front, input cost inflation eased to a 43-month low, while the rate of charge inflation was
marginal and below its long-run average.
The one bright spot in April was exports, which expanded solidly and at a slightly quicker pace than in March.
Source: www.tradingeconomics.com
Services PMI – April
The Indian services sector activity eased in April, with rates of new business and output growth, both cooling
to 7-month lows.
The Nikkei India Services Purchasing Managers’ Index (PMI) Business Activity Index fell to a 7-month low of 51
in April 2019 from 52 in March 2019. The index remained above the neutral mark of 50, which separates
expansion from contraction, for the eleventh month in a row.
The moderation was partially due to slower increases in output and new business orders, with both growth
rates falling back to lows last seen in September and weighed on by uncertainty leading up to the general
elections.
Meanwhile, export sales increased the most in 10 months and employment growth accelerated.
At the same time, firms continued to report greater levels of unfinished business as clients delayed payments.
On the price front, rates of inflation for input costs and output charges remained weak by historical standards.
Input price inflation moderated to the second slowest rate in almost 2 years and output inflation remained
subdued.
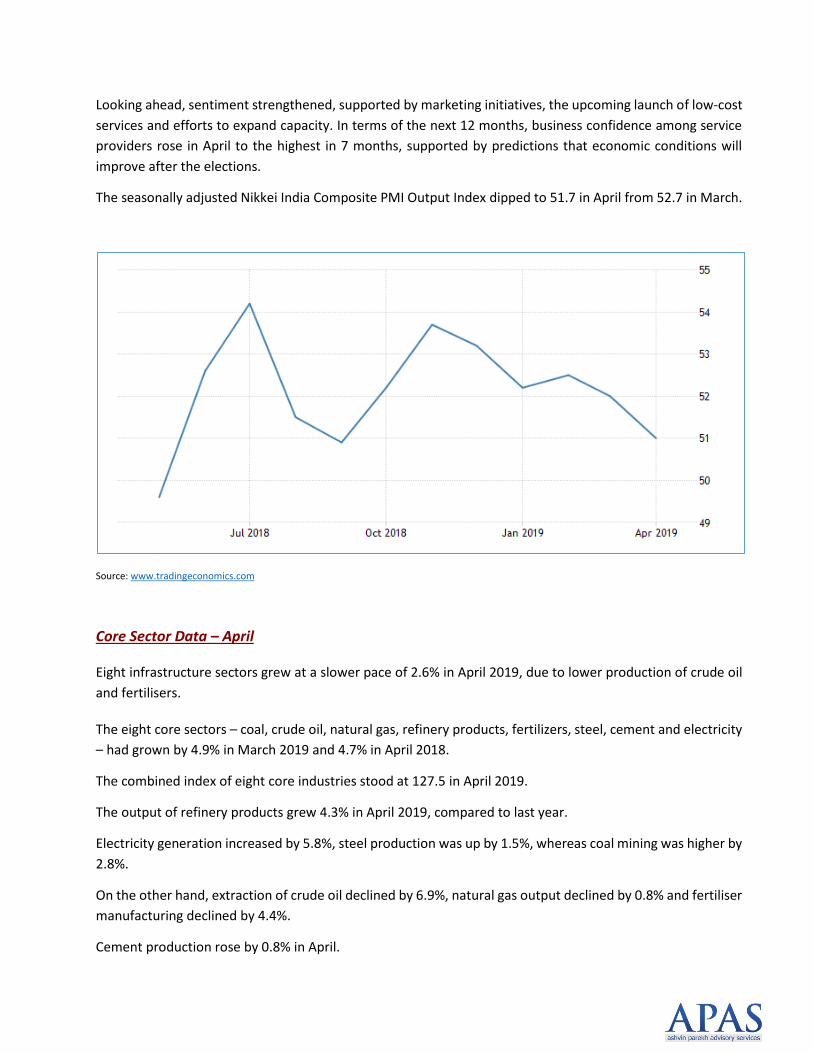
Looking ahead, sentiment strengthened, supported by marketing initiatives, the upcoming launch of low-cost
services and efforts to expand capacity. In terms of the next 12 months, business confidence among service
providers rose in April to the highest in 7 months, supported by predictions that economic conditions will
improve after the elections.
The seasonally adjusted Nikkei India Composite PMI Output Index dipped to 51.7 in April from 52.7 in March.
Source: www.tradingeconomics.com
Core Sector Data – April
Eight infrastructure sectors grew at a slower pace of 2.6% in April 2019, due to lower production of crude oil
and fertilisers.
The eight core sectors – coal, crude oil, natural gas, refinery products, fertilizers, steel, cement and electricity
– had grown by 4.9% in March 2019 and 4.7% in April 2018.
The combined index of eight core industries stood at 127.5 in April 2019.
The output of refinery products grew 4.3% in April 2019, compared to last year.
Electricity generation increased by 5.8%, steel production was up by 1.5%, whereas coal mining was higher by
2.8%.
On the other hand, extraction of crude oil declined by 6.9%, natural gas output declined by 0.8% and fertiliser
manufacturing declined by 4.4%.
Cement production rose by 0.8% in April.
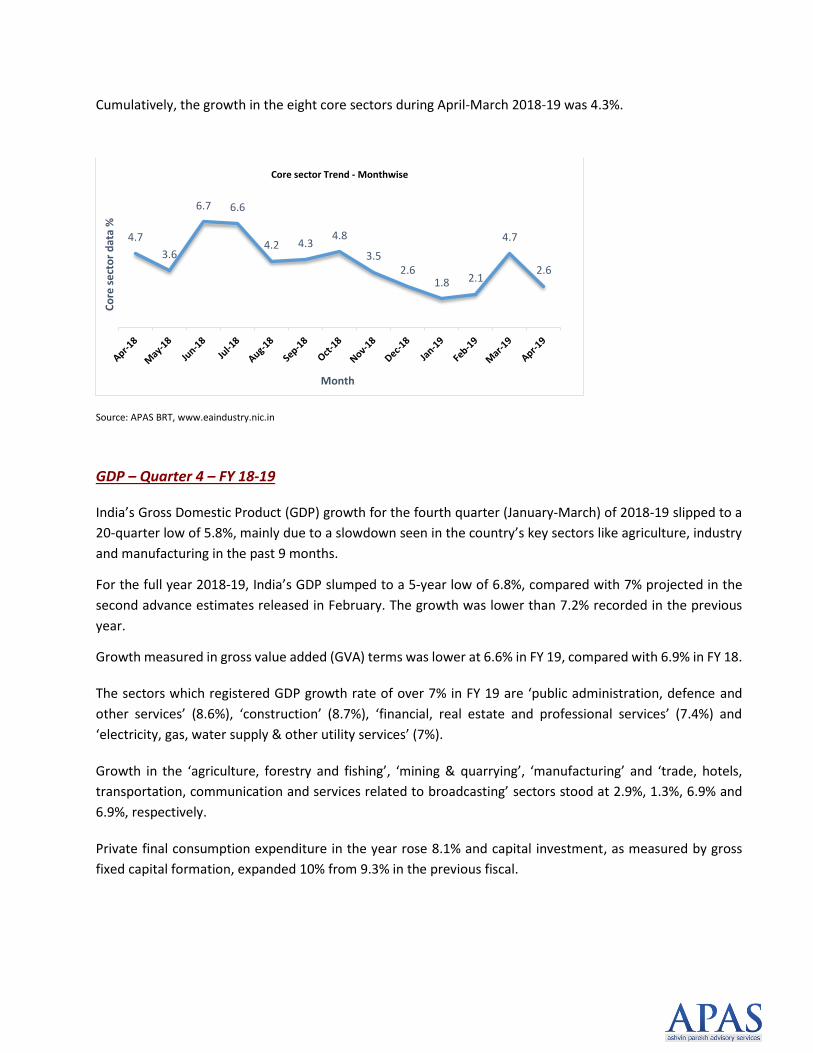
Cumulatively, the growth in the eight core sectors during April-March 2018-19 was 4.3%.
Source: APAS BRT, www.eaindustry.nic.in
GDP – Quarter 4 – FY 18-19
India’s Gross Domestic Product (GDP) growth for the fourth quarter (January-March) of 2018-19 slipped to a
20-quarter low of 5.8%, mainly due to a slowdown seen in the country’s key sectors like agriculture, industry
and manufacturing in the past 9 months.
For the full year 2018-19, India’s GDP slumped to a 5-year low of 6.8%, compared with 7% projected in the
second advance estimates released in February. The growth was lower than 7.2% recorded in the previous
year.
Growth measured in gross value added (GVA) terms was lower at 6.6% in FY 19, compared with 6.9% in FY 18.
The sectors which registered GDP growth rate of over 7% in FY 19 are ‘public administration, defence and
other services’ (8.6%), ‘construction’ (8.7%), ‘financial, real estate and professional services’ (7.4%) and
‘electricity, gas, water supply & other utility services’ (7%).
Growth in the ‘agriculture, forestry and fishing’, ‘mining & quarrying’, ‘manufacturing’ and ‘trade, hotels,
transportation, communication and services related to broadcasting’ sectors stood at 2.9%, 1.3%, 6.9% and
6.9%, respectively.
Private final consumption expenditure in the year rose 8.1% and capital investment, as measured by gross
fixed capital formation, expanded 10% from 9.3% in the previous fiscal.
4.7
3.6
6.7 6.6
4.2 4.34.8
3.52.6
1.8 2.1
4.7
2.6
Co
re s
ect
or
dat
a %
Month
Core sector Trend - Monthwise

Source: APAS BRT, www.mospi.gov.in
6.1 5.76.3
7.27.7
8.27.1
6.65.8
Q4 16-17 Q1 17-18 Q2 17-18 Q3 17-18 Q4 17-18 Q1 18-19 Q2 18-19 Q3 18-19 Q4 18-19
GD
P %
Quarter
GDP Trend
Second Bi-monthly Monetary Policy Statement, 2019-20 Resolution of the Monetary Policy
Committee (MPC), Reserve Bank of India
On the basis of an assessment of the current and evolving macroeconomic situation, the Monetary Policy
Committee (MPC) at its meeting decided to:
• Reduce the policy repo rate under the liquidity adjustment facility (LAF) by 25 basis points to 5.75 per cent
from 6.0 per cent with immediate effect.
Consequently, the reverse repo rate under the LAF stands adjusted to 5.50 per cent, and the marginal standing
facility (MSF) rate and the Bank Rate to 6.0 per cent. The MPC also decided to change the stance of monetary
policy from neutral to accommodative. These decisions are in consonance with the objective of achieving the
medium-term target for consumer price index (CPI) inflation of 4 per cent within a band of +/- 2 per cent,
while supporting growth. The main considerations underlying the decision are set out in the statement below.
Assessment:
Global Economy
Global economic activity has been losing pace after a somewhat improved performance in Q1:2019, reflecting
further slowdown in trade and manufacturing activity. Leading indicators point to a further slowdown in the
Euro area in Q2. In the UK, GDP growth for Q1 picked up on high retail sales and government expenditure.
However, the outlook is clouded by uncertainty relating to Brexit.
Economic activity has slowed in many emerging market economies (EMEs). In Q1:2019, the Chinese economy
grew at the same pace as in the previous quarter, though slightly above consensus expectations. However,
incoming data on industrial production and retail sales suggest that the growth momentum may weaken in
Q2.
Crude oil prices remained volatile, reflecting evolving demand-supply conditions underpinned by the
production stance of the OPEC plus, rising shale output, weakening global demand and geopolitical concerns.
The strengthening of the US dollar had weakened gold prices; however, prices picked up since the last week
of May on escalating trade tensions, reviving its demand as a safe haven asset. Inflation remains below target
in several economies, though it has shown an uptick since March. In many EMEs, bond yields have been falling
with central banks adopting accommodative monetary policy to boost economic growth.
BANKING
Domestic Economy
Moving beyond Q4, the India Meteorological Department (IMD) has predicted that south-west monsoon
rainfall (June to September) is likely to be normal at 96 per cent of the long period average (LPA). The current
weak El Niño conditions over the Pacific are likely to continue during the monsoon. However, currently
prevailing neutral Indian Ocean Dipole (IOD) conditions may turn positive in the middle of the monsoon season
and persist thereafter, which augur well for the rainfall outlook.
Transmission of the cumulative reduction of 50 bps in the policy repo rate in February and April 2019 was 21
bps to the weighted average lending rate (WALR) on fresh rupee loans. However, the WALR on outstanding
rupee loans increased by 4 bps as the past loans continue to be priced at high rates. Interest rates on longer
tenor money market instruments remained broadly aligned with the overnight WACR, reflecting near full
transmission of the reduction in policy rate.
Outlook
In the bi-monthly monetary policy resolution of April 2019, CPI inflation was projected at 2.4 per cent for
Q4:2018-19, 2.9-3.0 per cent for H1:2019-20 and 3.5-3.8 per cent for H2:2019-20, with risks broadly balanced.
The headline inflation outcome in Q4 at 2.5 per cent was largely in alignment with the April policy projections.
RBI notifies the revised Voluntary Retention Route for Investments by Foreign Portfolio Investors
(FPIs) and opens allotment ‘on tap’
Reserve Bank of India introduced the Voluntary Retention Route for Investments by Foreign Portfolio
Investors (FPIs) on March 01, 2019. Limits for investment in debt by Foreign Portfolio Investors (FPIs) were
offered for allotment ‘on tap’ during March 11 – April 30, 2019. Based on the feedback received, and in
consultation with the Government, the Bank has made certain changes in the scheme to increase its
operational flexibility.
The revised VRR scheme shall be open for allotment from May 27, 2019 as per the following details:
1. The investment limit shall be ₹ 54,606.55 crores, under the VRR–Combined category, which allows
investment in both government securities and corporate debt.
2. The minimum retention period shall be three years. During this period, FPIs shall maintain a minimum
of 75% of the allocated amount in India.
3. Investment limits shall be available ‘on tap’ and allotted on ‘first come, first served’ basis.
4. The ‘tap’ shall be kept open till the limit is fully allotted or till December 31, 2019, whichever is earlier.
5. FPIs may apply for investment limits online to Clearing Corporation of India Ltd. (CCIL) through their
respective custodians.
6. CCIL will separately notify the operational details of application and allotment.
7. FPIs that were allotted investment limits under the tap that was open during March 11-April 30, 2019,
may, at their discretion, opt to convert their full allotment to ‘VRR-Combined’ by advising CCIL through
their custodians. Such conversions shall not use up the investment limit of ₹ 54,606.55 crores
indicated above
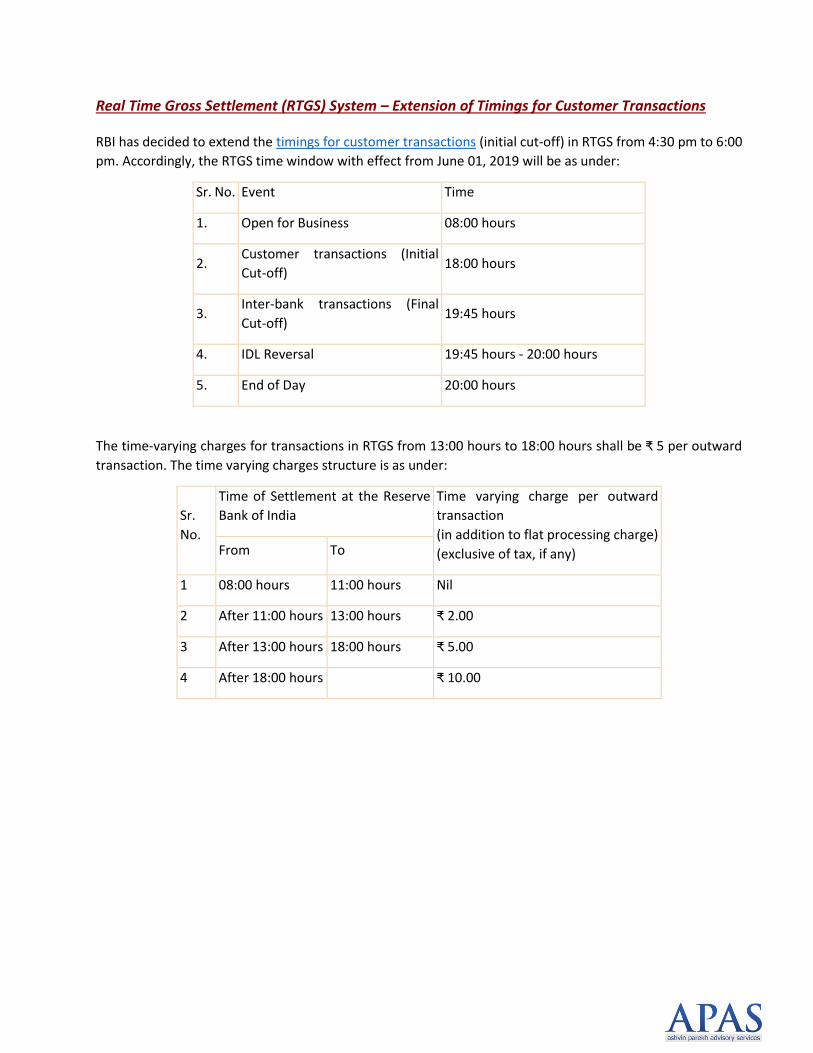
Real Time Gross Settlement (RTGS) System – Extension of Timings for Customer Transactions
RBI has decided to extend the timings for customer transactions (initial cut-off) in RTGS from 4:30 pm to 6:00
pm. Accordingly, the RTGS time window with effect from June 01, 2019 will be as under:
Sr. No. Event Time
1. Open for Business 08:00 hours
2. Customer transactions (Initial
Cut-off) 18:00 hours
3. Inter-bank transactions (Final
Cut-off) 19:45 hours
4. IDL Reversal 19:45 hours - 20:00 hours
5. End of Day 20:00 hours
The time-varying charges for transactions in RTGS from 13:00 hours to 18:00 hours shall be ₹ 5 per outward
transaction. The time varying charges structure is as under:
Sr.
No.
Time of Settlement at the Reserve
Bank of India
Time varying charge per outward
transaction
(in addition to flat processing charge)
(exclusive of tax, if any) From To
1 08:00 hours 11:00 hours Nil
2 After 11:00 hours 13:00 hours ₹ 2.00
3 After 13:00 hours 18:00 hours ₹ 5.00
4 After 18:00 hours ₹ 10.00
Reconciliation of Co-Insurers Balance from ETASS
General Insurance Council has been implementing ETASS (Electronic Transaction Administration and
Settlement System) for capturing of Co-insurance transactions, reconciliation and settlement of balances
between member insurance companies. The system has been in operation from April 2017 for all lines of
Business and GI Council agreed that from 1st April 2018, the system would be treated as live and all co-
insurance transactions will be settled between member insurers only on the basis of ETASS statement.
The Authority had noticed that the inter-company balances in re-insurance and co-insurance business are
significantly high and are on the rise. The re-insurance and co-insurance transactions typically involve multiple
organizations across various geographies giving rise to following issues:
1. Inability of parties to the transactions to agree, resulting in growing inter-company balances;
2. Lack of cooperation between the companies and inadequate documentation, posing a problem towards
the efforts to minimize these balances;
3. Lack of a common platform to handle the re-insurance and co-insurance transactions;
4. Delayed settlement of balances;
5. High turnaround times.
In this regard, IRDAI has directed that:
I. For all the co-insurance transactions that took place after 1st April 2018, the balances due to/from
co-insurers shall be reconciled with the balances as per ETASS;
II. A certificate from the statutory auditor shall be submitted to the Authority, in the format as
prescribed in Annexure A(Enclosed below), along with the annual financial statements certifying that there is
no difference in books of accounts and ETASS with regard to co-insurance transactions that relate to policies
with a risk start date on or after 1st April 2018;
III. In case of differences, the co-insurer wise differences shall be reported in the Auditor’s certificate;
IV. Balances for the transactions that took place before 1st April 2018 shall be reconciled by the insurer
and the same shall be submitted to the Authority on or before 30th September 2019 without fail.
INSURANCE

Preparation of Financial Statements for FY 2019-20 and Onwards
In order to bring uniformity, comparability and fair presentation of Financial Statements filed by the insurers,
the Authority, has issued the following directions:
1. Presentation of Excess Expenses of Management (EoM) in Operating Expenses:
The Authority vide Insurance Regulatory and Development Authority of India (Expenses of Management of
Insurers transacting General or Health Insurance business) Regulations, 2016 have prescribed the limits of
expenses of management. In case expenses of management exceed the limits prescribed by the Regulations,
the excess is required to be charged to Shareholders Account i.e. Profit and Loss Account.
It is observed that some insurers are disclosing the operating expenses net of excess EoM charged to
shareholders account, in Revenue Account. This leads to distorted picture of the Underwriting Results of the
Insurers. In light of the same, all Insurers are advised to present the excess of EoM in Financial Statements, as
under:
I. Report the gross amount of Operating expenses in Schedule-4 and Revenue Account without
deducting ‘Excess of allowable expenses’;
II. Report excess of allowable expenses as income under Revenue account under separate sub line item
as “Contribution from Shareholders Funds towards Excess EoM” in the line item “Others”;
III. Report excess of allowable expenses as expenses under Profit & Loss account under separate sub line
item, “Contribution to policyholders Funds towards Excess EoM” in line item “Other Expenses”;
2. Personal Accident Policies in Health Segment
In terms of Section 2(6C) of the Insurance Act, 1938, Personal Accident and Travel (Including domestic as well
as overseas) are part of Health Insurance.
2.1 In order to have uniformity in case of business from Personal Accident and Travel, it is hereby specified
that in Financial Statements:
I. Personal Accident shall continue to be shown as a separate sub-segment within “Miscellaneous
segment”;
II. As the Insurance Regulatory and Development Authority (Preparation of Financial Statements and
Auditor’s Report of Insurance Companies) Regulations, 2002 do not provide a separate segment/sub segment
for Travel (including domestic as well as overseas) insurance, it shall be clubbed with “Health Segment”;
2.2 For computation of Expenses of Management, Personal Accident and Travel shall be clubbed with Health
Segment.
3. Deviation from Formats prescribed:
It is observed that some insurers have modified the formats as prescribed by the by IRDA (Preparation of
Financial Statements and Auditor’s Report of Insurance Companies) Regulations, 2002 by way of
addition/deletion of line items.
All insurers are advised to strictly adhere to the formats prescribed by the Regulations. Any new line item, if
so warranted to be disclosed separately, may be shown under “Others” in Revenue Account, P&L Account
and/or relevant schedule of the financial statements by giving the break-up.
4. Creation of UPR and Outstanding Claims Reserve (Including IBNR/IBNER) for Premium Ceded under Clean-
cut Reinsurance Treaties
It is observed that some insurers enter into one-year Quota Share Reinsurance Treaty on Clean-cut basis. The
provision towards the unexpired premium reserve / IBNR / IBNER, on such treaties, is neither provided by
Direct insurer (cedant) nor by the reinsurer(s).
It is hereby advised that Direct insurers (cedant) shall create the adequate reserves, as follows, in accordance
with the IRDAI (Assets, Liabilities and Solvency Margin of General Insurance Business) Regulations, 2016:
I. Unearned Premium Reserve and Premium Deficiency Reserve towards the unexpired risk at the end
of the treaty period; and
II. Outstanding Claims Reserve (including IBNR/IBNER) towards the outstanding claims on the date of
expiry of the treaty.
5. Rewards and Remuneration to Agents/Brokers/Other intermediaries
In order to bring the consistency, uniformity and fair presentation, it is hereby advised that rewards and/or
remuneration to agents, brokers or other intermediaries shall be shown as part of Commission.
6. Segregation of Policyholders’ and Shareholders’ Funds
The Authority has issued to Circular IRDA/F&A/CIR/CPM/010/01/2017 dated 12th January 2017 which
mandates the insurers to segregate Policyholders’ Funds and Shareholders’ Funds. The provisions of the
Circular, which was hitherto applicable till 31stMarch 2018, are now extended for FY2018-19 and onwards, till
further orders. All other provisions of the above referred Circular shall continue to be applicable.
7. Corporate Social Responsibility Expenditure
In order to bring the consistency, uniformity and fair presentation, it is hereby advised that expenditure
towards Corporate Social Responsibility shall be shown in Profit and Loss Account.
PM-KISAN Scheme extension to include all eligible farmer families irrespective of the size of land
holdings
The Union Cabinet, chaired by the Prime Minister Narendra Modi, has approved that the ambit of the Pradhan
Mantri Kisan Samman Nidhi (PM-KISAN) would be comprehensively extended. With this decision, all land
holding eligible farmer families (subject to the prevalent exclusion criteria) would avail of the benefits under
this scheme.
More beneficiaries, greater progress:
The revised Scheme is expected to cover around 2 crore more farmers, increasing the coverage of PM-KISAN
to around 14.5 crore beneficiaries, with an estimated expenditure by Central Government of Rs. 87,217.50
crores for year 2019-20.
Speed, scale and a major promise delivered:
Today’s Cabinet decision pertaining to expanding the ambit PM-KISAN marks the fulfilment of a major promise
made by the Prime Minister to the people of India in the run-up to the 2019 Parliamentary elections. The BJP
manifesto too mentioned this major policy decision.
It may also be noted that certain operational issues like lack of updated land records in Jharkhand and lack of
Aadhaar penetration in states of Assam, Meghalaya and J&K have also been resolved.
PM-KISAN: A path-breaking support incentive for farmers:
The genesis of the PM-KISAN Yojana dates back to the interim Budget for the year 2019-2020.
The key element of PM-KISAN is income support of Rs. 6000/- to the small and marginal landholder farmer
families with cultivable land holding upto 2 hectare across the country. (This has been expanded today)
The amount is being released in three 4-monthly instalments of Rs.2000/- each over the year, to be credited
into the bank accounts of the beneficiaries held in destination banks through Direct Benefit Transfer mode.
The scheme was launched in a record time of 3 weeks, on 24th February at a huge programme in Gorakhpur,
Uttar Pradesh where the first rounds of instalments was paid to several farmers.
INFRASTRUCTURE &
OTHER GOVT.
INITIATIVES
So far, 1st instalment to 3.11 crore beneficiaries and 2nd instalment to 2.66 crore beneficiaries have been
credited directly to the bank accounts of the farmer families.
Serving India’s Annadatas with renewed vigour:
Time and again, PM Narendra Modi has spoken with great reverence for India’s farmers. He has described
India’s farmers as our Annadatas who undertake great efforts to feed 1.3 billion Indians.
Between 2014 to 2019, numerous measures were taken to empower the hardworking farmer. This includes
increase in the Minimum Support Prices (MSP) for 22 crops, Soil Health Cards, PM Krishi Sinchai Yojana, PM
Kisan Sampada Yojana, e-NAM for better markets and more. These steps have made agriculture more
prosperous and ensured greater productivity for farmers. They will go a long way in fulfilling the Prime
Minister’s dream of doubling farmer incomes by 2022, when India marks 75 years of freedom.
Pension scheme to secure lives of 5 crore farmers in three years
The Union Cabinet, chaired by the Prime Minister Narendra Modi, has approved new Central Sector Scheme,
a historic decision that will empower farmers across India. This is a path breaking scheme that will provide
pension cover to our industrious farmers who toil day and night to keep our nation fed. It is also for the first
time since independence that such a pension coverage has been envisioned for farmers.
It is estimated that 5 crore small and marginal farmers will benefit in the first three years itself. The Central
Government would spend Rs. 10774.50 crore for a period of 3 years towards its contribution (matching share)
for providing social security cover as envisaged under the scheme.
The salient features of this scheme are:
A voluntary and contributory pension scheme for all Small and Marginal Farmers (SMF) across the country.
Entry age of 18 to 40 years with a provision of minimum fixed pension of Rs.3,000/- on attaining the age of 60
years.
For example, a beneficiary farmer is required to contribute Rs 100/ - per month at median entry age of 29
years. The Central Government shall also contribute to the Pension Fund an equal amount as contributed by
the eligible farmer.
After the subscriber’s death, while receiving pension, the spouse of the SMF beneficiary shall be entitled to
receive 50% of the pension received by the beneficiary as family pension, provided he/she is not already an
SMF beneficiary of the Scheme. If, the death of the subscriber happens during the period of contribution, the
spouse shall have the option of continuing the Scheme by paying regular contribution.
Synergy between schemes, prosperity for farmers:
An interesting feature of the Scheme is that the farmers can opt to allow his/her monthly contribution to the
Scheme to be made from the benefits drawn from the Pradhan Mantri Kisan Samman Nidhi (PM-KISAN)
Scheme directly. Alternatively, a farmer can pay his monthly contribution by registering through Common
Service Centres (CSCs) under MeitY.
Participation of Mutual Funds in Commodity Derivatives Market in India
In order to promote institutional participation in Exchange Traded Commodity Derivatives (ETCDs), SEBI has
permitted Category III Alternative Investment Funds to participate in exchange traded commodity derivatives
and also permitted Eligible Foreign Entities (EFE) having actual exposure to Indian commodity markets, to
participate in the commodity derivative segment of recognized stock exchanges for hedging their exposure.
In furtherance to this objective, it has been decided to permit mutual funds to participate in ETCDs.
The participation of mutual funds in ETCDs would be subject to the following:
1. Mutual funds are permitted to participate in ETCDs in India, except in commodity derivatives on
‘Sensitive Commodities’ as defined by SEBI
2. ETCDs having gold as the underlying, shall also be considered as ‘gold related instrument’ for Gold
Exchange Traded Funds (Gold ETFs).
3. No Mutual fund schemes shall invest in physical goods except in ‘gold’ through Gold ETFs. Further, as
mutual fund schemes participating in ETCDs may hold the underlying goods in case of physical
settlement of contracts, in that case mutual funds shall dispose of such goods from the books of the
scheme, at the earliest, not exceeding 30 days from the date of holding of the physical goods.
4. No mutual fund scheme shall have net short positions in ETCDs on any particular good, considering
its positions in physical goods as well as ETCDs, at any point of time
5. Mutual funds are permitted to participate in ETCDs through the following schemes:
a. Hybrid schemes
b. Gold ETFs.
6. All the existing schemes shall comply with provisions of Regulation 18(15A) of SEBI (Mutual Funds)
Regulations, 1996, as this will lead to change in fundamental attributes of the scheme and all
unitholders shall be given a time-period of at least 30 days to exercise the option to exit at prevailing
NAV without charging of exit load, if any.
7. Prior to participation in ETCDs, the AMCs shall adhere to compulsions such as Appointing fund
manager, appointing custodian, drafting investment policy, valuation policy, etc.
The mutual funds shall follow certain investment limits and disclosure as applicable to the fund.
CAPITAL MARKETS
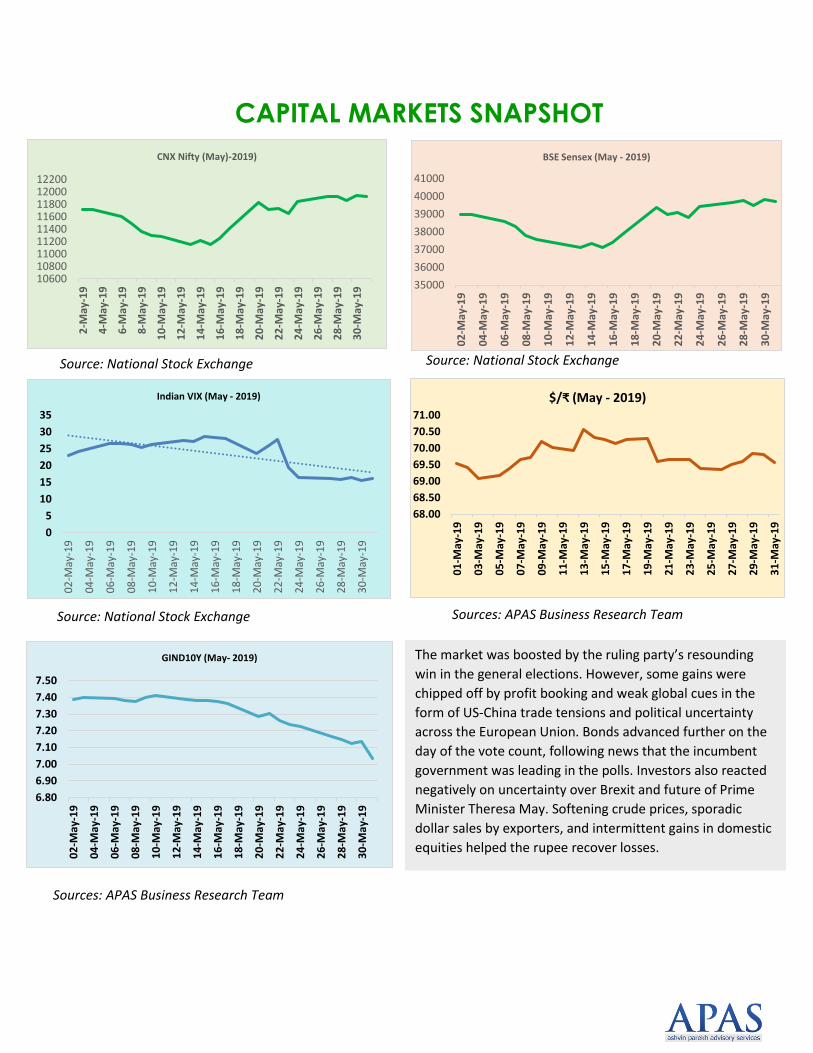
CAPITAL MARKETS SNAPSHOT
Source: National Stock Exchange
Sources: APAS Business Research Team
Source: National Stock Exchange Source: Bombay Stock Exchange
Source: National Stock Exchange Source: National Stock Exchange
Sources: APAS Business Research Team
The market was boosted by the ruling party’s resounding
win in the general elections. However, some gains were
chipped off by profit booking and weak global cues in the
form of US-China trade tensions and political uncertainty
across the European Union. Bonds advanced further on the
day of the vote count, following news that the incumbent
government was leading in the polls. Investors also reacted
negatively on uncertainty over Brexit and future of Prime
Minister Theresa May. Softening crude prices, sporadic
dollar sales by exporters, and intermittent gains in domestic
equities helped the rupee recover losses.
0
5
10
15
20
25
30
35
02
-May
-19
04
-May
-19
06
-May
-19
08
-May
-19
10
-May
-19
12
-May
-19
14
-May
-19
16
-May
-19
18
-May
-19
20
-May
-19
22
-May
-19
24
-May
-19
26
-May
-19
28
-May
-19
30
-May
-19
Indian VIX (May - 2019)
68.00
68.50
69.00
69.50
70.00
70.50
71.00
01
-May
-19
03
-May
-19
05
-May
-19
07
-May
-19
09
-May
-19
11
-May
-19
13
-May
-19
15
-May
-19
17
-May
-19
19
-May
-19
21
-May
-19
23
-May
-19
25
-May
-19
27
-May
-19
29
-May
-19
31
-May
-19
$/₹ (May - 2019)
6.80
6.90
7.00
7.10
7.20
7.30
7.40
7.50
02
-May
-19
04
-May
-19
06
-May
-19
08
-May
-19
10
-May
-19
12
-May
-19
14
-May
-19
16
-May
-19
18
-May
-19
20
-May
-19
22
-May
-19
24
-May
-19
26
-May
-19
28
-May
-19
30
-May
-19
GIND10Y (May- 2019)
106001080011000112001140011600118001200012200
2-M
ay-1
9
4-M
ay-1
9
6-M
ay-1
9
8-M
ay-1
9
10
-May
-19
12
-May
-19
14
-May
-19
16
-May
-19
18
-May
-19
20
-May
-19
22
-May
-19
24
-May
-19
26
-May
-19
28
-May
-19
30
-May
-19
CNX Nifty (May)-2019)
35000
36000
37000
38000
39000
40000
41000
02
-May
-19
04
-May
-19
06
-May
-19
08
-May
-19
10
-May
-19
12
-May
-19
14
-May
-19
16
-May
-19
18
-May
-19
20
-May
-19
22
-May
-19
24
-May
-19
26
-May
-19
28
-May
-19
30
-May
-19
BSE Sensex (May - 2019)
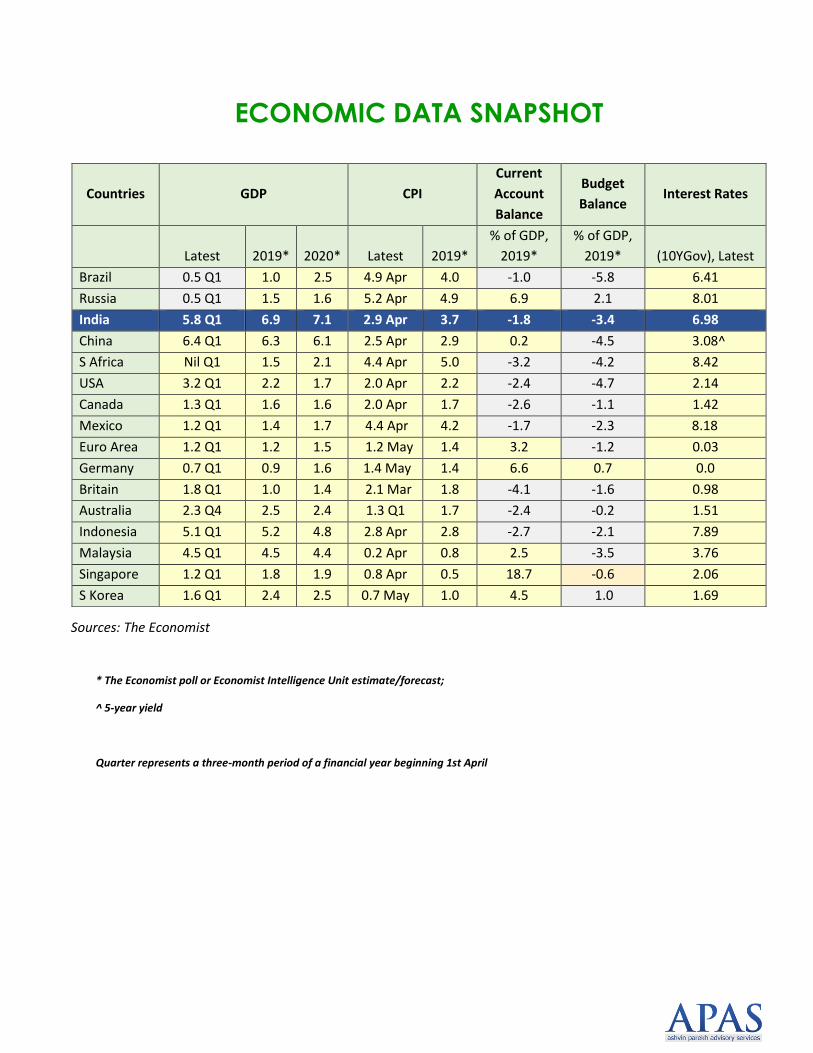
ECONOMIC DATA SNAPSHOT
* The Economist poll or Economist Intelligence Unit estimate/forecast;
^ 5-year yield
Quarter represents a three-month period of a financial year beginning 1st April
Countries GDP CPI
Current
Account
Balance
Budget
Balance Interest Rates
Latest 2019* 2020* Latest 2019*
% of GDP,
2019*
% of GDP,
2019* (10YGov), Latest
Brazil 0.5 Q1 1.0 2.5 4.9 Apr 4.0 -1.0 -5.8 6.41
Russia 0.5 Q1 1.5 1.6 5.2 Apr 4.9 6.9 2.1 8.01
India 5.8 Q1 6.9 7.1 2.9 Apr 3.7 -1.8 -3.4 6.98
China 6.4 Q1 6.3 6.1 2.5 Apr 2.9 0.2 -4.5 3.08^
S Africa Nil Q1 1.5 2.1 4.4 Apr 5.0 -3.2 -4.2 8.42
USA 3.2 Q1 2.2 1.7 2.0 Apr 2.2 -2.4 -4.7 2.14
Canada 1.3 Q1 1.6 1.6 2.0 Apr 1.7 -2.6 -1.1 1.42
Mexico 1.2 Q1 1.4 1.7 4.4 Apr 4.2 -1.7 -2.3 8.18
Euro Area 1.2 Q1 1.2 1.5 1.2 May 1.4 3.2 -1.2 0.03
Germany 0.7 Q1 0.9 1.6 1.4 May 1.4 6.6 0.7 0.0
Britain 1.8 Q1 1.0 1.4 2.1 Mar 1.8 -4.1 -1.6 0.98
Australia 2.3 Q4 2.5 2.4 1.3 Q1 1.7 -2.4 -0.2 1.51
Indonesia 5.1 Q1 5.2 4.8 2.8 Apr 2.8 -2.7 -2.1 7.89
Malaysia 4.5 Q1 4.5 4.4 0.2 Apr 0.8 2.5 -3.5 3.76
Singapore 1.2 Q1 1.8 1.9 0.8 Apr 0.5 18.7 -0.6 2.06
S Korea 1.6 Q1 2.4 2.5 0.7 May 1.0 4.5 1.0 1.69
Sources: The Economist
ABOUT APAS
APAS is a management advisory firm specializing in banking, financial services and the insurance space. APAS
assists business leaders of some of the leading domestic and global organizations, acting as an extended arm
to the management in coping with the ever changing internal and external dynamics. Leveraging deep
business insights APAS develops business and operational strategy for its clients. APAS provides transaction
advisory services (Buy, sell and merge), and also specializes in governance and board training. APAS facilitates
investors and sellers with directional guidelines of pursuing transactions, by utilizing subject knowledge, vast
experience and deep market outreach. APAS has capability to identify and analyze key transaction drivers,
recognize possible partnerships, and initiate discussions with them for possible growth opportunity. We help
major insurance companies, payment institutions, and other financial organizations to identify their growth
potential, innovative opportunity and possible benefits of consolidation, and hence comprehend the possible
merger or acquisition. Buying or selling a major asset or a business, undertaking a merger, or performing an
IPO can be risky and complex especially in this globalization era. Hence, the need of a trusted advisor who can
help clients preserve, create and enhance value in transactions.
Contact Us: 022-6789 1000
www.ap-as.com
Disclaimer – This informative APAS Monthly has been sent only for reader’s reference. Contents have been
prepared on the basis of publicly available information which has not been independently verified by APAS.
Neither APAS, nor any person associated with it, makes any expressed or implied representation or warranty
with respect to the sufficiency, accuracy, completeness or reasonableness of the information set forth in this
note, nor do they owe any duty of care to any recipient of this note in relation to this APAS Monthly. Reader
should not pursue any information provided in the Monthly as an investment advice. Neither APAS nor any
person associated with it are responsible for any loss due to such persuasion.