AP42 Section: 1.3 4 47 Gap Filling PMIO Emission Factors ... · Gap Filling PMIO Emission Factors...
55
AP42 Section: 1.3 Background Chapter 4 Reference: Title: Sources, 47 Gap Filling PMIO Emission Factors for Selected Open Area Dust EPA-450188-003.
Transcript of AP42 Section: 1.3 4 47 Gap Filling PMIO Emission Factors ... · Gap Filling PMIO Emission Factors...
AP42 Section: 1.3
Background Chapter 4
Reference:
Title: Sources,
47
Gap Filling PMIO Emission Factors for Selected Open Area Dust
EPA-450188-003.
aingram
Text Box
Note: This is a reference cited in AP 42, Compilation of Air Pollutant Emission Factors, Volume I Stationary Point and Area Sources. AP42 is located on the EPA web site at www.epa.gov/ttn/chief/ap42/ The file name refers to the reference number, the AP42 chapter and section. The file name "ref02_c01s02.pdf" would mean the reference is from AP42 chapter 1 section 2. The reference maybe from a previous version of the section and no longer cited. The primary source should always be checked.
7
. . . . . . . . . . . . . . . . . . . . ............ ............ . . . . . . . . . . . . . . . . . . . . . . . . . . - , . . . . . . . . . . . . . . . . . . . . . .
EPA-450/4-88-003 United States Environmental Protection Planning and Standards February 1988
Office of Air Oualitv
Research Triangle Park NC 2771 1 ,' Anencv
~
GAP FILLING PM,o EMISSION FACTORS FOR SELECTED OPEN AREA DUST SOURCES
. ..... .:. 7 . . . . . . . . ... . . . . . . . . _ . ............... - . . . . . . . . . . . . . . . . . . . . . . - - ~. ~..
E PA -4 501 4 - 8 8 - 00 3
Gap Filling PM,,Emission Factors For Selected Open Area Dust Sou'rces
BY
Midwest Research Institute Kansas City MO 641 10
€PA Contract No.68-02-3891
'1,s. ENVIRONMENTAL PROTECTION AGENCY Office Of Air And Radiation
Office Of Air Quaiity Planning And Standards Research Triangle Park NC 277.1 1
February 1988
. .. . .... .. . . . . -. _.... . .. . . . .. . :.. . . . - . . . . ,,. ... .. . . .... . . . . . ,. . . . .. .. - . . . . . . . - .. . .
This report has been reviewed by the Office of Air Quality Planning and Standards. U.S. Environmental Protection Agency. and approved for publication as received from the contractor. Approval does not signify that the contents necessarily reflect the views and policies of the Aggxy . neither does mention of trade names or commercial products constitute endorsement or recommendation for use.
....... . . . . . . . . . . B ..... . . . . . . . . . . . . ................ . . . . . . . . . . ...... .... ... . . .~ .- " .._- - . . - .
rn
CONTENTS
Preface ................................................................ 1.0 Introduction ................................................ 2 . 0 , Oevelopment of Proposed PM,, Emtssion Factors ............... 3.0 Agricultural Tilling .........................................
Derivation of PM,, emission factor ................ Recommended PM,, emission factor(s) ................
3.1 Background ........................................ 3.2 3.3 3.4 Reference documents ...............................
Agricultural Harvesting of Cotton .......................... 4.1 Background ........................................ 4.2 4.3 4.4 Reference documents ...............................
5.0 Agricultural Harvesting of Grain ............................ 5 . 1 Background .......................................... 5 . 2 5 . 3 5.4 Reference documents ...............................
6.0 Waste Oisposal by Burning ................................... 6.1 Background ........................................ 6 . 2
- 6 . 3 6.4 Reference documents ...............................
7.0 Airport Runways (Unpaved) .................................... 7 . 2 Basis for derivation o, f ?MI, emission factor ...... 7.3 Recommended PM,, emission factor ............... i ... 7 . 4 Reference documents ...............................
3.0 Cattle Feedlots: ............................................ 3.i Sac~ground ........................................ 8.3 8.4 Assumptions and caveats ........................... 8.5 Reference documents ...............................
9.0 Construction Site Preparation ............................... 9 .1 Background ........................................ 9.2 Basis for derivation of PM,, emission factors ..... 9.3 Recommended PM,, emission factors ................. 9.4 Reference documents ...............................
4.0
Basis for derivation of PM,, emission factor ...... Recommended PM,, emission factor(s) ...............
Derivation of PM,, emission factor ................ Recommended PM,, emission factor(s) ...............
Basis for derivation of PM,, emission factor ...... Recommended PM,, emission factor(s) ...............
7.1 Background ........................................
. 8.2 Basis for derivation o f PM,, emission factor ...... Recommended PM,, emission factor(s1 ...............
i i i
ii
! 2
7 7 ,
9 9 9
11 11 11 11 11 13 13 13 13 13 18 18 !3' I
I 18 19' 20 20 20 20 2 1 21 22 22 22 26 26
. . . . . . . . . . . . . . . . . . . . . . . . . . . . . . . . . . . . . . . . . . . . . . . . . . . . . . . . . . . ... ... . . . - .. ... .. ~ ~~~~~~~ - . _
CONTENTS (concluded)
10.0 Demolition of Structures .................................... ~ ~
10.1 Background ............................. 10.2 Basis for derivation of PM,, emission 10.3 Recommended PM., emission factor ...... 10.4 Reference documents ...................
11.0 Off-Highway Vehicle Travel ...................... 11.1 Background ............................ 11.2 Basis for derivation of PM.. emission
........... actor ...... ........... ........... ........... ........... actor ...... ..
11.3 Recommended PM,, emission factors ................. 11.4 Reference documents ..............................
12.0 Municipal Solid Waste Landfills ............................ 12.1 Background ................................... ..I..
12.2 Basis for derivation of PM,, emission factor ..... 12.3 Recommended PM,, emission factor (preliminary 12.4 Reference documents ...............................
13.0 Coarse. Dry Tailings Ponds .................................. 13.1 Background ........................................ 13.2 Basis for derivation of PM,, emission factor ...... 13.3 Recommended PM,, emission factor ..................
14.1 Background ......................................... 14.2 Basis for derivation of PM,, emission factor ...... 14.3 Recommended PM,, emission factor ..................
....
13.4 Reference documents.. ............................. 14.0 Transportation Tire Wear ....................................
14.4 Reference documents . -.. .......................... : .. 15.0 Transportation Brake Wear ...................................
15.1 Background ........................................ 15.3 Recommended PM,, emission factor .................. 15.4 Reference documents ...............................
16.0 Road Sanding/Salting ........................................ 16.1 Background ........................................ 16.2 aasis for derivation o f PM,, EEiSSiOC factor .... I . . 16.3 Recommended PM,, emission factor(s) ...,......... ... 1.6.4 Reference documents ...............................
!7.9 Unpaved ?arxinq Lots ........................................ 17. i Introduction ....................................... 17.2 Basis for derivation of PH,, emission factor ...... 17.3 Pecommended PM,, emission factor .................. 17.4 Reference documents ...............................
15.2 Basis for derivation of PM,, emission factor ......
I
27 27 27 29 29 31 31 31 32 32 33 '33 33 34 24 35 35 35 37 37 38 38 38
38 39 39 29 29 39 40
!lc 45 45 (16 96
46 47 47
38
40
iv
. . . ..... . . . . . . . . . . . . . . . . . . . . . . . . . . . . . .... .". . . . . . . . . . . . . - . . - . . . . . . . . . . . . . . . . . . . . . . . . - .~~ . ~~.
TABLES
Number
1
2
3
4
5
6
7
8
3
' 10
11
12
13
PM,, Emission Factor Development .....<...................... Proposed Gap Filling Emission Factors............. .......... Particulate Emission Factors fcr Cotton Harvesting
Emission Rates/Factors from the Harvesting Grain............
Emission Factors for Open Burning of Nonagricultural
Emission Factors and Fuel Loading Factors for Open Burning
Operations.. ..............................................
Material.......... ........................................
of Agricultural Materials............. .................... Emission Factors for Leaf Burning ........................... Calculated Emission Factors for Construction-Related Fugitive Oust. ............................................
Net Particulate Concentrations and Ratios........ ........... Comparison o f Emission Factors for Road 2..... .............. Wind Erosion Emission Factor Testing.. ...................... Results o f Sieve Analyszs ................................... Mileage o f Treated Highways and Tolluays, and Mean A h d l
Snow Oays by Scats ........................................
10 - -
12
14
15
17
23
25
3 1
35
41
13
V
. . . ... . . . ~ . . . . ,, .. .. . . . ..L ....... . , . . . . . ..
. .. .. . ... .. . . . . . .. .. . . . .. . ... .. . . .. . " . , ..
I"
SECTION 1.0
INTRODUCTION
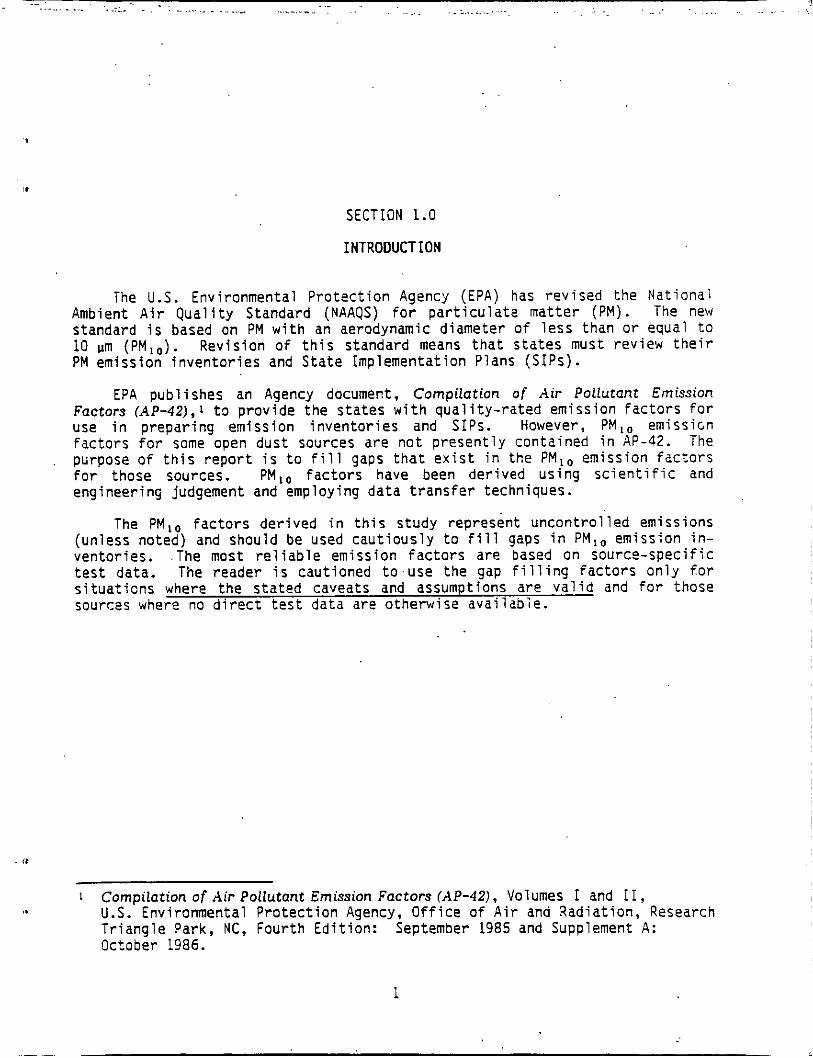
The Environmental P r o t e c t i o n Agency (EPA) h r e v i s e d the Na t iona l Ambient A i r Q u a l i t y Standard (NAAQS) f o r p a r t i c u l a t e ma t te r (PM). The new standard i s based on PM w i t h an aerodynamic d iameter o f l e s s than o r equal t o 10 urn (PM,,). Rev is ion o f t h i s standard means t h a t s t a t e s must rev iew t h e i r PM emission i n v e n t o r i e s and S t a t e Implementat ion Plans ( S I P S ) .
EPA pub l i shes an Agency document, Compi lat ion of Air Pol lutant Emission Factors (AP-42),1 t o p r o v i d e t h e s t a t e s w i t h q u a l i t y - r a t e d emiss ion f a c t o r s f o r use i n p repar ing emiss ion i n v e n t o r i e s and S I P S . However, PM,, emiss icn f a c t o r s f o r some open dus t sources are n o t p r e s e n t l y conta ined i n AP-42. The ptirpose o f t h i s r e p o r t i s t o f i l l gaps t h a t e x i s t i n the PM,, emiss ion f a c t o r s f o r those sources. PM,, f a c t o r s have been de r i ved u s i n g s c i e n t i f i c and engineer ing judgement and employing d a t a t r a n s f e r techniques.
The PM,, f a c t o r s de r i ved i n t h i s s tudy represent u n c o n t r o l l e d emissions (un less noted) and should be used c a u t i o u s l y t o f i l l gaps i n PM,, emiss ion in- ventor ies . The most r e l i a b l e emission f a c t o r s a re based on sou rce -spec i f i c t e s t data. The reader i s caut ioned t o use the gap f i l l i n g f a c t o r s o n l y for s i t u a t i c n s where t h e s t a t e d caveats and assumptions are v a l i d and f o r those sources where no d i r e c t t e s t da ta a re o therw ise a v a i l a o i e .
~
I Compilation of Air Pol lutant Emission Factors (AP-42), Volumes I and 11, U.S. Environmental P r o t e c t i o n Agency, O f f i c e o f A i r and Rad ia t ion , Research T r i a n g l e Park, NC, Four th Ed i t i on : September 1985 and Supplement A: October 1986.
1
... 7 ... ... . . . . . . . . . . . . . . . . ........... . . . . . . . .......... ..... . . . . .. -- . . . . . . . . . ..- . ..
~
. . .~.
SECTION 2.0
DEVELOPMENT OF PROPOSED PM,, EMISSION FACTORS
In this study, the first step consisted of the review o f current AP-42 factors for applicability, with particular emphasis on particle size informa- tion. For some open area dust sources, AP-42 presents particulate emission factors for total suspended particulates (TSP) o r other particle size frac- tions which can be used in estimating PM,,. The second step was to search for other documents which could contribute applicable PM,, emission factor information. Finally, al! technical information was evaluated and methods were proposed and then used to develop PM,, emission factors for the sources of interest.
In particular, three general techniques were used to develop PM,, factors. The first technique consisted of dividing a source activity into generic components and then combining available emission factors for these activities into a new emission factor for the source of interest. The second technique involved the formulation of a new factor using marginally applicable but related factors and size-specific data. The third technique was to base a PM,, factor on field testing data not currently reported in AP-42.
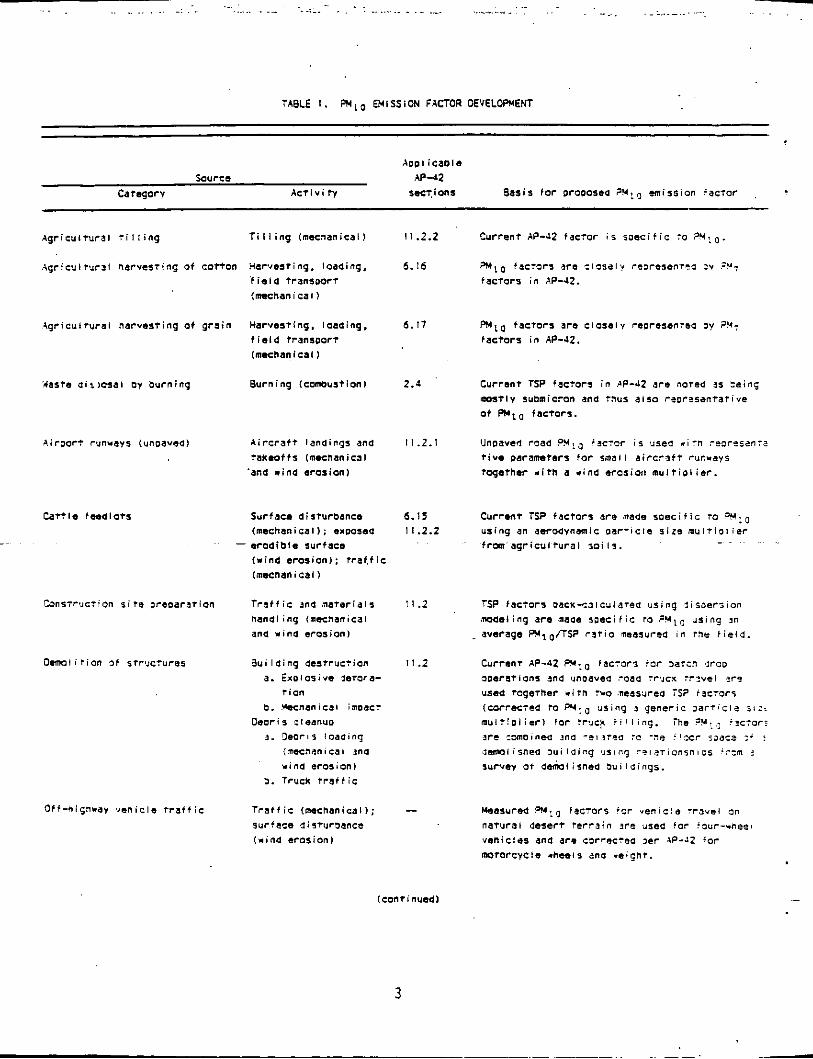
The above procedures resulted in PM,,. emission factors for the sources presented in Table 1. Each source is identified by category and dust-emitting activity. Related AP-42 emission factors are listed, if available, together 'with the basis for the proposed PM,, emission factor.
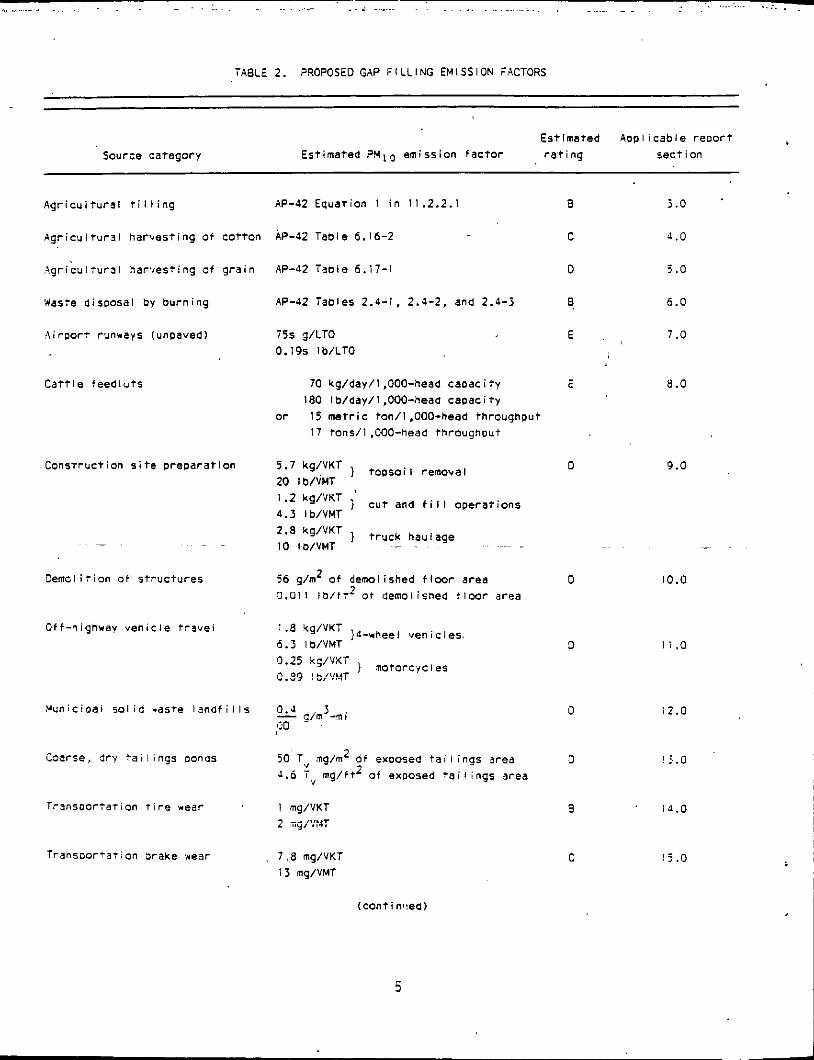
Table 2 summarizes and assigns quality r,atings to the proposed PM,, emis- sion factors for open area dust sources of interest and notes the relevant section of this report for each source. The quality ratings (A-E) are esri- mates of the reliability o f the factors and apply only when emission garam- ? t e r S are 'wizhin srated limits. Sections 3.0 through 17.0 oresent detailed background information and methodology f o r each of the proposea ?MI, idczirs, and state all assumptions and caveats. Background documents used 'as r e f e r - ences and to prepare the PM,, emission factors have been assembled and are on file at the Criteria Emissions Section of EPA's Office of Air Quality Planning and Standards.
~~~~~ ~ ~ ~~~
... ... . . . . . . . . . .......... . . . . . . . . . . . . . . . . . " . ...... ...... . -. . . . . . . .. __ ..~
. . TABLE I. FUlo EHISSION FACTOR OEVELOPHENT
AooIicaoIe Source AP-42
Catsgory Act1 v i t y secT i on5 8asis f o r orooosea ?MI0 emission actor ,
Agr icul tural t i l l i n g T i l l i n g (mechanical) I I .2.2 Current AP-42 factor i s soec i f ic 70 ?!4(:0.
Agriculr,w3l harvesting of cot ton Harvesting, loading, 5. I6 FUl0 f a c t i r s are c i i s a l y rwresenr-a ?Y 2'U.l
' f i e l d transoorr factors i n dP-42.
(mechanical)
,Agricufturai harvesting of grain Harvesting. loading, 5.17 FUi0 factors are cioaoly reoresentea JY ?!47
f i e l d transoort factors i n AP-42.
'daste di:iasal oy burning
Airwrr runravs (unoavea)
Off-kign-av 'renicle t r a f f i c
( m ~ n a n i c a l l
Burning tcomoustion) 2.4
A i r c r a f t landings ana 11.2.1 takeoffs Imecnanical
'and wind erosion)
Surface disturbance 6.15 (mechanical); exwasad 11.2.2
(wind erosion): t ra f , f ic (mecnanicall
T r a f f i c 2nd materials 11.2 handling (oechaniC31 ana rina erosion)
==erodible surface
Building destruction 11.2 a. Erolosive isrora-
b. .%cnanicJI imoact
3 . l e o r l s ioaaing
T i D "
Oeoris cleanuo
imscnanical ana Mind erosion)
S. Truck t r a f f i c
T r a f f i c (mechanical); -- surface di5Turbaocc ( w i o d erosion1
Current TSP factor¶ i n ?P-42 3r-e noted 2s >einS m s t l y submicron and thus also reorzsantarive of Rllo factors.
Unpaved road OMla iac?or i s usee " i r n ?e~rtsen:? t iye parameter3 for small a i c c r n f t rucw,ys tcqether r i t n a .ind erosioit m u l t i o l i e r .
Current TSP factors are made soec i f i c ro using an aerodynamic O W T I C I ~ s i z e m u l t i o ~ e r frm agr icu l tura l soils. ~
3
. . ... . . . . . . . . . . .... . . . . . . . . . . . . . . . . . . .~ .~
. . . . -. . . . . . . . . . . . . . . . . . . . . . . . . . . . . . . . . . . . . . . . . . . . . . . . . . . . ~. . . -
TABLE I t b n t i o u e a ~
Aooiicaola Source A P 4 2
< Category Act i v i ty sect I a n i Basis for prooosea ?HI,, emission facfor
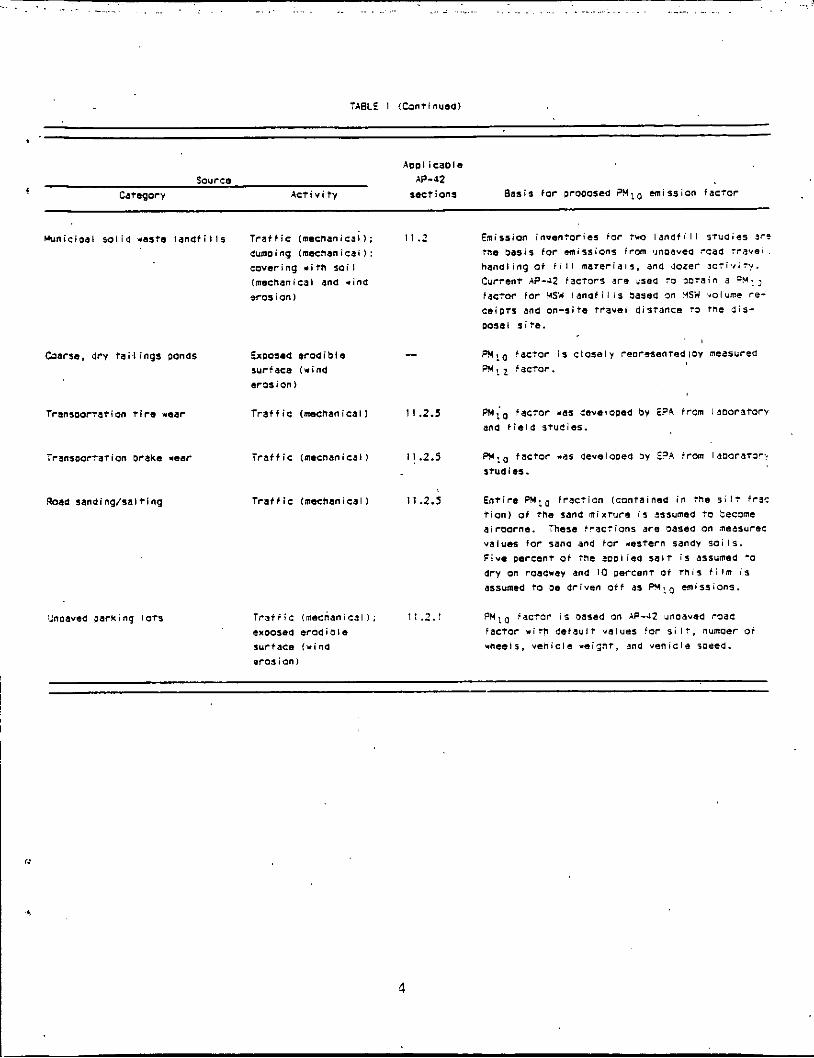
Hlnic ioai s o i i a waste I o n a t i l l s T r a f f i c (mecnanicai); 11.2 Emission iosantorics f o r tw) l a n d f i l l i t ua ies 3 r C
m e basis fo r m iss ions irom ,ulnoavea .-cad : r a v e * . dumoing (mechanical): covering .ith s o i i handling of f i l l mareriais. ana aozer x ~ i v i l y .
(mechanical ana *ins Current AP42 factors a r e uses to m r a i n a = N : ,
w o s i on I facfor far NSU I a n a f i i i s basea an 3SW volume re-
c e i ~ ~ s ana on-site t ravel d i i tance ro rne ais- posai s i t e .
I
Coarse. dry t a i l i n g s ponds Goosea erodible - elIo facfor i s c loseiy reoraseoraaiay measured surface ( r i n d W l z facmr. erosion)
T r a f f i c (mechanical) 1 I .2.s Transoarration f i r e m a r mio factor was aweiopcd by EPA from iaooratorv and f i e l d i tudie5.
W!o factor .as aevelooea by E?A irm IaDorarOr~ studies.
;ransoor?arion Drake .ear T r a f f i c (mechanical1 I I .2.5
Road sandinq/salting T r a f f i c (mechanical) 11.2.5 Entire PHlO f ract ion ;contained i n t h e 5 i l f f r x t i on ) o f the Sana rnixrure i s assumed t o tecome airoorne. ihese t-acfians are basea an ineasurec values for sana and for rastern sandy s o i i i . F ive percent of ?ne aooiiea salt i s assumed -0 d r y on roaarey ana 10 percent of m i 5 f i l m i s dsSumed t o be ariven o f f as cmissioos.
T r a f f i c (mecnanical ) ; I I .2 .1 P u l a factor i s oasea on rip-dz unpaved roaa exoosea erodible factor w i t h defau l t v a l u e s !or i i l t , numaer o i surtaca ( r i n a wheels. venic le -eignT. and venic le meed.
erosianl
4
. . .-.. ~. .. . . . :. . . ,.. ._ .- I . . . . . . . . - . . . . . . ~ . . . . . . . . . .. . . . . .. . . .. .. . .~
TABLE 2. PROPOSED GAP FILLING EMISSION FACTORS
Est imated App l i cab le r e o o r t Source ca tegory Est imate8 PMiO emiss ion f a c t o r r a f i ng s e c t i o n
A g r i c u l t u r a l t i I I i n g AP-42 Equat ion I i n 11.2.2.1 8 3.0
A g r i c u l t u r a l h a r v e s t i n g O f c o t t o n AP-42 Table 6.16-2 C 6.0
?gr icu l :u r i l har ' res t ing Gf g r a i n AP-42 Table 6.17-1 0 5 .O
Waste disoosal by bu rn ing AP-42 Tables 2.4-1, 2.4-2, and 2.4-3 8. 6.0
A i r p o r r runways (unpaved) 75s 3 1 ~ ~ 0 0.19s Ib/LTO
7 .O E ' 8
1
C a t t l e f e e d i u t s 70 kg/day/l,OOO-head c a o a c i t y E 8.0 180 Ib/day/l,OOO-neaa Capac i ty
o r 15 m e t r i c ton/I,OOO-head th roughput 17 tonS/ I ,GOO-head th roughput
0 5 . 7 kg/vKT 1 t n p s o i ~ removal 20 Ib/VHT
Cons t ruc t i on s i t e p repara t i on
kg/VKT 1 c u t an8 f i I I opera t i ons 4.3 I b/VHT
kg/VKT 1 t r u c k haulage IO Ib/VMT
9.0
Oemcl i t ion o f s t i u c t u r e s 56 g/m2 of demolished f l o o r area 0 10.0 7
3.011 I w t ? o t aemolisned t loor area
'" Cg/VKT }4-wheel veh ic les . 6.3 I b/VMT
').25 ''/'KT 1 notorc 'ycles 0.99 I b/\'!.+T
Off-highway v e h i c l e t r a v e l
D 11.0
D 12.0 - g/m'-ni
J.6 i,, mg/f t 2 of exposed t a i l i n g s area
Mun ic ipa l s o l i d r a s t e l d n d f i l l s ')O
50' Tv mg/m2 d f exoosed t a i I ings area Coarse, dry tai i ings Oonds 0 ! 3 . 0
Transoor ta i i an t i r e r e a r I mg/VKT 9 ' i 4 . O
2 xg /vnr
T ransoor ta t i on brake wear . 7.8 mg/VKT 13 mg/VMT
C 15.0
5
. . . . 7 .... ................... . . . . . . . . . . . . . . . . . . . . . . . . . . . . . . . . . . . . . . . :. - . . . . . . . . . . . . . . . . - . . . . . . . - . 1
. . .. ~ - _ ~.
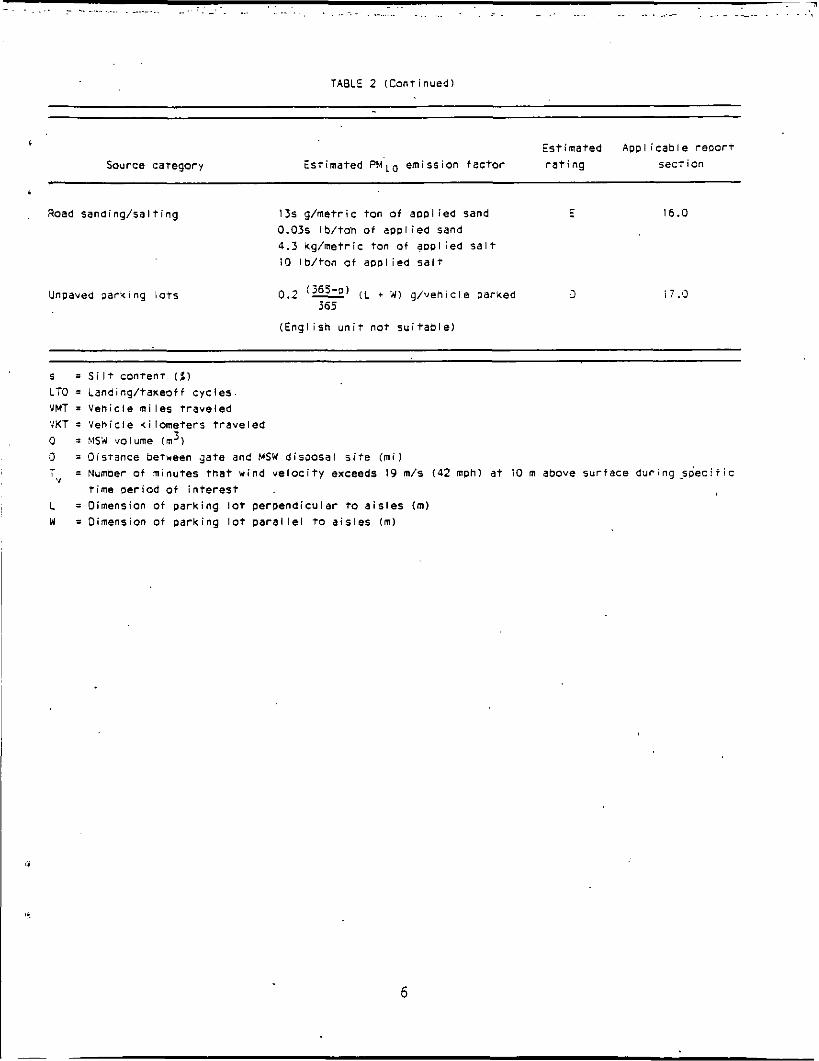
TABLE 2 (Cont inued)
E Es t imated App l i cab le reoorT
Source category i s t i m a t e d PMIO emission fec to r r a t i n g secTion
Road sand ing /sa l t i ng
Unpaved par!< i ng lots
13s g/met r ic ton of a p p l i e d sand E 16.0 0.03s Ib/tom o f a p p l i e d sand 4.3 k g h e t r i c ton o f aopl i ed S a l t IO Ib/ ton o i a p p l i e d s a l t
0.2 ‘j65-P’ (L + ‘W) g /ven ic le parked u i 7 .0 365
( E n g l i s h u n i t not s u i t a b l e 1
s = S i l t con tenr ( 5 ) LTO = Landing/takeoff c y c l e s . VNT = Veh ic le m i l e s t r a v e l e d VKT = ‘Vehicle k i l omete rs t r a v e l e d Q = %IS# volume ( m 1 3 = o is rance berveen ga te and MSW d i s w s a l s i t e ( m i l
T,,
L = Dimension of pa rk ing l o t pe rpend icu la r to a i s l e s (m) W = Oimension of pa rk ing lot p a r a l l e l to a i s l e s (ml
3
= Number Of i i n u t e s t h a t wind v e l o c i t y exceeds 19 m/s ( 4 2 mph) a t 10 m above s u r i a c e du r ing s d e c i i i c t ime Per iod o f i n t e r e s t
... .... .. . . . . . . . . ... . . . . . . . . . . . . . . . . - . . . . . . . . . . . . . . . . . . . . . . . .~
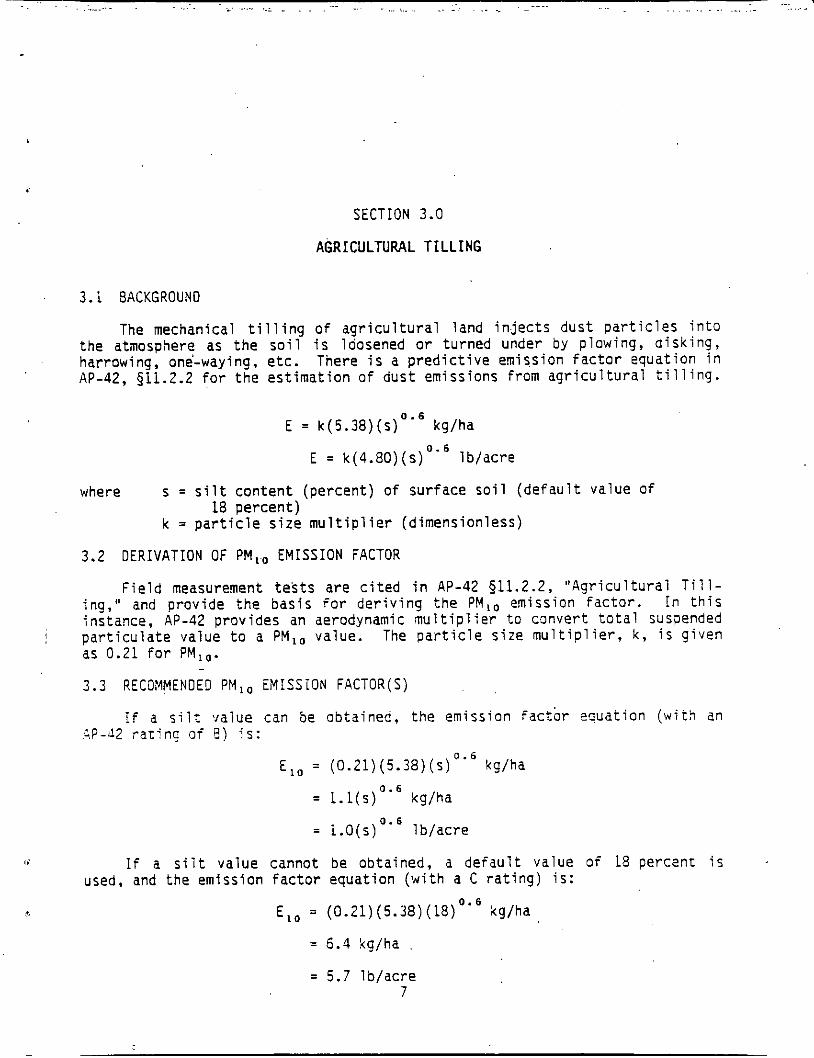
SECTION 3.0
AGRICULTURAL TILLING
3.1 BACKGROUNO
The mechanical tilling of agricultural land injects dust particles into the atmosphere as the soil is loosened or turned under by plowing, disking, harrowing, one-waying, etc. Tnere is a predictive emission factor equation in AP-42, $11.2.2 for the estimation o f dust emissions from agricultural tilling.
E = k(5.38)(~)"~ kg/ha
E = k(4.8O)(s)Oq6 lb/acre
where s = silt content (percent) o f surface soil (default value of
k = particle size multiplier (dimensionless) 18 percent)
3.2 DERIVATION OF PM,., EMISSION FACTOR
Field measurement tests are cited in AP-42 511.2.2, "Agricultural Till- ing," and provide the basis for deriving the PM,, emission factor. In this instance, AP-42 provides an aerodynamic multiplier to convert total suspended particulate value to a PM,, value. The particle size multiplier, k, is given as 0.21 for PM,,.
3.3 RECOMMENOED PM,, EMISSION FACTOR(S)
j
-
If a silt value can be obtained, the emission factor equation (with an
li If a s Y
4P-J2 rating o f E ) is:
E,, = (0.21)(5.38)(s)0.6 kg/ha 0 . 6
= l . l ( s ) kg/ha
= l.O(s) lb/acre
re cannot be obtained, a default v used, and the emission factor equation (with a C rating)
0.6
E,, = (0.21)(5.38)(18)0'6 kg/ha
= 6.4 kg/ha ,
= 5.7 lb/acre 7
lue of 18 percen is:
i
. . . . . . . . . . . . . . . ... ... . . . . . ~ . . . . . . . . . . . . . . . . . . . - . . . . . . . . . . . . . . . . . . ............ .-._ . ~~ ~. ~~
~~ -
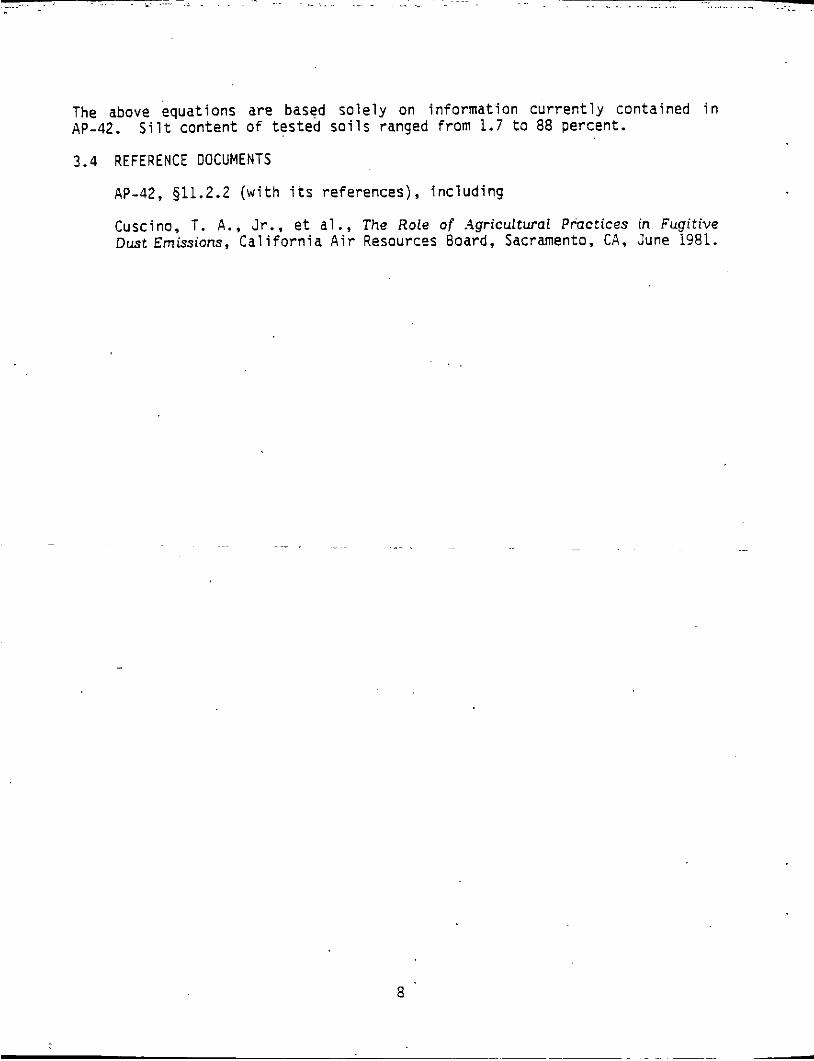
The above equations are based solely on information currently contained in AP-42.
3.4 REFERENCE DOCUMENTS
Silt content of tested soils ranged from 1.7 to 88 percent.
AP-42, 911.2.2 (with its references), including
Cuscino, T. A . , Jr., et al., The Role of .Agricultural Practices in Fugitive Dust Emissions, California Air Resources Board, Sacramento, Cd, June 1981.
8
- . . .... . . ... . . .. _ _ . ..- -. . .- L ... .. . . . . . ... . .. ' .. ~~. .. - - - - . .F.. . . .
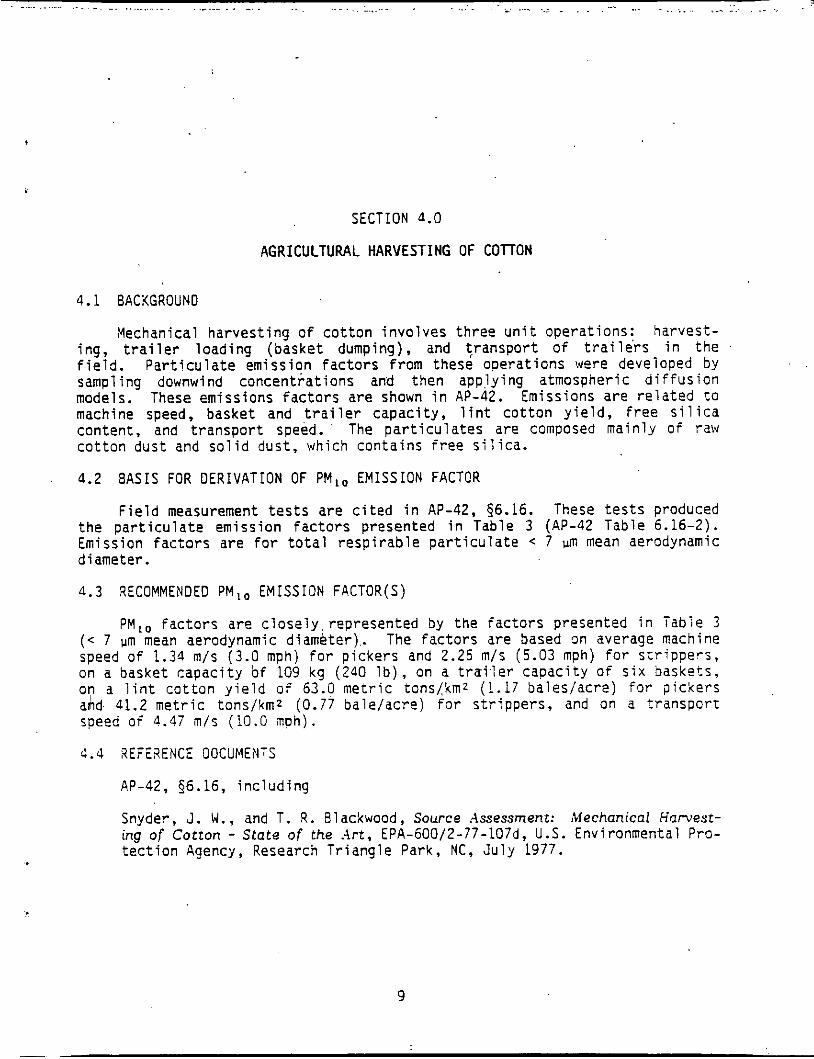
SECTION 4.0
AGRICULTURAL HARVESTING OF COTTON
4.1 BACKGROUND
Mechanical harvesting of cotton involves three unit operations: harvest- ing, trailer loading (basket dumping), and $ransport of trailers in the field. Particulate emission factors from these operations were developed by sampling downwind concentrations and then applying atmospheric diffusion models. These emissions factors are shown in AP-42. Emissions are related to machine speed, basket and trailer capacity, lint cotton yield, free silica content, and transport speed. ' The particulates are composed mainly of raw cotton dust and solid dust, which contains free silica.
4.2 BASIS FOR DERIVATION OF PM,, EMISSION FACTOR
Field measurement tests are cited in AP-42, 56.16. These tests produced the particulate emission factors presented i n Table 3 (AP-42 Table 6.16-2). Emission factors are for total respirable particulate < 7 um mean aerodynamic diameter . 4.3 RECOMMENDED PM,, EMISSION FACTOR(S)
PM,, factors are closely, represented by the factors presented in Tabie 3 ( < 7 urn mean aerodynamlc diameter),. The factors are based m average machine speed of 1.34 rn/s (3.0 mph) for pickers and 2 . 2 5 m/s (5.03 rnph) for strippers, on a basket capacity bf 109 kg (240 lb), on a trai.ler capacity of six baskets, on a lint cotton yield o f 63.0 metric tons[kmz (1.17 bales/acre) for pickers and. 41.2 metric tons/km* (0.77 bale/acre) for strippers, and on a transport speed of 4.47 m/s (10.0 aph).
4.4 REFEXENCE DOCUMENTS
AP-42, 56.16, including
Snyder, J. W . , and T. R . Blackwood, Source Assessment: Mechanical Harvest- ing of Cotton - State of the .Art, EPA-600/2-77-107d, U.S. Environmental Pro- tection Agency, Research Triangle Park, NC, July 1977.
9
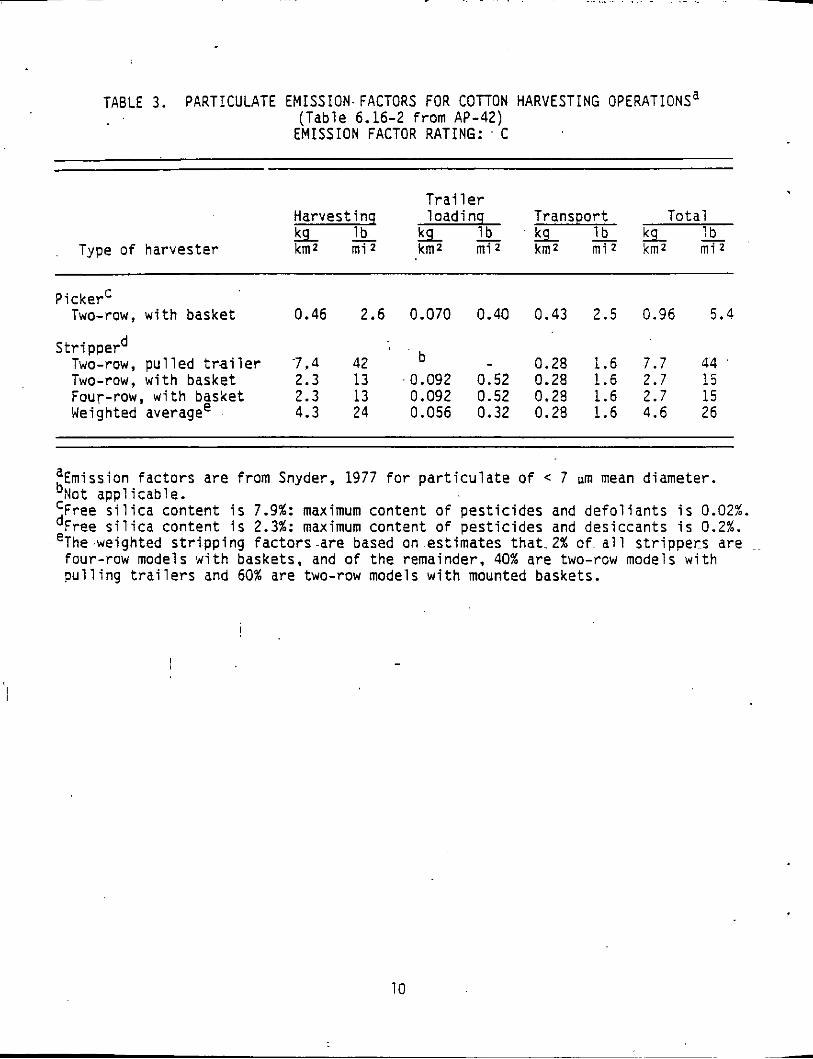
TABLE 3. PARTICULATE EMISSION. FACTORS FOR COTTON HARVESTING OPERATIONSa (Table 6.16-2 from AP-42) EMISSION FACTOR RATING: ' C
Trailer Harvest inq 1 oad i nq Transport Total kcJ lb k c J X & * k lb
Type of harvester km2 kmz mi2 krn2 m i 2 k m 2 mjz
pi ckerC Two-row, with basket 0.46 2.6 0.070 0.40 0.43 2.5 0.96 5.4
Two-row. ~u 1 1 ed trai 1 er -7,4 42 - 0.28 1.6 7.7 44 ' ' b Stri pperd
Two-row; with basket 2.3 13 -0 .092 0.52 0.28 1.6 2.7 15 Four-row, with basket 2.3 13 0.092 0.52 0.28 1.6 2.7 1 5 Weighted averagee 4.3 24 0.056 0.32 0.28 1.6 4.6 26
'Emission factors are from Snyder, 1977 for particulate o f < 7 um mean diameter. bNot applicab?e. 'Free silica content is 7.9%: maximum content of pesticides and defoliants is 0.02%. dFree silica content i s 2.3%: maximum content of pesticides and desiccants is 0.2%. eThe weighted stripping factors are based on estimates that 2% of all strippers are four-row models with baskets, and of the remainder, 40% are two-row models with pulling trailers and 60% are two-row models with mounted baskets.
10
7 . . . . . . . . .. . . . . . - ~ .... .. ._ . . ..~ ... . . .. . .. .. . - .
5.1 BACKGROUND
SECTION 5.0
AGRICULTURAL HARVESTING OF GRAIN
Mechanical ha rves t i ng o f g r a i n i nc ludes t h r e e opera t ions : (1) crop han- d l i n g by harves t machin,e, ( 2 ) l oad ing o f hzrvested c rop i n t o t rucks , and (3 ) t r a n s p o r t by t r u c k s on t h e f i e l d . P a r t i c u l a t e emiss ion r a t e s from these opera t ions were developed by sampling downwind concen t ra t i ons and then apply- i n g atmospheric d i f f u s i o n models. These emiss ion r a t e s / f a c t o r s a re g i ven i n AP-42 Table 6.17-1. Emissions are r e l a t e d t o combine speed, combine swath width, f i e l d t r a n s p o r t speed, t r u c k l oad ing t ime, t r u c k capac i t y , and t r u c k t r a v e l t ime.
5.2 'DERIVATION OF PM,, EMISSION FACTOR
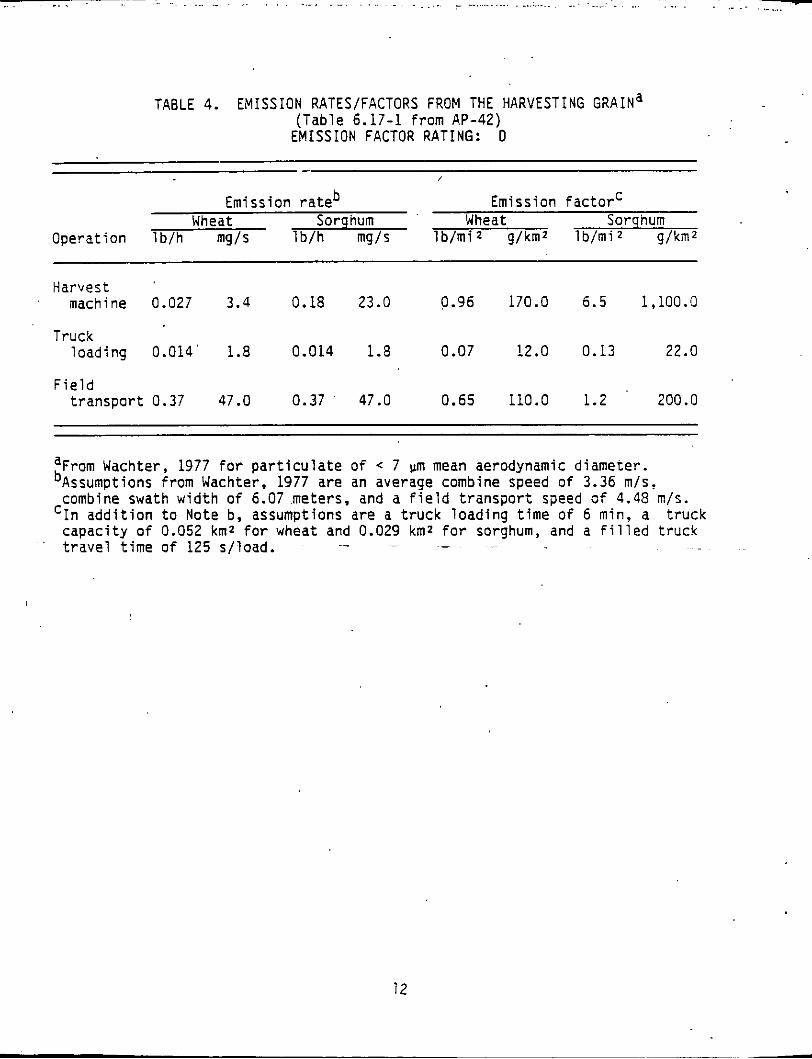
F i e l d measurement . t e s t s a r e c i t e d i n AP-42 96.17. These t e s t s produced t h e p a r t i c u l a t e emiss ion f a c t o r s / r a t e s i n Table 4 (AP-42 Table 6.17-1) Emis- s i o n f a c t o r s a r e f o r t o t a l r e s p i r a b l e p a r t i c u l a t e o f < 7 urn mean aerodynamic d iameter and a l so are es t imates o f PM,, f a c t o r s .
5.3 RECOMMENDED PM,, E M I S S I O N FACTOR(S)
PM,, fac t0r .s a re c l o s e l y represented by t h e f a c t o r s presented i n AP-42 Table.4 ( < 7 pm meal: aerodynamic d iameter ) . Assumptions are an average com- b ine speed o f 3.36 m/s , combine swath w i d t h o f 6.07 m, a f i e l d t r a n s p o r t speed o f 4.48 m/s, a t r u c k l oad ing t ime o f 6 min, a t r u c k c a p a c i t y o f 0.52 kmz f o r wheat and 0.029 k m z f o r sorghum, and a f i l 1 ,ed t r u c k t rave l . t ime o f 125 s per load.
5 . 4 REFERENCE DOCUMENTS
I
AP-42, 56.17, i n c l u d i n g
Wachter, R. A., and T. R. Blackwood, Source Assessment: Harvesting of Grain, State of the A r t , EPA 600/2-79-107f, U.S. Environmental P r o t e c t i o n Agency, Research T r i a n g l e Park, NC, J u l y 1977.
11
~. . .. . - . . . . ~~ ~~ ~~ ~~ .. _ - ,. ... . . , . . . . ... .~ . .. .. . , . . .. . . . .. . . . . . .. .. . . .. .
TABLE 4. EMISSION RATEVFACTORS FROM THE HARVESTING GRAIN^ (Tab le 6.17-1 f rom AP-42)
E M I S S I O N FACTOR RATING: 0
Emiss ion r a t e b Emission f a c t o r ' Wheat Sorqhum Wheat Sorghum
l b / h mg/s 1 b/mi 2 g/km2 1 b/mi 2 g/km2 Opera t i on I b / h mg/s
Harvest machine 0.027 3.4 0.18 23.0
Truck l o a d i n g 0.014' 1.8 0.014 1.8
0.96 170.0 6.5 1,100.0
0.07 12.0 0.13 22.0
F i e l d t r a n s p o r t 0.37 47.0 0.37 47.0 0.65 110.0 1.2 200.0
aFrom Wachter, 1977 f o r p a r t i c u l a t e o f < 7 urn mean aerodynamic d iameter . bAssumptions f rom Wachter, 1977 are an average combine speed o f 3.36 m/s.
' In a d d i t i o n t o Note b, assumptions a r e a t r u c k l o a d i n g t i m e o f 6 min, a t r u c k combine swath w i d t h o f 6.07 meters, and a f i e l d t r a n s p o r t speed o f 4.48 m/s.
c a p a c i t y of 0.052 kmz for wheat and 0.029 kmz f o r sorghum, and a f i l l e d t r u c k t r a v e l t i m e o f 125 s / load. ~
~ ~ ~
12
. . . .... ~. . .. .. . . ..-. . . . . . . -.:, . .. .. . . .. . . . . .. . ". --. ... . . . . _ . ... - .
SECTION 6.0
WASTE DISPOSAL BY BURNING
6.1 BACKGROUNO
Open burning is used to dispose of both industrial and agricultural wastes. Various burning emission factors are reported in AP-42, 92.4, but there is no indication of "exact" particle size. Dominant activities in- fluencing emission levels are firing techniques, moisture conrent, and "fuel" type.
6.2 B A S I S FOR DERIVATION OF PM,, EMISSION FACTOR
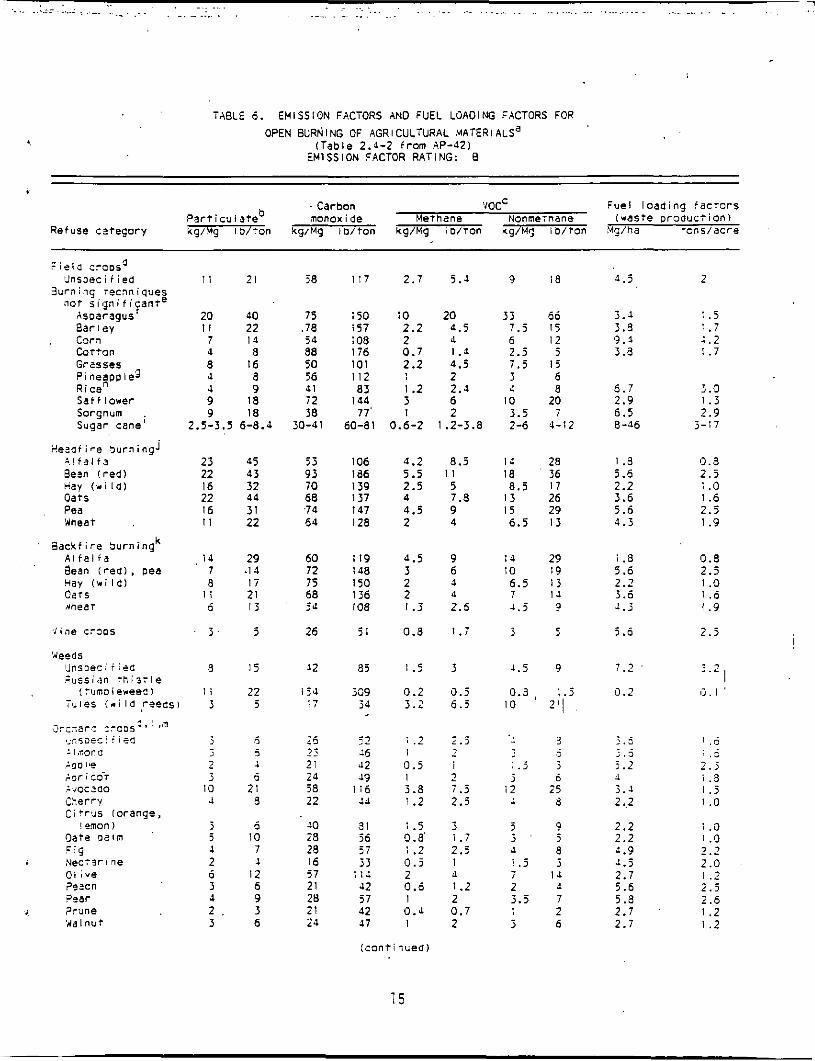
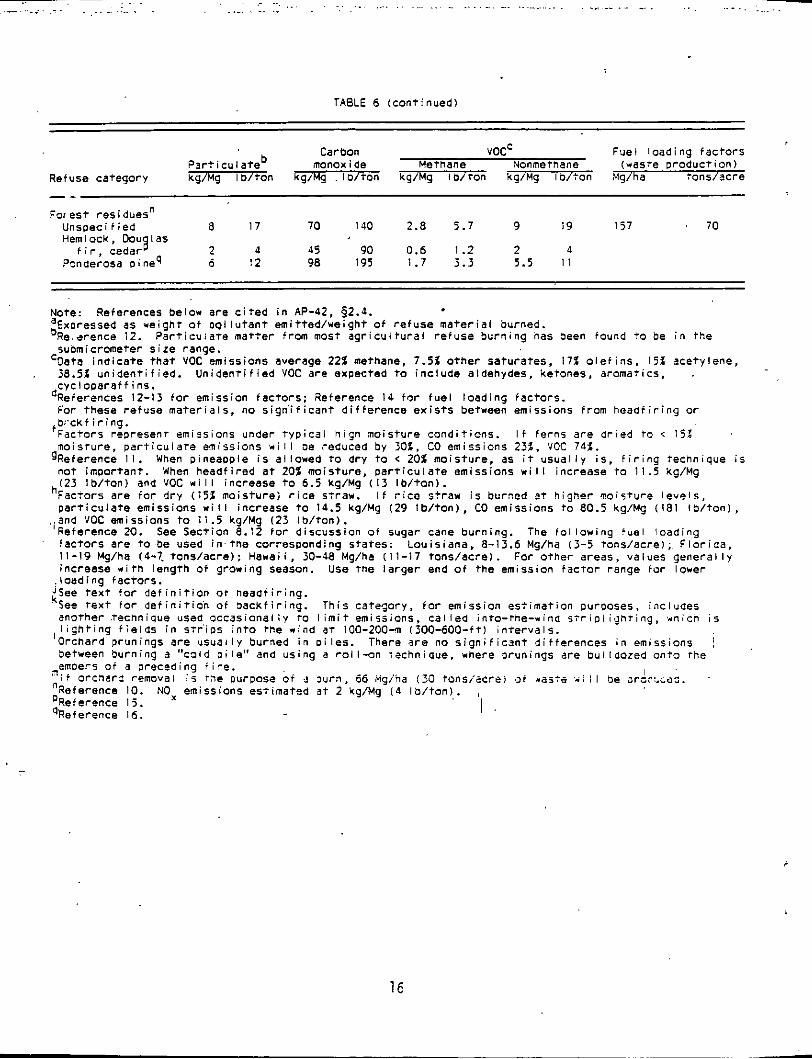
Total particulate values for open and agricultural burning in AP-42 Tables 2.4-2 and 2.4-3 are footnoted as being mostly submicron, and thus should represent PM,, emission factors well.
6.3 RECOMMENDED PM,, EMISSION FACTOR(S)
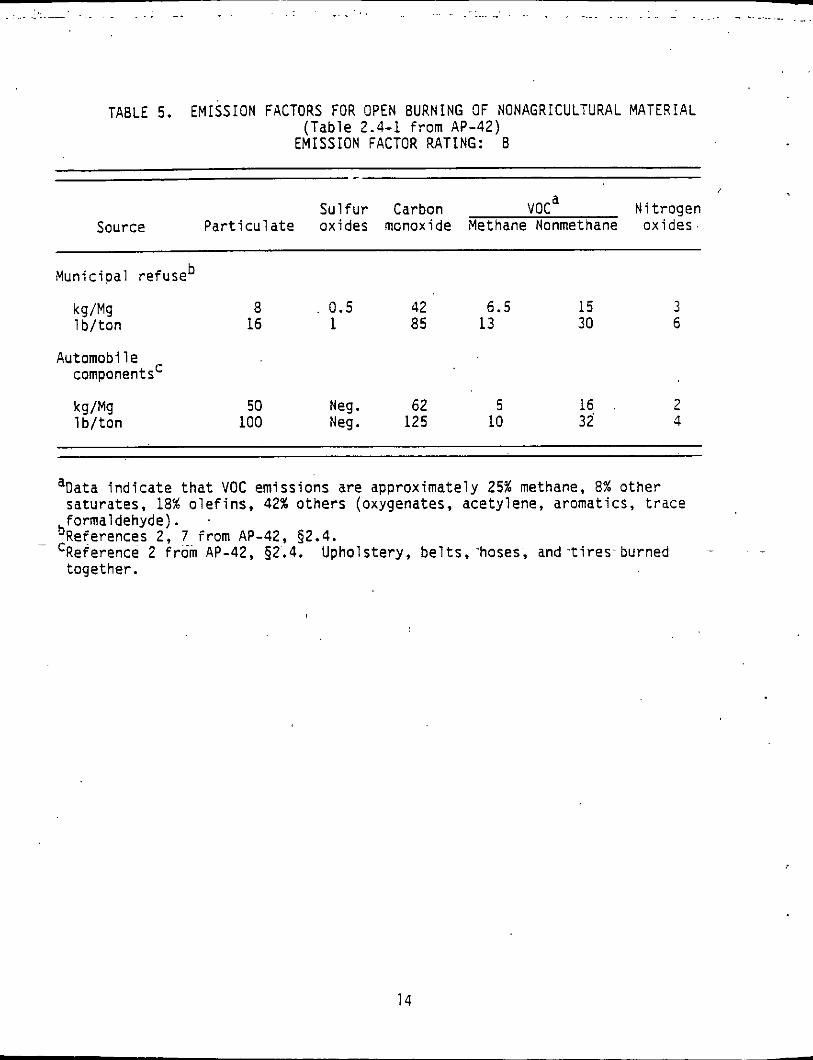
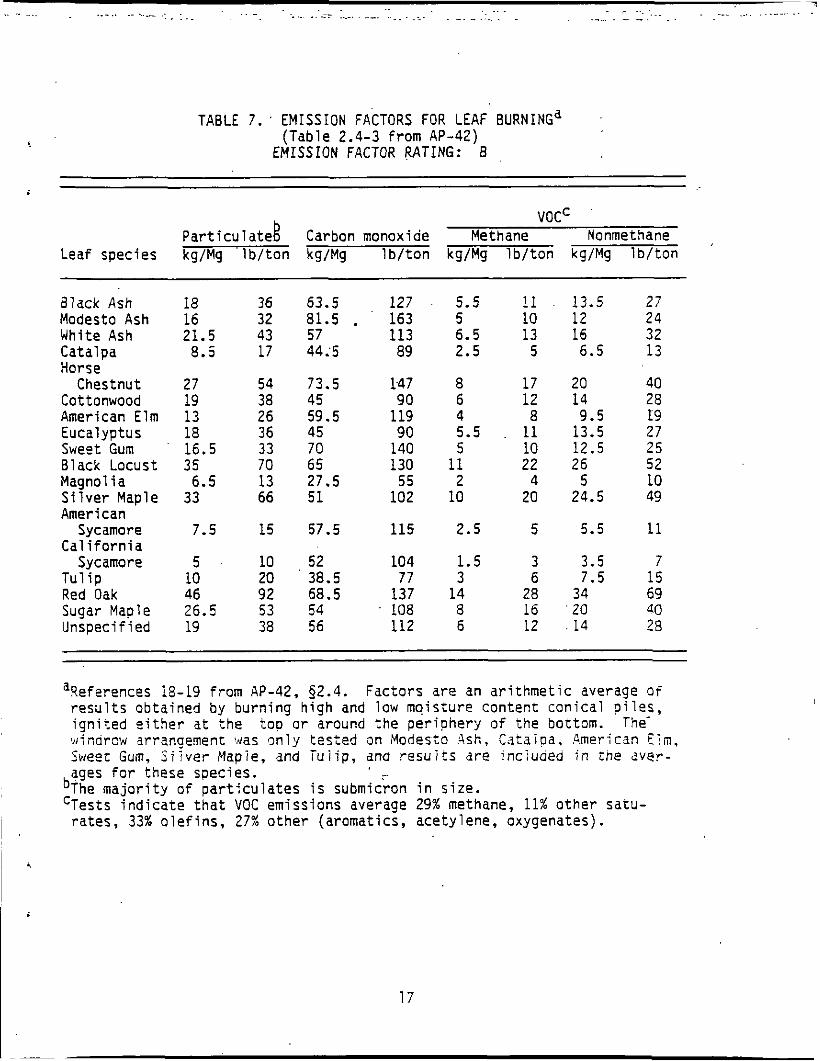
It i s assumed that all emission factors given in Tables 5 to 7 (AP-42 Tables 2.4-1 to 2.4-3) are 5 10 pmA. As a result, the attached AP-42 Tabies 2.4-1, 2.4-2, and 2.4-3 are representative also o f PM,, emission factors. I
6.4 REFERENCE OOCUMENTS
AP-42, $2.4 (with its references). I
- ... . . - . .. . . .___ .. . . . .. .~ . . .. .. - . . . .. . . : .. .. .. -_ . .. . . . . . --.
TABLE 5. EMISSION FACTORS FOR OPEN BURNING OF NONAGRICULTURAL MATERIAL (Table 2.4-1 from AP-42)
EMISSION FACTOR RATING: 8
Sulfur Carbon v0ca Nitrogen Source Particulate oxides monoxide Methane Nonmerhane oxides.
~~ ~~
b Municipal refuse
a 0.5 42 6.5 15 3 16 1 a5 13 30 6
kg/Mg 1 b/ton
Automobile component sc
50 Neg . 62 5 100 Neg . 125 10
16 32
2 4
‘Data indicate that VOC emissions are approximately 25% methane, 8% other saturates, 18% olefins, 42% others (oxygenates, acetylene, aromatics, trace formaldehyde).
~ ~ bReferences 2, 7 from AP-42, 52.4. ‘Reference 2 from AP-42, 62.4. Upholstery, belts, hoses, and tires burned ~
together.
14
~ ~~~
... . . . ... ... ......... .. - . ........ - - . .~ . ~ .. . ~~ ~ . . . . . . . . - .. . ~~.
. - . -. - . . .... . . . . ? :~ . . . . : I .. . .. .. . .
TABLE 6. EMISSION FACTORS AN0 FUEL LOAOING C.ACTORS FOR
OPEN BURNING OF AGRICULTURAL MATER1 ALSa (Table 2.4-2 f rom AP-42)
ENlSSlON FACTOR RATING: B
Carbon 'IOCC Fuel l oad ing fac -o rs
rons/acre nonox i de Methane Nonmeinane ( # a s t e p r o d u c t i o n ) b P a r t i c u l a t e
Refuse category kg/Mg I b / t o n kg/Mg l o / t on kg/Hg l o / T O n kg/Mq l b / t o n Mg/ha
F i e i d i r o ~ s ' Unspeci f ied
3urn ing recnniques nor s i g n i i i a n t e
Asparagus Bar I ey Corn Cotton Grasses p i neapp I e3 Ricen Sa i f loner Sorgnum , Sugar cane'
F
i r e >u rn ingj r l f a l f ~ Bean ( r e d ) Hay ( w i l d ) Oats Pea Wheat
k 3 a c k i i r e 3urn ing n l f a l i a Bean ( r e d ) . pea Hay ( w i l d 1 Oars mnear
l i n e c r 3 p s
'deeds Unsaeci i ied .;ussian rhi5:le
( r u m 0 i eweel) T u l e s ( r i l a , reeds)
,;~53et: i i ea v m n a ,200 Ice ;oric37 .:ioc3ao i> ,er ry C i t r u s (orange,
I emon) Date D d l m F i g NecTar i ne @I i ve ??am Pear
i ?rune 'Nalnur
7r;nar: CrsDs'.' 8'
I 1 21
40 20 1 1 22 7 14 d 8
16 8 3 8
9 J 18 9
9 18 2.5-3 .5 6-8.4
23 45 43 22 ~~
32 16 44 22 31 16
1 1 22
14 29 7 .I 4 8 17
21 I / I: 5
3 . 5
15
1 1 22 J 5
8
5 6 6
2 4 5 i
21 4 8
10
3 10 6 5 1 7 2 J 6 I2 3 6 3 9 2 . 3 3 6
58
75 .78 5 4 88 50 56 41 7 2 38
30-41
53 93 70 68 -74 64
60 72 75 68 54
26
3 2
I 3 4 I:
26
21 24 58 22
10 28 28 16 57 21 28 21 23
7: _ _
I17 2.7 5 . 1 9 I 8 4.5
150 10 20 5 5 66 3 . 4 I 57 2.2 4 . 5 7 . 5 15 3.8 108 2 4 6 12 9.4 I76 0.7 1.4 2 . 5 5 3.3 101 112 83 1.2 2.1 4 8 6 . 7 I 44 3 6 10 20 2.9 77' I 2 5.5 7 6 . 5
60-81 0.6-2 1.2-3.8 2-6 4-12 8-46
2.2 4 . 5 7 . 5 I 5 2 3 6
I06 4.2 8.5 I 4 28 I . 3 1-36 5 . 5 I I 18 . 36 5.6
I19 148 I50 I 3 6 I08
5 1
85
509 34
=, _ - 16 a2 49
I T6 4d
31 56 5 7 33
: I1 32 57 42 17
4 . 5 9 I 4 29 : .8 ~~ ~~
3 6 10 I9 5.6 2 1 6.5 I 5 2.2 2 4 7 I1 3.6 1.3 2.6 4.5 '? 1.3
F 0.8 1 . i 5 5.6
1.5 3 1 .5 9 7.2
0.2 9.5 0 . 3 , ; . 5 0 . 2 5 . 2 6.5 10 2'1
: . 5 5 5.2 I ? 6 i 0.5 I : . 5 5 5.2 I 2 2 6 i 0.5 I
3.8 7 . 5 I2 25 3.1 1.2 2.5 .I 8 2 ..2
1.5 3 5 9 2.2 0.8' 1 . 7 5 ' 5 2.2 i .2 2 . 5 1 8 d.9
i . 5 5 4 . 5 2 d 13 2.7 0 .5 I
0.6 1.2 2 d 5 . 6 I 2 3.5 7 5.8 0 . a 0 . 7 1 2 2.7 I 2 5 6 2.7
-
2
I . 5 1.7 4 . 2 I . 7
5.0 I . 3 2.9
j -17
0 .3 2.5 I .o I .6 2 . 5 I .9
0.8 2.5 I .O : .6 t .9
2.5
5 . 2 I # ; . I '
5 .6
2.3 I . a I . 5 I .o
i .0 I .0 2 .2 2 .0 I . z 2.5
. - . ^ , <
2 . 6 I .2 I . z
( c o n t i cued1
1 5
. . . .. .. - . . - . .. .... . . ~... .. .. -- .F .-.. . . . . . . . . . . .~ . .- .~ . . . - -. . - - :’
TABLE 6 (con t inued)
Carbon VOCC Fuei load ing f a c t o r s
Refuse ca tegory kg/Mg Ib/ ton kg/Mg . l o / t o n kg/Mg I b l t o n kg/Mg lD/ton Mg/ha t o n s i a c r e (waste p roduc t i on ) monox i de gethane Nonmethane b P w t i c u l a t e
Fo res t res iduesn Unspec i f i ed 0 17 70 I40 2.0 5.7 9 19 I 5 7 Hemlock, Dou i as
Pcnderosa D i neq 6 ! 2 90 I95 1.7 3.3 5.5 I 1 f i r , cedar a 2 4 45 90 0.6 1.2 2 4
70
Note: References below a re c i t e d i n A?-42, 92.4. aFxoressed as weight O f ovl l u t a n t m i t t e d / w e i g h t of r e f u s e m a t e r i a l burned. b ie .d rence 12. P a r t i c u i a r e ma t te r from most a g r i c u i t u r a l r e f u s e bu rn ing nas 3een found t o be i n t h e
suomicrometer s i z e range.
38.52 u n i d e n t i f i e d . U n i d e n r i f i e d VOC a re expected t o i n c l u d e aldehvdes. ketones. aromaTiCS. . 'Oats i n d i c a t e t h a t VOC emissions average 22% methane, 7.5% o t h e r sa tura tes , 17% o l e f i n s . I 5 2 ace ty lene,
& l o p a r a f t ins .
For these r e f u s e m a t e r i a l s , no s i g n ’ i f i c a n t d i f f e r e n c e e x i s t s between emissions from h e a d f i r i n g or
Fac to rs represent emissions under t y p i c a l h i g h mo is tu re c o n d i t i o n s . I f f e rns a r e d r i e d t o < 15’ moisTure. p a r t i c u l a t e emissions w i l l De reduced by 30%, CO emissions 23%. VOC 741.
not impor tan t . When head f i red a t 20% mois tu re , p a r t i c u l a t e emissions w i l l increase t o 1 1 . 5 kg/Mg (23 I b / t o n ) and VOC * i l l increase t o 6.5 kg/Mg ( 1 3 I b / t o n l .
p a r t i c u l a t e emissions w i l l i nc rease t o 14.5 kg/Hg (29 I b / t o n ) , CO emissions t o 80.5 kg/Mg (181 I b / t o n ) ,
Reference 20. See Sect ion 0.12 f o r d i scuss ion ot sugar cane burn ing . The f o l l o w i n g tuel l oad ing !ac to rs a r e t o be used i n tne cor respond ing s ta tes : Lou is iana . 8-13.6 Mg/ha (3-5 tons /acre) ; F l o r i d a , 11-19 Mg/ha (4-7.tons/acre); Hawaii , 30-48 Mg/ha (11-17 tons /ac re l . For o t h e r areas, values g e n e r a l l y increase * i t h length o f growing season. Use tne l a r g e r end of t h e emission f a c t o r range fur lower
dReferences 12-15 f o r emission f a c t o r s ; Xeference 14 f o r f u e l load ing fac to rs .
fb: ‘ckf i r ing.
gReference 1 1 . When p ineapp le i s a l lowed t o dry to < 20% mois tu re . as i t Usua l l y i s , f i r i n g techn ique i s
hFac tors a re f o r d r y ( i 5 1 mois tu re ) r i c e straw.
.iand VOC emissions to 11.5 kg/Mg (23 Ib / ton) .
I f r i c e Straw i s burned a t h ighe r mo is tu re l e v e l s ,
, l oad ing fac to rs . JSee t e x t for d e f i n i t i o n at n e a a t i r i n g . ‘See t e n t f o r d e f i n i t i o n o f b a c k f i r i n g .
‘Orchard prun ings a r e ,usually burned i n p i l e s .
‘) t orchar9 removal i s m e purpose of 1 ,urn, 66 Mgina (30 tons /bcre) .ai ..asti. i i I I be sr&?d;ei. “eference IO . Paeference I j . qkeference 16.
T h i s cat?n,ory, f o r emission es t ima t ion purposes, inc ludes angrher tecnn ique used uccas iona l i y ro l i m i t emissions, c a l l e d into-the-wind s ? r i p I i g h t i n g , r n i c n i s l i g h t i n g f i e l d s i n s t r ’ i os i n t o t h e wind aT 100-200-m (300-600-f t ) i n t e r v a l s .
betueen burn ing a “c3Id p i l e “ and us ing a roll-on Tachnique, where prun ings a re bu l l dozed o n t o rhe emoers o f a preceding f i r e .
There a r e no s i g n i f i c a n t d i f f e r e n c e s i n emissions j
NOx emissions es t imated a t 2 kg/Mg ( 4 I b / t o n ) . , I
16
- . . . . . . . . . . ... .. . . . ... ... . . . . . . . . . . . ... ...... . . . . - - - . . ... . . . ..... . . . . . ......
. . -. .. - ~. ._ .~ ~~
TABLE 7. 1 EMISSION FACTORS FOR LEAF BURNING^ (Table 2.4-3 f rom AP-42)
EMISSION FACTOR RATING: B
vocc P a r t i c u l a tek Carbon monoxide Methane Nonmethane
Leaf species kg/Mg ' l b / t o n kg/Mg l b / t o n kg/Mg l b / t o n kg/Mg I b / t o n
Black Ash i a 36 63.5 127 Modesto Ash 16 32 81.5 . 163 White Ash 21.5 43 57 113 Catalpa 8.5 17 44;5 89 Horse
Chestnut 27 54 73.5 147 Cottonwood 19 38 45 90 American E l m 13 26 59.5 119 Eucalyptus 18 36 45 90 Sweet Gum 16.5 33 70 140 Black Locust 35 70 65 130 Magnol ia 6.5 13 27.5 55 S i l v e r Maple 33 66 51 102 American
C a l i f o r n i a Sycamore 7.5 15 57.5 115
5.5 11 . 13.5 27 5 10 12 24 6.5 13 16 32 2.5 5 6.5 13
a 17 20 40
4 a 9.5 19 6 12 1 4 za
~~
5.5 . ii 13.5 27 5 10 12.5 25 1 22 26 52 2 4 5 10 0 20 24.5 49
2.5 5 5.5 11 ~~
Sycamore 5 10 52 104 1.5 3 3.5 7 Tu1 i p 10 20 38.5 77 3 6 7.5 15 Red Oak 46 92 68.5 137 14 za 34 69 Sugar Maple 26.5 53 54 ma 8 16 20 ao Unspec i f ied 19 38 56 112 6 12 . 14 28
aReferences 18-19 f rom AP-42, 92.4. Fac to rs a r e an a r i t h m e t i c average o f r e s u l t s ob ta ined by bu rn ing h igh and low mo is tu re conten t c o n i c a l p i l e s , i g n i t e d e i t h e r a t t h e t o p or around t h e pe r iphe ry o f the bottom. The- 'windrcw arrangement xas m l y tes ted on Modesto Ash, Catalpa, .4merican E?m, Sweet Gum, S i i v e r Mapie, and Tu l ip , and r e s u i t s dre inciuaea i n i n e aver- ages f o r these species. -
bThe m a j o r i t y o f p a r t i c u l a t e s i s submicron i n s ize . CTests i n d i c a t e t h a t VOC emissions average 29% methane, 11% o t h e r satu-
r a t e s , 33% o l e f i n s , 27% o t h e r (aromat ics, acety lene, oxygenates).
17
- . . . .. .~ ~ - .. . ... ~ .... . . ~ . .. .. ... .. ~ . , . .. . , .. . .. ~- . . . . . ... . . . - .. .. . - . . ~.
'.
SECTION 7.0
AIRPORT RUNWAYS (UNPAVED)
7.1 BACKGROUNO
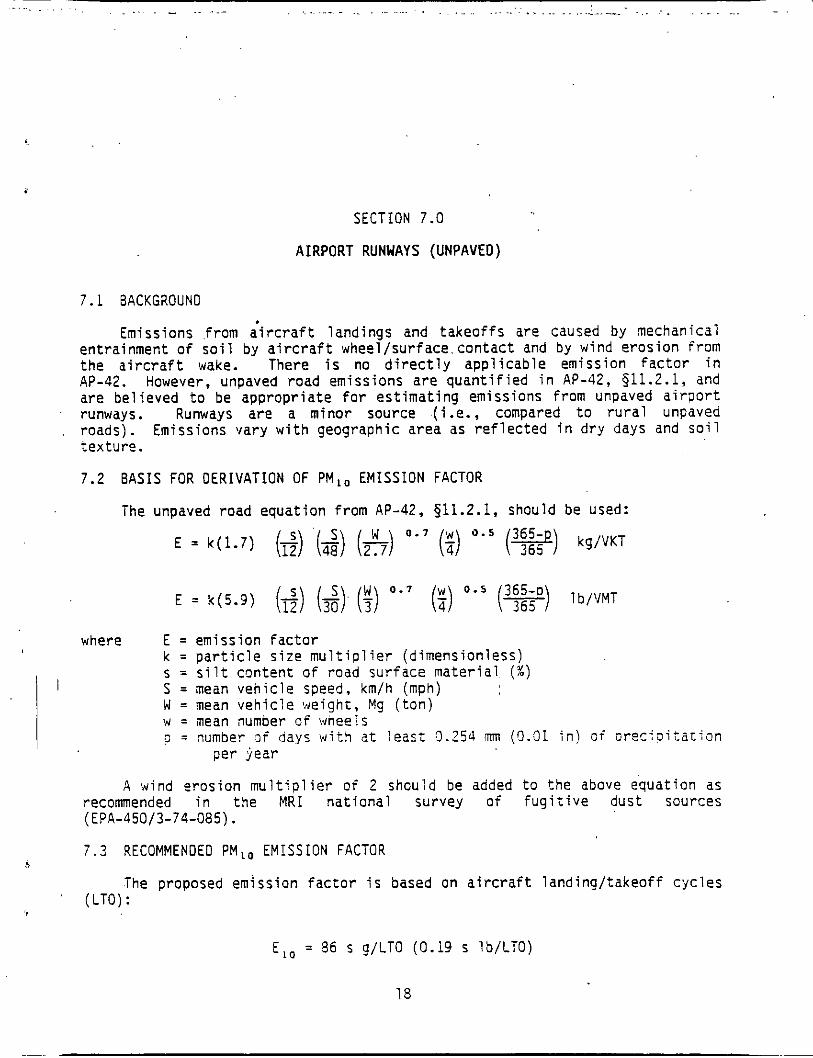
Emissions from aircraft landings and takeoffs are caused by mechanical entrainment of soil by aircraft wheel/surface.contact and by wind erosion from the aircraft wake. There is no directly applicable emission factor in AP-42. However, unpaved road emissions are quantified in AP-42, 911.2.1, and are believed to be appropriate for estimating emissions from unpaved airport runways. Runways are a minor source (i.e., compared to rural unpaved roads). Emissions vary with geographic area as reflected in dry days and soil texture.
7.2 BASIS FOR DERIVATION OF PM,, EMISSION FACTOR
The unpaved road equation from AP-42, 511.2.1, should be used:
E = k(1.7) (6) '(4) (A) (:) ' * ' (s) kg/VKT
where E = emission factor k = particle size multiplier (dimensionless) s = silt cmtent of road surface material (%) 5 = mean vehicle speed, km/h (mph) W = mean vehicle !weight, Mg ( t o n ) w = mean number of wneels p = number of days with at least 9.254 rnm (0.31 In) o f srecioitation
A wind erosion multiplier of 2 should be added to the above equation as recommended in the MRI national survey of fugitive dust sources
i . 3 RECOMMENDED PM,, EMISSION FACTOR
I
per year
(EPA-450/3-74-085).
5
The proposed emission factor is based an aircraft landing/takeoff cycles ' (LTO) :
',
= 36 s g/LTO (0.19 s lb/LTO) E l ,
18
. . . . - .. . . . . . . . . . . . . . . . . . . . . . . . . . . . . . . . . . . . . . . . . . .. . . .~
~~ ~~~
where
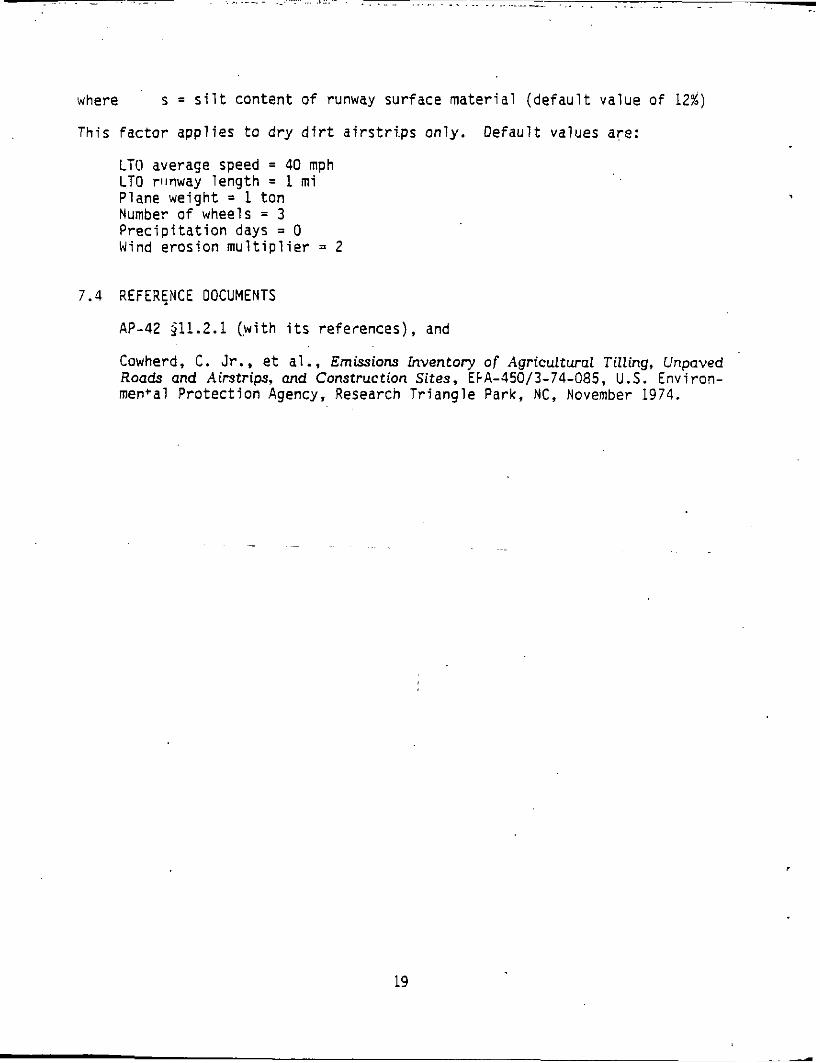
This factor applies to dry dirt airstri.ps only. Default values are:
s = silt content of runway surface material (default value of 12%)
LTU average speed = 40 mph LTO rlmway length = 1 mi Plane weight = 1 ton Number of wheels = 3 Precipitation days = 0 Wind erosion multiplier = 2
7.4 REFERENCE DOCUMENTS
AP-42 $11.2.1 (with its references), and
Cowherd, C. Jr. , et al., Emissions Inventory of Agricultural TiZling, Unpaved Roads and Airstrips, and Construction Sites, EFA-350/3-74-085, U.S. Environ- mental Protection Agency, Research Triangle Park, NC, November 1974.
19
B . . ~ ,.. . . . .. - . .. . .. . . . . .. .. .. . .~ . .. . . . - . .. . - . . . . . ~ . . .. .. ~ ~ . . ... ..~ . . ~ .. . . .. - . ~ . . ,
SECTION 8.0
CATTLE FEEDLOTS
5
8.1 EACKGROUNO
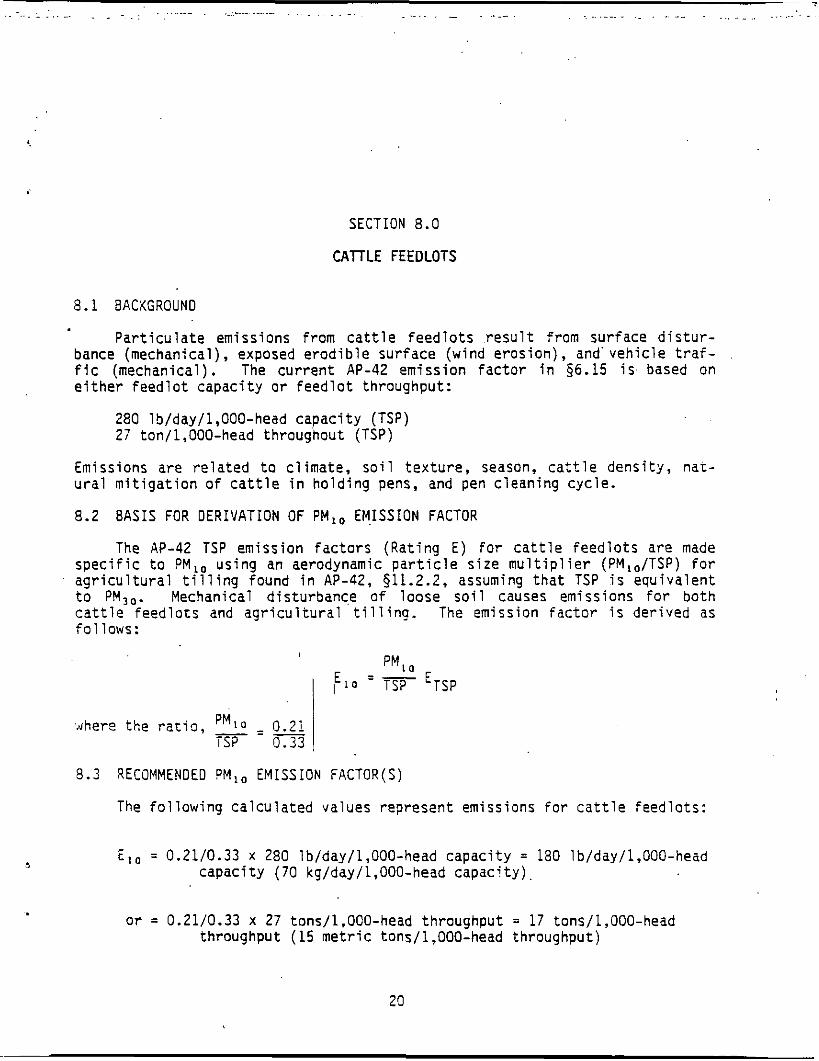
P a r t i c u l a t e emissions f rom c a t t l e f e e d l o t s r e s u l t f rom sur face d i s t u r - bance (mechanical) , exposed e r o d i b l e su r face (wind eros ion) , and' v e h i c l e t r a f - f i c (mechanical) . The c u r r e n t AP-42 emiss ion f a c t o r i n 86.15 i s based on e i t h e r f e e d l o t c a p a c i t y or f e e d l o t throughput :
280 lb/day/l,OOO-head c a p a c i t y (TSP) 27 ton/l,OOO-head throughout (TSP)
Emissions are r e l a t e d t o c l ima te , s o i l t e x t u r e , season, c a t t l e dens i t y , naL- u r a l m i t i g a t i o n o f c a t t l e i n h o l d i n g pens, and pen c lean ing cyc le .
8.2 B A S I S FOR OERIVATION OF PM,, E M I S S I O N FACTOR
The AP-42 TSP emiss ion f a c t o r s (Ra t ing E) for c a t t l e f e e d l o t s a re made s p e c i f i c t o OM,, us ing an aerodynamic p a r t i c l e s i z e m u l t i p l i e r (PM,,/TSP) for a g r i c u l t u r a l t i l l i n g found i n AP-42, 511.2.2, assuming t h a t TSP i s equ iva len t t o PM,,. Mechanical d i s tu rbance o f loose s o i l causes emissions f o r b o t h c a t t l e f e e d l o t s and a g r i c u l c u r a l t i l l i n g . The emission f a c t o r i s de r i ved as fo l l ows :
PM,, I = - TSP ETSP
,Ahere the r a t i o , 5 = 0.21 TSP 0.33
8.3 RECOMMENOEO PM,, E M I S S I O N FACTOR(S)
The f o l l o w i n g c a l c u l a t e d va lues rep resen t emissions f o r c a t t l e feed lo ts :
E,, = 0.21/0.33 x 280 lb/day/l,OOO-head c a p a c i t y = 180 lb/day/l,OOO-head capac i t y ( 7 0 kg/day/l,OOO-head c a p a c i t y ) .
or = 0.21/0.33 x 27 tons/l.OOO-head throughput = 17 tons/l,OOO-head throughput ( 1 5 m e t r i c tons/l,OOO-head throughput)
20
~~~~~ ~~~ ~ ~~~
... . . . ........... ... . . . . . . . . . . . . . . . . . ...,.. . . . . . . . . -~ .... .. . . . . . . , .
8.4 ASSUMPTIONS AN0 CAVEATS
Suspended particulate from cattle feedlots is assumed to be of' same particle size distribution as from "generic" agricultural so i l with 18 percent silt fraction. In addition, TSP is assumed to Le equivalent to PM,,. Emissions are related to climate and natural mitigation of cattle and cattle density.
8.5 REFERENCE DOCUMENTS
. AP-42, 96.15 and 911.2.2.
Cuscino, T. A., Jr., et al., The Role of Agricultural Practices in Fugitive D u s t Emissions, California Air Resources Board, Sacramento, C A , June 1981.
Peters, J. A.; and T. R. Blackwood, Source Assessment: Beef Cat t le Feedlots, EPA-600/2-77-107, U.S. Environmental Protection Agency, Research Triangle Park, NC, June 1977.

- 7 . . . . . . . . . . . . . . . . . . . . . . .. ... ... . . . . . . . . . . . ........ .. . . - ......... . . . . . . -- - . . - . - -.
SECTION 9.0
CONSTRUCTION SITE PREPARATION
9.1 BACKGROUNO
The current] AP-42 emission factor (related to particles < 30 pmS) is 1.2 tons/acre/month for'an entire construction site. However, three different source activities usually comprise construction site preparation: topsoil re- moval (generally with scrapers), earthmoving (cut and fill operations), and truck haulage. These are represented separately in the sections below to produce estimated PM,, emission factors for each activity.
The most applicable reference document (Kinsey, 1983) indicates that the ambient PM,, concentration (C) downwind o f road construction activity is related to surface silt content. ( s ) , traffic density (Td), and surface moisture (M) by:
C = 60 ( 5 ) 0 . 8 8 x (Td)le0* x (M)-0-40
at a downwind dist'ance of 50 m. be related to similar parameters.
9 . 2
Therefore, PM,, emission factors should also
BASIS FOR DERIVATION OF PM,, EMISSION FACTORS
The PM,, eyission factors were determined from TSP emission factors (back-calculated usin'g dispersion modeling) and an average PW,,/TS? racio measured in the field.
4 . 2 . 1 i'lessurod Emission Factor5 f o r Cons t ruc t i on S i t e Premracion
The data in Table 8 were presented by J . 5. Kinsey et a!. in Study of
Three different construction activities were tested and are separated
Construction Related Dust Control.
below by run number:
Run Nos. AH-1 and AH-2 = Topsoil removal
Run Nos. AH-4, AH-5, AH-7, and AH-10 = Earthmoving (cut and fill)
Run Nos. AH-11 and AH-12 = Aggregate hauling (on dirt)
.I
22
. . . . . - .... .. . . ... ... . . ... .i . . -. . ;.- ... . . . . ... ...... -. -. ..... - . . . . . .. . . . ~ ~~~~~~
.~ . - . -. _. -.
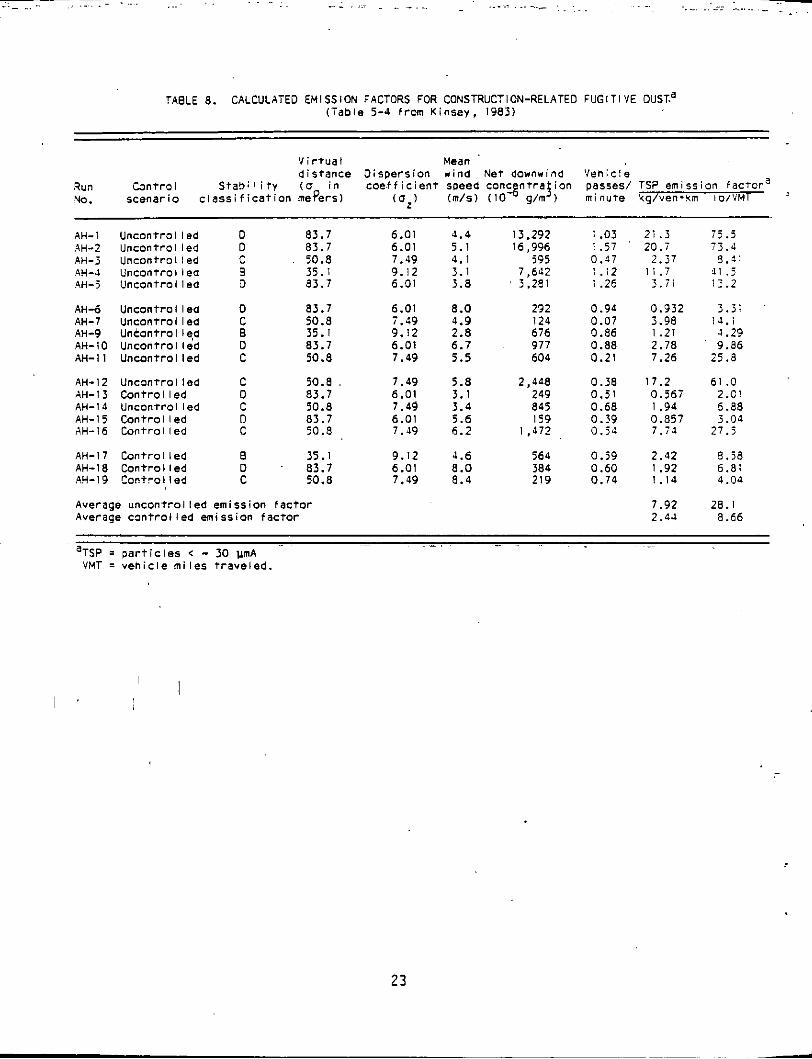
?ABLE 8. CALCULATED EMISSION FACTORS FOR CONSTRUCTION-RELATED FUGITIVE OUST.' (Tab le 5-4 from Kinsey, 1983)
V i r t u a l Mean d i s t a n c e D i s p e r s i o n wind Net downwind 'Vehicle
StaS;I i t y (0 i n c o e f f i c i e n t seeed conc n t r a ion passes/ TSP emission f a c t o r a % f Run Contro I NO. scenar io c~ ass i f i c a t ion mefers) (aL) (m/s) (10- g/m ) minute kg/ven-%m lo/VMT
AH-I U n c o n t r o l l e d D 83.7 6.01 6 .4 13,292 1.03 21.3 i j . 5 .AH-2 Uncontro I I ed D 83.7 6.01 5.1 16.996 1.57 ' 20.7 7 3 . J . ~~ ~ ~~
AH-3 Uncontro l led C 50.8 7.49 4.1 595 0.47 2.37 8.*1 A.H-4 Uncontro l lee 8 35.1 9 . i 2 3.1 7.642 1 . ; 2 11.7 4 I . j AH-5 U n c o n t r o l l e d D 83.7 6.01 3.8 3.281 I .26 3.71 13.2
AH-6 U n c o n t r o l l e d D 83.7 6.01 8.0 232 0.94 0.932 3.5; . . . . AH-7 U n c o n t r o l l e d C 50.8 i .49 4.9 124 0.07 3.98 14.i
AH-IO U n c o n t r o l l e d D 83.7 6.01 6.7 977 0.88 2.78 9.86 AH-II U n c o n t r o l l e d C 50.8 7.49 5.5 604 0.21 7.26 25.8
AH-I2 U n c o n t r o l l e d C 50.8 7.49 5.8 2,448 0.38 17.2 61 .O AH-I3 C a n t r o i l e d D 83.7 6.01 3.1 249 0.51 0.567 2.CI AH-I4 UnconTro l led C 50.8 7.49 3.4 845 0.68 I .94 6.88 AH-I5 C o n t r o l l e d D 83.7 6.01 5.6 I59 0.39 0.857 3.04
AH-9 UnkOntrOl le,4 B 35.1 9.12 2.8 676 0.86 I .21 1.29
AH-I6 C o n t r o l l e d C 50.8 7.49 6.2 1.472 , a . 5 4 7 . i l 27.5
AH-I7 C a n t r o l l e d 0 35.1 9.12 4.6 564 0.59 2.42 8.58 AH-18 C o n t r o l l e d D 83.7 6.01 8.0 384 0.60 1.92 6.81 .AH-19 Cont ro l le4 C 50.8 7.49 8.4 219 0.74 1.14 4.04
Average u n c o n t r o l l e d emiss ion f a c t o r Average c ? n t r o l l e d emission f a c t o r
7.92 28. I 2.45 8.66
. . . . ~~~ ~~ ~~
aTSP = p a r t i c l e s < - 30 ymA VMT = v e h i c l e m i l e s t r a v e l e d .
I ' i
2 3
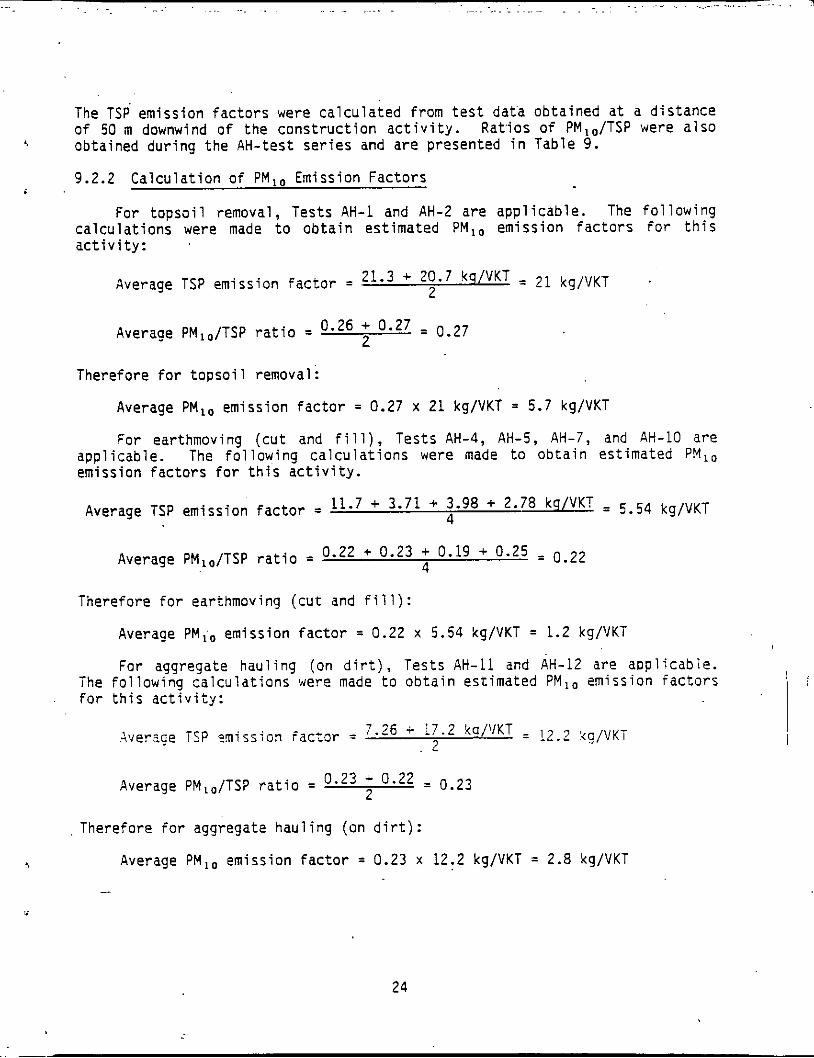
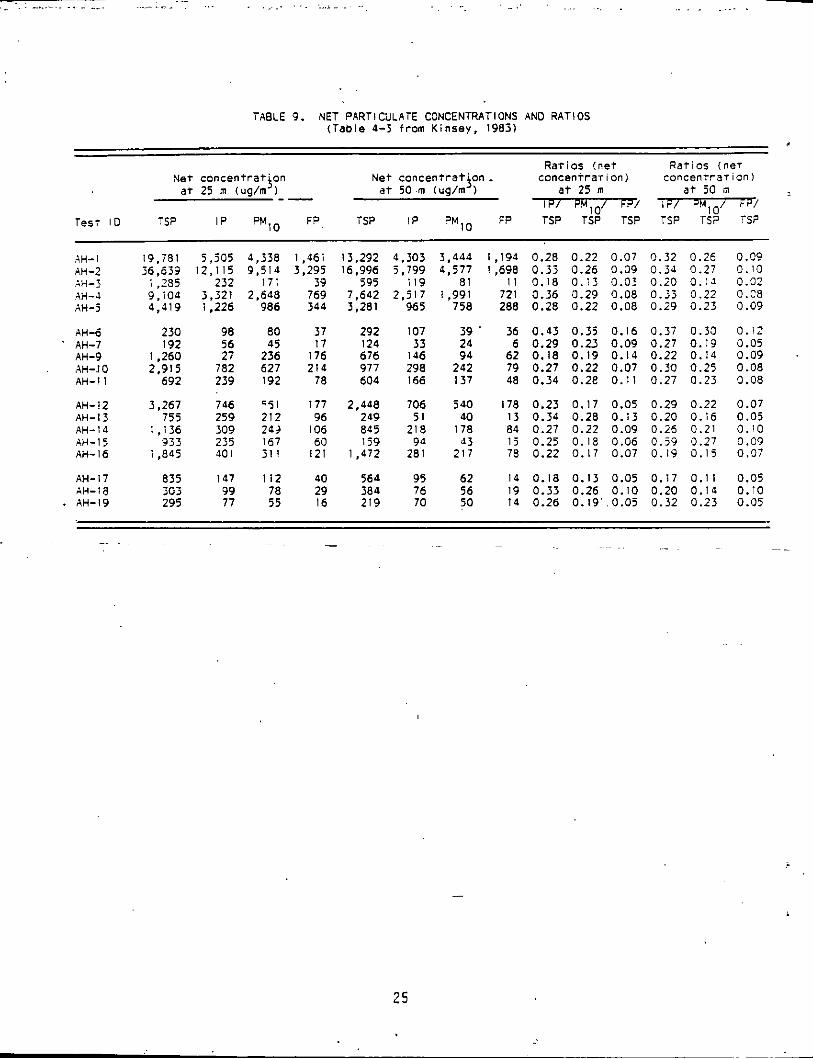
The TSP emission f a c t o r s were c a l c u l a t e d from t e s t da ta ob ta ined a t a d i s t a n c e o f 50 m downwind o f the c o n s t r u c t i o n a c t i v i t y . Ra t ios o f PM,,/TSP were a l s o obta ined du r ing t h e AH-test s e r i e s and a r e presented i n Table 9. 6.
9.2.2 C a l c u l a t i o n o f PM,, Emission Fac to rs i
F o r t o p s o i l removal, Tests AH-1 and AH-2 are app l i cab le . The f o l l o w i n g c a l c u l a t i o n s were made t o o b t a i n es t imated PM,, emiss ion f a c t o r s f o r t h i s a c t i v i t y :
21.3 + 20.7 kq/VKT = 2 1 k9/VKT 2 Average TSP emission f a c t o r =
0.26 + 0.27 = 0.27 2 Average PM,,/TSP r a t i o =
Therefore f o r t o p s o i l removal:
Average PM,, emission f a c t o r = 0.27 x 21 kg/VKT = 5.7 kg/VKT
For earthmoving ( c u t and f i l l ) , Tes ts AH-4, AH-5, AH-7, and AH-10 are app l i cab le . The f o l l o w i n g c a l c u l a t i o n s were made t o o b t a i n es t imated PM,, emission f a c t o r s f o r t h i s a c t i v i t y .
11.7 + 3.71 + 3.98 + 2.78 kq/VKT = 5.54 k9/VKT 4 Average TSP emission f a c t o r =
0.22 + 0.23 + 0.19 + 0.25 = 0.22 4 Average PM,,/TSP r a t i o =
Therefore f o r earthmoving ( c u t and f i l l ) :
Average PM,, emiss ion f a c t o r = 0.22 x 5.54 kg/VKT = 1.2 kg/VKT
F o r aggregate hau l i ng (on d i r t ) , Tes ts AH-11 and AH-12 are a p p l i c a b l e . The f o l l o w i n g c a l c u l a t i o n s were made t o o b t a i n est imated PM,, emission f a c t o r s f o r t h i s a c t i v i t y :
- . .. . . . . . . . . . .~ .. . . . . . . . . ~ ~ . . .. . . . ... ~. . . . . ~.~ ... . . .. . . . . . . .-
I
7.26 t !7.2 ka/\/KT = !2.2 2 Averaqe TSP :mission f a c t o r =
0.23 + 0.22 = 0.23 2 Average PM,,/TSP r a t i o =
Therefore f o r aggregate h a u l i n g (on d i r t ) :
.r Average PM,, emission f a c t o r = 0.23 x 12.2 kg/VKT = 2.8 kg/VKT
24
~~ ~
.. . . .~... . . . . . .. . . . .. . . - . . ... . ..~.. . . . -. . ._ _ _ . . . . . . -.... ~~~. .. .. __
TABLE 9. NET PARTICULATE CONCENTRATIONS AN0 RATIOS (Table 4-3 from Kinsey, 1983)
R a t i o s ( n e t Ra t ios ( n e t Ne t concen t ra t ' on Ne t c o n c e n t r a t j o n ~ concenr ra r ion ) c o n c e n t r a r i o n )
a t 50 m ( u g h ) a t 25 m a t 50 iil IP/ P M." / F? / i P / ?M .J w -- f a t 25 m ( u g h )
Test I O TSP IP W10 FP TSP IP PMIO FP TSP T ~ F TSP TSP r G TSP
.AH-l 19.781 4H-2 X i 6 3 9 A H - 5 1.285 AH-4 9. i04 AH-5 4,419
AH-6 230 ' AH-7 I 9 2
AH-9 1,260 AH-.IO 2,915 AH-I I 692
AH-!2 3,267 AH-13 755 AH-14 1.136 A.H-15 933 AH- I6 1,845
AH- I 7 835 ;+:a 303 . AH-19 295
5,?05 4,338 12,115 9,514
232 171 _._ 3,321 2.648 1,226 986
98 80 5 6 45
746 <51 259 2 i 2 309 243 235 167 401 3 1 1
147 I12 99 78 77 55
I ,46i 3,295
39 769 344
37 17
I76 214
78
177 96
IO6 60
I21
40 29 16
13,292 4,303 16.996 5.799
3,444 1,194 0.28 0.22 4.577 1.698 0.33 0.26
81 I1 0.18 0.15 595 119 ~. ~ ~~ ~
7,642 2,517 1,991 721 0.36 0.29 3,281 965 758 288 0.28 0.22
292 107 I 2 4 33 676 146 977 298 604 166
2,448 706 249 5 1 845 218 159 94
1,472 281
3 9 ' 36 0.43 0.35 24 6 0.29 0.23 94 62 0.18 0.19
242 79 0.27 0.22 I 3 7 48 0.34 o.2e
540 178 0.23 0.17 40 1 3 0.54 0.28
I 7 8 84 0.27 0.22 53 I5 0.25 0.18
217 78 0.22 0.17
564 95 62 14 0.18 0.13 384 76 56 I 9 0.33 0.26 219 70 50 1 4 0.26 0.19'
0.07 0.09 0.03 0.08 0.08
0.16 0.09 0.14 0.07 0.11
0.05 0.13 0.09 0.06 0.07
0.05 0. I O .0.05
0.32 0.26 0.09 0.35 0.27 0.10 0.20 0.:4 0.02 0 . j 3 0.22 0.C8 0.29 0.23 0.09
0.37 0.30 0.12 0.27 0.19 0.05 0.22 0.14 0.09 0.30 0.25 0.08 0.27 0.23 0.08
0.29 0.22 0.07 0.20 0.16 0.05 0.X 0.21 0.10 0.59 0.27 0.09 0.19 0.15 0.07
0.17 0.11 0.05 0.20 0.14 0.10 0.32 0.23 0.05
25
. . . . . . . . . ~~ . . . . . . . . . . . . . . . . . . . . . . . . . . .. . . . . . . . . . . . . . . . .~ . . . . . . . . . . . - -
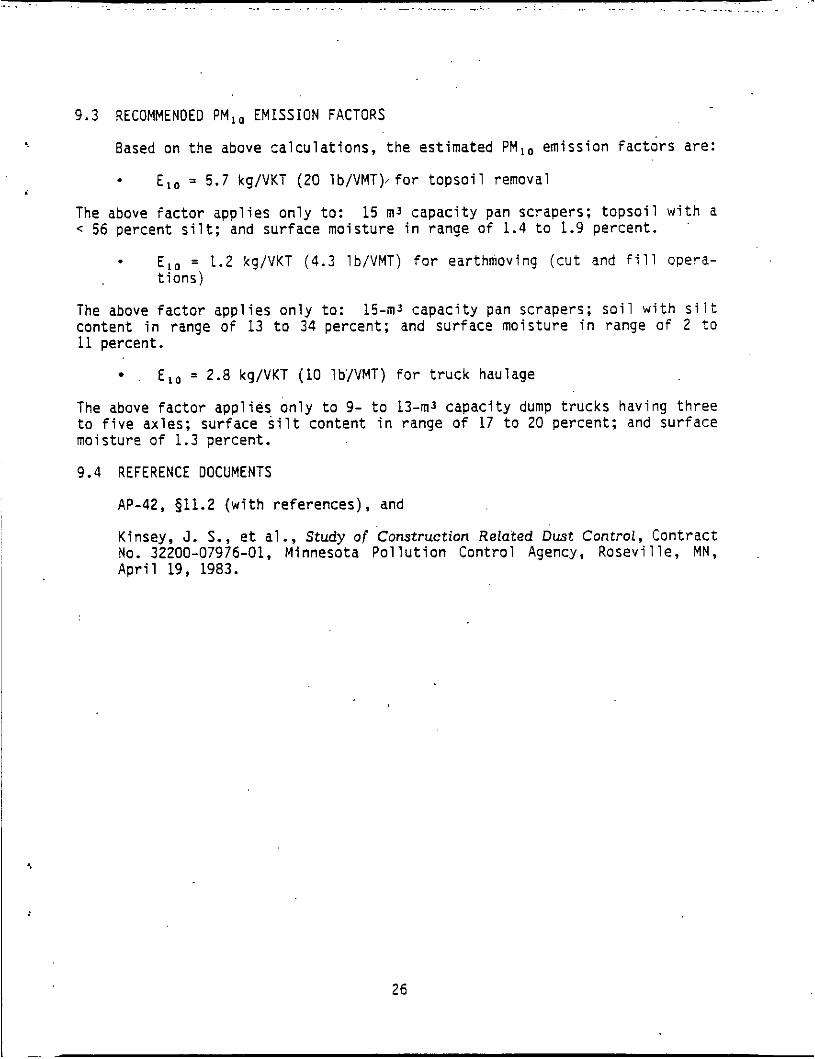
9.3 RECOMMENDED PM,, EMISSION FACTORS
Based on t h e above c a l c u l a t i o n s , t h e est imated PM,, emiss ion f a c t o r s are:
* E,, = 5.7 kg/VKT (20 lb/VMT),for t o p s o i l removal 2
The above f a c t o r a p p l i e s o n l y to : < 56 percent s i l t ; and sur face mois tu re i n range o f 1.4 t o 1.9 percent .
15 m3 c a p a c i t y pan scrapers; t o p s o i l w i t h a
E,, = 1.2 kg/VKT (4.3 lb/VMT) f o r earthmoving ( c u t and f i l l opera- t i o n s )
The above f a c t o r a p p l i e s o n l y t o : 1 5 - m 3 c a p a c i t y pan scrapers; s o i l w i t h s i l t content i n range o f 13 t o 34 percent ; and sur face mois tu re i n range o f 2 t o 11 percent.
'
, E,, = 2.8 kg/VKT (10 lb/VMT) f o r t r u c k haulage
The above f a c t o r a p p l i e s o n l y t o 9- t o 13-1113 c a p a c i t y dump t r u c k s having t h r e e t o f i v e axles; sur face s i l t con ten t i n range o f 17 t o 20 percent ; and surface mois ture o f 1.3 percent.
9.4 REFERENCE DOCUMENTS
AP-42, 911.2 ( w i t h re fe rences) , and
Kinsey, J . S., e t al. , Study of 'Construction Related Dust Control, Cont rac t No. 32200-07976-01, Minnesota P o l l u t i o n Cont ro l Agency, R o s e v i l l e , MN, A p r i l 19, 1983.
26
.. ~ ... . - . . __ . - - . ... . . .. .I - . - . .. . -- -
SECTION 10.0
DEMOLITION OF STRUCTURES
10.1 BACKGROUND
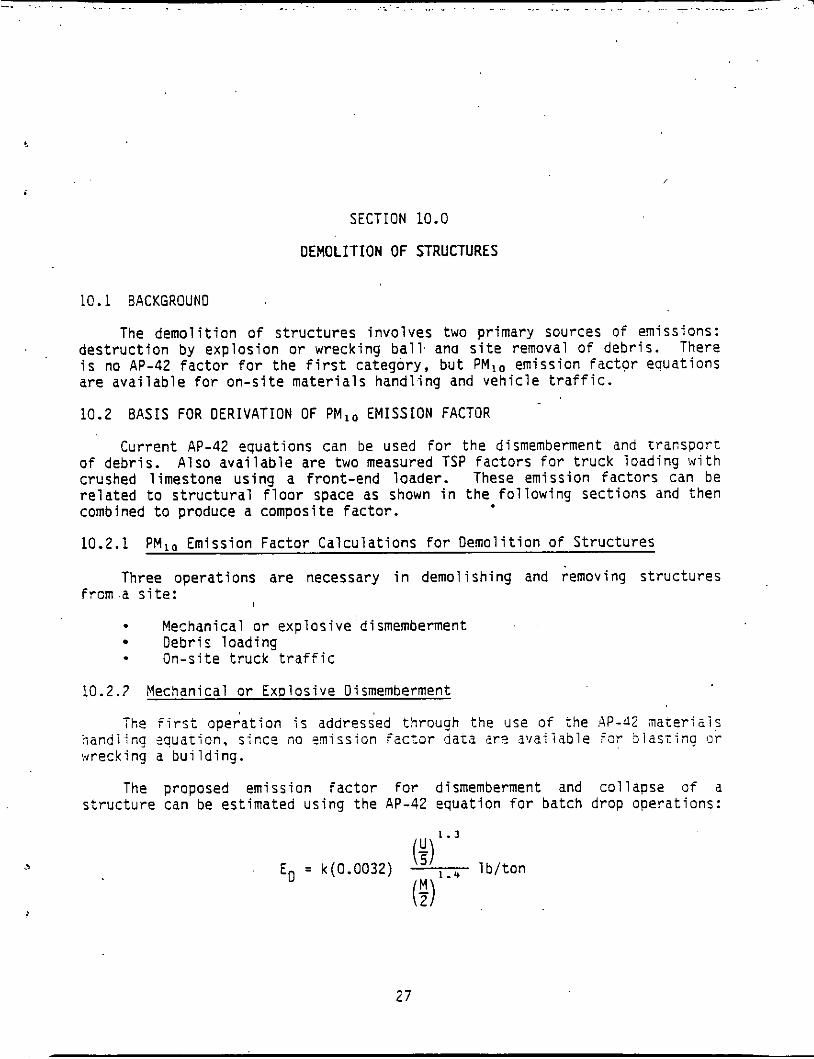
The demolition of structures involves two primary sources of emissions: destruction by explosion or wrecking ball, and site removal of debris. There is no AP-42 factor for the first category, but PMl0 emission factor equations are available for on-site materials handling and vehicle traffic.
10.2 BASIS FOR DERIVATION OF PMlo EMISSION FACTOR
Current AP-42 equations can be used for the dismemberment and transport of debris. Also available are two measured TSP factors for truck loading with crushed limestone using a front-end loader. These emission factors can be related to structural floor space as shown in the following sections and then combined to produce a composite factor.
10.2.1 PMl0 Emission Factor Calculations for Demolition of Structures
Three operations are necessary in demo1 ishing and ;emoving structures
- Mechanical or explosive 'dismemberment Debris loading
frcm.a site: I
On-site truck traffic
10.2.7 Mechanical or Explosive Dismemberment
The first operation i s addressed through the use of the AP-d2 maceri6is :handling squarion, since no emission factor d a m ?re available for biasTina fir :urecking a building.
The proposed emission factor for dismemberment and collapse of a structure can be estimated using the AP-42 equation for batch drop operations:
27
. . ~~ ~~
” ... . . . .. . ~ ... . . . .. .. ... .~~.. . ... . - . .. . . - . ~. . . . . -. . --
where k = 0.35 f o r PMlo U = mean wind speed ( d e f a u l t = 5 mph) M = m a t e r i a l mo is tu re conten t ( D e f a u l t = 2%)
and
Th is f a c t o r can be m o d i f i e d f o r waste tonnage r e l a t e d t o s t r u c t u r a l f l o o r space. The f o l l o w i n g r e l a t i o n s h i p s were determined f rom a 1976 a n a l y s i s by Murphy and C h a t t e r j e e o f t h e d e m o l i t i o n o f 12 commercial b r i c k , concrete, and s t e e l b u i l d i n g s :
Eo = 0.0011 l b / t o n ( w i t h d e f a u l t parameters)
1 f t z f l o o r space = 10 f t 3 o r i g i n a l b u i l d i n g volume 1 f t 3 b u i l d i n g voldme = 0.25 f t 3 waste volume 1 yd3 b u i l d i n g waste = 0.5 t o n we igh t Mean t r u c k capacity = 30 yd3 haulage volume
From these data, 1 f t 2 o f f l o o r space represents 0.046 t o n o f waste mate- r i a l , and a r e v i s e d emiss ion f a c t o r r e l a t e d t o s t r u c t u r a l f l o o r space can be o b t a i ned :
G.046 t o n ED = 0.0011 l b / t o n . = 0.000051 l b / f t 2
f t2
,10.2.3 Debr is Loading
The proposed emiss ion f a c t o r f o r d e b r i s l o a d i n g i s based on two t e s t s of t h e f i l l - i n g o f t r u c k s wi th crushed l imestone u s ~ i n g a f r o n t - e n d loader; p a r t o f t h e t e s t bas i s f o r t h e ba tch drop equa t ion i n AP-42, 511.2.3. Crushed l imestone was considered c l o s e s t i n compos i t ion t o t h e brcken b r i c k , and p l a s t e r found i n demolished commercial b u i l d i n g s . The measured emiss ion f a c t o r s f o r crushed l imestone were 0.053 and 0.063 l b / t o n TSP. To conver t ’Lhe average TSP f a c t o r , 0.058 lb / ton , t o a PM,o f a c t o r w i t h source extent o f s t r u c t u r a l f l o o r space, t h e p r e v i o u s l y determined es t ima te o f 0 . 0 4 ton!ftZ and a p a r t i c l e s i z e m u l t i p l i e r must be used. The r e s u l t i s the emission f a c t o r f o r d e b r i s load ing :
0.046 t o n C i 2
EL = k(0.058) l b / t o n . I 1-
= 0.00093 l b / f t *
where k = 0.35 i s taken f rom the new recommended p a r t i c l e s i z e m u l t i p l i e r s developed by Mulesk i (1987).
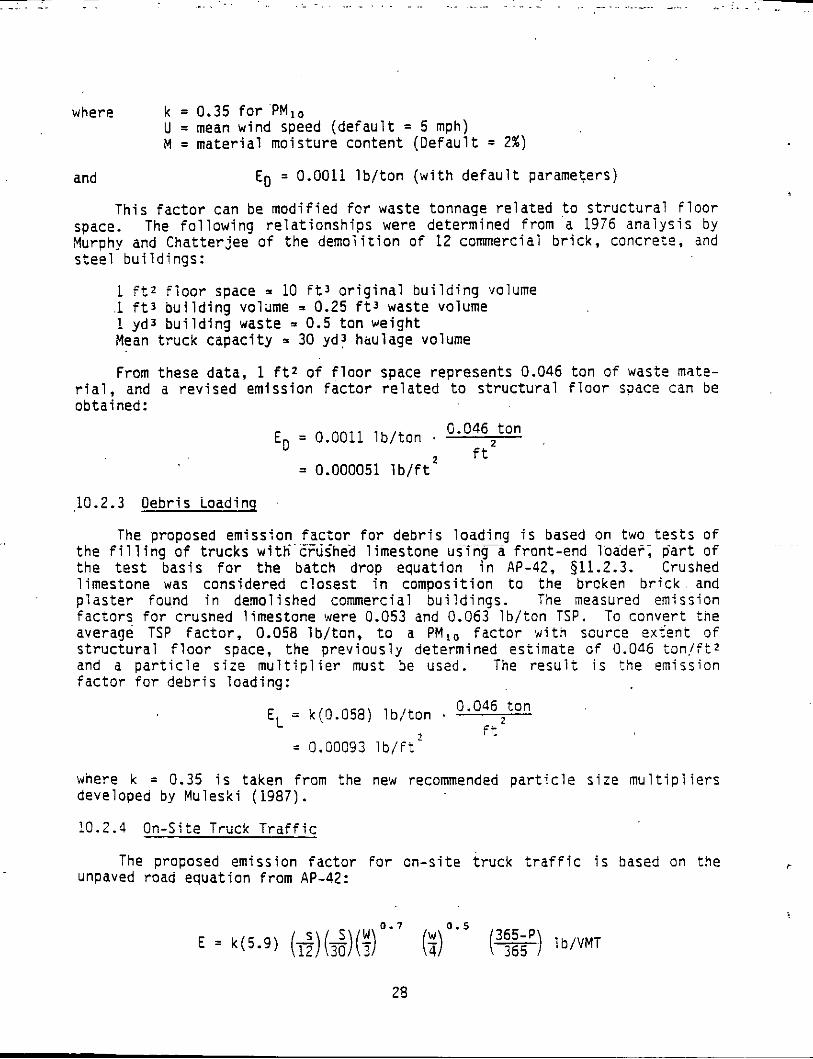
LO.Z.4 On-Si te Truck T r a f f i c
The proposed emiss ion f a c t o r f o r c n - s i t e t r u c k t r a f f i c i s based on t h e unpaved road equa t ion f rom AP-42:
c
28
...... . . . . . . . . ., .. . . . . . . . . . . . . . . . . . . . . . . . . . .- . . . . . . . . . . . . . . . . . . . . . . . ...... :__* .... < . . . . . . . . . . ..... - - ...
. where k = b.36 for PM,,
s = silt content (default.= 12%) S = truck speed (default = 10 mph) W = truck weight (default = 22 tons) w = truck wheels (default = 10 wheels) p = number of days with precipitation (default = 0 days)
For a demolition site, 10-wheel trucks o f mean 22-ton gross ,$eight are estimated to travel 1/4 mile on-site for each round trip to remove dry debris. Uith this information and default values for the unpaved road equation, the proposed emission factor for on-site truck traffic becomes:
0 . 7 0 . 5
ET = (0;36)(5*9) (fT)(w)(T) 12 10 22 (q) (x) 365-0 lb/VMT = 4.5 lb/VMT
To convert this emission factor from lb/VMT to lb/ft2 o f structural floo; space, it is necessary to use the previously described relationships obtained from a study by Murphy and Chatterjee.
3 2
3 - 2 30 yd waste 4 yd volume yd floor space 9 ft
yd waste lo yd3 . % = 0.0023 mi/ftz 0.25 mi 3
and ET = 4.5 lb/VMT x 0.0023 mi/ft2
10.3 RECOMMENOEO PMlo EMISSION FACTOR
= 0.010 lb/ft*
The combined emission factor for building demolition, debris loading, and truck traffic is thus:
= 0.000051 + 0.00093 + 0.010 lb/ft2 I
= 56-g /mz (0.011 lb/ft2) ' o f 'bemolished floor area
: L i s 2asily seen that enrissions from on-site trluck traffic cmsc i tuce :he overwhelming portion of PM,, emissions from builoing demolition ana removai.
10.4 REFERENCE DOCUMENTS
7 6 .
AP-42,' 911.2 (with associated references), and
Muleski, G., C. Cowherd, Jr., and P. Englehart, Update of Fugitive Dust Emission Factors in AP-42 Section 11.2, Final Report prepared by Midwest Research Institute for U.S. Environmental Protection Agency, EPA Contract No. 68-02-3891, Assignment No. 19, July 14, 1987.
29
~ ~~
. . . . . . . . . -
.. . . .. . . -. ..._...... . . .~~ ... . .. . . . . . ~ ~ . ~ .. .
Murphy, K. S., and 5. Chatterjee, Development of Predictive Criteria f o r Demolition and Construction Solid Waste Management, Final Report prepared
. by Battelle Columbus Laboratories for the U.S. Army Corps o f Engineers, NTIS AD A 033646, October 1976.
!
i
30
~~ ~ ~~ ~ ~~~ ~~ ~~~ .. ...... . . . . . . . . . . . . . . . . . . . . . . . . . . . . . .................. . . . . . . . .. ~~ . . : .~ .. . . . . . . . . . . . . - ... I - .. . . - - :, : . .
SECTION 11.0
OFF-HIGHWAY VEHICLE TRAVEL
11.1 BACKGROUNO
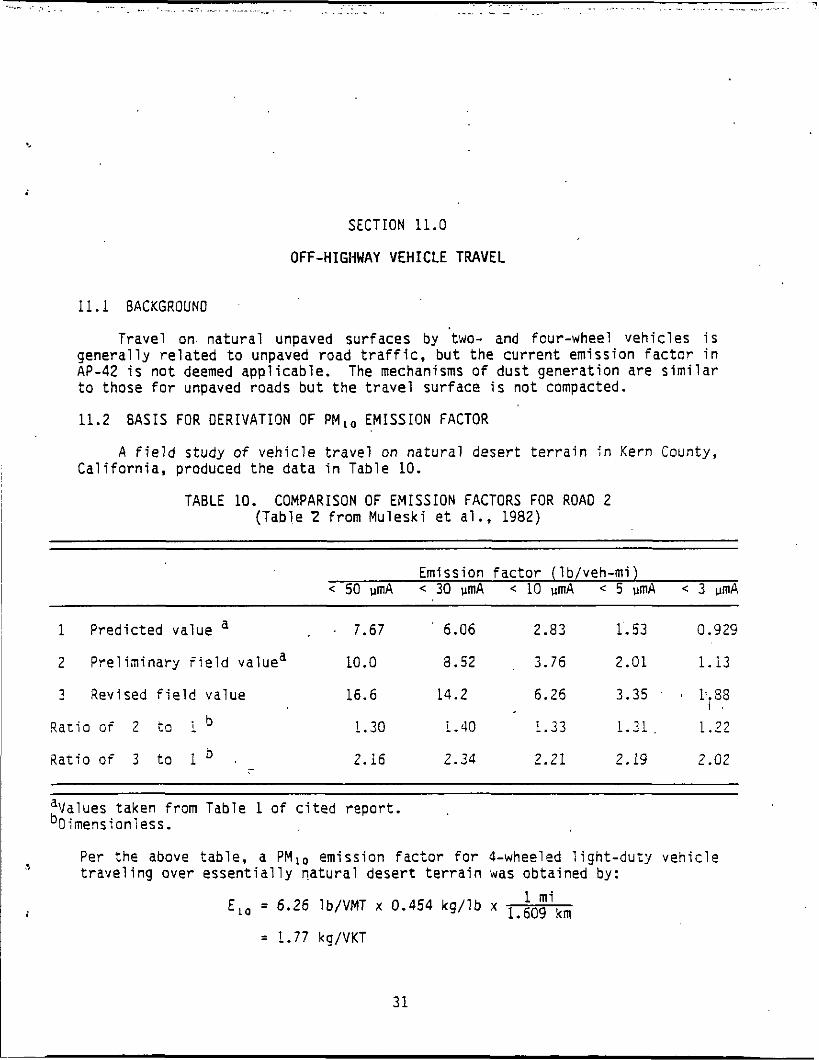
Travel on natural unpaved surfaces by 'two- and four-wheel vehicles is generally related to unpaved road traffic, but the current emission factor in AP-42 is not deemed applicable. The mechanisms o f dust generation are similar to those f o r unpaved roads but the travel surface i s not compacted.
11.2 GASIS FOR DERIVATION OF PM,,, EMISSION FACTOR
A field study of vehicle travel on natural desert terrain in Kern County, California, produced the data in Table 10.
(Table 2 f rom Muleski et al., 1982) TABLE 10. COMPARISON OF EMISSION FACTORS FOR ROAD 2
a
Emission factor (lb/veh-mi) < 50 umA < 30 umA < 10 umA < 5 umA < 3 umA
1 Predicted value a . . 7.67 6.06 2.83 1.53 0.929
2 Preliminary field value' 10.0 8.52 3.76 2.01 1.13
3.35 ' b.38 3 Revised field value 16.6 14.2 6.26
1.30 1-40 1.33 1.31 1.22 I
. b tario o f 2 t o i
Ratio o f 3 to I ' . - 2.16 2.34 2.21 2.19 2.02
'Values taken from Table 1 o f cited report. "0 i mens i on 1 es s .
Per the above table, a PMlo emission factor for 4-wheeled light-duty vehicle traveling over essentially natural desert terrain was obtained by:
1 mi E,,, = 6.26 lb/VMT x 0.454 kg/lb x km = 1.77 kg/VKT
. . . . ~~~~ ~~ ~
. . . . . . . . . . . . . . . . .... .,_ . . . . . . . . . . . ~ . . . . . . . . . . . . . . - ... - . . .. ,. .~ . .
~~ ~~ ..
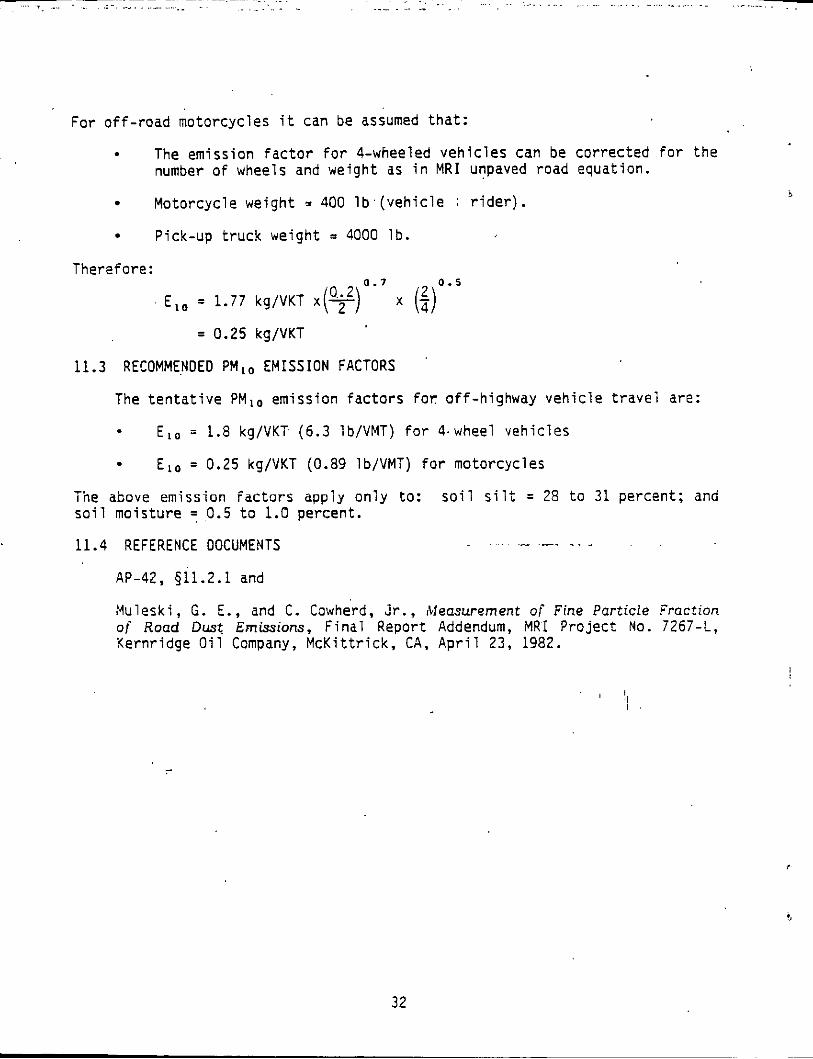
For off-road motorcycles it can be assumed that:
- The emission factor for 4-wheeled vehicles can be corrected for the
Motorcycle weight = 400 lb.(vehicle ~ rider).
number of wheels and weight as in M R I unpaved road equation.
Therefore:
Pick-up truck weight = 4000 lb.
0 . 7 0 . 5
E,, = 1.77 kg/VKT x(?) x ($) = 0.25 kg/VKT
11.3 RECOMMENDED PM,, EMISSION FACTORS
The tentative PM,, emission factors f o r off-highway vehicle travel are:
- E I o = 1.8 kg/VKI (6.3 lb/VMT) for 4.wheel vehicles
. E l o = 0.25 kg/VKT (0.89 lb/VMT) for motorcycles
Tire above emission factors apply only to: soil silt = 28 to 3 1 percent; and soil moisture = 0.5 to 1.0 percent. 11.4 REFERENCE OOCUMENTS-~~~ = = ~ ~~ ~~
~~ ~~~
AP-42, 511.2.1 and
Muleski, G. E., and C. Cowherd, Jr., Measurement O F Fine Particle Fraction of Road Dus t Emissions, Final Report Addendum, MRI Project No. 7267-L, Kernridge Oil Company, McKittrick, CA, April 23, 1982.
32
1 ~~~ ~ ~~~
- . .. . . . . .. . . -. . .~. ~. . .. . .. .. . .: ... . . . .. . . .. ___ . . . . .. .. . .. .. . . . . . . .. ,. .. -
f
SECTION 12.0
MUNICIPAL SOLID UASTE LANDFILLS
12.1 BACKGROUNO
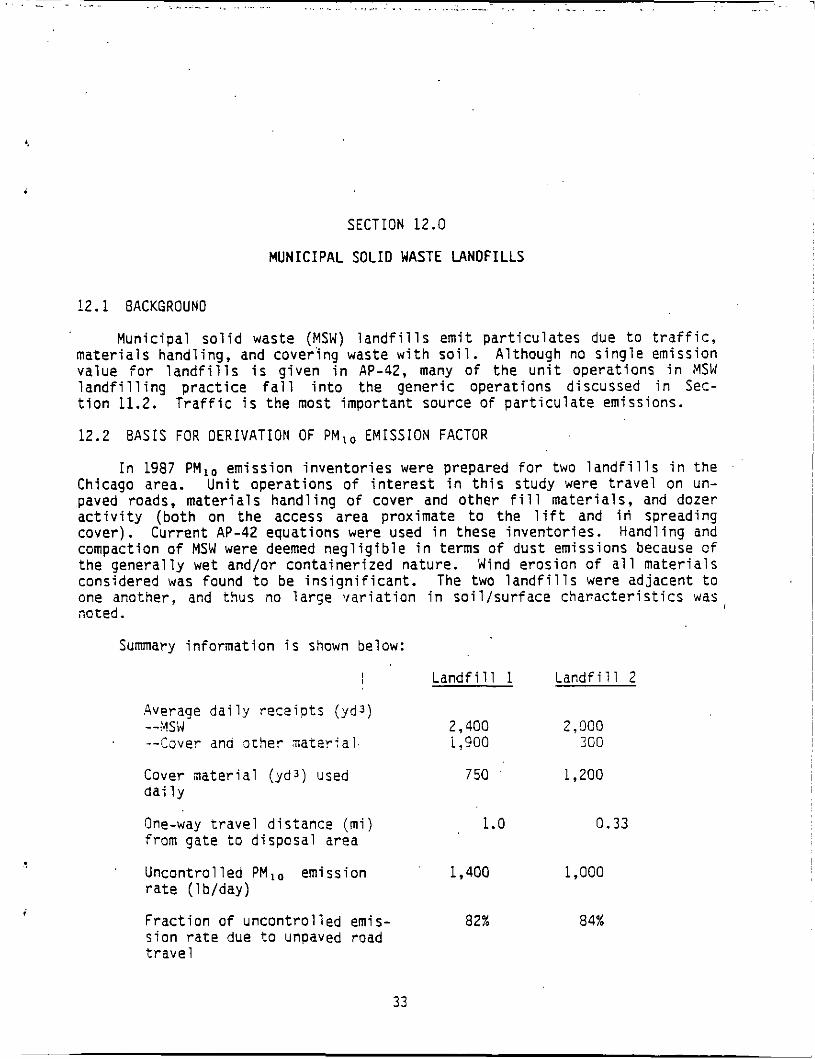
Mun ic ipa l s o l i d waste (MSW) l a n d f i l l s e m i t p a r t i c u l a t e s due t o t r a f f i c , m a t e r i a l s handl ing, and cover ing waste w i t h s o i l . Al though no s i n g l e emiss ion va lue f o r l a n d f i l l s i s g i v e n i n AP-42, many o f t h e u n i t ope ra t i ons i n MSW l a n d f i l l i n g p r a c t i c e f a l l i n t o t h e gener i c opera t ions d iscussed i n Sec- t i o n 11.2.
12.2
T r a f f i c i s t h e most impor tan t source o f p a r t i c u l a t e emissions.
B A S I S FOR D E R I V A T I O N OF PM,, E M I S S I O N FACTOR
I n 1987 PMlo emiss ion i n v e n t o r i e s were prepared f o r two l a n d f i l l s i n t h e Chicago area. Unit ope ra t i ons o f i n t e r e s t i n t h i s s tudy were t r a v e l on un- paved roads, m a t e r i a l s hand l ing o f cover and o t h e r f i l l ma te r ia l s , and dozer a c t i v i t y (bo th on t h e access area prox imate t o t h e l i f t and i n spreading cover ) . Cur ren t AP-42 equat ions were used i n these i n v e n t o r i e s . Handl ing and compaction o f MSW were deemed n e g l i g i b l e i n terms o f dus t emissions because of t h e g e n e r a l l y wet and/or c o n t a i n e r i z e d nature. Wind e ros ion o f a l l m a t e r i a l s considered was found t o be i n s i g n i f i c a n t . The two l a n d f i l l s were ad jacent t o ane another, and thus no l a r g e v a r i a t i o n i n s o i l / s u r f a c e c h a r a c t e r i s t i c s was noted.
Summary i n f o r m a t i o n i s shown below:
I L a n d f i l l 1 L a n d f i l l 2
.4verage d a i l y r e c e i p t s (yd3) --1ISW 2,400 2,000 - - i s v e r and a t h e r n a x e r i a l . i,900 200
Cover m a t e r i a l (yd3) used d a i l y
7 50 1,200
One-way t r a v e l d i s tance (mi) 1.0 0.33 from gate t o d i sposa l area
r a t e (1 b/day)
s i o n r a t e due t o unpaved road t r a v e l
Uncon t ro l l ed PM,, emission 1,400 1,000
F r a c t i o n o f u n c o n t r o l l e d emis- 82% a4%
33
.. . - . . . .... . .~...... . . . . . . _ _ . - . .. . . . ~ ~. .. . ... ....
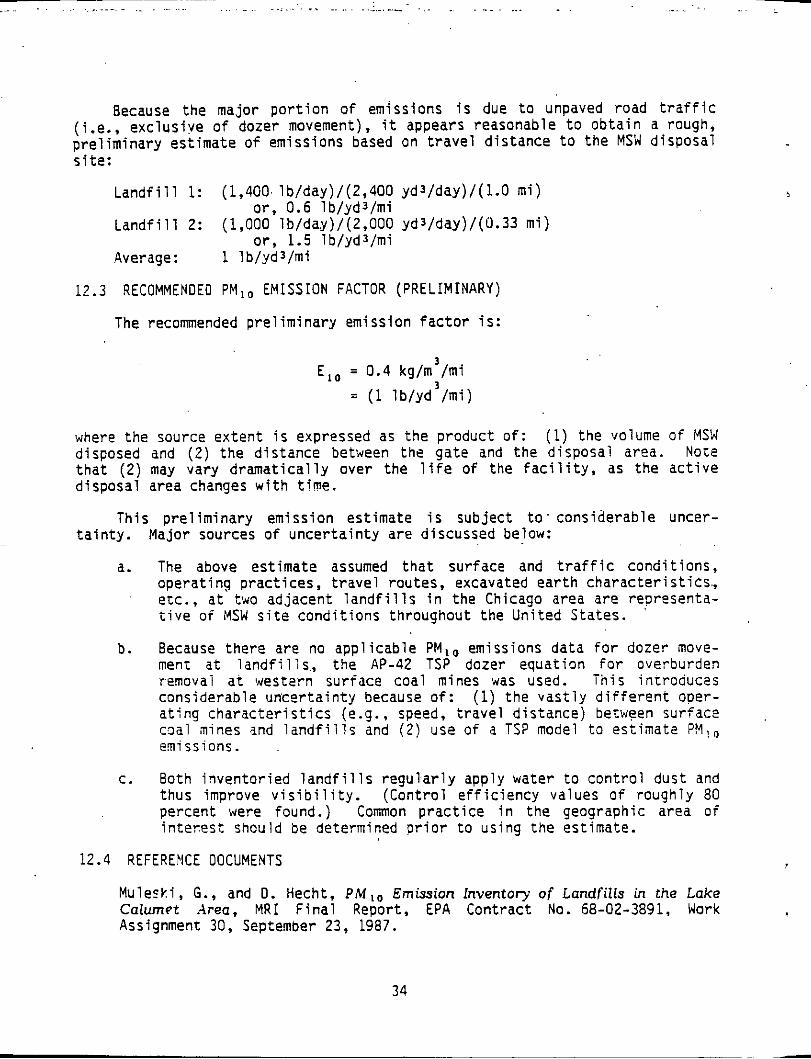
Because the major portion of emissions is due to unpaved road traffic (i.e., exclusive o f dozer movement), it appears reasonable to obtain a rough, preliminary estimate o f emissions based on travel distance to the MSW disposal site:
Landfill 1: (1,400, lb/day)/(2,400 yds/day)/(l.O mi) or, 0.6 lb/yd3/mi
Landfill 2: or, 1.5 lb/yds/mi
Average: 1 lb/yd3/mi
(1,000 lb/day)/(2,000 yd3/day)/(0.33 mi)
12.3 RECOMMENDED PM,, EMISSION FACTOR (PRELIMINARY)
The recommended preliminary emission factor is:
3 E,, = 0.4 kg/m /mi = (1 lb/yd3/mi)
where the source extent is expressed as the product of: (1) the volume of MSW disposed and (2) the distance betveen the gate and the disposal area. Note that ( 2 ) may vary dramatically over the life o f the facility, as the active disposal area changes with time.
This preliminary emission estimate is subject to. considerable uncer- tainty. Major sources of uncertainty are discussed below:
~ ~
a. The above estimate assumed that surface and traffic conditions, operating practices, travel routes, excavated earth characteristics,, ex., at two adjacent landfills in the Chicago area are representa- tive o f MSW site conditions throughout the United States. '
b. Because there are no applicable PM,, emissions data f o r dozer move- ment at landfills., the AP-42 TSP dozer equation f o r overburden removai at western surface coal mines was used. This incroduces considerable uncertainty because o f : (1) the vastly different oper- ating characteristics (e.g., speed, travel distance) between surface mal mines and landfills and (2) use o f a TSP model to estimate PM!, emissions.
c. Both inventoried landfills regularly apply water t o control dust and thus improve visibility. (Control efficiency values of roughly 80 percent were found.) Common practice in the geographic area of interest shculd be determined prior to using the estimate.
12.4 REFEREHCE DOCUMENTS
Mulerki, G., and 0. Hecht, PM,, Emission Inventory of Landfills in the Lake Calumet Area, MRI Final Report, €PA Contract No. 68-02-3891, Work Assignment 30, September 23, 1987.
34
- ~~
. . . . . . . ..: - .. . ... .... .. . . - . . , . - . . . . .. .. . .. . - . . . .. . ~ .. . ,...... -- .... ... .. ~- ~ .... .
SECTION 13.0
COARSE, DRY TAILINGS PONDS
13.1 BACKGROUND
Wind erosion of coarse, dry.tailings ponds is currently not addressed in AP-42. However, the discussion of wind erosion o f storage .piles in A P - 4 2 511.2.3.3 notes that factors influencing emissions are silt and moisture content of the erodible surface and the threshold wind velocity.
13.2 B A S I S FOR' D E R I V A T I O N OF PM,, ' E M I S S I O N FACTOR
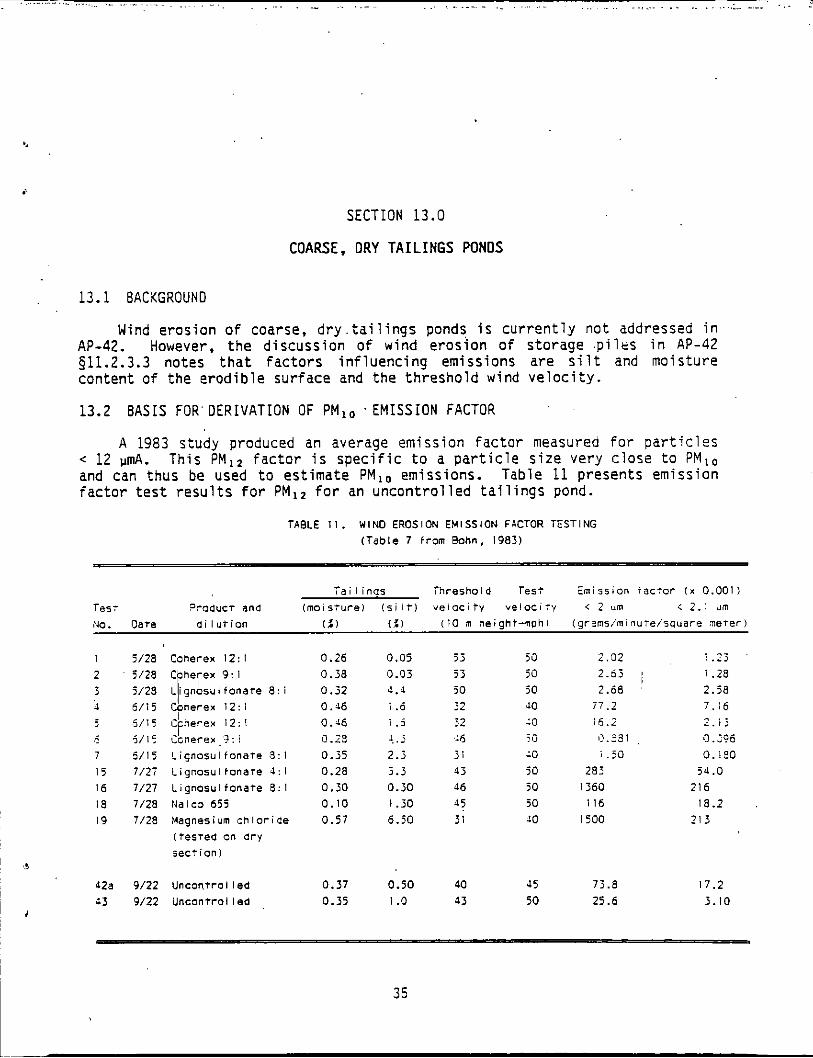
A 1983 study produced an average emission factor measured f o r particles < 12 umA. This PM,, factor is specific to a particle size very close to PMlo and can thus be used to estimate PM,, emissions. Table 11 presents emission factor test results for PM,, for an uncontrolled tailings pond.
TABLE 1 1 . WINO EROSION EMISSION FACTOR TESTING ( T a b l e 7 from Bohn, 1983)
i a i l i n q s ihreshol d Test Emission f a c r o r l x 0.001) Tes: ?rOdUCT ana (mois ture ) ( s i l t ) v e i o c i t y v e l o c i i y < 2 urn < 2.1 urn
No. Date d i l u t i o n 1.2) ( 3 ) (10 m height-mphl lgrarns/minute/square n e r e r )
2 3 J
5 .. 1 15 16 i 8 19
3
42a 33
I
I I
5/28 Caherex 12: l 5/28 C heyex 9:1 5/28 Lignosuifonate 8 : i 6 / 1 5 Coherex 1 2 : l 5 /15 C nerex 1 2 : l 5 / 1 5 i c n e r e x . ? : i 5 / 1 5 Lignosulfonare 3 : l 1 / 2 i i ignosu l fonare 4 : I
1/21 Lignosulfonate 8 : l 7/28 Nalco 655 7/28 Magnesium c h l o r i d e
P i f
( t e s t e d on dry sect ion)
9/22 uncont ro l led 9/22 Uncontrol l ed
0.26 0 .05 53 0 .58 0.05 5 5 0.52 4.1 50 0.16 i .6 32 0.16 i . 6 32 i l .28 4.5 :6 0.35 2.5 31 0 .28 3 .5 43 0 . 3 0 0.30 16
0.57 6.50 31 0.10 I .30 45
0 .37 0.50 40 0.35 I .o 45
50 2 . 0 2 50 2.63 50 2.68 10 17.2 10 16.2
81.231 - - ?U
10 i .SO
50 283 50 I560 50 i I6 JO I500
J5 13 .8 50 25.6
i . 2 j I .28 2.58 7.16 ? i j
0. ;06 O.iB0
-.
5 4 . 0
18.2 216
213
17.2 5.10
~
13
.. .... -.,...... ~ . - . -. . . . . ... .. .. . .I. . - - . . . .. . . . ..i_ .. - . . .. .
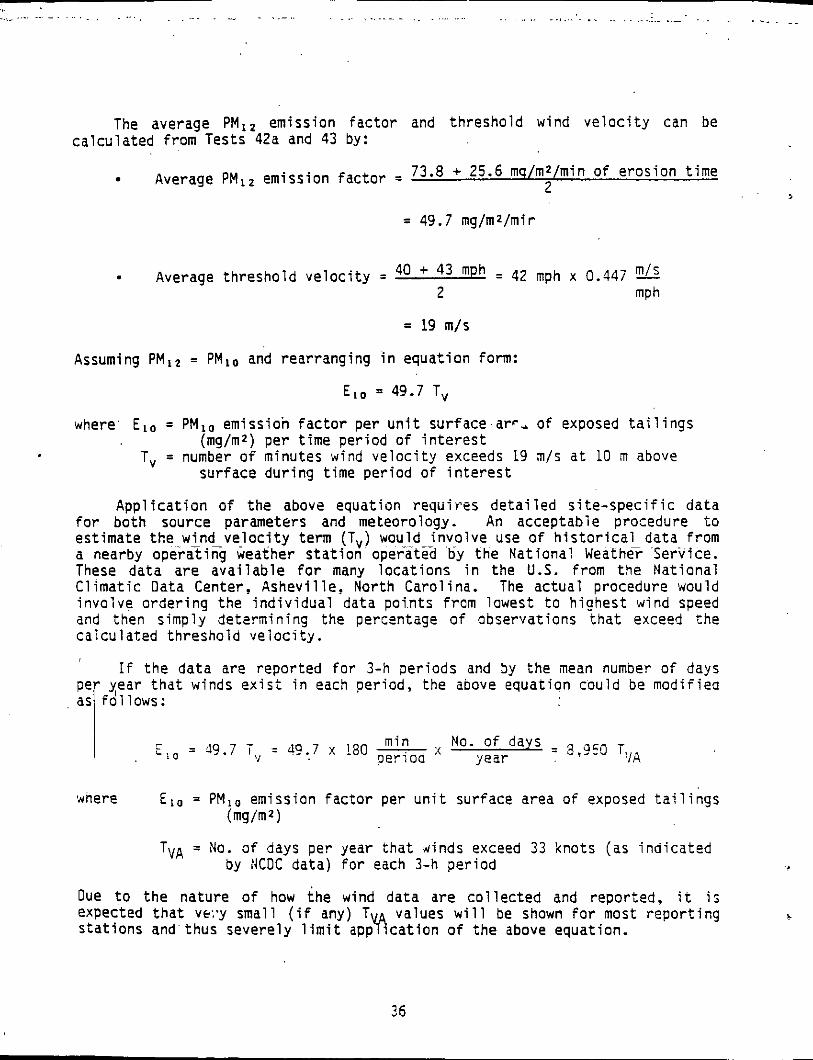
The average P M , , emission factor and threshold wind velocity can be
73.8 + 25.6 mq/mZ/min of erosion time
calculated from Tests 42a and 43 by:
2 Average P M , , emission factor =
= 49.7 mg/mz/mir
- Average threshold velocity = 40 + 43 mph = 42 mph x 0.447 m/s 2 mPh
= 19 m/s
Assuming P M I 2 = P M l o and rearranging in equation form:
E I O = 49.7 Tv
where' E l o = P M I o emission factor per unit surface ar=, of exposed tailings
Tv = number of minutes wind velocity exceeds 19 m/s at 10 m above (mg/mz) per time period of interest
surface during time period of interest
Application o f the above equation requires detailed site-specific data for both source parameters and meteorology. An acceptable procedure to estimate the wind velocity term (T,) would involve use of historical data from a nearby operfiicg weather station operatea ~tiy the Nationa! Weather 3ervice. These data are available f o r many locations in the U.S. from the National Climatic Data Center, Asheville, North Carolina. The actual procedure would involve ordering the individual data poi.nts from lowest to highest wind speed and then simply determining the percentage of observations that exceed the calculated threshold velocity.
If the data are reported f o r 3-h periods and by the mean number of days winds exist in each period, the above equation could be modified
I mi n :< of = 3,950 T,,,A = d 0 . 7 x !80 perioo E LO ' i year = 49.7 T
'where E,, = P M , , emission factor per unit surface area of exposed tailings
TVA = No. of days per year that rinds exceed 33 knots (as indicated
(mg/m, 1
by NCOC data) for each 3-h period
Due to the nature of how the wind data are collected and reported, it i; expected that ve:*y small (if any) T values will be shown for most reporting stations and'thus severely limit app vp ication of the above equation. !.
. . . . . . . . . . . . . . . . . . . 7 ..... .... . . . . . . . . . . . . . . . . ........ . . . . . ................. A,.- .... . . . . . . . .. - .
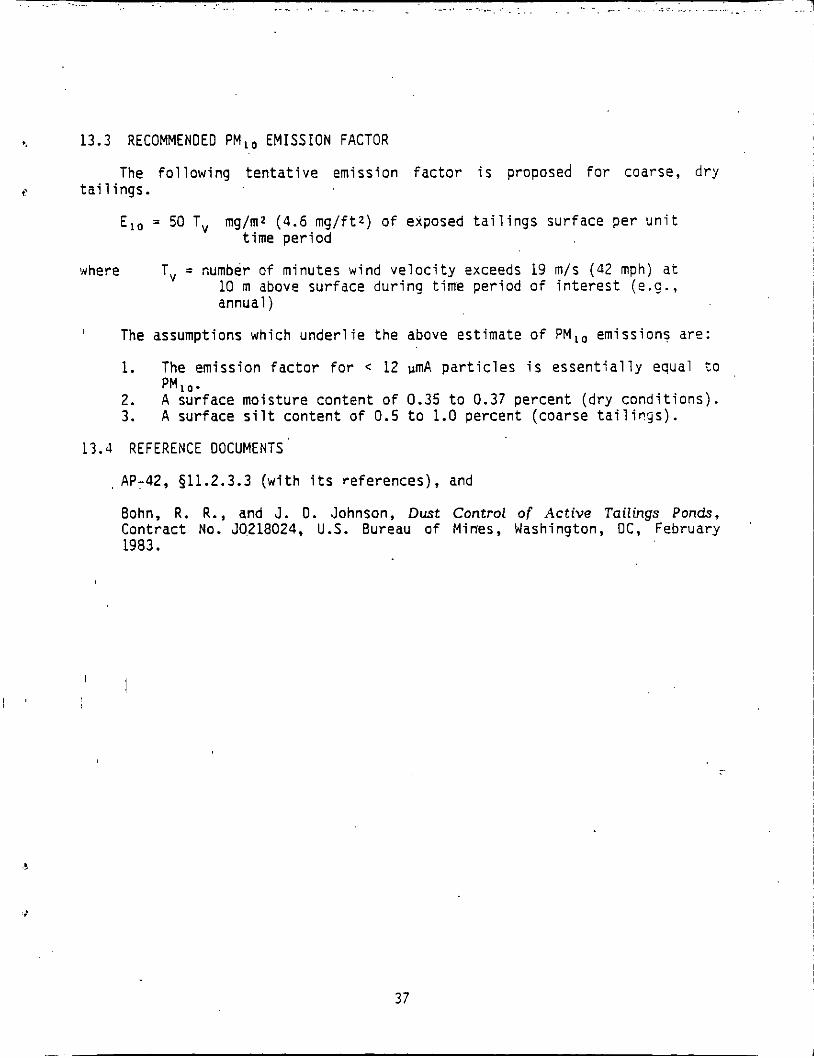
e. 13.3 RECOMMENDED PM,, EMISSION FACTOR
The following tentative emission factor is proposed for coarse, dry
E,, = 50 T, mg/mz ( 4 . 6 mg/ftZ) of exposed tailings surface per unit
Tv = number of minutes wind velocity exceeds 19 m/s (42 mph) at 10 m above surface during time period of interest ( e . ? . , annual)
,' tailings.
time period
where
' The assumptions which underlie the above estimate of PM,, emissions are:
1. The emission factor for c 12 VmA particles is essentially equal t o
2. A surface moisture content of 0.35 to 0.37 percent (dry conditions). 3 . A surface silt content of 0.5 to 1.0 percent (coarse tailicgs).
PM,,.
13.4 REFERENCE DOCUMENTS
, AP-42, 911.2.3.3 (with its references), and
Bohn, R. R., and J. 0. Johnson, Dust Control of Active Tailings Ponds, Contract No. 50.218024, U.S. Bureau of Mines, Washington, OC, February 1983.
' I ! '
37
. . . . . . i .. ~ . . .. . >- . .. -. . . . . . .. . .. . . - .. . . . ... . . . , . . . _ .. .. .
SECTION 14.0
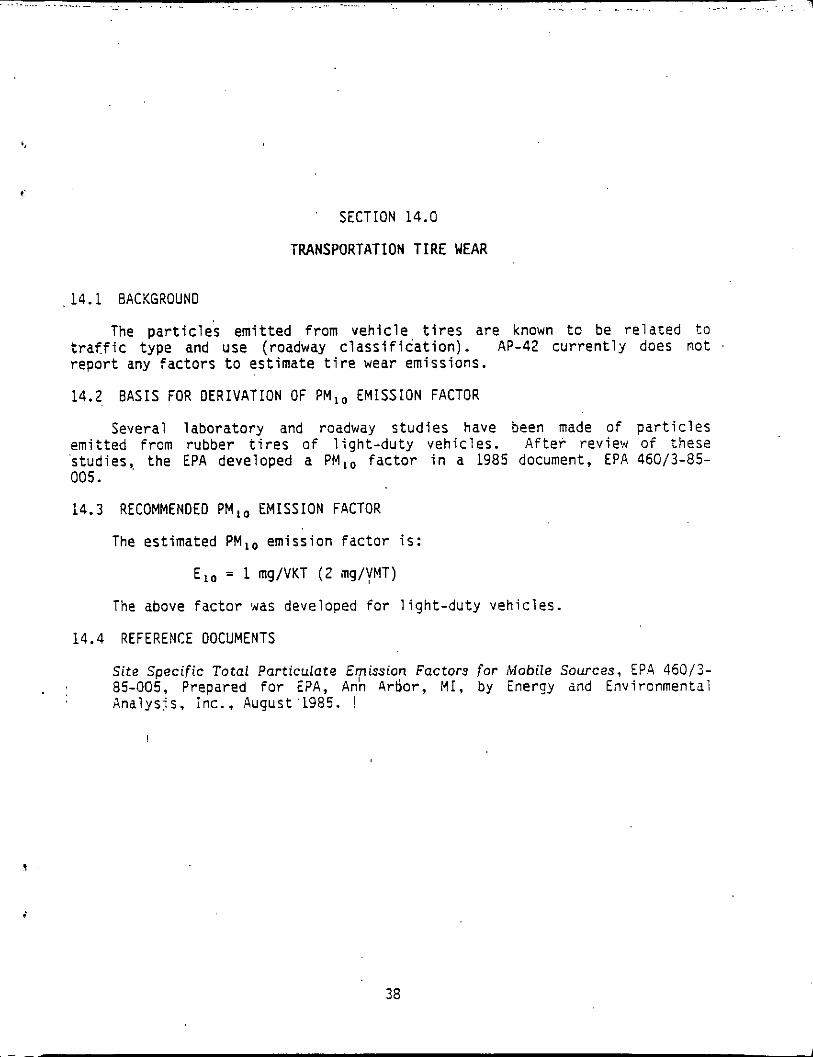
TRANSPORTATION TIRE WEAR
14.1 BACKGROUND
The p a r t i c l e s emi t ted f rom v e h i c l e , t i r e s a re known t o be r e l a t e d t o t r a f f i c type and use (roadway c l a s s i f i c a t i o n ) . AP-42 c u r r e n t l y does n o t r e p o r t any f a c t o r s t o es t ima te t i r e wear emissions.
14.2 B A S I S FOR D E R I V A T I O N OF PM,, EMISSION FACTOR
Several l a b o r a t o r y and roadway s t u d i e s have been made o f p a r t i c l e s emi t ted f rom rubber t i r e s o f l i g h t - d u t y veh ic les . A f t e r rev iew o f these s tud ies , t h e EPA developed a PM,, f a c t o r i n a 1985 document, EPA 460/3-85- 005.
14.3 RECOMMENDED PM,, E M I S S I O N FACTOR
The est imated PM,, emiss ion f a c t o r i s :
E,, = 1 mg/VKT ( 2 mg/VMT)
The above f a c t o r was developed f o r l i g h t - d u t y veh ic les .
14.4 REFERENCE DOCUMENTS
Site Specific Total Particulate Emission Factors for MobiZe Sources, EPA 460 /2 - . . 85-005, Prepared f o r EPA, Ann Arhor, MI, by Energy and Environmentai
Analys is , inc., A u g h t '1985. !
I
38
. . . . . . . . . . . . . . . . . . . . . . . . . . . . . . ....... - . . . . . . . - . . . . . . . . . . . . . . . . . . . . . . . . . . . . . . . . . . . . . . . . . . - ..
8,
e\
S E C T I O N 15.0
TRANSPORTATION BRAKE WEAR
15.1 BACKGROUND
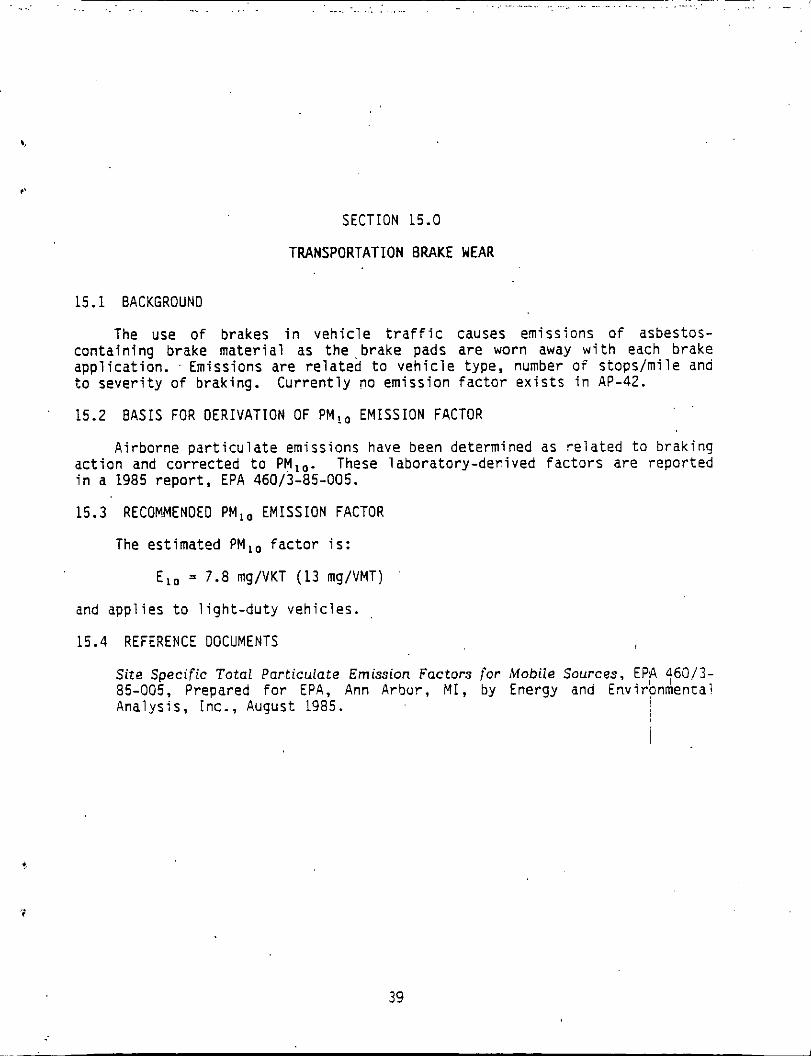
The use o f brakes i n v e h i c l e t r a f f i c causes emissions o f asbestos- con ta in ing brake m a t e r i a l as t h e , b r a k e pads are worn away w i t h each brake app l i ca t i on . ' Emissions are r e l a t e d t o v e h i c l e type, number of s tops /mi le ana t o s e v e r i t y o f brak ing. C u r r e n t l y no emiss ion f a c t o r e x i s t s i n AP-42.
15.2 B A S I S FOR OERIVATION OF PM1, E M I S S I O N FACTOR
Ai rborne p a r t i c u l a t e emissions have been determined as r e l a t e d t o b rak ing a c t i o n and co r rec ted t o PM,,. These labo ra to ry -de r i ved f a c t o r s a re repo r ted i n a 1985 r e p o r t , EPA 460/3-85-005.
15.3 RECOMMENOEO PM,, E M I S S I O N FACTOR
The est imated PM,, f a c t o r i s :
E,, = 7.8 mg/VKT ( 1 3 mg/VMT)
and app l i es t o l i g h t - d u t y veh ic les .
15.4 REFERENCE DGCUMENTS
Site Specific Total Particulate Emission Factors for Mobile Sources, 85-005, Prepared f o r EPA, Ann Arbor , MI, by Energy and E n v i r Analys is , Inc., August 1985.
39
........... '1 . . . . . . . . . ........... . . . . ... . . . . . . . . . . . . . . . . . . . . . . . . . . . . . . . . . . . . . . .
.
SECTION 16.0
ROAO SANOING/SALTING
16.1 BACKGROUND
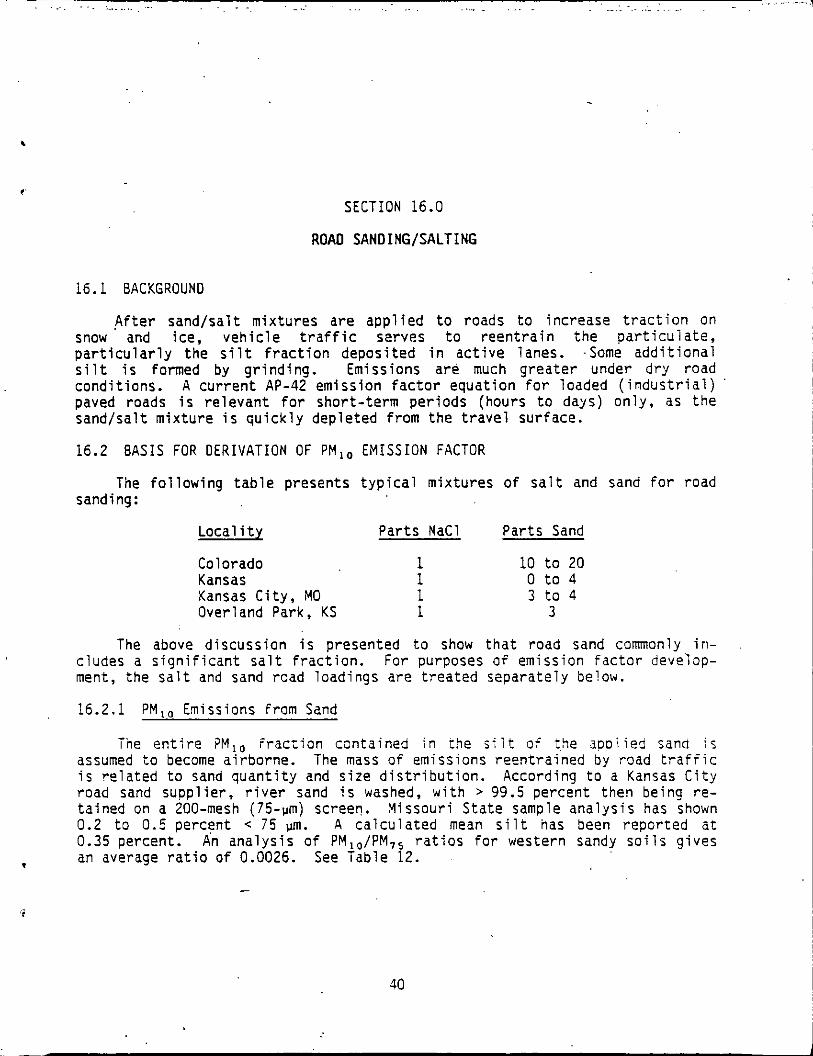
A f t e r sand/sa l t m ix tu res a r e a p p l i e d t o roads t o inc rease t r a c t i o n on snow and ice . v e h i c l e t r a f f i c serves t o r e e n t r a i n t h e p a r t i c u l a t e , p a r t i c u l a r l y t h e s i l t f r a c t i o n depos i ted i n a c t i v e lanes. .Some a d d i t i o n a l s i l t i s formed by g r i n d i n g . Emissions a r e much g r e a t e r under d r y road cond i t ions . A c u r r e n t AP-42 emiss ion f a c t o r equat ion f o r loaded ( i n d u s t r i a l ) paved roads i s r e l e v a n t f o r shor t - te rm pe r iods (hours t o days) on l y , as t h e sand/sa l t m i x t u r e i s q u i c k l y dep le ted f rom t h e t r a v e l sur face .
16.2 B A S I S FOR D E R I V A T I O N OF PM,, E M I S S I O N FACTOR
The f o l l o w i n g t a b l e p resents t y p i c a l m ix tu res o f s a l t and sand f o r road sanding :
T t 3V
Local i t y
Colorado Kansas Kansas C i t y , MO Overland Park, KS
d i scuss ion i s Dr
P a r t s NaCl P a r t s Sand
10 t o 20 0 t o 4 3 t o 4
3
n ted t o sh I h a t road sand comm l y i r i - For purposes o f emiss ion f a c t o r deve'lop- c ludes a s i g n i f i c a n t s a l t f r a c t i o n .
ment, the s a l t and sand rcad load ings a r e t r e a t e d separa te l y below.
16.2.1 PM,, Emissions from Sand
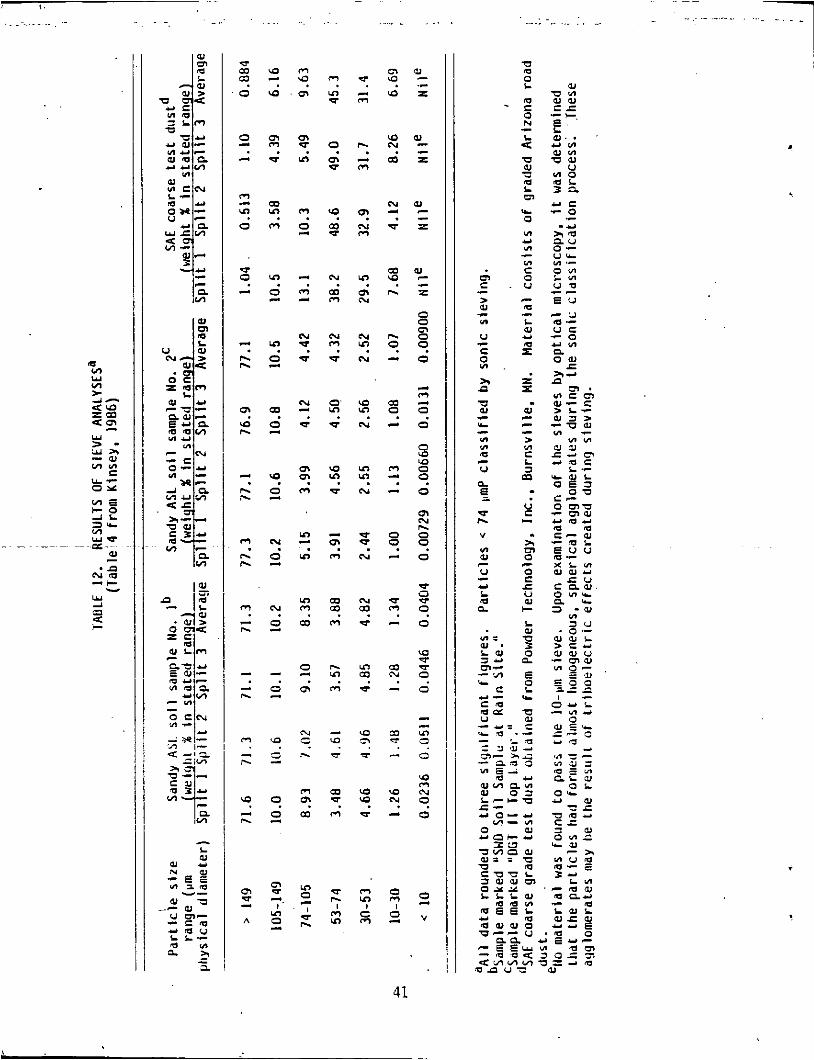
The e r ? t i r e ?MI,, i r a c x i o n conta ined in the s i i t o f t,he app l i ed sand i s assumed t o become a i rborne . The mass o f emissions reen t ra ined by road t r a f f i c i s r e l a t e d t o sand q u a n t i t y and s i z e d i s t r i b u t i o n . According t o a Kansas C i t y road sand supp l i e r , r i v e r sand Is washed, w i t h > 99.5 percent then be ing r e - t a ined on a ZOO-mesh (75-urn) screen. M issour i S t a t e sample a n a l y s i s has shown 0.2 t o 0.5 percent < 7 5 urn. A c a l c u l a t e d mean s i l t has been r e p o r t e d a t 0.35 percent. An a n a l y s i s o f PM,,/PM,S r a t i o s for western sandy s o i l s g i ves an average r a t i o o f 0.0026. See Table 12. .
40
~~
...... . . . . . . . . . . . . . . . . .......... ... . . . . . . . . . . . . . . . . . . .............. I .
. .
41
. . . . . .. - .. . . ~ .. .. . . ~~ . . . . . ... ....,. . ~ . . ~ . . ... . . .. . - .- . . . .
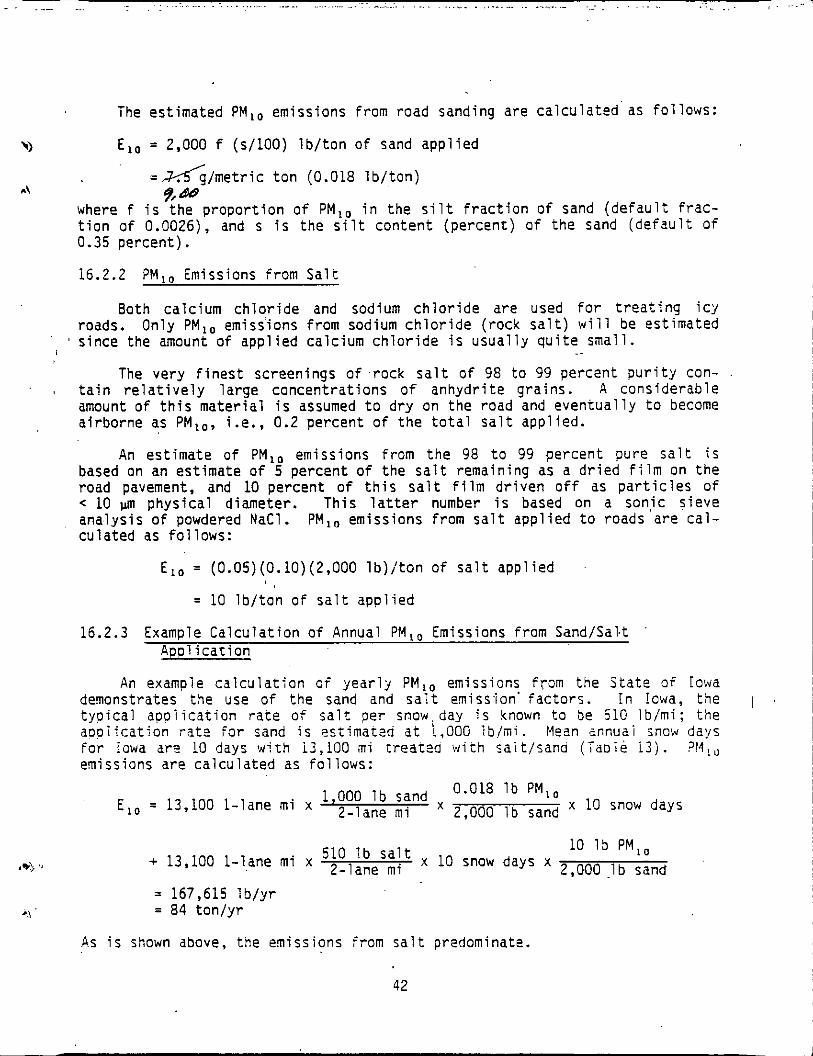
The estimated PM,, emissions from road sanding are calculated. as follows:
Y E,, = 2,000 f (s/lOO) lb/ton of sand applied
= d g / m e t r i c ton (0.018 lb/ton) 95 r\
where f is the proportion of PM,!, in the silt fraction of sand (default frac- tion of 0.0026), and s is the silt content (percent) of the sand (default of 0.35 percent).
16.2.2 PM,, Emissions from Salt
Both calcium chloride and sodium chloride are used for treating icy Only PM,, emissions from sodium chloride (rock salt) will be estimated
The very finest screenings of .rock salt of 98 to 99 percent purity con- .
roads. ' since the amount of applied calcium chloride is usually quite small.
..
I tain relatively large concentrations o f anhydrite grains. A considerable amount of this material i s assumed to dry on the road and eventually to become airborne as PM,,, i . e . , 0.2 percent of the total salt applied.
An estimate of PM,, emissions from the 98 to 99 percent pure salt is based on an estimate of 5 percent of the salt remaining as a dried film on the road pavement, and 10 percent of this salt film driven off as particles of < 10 ym physical diameter. This latter number is based on a sonic sieve ana.lysis o f powdered NaC1. PM,, emissions from salt applied to roads are cal- culated as follows:
E,, = (0.05)(0.10)(2,000 1b)iton of salt applied
= 10 lb/ton of salt applied
16.2.3 Example Calculation of Annual PM,, Emissions from Sand/Sal.t '
Application
An example calculation o i yearly PM,, emissions from the State of Iowa demonstrates the use of the sand and salt emissfon' factors. In Iowa, the I I
typical appli'cation rate of salt per snow, day i s known to be 510 lb/mi; the aoplication rate for sand is estimated at 1,000 lb/mi. Mean annuai snow days for iowa ar? 10 days with i3,lOO mi treated with sait/sana (Taoie i 3 ) . ? l 4 , , emissions are calculated as follows:
0.018 lb PM,,
2,000 lb sand x 10 snow days 1000 lb sand '2-lane mi E,, = 13,100 1-lane mi x
10 15 PM,, 510 lb salt 2-lane mi + 13,100 1-lane mi x x 10 snow days x 2,000 -lb sand
= 167,615 lb/yr = 84 ton/yr
As is shown above, the emissions from salt predominate.
42
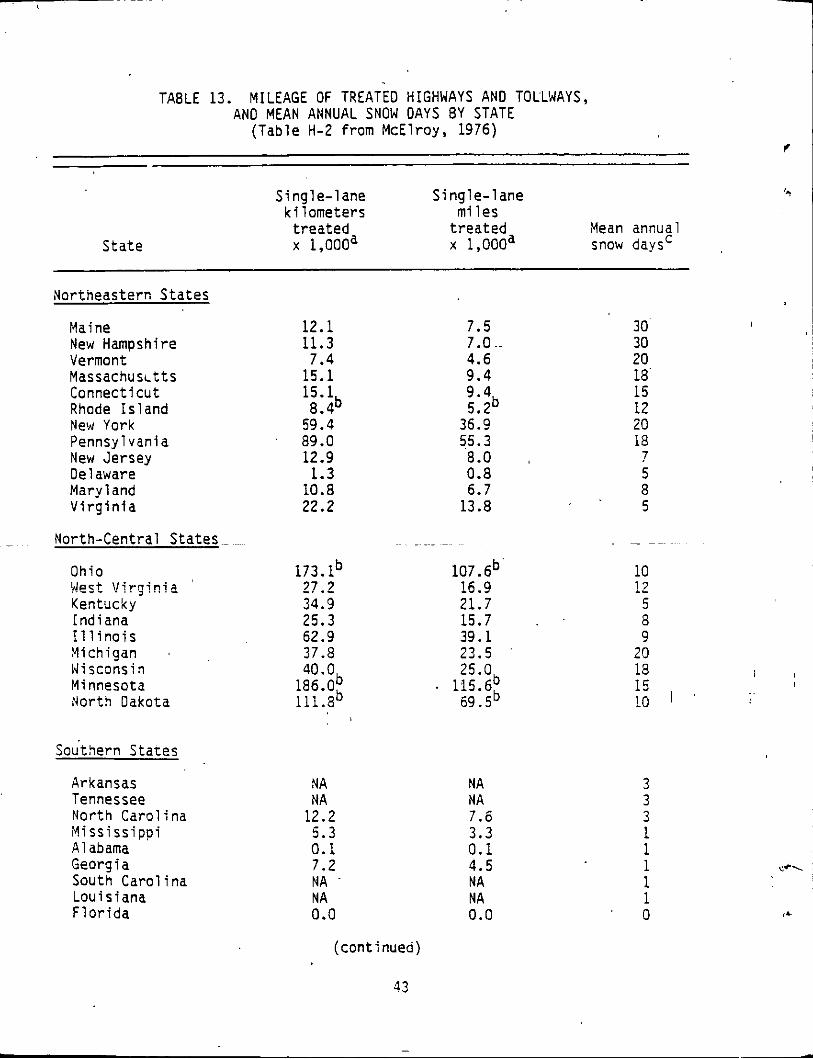
TABLE 13. MILEAGE OF TREATEO HIGHWAYS AND TOLLWAYS, AND MEAN ANNUAL SNOW DAYS BY STATE
(Table H-2 f rom McElroy, 1976)
S ing le - lane S ing le - lane k i l o m e t e r s m i l e s
t r e a t e d a t r e a t e d Mean annual x 1,000 x 1,000a snow days' S t a t e
Nor theastern S t a t e s
Maine New Hampshire Vermont Massachusi t ts Connect icut Rhode I s l a n d New York Pennsylvania New Jersey Del aware Mary1 and V i r g i n i a
12.1 11.3 7.4
15.1
7.5 7.0.. 4.6 9.4
30 I
30 20 18.
15.1b
59.4 8.4
9.4b 5.2
36.9
15 12 20 18 89.0 55.3
12.9 1.3
10.8
8.0 7 ~~~
0.8 6.7
5 a
22.2 13.8 5
Ohio
Kentucky Ind iana I 1 1 i n o i s Michigan I
W i scons i n Minnesota Nor th Dakota
west \ / j r g j n i a 173.1b 107. gb' 10 2?.2 34.9 25.3
16.9 !2 21.7 5 15.7 a
62.9 39.1 9 37.8 23.5 40.0 25.0,
186.0; . 115.6: 111.8 69.5
20
15 i a
10 ' i
Souihern Sta tes
Arkansas Tennessee Nor th C a r o l i n a M i s s i s s i p p i A 1 abama Georgia South C a r o l i n a Loui s iana F l o r i d a
NA NA
12.2
NA NA 7.6
3 3 3
5.3 0.1 7.2
3.3 0.1 4.5
1 1 1
NA NA 0.0
NA NA 0.0
1 1
' 0
(cont inued)
33
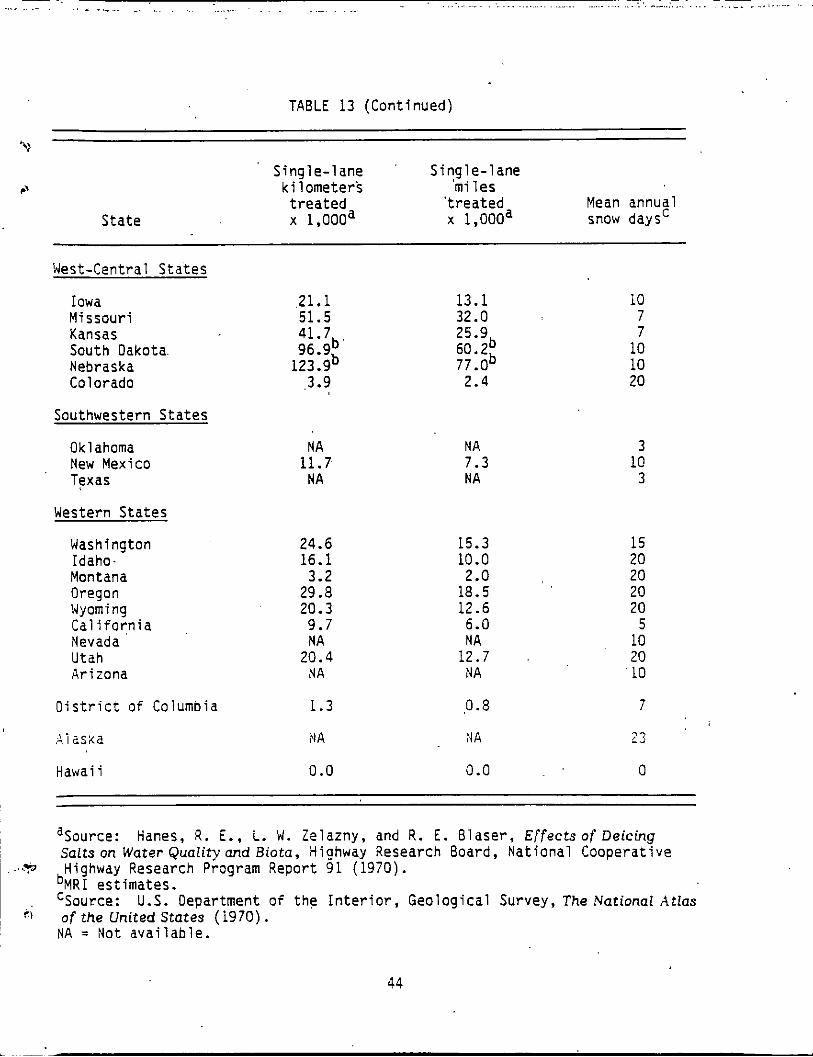
..., .. .-
'> r'
. .. . _.: ..... .. . .. - .- .. .. ,.. .. . . . . ..
TABLE 13 (Continued)
Single-lane Single-lane kilometers 'mi les
State x 1,000a x 1,000a snow days' treated 'treated Mean annual
Nest-Central States
Iowa Missouri Kansas South Dakota. Nebraska Colorado
Southwestern States
Oklahoma New Mexico Texas
Western States
Washington Idaho- Montana Oregon Uyomi ng California Nevada Utah Arizona
21.1 51.5 41.7b, 96.9,,,
123.9 ,3.9
NA 11.7 NA
24.6 16.1
3.2 29 .a 20.3 9.7 NA
20.4 NA
District o f Columbia 1.3
A i zsxa NA
Hawaii 0.0
13.1 32.0 25 .gb 6O.Zb 77.0
2.4
NA 7.3 NA
15.3 10.0 2.0
18.5 12.6 6.0 NA
12.7 NA
,o .a :I A
10 7 7
10 10 20
3 10 3
15 20 20 20 20
5 10 20
'10
0.0 0
aSource: Salts on Water Quality and Biota, Highway Research Board, National Cooperative Highway Research Program Report 91 (1970).
b M R I estimates. CSource: of the United States (1970). NA = Not available.
Hanes, R. E., L. W. Zelazny, and R. E . Blaser, E f f e c t s o f Deicing
U.S. Oepartment o f the Interior, Geological Survey, The National Atlas
44
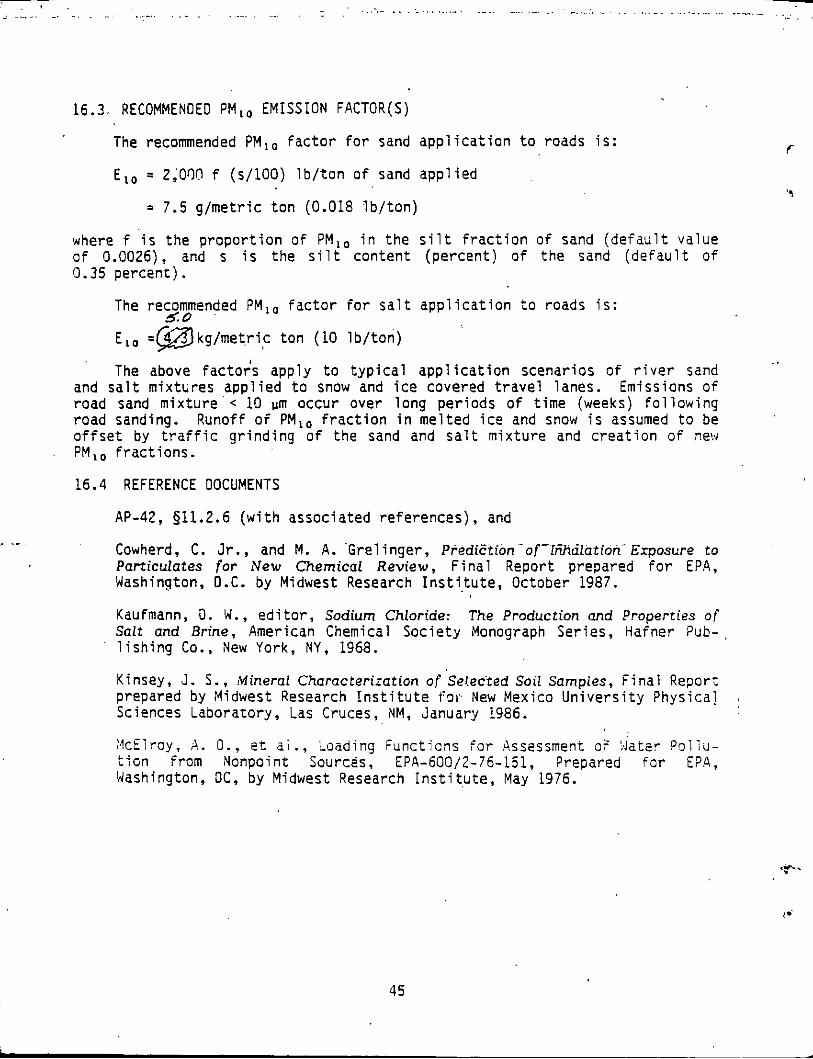
~~ ~ ~~~~ ~
~~ . .................... .............. ......... ......... . . . . .
~ t .
... __ . . . . . . . . . . . . . . . . . . . . . . . ...
16.3. RECOMMENDED PM,, EMISSION FACTOR(S)
The recommended PM,, f a c t o r f o r sand a p p l i c a t i o n t o roads i s :
E,, = 2;OrlCI f (s/lOO) l b / t o n o f sand a p p l i e d
= 7.5 g / m e t r i c t o n (0.018 l b / t o n )
where f i s t h e p r o p o r t i o n o f PM,, i n t h e s i l t f r a c t i o n o f sand ( d e f a u l t va lue o f 0.0026), and s i s t h e s i l t con ten t (pe rcen t ) o f t h e sand ( d e f a u l t o f 0.35 pe rcen t ) .
The recommended PM,, f a c t o r f o r s a l t a p p l i c a t i o n t o roads i s :
E,, =@kg/metr ic t o n (10 l b / t o n )
The above facto;s app ly t o t y p i c a l a p p l i c a t i o n scenar ios o f r i v e r sand and s a l t mixtl;res a p p l i e d t o snow and i c e covered t r a v e l lanes. Emissions of road sand m i x t u r e ' < 10 prn occur over l ong p e r i o d s o f t ime (weeks) f o l l o w i n g road sanding. Runoff o f PM,, f r a c t i o n i n me l ted i c e and snow i s assumed t o be o f f s e t by t r a f f i c g r i n d i n g o f t h e sand and s a l t m i x t u r e and c r e a t i o n o f ne% PM,, f r a c t i o n s .
16.4 REFERENCE DOCUMENTS
s o
~.
AP-42, 511.2.6 ( w i t h assoc ia ted re fe rences ) , and
Cowherd, C. J r . ,- and&M;~ A. 'Gre l inger , Prediction ~of- [r ihdla t ion~ Exposwe t o Particulates for New Chemical Rev iew , F i n a l Report prepared f o r EPA, Washington, O.C. by Midwest Research I n s t i t u t e , October 1987.
Kaufmann, 0. W., e d i t o r , Sodium Chloride: The Production and Properties of Salt and Brine, American Chemical Soc ie ty Monograph Ser ies, Hafner Pub- , l i s h i n g Co., New York, NY, 1968.
Kinsey, J . S., !Mineral Characterization of 'Selected Soil Samples, F i n a l Repor: prepared by Midwest Research I n s t i t u t e f w New Mexico U n i v e r s i t y Phys ica l Sciences Laboratory , Las Cruces, NM, January 1986.
~~~~~
I
: IcElroy, A. D., 2 t a i . , Loading Funct ions f o r Assessmen1 o f :.iaE,r Pollu- tion from Nonpoint Sources, EPA-600/2-76-151, Prepared f o r EPA, Washington, DC, by Midwest Research I n s t i t u t e , May 1976.
45
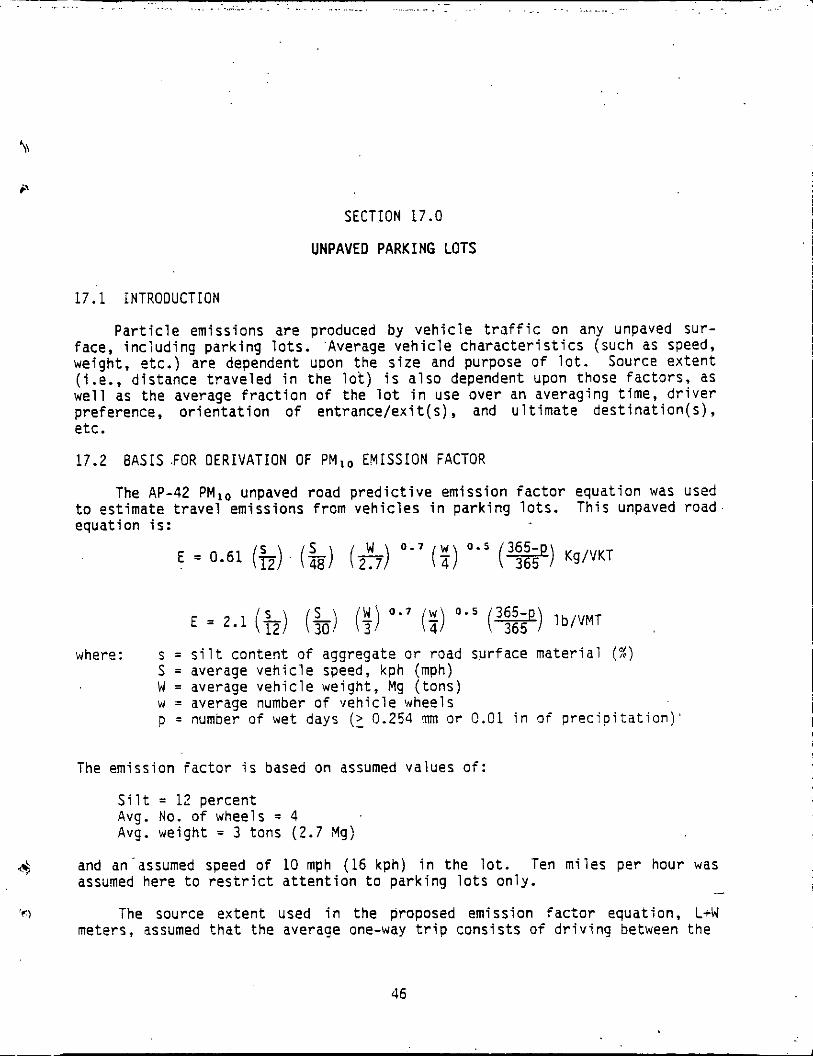
. . . .. .. . . . .,. . . . ~. .~ . . . . . . . . ,. . . . ...
. . . . . . - . ..~ -. .. . . .. . .....
SECTION 17.0
UNPAVED PARKING LOTS
17.1 INTRODUCTION
Particle emissions are produced by vehicle traffic on any unpaved sur- face, including parking lots. 'Average vehicle characteristics (such as speed, weight, etc.) are dependent upon the size and purpose of lot. Source extent (i.e., distance traveled in the lot) is also dependent upon those factors, as well as the average fraction of the lot in use over an averaging time, driver preference, orientation o f entrance/exit(s), and ultimate destination(s), etc.
17.2 8ASIS.FOR OERIVATION OF PMlo EMISSION FACTOR
The AP-42 PM,, unpaved road predictive emission factor equation was used This unpaved road to estimate travel emissions from vehicles in parking lots.
equation is:
where:
The
s = silt content of aggregate o r road sgrface material (%) S = average vehicle speed, kph (mph) W = average vehicle weight, Mg (tons) w = average number of vehicle wheels p = number o f wet days ( 2 0.254 mm o r 0.01 in of precipitation)
sion factor is based on assumed values o f :
Silt = 12 percent 4vg. No. of wheels = 4 4vg. weight = 3 tons (2.7 Mg)
and an~assumed speed of 10 mph (16 kph) in the 1c . Ten mile per hour w I
assumed here to restrict attention to parking lots only.
%) The source extent used in the proposed emission factor equation, L+W -
4
meters, assumed that the average one-way trip consists o f driving between the
~ ~~ ~~~~~~~~~
. .. . . . . . .. . ~ .. . ... . . . . - . . .. . .. ... . , ~ . . . . ... . . . , . . . . .. . . . . .. . ..... . . ..
middle of the lot and the exit. It is further assumed that the one-way dis- tance is (L+W)/2 (i.e., the vehicle travels halfway down the perpendicular dimension and halfway dawn the parallel dimension). Because each vehicle parked must travel both legs of (L+W)/2, the total distance traveled by each vehicle parked i s 2 x (L+W)/2 = L+W.
17.3 RECOMMENDED PMlo E M I S S I O N FACTOR
365- E,, = 0.2 -& ( L + W ) g/vehicie parked (in time period of interest)
where p = number of days/year with rain (Figure 11.2.1-1 in A P - 4 2 ) L = dimension of parking lot (m) perpendicular to aisles W = dimension of parking lot ( m i parallel to aisles
Several assumptions were made in obtaining the preliminary estimate. These were described in Section 17.2. . In addition, several caveats should be noted:
a. The emission factor and the source extent may be very site-specific in that use of the lot may be by heavier vehicles, or may be shared by a number o f facilities (thus resulting in clusters, each with their own source extent). In addition, driver preference nay result in substantially higher travel speeds or in longer travel dis- tances.
b. The equation recommended earlier will require that the total number o f vehicles parked per unit time be determined by counting or other means. This may not be practical in ail instances.
~~ ~~~~ ~ ~ ~ ~~ ~ ~ ~~~~~ ~~~
~~ ~~ ~ ~
17.4 REFERENCE DOCUMENTS
A P - 4 2 511.2.
a7
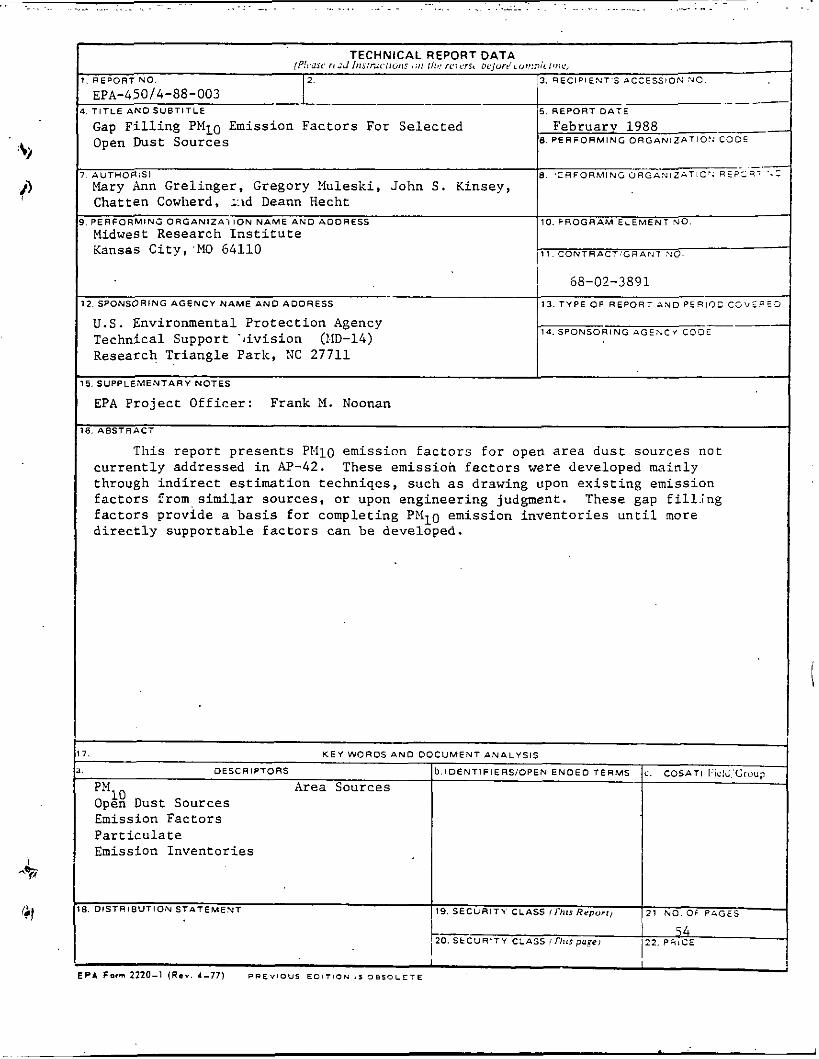
. . . ... . . . . . . . . . . . . .~ ... . . . . . . . . . . . . . . . . . . . . . . . . . _. . . . . . . . . . . . . . . . . . . . . . . . . . . . . . . . . . . . . . . . . . . . . . . . . . . . . . . . . . . . . .
REPORT NO. 2 .
- EPA-450/4-88-003
l
'41
3 . RECIPIENT'S ACCESSION NO.
.- - _-
dUTHORISI Hary Ann Grelinger. Gregory Muleski, John S . Kinsey, Chatten Cowherd, ;:id Deann Hecht
Midwest Research Institute Kansas City;MO 64110
PERFORMING ORGANIZA-4 I O N NAME A N 0 AOORESS
2. SPONSORING AGENCY NAME A N 0 AODRESS
~~
Gap Filling PMLO Emission Factors For Selected Open Dust Sources
-. e. ' C R F O R k 4 I N C ORGANIZLTIO~. R E P Z R ' ..Z
10. FROGRAM ELEMENT NO.
1 1 . C0NTRPCT:GRAPIT NO.
68-02-3891 13. TYPE O F R E P O R T A N 0 P E 9 1 O Z CSYEaEI
~~~ ~~
Februarv 1988 - 6 P E R F O R M %C ORGAI\ Z b T 0'. C C 3 t
DESCRIPTORS b.lOENTIFIERS/OPEN ENOEO TERMS c. COSATI I:iclj.'(;ruup
U.S. Environmental Protection Agency Technical Support .oivision (PID-14) Research Triangle Park, :iC 27711
DISTRIBUTION STATEMENT SECURITY CLASS f rhzrRrpurr ,
I i. SUPPLEMENTARY NOTES
EPA Project Officer: Frank M. Noonan
- 1 NO. O F P ~ G E S
> ABSTRACT
This report presents PEllo emission factors for open area dust sources not currently addressed in AP-42. These emission factors were developed mainly through indirect estimation techniqcs, such as drawing upon existing emission factors from similar sources, or upon engineering judgment. These gap fill;ng factors provide a basis for completing PMlo emission inventories until more directly supportable factors can be developed.
KEY WORDS AN0 DOCUMENT ANAL Y<19
1u Open Dust Sources Emission Factors Particulate Emission Inventories
1 ..
i