AP Statistics 2013 Scoring Guidelines - statsw15.prof.ninjastatsw15.prof.ninja/notes/apsol.pdf ·...
23
AP ® Statistics 2013 Scoring Guidelines The College Board The College Board is a mission-driven not-for-profit organization that connects students to college success and opportunity. Founded in 1900, the College Board was created to expand access to higher education. Today, the membership association is made up of over 6,000 of the world’s leading educational institutions and is dedicated to promoting excellence and equity in education. Each year, the College Board helps more than seven million students prepare for a successful transition to college through programs and services in college readiness and college success — including the SAT® and the Advanced Placement Program®. The organization also serves the education community through research and advocacy on behalf of students, educators, and schools. The College Board is committed to the principles of excellence and equity, and that commitment is embodied in all of its programs, services, activities, and concerns. © 2013 The College Board. College Board, Advanced Placement Program, AP, SAT and the acorn logo are registered trademarks of the College Board. All other products and services may be trademarks of their respective owners. Visit the College Board on the Web: www.collegeboard.org. AP Central is the official online home for the AP Program: apcentral.collegeboard.org.
Transcript of AP Statistics 2013 Scoring Guidelines - statsw15.prof.ninjastatsw15.prof.ninja/notes/apsol.pdf ·...

AP® Statistics 2013 Scoring Guidelines
The College Board The College Board is a mission-driven not-for-profit organization that connects students to college success and opportunity. Founded in 1900, the College Board was created to expand access to higher education. Today, the membership association is made up of over 6,000 of the world’s leading educational institutions and is dedicated to promoting excellence and equity in education. Each year, the College Board helps more than seven million students prepare for a successful transition to college through programs and services in college readiness and college success — including the SAT® and the Advanced Placement Program®. The organization also serves the education community through research and advocacy on behalf of students, educators, and schools. The College Board is committed to the principles of excellence and equity, and that commitment is embodied in all of its programs, services, activities, and concerns. © 2013 The College Board. College Board, Advanced Placement Program, AP, SAT and the acorn logo are registered trademarks of the College Board. All other products and services may be trademarks of their respective owners. Visit the College Board on the Web: www.collegeboard.org. AP Central is the official online home for the AP Program: apcentral.collegeboard.org.

AP® STATISTICS 2013 SCORING GUIDELINES
© 2013 The College Board. Visit the College Board on the Web: www.collegeboard.org.
Question 1 Intent of Question The primary goals of this question were to assess a student’s ability to (1) use a stem-and-leaf plot to answer a question about a distribution of data; (2) identify and compute an appropriate confidence interval after checking the necessary conditions; and (3) interpret the interval in the context of the data. Solution Part (a):
Four of the 23 crows in the sample had a lead level greater than 6.0 ppm. Therefore, the proportion of
crows in the sample that were classified as unhealthy is ≈4 0.174.23
Part (b):
Step 1: Identifies the appropriate confidence interval (by name or by formula) and checks appropriate conditions.
The appropriate procedure is a one-sample t-interval for a population mean. Conditions: 1. The sample is randomly selected from the population. 2. The population has a normal distribution, or the sample size is large. The first condition is met because we were told that the crows were randomly selected. The sample size of 23 is not considered large, so we need to examine the sample data to assess whether it is reasonable to assume that the population distribution of lead levels for all crows in this region is normal. The stem-and-leaf plot shows no strong skewness or outliers, so we will consider the second condition to be met.
Step 2: Correct mechanics
A 95% confidence interval for the population mean μ is given by: * .sx tn
± The critical value for
95% confidence, based on =23 – 1 22 degrees of freedom, is =* 2.074.t The 95% confidence interval for μ is therefore
1.124.90 2.074 4.90 0.484,23
± × ≈ ±
which is the interval (4.416, 5.384) ppm. Using the raw data rather than the given summary statistics, the 95% confidence interval for µ is (4.411, 5.3803).
Step 3: Interpretation
We can be 95% confident that the population mean lead level among all crows in this region is between 4.416 and 5.384 parts per million.

AP® STATISTICS 2013 SCORING GUIDELINES
© 2013 The College Board. Visit the College Board on the Web: www.collegeboard.org.
Question 1 (continued) Scoring This question is scored in four sections. Section 1 consists of part (a); section 2 consists of part (b), step 1; section 3 consists of part (b), step 2; and section 4 consists of part (b), step 3. Each section is scored as essentially correct (E), partially correct (P), or incorrect (I). Section 1 is scored as follows:
Essentially correct (E) if the response provides the correct numerical answer, as a decimal or as a fraction, with work shown. Partially correct (P) if the response provides the correct numerical answer as a decimal but does not show the fraction that produced the answer, OR shows a fraction with the correct numerator but an incorrect denominator, OR shows the correct fraction but computes an incorrect answer. Incorrect (I) if the response does not meet the criteria for E or P.
Section 2 is scored as follows:
Essentially correct (E) if the response identifies a one-sample t-interval for a population mean (either by name or formula) AND also checks both the random sampling and the normality/large sample condition correctly. Note: Any reasonable comment about the normality displayed in the stem-and-leaf plot (or another appropriately sketched plot) is acceptable.
Partially correct (P) if the response identifies the correct procedure AND checks only one of the two conditions correctly OR does not identify the correct procedure but does check both conditions correctly.
Incorrect (I) if the response identifies the correct procedure but does not check conditions correctly OR does not identify the correct procedure and checks at most one condition correctly.
Section 3 is scored as follows:
Essentially correct (E) if the response gives the correct confidence interval. Supporting work is not required, but if included, it must be correct. Partially correct (P) if the response gives an incorrect but reasonable confidence interval with appropriate supporting work shown OR gives a correct confidence interval with incorrect (but appropriate) supporting work shown.
Note: If the response identifies a one-sample z-interval as the correct procedure in Section 2, then the response earns a P in Section 3 if this interval is calculated correctly. Incorrect (I) if the response makes use of an inappropriate procedure for a confidence interval about a population mean.

AP® STATISTICS 2013 SCORING GUIDELINES
© 2013 The College Board. Visit the College Board on the Web: www.collegeboard.org.
Question 1 (continued) Section 4 is scored as follows:
Essentially correct (E) if the response gives a reasonable interpretation of the interval that includes four elements:
1. Estimating a mean 2. Inference about a population 3. 95% confidence 4. Context (lead level/ppm and crows).
Partially correct (P) if the response gives a reasonable interpretation of the interval that includes both of the first two elements and one of the last two elements;
OR if the response gives a correct interpretation of the confidence level in context (lead level/ppm and crows) but does not attempt to interpret the confidence interval. Incorrect (I) if the response does not meet the criteria for an E or a P.
Each essentially correct (E) response counts as 1 point, and a partially correct (P) response counts as ½ point.
4 Complete Response 3 Substantial Response
2 Developing Response 1 Minimal Response If a response is between two scores (for example, 2½ points), use a holistic approach to determine whether to score up or down, depending on the strength of the response and communication.

AP® STATISTICS 2013 SCORING GUIDELINES
© 2013 The College Board.
Visit the College Board on the Web: www.collegeboard.org.
Question 2 Intent of Question The primary goals of this question were to assess a student’s ability to (1) recognize and explain why a particular sampling method is likely to be biased; (2) describe a method for selecting a simple random sample from a population using a computer random number generator; and (3) demonstrate an understanding of the principle of stratification by describing circumstances in which one stratification variable would be better than another. Solution Part (a):
The first 500 students who enter the football stadium were not likely to be representative of the population of all students at the university. In other words, these 500 students were likely to differ systematically from the population with regard to many variables. For example, these 500 students might have more school pride than the population of students as a whole, which might be related to their opinions about the appearance of university buildings and grounds. Perhaps their school pride is related to having more positive opinions about the appearance of university buildings and grounds, in which case the sample proportion of students who were satisfied would be biased toward overestimating the population proportion of students who were satisfied.
Part (b): Obtain a list of all 70,000 students at the university. Assign an identification number from 1 to 70,000 to each student. Then use a computer to generate 500 random integers between 1 and 70,000 without replacement. The students whose ID numbers correspond to those numbers were then selected for the sample.
Part (c):
Stratifying by campus would be more advantageous than stratifying by gender provided that opinions about appearance of university buildings and grounds between the two campuses differ more than the opinions about appearance of university buildings and grounds between the two genders.
Scoring Parts (a), (b), and (c) were scored as essentially correct (E), partially correct (P), or incorrect (I). Part (a) is scored as follows:
Essentially correct (E) if the response correctly includes the following three components:
1. Provides a reasonable explanation for why the sample might not be representative of the population;
2. Mentions a link between the nonrepresentative nature of the convenience sample and the variable of interest (opinion about appearance of university buildings and grounds);
AP® STATISTICS 2013 SCORING GUIDELINES
© 2013 The College Board.
Visit the College Board on the Web: www.collegeboard.org.
Question 2 (continued)
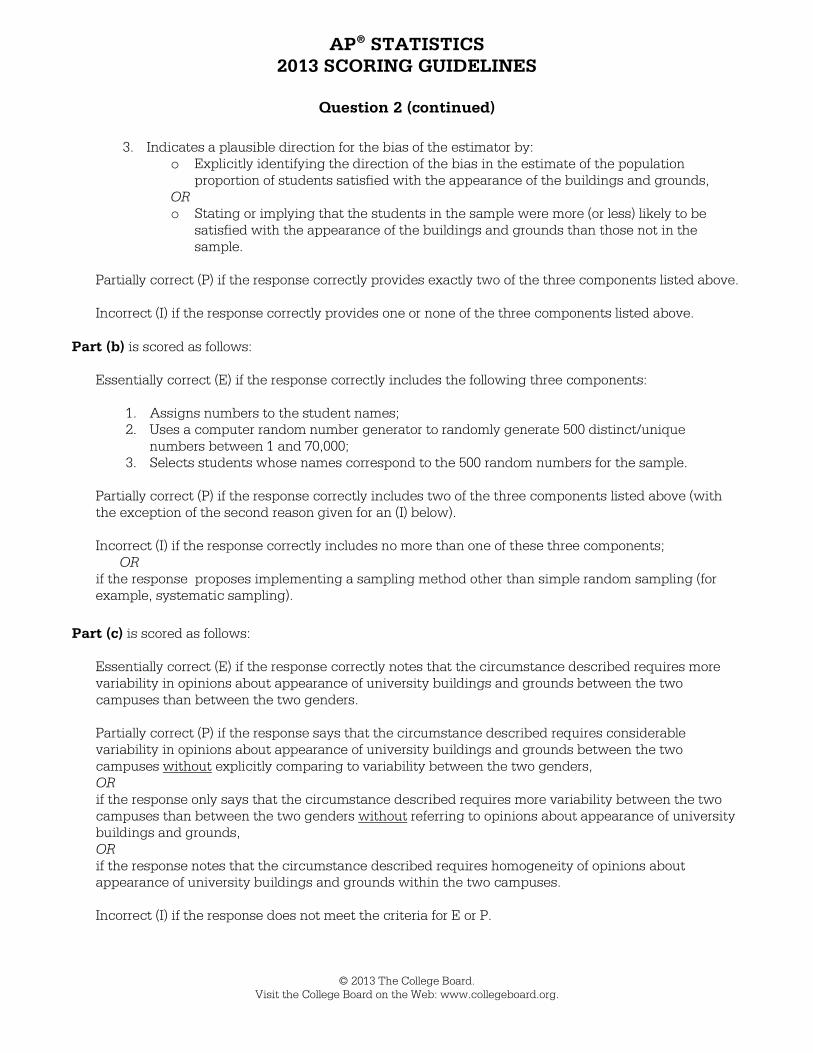
3. Indicates a plausible direction for the bias of the estimator by: o Explicitly identifying the direction of the bias in the estimate of the population
proportion of students satisfied with the appearance of the buildings and grounds, OR o Stating or implying that the students in the sample were more (or less) likely to be
satisfied with the appearance of the buildings and grounds than those not in the sample.
Partially correct (P) if the response correctly provides exactly two of the three components listed above.
Incorrect (I) if the response correctly provides one or none of the three components listed above.
Part (b) is scored as follows:
Essentially correct (E) if the response correctly includes the following three components:
1. Assigns numbers to the student names; 2. Uses a computer random number generator to randomly generate 500 distinct/unique
numbers between 1 and 70,000; 3. Selects students whose names correspond to the 500 random numbers for the sample.
Partially correct (P) if the response correctly includes two of the three components listed above (with the exception of the second reason given for an (I) below). Incorrect (I) if the response correctly includes no more than one of these three components;
OR if the response proposes implementing a sampling method other than simple random sampling (for example, systematic sampling).
Part (c) is scored as follows:
Essentially correct (E) if the response correctly notes that the circumstance described requires more variability in opinions about appearance of university buildings and grounds between the two campuses than between the two genders. Partially correct (P) if the response says that the circumstance described requires considerable variability in opinions about appearance of university buildings and grounds between the two campuses without explicitly comparing to variability between the two genders, OR if the response only says that the circumstance described requires more variability between the two campuses than between the two genders without referring to opinions about appearance of university buildings and grounds, OR if the response notes that the circumstance described requires homogeneity of opinions about appearance of university buildings and grounds within the two campuses. Incorrect (I) if the response does not meet the criteria for E or P.

AP® STATISTICS 2013 SCORING GUIDELINES
© 2013 The College Board.
Visit the College Board on the Web: www.collegeboard.org.
Question 2 (continued) 4 Complete Response All three parts essentially correct 3 Substantial Response
Two parts essentially correct and one part partially correct
2 Developing Response
Two parts essentially correct and one part incorrect OR One part essentially correct and one or two parts partially correct OR Three parts partially correct
1 Minimal Response
One part essentially correct and two parts incorrect OR Two parts partially correct and one part incorrect
AP® STATISTICS 2013 SCORING GUIDELINES
© 2013 The College Board. Visit the College Board on the Web: www.collegeboard.org
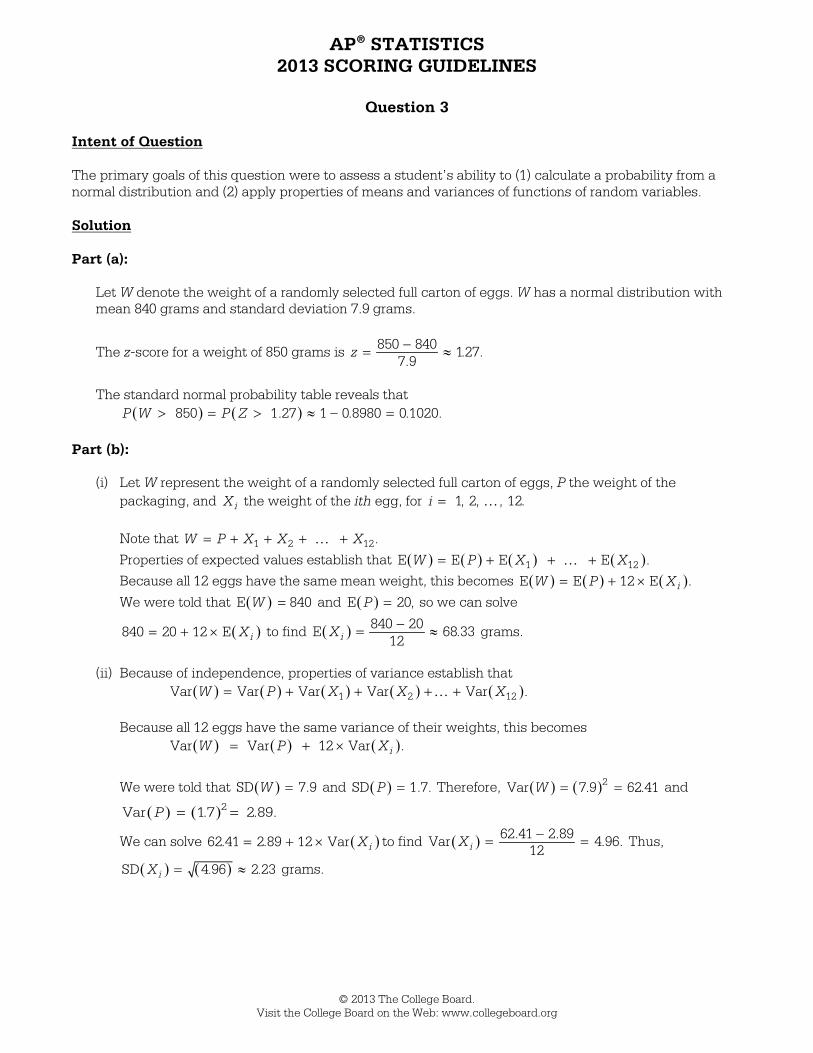
Question 3 Intent of Question The primary goals of this question were to assess a student’s ability to (1) calculate a probability from a normal distribution and (2) apply properties of means and variances of functions of random variables. Solution Part (a):
Let W denote the weight of a randomly selected full carton of eggs. W has a normal distribution with mean 840 grams and standard deviation 7.9 grams.
The z-score for a weight of 850 grams is −= ≈850 840 1.27.7.9
z
The standard normal probability table reveals that
( ) ( )> = > ≈ = 850 1.27 1 – 0.8980 0.1020.P W P Z
Part (b): (i) Let W represent the weight of a randomly selected full carton of eggs, P the weight of the
packaging, and iX the weight of the ith egg, for = … 1, 2, , 12.i
Note that = + + + … +1 2 12 .W P X X X
Properties of expected values establish that ( ) ( ) ( ) ( )= + + … +1 12E E E E .W P X X
Because all 12 eggs have the same mean weight, this becomes ( ) ( ) ( )= + ×E E 12 E .iW P X
We were told that ( )E = 840W and ( ) =E 20,P so we can solve
( )= + ×840 20 12 E iX to find ( ) −= ≈840 20E 68.3312iX grams.
(ii) Because of independence, properties of variance establish that
( ) ( ) ( ) ( ) ( )= + + +… +1 2 12Var Var Var Var Var .W P X X X Because all 12 eggs have the same variance of their weights, this becomes
( ) ( ) ( )= + ×Var Var 12 Var .iW P X
We were told that ( )SD 7.9W = and ( )SD 1.7.P = Therefore, ( ) ( )= =2Var 7.9 62.41W and
( ) ( )2Var = 1.7 = 2.89.P
We can solve ( )= + ×62.41 2.89 12 Var iX to find ( ) 62.41 2.89Var 4.96.12iX −= = Thus,
( ) ( )= ≈SD 4.96 2.23iX grams.
AP® STATISTICS 2013 SCORING GUIDELINES
© 2013 The College Board. Visit the College Board on the Web: www.collegeboard.org
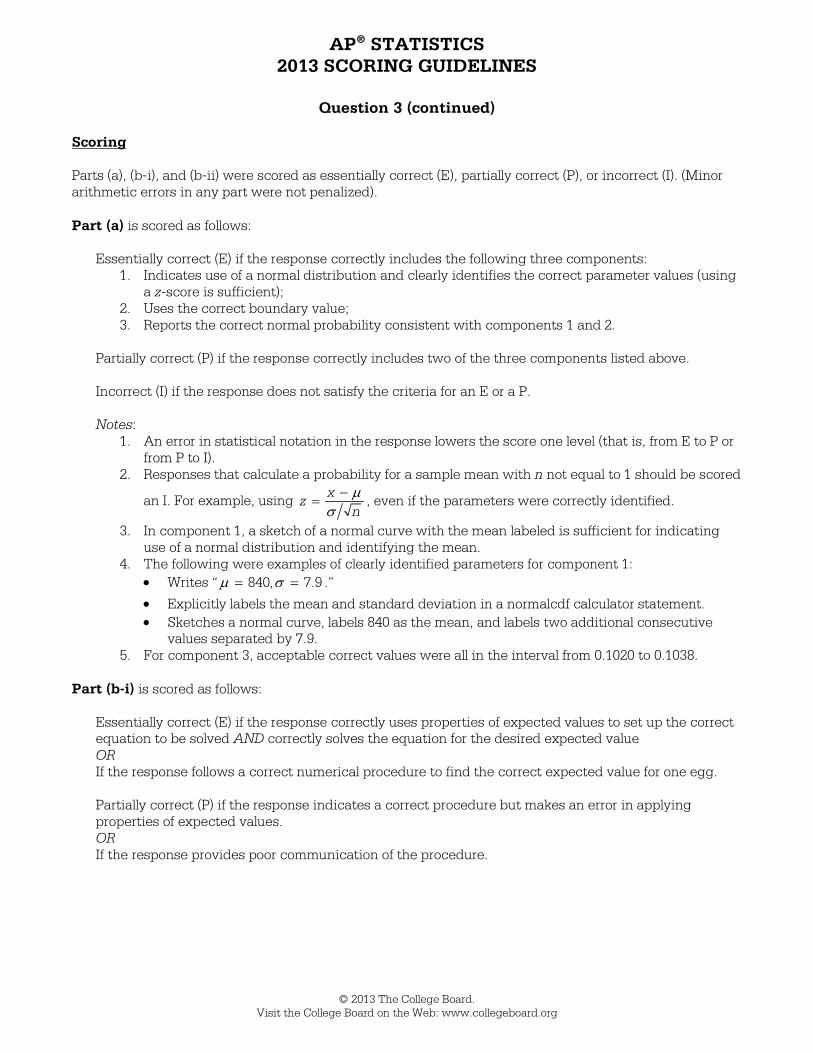
Question 3 (continued) Scoring Parts (a), (b-i), and (b-ii) were scored as essentially correct (E), partially correct (P), or incorrect (I). (Minor arithmetic errors in any part were not penalized). Part (a) is scored as follows:
Essentially correct (E) if the response correctly includes the following three components: 1. Indicates use of a normal distribution and clearly identifies the correct parameter values (using
a z-score is sufficient); 2. Uses the correct boundary value; 3. Reports the correct normal probability consistent with components 1 and 2.
Partially correct (P) if the response correctly includes two of the three components listed above. Incorrect (I) if the response does not satisfy the criteria for an E or a P. Notes:
1. An error in statistical notation in the response lowers the score one level (that is, from E to P or from P to I).
2. Responses that calculate a probability for a sample mean with n not equal to 1 should be scored
an I. For example, using µ
σ−= x
zn
, even if the parameters were correctly identified.
3. In component 1, a sketch of a normal curve with the mean labeled is sufficient for indicating use of a normal distribution and identifying the mean.
4. The following were examples of clearly identified parameters for component 1: • Writes “ µ σ= =840, 7.9 .”
• Explicitly labels the mean and standard deviation in a normalcdf calculator statement. • Sketches a normal curve, labels 840 as the mean, and labels two additional consecutive
values separated by 7.9. 5. For component 3, acceptable correct values were all in the interval from 0.1020 to 0.1038.
Part (b-i) is scored as follows:
Essentially correct (E) if the response correctly uses properties of expected values to set up the correct equation to be solved AND correctly solves the equation for the desired expected value OR If the response follows a correct numerical procedure to find the correct expected value for one egg. Partially correct (P) if the response indicates a correct procedure but makes an error in applying properties of expected values. OR If the response provides poor communication of the procedure.
AP® STATISTICS 2013 SCORING GUIDELINES
© 2013 The College Board. Visit the College Board on the Web: www.collegeboard.org
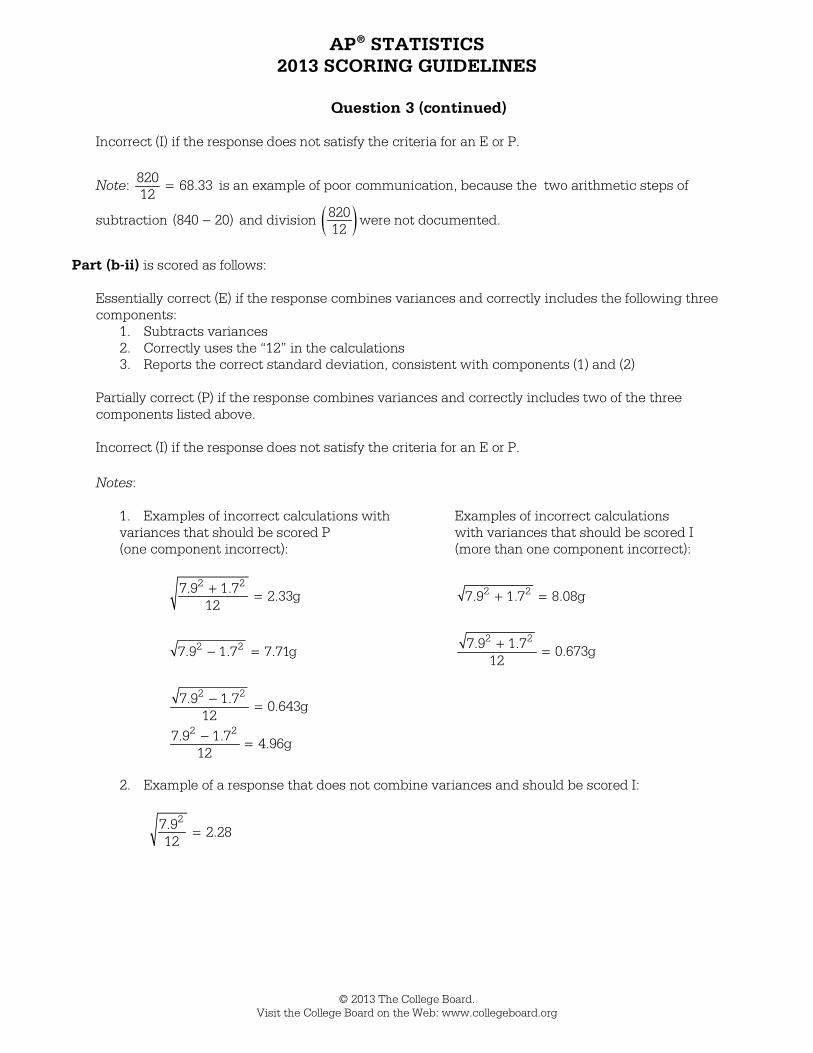
Question 3 (continued)
Incorrect (I) if the response does not satisfy the criteria for an E or P.
Note: 820 68.3312
= is an example of poor communication, because the two arithmetic steps of
subtraction (840 20)− and division ( )82012
were not documented.
Part (b-ii) is scored as follows:
Essentially correct (E) if the response combines variances and correctly includes the following three components:
1. Subtracts variances 2. Correctly uses the “12” in the calculations 3. Reports the correct standard deviation, consistent with components (1) and (2)
Partially correct (P) if the response combines variances and correctly includes two of the three components listed above. Incorrect (I) if the response does not satisfy the criteria for an E or P. Notes:
1. Examples of incorrect calculations with Examples of incorrect calculations variances that should be scored P with variances that should be scored I (one component incorrect): (more than one component incorrect):
+ =2 27.9 1.7 2.33g
12 + =2 27.9 1.7 8.08g
− =2 27.9 1.7 7.71g + =2 27.9 1.7 0.673g12
− =2 27.9 1.7 0.643g12
− =2 27.9 1.7 4.96g
12
2. Example of a response that does not combine variances and should be scored I:
=27.9 2.28
12
AP® STATISTICS 2013 SCORING GUIDELINES
© 2013 The College Board. Visit the College Board on the Web: www.collegeboard.org
Question 3 (continued)
4 Complete Response All three parts essentially correct 3 Substantial Response
Two parts essentially correct and one part partially correct OR
One part essentially correct and two parts partially correct
2 Developing Response
Two parts essentially correct and one part incorrect OR
One part essentially correct, one part partially correct, and one part incorrect
OR Three parts partially correct
1 Minimal Response
One part essentially correct and two parts incorrect OR
One or two parts partially correct

AP® STATISTICS 2013 SCORING GUIDELINES
© 2013 The College Board. Visit the College Board on the Web: www.collegeboard.org
Question 4 Intent of Question The primary goal of this question was to assess students’ ability to identify, set up, perform, and interpret the results of an appropriate hypothesis test to address a particular question. More specific goals were to assess students’ ability to (1) state appropriate hypotheses; (2) identify the appropriate statistical test procedure and check appropriate conditions for inference; (3) calculate the appropriate test statistic and p-value; and (4) draw an appropriate conclusion, with justification, in the context of the study. Solution Step 1: States a correct pair of hypotheses.
The null hypothesis is that fruit and vegetable consumption is independent of (that is, it is not associated with) age group for the population of adults in the United States. The alternative hypothesis is that fruit and vegetable consumption is not independent of (that is, it is associated with) age group for the population of adults in the United States.
Step 2: Identifies a correct test procedure (by name or by formula) and checks appropriate conditions.
The appropriate test is a chi-square test of independence. The conditions for this test were satisfied because: 1. The question states that the sample was randomly selected. 2. The expected counts for all six cells of the table were all at least 5, as seen in the following table
that lists expected counts in parentheses beside the observed counts:
Five or more servings of
fruit and vegetables
Four or fewer servings of fruit and vegetables
Total
18–34 years 231 (240.2) 741 (731.8) 972 35–54 years 669 (719.4) 2242 (2191.6) 2911 55+ years 1291 (1231.4) 3692 (3751.6) 4983 Total 2191 6675 8866
Step 3: Correct mechanics, including the value of the test statistic and p-value (or rejection region).
The test statistic is calculated from ( )22 ;O E
Eχ −= ∑ that is,
χ = + + + + + =2 0.353 0.116 3.528 1.158 2.883 0.946 8.983.
The p-value is χ ≥ =2( 8.983) 0.011,P based on ( ) ( )3 1 2 1 2− × − = degrees of freedom.

AP® STATISTICS 2013 SCORING GUIDELINES
© 2013 The College Board. Visit the College Board on the Web: www.collegeboard.org
Question 4 (continued)
Step 4: States a correct conclusion in the context of the study, using the result of the statistical test.
Because the p-value is very small (for instance, much smaller than α = 0.05 ), we would reject the null hypothesis at the 0.05 level and conclude that the sample data provide strong evidence that there is an association between age group and consumption of fruits and vegetables for adults in the United States. In particular, older (55+ years of age) people were more likely to eat five or more servings of fruits and vegetables, and middle-aged people (35–54 years of age) were less likely to eat five or more servings of fruits and vegetables.
Scoring Each of steps 1, 2, 3, and 4 were scored as essentially correct (E), partially correct (P), or incorrect (I). Step 1 is scored as follows:
Essentially correct (E) if the response correctly states both hypotheses with at least one in context.
Partially correct (P) if the response correctly states both hypotheses but not in context, OR the hypotheses were reversed with at least one stated in context.
Incorrect (I) if the response does not meet the criteria for E or P.
Notes:
• If the hypotheses contain language that suggests that the response refers to the sample data, step
1 is scored as incorrect (I).
• If the null and alternative hypotheses were correctly stated in terms of population proportions, step 1 is scored essentially correct (E):
1 2 30H : p pp = = , where ip is the population proportion of adults at the indicated age group, 1, 2, or 3, who eat at least 5 servings of fruits and vegetables. H :a At least one of the population proportions, 1 2 3, ,p p p , differs from the other two OR H :a The population proportions for the three age groups were not the same
Step 2 is scored as follows:
Essentially correct (E) if the response correctly includes the following three components:
1. Identifies a chi-square test of independence by name or by formula for the chi-square test statistic.
2. States AND verifies the random sampling condition. 3. States AND verifies the technical condition that all expected counts were greater than 5.

AP® STATISTICS 2013 SCORING GUIDELINES
© 2013 The College Board. Visit the College Board on the Web: www.collegeboard.org
Question 4 (continued)
Partially correct (P) if the response correctly includes two of the three components listed above. Incorrect (I) if the response does not meet the criteria for E or P.
Notes:
• If the response identifies the test procedure as a chi-square test of homogeneity of proportions, step 2 does not receive credit for component 1.
• If the response identifies the correct test procedure but gives an incorrect formula for the test statistic, then this is considered a contradiction and does not meet the criteria for component 1.
• Stating the condition that the expected counts must be greater than 5 is not in itself sufficient
for satisfying component 3; the condition must be checked by reporting expected counts, or minimally reporting the value of the smallest expected count and indicating that it is at least 5.
• If the response includes an incorrect technical condition, such as “ ≥ 30n ” or “normality,” then
this will be considered a parallel solution and credit will not be granted for component 3.
• If the response states and verifies the condition that 80 percent of all expected counts must be ≥ 5 and all expected counts must be≥ 1, then the response can receive credit for component 3.
Step 3 is scored as follows:
Essentially correct (E) if the response correctly calculates the following two components: 1. Test statistic 2. p-value or critical value
Partially correct (P) if the response correctly calculates one of the two components listed above. Incorrect (I) if the response does not meet the criteria for E or P. Notes:
• When a response has an error in one calculation, future calculations were considered correct if they follow correctly from the initial miscalculation.
• The correct critical value is 5.99 for a significance level of 0.05. Step 4 is scored as follows:
Essentially correct (E) if the response correctly includes the following three components: 1. A correct conclusion 2. Justification of the conclusion based on linkage between the p-value and conclusion (or linkage
between test statistic and critical value) 3. The conclusion is stated in context

AP® STATISTICS 2013 SCORING GUIDELINES
© 2013 The College Board. Visit the College Board on the Web: www.collegeboard.org
Question 4 (continued) Partially correct (P) if the response includes a correct conclusion and one of the other two components listed above. Incorrect (I) if the response does not provide a correct conclusion or is missing both linkage and context.
Notes:
• If the conclusion is consistent with an incorrect p-value from step 3, stated in context, and has justification based on linkage to the p-value, then step 4 is scored as E.
• To meet the criteria for component 1, the conclusion must be consistent with the hypotheses. • If the response does not have linkage between the p-value and conclusion, then in order to
meet the criteria for component 1, the conclusion must be correct based on a 0.05 level of significance.
• If no significance level, ,α is given, then in order to meet the criteria for the linkage component, the solution must explain how the conclusion follows from the p-value such as saying: “Because the p-value is small, we reject the null hypothesis” or “Because the p-value is large, we do not reject the null hypothesis.”
• A p-value interpretation, in terms of the probability of obtaining a sample result as or more extreme as the observed result if the null hypothesis were true, does not in itself meet the criteria for the linkage component. A response with an incorrect interpretation of the p-value lowers the score one level (that is, from E to P, or from P to I)
• A response that states the alternative hypothesis has been proven lowers the score one level (that is, from E to P, or from P to I)
• A response including incorrect statistical language lowers the score one level (that is, from E to P, or from P to I)
Each essentially correct (E) step counts as 1 point, and a partially correct (P) step in counts as ½ point.
4 Complete Response 3 Substantial Response
2 Developing Response
1 Minimal Response If a response is between two scores (for example, 2½ points), use a holistic approach to determine whether to score up or down, depending on the strength of the response and communication.

AP® STATISTICS 2013 SCORING GUIDELINES
© 2013 The College Board. Visit the College Board on the Web: www.collegeboard.org.
Question 5 Intent of Question The primary goals of this question were to assess a student’s ability to (1) recognize the limited conclusions that can be drawn from an observational study; (2) determine whether a condition for applying a particular inference procedure is satisfied; and (3) draw an inferential conclusion from a simulation analysis. Solution Part (a):
No, it would not be reasonable to conclude that meditation causes a reduction in blood pressure for men in the retirement community. Because this is an observational study and not an experiment, no cause-and-effect relationship between meditation and lower blood pressure can be inferred. It is quite possible that men who choose to meditate could differ from men who do not choose to meditate in other ways that were also associated with blood pressure.
Part (b): The sample sizes were too small, relative to the overall sample proportion of successes, to justify using a normal approximation. One way to check this is to note that the combined sample proportion of
successes is +
= = ≈+
0 8 8ˆ 0.286,
11 17 28p so neither = × ≈
8ˆ 11 3.143
28mn p nor = × ≈
8ˆ 17 4.857
28cn p is at
least 10. Part (c):
The observed value of the sample statistic −ˆ ˆm cp p is − ≈ −
0 80.47.
11 17 The graph of simulation results
reveals that a difference of –0.47 or more extreme was very rare. In fact, the value –0.47 was the smallest possible outcome and occurred in only 76 of the 10,000 repetitions in the simulation. Thus, assuming that all men in the retirement community were equally likely to have high blood pressure whether they meditate or not, there is an approximate probability of 0.0076 of getting a difference of −0.47 or smaller by chance alone. Because this approximate p-value is very small, there is convincing evidence that men in this retirement community who meditate were less likely to have high blood pressure than men in this retirement community who do not meditate. However, because this is an observational study, even though we can conclude that meditation is associated with a lower chance of having high blood pressure, we cannot conclude that meditation causes a reduction in the likeliness of having high blood pressure.
AP® STATISTICS 2013 SCORING GUIDELINES
© 2013 The College Board. Visit the College Board on the Web: www.collegeboard.org.
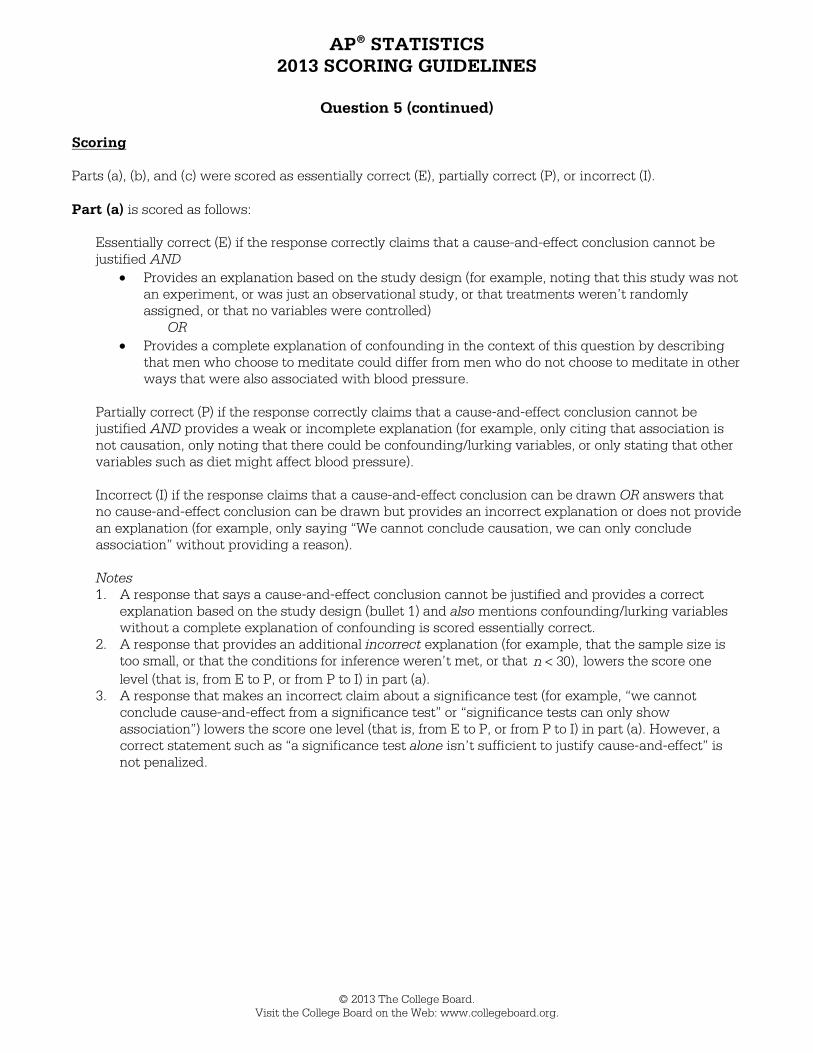
Question 5 (continued) Scoring Parts (a), (b), and (c) were scored as essentially correct (E), partially correct (P), or incorrect (I). Part (a) is scored as follows:
Essentially correct (E) if the response correctly claims that a cause-and-effect conclusion cannot be justified AND
• Provides an explanation based on the study design (for example, noting that this study was not an experiment, or was just an observational study, or that treatments weren’t randomly assigned, or that no variables were controlled)
OR • Provides a complete explanation of confounding in the context of this question by describing
that men who choose to meditate could differ from men who do not choose to meditate in other ways that were also associated with blood pressure.
Partially correct (P) if the response correctly claims that a cause-and-effect conclusion cannot be justified AND provides a weak or incomplete explanation (for example, only citing that association is not causation, only noting that there could be confounding/lurking variables, or only stating that other variables such as diet might affect blood pressure).
Incorrect (I) if the response claims that a cause-and-effect conclusion can be drawn OR answers that no cause-and-effect conclusion can be drawn but provides an incorrect explanation or does not provide an explanation (for example, only saying “We cannot conclude causation, we can only conclude association” without providing a reason).
Notes 1. A response that says a cause-and-effect conclusion cannot be justified and provides a correct
explanation based on the study design (bullet 1) and also mentions confounding/lurking variables without a complete explanation of confounding is scored essentially correct.
2. A response that provides an additional incorrect explanation (for example, that the sample size is too small, or that the conditions for inference weren’t met, or that < 30),n lowers the score one level (that is, from E to P, or from P to I) in part (a).
3. A response that makes an incorrect claim about a significance test (for example, “we cannot conclude cause-and-effect from a significance test” or “significance tests can only show association”) lowers the score one level (that is, from E to P, or from P to I) in part (a). However, a correct statement such as “a significance test alone isn’t sufficient to justify cause-and-effect” is not penalized.

AP® STATISTICS 2013 SCORING GUIDELINES
© 2013 The College Board. Visit the College Board on the Web: www.collegeboard.org.
Question 5 (continued) Part (b) is scored as follows:
Essentially correct (E) if the response indicates that at least one observed or expected count is too small AND includes the following three components:
• States the numerical value of at least one of the relevant observed or expected counts of successes or failures for one of the two groups
• Clearly labels/identifies the count using words (for example, number of meditators who have high blood pressure), symbols with at least one subscript (for example, ,
ˆm mn p ,
ˆmnp ),mnp or
evidence of calculation (for example, ×0
11 ).11
• Correctly compares this count to a reasonable boundary (for example, 5 or 10, but not 30) Partially correct (P) if the response indicates that at least one observed or expected count is too small AND includes exactly two of the three components listed above. Incorrect (I) if the response does not satisfy the criteria for E or P Notes • If the response correctly discusses other conditions for a two-sample z test for a difference in
proportions, these should be ignored. However, if the response makes an incorrect statement about the conditions (for example, the sample size should be greater than 30, the population is/should be Normal, the sample is/should be Normal), then the response lowers the score one level (that is, from E to P, or from P to I) in part (b). Summary statements about the sample size (for example, “the sample size is too small”) were not penalized because they were not proposing an additional condition.
• Any statement about conditions for performing inference in part (a) should not be considered in part (b).
Part (c) is scored as follows:
Essentially correct (E) if the response provides evidence that the difference in the sample proportions − ≈ −ˆ ˆ 0.47m cp p was calculated AND clearly uses the results of the simulation AND includes the
following two components: • States that values less than or equal to –0.47 were very unlikely, by comparing 0.0076 to a
common significance level or saying that a difference of –0.47 or less is very unlikely.
• Draws an appropriate conclusion in context.
Partially correct (P) if the response provides evidence that the difference in the sample proportions was calculated AND clearly uses the results of the simulation AND includes exactly one of the two components listed above.
Incorrect (I) if the response does not satisfy the criteria for E or P.
Note: • If the response subtracts the sample proportions in the opposite order, calculates the difference to
be +0.47, and uses the right side of the simulated distribution correctly, then the response is essentially correct if it also includes the two components listed above.
AP® STATISTICS 2013 SCORING GUIDELINES
© 2013 The College Board. Visit the College Board on the Web: www.collegeboard.org.
Question 5 (continued)
4 Complete Response All three parts essentially correct 3 Substantial Response
Two parts essentially correct and one part partially correct
2 Developing Response
Two parts essentially correct and one part incorrect OR One part essentially correct and one or two parts partially correct OR Three parts partially correct
1 Minimal Response
One part essentially correct and two parts incorrect OR One or two parts partially correct

AP® STATISTICS 2013 SCORING GUIDELINES
© 2013 The College Board. Visit the College Board on the Web: www.collegeboard.org.
Question 6 Intent of Question The primary goals of this question were to assess a student’s ability to (1) summarize information provided in a time plot that involves trend components; (2) perform calculations related to a summary statistic not previously studied; and (3) compare and contrast information conveyed by the summary statistics with the data. Solution Part (a):
The Western Pacific Ocean had more typhoons than the Eastern Pacific Ocean in all but one of these years. The average seems to have been about 31 typhoons per year in the Western Pacific Ocean, which is higher than the average of about 19 typhoons per year in the Eastern Pacific Ocean. The Western Pacific Ocean also saw more variability (in number of typhoons per year) than the Eastern Pacific Ocean; for example, the range of the frequencies for the Western Pacific is about 21 typhoons and only 10 typhoons for the Eastern Pacific.
Part (b): The Western Pacific Ocean had a decreasing trend in number of typhoons per year over this time period, especially from about 2001 through 2010. In contrast, the Eastern Pacific Ocean was fairly consistent in the number of typhoons per year over this time period, with a slight increasing trend in the later years from 2005 through 2010.
Part (c):
The four-year moving average for the year 2010 in the Western Pacific Ocean is 28 27 28 18 25.25.
4+ + + =
The value is written in the table as follows.
.
. . . . .
.
. . . . .
.
. . 2008 20 20.25 27 28.75 2009 23 21.75 28 29.25 2010 18 20.00 18 25.25

AP® STATISTICS 2013 SCORING GUIDELINES
© 2013 The College Board. Visit the College Board on the Web: www.collegeboard.org.
Question 6 (continued) Part (d):
Part (e):
(i) The overall trends across this time period were more apparent with the moving averages than with the original frequencies. The moving averages reduce variability, making more apparent the overall decreasing trend in number of typhoons in the Western Pacific Ocean and the slight increasing trend in the number of typhoons in the Eastern Pacific Ocean.
(ii) The year-to-year variability in number of typhoons is less apparent with the moving averages than
with the original frequencies. Scoring This question is scored in four sections: Section 1 consists of part (a); section 2 consists of part (b); section 3 consists of parts (c) and (d); and section 4 consists of part (e). Each of the four sections is scored as essentially correct (E), partially correct (P), or incorrect (I). Section 1 is scored as follows:
Essentially correct (E) if the response correctly includes the following three components: 1. A comparison of the center or location of the two distributions of frequencies. 2. A comparison of the variability of the two distributions of frequencies. 3. Comments in context.
Partially correct (P) if the response correctly includes two of the three components listed above. Incorrect (I) if the response does not meet the criteria for E or P. Notes:
• Comparison of frequencies for just a few years of the two regions is not a comparison of the distributions of the frequencies of the two regions.
• Comparisons of the two endpoints in the 1997 and 2010 for both regions were not sufficient for component 2.
AP® STATISTICS 2013 SCORING GUIDELINES
© 2013 The College Board. Visit the College Board on the Web: www.collegeboard.org.
Question 6 (continued)
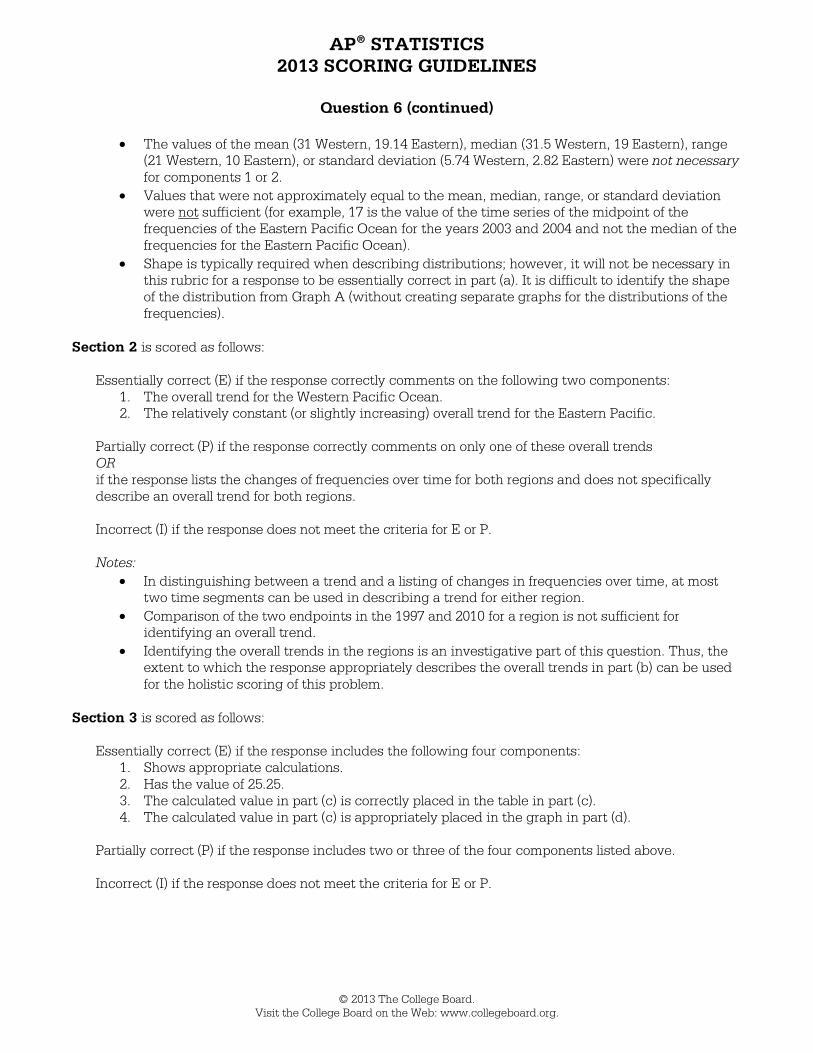
• The values of the mean (31 Western, 19.14 Eastern), median (31.5 Western, 19 Eastern), range (21 Western, 10 Eastern), or standard deviation (5.74 Western, 2.82 Eastern) were not necessary for components 1 or 2.
• Values that were not approximately equal to the mean, median, range, or standard deviation were not sufficient (for example, 17 is the value of the time series of the midpoint of the frequencies of the Eastern Pacific Ocean for the years 2003 and 2004 and not the median of the frequencies for the Eastern Pacific Ocean).
• Shape is typically required when describing distributions; however, it will not be necessary in this rubric for a response to be essentially correct in part (a). It is difficult to identify the shape of the distribution from Graph A (without creating separate graphs for the distributions of the frequencies).
Section 2 is scored as follows:
Essentially correct (E) if the response correctly comments on the following two components: 1. The overall trend for the Western Pacific Ocean. 2. The relatively constant (or slightly increasing) overall trend for the Eastern Pacific.
Partially correct (P) if the response correctly comments on only one of these overall trends OR if the response lists the changes of frequencies over time for both regions and does not specifically describe an overall trend for both regions. Incorrect (I) if the response does not meet the criteria for E or P. Notes:
• In distinguishing between a trend and a listing of changes in frequencies over time, at most two time segments can be used in describing a trend for either region.
• Comparison of the two endpoints in the 1997 and 2010 for a region is not sufficient for identifying an overall trend.
• Identifying the overall trends in the regions is an investigative part of this question. Thus, the extent to which the response appropriately describes the overall trends in part (b) can be used for the holistic scoring of this problem.
Section 3 is scored as follows:
Essentially correct (E) if the response includes the following four components: 1. Shows appropriate calculations. 2. Has the value of 25.25. 3. The calculated value in part (c) is correctly placed in the table in part (c). 4. The calculated value in part (c) is appropriately placed in the graph in part (d).
Partially correct (P) if the response includes two or three of the four components listed above. Incorrect (I) if the response does not meet the criteria for E or P.
AP® STATISTICS 2013 SCORING GUIDELINES
© 2013 The College Board. Visit the College Board on the Web: www.collegeboard.org.
Question 6 (continued) Notes:
• In completing the graph, it is not necessary to draw the line connecting the calculated moving average in part (c) for 2010 to the moving average value for 2009.
• An incorrect value in part (c) can be used to obtain component 3 or component 4. • An appropriately placed value on the graph for component 4 requires the placement on the
graph close to 2010 and at or slightly above the 25 yearly frequency line. • The severity of the mistakes resulting in a partially correct response can be used in holistic
scoring for this question. Section 4 is scored as follows:
Essentially correct (E) if the response includes the following three components:
1. Correctly mentions overall trend in regards to the moving averages graph in at least one region. 2. Correctly identifies some characteristic of the data that is less apparent by not having
individual frequencies of the typhoons. 3. Correctly links at least one of the previous two components to the time plot in this specific
question.
Partially correct (P) if the response has exactly two of the three components.
Incorrect (I) if the response does not meet the criteria for E or P. Notes:
• Stating that the frequencies were not determinable from the graph of moving averages is not sufficient for describing a less apparent characteristic of the data.
• If the response in part (e) can be applied to any plot of 4-year moving averages, then component 3 (linkage to the time plot in this specific question) is not achieved.
• Because moving averages decrease variability, which may make identifying trends easier, clear communication (for example identifying direction of the trend) in describing the trend or the decreased variability for these data can be used for the holistic scoring of this question.
Each essentially correct (E) section counts as 1 point, and a partially correct (P) section counts as ½ point.
4 Complete Response 3 Substantial Response
2 Developing Response
1 Minimal Response If a response is between two scores (for example, 2½ points), use a holistic approach to determine whether to score up or down, depending on the overall strength of the response and communication. See notes following sections 2, 3, and 4 for additional guidance in holistic scoring of this question.