AP Revision Guide Ch 3 - AS-A2-Physics · Revision Guide for Chapter 3 ... Revision Notes: Noise...
25
3 Signalling Revision Guide for Chapter 3 Contents Student’s Checklist Revision Notes Superposing signals .................................................................................................................. 4 Spectrum of a signal .................................................................................................................. 6 Analogue signals ....................................................................................................................... 8 Digital sampling ......................................................................................................................... 9 Analogue to digital conversion................................................................................................. 10 Noise........................................................................................................................................ 11 Polarisation .............................................................................................................................. 12 Bandwidth ................................................................................................................................ 13 Amount and rate of transmission of information ...................................................................... 14 Radio waves ............................................................................................................................ 14 Summary Diagrams (OHTs) Atlas of sound spectra ............................................................................................................. 16 Signal sampling ....................................................................................................................... 19 Digitising samples .................................................................................................................... 20 Effect of noise on analogue and digital signals ....................................................................... 21 Polarisation: mechanical analogue .......................................................................................... 22 Signal bands for communications............................................................................................ 23 Sending a fax ........................................................................................................................... 24 Sending e-mail ......................................................................................................................... 25 Advancing Physics AS 1
Transcript of AP Revision Guide Ch 3 - AS-A2-Physics · Revision Guide for Chapter 3 ... Revision Notes: Noise...
3 Signalling
Revision Guide for Chapter 3 Contents Student’s Checklist Revision Notes Superposing signals .................................................................................................................. 4 Spectrum of a signal .................................................................................................................. 6 Analogue signals ....................................................................................................................... 8 Digital sampling ......................................................................................................................... 9 Analogue to digital conversion................................................................................................. 10 Noise........................................................................................................................................ 11 Polarisation .............................................................................................................................. 12 Bandwidth ................................................................................................................................ 13 Amount and rate of transmission of information...................................................................... 14 Radio waves ............................................................................................................................ 14 Summary Diagrams (OHTs) Atlas of sound spectra ............................................................................................................. 16 Signal sampling ....................................................................................................................... 19 Digitising samples.................................................................................................................... 20 Effect of noise on analogue and digital signals ....................................................................... 21 Polarisation: mechanical analogue.......................................................................................... 22 Signal bands for communications............................................................................................ 23 Sending a fax........................................................................................................................... 24 Sending e-mail......................................................................................................................... 25
Advancing Physics AS 1
3 Signalling
Student's Checklist Back to list of Contents
I can show my understanding of effects, ideas and relationships by describing and explaining: how a complex signal (waveform) can be constructed of or broken down into a set of simpler signals (waves) of single, different frequencies Revision Notes: Superposing signals; Spectrum of a signal
how a complex signal (waveform) can be described in terms of the spectrum of frequencies it contains Revision Notes: Spectrum of a signal Summary Diagrams: Atlas of sound spectra
how a continuous signal can be digitised Revision Notes: Analogue signals; Digital sampling; Analogue to digital conversion Summary Diagrams: Signal sampling; Digitising samples;
how a digitised signal has an important advantage in its ability to reduce the noise in the signal Revision Notes: Noise Summary Diagrams: Effect of noise on analogue and digital signals
how there may be some loss of detail in a digitised signal if sampling is not frequent enough Revision Notes: Digital sampling
the evidence for electromagnetic waves being transverse waves, and how this feature allows them to be polarized Revision Notes: Polarisation Summary Diagrams: Polarisation – mechanical analogue
I can use the following words and phrases accurately when describing effects and observations: analogue signal, digital sampling, sampling frequency (sampling rate), amplitude, spectrum, bandwidth, superposition Revision Notes: Analogue signals; Digital sampling; Analogue to digital conversion; Spectrum of a signal; Bandwidth; Superposing signals; Summary Diagrams: Signal sampling; Digitising signals
polarization Revision Notes: Polarisation Summary Diagrams: Polarisation – mechanical analogue
Advancing Physics AS 2
3 Signalling
I can interpret: waveform diagrams i.e. wave amplitude plotted against distance or time Revision Notes: Superposing signals
diagrams of the spectra of waves Revision Notes: Spectrum of a signal Summary Diagrams: Atlas of sound spectra
I can calculate: wavelengths, wave speeds and frequencies by using (and remembering) the relationship v = fλ See Revision Guide Chapter 1
the quantity of information (data) in a signal Revision Notes: Amount and rate of transmission of information
the rate of transmitting information (data) i.e. in bits per second Revision Notes: Amount and rate of transmission of information; Bandwidth
I can give and explain an example of: an application of signal transmission and the demand it makes on the transmission system used Revision Notes: Radio waves; Summary Diagrams: Signal bands for communications; Sending a fax; Sending e-mail
Advancing Physics AS 3

3 Signalling
Revision Notes Back to list of Contents
Superposing signals Signals can be added together to make a new signal. That is, one signal can be superposed on another. Here is an example. Below, you see a small time-slice from a 1000 Hz signal. There is just this one frequency present. The waveform is sinusoidal.
A 1000 Hz signal
Now we will add another signal to the 1000 Hz signal. The added signal will have a frequency three times larger, that is, 3000 Hz. It will have 33% of the amplitude of the 1000 Hz signal. Below you can see first the added 3000 Hz signal, and then the result of combining the two.
Added 3000 Hz signal, with 33% of the amplitude of the 1000 Hz signal
Advancing Physics AS 4
3 Signalling
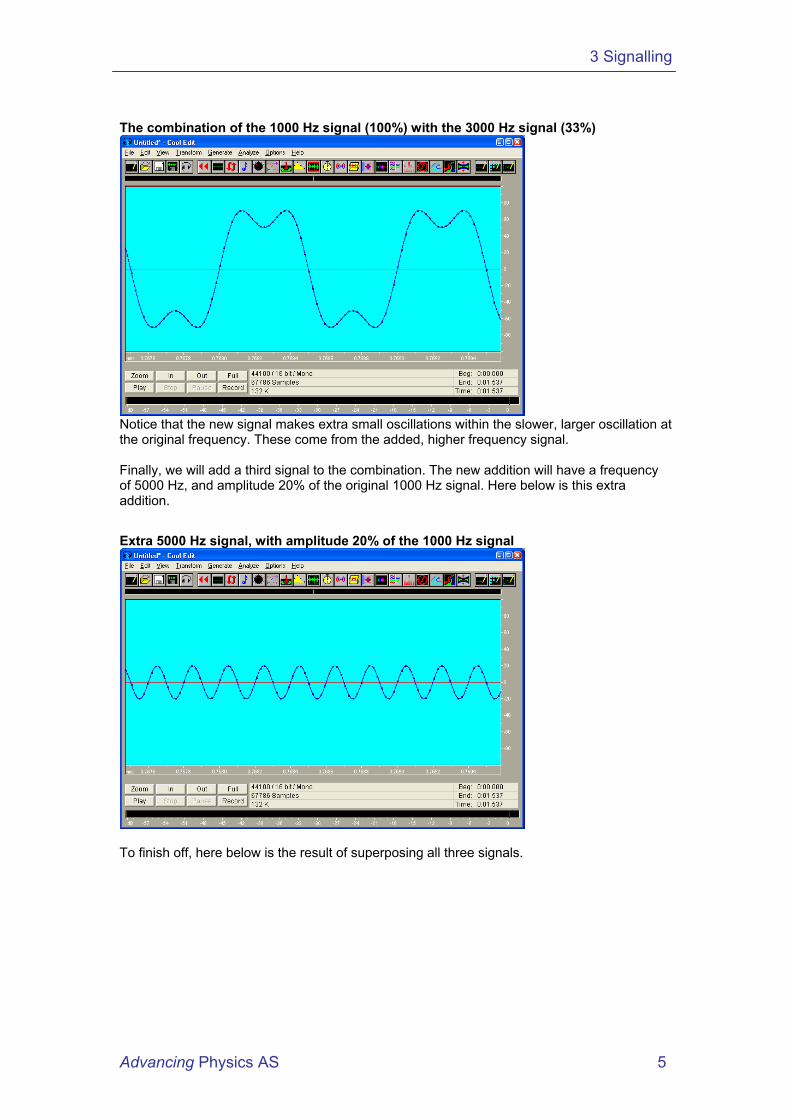
The combination of the 1000 Hz signal (100%) with the 3000 Hz signal (33%)
Notice that the new signal makes extra small oscillations within the slower, larger oscillation at the original frequency. These come from the added, higher frequency signal. Finally, we will add a third signal to the combination. The new addition will have a frequency of 5000 Hz, and amplitude 20% of the original 1000 Hz signal. Here below is this extra addition.
Extra 5000 Hz signal, with amplitude 20% of the 1000 Hz signal
To finish off, here below is the result of superposing all three signals.
Advancing Physics AS 5
3 Signalling
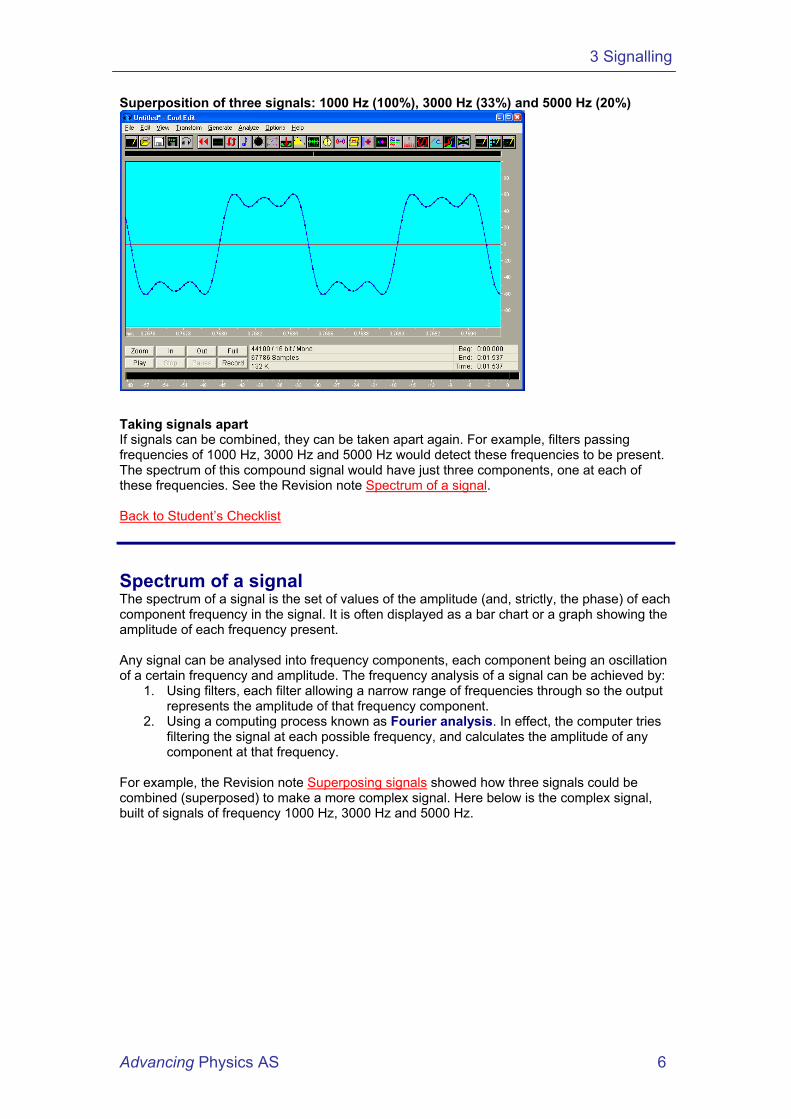
Superposition of three signals: 1000 Hz (100%), 3000 Hz (33%) and 5000 Hz (20%)
Taking signals apart If signals can be combined, they can be taken apart again. For example, filters passing frequencies of 1000 Hz, 3000 Hz and 5000 Hz would detect these frequencies to be present. The spectrum of this compound signal would have just three components, one at each of these frequencies. See the Revision note Spectrum of a signal. Back to Student’s Checklist
Spectrum of a signal The spectrum of a signal is the set of values of the amplitude (and, strictly, the phase) of each component frequency in the signal. It is often displayed as a bar chart or a graph showing the amplitude of each frequency present. Any signal can be analysed into frequency components, each component being an oscillation of a certain frequency and amplitude. The frequency analysis of a signal can be achieved by:
1. Using filters, each filter allowing a narrow range of frequencies through so the output represents the amplitude of that frequency component.
2. Using a computing process known as Fourier analysis. In effect, the computer tries filtering the signal at each possible frequency, and calculates the amplitude of any component at that frequency.
For example, the Revision note Superposing signals showed how three signals could be combined (superposed) to make a more complex signal. Here below is the complex signal, built of signals of frequency 1000 Hz, 3000 Hz and 5000 Hz.
Advancing Physics AS 6
3 Signalling
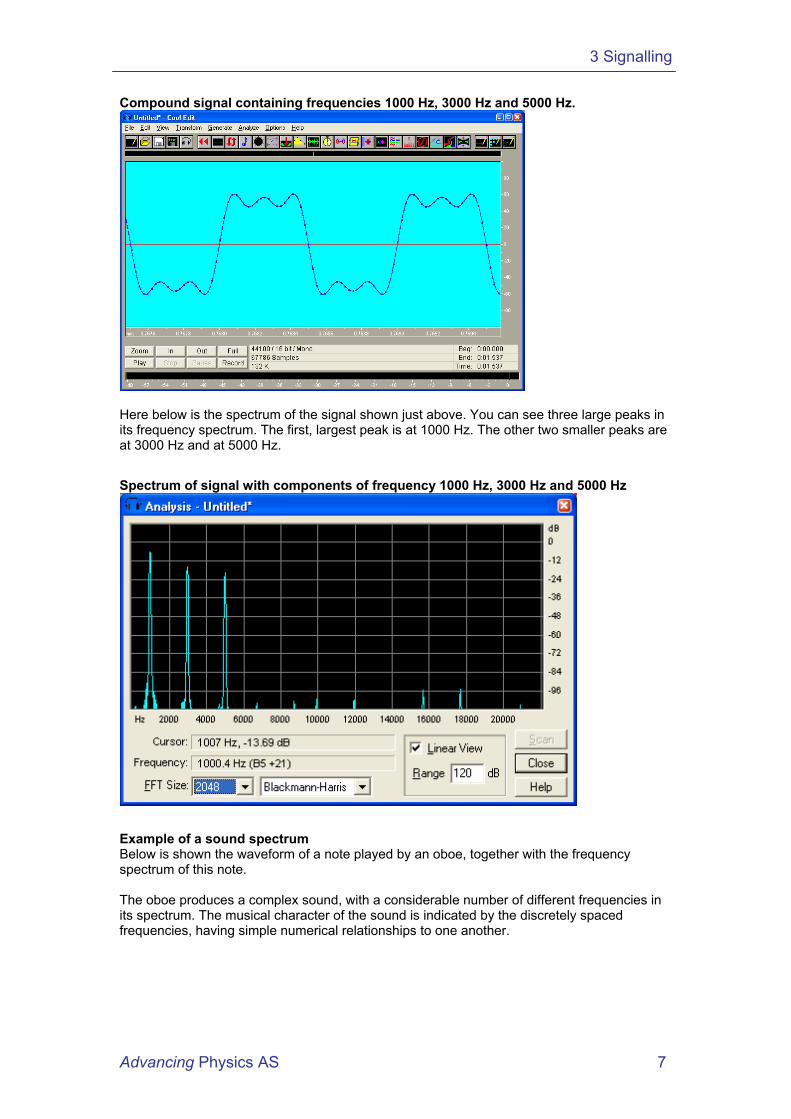
Compound signal containing frequencies 1000 Hz, 3000 Hz and 5000 Hz.
Here below is the spectrum of the signal shown just above. You can see three large peaks in its frequency spectrum. The first, largest peak is at 1000 Hz. The other two smaller peaks are at 3000 Hz and at 5000 Hz.
Spectrum of signal with components of frequency 1000 Hz, 3000 Hz and 5000 Hz
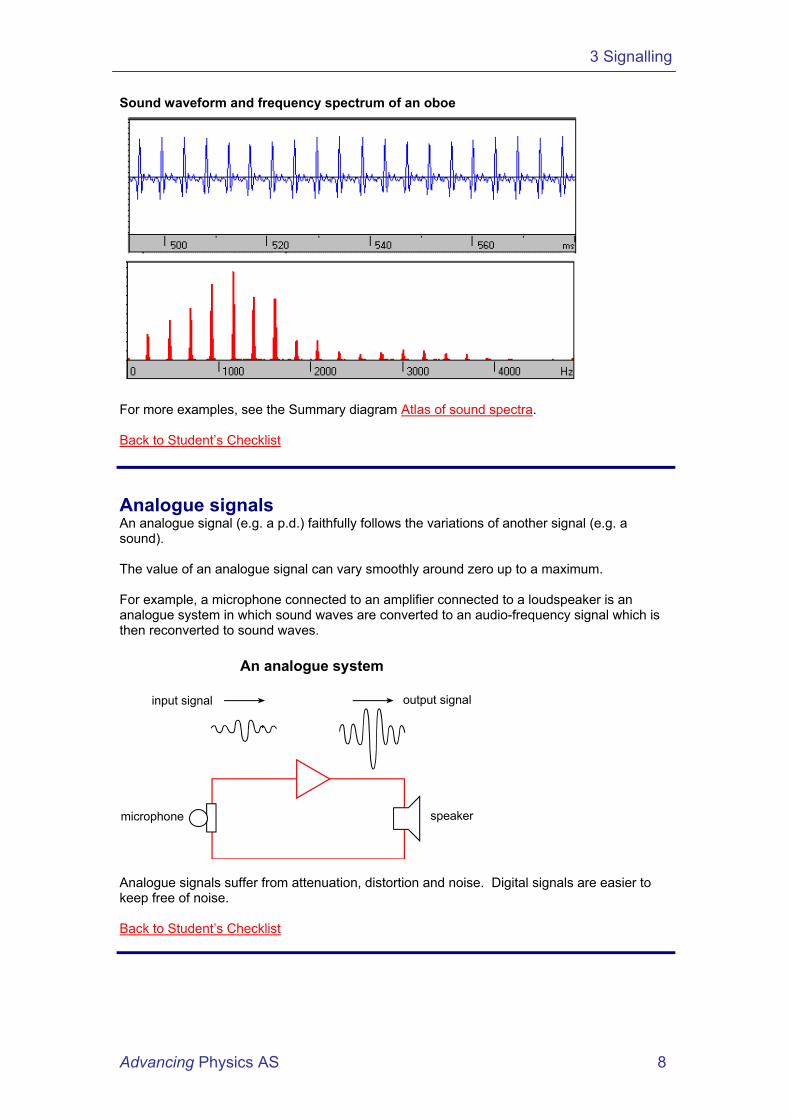
Example of a sound spectrum Below is shown the waveform of a note played by an oboe, together with the frequency spectrum of this note. The oboe produces a complex sound, with a considerable number of different frequencies in its spectrum. The musical character of the sound is indicated by the discretely spaced frequencies, having simple numerical relationships to one another.
Advancing Physics AS 7
3 Signalling
Sound waveform and frequency spectrum of an oboe
For more examples, see the Summary diagram Atlas of sound spectra. Back to Student’s Checklist
Analogue signals An analogue signal (e.g. a p.d.) faithfully follows the variations of another signal (e.g. a sound). The value of an analogue signal can vary smoothly around zero up to a maximum. For example, a microphone connected to an amplifier connected to a loudspeaker is an analogue system in which sound waves are converted to an audio-frequency signal which is then reconverted to sound waves.
input signal output signal
microphone speaker
An analogue system
Analogue signals suffer from attenuation, distortion and noise. Digital signals are easier to keep free of noise. Back to Student’s Checklist
Advancing Physics AS 8
3 Signalling
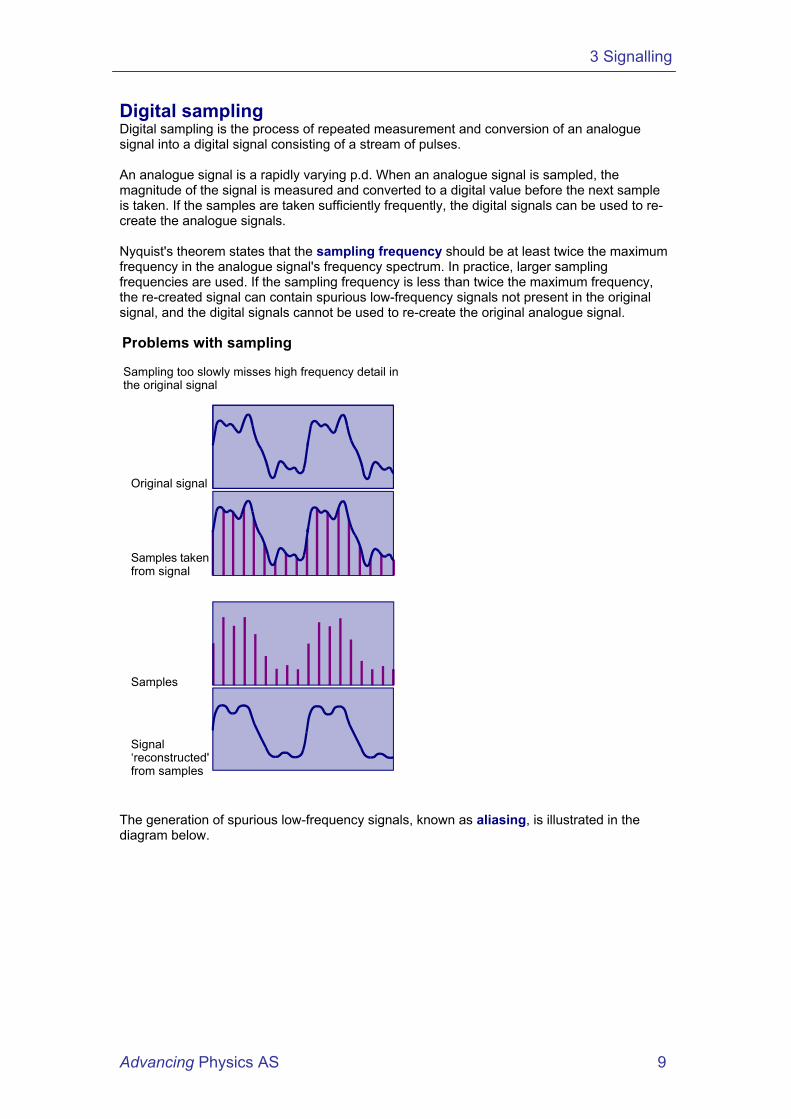
Digital sampling Digital sampling is the process of repeated measurement and conversion of an analogue signal into a digital signal consisting of a stream of pulses. An analogue signal is a rapidly varying p.d. When an analogue signal is sampled, the magnitude of the signal is measured and converted to a digital value before the next sample is taken. If the samples are taken sufficiently frequently, the digital signals can be used to re-create the analogue signals. Nyquist's theorem states that the sampling frequency should be at least twice the maximum frequency in the analogue signal's frequency spectrum. In practice, larger sampling frequencies are used. If the sampling frequency is less than twice the maximum frequency, the re-created signal can contain spurious low-frequency signals not present in the original signal, and the digital signals cannot be used to re-create the original analogue signal. Problems with sampling
Sampling too slowly misses high frequency detail inthe original signal
Original signal
Samples takenfrom signal
Samples
Signal‘reconstructed'from samples
The generation of spurious low-frequency signals, known as aliasing, is illustrated in the diagram below.
Advancing Physics AS 9

3 Signalling
Samples takenfrom signal
Sampling too slowly creates spurious lowfrequencies (aliases)
Original signal
Samples alone
Signal‘reconstructed’from samples
The analogue samples are converted to digital signals by means of an analogue to digital converter. For an audio signal of bandwidth 4 kHz, the highest frequency in the signal is 4 kHz, therefore the minimum sampling rate is 8 kHz. If each sample is converted into an 8-bit byte, the bit rate for data transfer must be at least 64 000 per second, or 64 kbit s–1. Back to Student’s Checklist
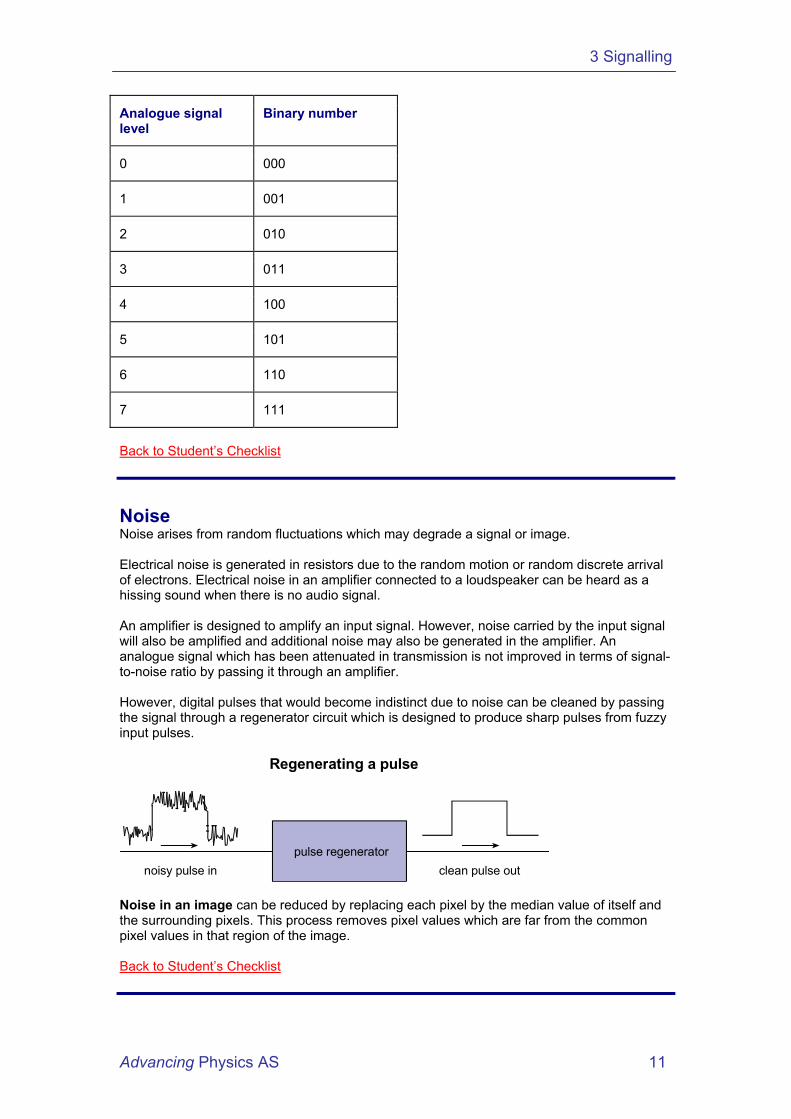
Analogue to digital conversion An analogue-to-digital converter is a circuit used to convert an analogue signal to a digital signal. An analogue signal varies smoothly in potential difference. A digital signal is a sequence of on/off pulses. In an analogue to digital converter, the voltage of the analogue signal is sampled at frequent intervals. The value of each sample of the analogue signal is then converted into a binary number. At each interval, the analogue signal can be used to open an electronic gate for a time in proportion to the voltage of the analogue signal at the instant it was sampled. When the gate is open, a continuous stream of pulses passes through the gate. The number of pulses through the gate is therefore in proportion to the voltage of the analogue signal. The digital signal is therefore represented by the number of pulses. The table below shows how a 3-bit converter would distinguish 8 different levels of the signal. For comparison, an 8-bit converter would distinguish 256 different signal levels. Notice that there is always some error in assigning the nearest binary number to a given analogue value. This is called quantisation error.
Advancing Physics AS 10
3 Signalling
Analogue signal level
Binary number
0 000
1 001
2 010
3 011
4 100
5 101
6 110
7 111
Back to Student’s Checklist
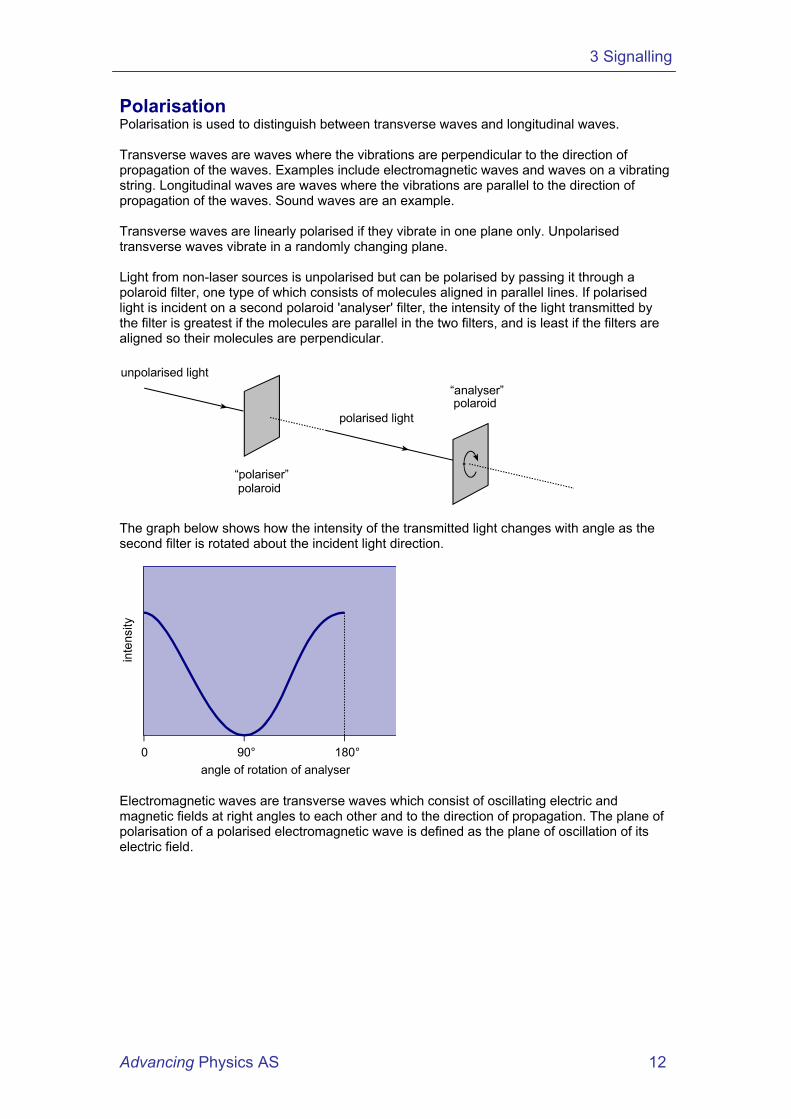
Noise Noise arises from random fluctuations which may degrade a signal or image. Electrical noise is generated in resistors due to the random motion or random discrete arrival of electrons. Electrical noise in an amplifier connected to a loudspeaker can be heard as a hissing sound when there is no audio signal. An amplifier is designed to amplify an input signal. However, noise carried by the input signal will also be amplified and additional noise may also be generated in the amplifier. An analogue signal which has been attenuated in transmission is not improved in terms of signal-to-noise ratio by passing it through an amplifier. However, digital pulses that would become indistinct due to noise can be cleaned by passing the signal through a regenerator circuit which is designed to produce sharp pulses from fuzzy input pulses.
noisy pulse in clean pulse out
Regenerating a pulse
pulse regenerator
Noise in an image can be reduced by replacing each pixel by the median value of itself and the surrounding pixels. This process removes pixel values which are far from the common pixel values in that region of the image. Back to Student’s Checklist
Advancing Physics AS 11
3 Signalling
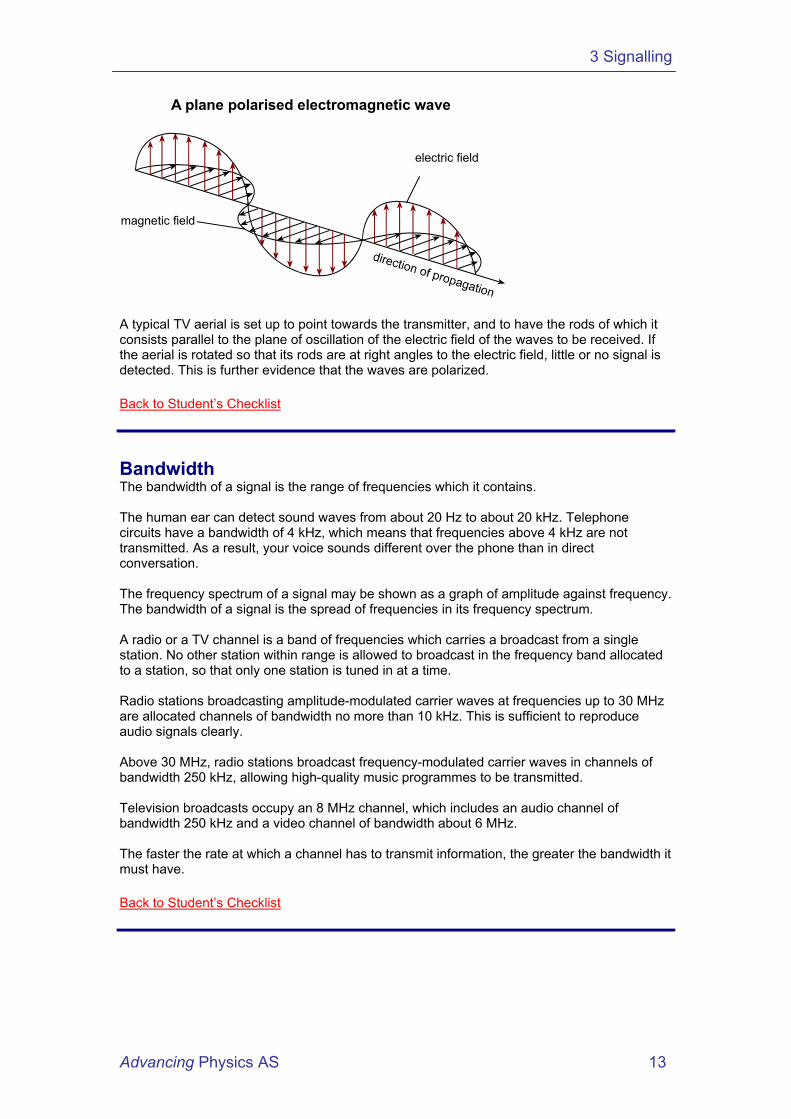
Polarisation Polarisation is used to distinguish between transverse waves and longitudinal waves. Transverse waves are waves where the vibrations are perpendicular to the direction of propagation of the waves. Examples include electromagnetic waves and waves on a vibrating string. Longitudinal waves are waves where the vibrations are parallel to the direction of propagation of the waves. Sound waves are an example. Transverse waves are linearly polarised if they vibrate in one plane only. Unpolarised transverse waves vibrate in a randomly changing plane. Light from non-laser sources is unpolarised but can be polarised by passing it through a polaroid filter, one type of which consists of molecules aligned in parallel lines. If polarised light is incident on a second polaroid 'analyser' filter, the intensity of the light transmitted by the filter is greatest if the molecules are parallel in the two filters, and is least if the filters are aligned so their molecules are perpendicular.
polarised light
unpolarised light“analyser” polaroid
“polariser” polaroid
The graph below shows how the intensity of the transmitted light changes with angle as the second filter is rotated about the incident light direction.
0 90° 180°angle of rotation of analyser
Electromagnetic waves are transverse waves which consist of oscillating electric and magnetic fields at right angles to each other and to the direction of propagation. The plane of polarisation of a polarised electromagnetic wave is defined as the plane of oscillation of its electric field.
Advancing Physics AS 12
3 Signalling
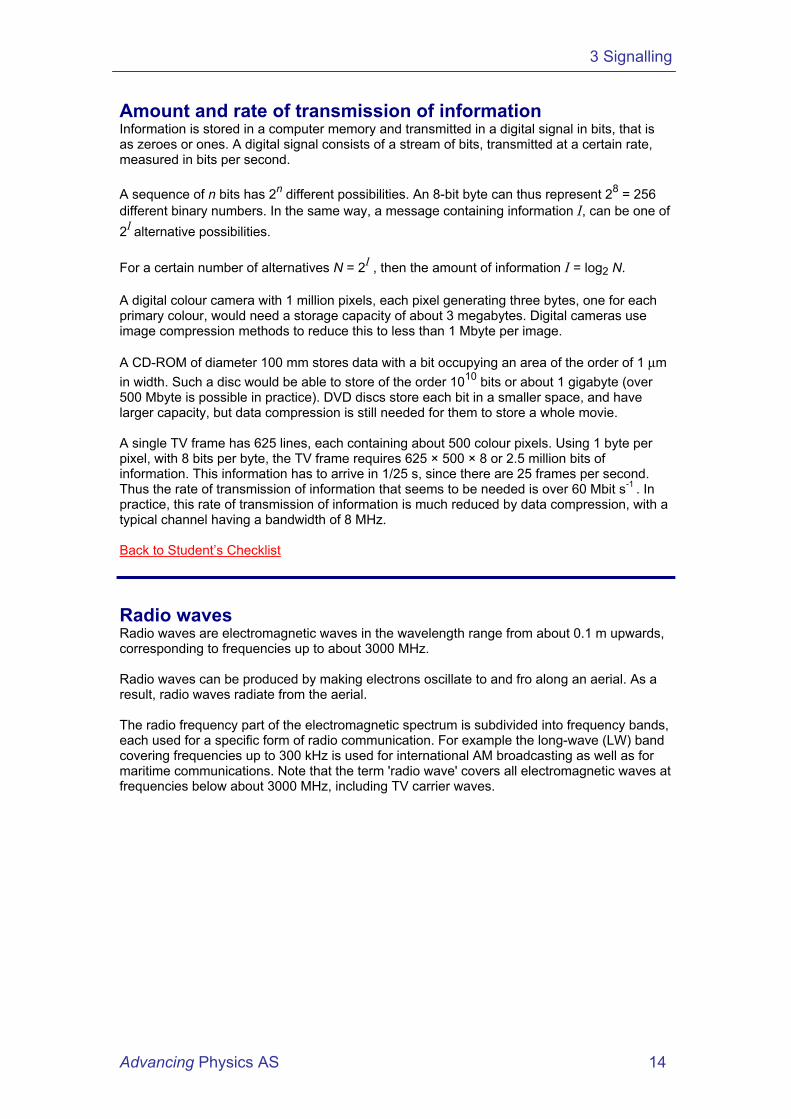
A plane polarised electromagnetic wave
electric field
magnetic field
A typical TV aerial is set up to point towards the transmitter, and to have the rods of which it consists parallel to the plane of oscillation of the electric field of the waves to be received. If the aerial is rotated so that its rods are at right angles to the electric field, little or no signal is detected. This is further evidence that the waves are polarized. Back to Student’s Checklist
Bandwidth The bandwidth of a signal is the range of frequencies which it contains. The human ear can detect sound waves from about 20 Hz to about 20 kHz. Telephone circuits have a bandwidth of 4 kHz, which means that frequencies above 4 kHz are not transmitted. As a result, your voice sounds different over the phone than in direct conversation. The frequency spectrum of a signal may be shown as a graph of amplitude against frequency. The bandwidth of a signal is the spread of frequencies in its frequency spectrum. A radio or a TV channel is a band of frequencies which carries a broadcast from a single station. No other station within range is allowed to broadcast in the frequency band allocated to a station, so that only one station is tuned in at a time. Radio stations broadcasting amplitude-modulated carrier waves at frequencies up to 30 MHz are allocated channels of bandwidth no more than 10 kHz. This is sufficient to reproduce audio signals clearly. Above 30 MHz, radio stations broadcast frequency-modulated carrier waves in channels of bandwidth 250 kHz, allowing high-quality music programmes to be transmitted. Television broadcasts occupy an 8 MHz channel, which includes an audio channel of bandwidth 250 kHz and a video channel of bandwidth about 6 MHz. The faster the rate at which a channel has to transmit information, the greater the bandwidth it must have. Back to Student’s Checklist
Advancing Physics AS 13
3 Signalling
Amount and rate of transmission of information Information is stored in a computer memory and transmitted in a digital signal in bits, that is as zeroes or ones. A digital signal consists of a stream of bits, transmitted at a certain rate, measured in bits per second. A sequence of n bits has 2n different possibilities. An 8-bit byte can thus represent 28 = 256 different binary numbers. In the same way, a message containing information I, can be one of 2I alternative possibilities. For a certain number of alternatives N = 2I , then the amount of information I = log2 N. A digital colour camera with 1 million pixels, each pixel generating three bytes, one for each primary colour, would need a storage capacity of about 3 megabytes. Digital cameras use image compression methods to reduce this to less than 1 Mbyte per image. A CD-ROM of diameter 100 mm stores data with a bit occupying an area of the order of 1 µm in width. Such a disc would be able to store of the order 1010 bits or about 1 gigabyte (over 500 Mbyte is possible in practice). DVD discs store each bit in a smaller space, and have larger capacity, but data compression is still needed for them to store a whole movie. A single TV frame has 625 lines, each containing about 500 colour pixels. Using 1 byte per pixel, with 8 bits per byte, the TV frame requires 625 × 500 × 8 or 2.5 million bits of information. This information has to arrive in 1/25 s, since there are 25 frames per second. Thus the rate of transmission of information that seems to be needed is over 60 Mbit s-1 . In practice, this rate of transmission of information is much reduced by data compression, with a typical channel having a bandwidth of 8 MHz. Back to Student’s Checklist
Radio waves Radio waves are electromagnetic waves in the wavelength range from about 0.1 m upwards, corresponding to frequencies up to about 3000 MHz. Radio waves can be produced by making electrons oscillate to and fro along an aerial. As a result, radio waves radiate from the aerial. The radio frequency part of the electromagnetic spectrum is subdivided into frequency bands, each used for a specific form of radio communication. For example the long-wave (LW) band covering frequencies up to 300 kHz is used for international AM broadcasting as well as for maritime communications. Note that the term 'radio wave' covers all electromagnetic waves at frequencies below about 3000 MHz, including TV carrier waves.
Advancing Physics AS 14
3 Signalling
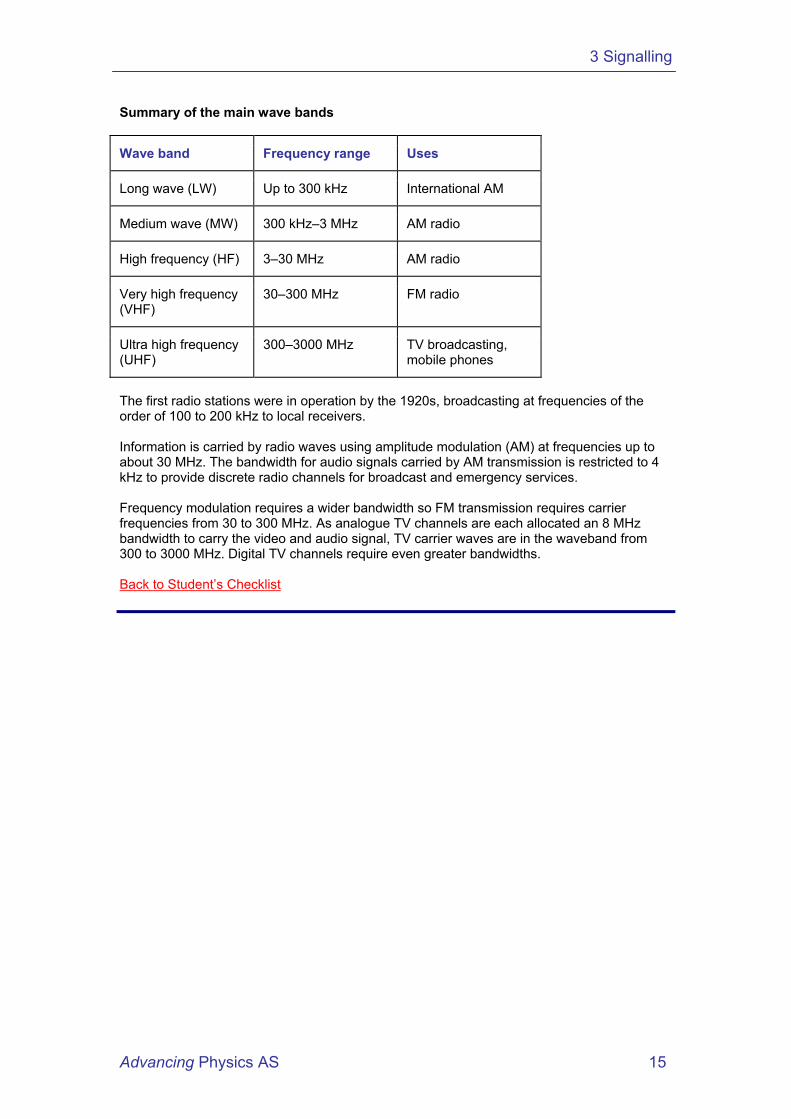
Summary of the main wave bands
Wave band Frequency range Uses
Long wave (LW) Up to 300 kHz International AM
Medium wave (MW) 300 kHz–3 MHz AM radio
High frequency (HF) 3–30 MHz AM radio
Very high frequency (VHF)
30–300 MHz FM radio
Ultra high frequency (UHF)
300–3000 MHz TV broadcasting, mobile phones
The first radio stations were in operation by the 1920s, broadcasting at frequencies of the order of 100 to 200 kHz to local receivers. Information is carried by radio waves using amplitude modulation (AM) at frequencies up to about 30 MHz. The bandwidth for audio signals carried by AM transmission is restricted to 4 kHz to provide discrete radio channels for broadcast and emergency services. Frequency modulation requires a wider bandwidth so FM transmission requires carrier frequencies from 30 to 300 MHz. As analogue TV channels are each allocated an 8 MHz bandwidth to carry the video and audio signal, TV carrier waves are in the waveband from 300 to 3000 MHz. Digital TV channels require even greater bandwidths. Back to Student’s Checklist
Advancing Physics AS 15
3 Signalling
Summary Diagrams (OHTs) Back to list of Contents
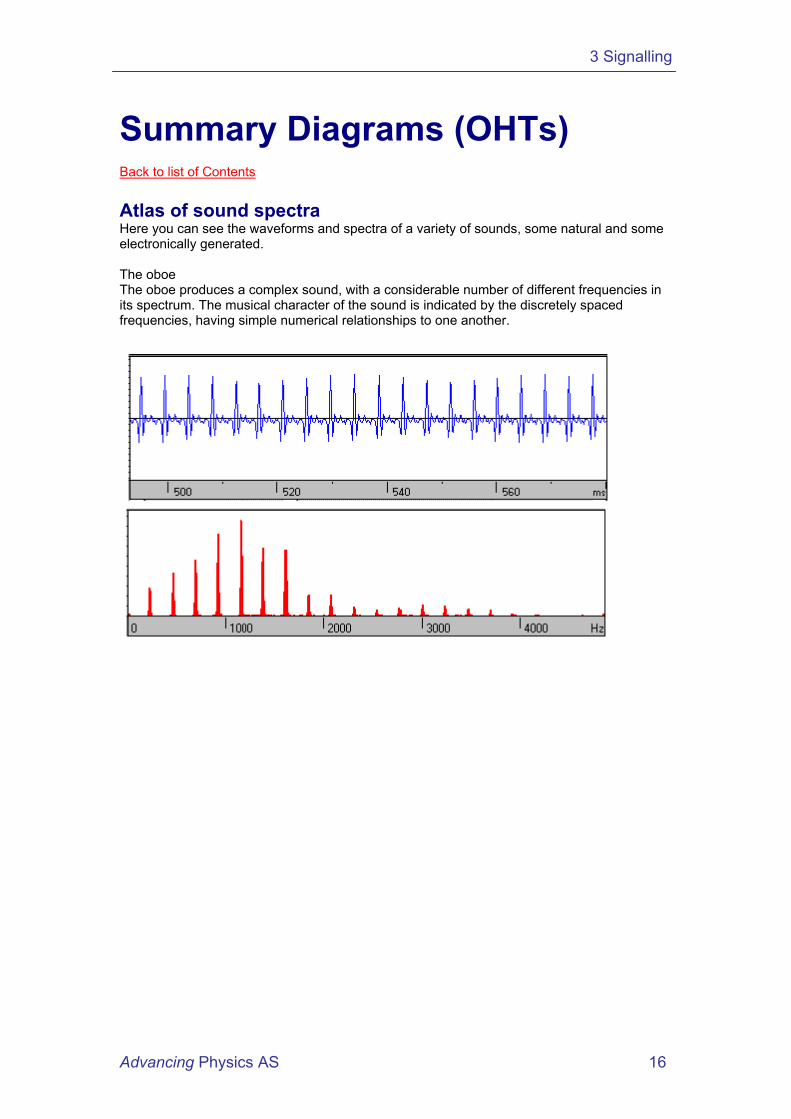
Atlas of sound spectra Here you can see the waveforms and spectra of a variety of sounds, some natural and some electronically generated. The oboe The oboe produces a complex sound, with a considerable number of different frequencies in its spectrum. The musical character of the sound is indicated by the discretely spaced frequencies, having simple numerical relationships to one another.
Advancing Physics AS 16
3 Signalling
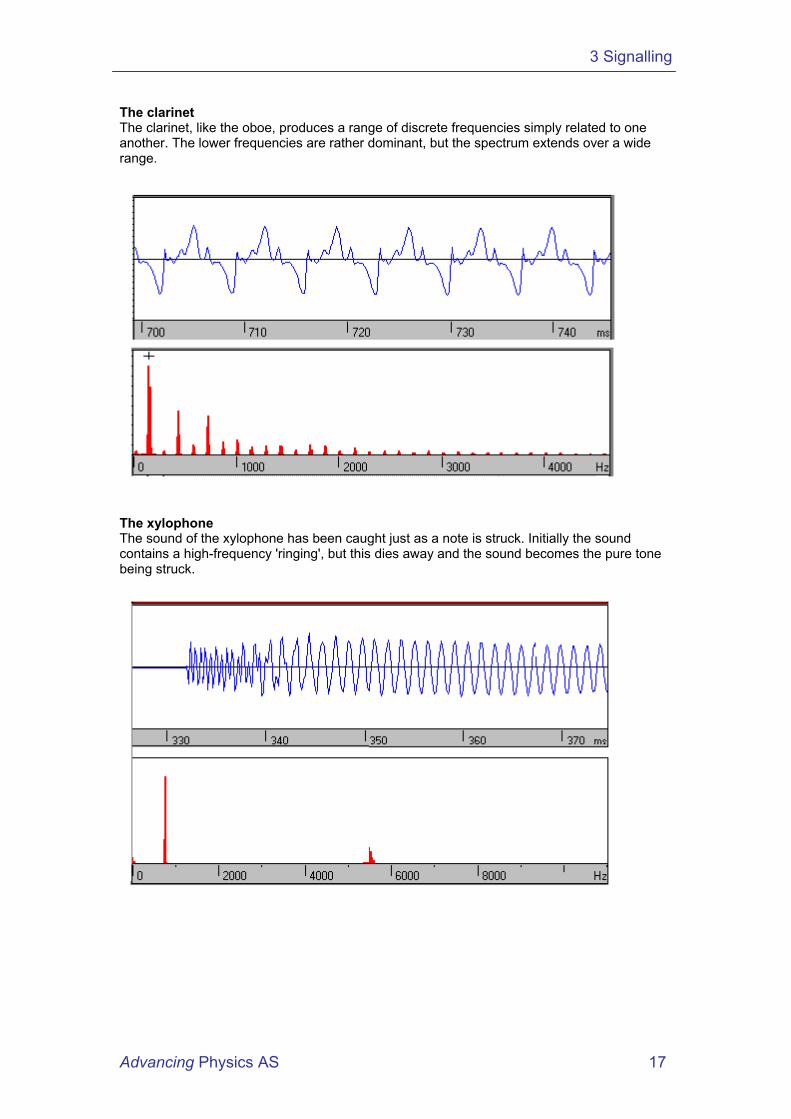
The clarinet The clarinet, like the oboe, produces a range of discrete frequencies simply related to one another. The lower frequencies are rather dominant, but the spectrum extends over a wide range.
The xylophone The sound of the xylophone has been caught just as a note is struck. Initially the sound contains a high-frequency 'ringing', but this dies away and the sound becomes the pure tone being struck.
Advancing Physics AS 17
3 Signalling
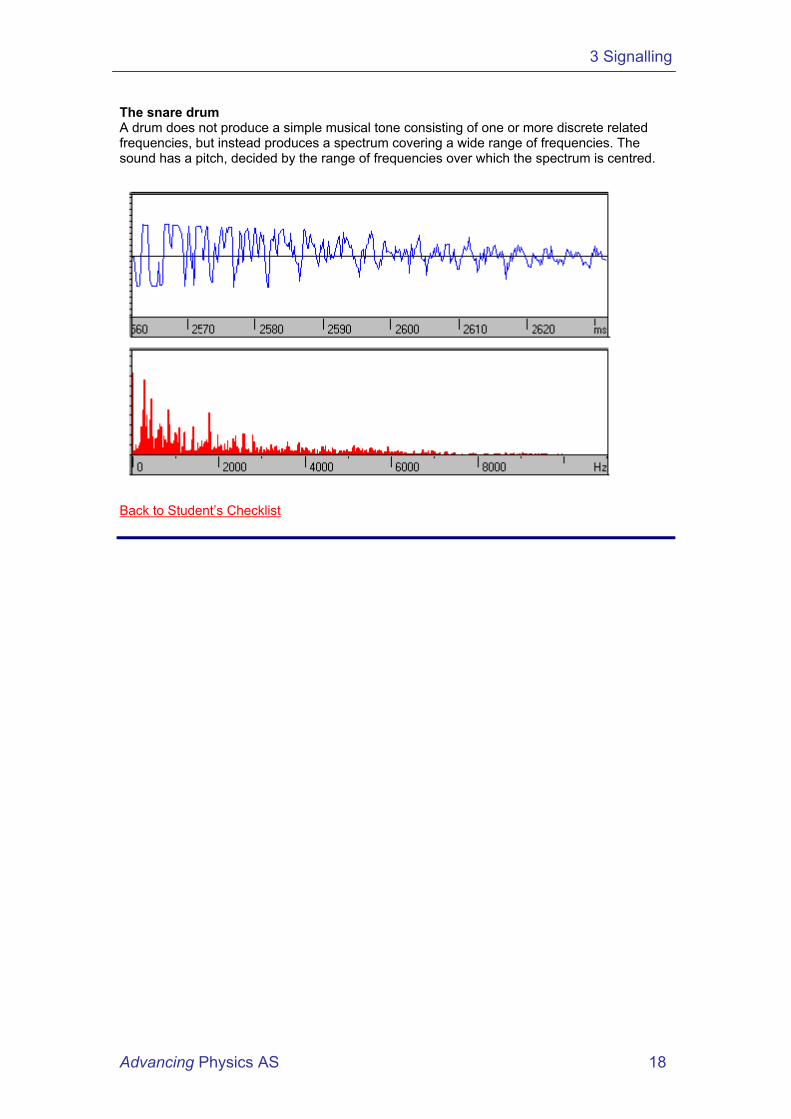
The snare drum A drum does not produce a simple musical tone consisting of one or more discrete related frequencies, but instead produces a spectrum covering a wide range of frequencies. The sound has a pitch, decided by the range of frequencies over which the spectrum is centred.
Back to Student’s Checklist
Advancing Physics AS 18

3 Signalling
Signal sampling For digital transmission, signals must be sampled at discrete intervals. Sampling a signal
original signal
sampling pulses0 or 1 from clock
sampled waveform
original waveformreconstructedfrom samples
The original signal can be exactly reconstructed if the samplingis frequent enough
Back to Student’s Checklist
Advancing Physics AS 19

3 Signalling
Digitising samples After a signal is sampled, the values must be digitised.
Digitising a signal
The greater the number of bits the better the resolution
7=111
6=110
5=101
4=100
3=011
2=010
1=001
0=000
CD uses16-bitcoding
3-bit coding: an example
quantisationerror
sample
originalsignal
nearest digitalvalue chosen
001 100 101 110 111 110 100 011 100binary values
digital stream of bits
number of bits N
number of levels
2N23=8 28=256 216=65536
3 8 16
8 256 65536
Back to Student’s Checklist
Advancing Physics AS 20
3 Signalling
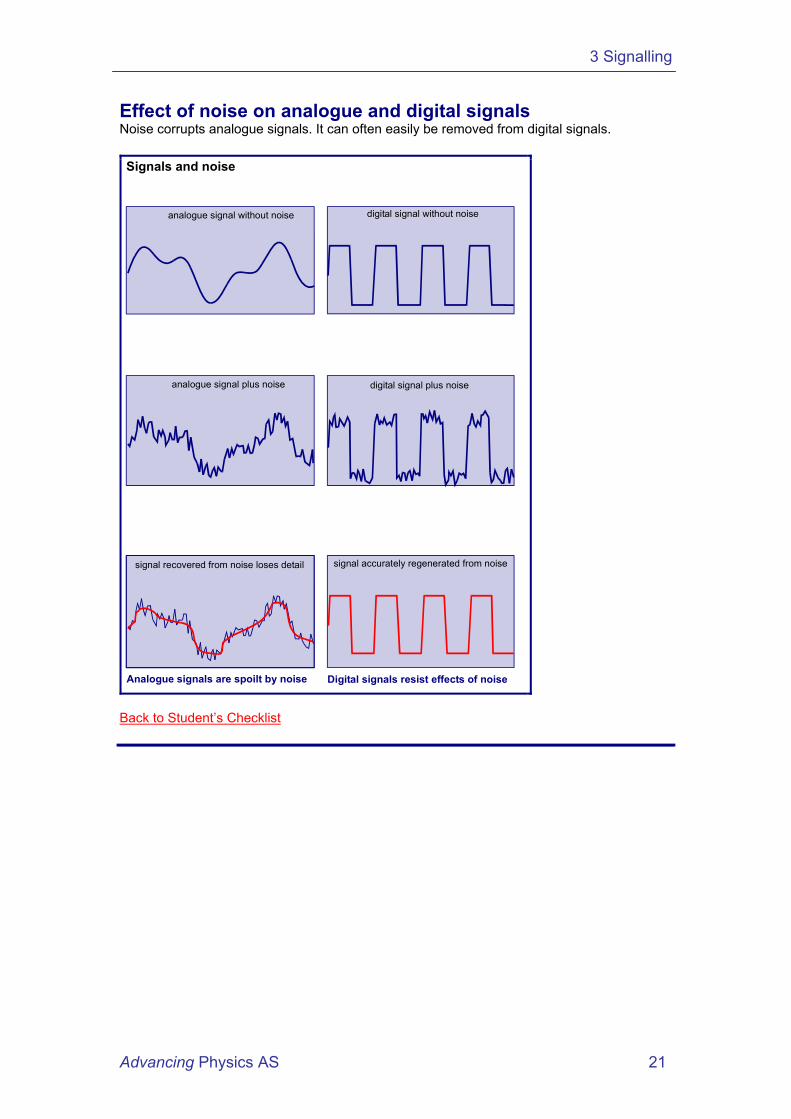
Effect of noise on analogue and digital signals Noise corrupts analogue signals. It can often easily be removed from digital signals. Signals and noise
Analogue signals are spoilt by noise Digital signals resist effects of noise
analogue signal without noise
analogue signal plus noise
signal recovered from noise loses detail
digital signal without noise
digital signal plus noise
signal accurately regenerated from noise
Back to Student’s Checklist
Advancing Physics AS 21
3 Signalling
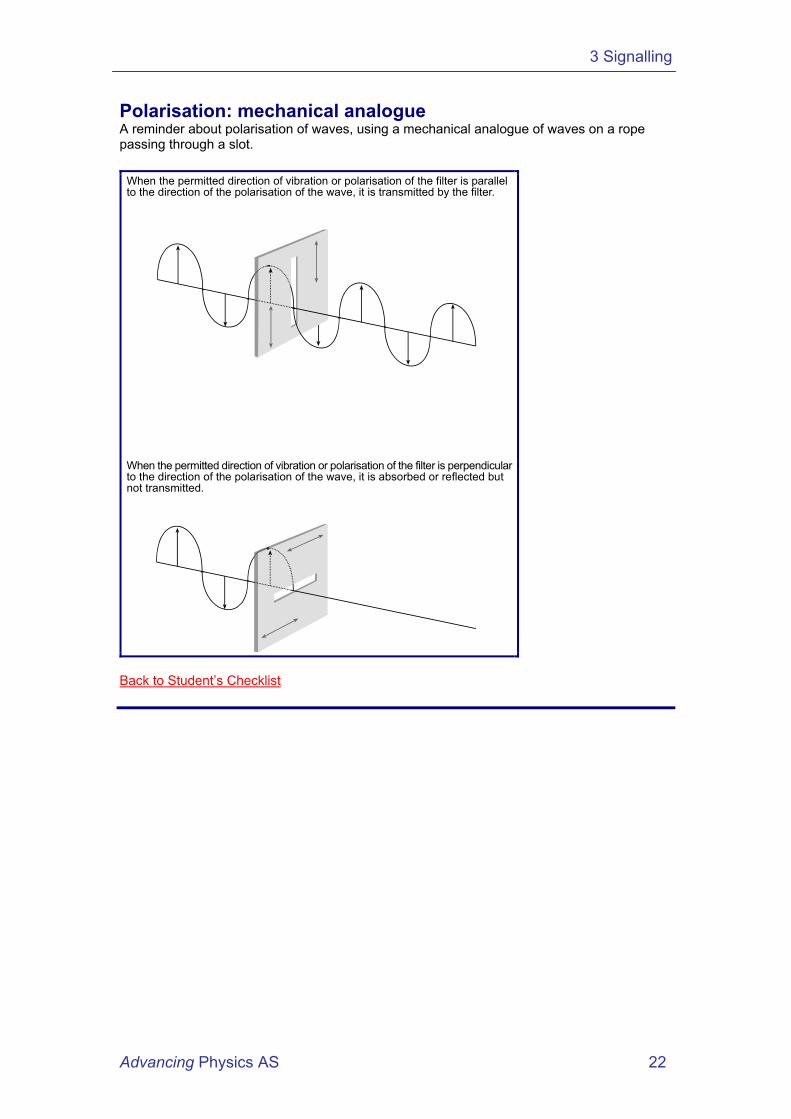
Polarisation: mechanical analogue A reminder about polarisation of waves, using a mechanical analogue of waves on a rope passing through a slot.
When the permitted direction of vibration or polarisation of the filter is parallelto the direction of the polarisation of the wave, it is transmitted by the filter.
When the permitted direction of vibration or polarisation of the filter is perpendicularto the direction of the polarisation of the wave, it is absorbed or reflected butnot transmitted.
Back to Student’s Checklist
Advancing Physics AS 22
3 Signalling
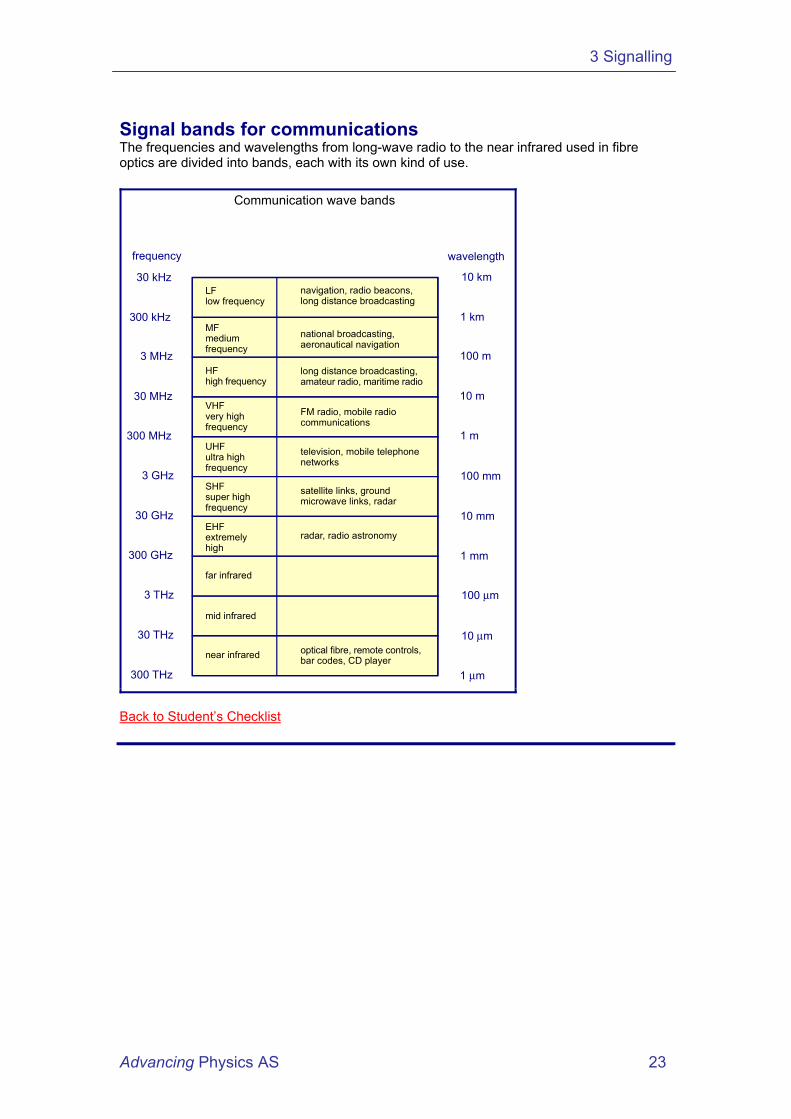
Signal bands for communications The frequencies and wavelengths from long-wave radio to the near infrared used in fibre optics are divided into bands, each with its own kind of use.
LFlow frequency
navigation, radio beacons,long distance broadcasting
optical fibre, remote controls,bar codes, CD player
30 kHz
near infrared
MFmediumfrequency
HFhigh frequency
VHFvery highfrequency
UHFultra highfrequency
SHFsuper highfrequency
EHFextremelyhigh
far infrared
mid infrared
national broadcasting,aeronautical navigation
long distance broadcasting,amateur radio, maritime radio
radar, radio astronomy
FM radio, mobile radiocommunications
television, mobile telephonenetworks
satellite links, groundmicrowave links, radar
300 kHz
3 MHz
30 MHz
300 MHz
3 GHz
30 GHz
300 GHz
3 THz
30 THz
300 THz
10 km
1 km
100 m
10 m
1 m
100 mm
10 mm
1 mm
100 µm
10 µm
1 µm
Communication wave bands
frequency wavelength
Back to Student’s Checklist
Advancing Physics AS 23
3 Signalling
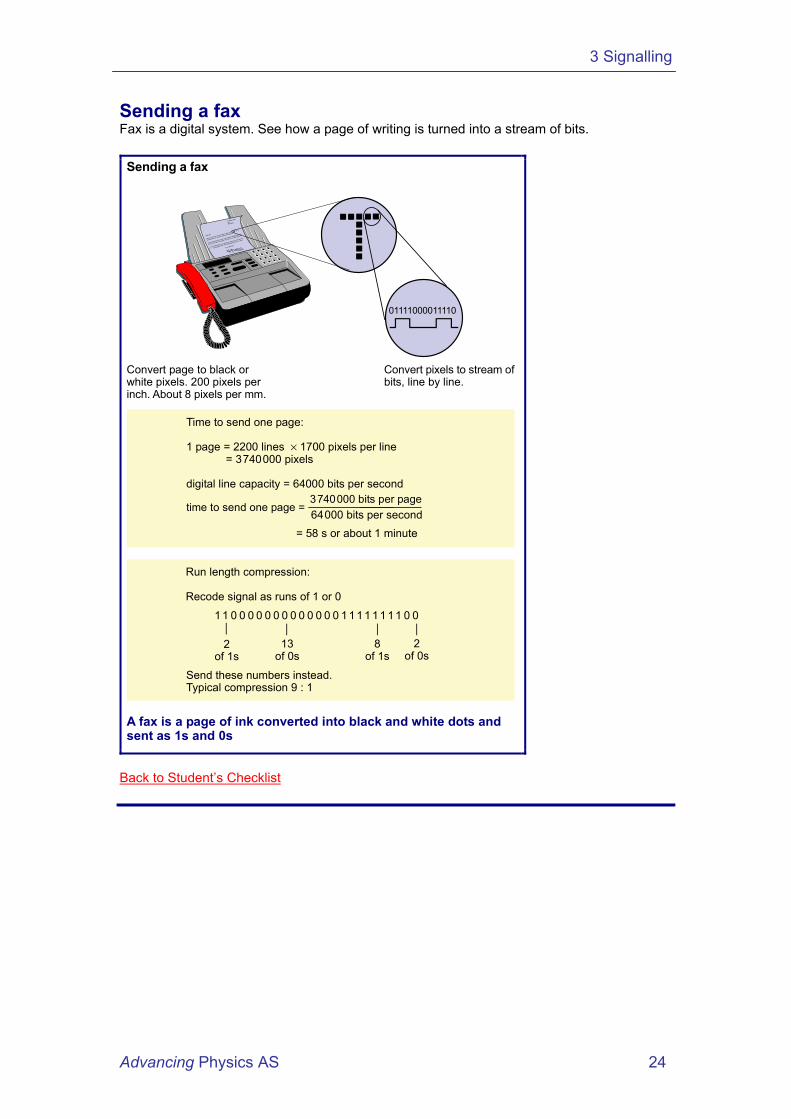
Sending a fax Fax is a digital system. See how a page of writing is turned into a stream of bits. Sending a fax
Time to send one page:
1 page = 2200 lines × 1700 pixels per line = 3740000 pixels
digital line capacity = 64000 bits per second
01111000011110
A fax is a page of ink converted into black and white dots andsent as 1s and 0s
Convert page to black orwhite pixels. 200 pixels perinch. About 8 pixels per mm.
Convert pixels to stream ofbits, line by line.
time to send one page =
Run length compression:
Recode signal as runs of 1 or 0
11 0 0 0 0 0 0 0 0 0 0 0 0 0 1 111 11 11 0 0
2of 1s
13of 0s
8of 1s
2of 0s
Send these numbers instead.Typical compression 9 : 1
3740000 bits per page64000 bits per second
= 58 s or about 1 minute
Back to Student’s Checklist
Advancing Physics AS 24
3 Signalling
Advancing Physics AS 25
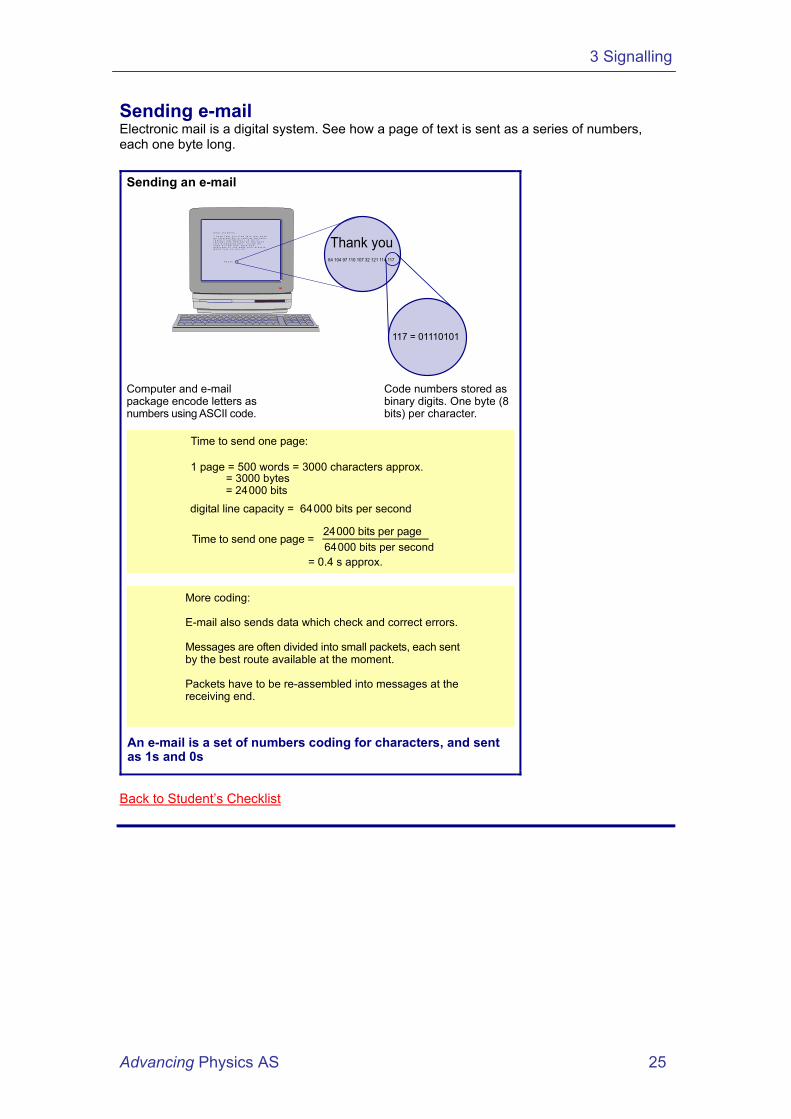
Sending e-mail Electronic mail is a digital system. See how a page of text is sent as a series of numbers, each one byte long. Sending an e-mail
An e-mail is a set of numbers coding for characters, and sentas 1s and 0s
Time to send one page:
1 page = 500 words = 3000 characters approx.
Thank you84 104 97 110 107 32 121 114 117
117 = 01110101
Computer and e-mailpackage encode letters asnumbers using ASCII code.
Code numbers stored asbinary digits. One byte (8bits) per character.
More coding:
E-mail also sends data which check and correct errors.
Messages are often divided into small packets, each sentby the best route available at the moment.
Packets have to be re-assembled into messages at thereceiving end.
= 3000 bytes= 24000 bits
digital line capacity = 64000 bits per second
Time to send one page = 24000 bits per page64000 bits per second
= 0.4 s approx.
D e a r s t u d e n t s ,
I h o p e t h a t y o u f i n d t h i s t e x t b o o ka s i n t e r e s t i n g t o r e a d a s w e h a v ef o u n d i l l u s t r a t i n g i t . A l o t o ft h o u g h t a n d d e d i c a t i o n h a s g o n ei n t o p r o d u c i n g t h i s , s o w e a l lh o p e a t I O P t h a t e a c h a n de v e r y o n e o f y o u p a s s y o u r A l e v e l s .G o o d l u c k t o y o u a l l .
T h a n k y o u
Back to Student’s Checklist