
Restriction Enzyme Cleavage of DNA and Electrophoresis (AP Biology

Pearson Education, Inc., publishing as Person Benjamin Cummings College Board, AP Biology Curriculum Framework 2012-2013
Copyright © Rebecca Rehder Wingerden
Investigation 9: Biotechnology:Restriction Enzyme Analysis of DNA
AP Biology Investigation 9: Restriction Enzyme Analysis
Learning Objectives
• In this investigation, you will learn how to use restriction enzymes and gel electrophoresis to create genetic profiles.
• You will use these profiles to help narrow the list of suspects in the hypothetical crime.
Copyright © 2012 Rebecca Rehder Wingerden
PreLab:
• Complete Bozeman Science- Molecular Biology Questions in CompBook (handout online) - http://www.bozemanscience.com/molecule-biology
Investigation 9: Restriction Enzyme Analysis
BozemanScience.com: AP Biology Lab 6 - Molecular Biology (9:00 min.) http://www.bozemanscience.com/ap-bio-lab-6-molecular-biology
Copyright © 2012 Rebecca Rehder Wingerden
PreLab: • Complete Activity - A Process To Dye For: Gel
Electrophoresis in CompBook (handout) - Read Introduction, Background & Experimental
Overview - Complete Pre-Lab Activity 1-5 (#5 is a Table 1) - Copy Gel Drawing Worksheet (Figure 1)
Investigation 9: Restriction Enzyme Analysis
Copyright © 2012 Rebecca Rehder Wingerden
Lab: • Complete Procedure
steps 1-11 and collect data & draw gel
Post Lab: • Complete Post-Lab
Questions 1-10

Investigation 9: Restriction Enzyme Analysis
BufferDyes
Power Supply
+
-
Agarose gel
Cathode
Anode
Electrophoresis Equipment
•Power supply and chamber- a source of negatively charged particles with a cathode and anode
•Buffer- a fluid mixture of water and ions •Agarose gel- a porous material the DNA
migrates through •DNA ladder- mixture of DNA fragments of
known lengths •Loading dye- contains a dense material and
allows visualization of DNA migration •DNA Stain- allows visualization of DNA
fragments after electrophoresis
Copyright © 2012 Rebecca Rehder Wingerden
Investigation 9: Restriction Enzyme Analysis
Electrophoresis - Loading the Gel
Copyright © 2012 Rebecca Rehder Wingerden
Investigation 9: Restriction Enzyme Analysis
Copyright © 2012 Rebecca Rehder Wingerden
Dye Name Dye Well #
Migration Distance
(mm)
Migration Direction
(+/-)Dye Molecules
“Speed” Ranking
Malachite Green 1Orange G 2Safranin O 3
Alizarin Red S 4m-Cresol Purple 5
Unknown Sample letter? NA NA NA
Table 1: Gel Electrophoresis
Analysis: • Collect data to complete Table 1: Gel Electrophorese • Complete Fig. 1 Gel Drawing
Post Lab: • Complete Post-Lab Questions 1-10
Investigation 9: Restriction Enzyme Analysis
Copyright © 2012 Rebecca Rehder Wingerden
Figure 1: Gel Drawing-
- +
+1
2
3
4
5
?

Background
• DNA Restriction enzymes found naturally in bacteria, can be used to cut DNA fragments at specific sequences, while another enzyme, DNA ligase, can attach or rejoin DNA fragments with complementary (sticky) ends.
• More than 200 restriction enzymes now available commercially, they are named after the bacterium in which they were first identified: - EcoRI was the first enzyme isolated
from Escherichia coli - HindIII was the third enzyme isolated
for Haemophilus influenzae (restriction enzyme we will be using in DNA Forensic Lab)
Investigation 9: Restriction Enzyme Analysis
Copyright © 2012 Rebecca Rehder Wingerden
Investigation 9: Restriction Enzyme Analysis
GGCCTGCGAATTCCCGATCGAAGGCCCGAATTCTGGCCA CCGGACGCTTAAGGGCTAGCTTCCGGGCTTAAGACCGGTEco RI
GGCCTGCG AATTCCCGATCGAAGGCCCG AATTCTGGCCA CCGGACGCTTAA GGGCTAGCTTCCGGGCTTAA GACCGGT
GGCCTGCGAATTCCCGATCGAAGGCCCGAATTCTGGCCA CCGGACGCTTAAGGGCTAGCTTCCGGGCTTAAGACCGGTHae III
GG CCTGCGAATTCCCGATCGAAGG CCCGAATTCTGG CCA CC GGACGCTTAAGGGCTAGCTTCC GGGCTTAAGACC GGT
Sticky Ends - ligation is very specific
Blunt Ends - ligation is non-specific
How do restriction enzymes work?
• Each restriction enzyme digest (cuts) DNA at a specific sequence, called the restriction site.
Copyright © 2012 Rebecca Rehder Wingerden
Investigation 9: Restriction Enzyme Analysis
How do we visualize the DNA?
• Agarose Gel Electrophoresis is a method of separating molecules in an electrical field based on their size and charge; DNA has an overall negative charge
Copyright © 2012 Rebecca Rehder Wingerden
Investigation 9: Restriction Enzyme Analysis
• Agarose gel acts as a sieve for separating DNA fragments; smaller fragments travel faster than large fragments
1% agarose
2% agarose
• Concentration of the agarose gel affects DNA migration - Low Concentration = larger
pores -- better resolution of larger DNA fragments
- Higher Concentration = smaller pores -- better resolution of smaller DNA fragments
Copyright © 2012 Rebecca Rehder Wingerden

Investigation 9: Restriction Enzyme Analysis
Agarose Gel
DNA Fragments
Copyright © 2012 Rebecca Rehder Wingerden
Molecules are separated based on their size and charge. DNA has an overall negative charge.
Forensic DNA Fingerprinting
Copyright © 2012 Rebecca Rehder Wingerden
Investigation 9: Restriction Enzyme Analysis
Restriction Enzymes
A A G C T T
T T C G A A
HindIII (Hin D Three) restriction enzyme
Standard Lambda/HindIII
CS S1 S2 S3 S4 S5
Complete the following before conducting this investigation:
I. Read Investigation 9: Biotechnology: Restriction Enzyme Analysis of DNA
II. Answer the following PreLab questions in your Comp Book:
1. Summarize what you will be doing in this investigation.
2. What is the primary question you will be trying to answer in this investigation?
Copyright © 2012 Rebecca Rehder Wingerden
PreLab
Investigation 9: Restriction Enzyme Analysis
Inv. 9: Biotechnology: Restriction Enzyme Analysis of DNA
PreLab - Getting Started:
• Define: Restriction Enzyme, PCR, RFLP, and Gel Electrophoresis
• Activity I: Restriction Enzyme 2Q p. S113-S114
• Activity II: DNA Mapping Using Restriction Enzymes 5Q p. S114-S115 (Note: There are a total of 5 questions in the 2 bullets.)
• Activity III: Basic Principle of Gel Electrophoresis 1Q p. S115
Investigation 9: Restriction Enzyme Analysis
Copyright © 2012 Rebecca Rehder Wingerden

Forensic DNA Fingerprinting Procedure: Lesson 1 Restriction Digestion
• Steps 1-8
Investigation 9: Restriction Enzyme Analysis
Copyright © 2012 Rebecca Rehder Wingerden
CS S1 S2 S3 S4 S5
Pipet 10 µl of each DNA sample from the stock tubes and transfer to corresponding colored micro centrifuge tubes. Make sure the samples transferred to the bottom of the tubes.
DNA
Forensic DNA Fingerprinting Procedure: Lesson 1 Restriction Digestion
• Steps 1-8
Investigation 9: Restriction Enzyme Analysis
Copyright © 2012 Rebecca Rehder Wingerden
ENZ
CS S1 S2 S3 S4 S5
HindIII (Hin D Three) restriction enzyme
Using a fresh tip for each DNA sample, pipet 10 µl of ENZ into the bottom of each tube.
Forensic DNA Fingerprinting Procedure: Lesson 1 Restriction Digestion
• Steps 1-8
Investigation 9: Restriction Enzyme Analysis
Copyright © 2012 Rebecca Rehder Wingerden
CS S1 S2 S3 S4 S5
Tightly cap the tubes and mix the components by gently flicking the tubes with your finger. Place tubes in your labeled floating micro-centrifuge tube rack and give to instructor.
Forensic DNA Fingerprinting Procedure: Lesson 2 Agarose Gel Electrophoresis
• Steps 7-9
Investigation 9: Restriction Enzyme Analysis
Copyright © 2012 Rebecca Rehder Wingerden
CS S1 S2 S3 S4 S5S
CS S1 S2 S3 S4 S5S
Using a separate tip for each sample, load 10 µl of Standard and 20 µl of digested DNA samples in to the correct wells of gel.

Investigation 9: Restriction Enzyme Analysis
• Loading Dye - DNA samples are loaded using the dry method. Samples are loading into the wells using a micro pipet.
• The presence of dyes in the DNA samples allows visualization while running the gel. The dyes must not be allowed to run off the gel.
Copyright © 2012 Rebecca Rehder Wingerden
Designing and Conducting Your Investigation: • The Disappearance of Ms. Mason: Your task is to design
and conduct a procedure based on DNA evidence to determine whose blood is spattered on the classroom floor. - Purpose: What is the goal of this investigation? - Hypothesis: If (rational for the investigation), then
(outcome that you would expect). - Procedure: Steps outlining the lab techniques that you
will complete to test your hypothesis (Include the following techniques in your procedure: PCR, RFLP, and gel electrophoresis.)
- Data: Table 1: Electrophoresis Data: DNA Fingerprints of Five Suspects
- Approval by Instructor
Investigation 9: Restriction Enzyme Analysis
Copyright © 2012 Rebecca Rehder Wingerden
Lambda/HindIII Size Standard
Crime Scene Suspect 1 Ms. Mason
Suspect 2 Mr. Gladson
Suspect 3 Bobby
Suspect 4 Unknown A
Suspect 5 Unknown B
Band Distance (mm)
Actual size (bp)
Distance (mm)
Actual size (bp)
Distance (mm)
Actual size (bp)
Distance (mm)
Actual size (bp)
Distance (mm)
Actual size (bp)
Distance (mm)
Actual size (bp)
Distance (mm)
Actual size (bp)
1 23,130
2 9,416
3 6,557
4 4,361
5 2,322
6 2,027
Table 1: Electrophoresis Data: DNA Fingerprints of Five Suspects
Copyright © 2012 Rebecca Rehder Wingerden
Designing and Conducting Your Investigation:
Investigation 9: Restriction Enzyme Analysis
- Evidence collected: • Crime Scene DNA- blood
spatter in classroom (SC) • Ms. Mason’s DNA- saliva
on her coffee cup (S1) • Mr. Gladson’s DNA- tissue
with which he wiped his nose (S2)
• Bobby’s DNA- bubble gum (S3)
• Unknown A DNA- blond hair (S4)
• Unknown B DNA- brown hair (S5)
Copyright © 2012 Rebecca Rehder Wingerden

Analyzing and Evaluating Results: • Complete Graph 1: Standard Curve ~ Lambda/
HindIII Size Standard • Complete Table 1: Electrophoresis Data: DNA
Fingerprints of Five Suspects • Conclusion: Write a conclusion which takes into
account the DNA results at the “crime scene.” Your conclusion should address “who-dun-it” by including motive, means, opportunity, and the DNA evidence found in Ms. Mason’s classroom.
• Evaluating Results: #1-2 (p. S122) • Thinking About Your Results: #1-4 (p. S123)
Investigation 9: Restriction Enzyme Analysis
Copyright © 2012 Rebecca Rehder Wingerden
Analyzing Results: • Calculating the Sizes of Restriction Fragment Length Polymorphisms (p. S120) base pair length (bp) is substituted for molecular weight when determining the size of DNA fragments.
Investigation 9: Restriction Enzyme Analysis
Copyright © 2012 Rebecca Rehder Wingerden
* For this “ideal” gel, assume that these two bands appear as a single band instead of resolving into separate bands.** These bands do not appear on the ideal gel and likely will not be seen.
• Creating the Standard Curve: - Graph 1: Standard Curve
- Table 1: DNA Fragment - Migration Distance
11.00 mm13.00 mm15.00 mm
1000900800
700
600
500
400
300
100
200
908070
60
50
40
30
10
20
987
6
5
4
3
1
2
10 2 3 4 5 6 7 8 9 10
Graph 1: Standard Curve ~ Lambda/HindIII Size Standard
DN
A Fr
agm
ent S
ize
(#bp
)
i.e. band #2 is 9416 bp and it migrated 13 mm
Copyright © 2012 Rebecca Rehder Wingerden
i.e. band #3 is 6557 bp and it migrated 15 mm
10 20 30 40 50 60 70 80 90 1000
Distance Migrated (mm)
x100
9 8 7 6
5
4
3
2
1
x1,0
00
9 8 7 6
5
4
3
2
1
x10,
000
5
4
3
2
1i.e. band #1 is 23,130 bp and it migrated 11 mm
NOTE: The first fragment is too large to migrate properly in agarose and will not fit within your line of best fit, and should be discarded.
Complete Activity- Restriction Enzyme Cleavage of DNA (EDVOTEK 112)
Investigation 9: Restriction Enzyme Analysis
PreLab - • Read Background Information and Experimental
Procedure (p. 4-9) • Copy data tables:
• Table 1: DNA Marker Standard • Table 2: Lambda DNA cut with EcoRI • Table 3: Lambda DNA (UNcut) • Figure 1: Lambda DNA cut with EcoRI
Copyright © 2012 Rebecca Rehder Wingerden

Complete Activity- Restriction Enzyme Cleavage of DNA (EDVOTEK 112)
Investigation 9: Restriction Enzyme Analysis
• Complete Procedure steps 1-6 (p.9) • Collect Data:
• Table 1: DNA Marker Standard • Table 2: Lambda DNA cut with
EcoRI • Table 3: Lambda DNA (UNcut)
• Analysis: • Graph: Size Determination of
DNA Restriction Fragments (p.10) • Answer Study Questions #1-2 (p.
12) Lambda DNA cut with EcoRI
DNA Ladder - known quantities of DNALambda DNA
Lambda DNA
Copyright © 2012 Rebecca Rehder Wingerden
Fragment Distance Migrated (mm) Length (bp)
1 (top) 23109
2 9416
3 6557
4 4361
5 3000
6 2322
7 2027
8 725
9 570
Table 1: DNA Marker Standard - Lane 1
NOTE: The first fragment is too large to migrate properly in agarose and will not fit within your line of best fit, and should be discarded.
Copyright © 2012 Rebecca Rehder Wingerden
Fragment Distance Migrated (mm) Length (bp)
1
2
3
4
5
6
Table 2: Lambda DNA cut w/ Eco RI - Lane 2
Copyright © 2012 Rebecca Rehder Wingerden
Table 3: Lambda DNA (UNcut) - Lane 3
Fragment Distance Migrated (mm) Length (bp)
1
Use the “best fit line” on your graph (Determination of Unknown DNA Fragment Size) to determine the length of the DNA fragments in lanes 2 and 3.
Copyright © 2012 Rebecca Rehder Wingerden
Figure 1: Lambda DNA cut with EcoRI
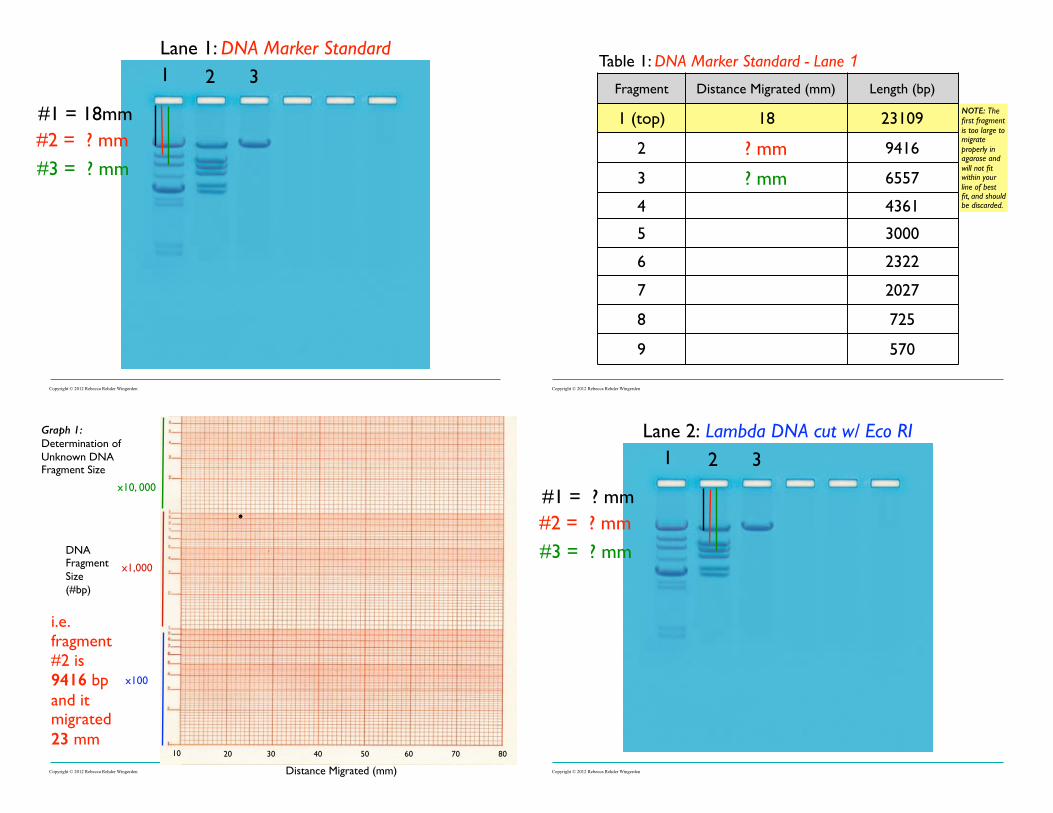
#1 = 18mm#2 = ? mm
#3 = ? mm
1 2 3
Lane 1: DNA Marker Standard
Copyright © 2012 Rebecca Rehder Wingerden
Fragment Distance Migrated (mm) Length (bp)
1 (top) 18 23109
2 ? mm 9416
3 ? mm 6557
4 4361
5 3000
6 2322
7 2027
8 725
9 570
Table 1: DNA Marker Standard - Lane 1
NOTE: The first fragment is too large to migrate properly in agarose and will not fit within your line of best fit, and should be discarded.
Copyright © 2012 Rebecca Rehder Wingerden
Graph 1: Determination of Unknown DNA Fragment Size
DNA Fragment Size (#bp)
Distance Migrated (mm)
10 20 30 40 50 60 70 80
x100
x1,000
x10, 000
i.e. fragment #2 is 9416 bp and itmigrated 23 mm
Copyright © 2012 Rebecca Rehder Wingerden
#1 = ? mm#2 = ? mm
#3 = ? mm
1 2 3
Lane 2: Lambda DNA cut w/ Eco RI
Copyright © 2012 Rebecca Rehder Wingerden

Fragment Distance Migrated (mm) Length (bp)
1 ? mm
2 ? mm
3 ? mm
4
5
6
Table 2: Lambda DNA cut w/ Eco RI - Lane 2
#1 = ? mm
1 2 3
Lane 3: Lambda DNA (UNcut)
Copyright © 2012 Rebecca Rehder Wingerden
Table 3: Lambda DNA (UNcut) - Lane 3
Fragment Distance Migrated (mm) Length (bp)
1 ? mm
Copyright © 2012 Rebecca Rehder Wingerden
Use the “best fit line” on your graph (Determination of Unknown DNA
Fragment Size) to determine the length of the DNA fragments in lanes 2 and 3.
Complete Activity- Restriction Enzyme Cleavage of DNA (EDVOTEK 112)
Investigation 9: Restriction Enzyme Analysis
• Complete Procedure steps 1-6 (p.9) • Collect Data:
• Table 1: DNA Marker Standard • Table 2: Lambda DNA cut with
EcoRI • Table 3: Lambda DNA (UNcut)
Lambda DNA cut with EcoRI
DNA Ladder - known quantities of DNALambda DNA
Lambda DNA
Copyright © 2012 Rebecca Rehder Wingerden
• Analysis: • Graph: Size Determination of
DNA Restriction Fragments (p.10) • Answer Study Questions #1-2 (p.
12)


