AP Biology Discussion Notes -...
56
AP Biology Discussion Notes Monday 12/11/2017
Transcript of AP Biology Discussion Notes -...
AP Biology Discussion Notes
Monday 12/11/2017
Goals for the Day
1. Be able to identify and describe inputs
and outputs in each stage of cell
respiration
2. Be able to say where each piece of cell
respiration occurs
3. Describe how cell respiration is regulated
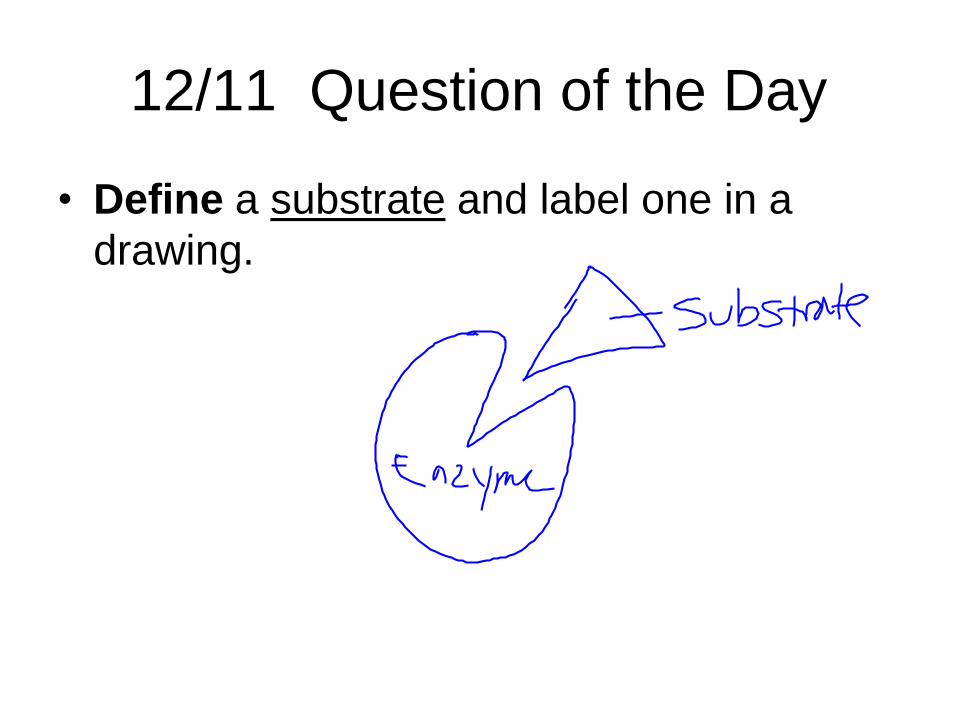
12/11 Question of the Day
• Define a substrate and label one in a
drawing.
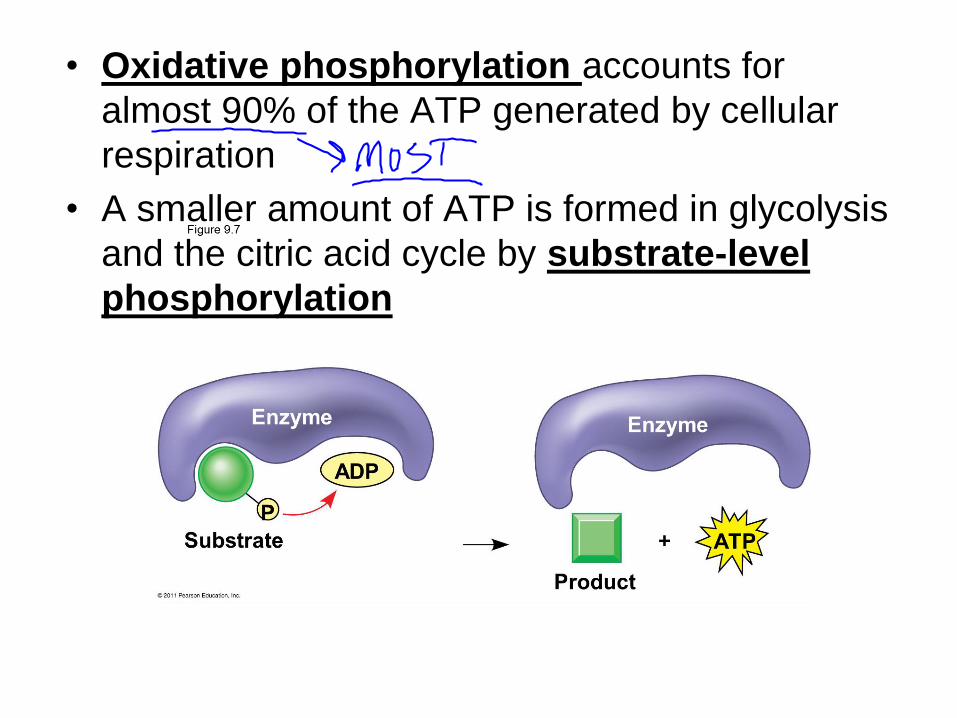
• Oxidative phosphorylation accounts for
almost 90% of the ATP generated by cellular
respiration
• A smaller amount of ATP is formed in glycolysis
and the citric acid cycle by substrate-level
phosphorylation
What is the first step of cell
respiration in ALL organisms?

Figure 9.18
Glucose
CYTOSOLGlycolysis
Pyruvate
No O2 present:
Fermentation
O2 present:
Aerobic cellular
respiration
Ethanol,
lactate, or
other products
Acetyl CoA
MITOCHONDRION
Citric
acid
cycle
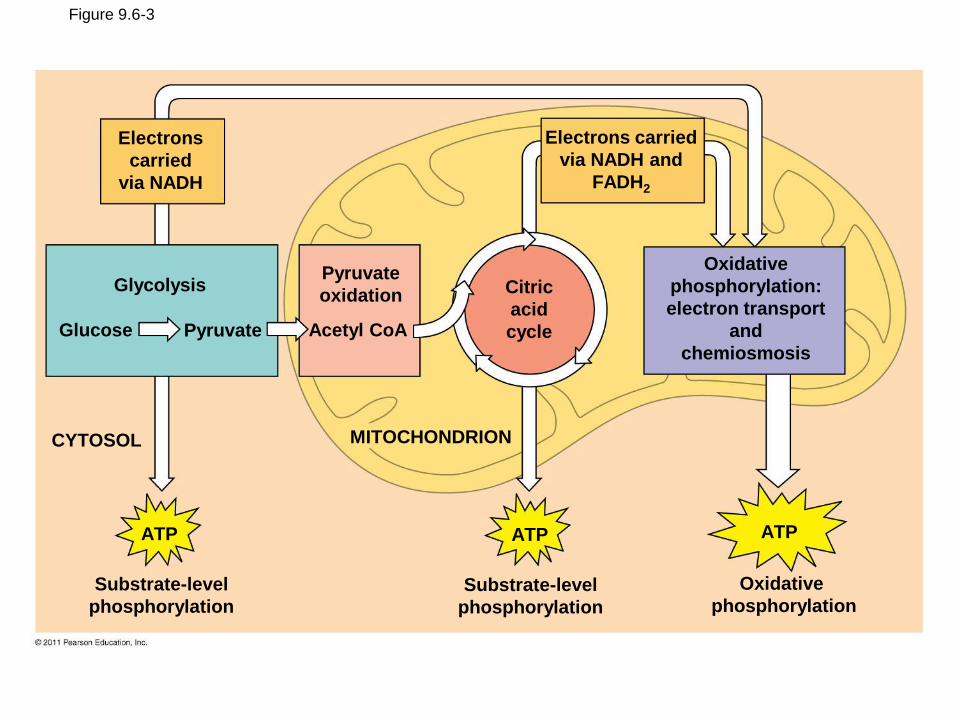
Figure 9.6-3
Electrons
carried
via NADH
Electrons carried
via NADH and
FADH2
Citric
acid
cycle
Pyruvate
oxidation
Acetyl CoA
Glycolysis
Glucose Pyruvate
Oxidative
phosphorylation:
electron transport
and
chemiosmosis
CYTOSOL MITOCHONDRION
ATP ATP ATP
Substrate-level
phosphorylationSubstrate-level
phosphorylation
Oxidative
phosphorylation
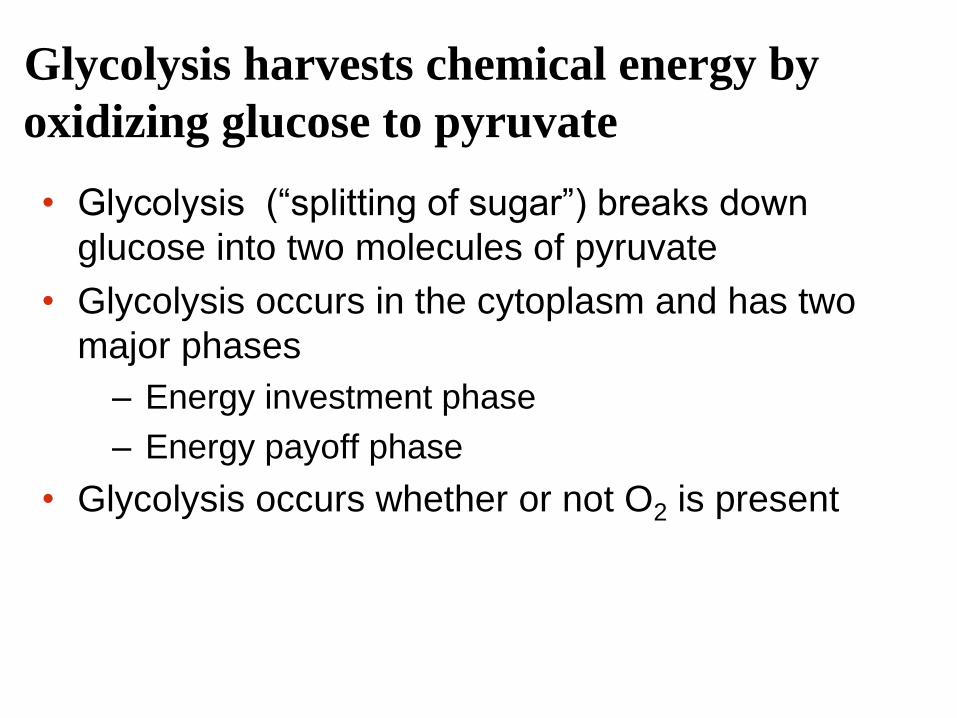
Glycolysis harvests chemical energy by
oxidizing glucose to pyruvate
• Glycolysis (“splitting of sugar”) breaks down
glucose into two molecules of pyruvate
• Glycolysis occurs in the cytoplasm and has two
major phases
– Energy investment phase
– Energy payoff phase
• Glycolysis occurs whether or not O2 is present
The Evolutionary Significance of Glycolysis
• Ancient prokaryotes are thought to have used
glycolysis long before there was oxygen in the
atmosphere
• Very little O2 was available in the atmosphere
until about 2.7 billion years ago, so early
prokaryotes likely used only glycolysis to
generate ATP
• Glycolysis is a very ancient process
Glycolysis – Happens in:
Inputs/Reactants OUTputs/Products

Figure 9.8
Energy Investment Phase
Glucose
2 ADP 2 P
4 ADP 4 P
Energy Payoff Phase
2 NAD+ 4 e 4 H+
2 Pyruvate 2 H2O
2 ATP used
4 ATP formed
2 NADH 2 H+
NetGlucose 2 Pyruvate 2 H2O
2 ATP
2 NADH 2 H+2 NAD+ 4 e 4 H+
4 ATP formed 2 ATP used
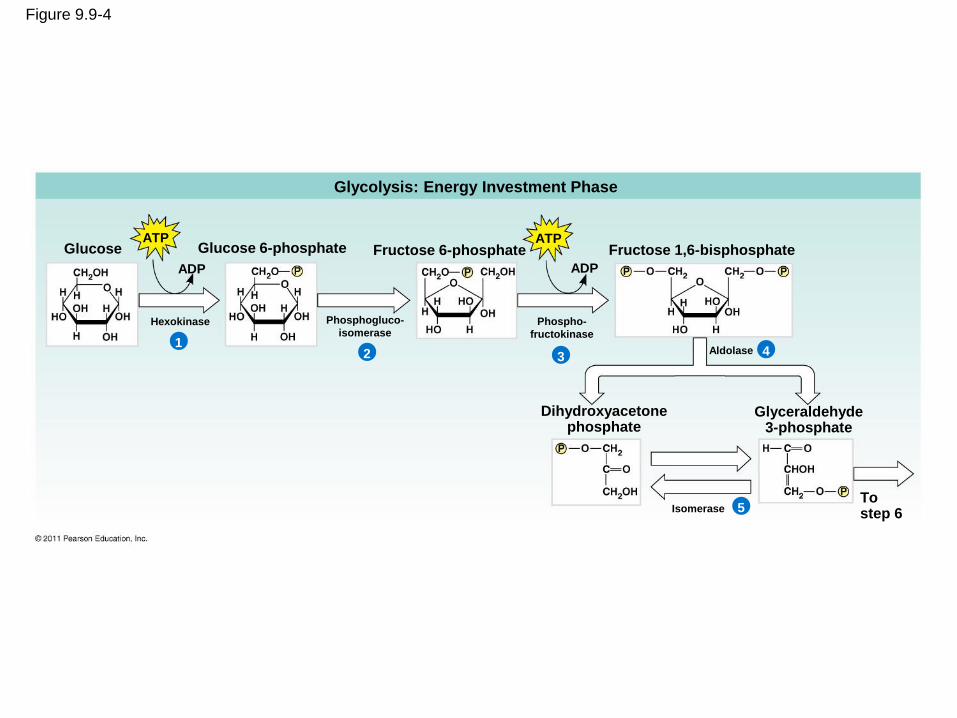
Figure 9.9-4
Glycolysis: Energy Investment Phase
ATP ATPGlucose Glucose 6-phosphate Fructose 6-phosphate Fructose 1,6-bisphosphate
Dihydroxyacetonephosphate
Glyceraldehyde3-phosphate
Tostep 6
ADP ADP
Hexokinase Phosphogluco-
isomerasePhospho-
fructokinase
Aldolase
Isomerase
12 3 4
5
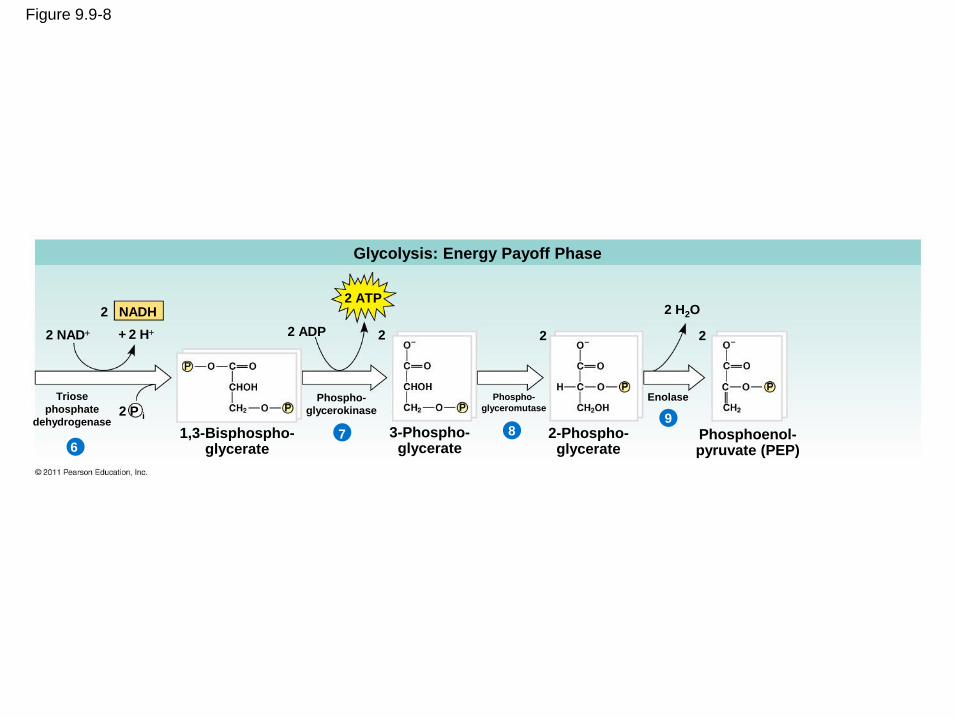
Figure 9.9-8
Glycolysis: Energy Payoff Phase
2 ATP2 NADH
2 NAD + 2 H
2 P i
2 ADP
1,3-Bisphospho-glycerate
3-Phospho-glycerate
2-Phospho-glycerate
Phosphoenol-pyruvate (PEP)
2 2 2
2 H2O
Phospho-
glycerokinase
Phospho-
glyceromutaseEnolase
67 8
9
Triose
phosphate
dehydrogenase
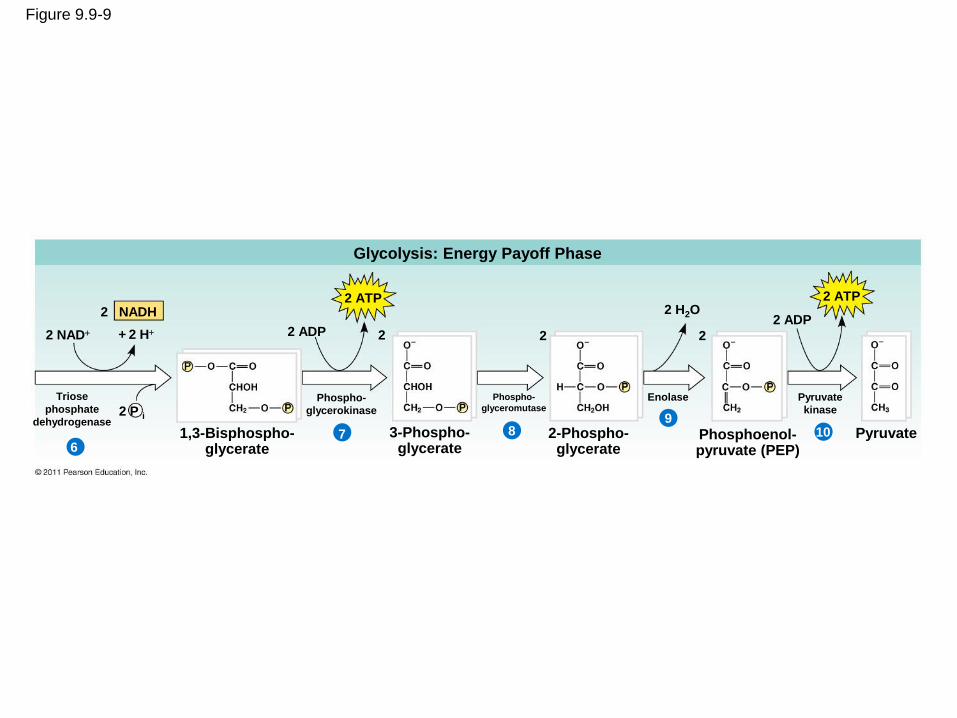
Figure 9.9-9
Glycolysis: Energy Payoff Phase
2 ATP 2 ATP
2 NADH
2 NAD + 2 H
2 P i
2 ADP
1,3-Bisphospho-glycerate
3-Phospho-glycerate
2-Phospho-glycerate
Phosphoenol-pyruvate (PEP)
Pyruvate
2 ADP2 2 2
2 H2O
Phospho-
glycerokinase
Phospho-
glyceromutaseEnolase Pyruvate
kinase
67 8
910
Triose
phosphate
dehydrogenase
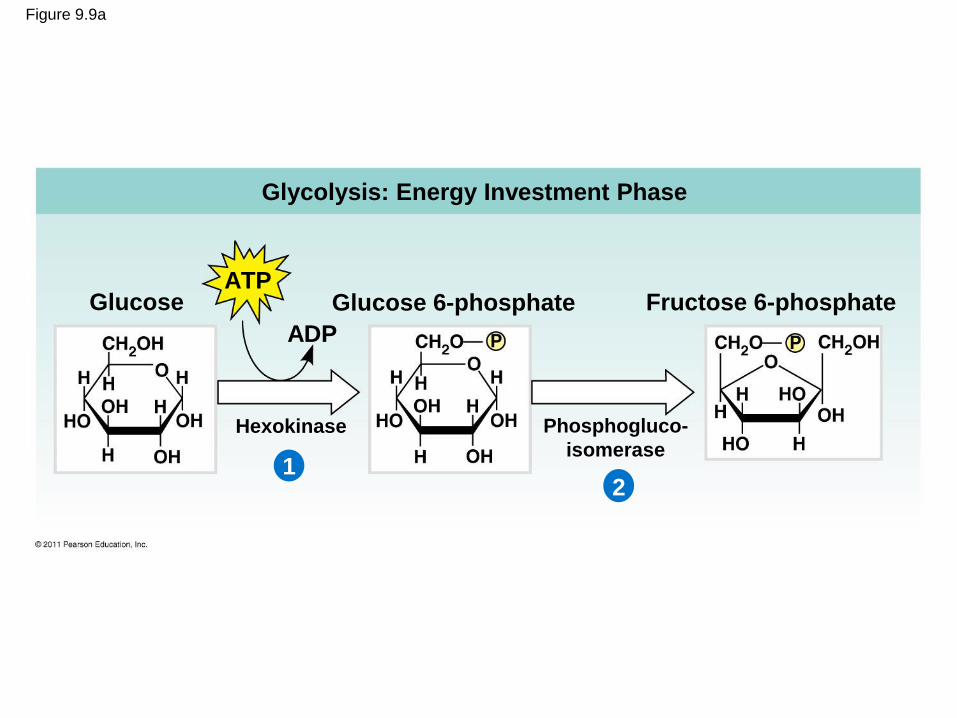
Figure 9.9a
Glycolysis: Energy Investment Phase
ATPGlucose Glucose 6-phosphate
ADP
Hexokinase
1
Fructose 6-phosphate
Phosphogluco-
isomerase
2
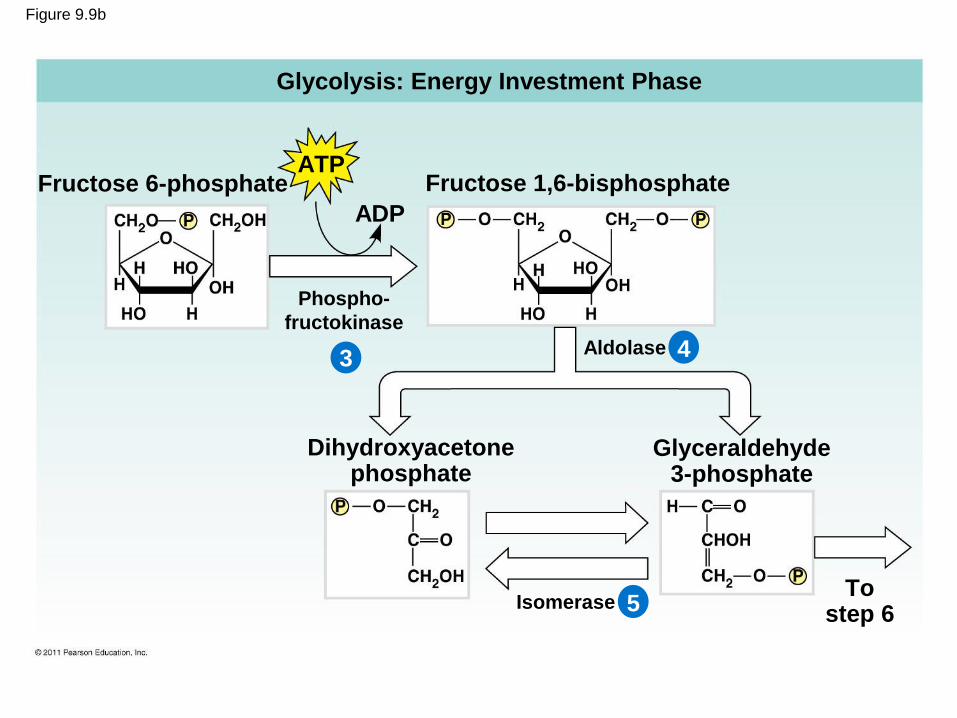
Figure 9.9b
Glycolysis: Energy Investment Phase
ATPFructose 6-phosphate
ADP
3
Fructose 1,6-bisphosphate
Phospho-
fructokinase
4
5
Aldolase
Dihydroxyacetonephosphate
Glyceraldehyde3-phosphate
Tostep 6
Isomerase
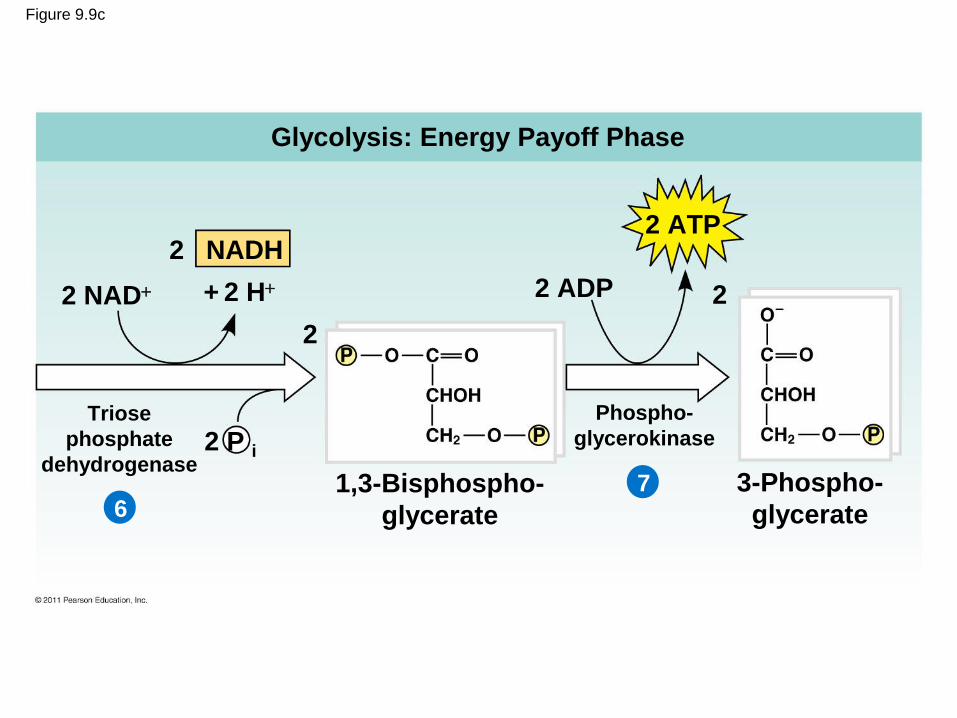
Figure 9.9c
Glycolysis: Energy Payoff Phase
2 NADH2 ATP
2 ADP 2
2
2 NAD + 2 H
2 P i
3-Phospho-
glycerate1,3-Bisphospho-
glycerate
Triose
phosphate
dehydrogenase
Phospho-
glycerokinase
67
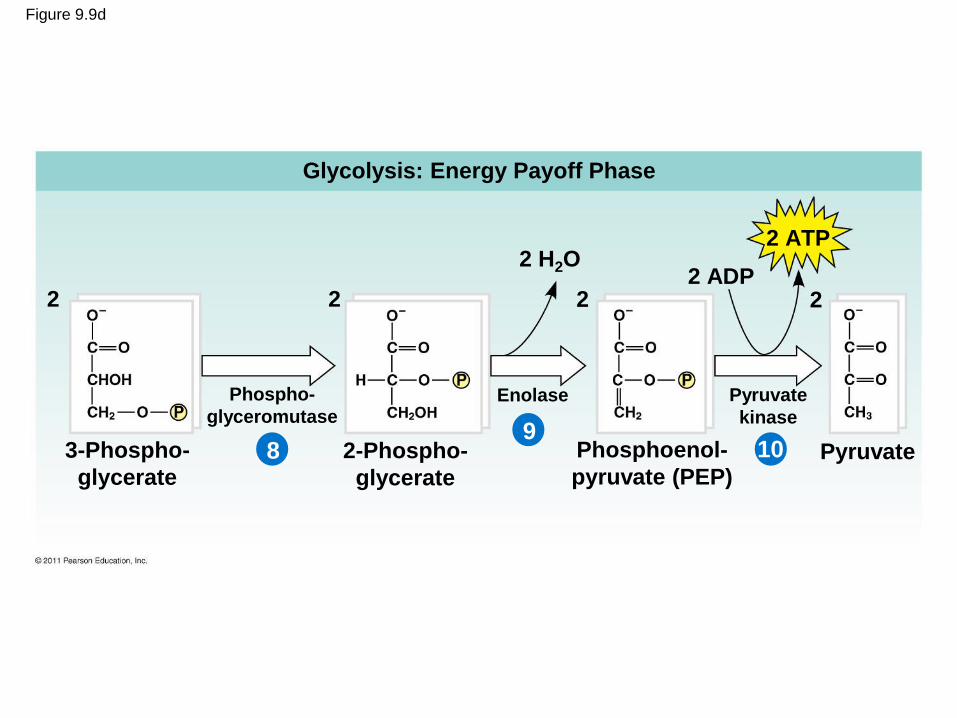
Figure 9.9d
Glycolysis: Energy Payoff Phase
2 ATP
2 ADP2222
2 H2O
PyruvatePhosphoenol-
pyruvate (PEP)2-Phospho-
glycerate
3-Phospho-
glycerate8
910
Phospho-
glyceromutaseEnolase Pyruvate
kinase
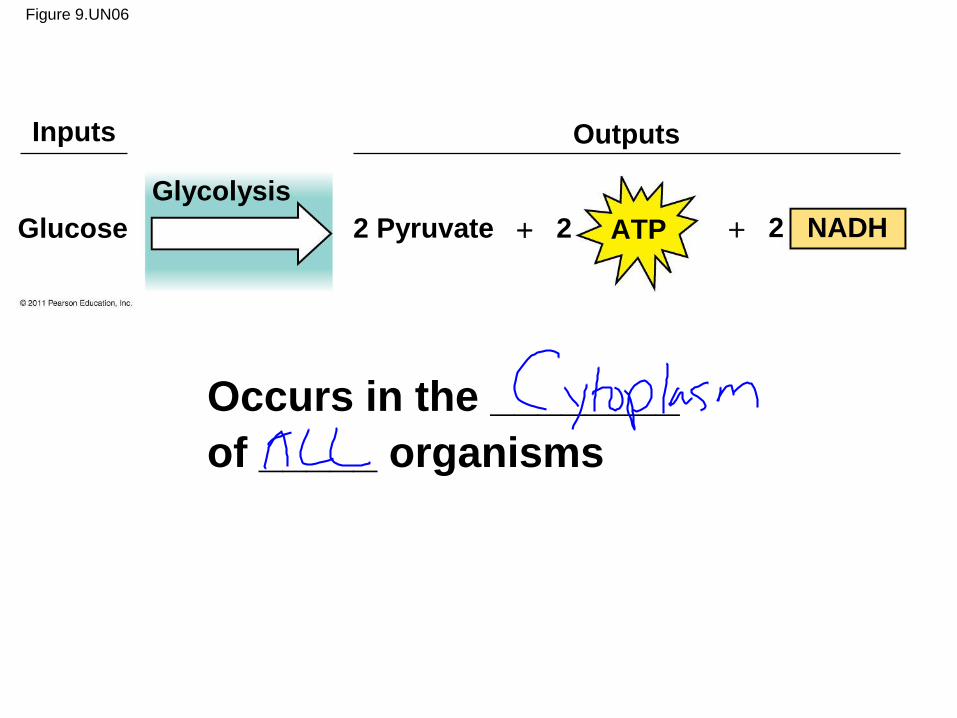
Figure 9.UN06
Inputs Outputs
Glucose
Glycolysis
2 Pyruvate 2 ATP 2 NADH
Occurs in the ________
of _____ organisms
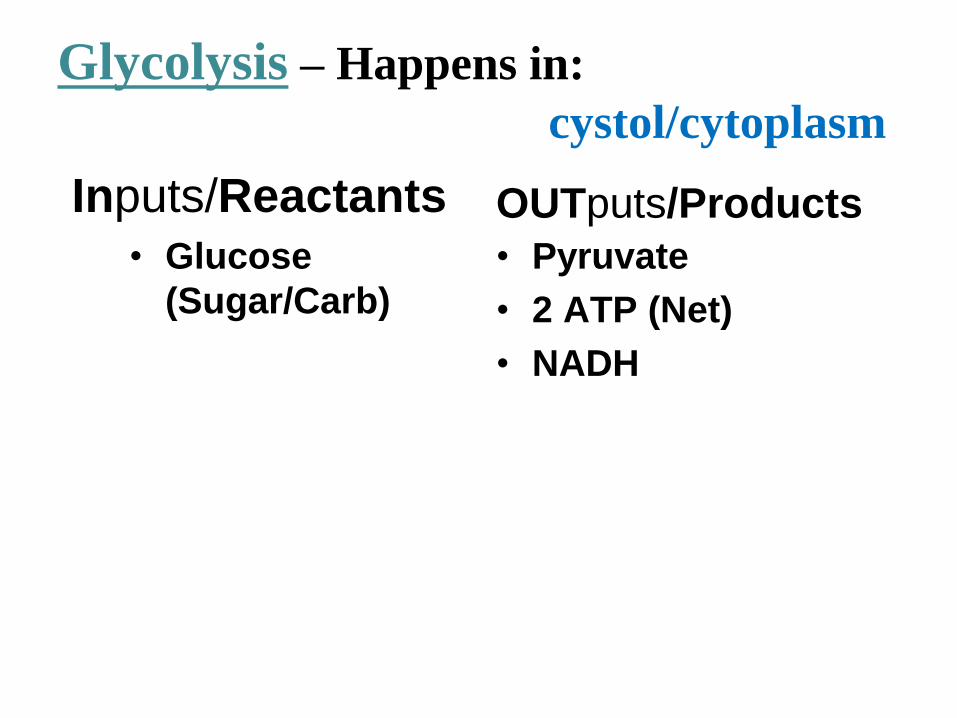
Glycolysis – Happens in:
cystol/cytoplasm
• Glucose
(Sugar/Carb)
• Pyruvate
• 2 ATP (Net)
• NADH
Inputs/Reactants OUTputs/Products
Citric Acid Cycle – Happens in:
AKA: Krebs Cycle
Inputs/Reactants OUTputs/Products
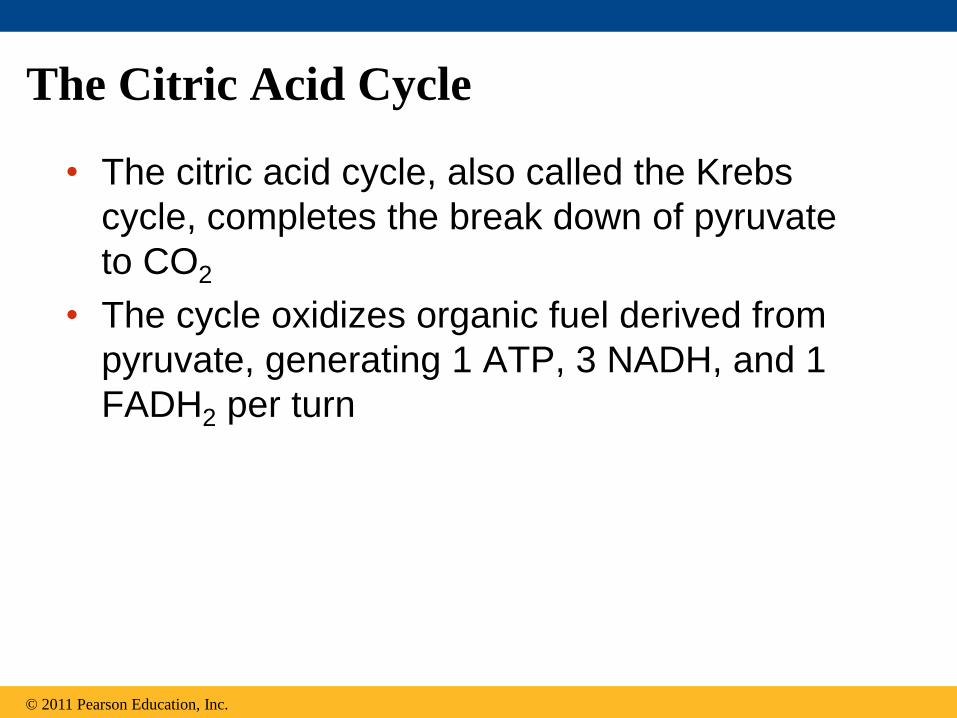
• The citric acid cycle, also called the Krebs
cycle, completes the break down of pyruvate
to CO2
• The cycle oxidizes organic fuel derived from
pyruvate, generating 1 ATP, 3 NADH, and 1
FADH2 per turn
© 2011 Pearson Education, Inc.
The Citric Acid Cycle
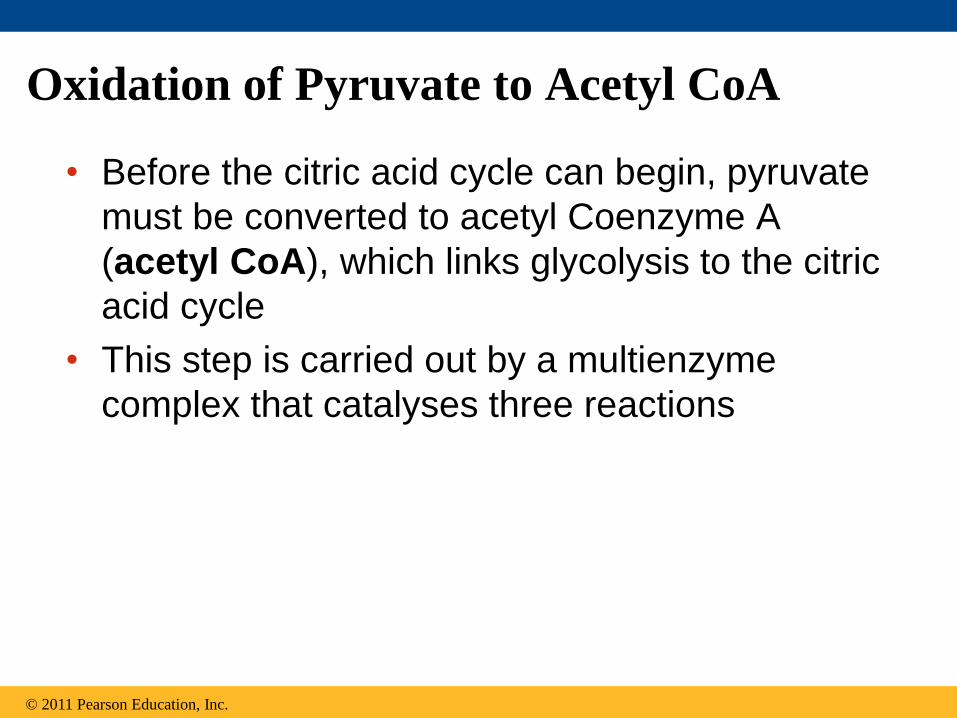
Oxidation of Pyruvate to Acetyl CoA
• Before the citric acid cycle can begin, pyruvate
must be converted to acetyl Coenzyme A
(acetyl CoA), which links glycolysis to the citric
acid cycle
• This step is carried out by a multienzyme
complex that catalyses three reactions
© 2011 Pearson Education, Inc.
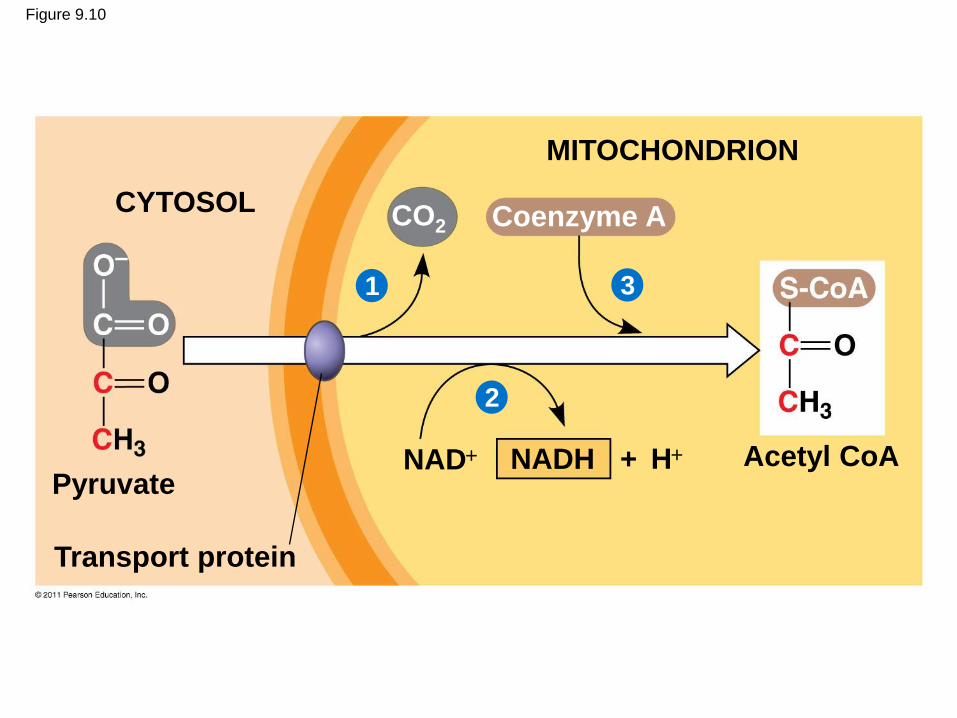
Figure 9.10
Pyruvate
Transport protein
CYTOSOL
MITOCHONDRION
CO2 Coenzyme A
NAD + HNADH Acetyl CoA
1
2
3
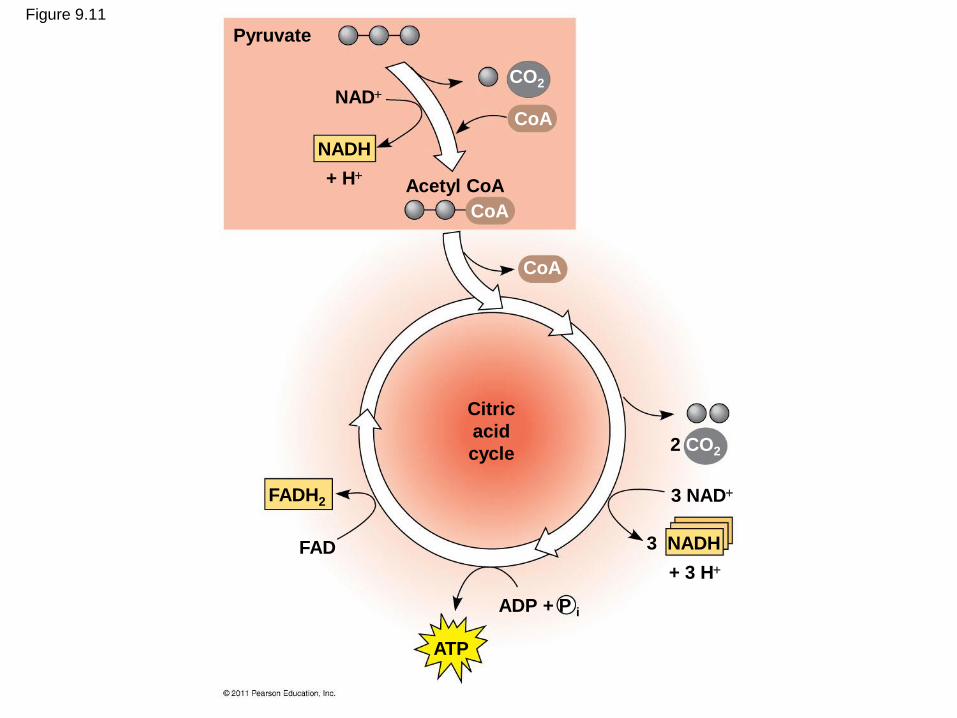
Figure 9.11
Pyruvate
NAD
NADH
+ HAcetyl CoA
CO2
CoA
CoA
CoA
2 CO2
ADP + P i
FADH2
FAD
ATP
3 NADH
3 NAD
Citric
acid
cycle
+ 3 H
• The citric acid cycle has eight steps, each
catalyzed by a specific enzyme
• The acetyl group of acetyl CoA joins the cycle
by combining with oxaloacetate, forming citrate
• The next seven steps decompose the citrate
back to oxaloacetate, making the process a
cycle
• The NADH and FADH2 produced by the cycle
relay electrons extracted from food to the
electron transport chain
© 2011 Pearson Education, Inc.
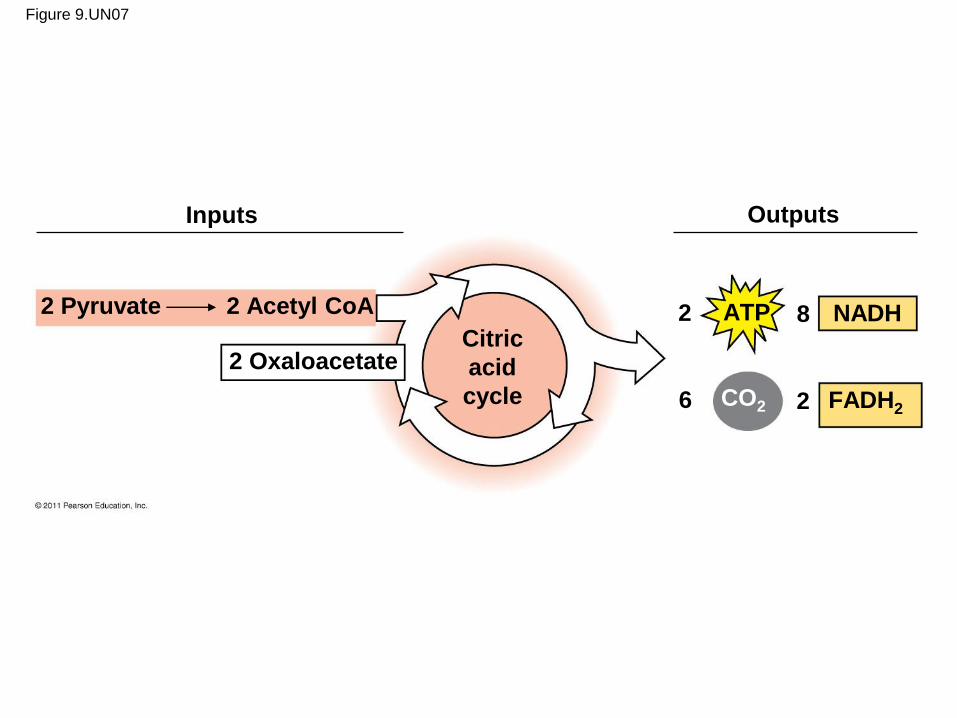
Figure 9.UN07
Inputs Outputs
2 Pyruvate 2 Acetyl CoA
2 OxaloacetateCitric
acid
cycle
2
26
8ATP NADH
FADH2CO2
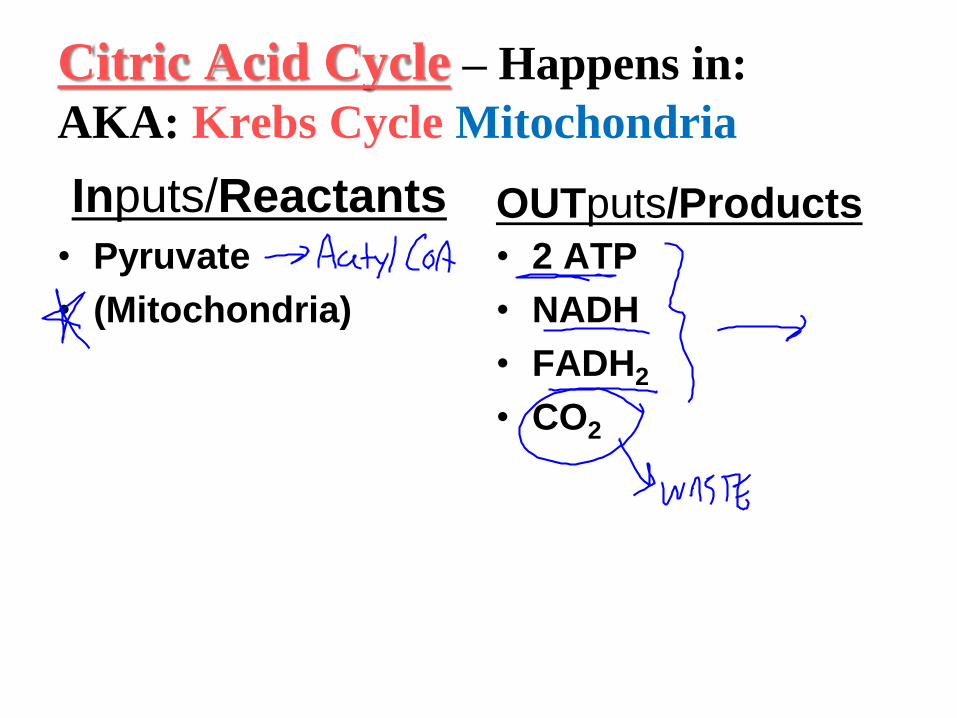
Citric Acid Cycle – Happens in:
AKA: Krebs Cycle Mitochondria
• Pyruvate
• (Mitochondria)
• 2 ATP
• NADH
• FADH2
• CO2
Inputs/Reactants OUTputs/Products
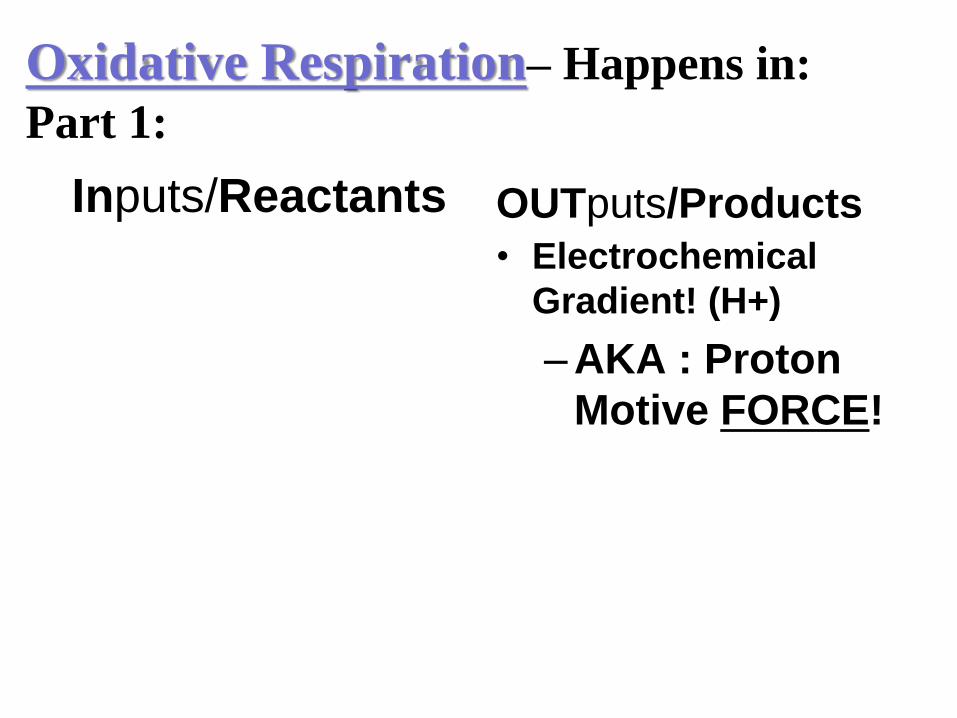
Oxidative Respiration– Happens in:
Part 1:
• Electrochemical
Gradient! (H+)
– AKA : Proton
Motive FORCE!
Inputs/Reactants OUTputs/Products
Concept 9.4: During oxidative
phosphorylation, chemiosmosis couples
electron transport to ATP synthesis
• Following glycolysis and the citric acid cycle,
NADH and FADH2 account for most of the
energy extracted from food
• These two electron carriers donate electrons to
the electron transport chain, which powers ATP
synthesis via oxidative phosphorylation
© 2011 Pearson Education, Inc.
The Pathway of Electron Transport
• The electron transport chain is in the inner
membrane (cristae) of the mitochondrion
• Most of the chain’s components are proteins,
which exist in multiprotein complexes
• The carriers alternate reduced and oxidized
states as they accept and donate electrons
• Electrons drop in free energy as they go down
the chain and are finally passed to O2, forming
H2O
© 2011 Pearson Education, Inc.
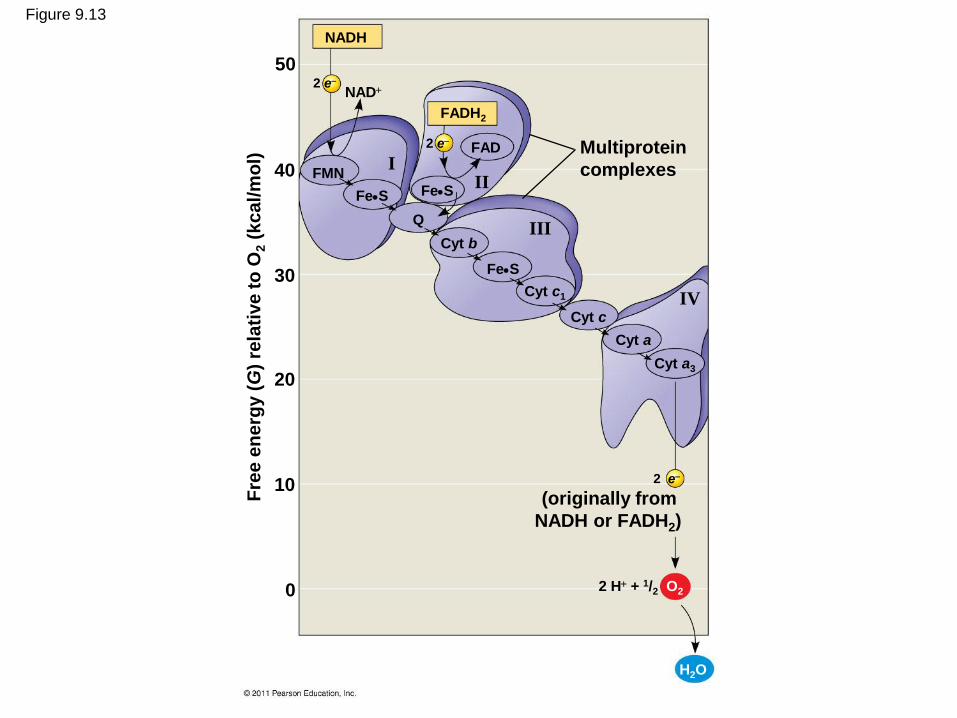
Figure 9.13
NADH
FADH2
2 H + 1/2 O2
2 e
2 e
2 e
H2O
NAD
Multiprotein
complexes
(originally from
NADH or FADH2)
III
III
IV
50
40
30
20
10
0
Fre
e e
ne
rgy (
G)
rela
tive
to
O2
(kc
al/m
ol)
FMN
Fe•S Fe•S
FAD
Q
Cyt b
Cyt c1
Cyt c
Cyt a
Cyt a3
Fe•S
• Electrons are transferred from NADH or FADH2
to the electron transport chain
• Electrons are passed through a number of
proteins including cytochromes (each with an
iron atom) to O2
• The electron transport chain generates no ATP
directly
• It breaks the large free-energy drop from food
to O2 into smaller steps that release energy in
manageable amounts
© 2011 Pearson Education, Inc.
Figure 9.5
(a) Uncontrolled reaction (b) Cellular respiration
Explosiverelease of
heat and lightenergy
Controlledrelease ofenergy for
synthesis ofATP
Fre
e e
nerg
y,
G
Fre
e e
nerg
y,
G
H2 1/2 O2 2 H 1/2 O2
1/2 O2
H2O H2O
2 H+ 2 e
2 e
2 H+
ATP
ATP
ATP
(from food via NADH)
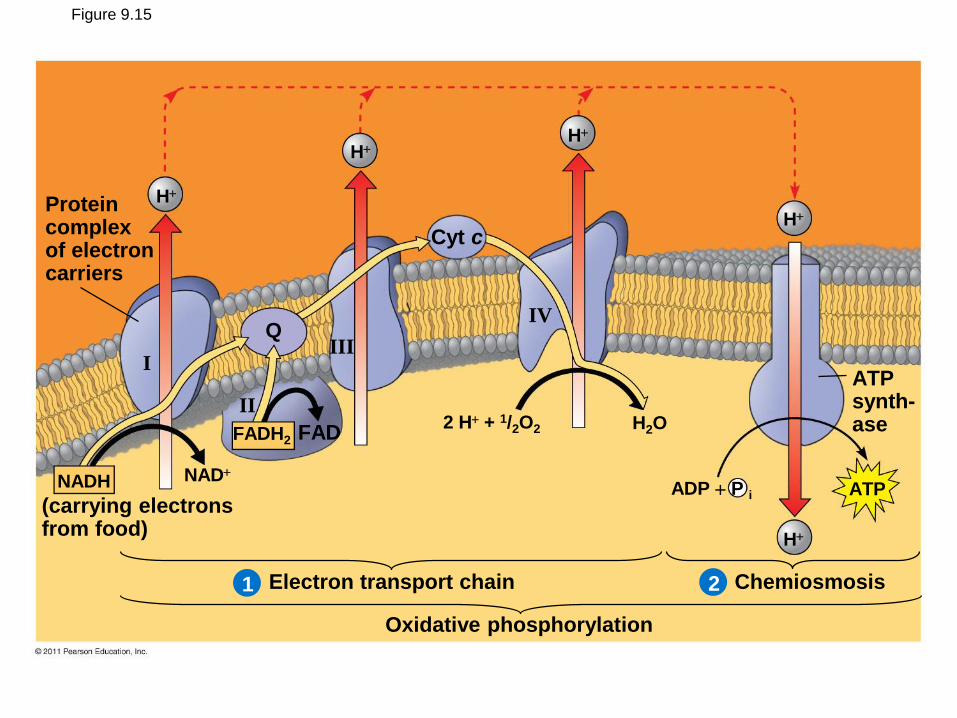
Figure 9.15
Proteincomplexof electroncarriers
(carrying electronsfrom food)
Electron transport chain
Oxidative phosphorylation
Chemiosmosis
ATPsynth-ase
I
II
III
IVQ
Cyt c
FADFADH2
NADH ADP P iNAD
H
2 H + 1/2O2
H
HH
21
H
H2O
ATP
• The energy stored in a H+ gradient across a
membrane couples the redox reactions of the
electron transport chain to ATP synthesis
• The H+ gradient is referred to as a proton-
motive force, emphasizing its capacity to do
work
© 2011 Pearson Education, Inc.
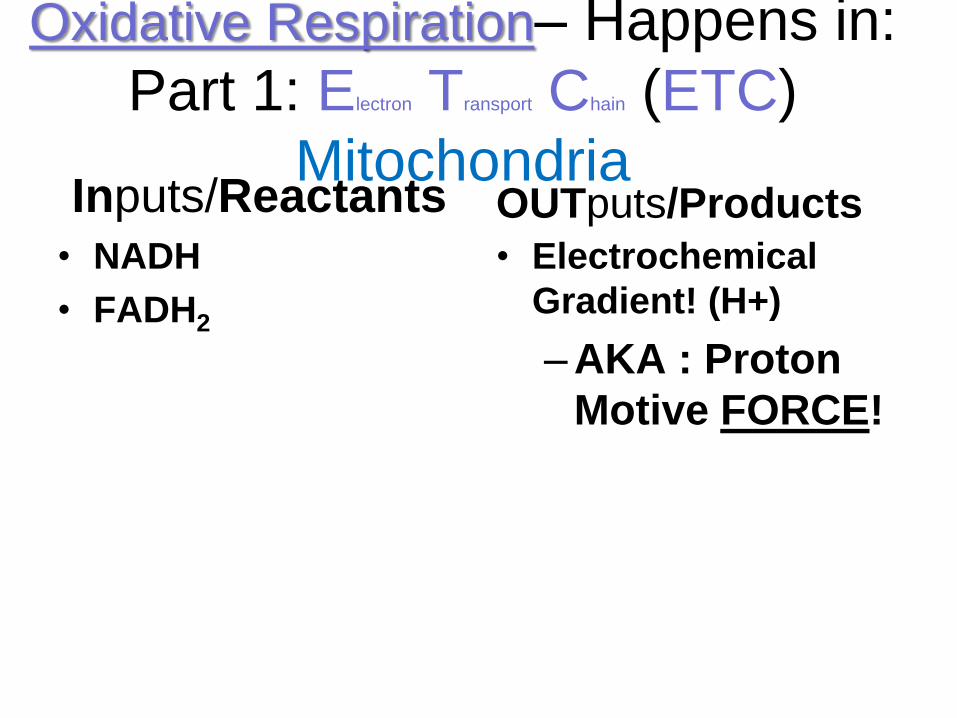
Oxidative Respiration– Happens in:
Part 1: Electron Transport Chain (ETC)
Mitochondria
• NADH
• FADH2
• Electrochemical
Gradient! (H+)
– AKA : Proton
Motive FORCE!
Inputs/Reactants OUTputs/Products
Oxidative Respiration– Happens in:Part 2: Chemiosmosis
Inputs/Reactants OUTputs/Products
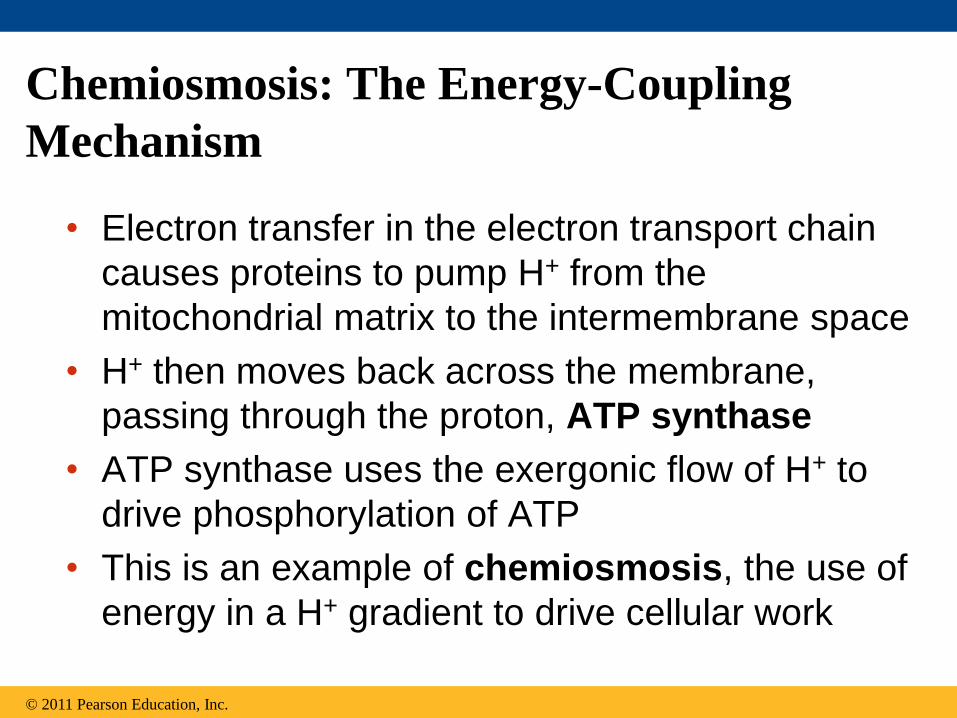
Chemiosmosis: The Energy-Coupling
Mechanism
• Electron transfer in the electron transport chain
causes proteins to pump H+ from the
mitochondrial matrix to the intermembrane space
• H+ then moves back across the membrane,
passing through the proton, ATP synthase
• ATP synthase uses the exergonic flow of H+ to
drive phosphorylation of ATP
• This is an example of chemiosmosis, the use of
energy in a H+ gradient to drive cellular work
© 2011 Pearson Education, Inc.
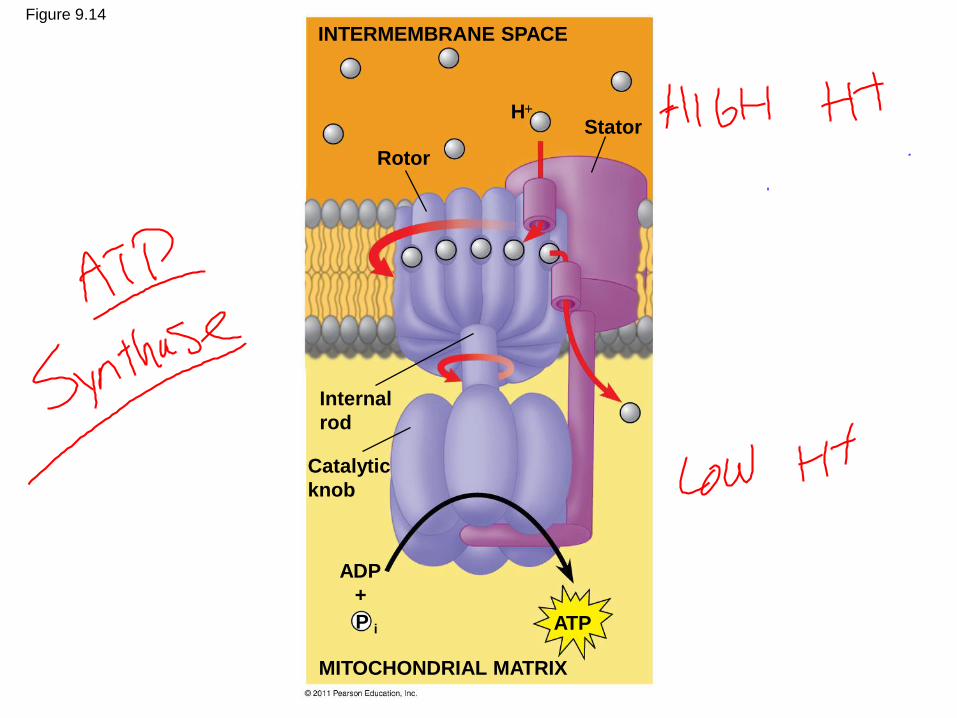
Figure 9.14
INTERMEMBRANE SPACE
Rotor
StatorH
Internal
rod
Catalytic
knob
ADP
+
P i ATP
MITOCHONDRIAL MATRIX
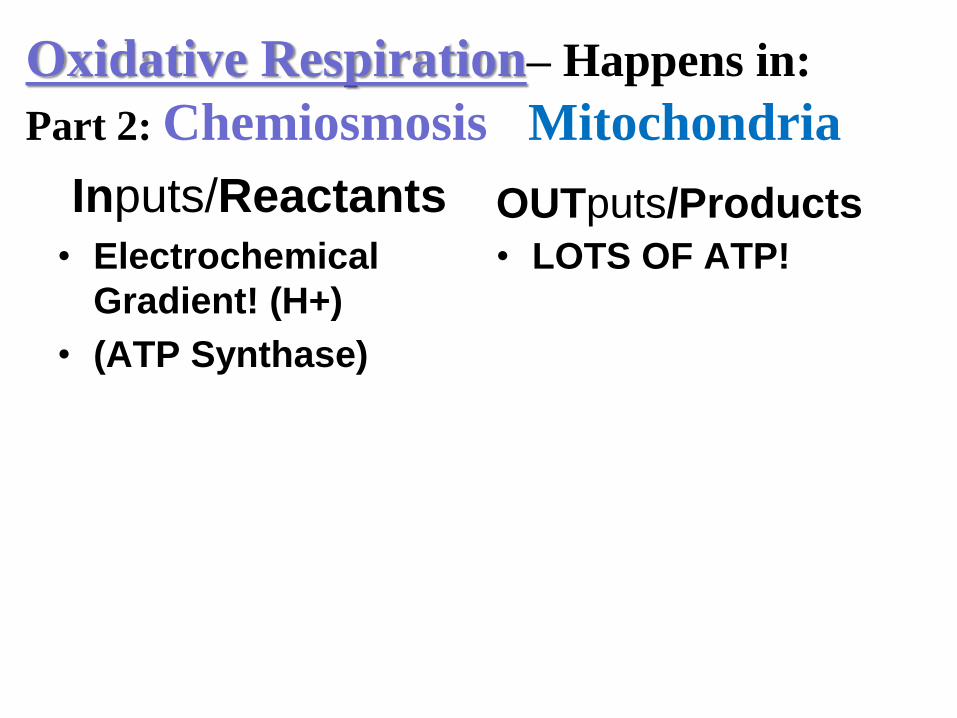
Oxidative Respiration– Happens in:
Part 2: Chemiosmosis Mitochondria
• Electrochemical
Gradient! (H+)
• (ATP Synthase)
• LOTS OF ATP!
Inputs/Reactants OUTputs/Products
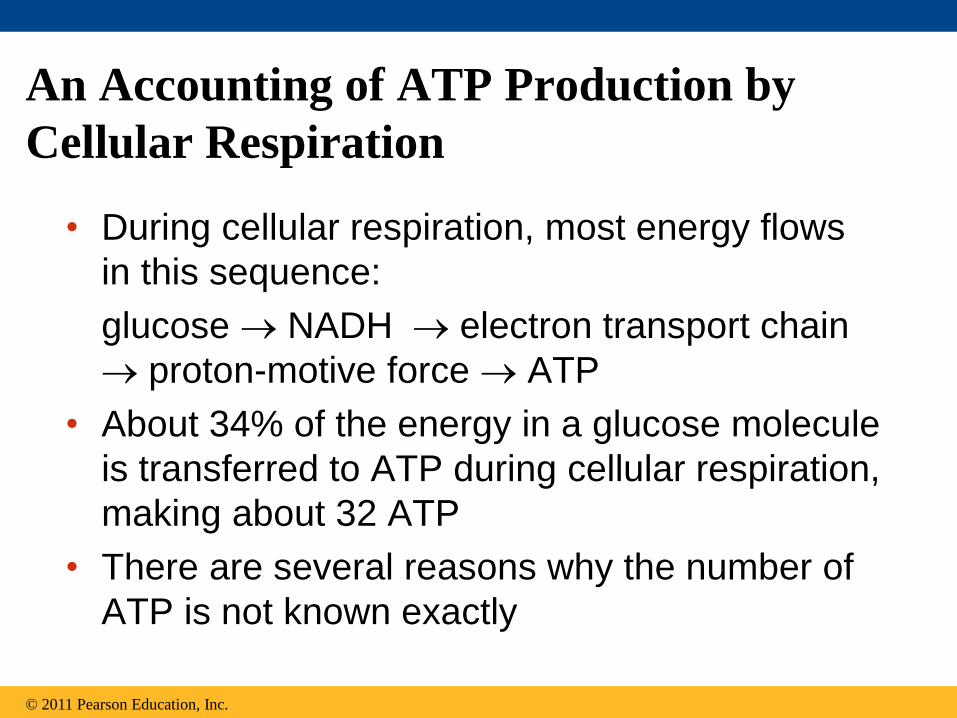
An Accounting of ATP Production by
Cellular Respiration
• During cellular respiration, most energy flows
in this sequence:
glucose NADH electron transport chain
proton-motive force ATP
• About 34% of the energy in a glucose molecule
is transferred to ATP during cellular respiration,
making about 32 ATP
• There are several reasons why the number of
ATP is not known exactly
© 2011 Pearson Education, Inc.
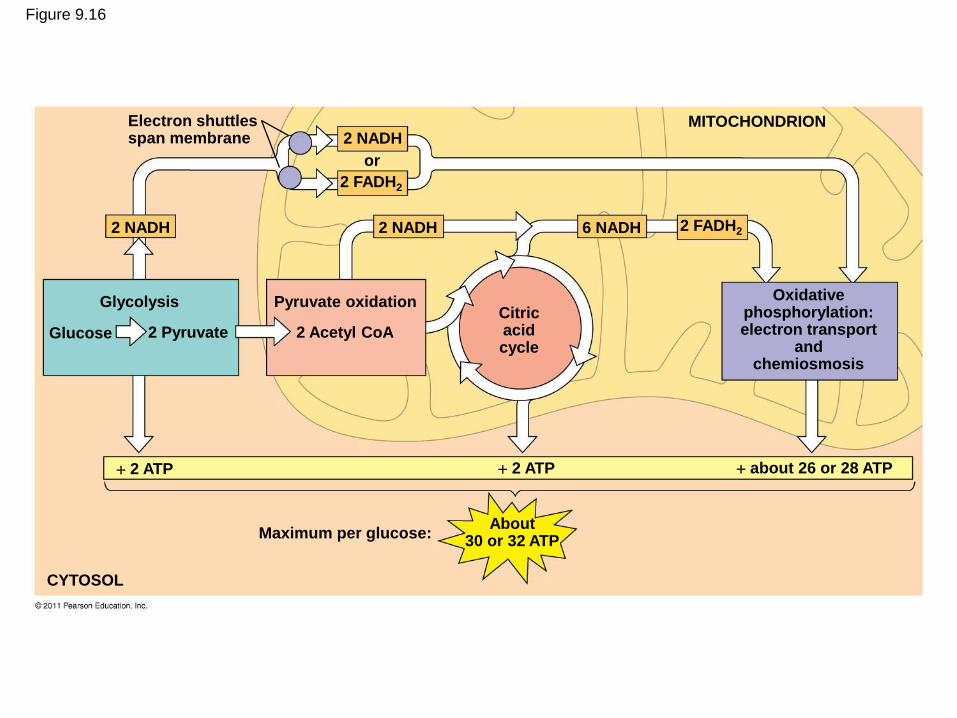
Figure 9.16
Electron shuttlesspan membrane
MITOCHONDRION2 NADH
2 NADH 2 NADH 6 NADH
2 FADH2
2 FADH2
or
2 ATP 2 ATP about 26 or 28 ATP
Glycolysis
Glucose 2 Pyruvate
Pyruvate oxidation
2 Acetyl CoA
Citricacidcycle
Oxidativephosphorylation:electron transport
andchemiosmosis
CYTOSOL
Maximum per glucose:About
30 or 32 ATP
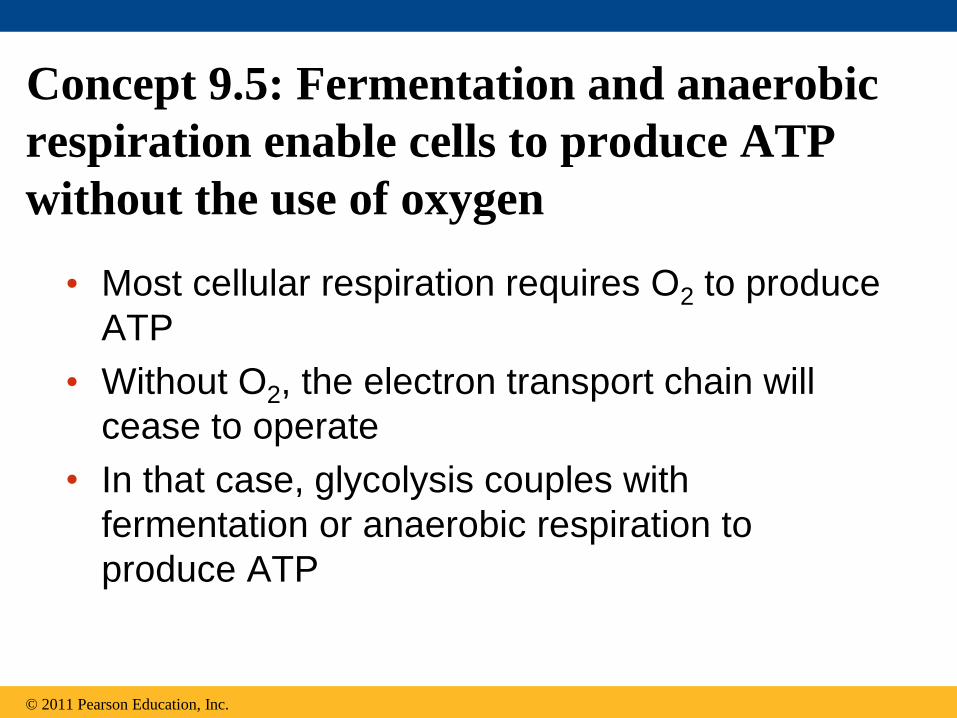
Concept 9.5: Fermentation and anaerobic
respiration enable cells to produce ATP
without the use of oxygen
• Most cellular respiration requires O2 to produce
ATP
• Without O2, the electron transport chain will
cease to operate
• In that case, glycolysis couples with
fermentation or anaerobic respiration to
produce ATP
© 2011 Pearson Education, Inc.
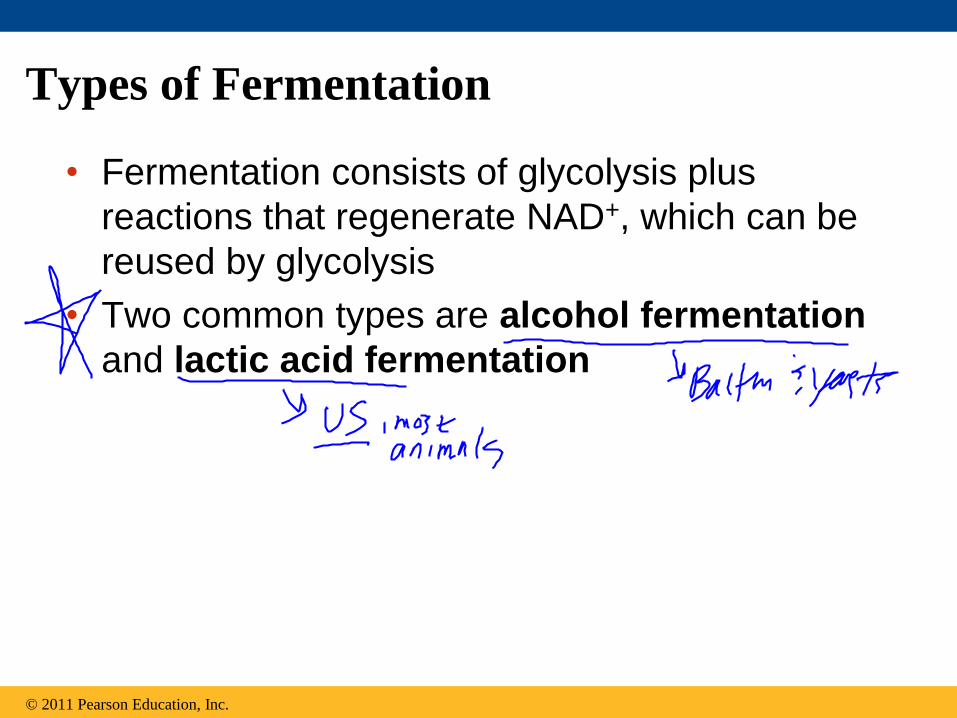
Types of Fermentation
• Fermentation consists of glycolysis plus
reactions that regenerate NAD+, which can be
reused by glycolysis
• Two common types are alcohol fermentation
and lactic acid fermentation
© 2011 Pearson Education, Inc.
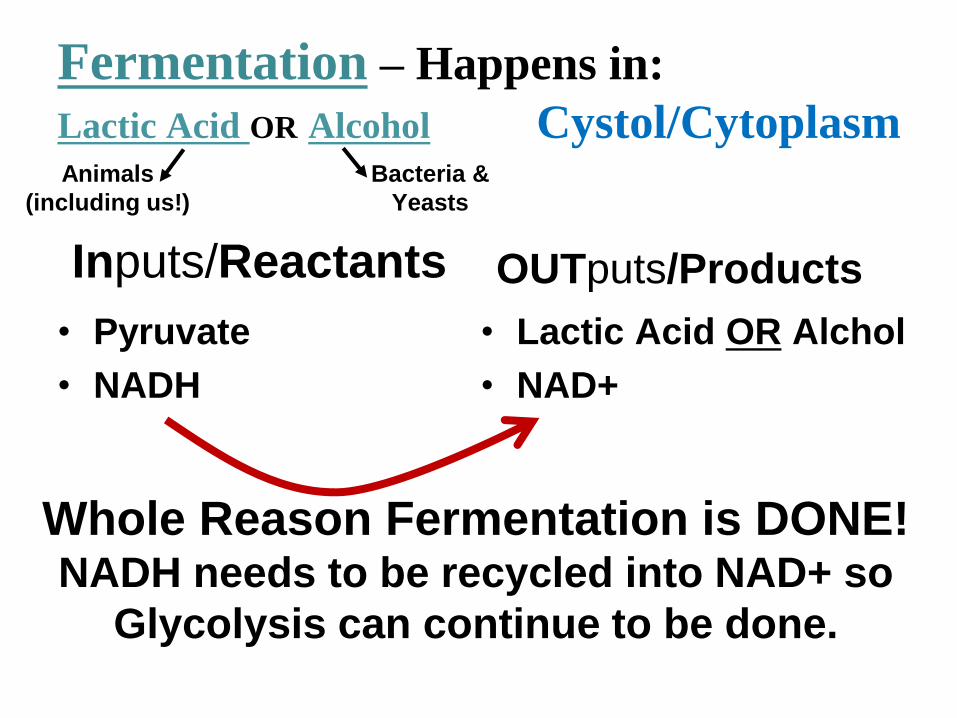
Fermentation – Happens in:
Lactic Acid OR Alcohol Cystol/Cytoplasm
Inputs/Reactants
• Pyruvate
• NADH
OUTputs/Products
• Lactic Acid OR Alchol
• NAD+
Animals
(including us!)
Bacteria &
Yeasts
Whole Reason Fermentation is DONE! NADH needs to be recycled into NAD+ so
Glycolysis can continue to be done.
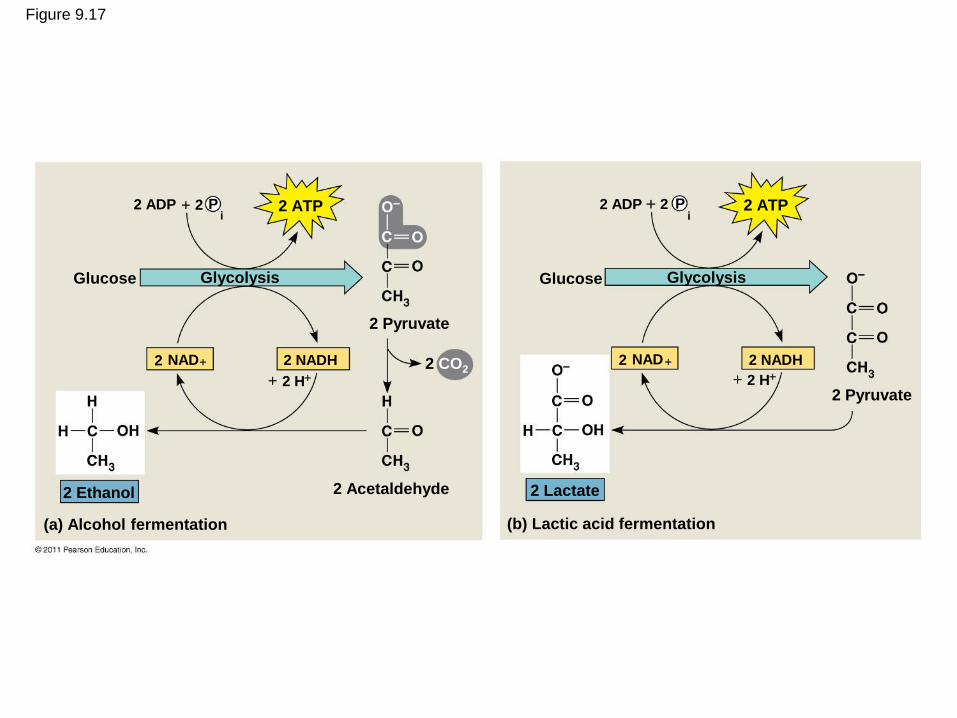
Figure 9.17
2 ADP 2 ATP
Glucose Glycolysis
2 Pyruvate
2 CO22
2 NADH
2 Ethanol 2 Acetaldehyde
(a) Alcohol fermentation (b) Lactic acid fermentation
2 Lactate
2 Pyruvate
2 NADH
Glucose Glycolysis
2 ATP2 ADP 2 Pi
NAD
2 H
2 Pi
2 NAD
2 H
Comparing Fermentation with Anaerobic
and Aerobic Respiration
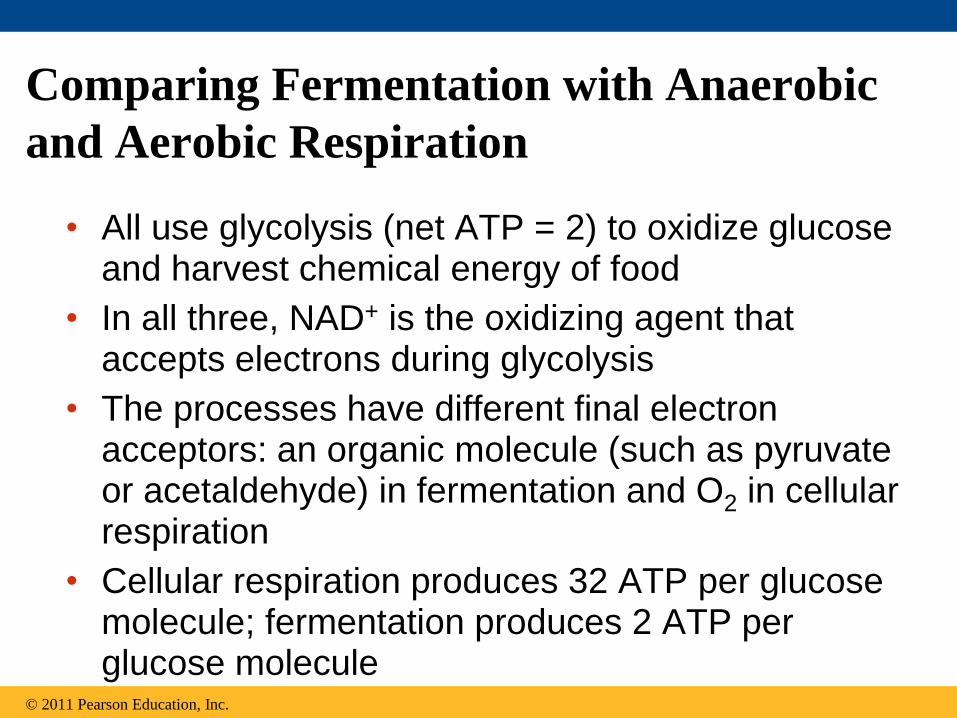
• All use glycolysis (net ATP = 2) to oxidize glucose and harvest chemical energy of food
• In all three, NAD+ is the oxidizing agent that accepts electrons during glycolysis
• The processes have different final electron acceptors: an organic molecule (such as pyruvate or acetaldehyde) in fermentation and O2 in cellular respiration
• Cellular respiration produces 32 ATP per glucose molecule; fermentation produces 2 ATP per glucose molecule
© 2011 Pearson Education, Inc.
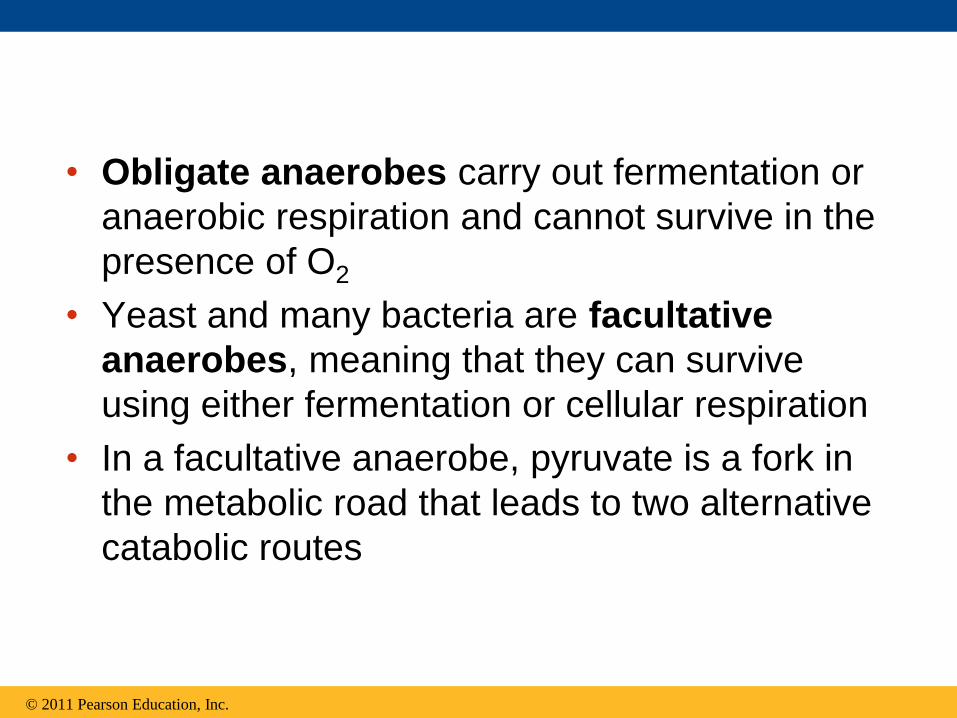
• Obligate anaerobes carry out fermentation or
anaerobic respiration and cannot survive in the
presence of O2
• Yeast and many bacteria are facultative
anaerobes, meaning that they can survive
using either fermentation or cellular respiration
• In a facultative anaerobe, pyruvate is a fork in
the metabolic road that leads to two alternative
catabolic routes
© 2011 Pearson Education, Inc.
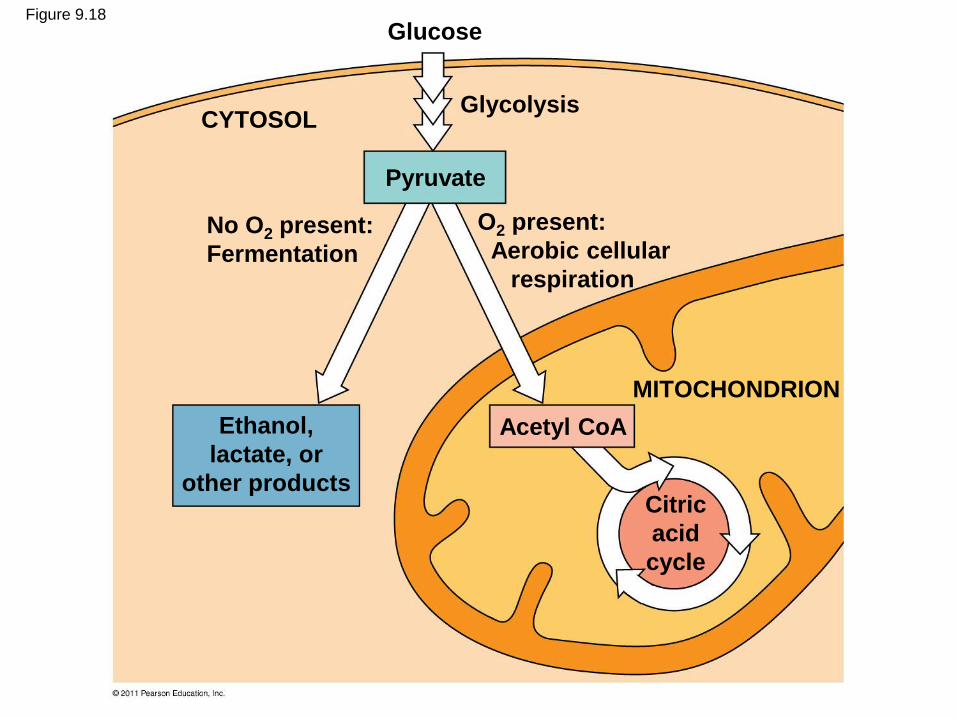
Figure 9.18
Glucose
CYTOSOLGlycolysis
Pyruvate
No O2 present:
Fermentation
O2 present:
Aerobic cellular
respiration
Ethanol,
lactate, or
other products
Acetyl CoA
MITOCHONDRION
Citric
acid
cycle
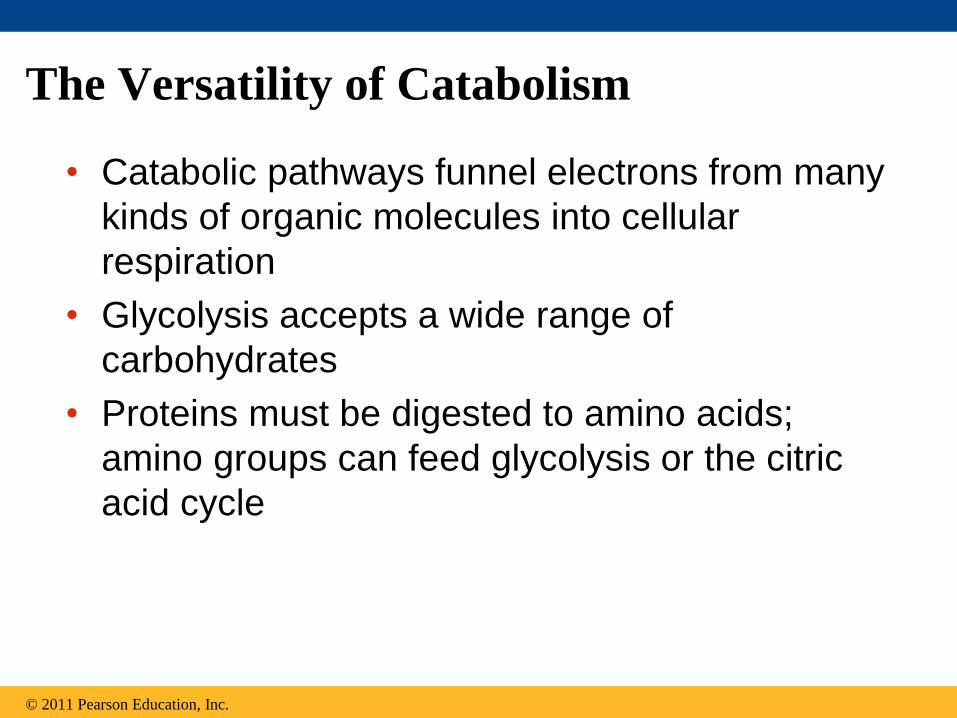
The Versatility of Catabolism
• Catabolic pathways funnel electrons from many
kinds of organic molecules into cellular
respiration
• Glycolysis accepts a wide range of
carbohydrates
• Proteins must be digested to amino acids;
amino groups can feed glycolysis or the citric
acid cycle
© 2011 Pearson Education, Inc.
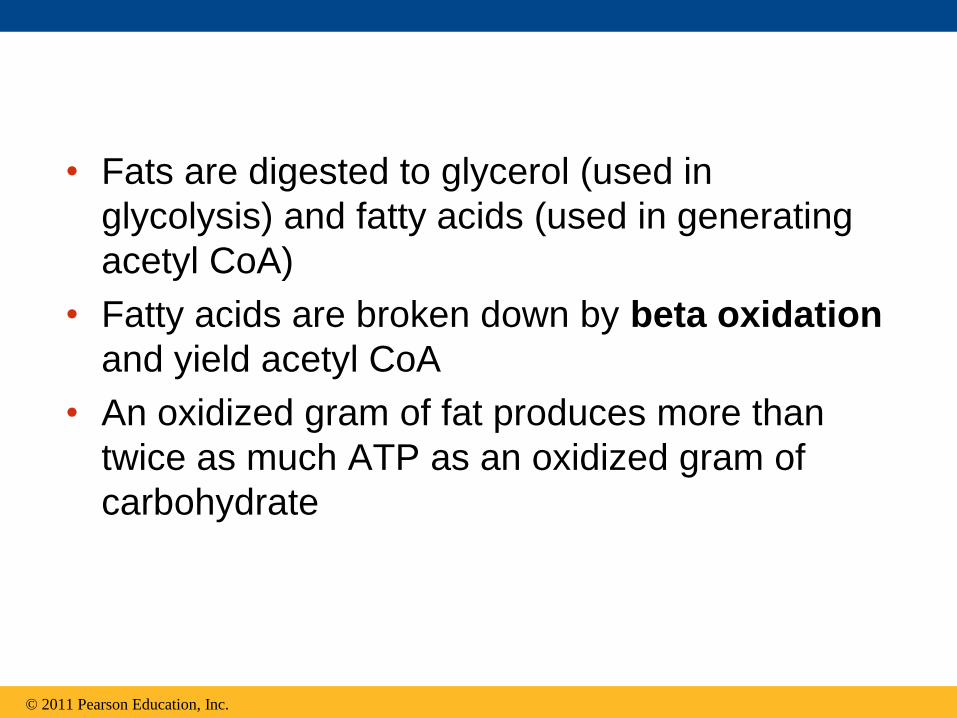
• Fats are digested to glycerol (used in
glycolysis) and fatty acids (used in generating
acetyl CoA)
• Fatty acids are broken down by beta oxidation
and yield acetyl CoA
• An oxidized gram of fat produces more than
twice as much ATP as an oxidized gram of
carbohydrate
© 2011 Pearson Education, Inc.
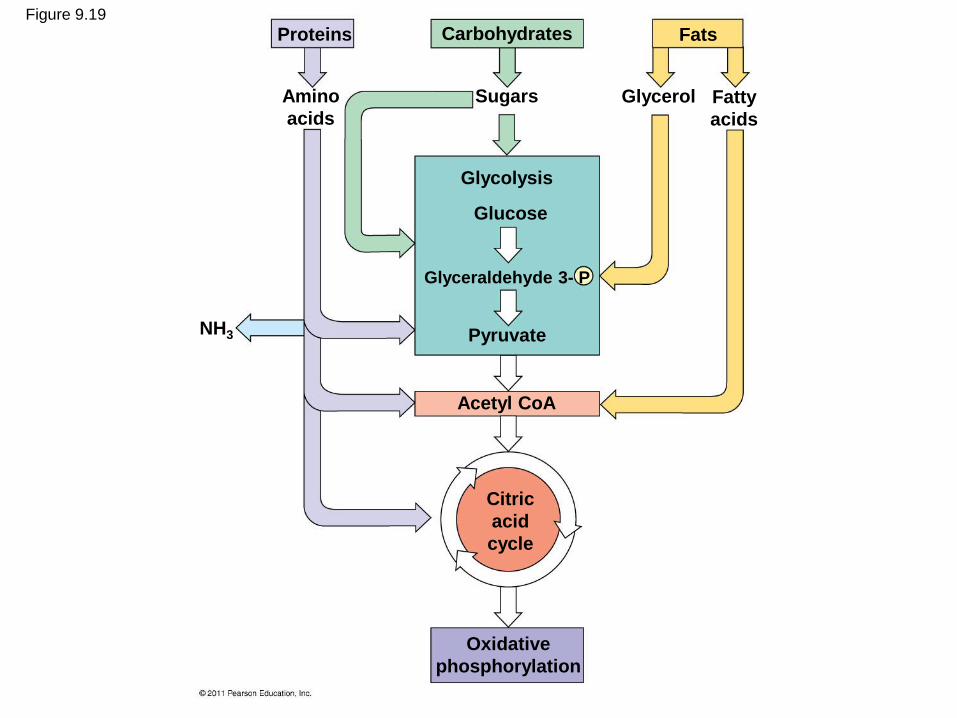
Figure 9.19
CarbohydratesProteins
Fatty
acids
Amino
acids
Sugars
Fats
Glycerol
Glycolysis
Glucose
Glyceraldehyde 3- P
NH3 Pyruvate
Acetyl CoA
Citric
acid
cycle
Oxidative
phosphorylation
Regulation of Cellular Respiration via
Feedback Mechanisms
• Feedback inhibition is the most common
mechanism for control
• If ATP concentration begins to drop,
respiration speeds up; when there is plenty
of ATP, respiration slows down
• Control of catabolism is based mainly on
regulating the activity of enzymes at
strategic points in the catabolic pathway
© 2011 Pearson Education, Inc.
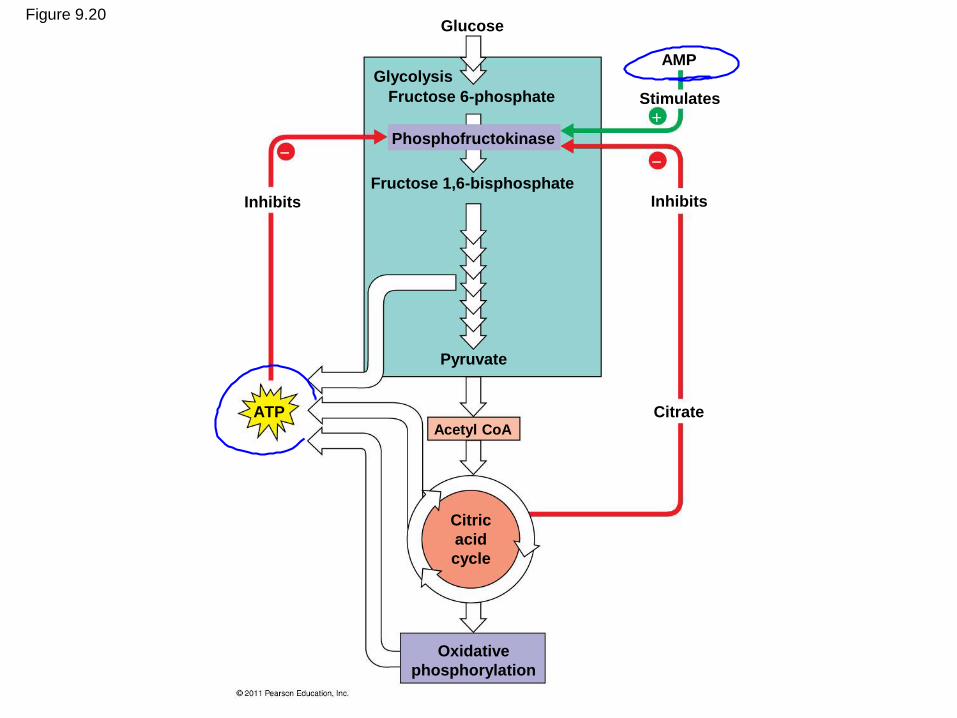
Figure 9.20
Phosphofructokinase
Glucose
GlycolysisAMP
Stimulates
Fructose 6-phosphate
Fructose 1,6-bisphosphate
Pyruvate
Inhibits Inhibits
ATP Citrate
Citric
acid
cycle
Oxidative
phosphorylation
Acetyl CoA
Chapter 9 figures Assignment
Chapter 9 Cell Respiration pg. (163-181)
• Figures with Description
–9.2, 9.7, 9.10, 9.14, 9.15, 9.16, 9.18
• EXTRA CREDIT Figures with Description
– 9.19, 9.20