AP-42 Section Number: 9.10.1.2 Reference Number: 11 · AP-42 Section Number: 9.10.1.2 Reference...
120
AP-42 Section Number: 9.10.1.2 Reference Number: 11 Title: Emissions Survey Conducted at Western Sugar Company's Billings, Montana, Production Facility American Environmental Testing Company, Inc. American Environmental Testing Company, Inc. December 1988
Transcript of AP-42 Section Number: 9.10.1.2 Reference Number: 11 · AP-42 Section Number: 9.10.1.2 Reference...
AP-42 Section Number: 9.10.1.2
Reference Number: 1 1
Title: Emissions Survey Conducted at Western Sugar Company's Billings, Montana, Production Facility
American Environmental Testing Company, Inc.
American Environmental Testing Company, Inc.
December 1988
EPA
Text Box
Note: This is a reference cited in AP 42, Compilation of Air Pollutant Emission Factors, Volume I Stationary Point and Area Sources. AP42 is located on the EPA web site at www.epa.gov/ttn/chief/ap42/ The file name refers to the reference number, the AP42 chapter and section. The file name "ref02_c01s02.pdf" would mean the reference is from AP42 chapter 1 section 2. The reference may be from a previous version of the section and no longer cited. The primary source should always be checked.
"EMISSIONS SURVEY CONDUCTED AT
WESTERN SUGAR COMPANY'S BILLINGS, -MONTANA
PRODUCTION FACILITY"
L. .
1 - I I
I
L .
d..'
i 1
i I
I I~ I.
I
I
.... . .. i '.
I
, I i s.
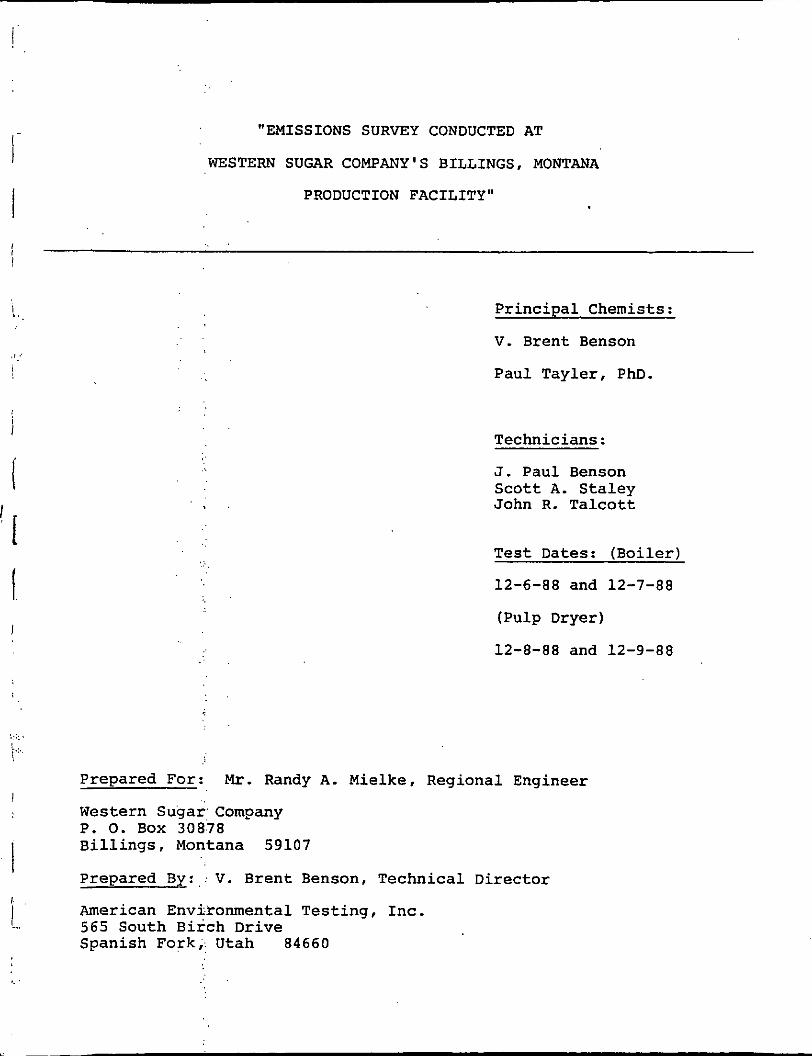
"EMISSIONS SURVEY CONDUCTED AT
WESTERN SUGAR COMPANY'S BILLINGS, MONTANA
PRODUCTION FACILITY"
Principal Chemists:
V. Brent Benson
Paul Tayler, PhD.
Technicians:
J. Paul Benson Scott A. Staley John R. Talcott
Test Dates: (Boiler)
12-6-88 and 12-7-88
(Pulp Dryer)
12-8-88 and 12-9-88
Prepared For: M r . Randy A. Mielke, Regional Engineer
Western ~ugar. company P. 0. Box 30878 Billings, Montana 59107
Prepared By:,: V. Brent Benson, Technical Director
American Environmental Testing, Inc. 565 South Birch Drive Spanish Fork;: Utah 84660
. .
I
I
. .
I
I. I.. 1 I
.. , ... I.
I ,, I
I i
1
_..
CERTIFICATION OF REPORT INTEGRITY
American Environmental Testing, Inc., (AET) certifies
that this report represents the truth as well as can
be derived by the methods employed. Every effort was
made to obtain accurate and representative data and
to comply with procedures set forth in the Federal
Register.
V. Brent .Benson / Technical Director
American Environmental Testing, Inc. 565 South Birch Drive Spanish Fork, Utah 8 4 6 6 0
801-266-7111
. I

1 .
j
!
!
TABLE OF CONTENTS Page
I. Introduction 1
11. Summary . . . . . . . . . . . . . . . . . . . . . . . 2
3 A. Table I. (Data Summary) . . . . . . . . . . . . . 111. Procedures and Methods . . . . . . . . . . . . . . . . 5
A. Figure I, Beet Pulp Dryer Stack Diagram 7
B. Figure 11, Boiler Stack Diagram. 9
Figure 111, Boiler Inlet Duct 11
Figure IV, Boiler Inlet Cross Section 12
. . . . . . . . . . . . . . . . . . . . .
. . . . . . . . . . . . . .
. . . . . . . . . . . . . . . . .
0 C. Table IIa - Traverse Point Calculations (Dryer). . Table I11 - Traverse Point Calculations. 10 . . . . .
IV. Results and Conclusions 13
A. Beet Pulp Stacks . . . . . . . . . . . . . . . . . . . . . . . . . . . . . . . .
. . . . . 1. Table IVa Field and Laboratory Data 15
Table IVb Field and Laboratory Data . . . . . 16
2. Table Va Data Summary . . . . . . . . . . . . 17
Table Vb Data Summary . . . . . . . . . . . . 18
B. Boiler Exhaust Stack
1. Table VI Field and Laboratory Data . . . . . 19
2. Table VI1 Data Summary . . . . . . . . . . . 20
C. Boiler Inlet Duct
. . . . 1. Table VI11 Field and Laboratory Data 21
Table IX Data Summary 22 . . . . . . . . . . . APPENDICES:
A. Calibration Data B. Laboratory and Field Data Forms c. VEO Data Sheets D. Cyclonic Flow Determination
"EMISSIONS SURVEY CONDUCTED AT WESTERN
SUGAR COiQANY ' S BILtIlJGS, MONTANA
PRODUCTION FACILITY"
-
' j
I ,.::.. I.
I. INTRODUCTION:
At the request of Western Sugar Company's M r . Randy A.
Mielke, American Environmental Testing, Inc., conducted the
following emissions tests at their Billings, Montana production
facility.
1. Coal fired boiler
Combined EPA Methods 5 and 8 for particulate
matter and SO2 emissions from the exhaust
stack and the SO2 from the scrubber inlet.
2. Beet pulp dryer
EPA Method 5 for particulate matter from the
dryer combustion and pelletizing circuit.
The tests on the boiler were conducted on December 6 and 7 ,
1988.
The tests were observed by Mr. Harry Keltz and M r . Jim Hughes
from the Montana State Air Quality Bureau.
The pulp dryer tests were run on December 8 and 9, 1988.
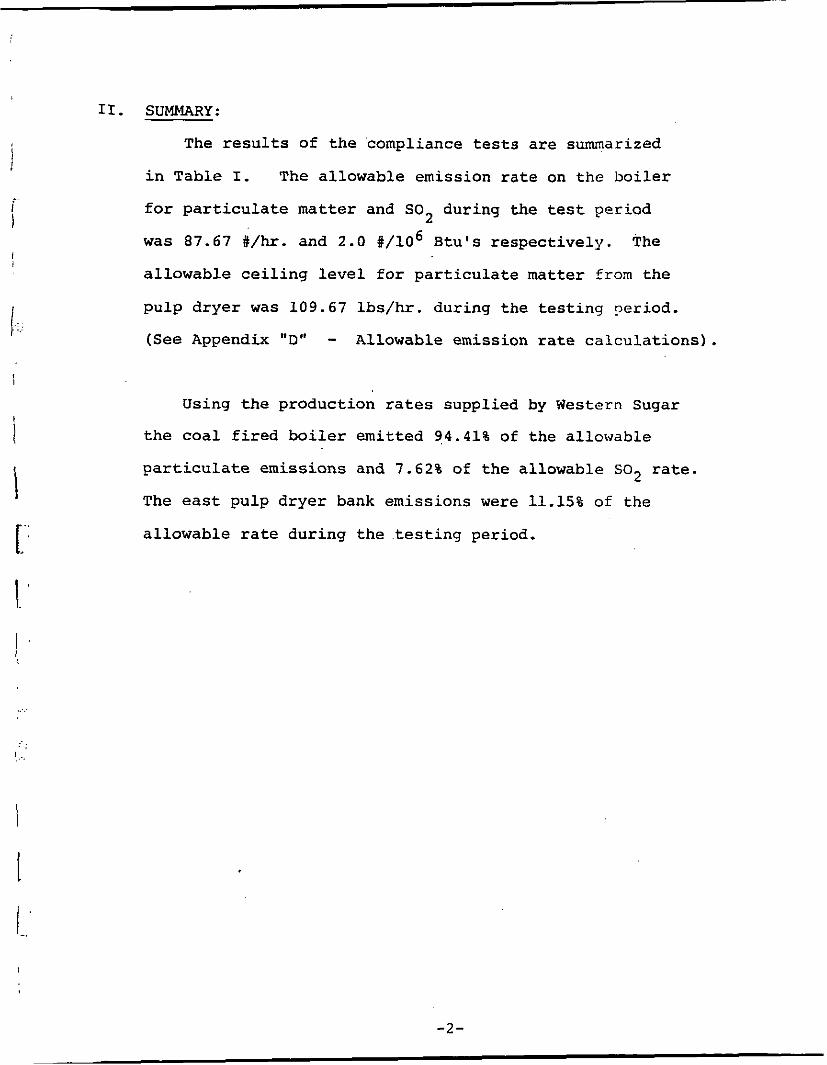
11. SUMMARY:
The results of the compliance tests are summarized
in Table I. The allowable emission rate on the boiler
for particulate matter and SO2 during the test period
was 87.67 #/hr. and 2 .0 #/lo6 Btu's respectively.
allowable ceiling level for particulate matter from the
pulp dryer was 109.67 lbs/hr. during the testing Feriod.
(See Appendix "D" - Allowable emission rate calculations) .
The
I
Using the production rates supplied by Western Sugar
the coal fired boiler emitted 94.41% of the allowable
i
particulate emissions and 7.62% of the allowable SO2 rate.
The east pulp dryer bank emissions were 11.15% of the
allowable rate during the testing period.
-2-
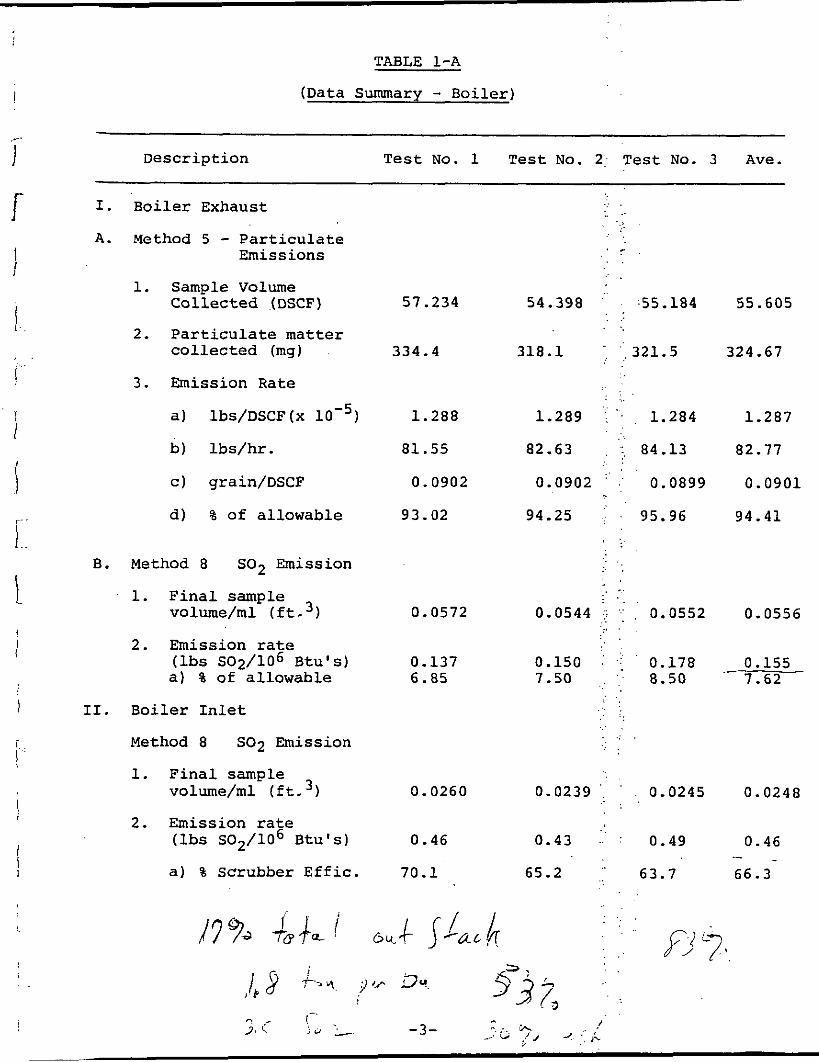
TABLE 1-A
(Data Summary - Boiler)
Description ~ ~~~ ~
Test NO. 1 Test NO. 2 Test NO. 3 Ave.
I. Boiler Exhaust
A. Method 5 - Particulate Emissions
1. Sample Volume
2. Particulate matter
Collected (DSCF) 57.234
collected (mg) 334.4
3. Emission Rate
a) lbs/DSCF(x lo-') 1.288
b) lbs/hr. 81.55
c) grain/DSCF 0 - 0902 d) % of allowable 93.02
B. Method 8 SO2 Emission
.. . . . , .. .
' 7 . .
:55.184 55.605 . . 54.398 . . . .
. . ' 321.5 324.67 . . 318.1
. . . . .,.
1.289 1 '' . , 1.284 1.287 . .
82.63 , ': . 84.13 82.17 .. . . .
0.0902 ' .' 0.0899 0.0901
94.25 .:. 95.96 94.41
. . . . . I. 1. Final sample . . .
0.0572 0.0544 .. jl '.. . , 0.0552 0.0556 .. .
volume/ml ( ft -3)
(lbs S02/106 Btu's) 0.137 0.150 i .i 0.178 - 0.155 a) % of allowable 6.85 7.50 ,. ' . , 8.50 7.62
. . , . . . . 2. Emission rate
11. Boiler Inlet . ., .
Method 8 SO2 Emission . .
1. Final sample volume/ml (ft.3) 0.0260 0.0239 '. ' . 0.0245 0.0248
2. Emission rate (lbs S02/106 Btu's) 0.46 0.43 .. . ' 0.49 0.46
a) % Scrubber Effic. 70.1 65.2 .: 63.7 66.3 - -
13 9-J JL'k
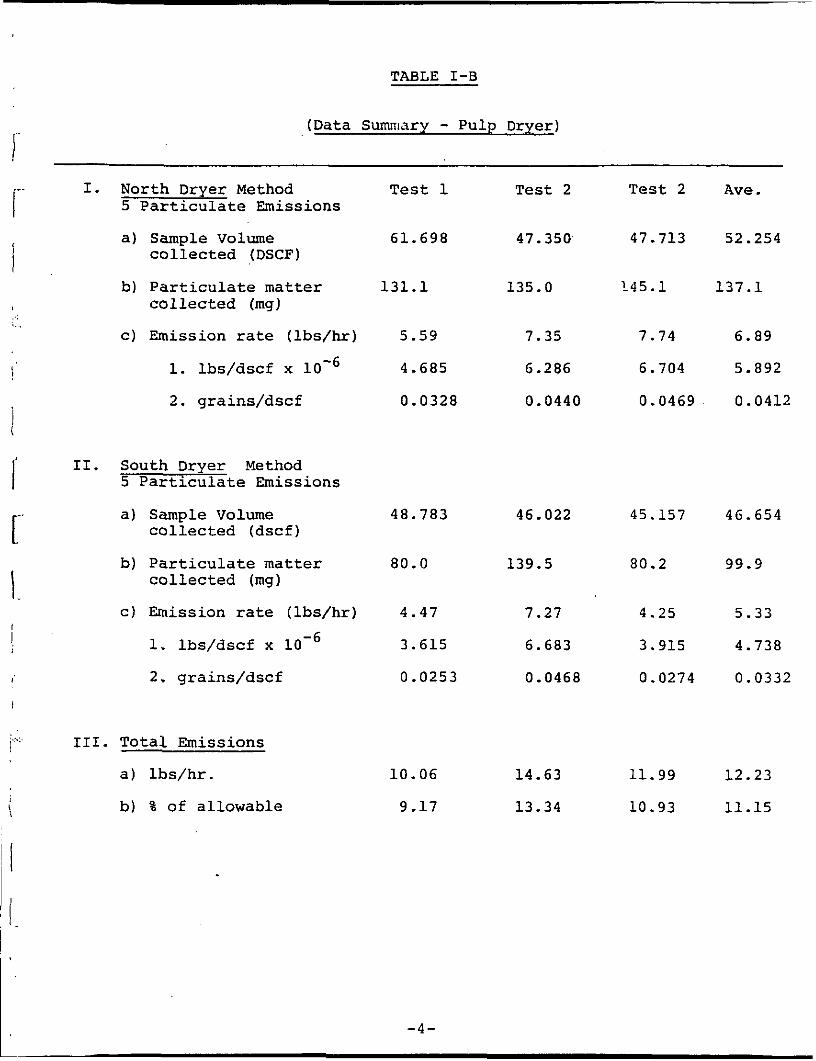
TABLE I-B
(Data Summary - Pulp Dryer)
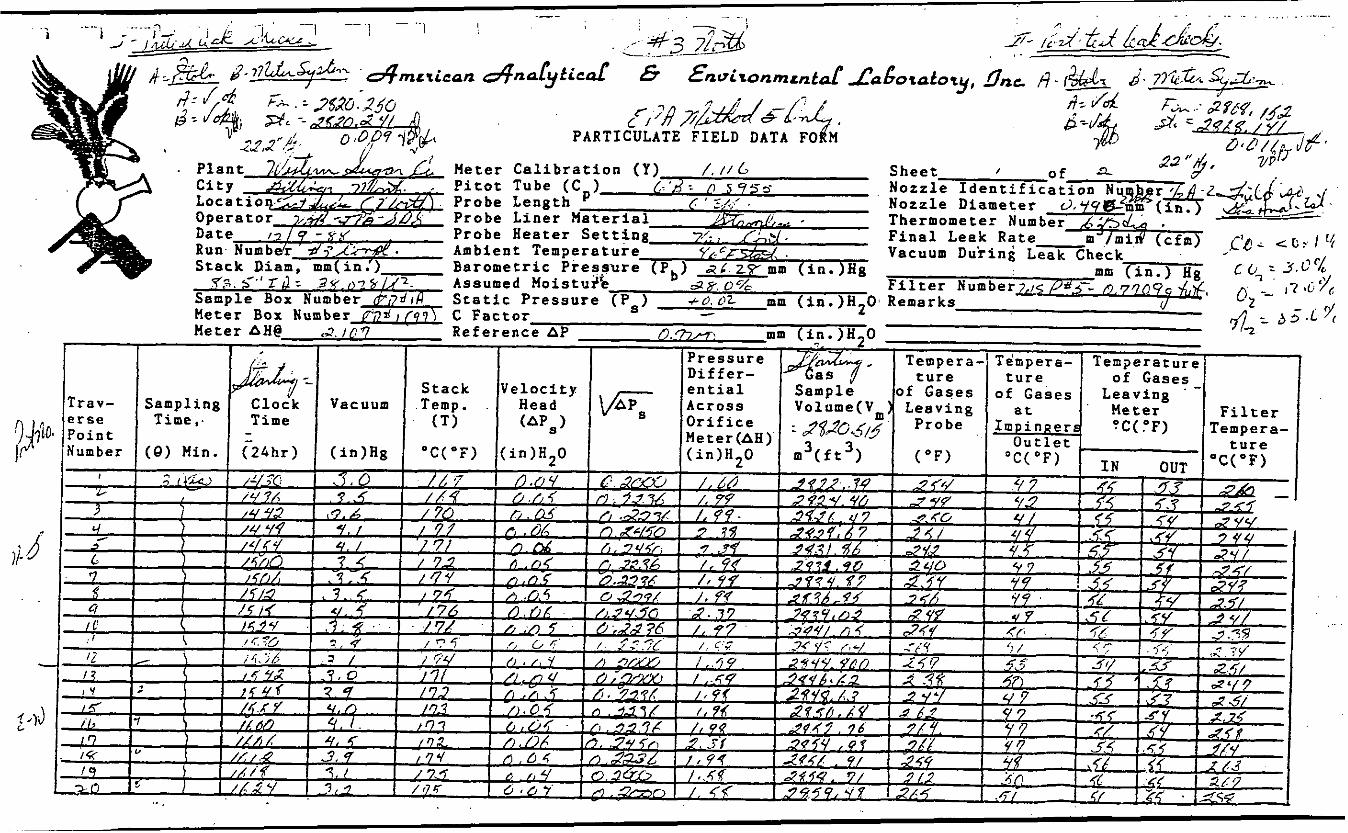
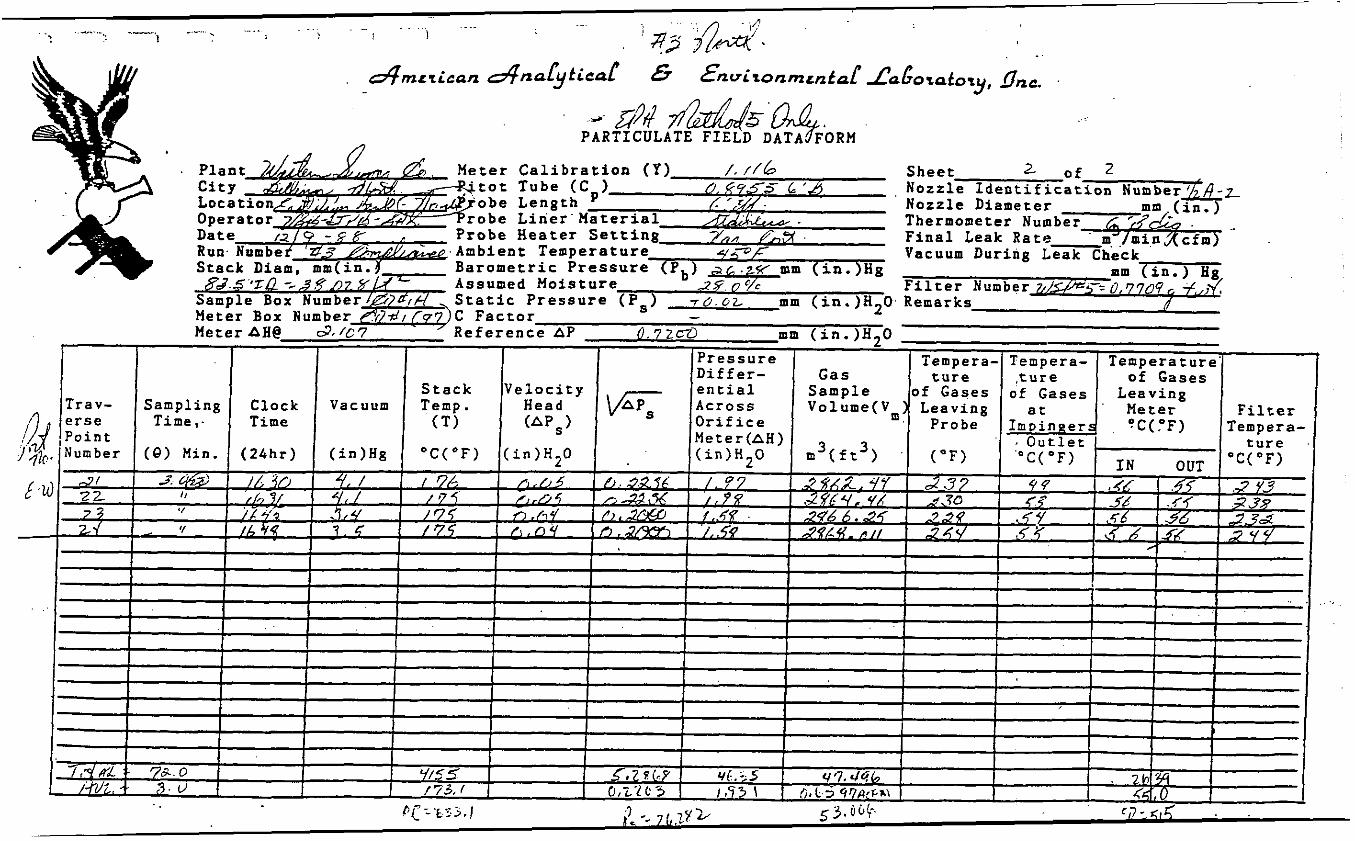
I. North Dryer Method 5 Particulate Emissions
a) Sample Volume collected (DSCF)
b) Particulate matter collected (mg)
c) Emission rate (lbs/hr)
1. lbs/dscf x
2. grains/dscf
11. South Dryer Method 5 Particulate Emissions
a) Sample Volume collected (dscf)
b) Particulate matter collected (mg)
c) Emission rate (lbs/hr)
1. lbs/dscf x
2. grains/dscf
111. Total Emissions
a ) lbs/hr.
b) % of allowable
Test 1 Test 2 Test 2
61.698 47.350 47.713
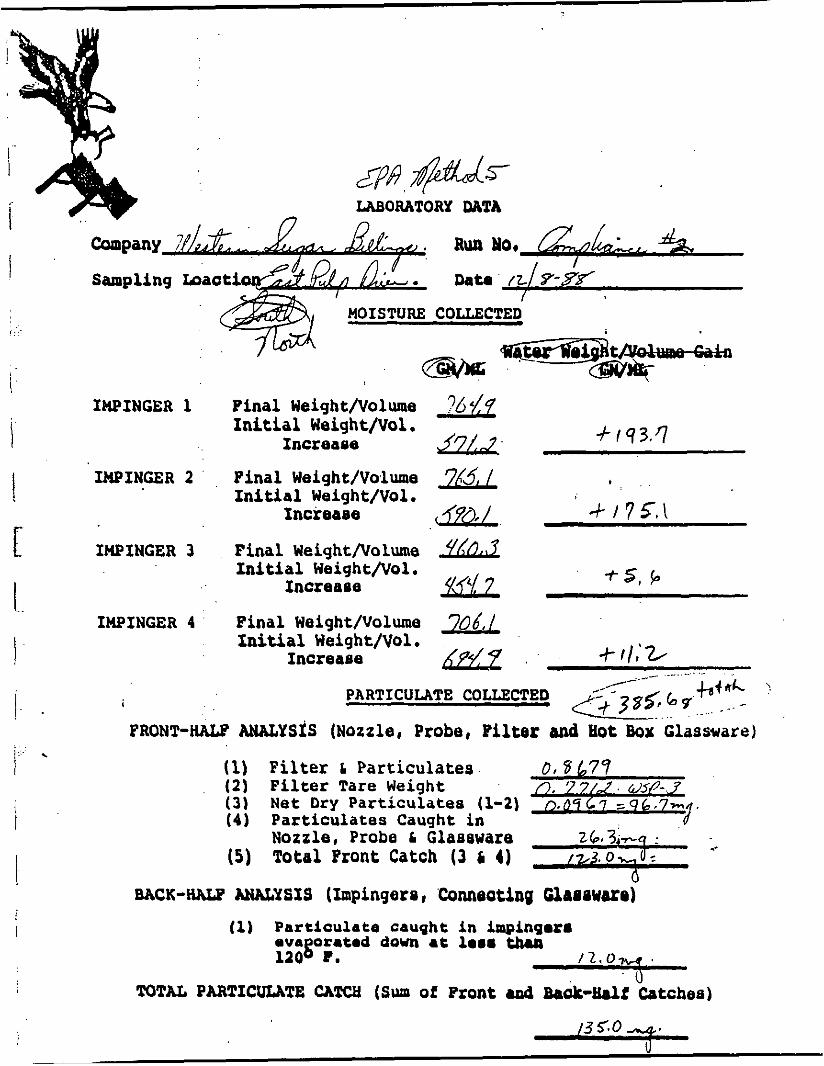
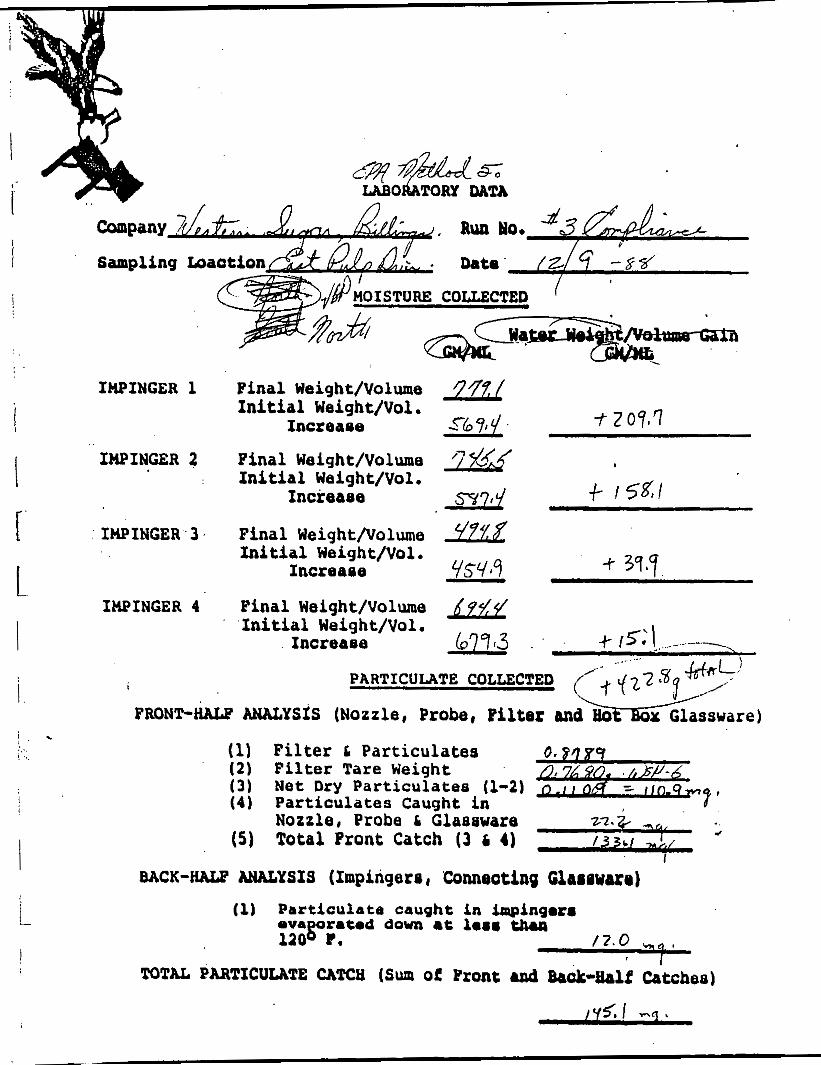
131.1 135.0 145.1
5.59 7.35 7.74
4.685 6.286 6.704
0.0328 0.0440 0.0469
Ave .
52.254
137.1
6.89
5.892
0.0412
48.783
80.0
4.47
3.615
0.0253
10.06
9 -17
46 - 022 45.157 46.654
139.5 80.2 99.9
7.27 4.25 5.33
6.683 3.915 4.738
0.0468 0.0274 0.0332
14.63 11.99 12.23
13.34 10.93 11.15
-4-
111. PROCEDURES AND METHODS:
A.
B.
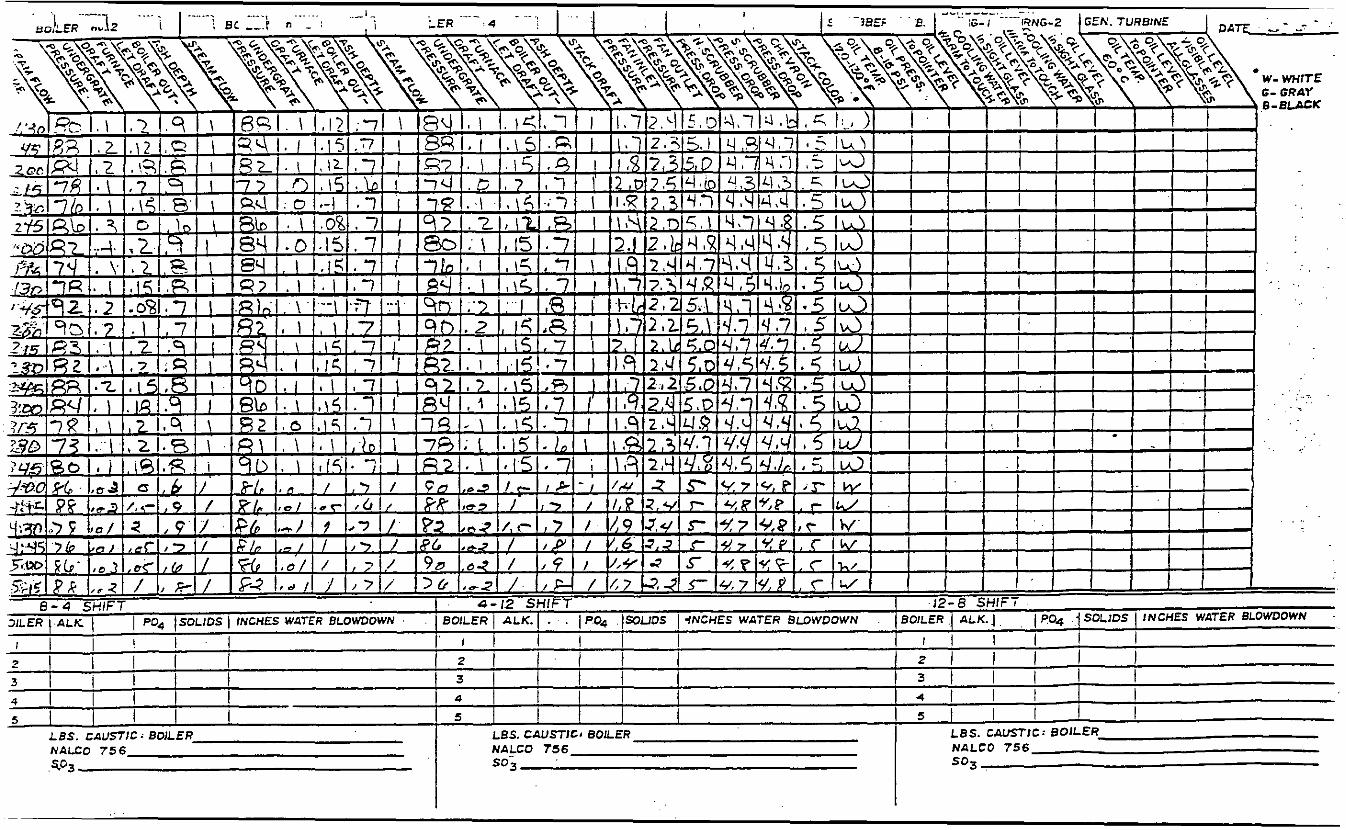
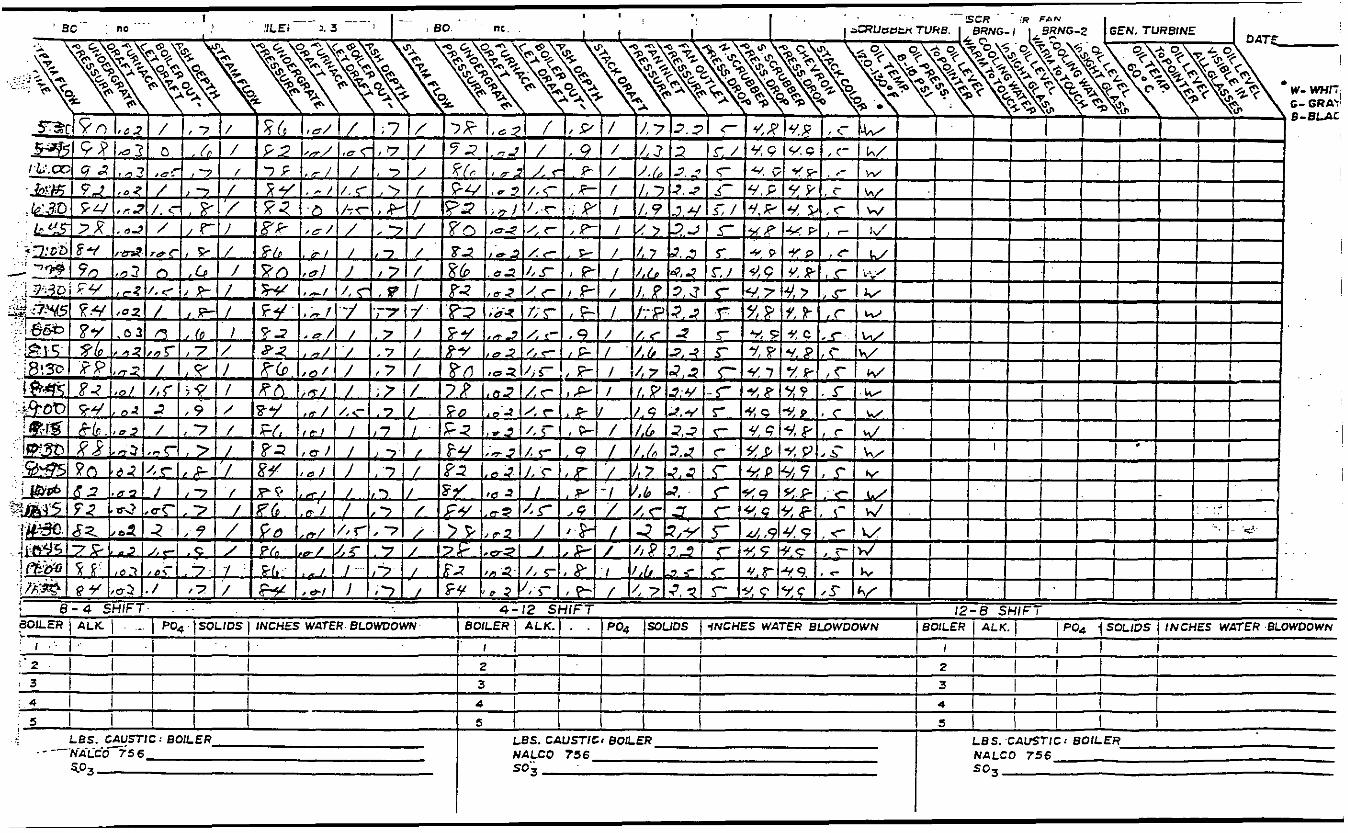
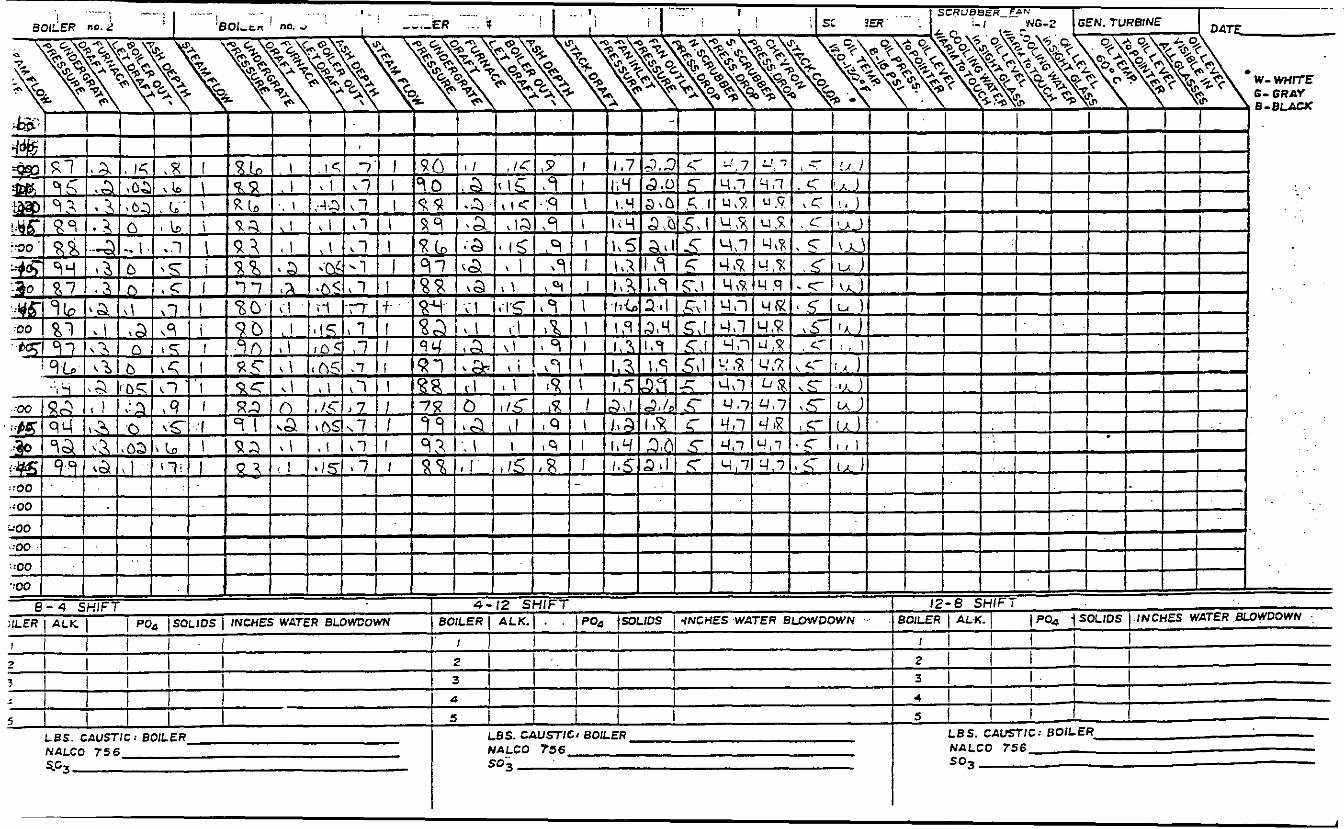
Plant Operations.
Plant production levels for pulp dryer and boiler firing
rates are given in Appendix “D“. Boiler run sheets are also
included in Appendix “D“ with 15 minutes parameter readings
recorded during the testing period by Western Sugar production
personnel.
Emissions Testing:
All of the test procedures employed were as specified
in 40 CFR 6 0 . 4 2 4 (7-1-85 and as amended) and in the
“Quality Assurance Handbook for Air Pollution Measurement
Systems”. The standard Method 5 train was modified to
allow for a Method 8 to be run concurrently with the
particulate tests.
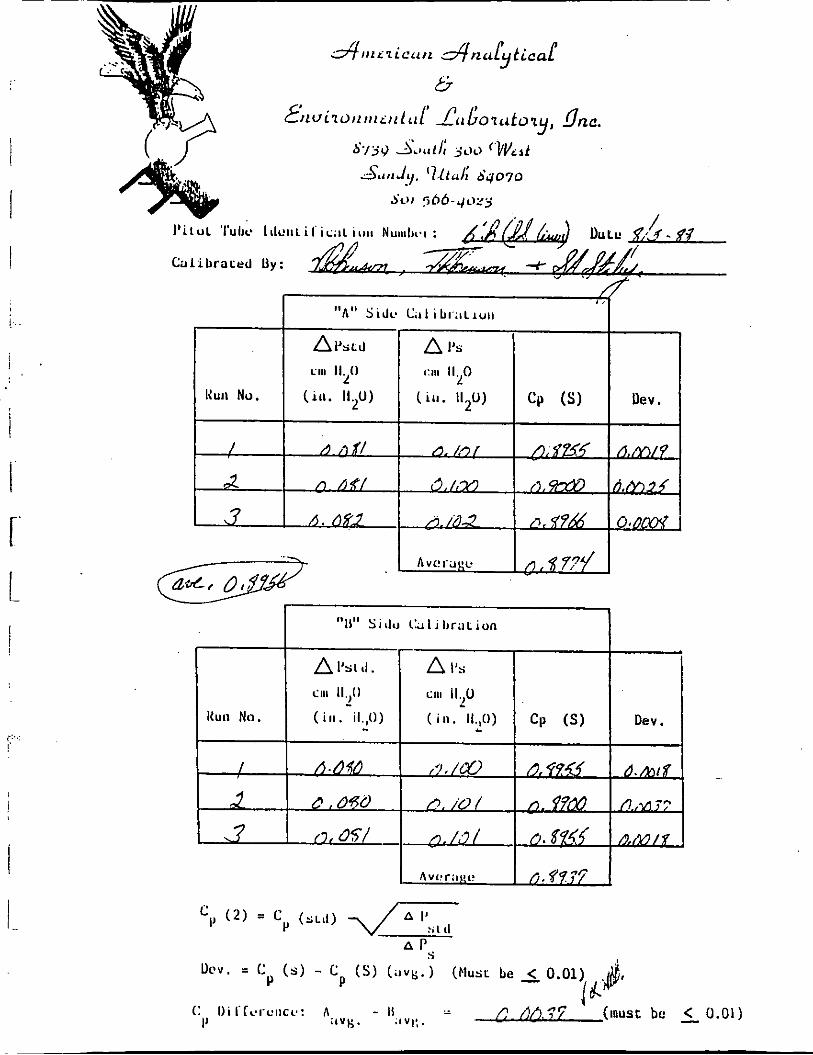
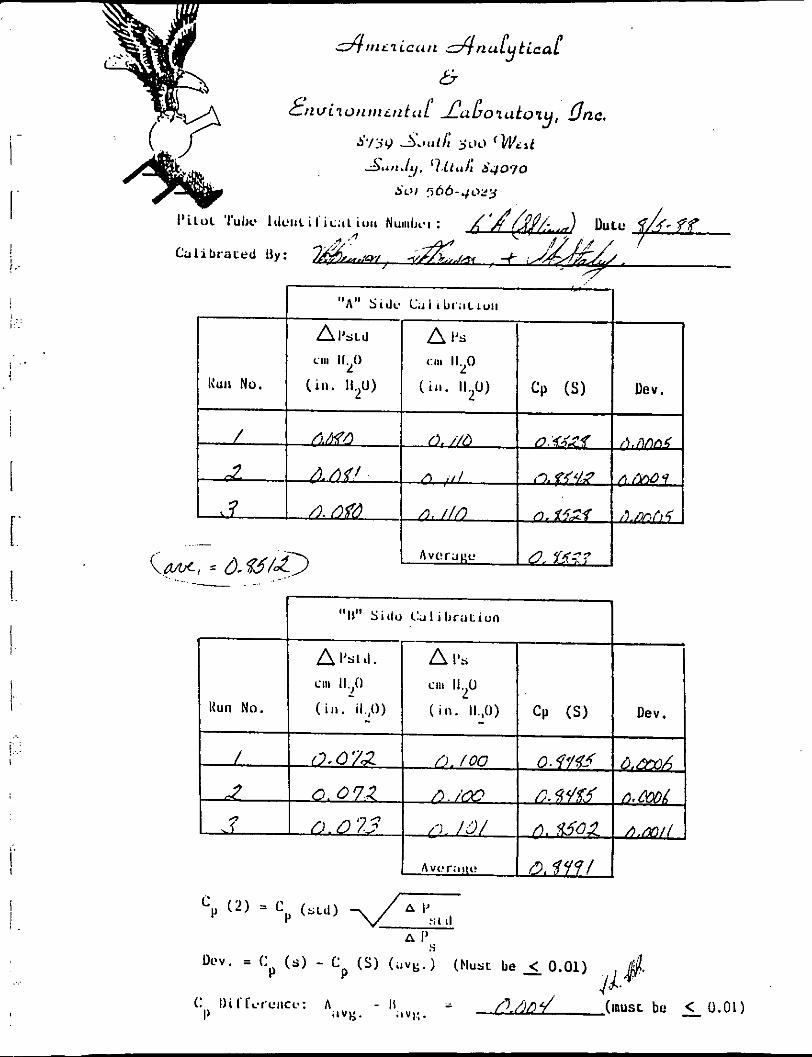
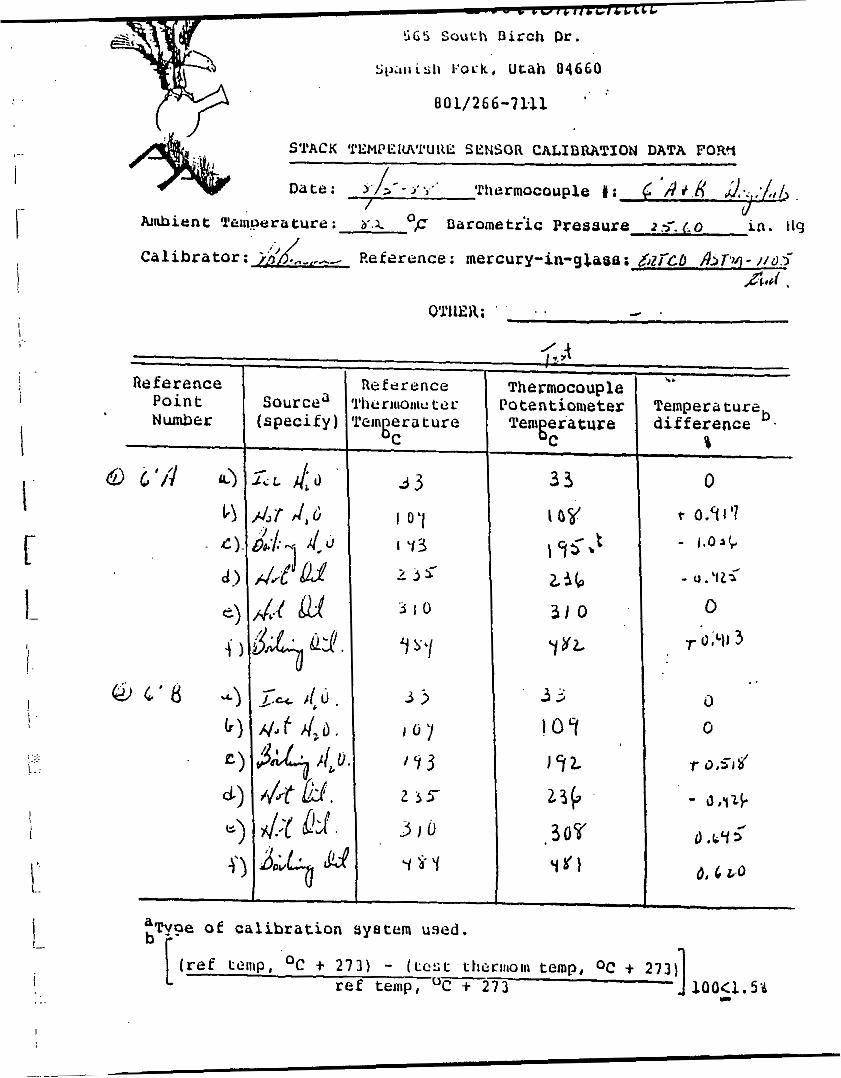
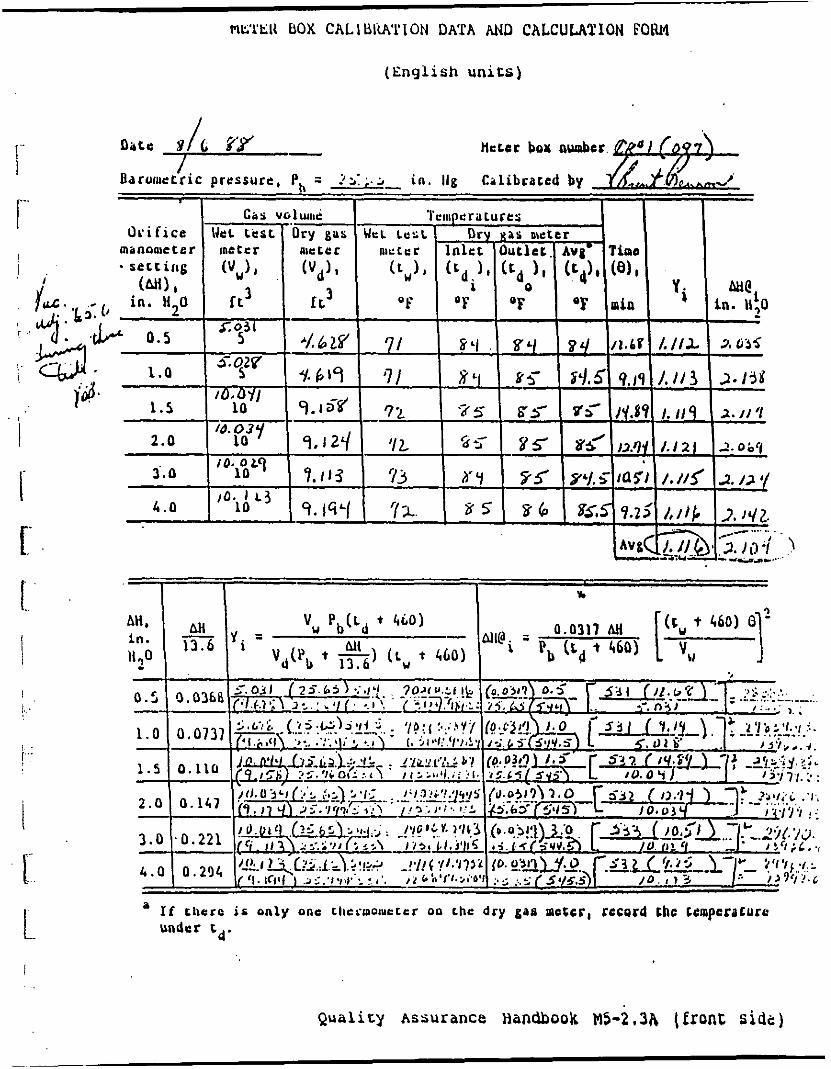
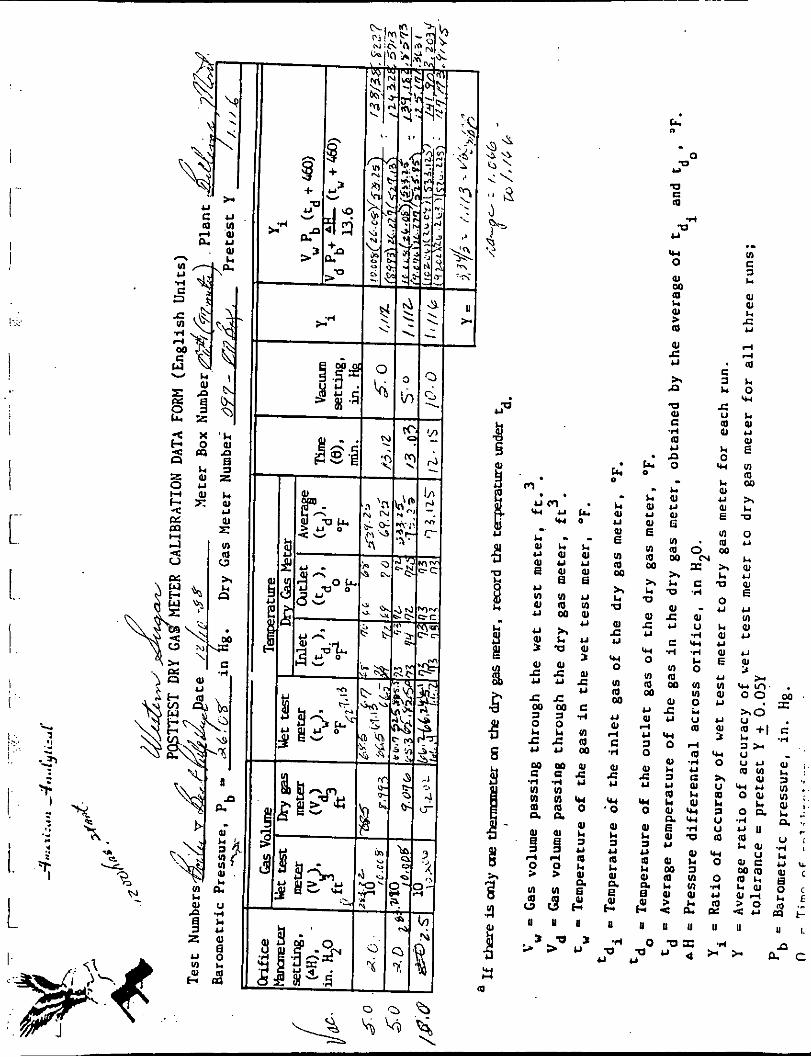
1. Calibrations:
Calibration data and forms are included as
Appendix “A“.
2. Traverse Points:
a) Pulp Dryer
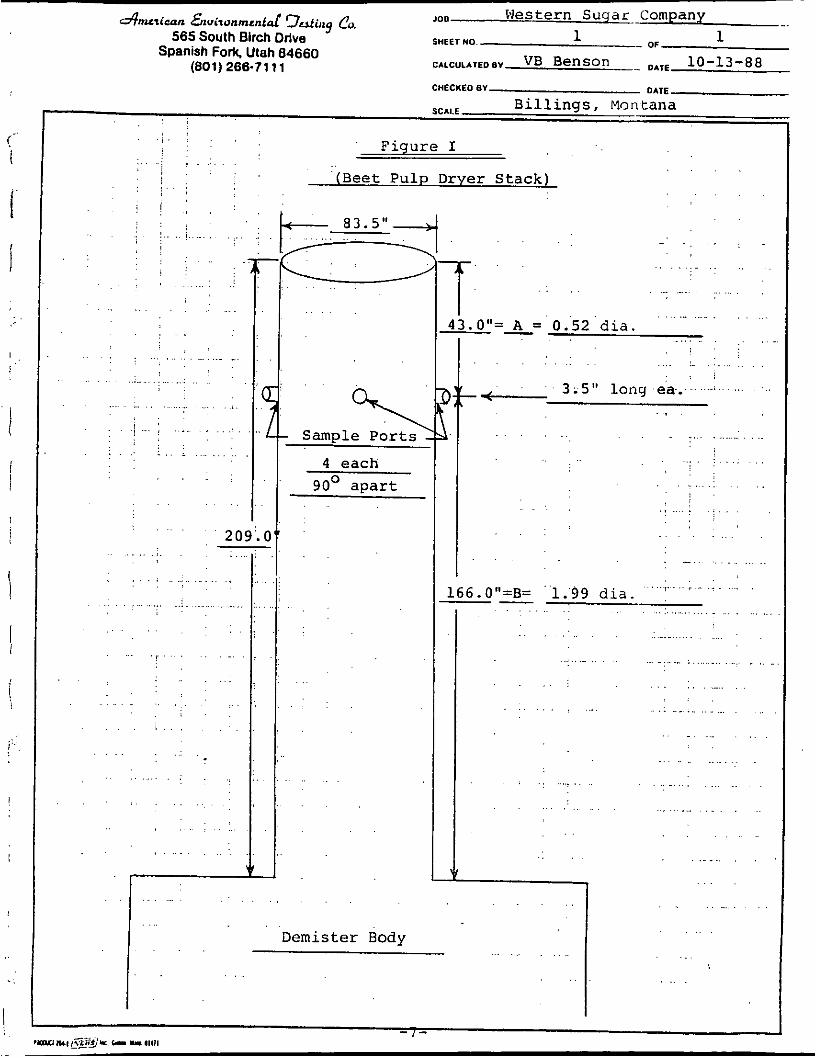
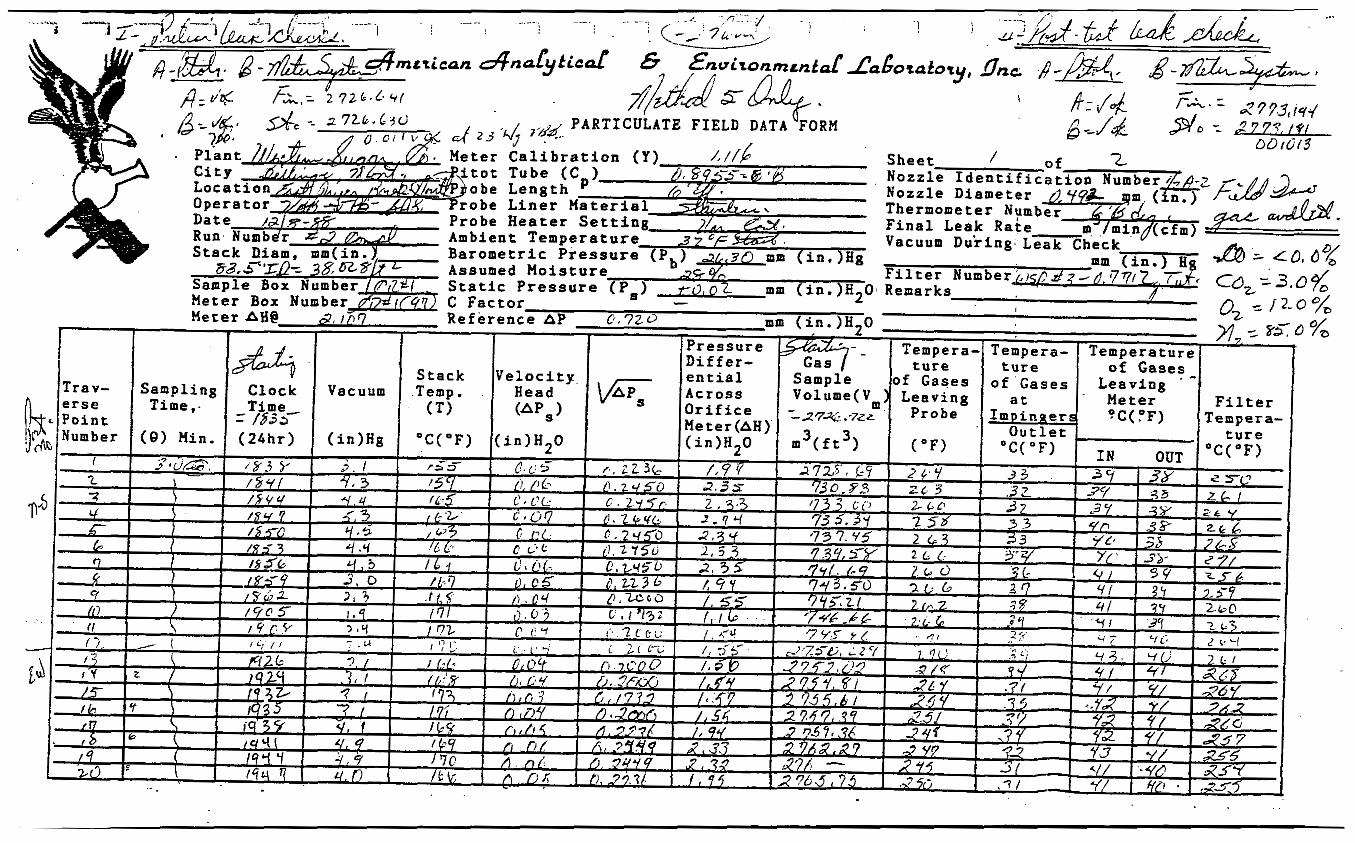
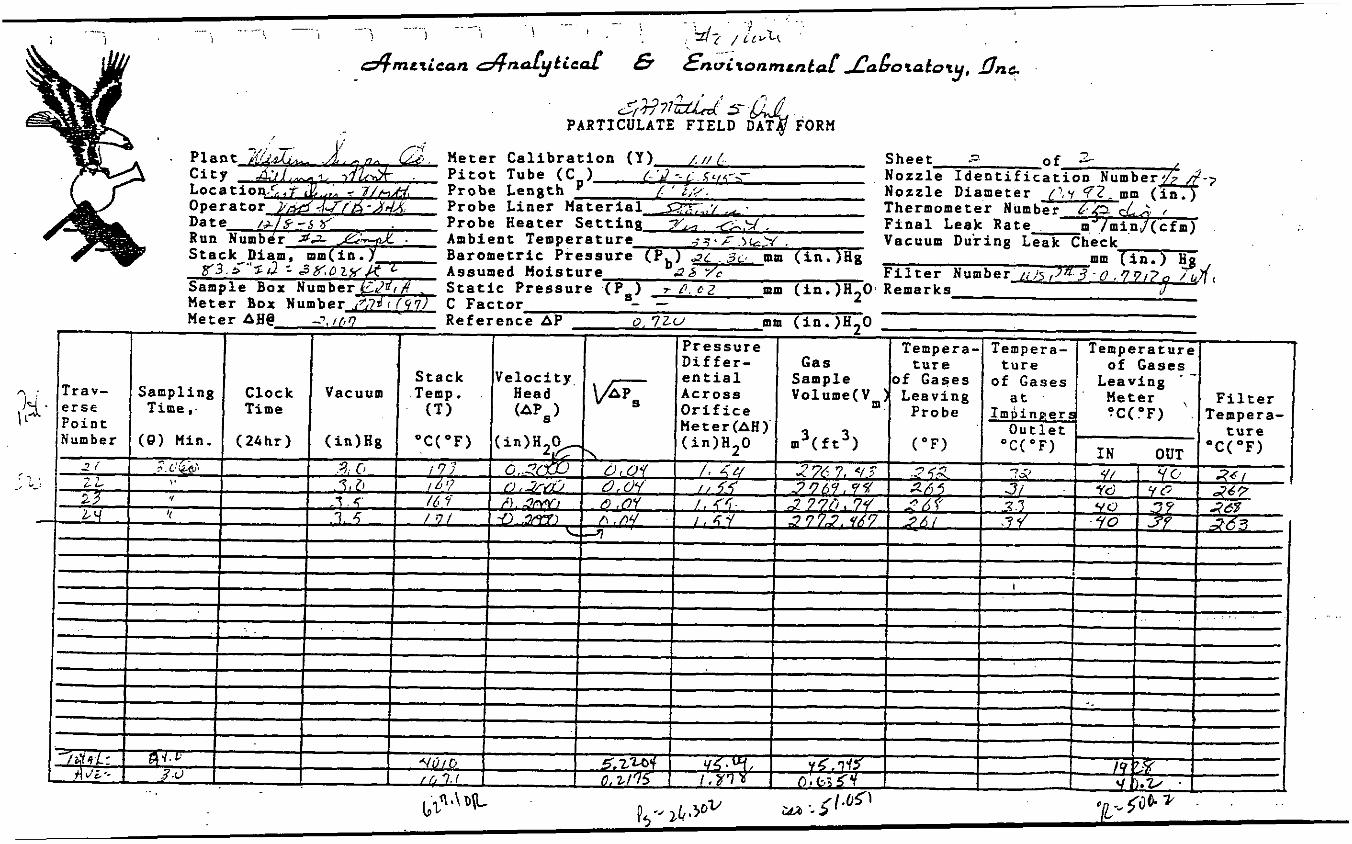
Figure I, is a diagram of the exhaust stacks from
the East beet pulp dryer. With this geometry, it
w a s necessary to use twenty-four ( 2 4 ) traverse points
for each of the six Method 5 compliance tests.
One complete test consisted of a test on each of the
North and South exhaust stacks with the particulate
loading from each being added for compliance criteria.
-5-
I
The distance from the inside wall of the stack
to each point is given in Table 11.
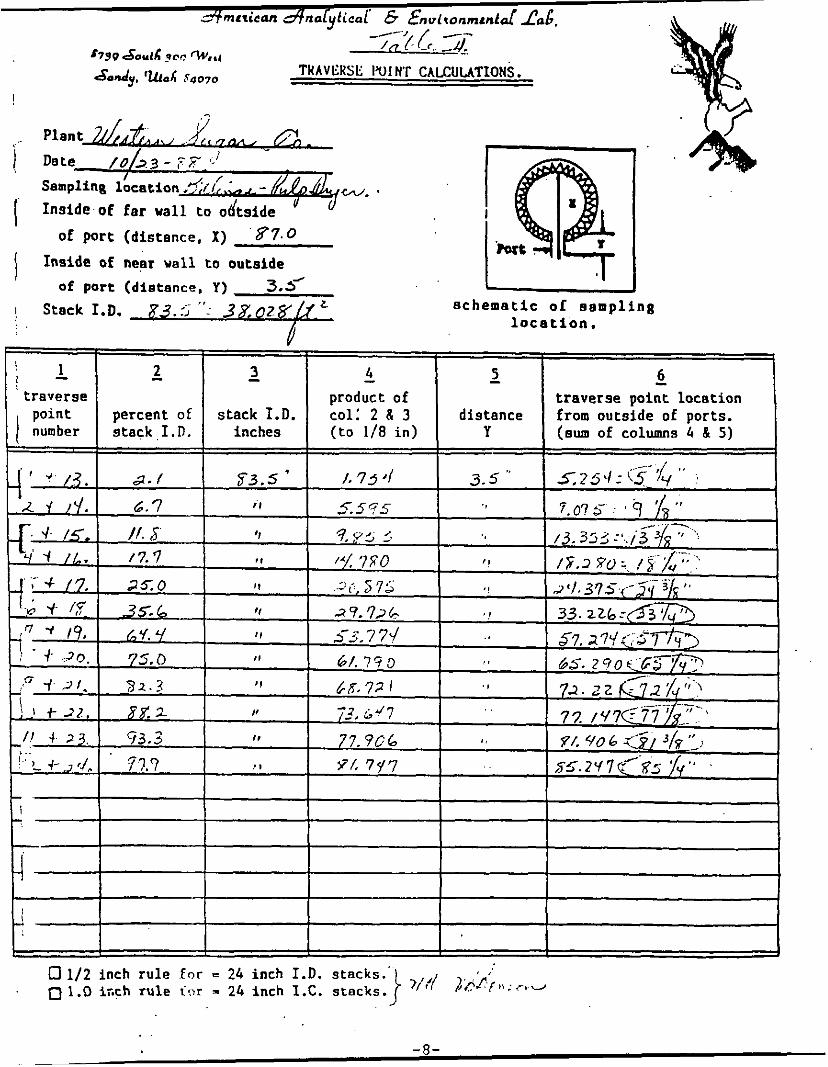
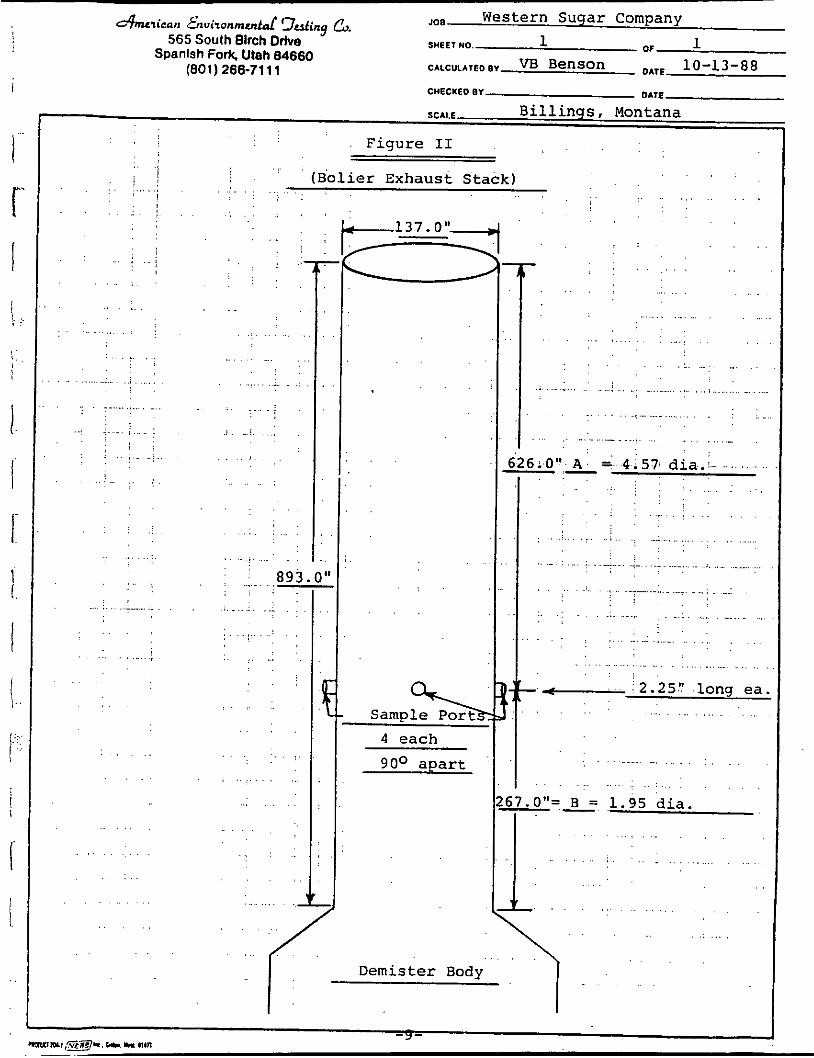
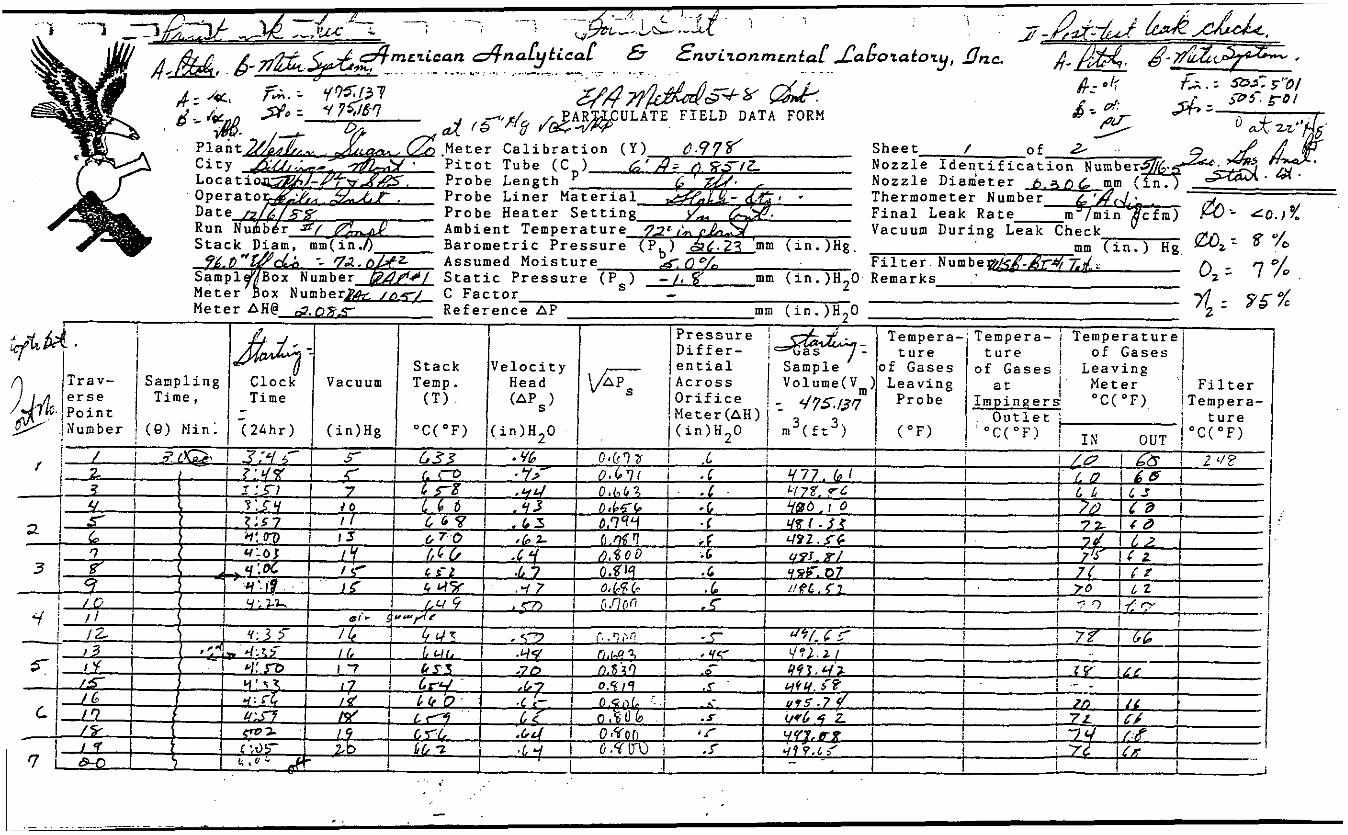
b) Boiler Exhaust Stack
Figure 11, is a diagram of the exhaust stack from
.the coal-fired boiler. With this geometry, it was
necessary to use twenty-four ( 2 4 ) traverse points
for each of the three tests.
The distance from the inside wall of the stack to
each point is given in Table 111.
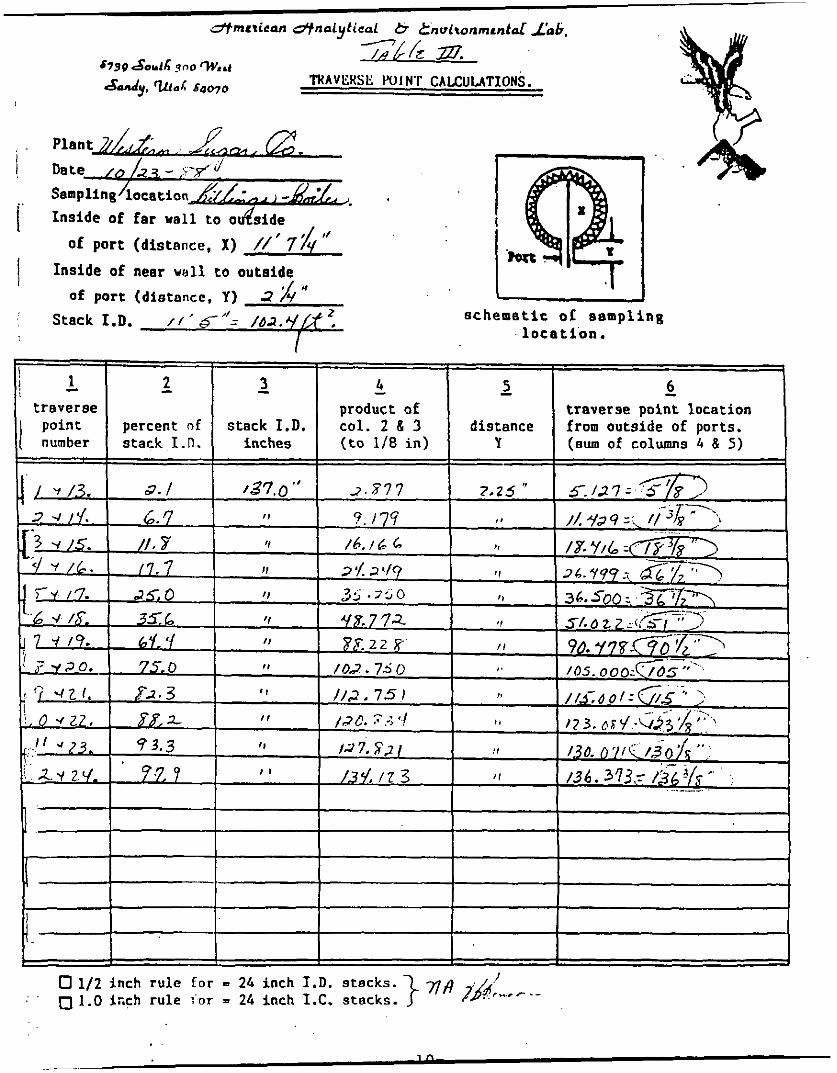
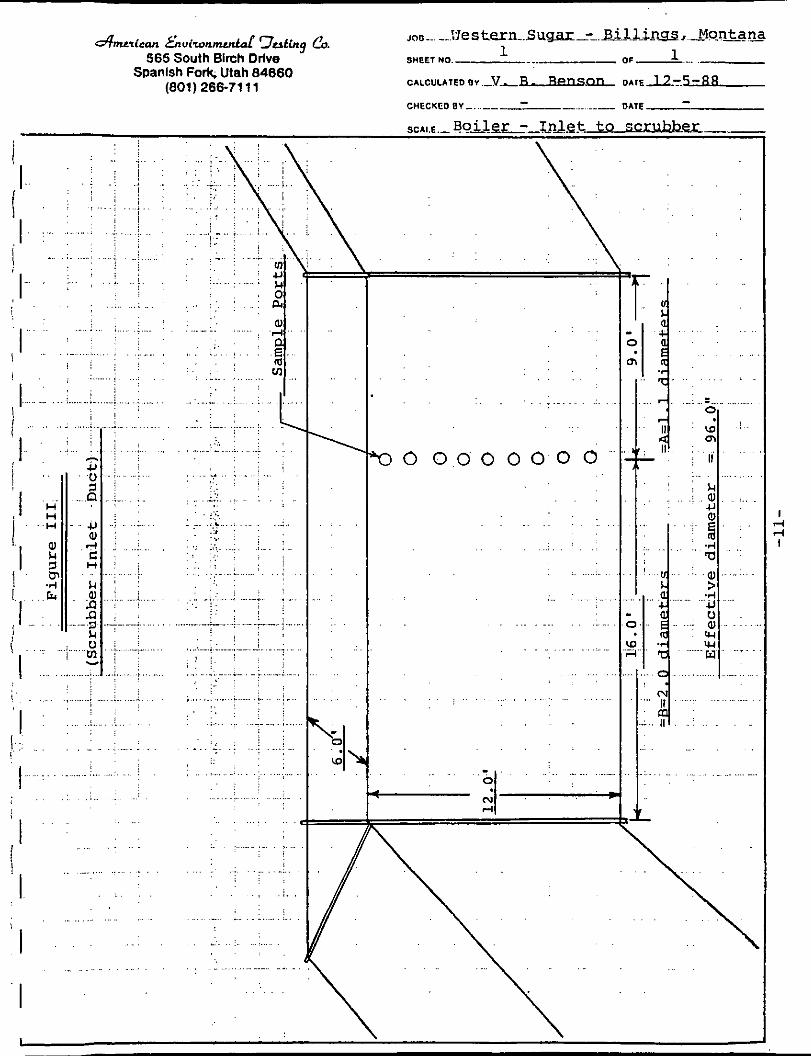
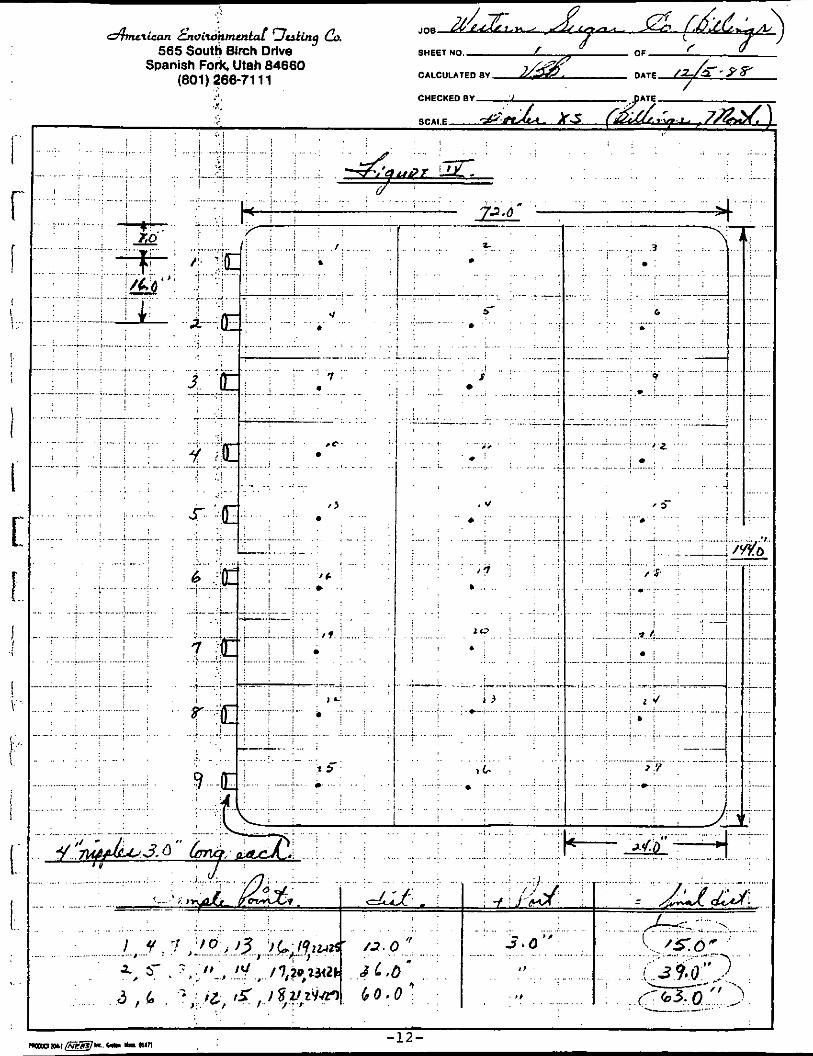
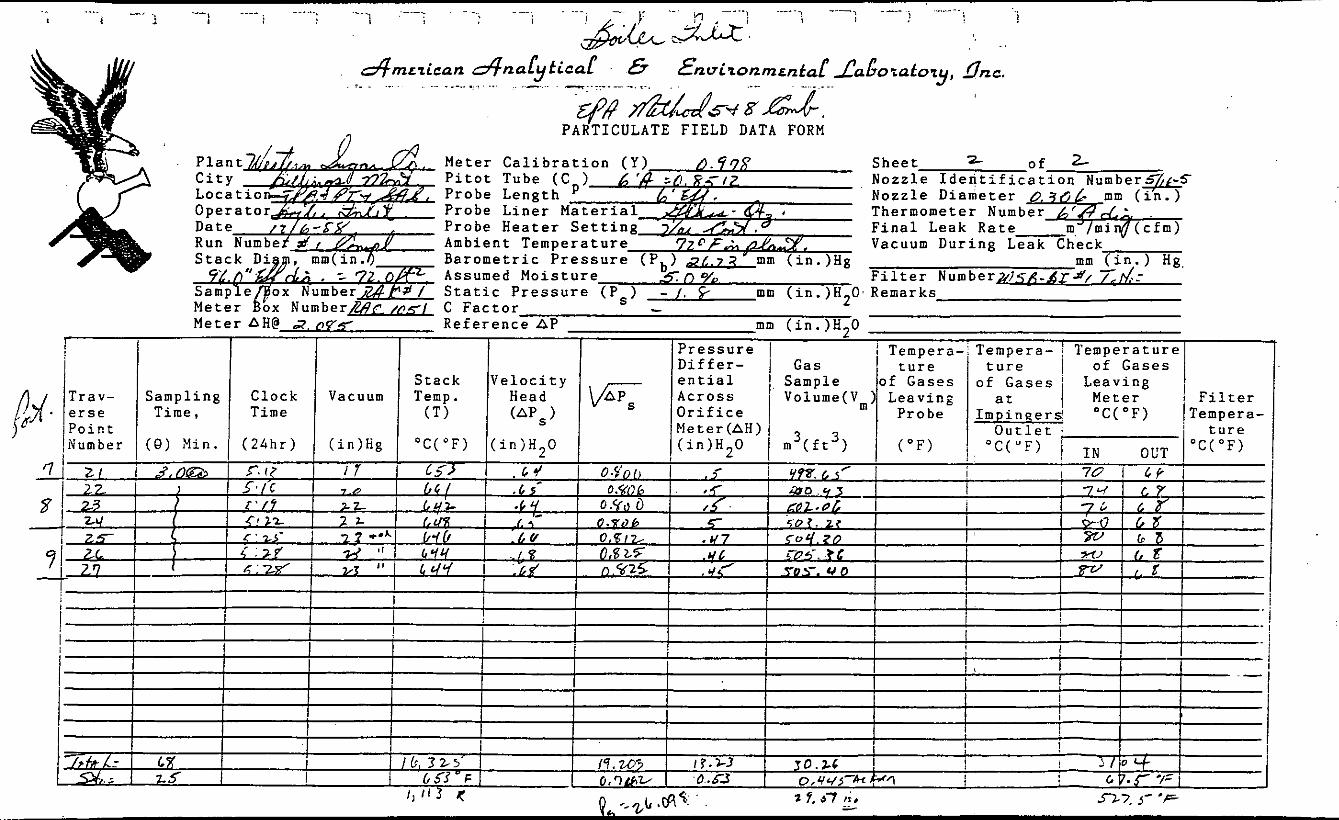
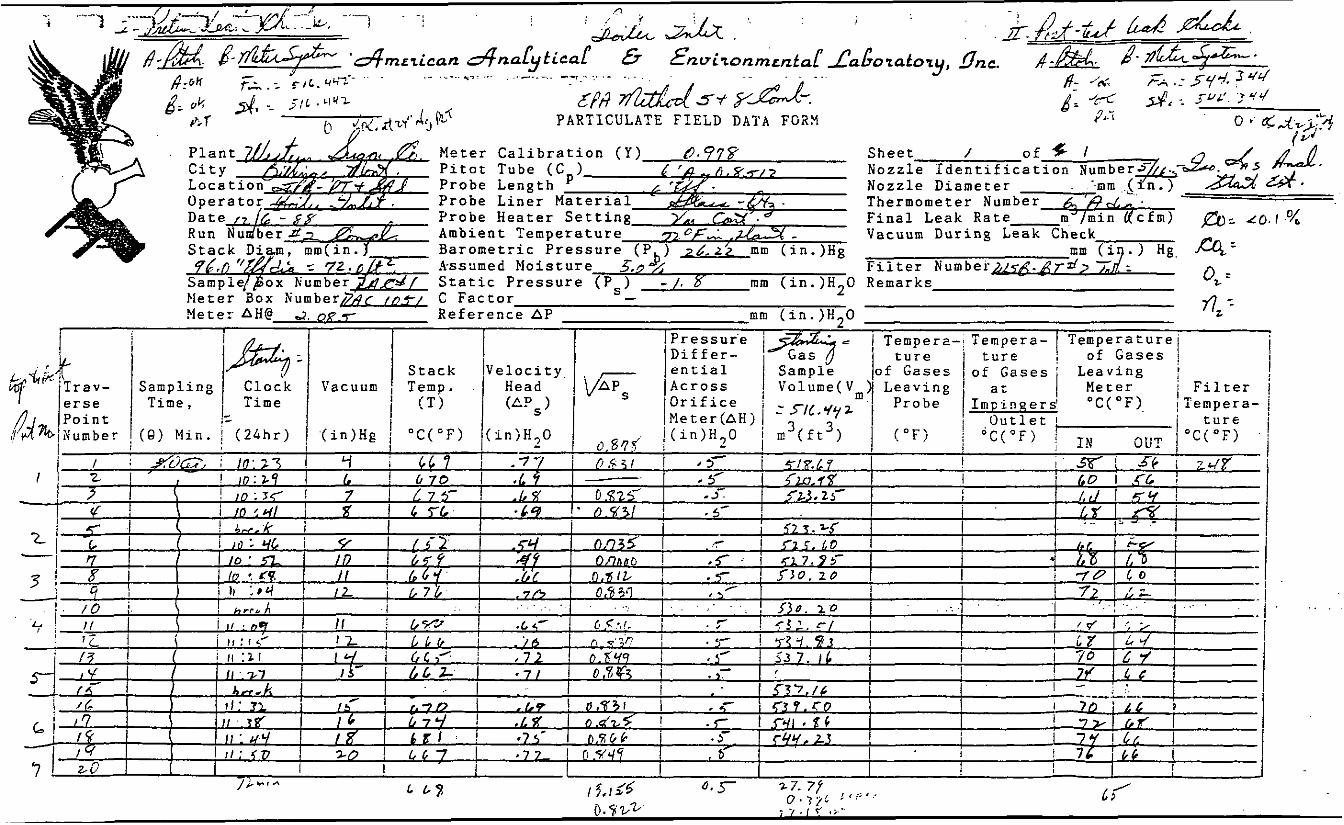
c) Boiler Scrubber Inlet Duct
Figure 111, is a diagram of the inlet duct to the
boiler scrubber. This point was analyzed for sulfur
emissions only. With this geometry, it vas necessary
to use twenty-seven ( 2 7 ) traverse points on a 9 X 3
grid. A cross-section of the sample port area is shown
in Figure IV along with the distance from the inside
of the duct wall to each of the points.
-6-
_. Western Suqar Company 4 n u r i c n n &nvironmcntat 9 d i y a, JOQ
1 - OF 1 565 South Blrch Drlve SHEET NO
CILCULAIEonv VB Benson DIrE 10-13-88 Spanish Fork, Utah 84660 (801) 266-71 11
. . . . . . . . . . . . . .
. . . . . . . . .
CHECKEO av DATE
SCALE B i l l i n g s , Mor1 t a n a . . :
. : F i g u r e I . . . i . : .~
i . . . . . . . . . ~ . . . . . . . ' i
. . . . . . ( B e e t Pu lp Dryer S t a c k ) , . , a , . . . , . :
. . . . : I
. . . .
. . . .
. . . . . .
. . . . . . . . . T: ' ' . : , . . . . . . . . . . . .
. . . . . - ...... . . . . . I
4 3 . 0 " = A = ' 0 . ' 5 2 ' d i a . . . . . . . . . . . .
...
. .
. . . . . . . . . . . . . . :
j ., ...... . : . . . . . . : . . .
. . . . . . . .
. .- . . . . . . . . . . . .
...,. . . . . . . . . . . . . . . 166.0"=B= "1.'99 d i a . : - . . . . . . . . . . . . . . . . . . . . . . . . . . . . , . . . .
. . . . . . . . ...............
............... ...................
. . . . . . . . . . . . . . . . . . . . .
. . . . . , ..... . . . . . . . . . . . . . . . . . . .
. . . . . . . . . . . .
... . . . . . . .
. . . . . . . . . . . . . . . . . - . . . . . . . . . . . . .
. . . . . . . . . . . . . . . . . . . . . . . . . . .
. . . . . . . . .
. . . . . . . . . . . .
. . . .
------I
Plant& A , ) 2 Date
Inside of far w a l l to adtside
/ $ 3 - 7 z I t 4 . ,
&I-
Sampling location .dii w.
1 of port (distance, X) 8 7 . O
Inside of near us11 to outside I of port (dietance, Y ) 3 5 I I
schemat ic o f eampling l o c a t i o n .
traverse point location
I I
0 1 / 2 inch rule f o r = 24 inch I.D. stacks.' I ,
D1.0 ir.ch rule L:>r = 24 inch I.C. s tacks . ) ?it/ J ~ P ; , , ; .-%d
d t m e r i c a n & n d y t i c d b &ultonmentd Lab .
w. S?9V S o u l 6 goo *.rt
Sand3 'UI~ saw0 TRAVERSE wiwr CALCULATIONS.
of port (distmce, X) //'7'$''
I Inside of near wall to outaide Of port (distance, Y) 3 A''
schematic o t eampling . l o c a t i o n .
1 nA l ~ ! - . c . - 0 1/2 inch rule for = 24 inch I.D. stacks. 01.0 k c h rule :or = 26 inch I .C . stacks. .' .
Joe-.. --.~Jest~n-.Su~.---..~~l.~.~~,.-Mon~a~a 1 ..______ O f .
1 4nu&cln &"iWonmcntac 7 r r t i n g co. 565 South Birch Drfve SHEET NO.
CALCULATED O V . - v - m G D A l E u . I S - A A
CHECUCD BY -- DATE ___
Spanlsh Fork, Utah 84860 (801) 266-71 11 -
565 South Birch Drlve Spanish Fork Utah 64680
(801) 266-71 11 . . CHECKED BY ,'I .. I.. ,.
SCALE
. . . . .
,~ . . . . . . . . . . . .
: ' !
. . .
......... ,.. . . .
..................
. . . . . . . . . . .
. .
! I ' ' j I
. . I .
' _ !
1 i
I I" '.'
! j , .
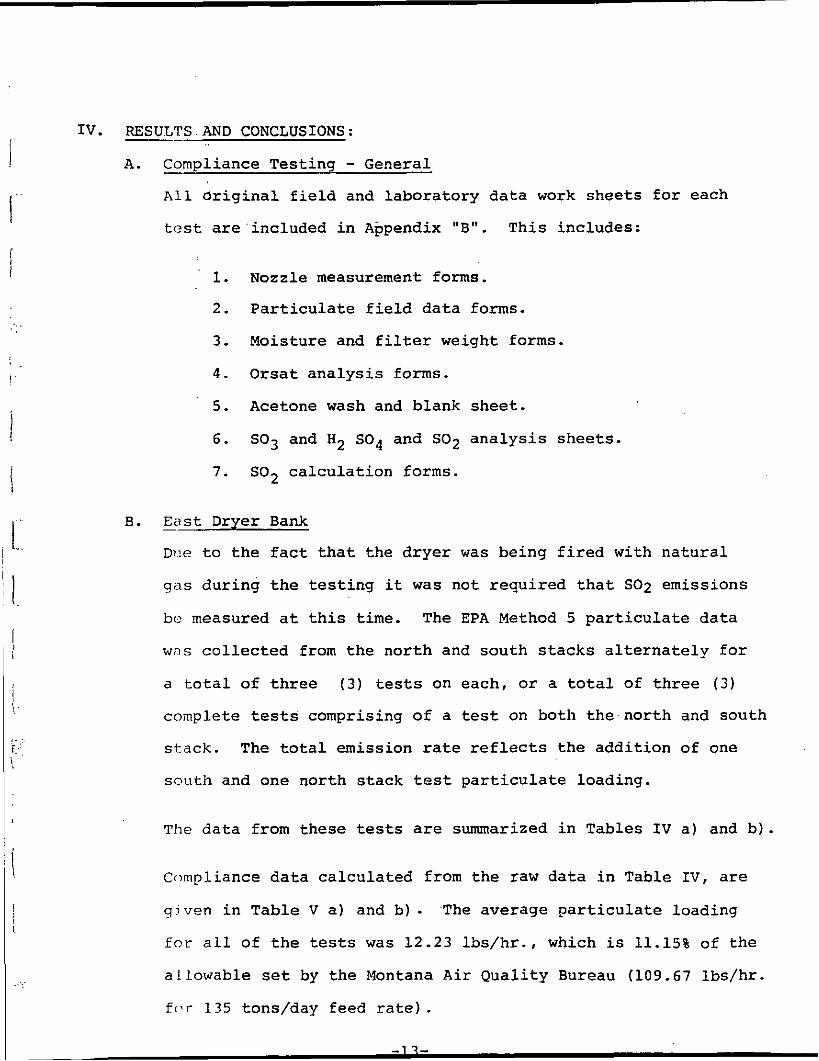
Iv. RESULTS - AND CONCLUSIONS:
A. Compliance Testing - General All original field and laboratory data work sheets for each
test are included in Appendix "B". This includes:
1. Nozzle measurement forms.
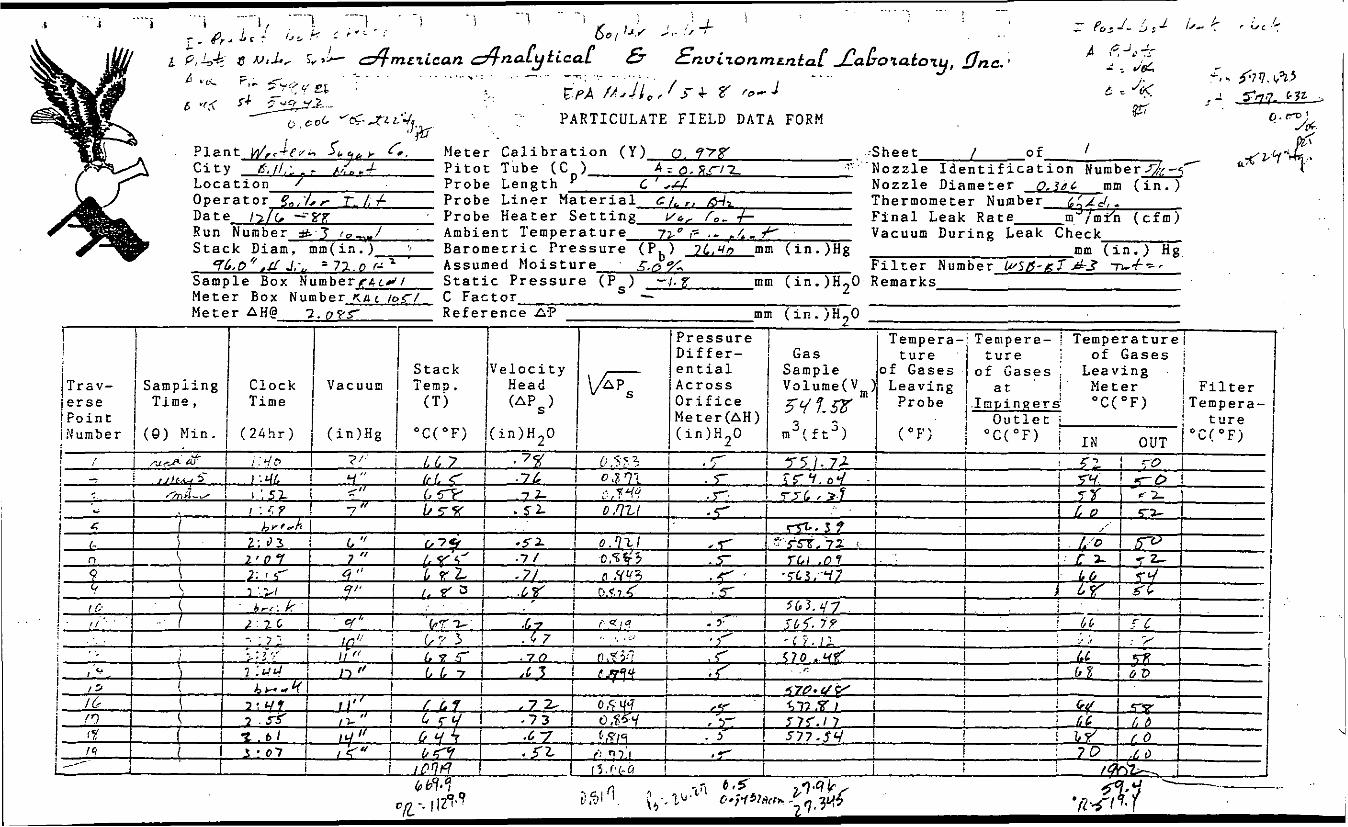
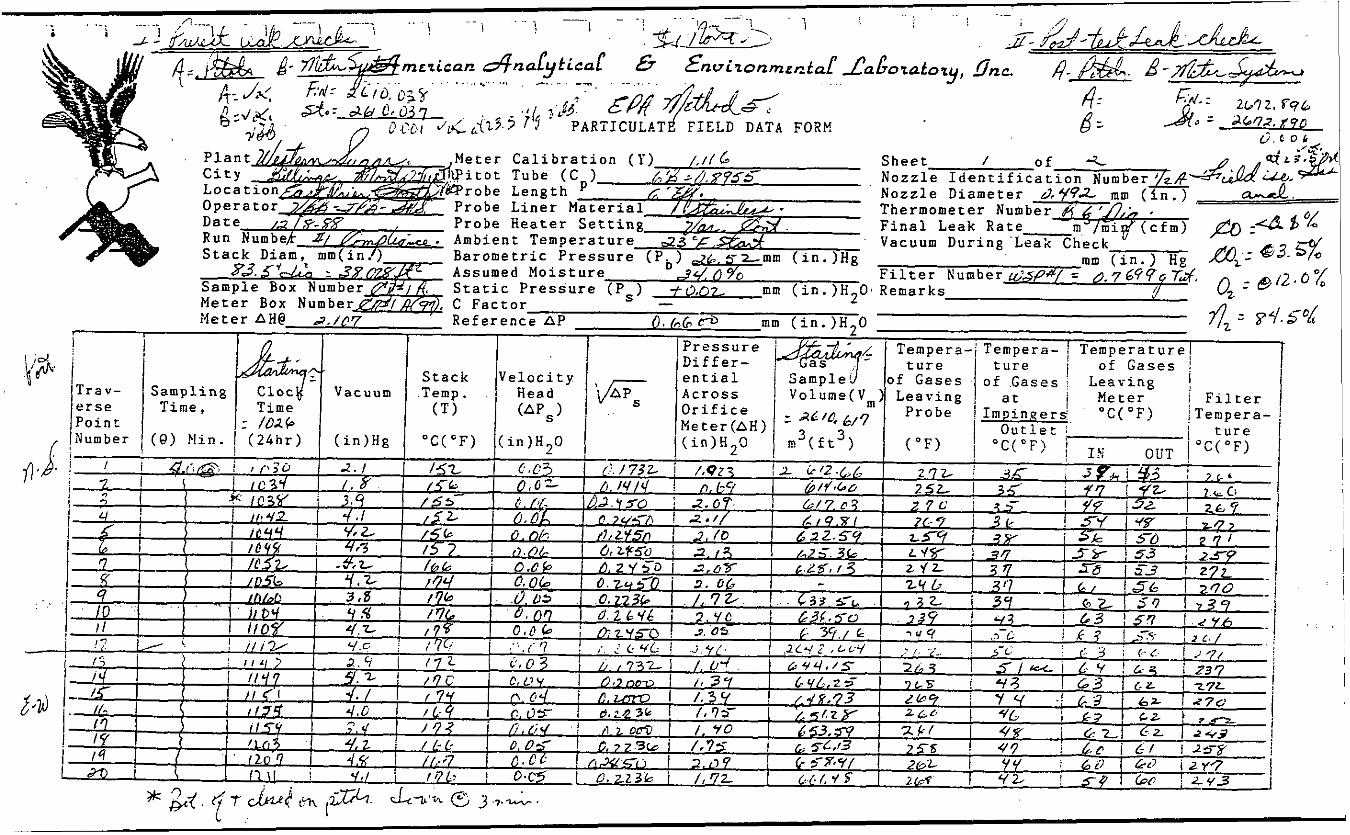
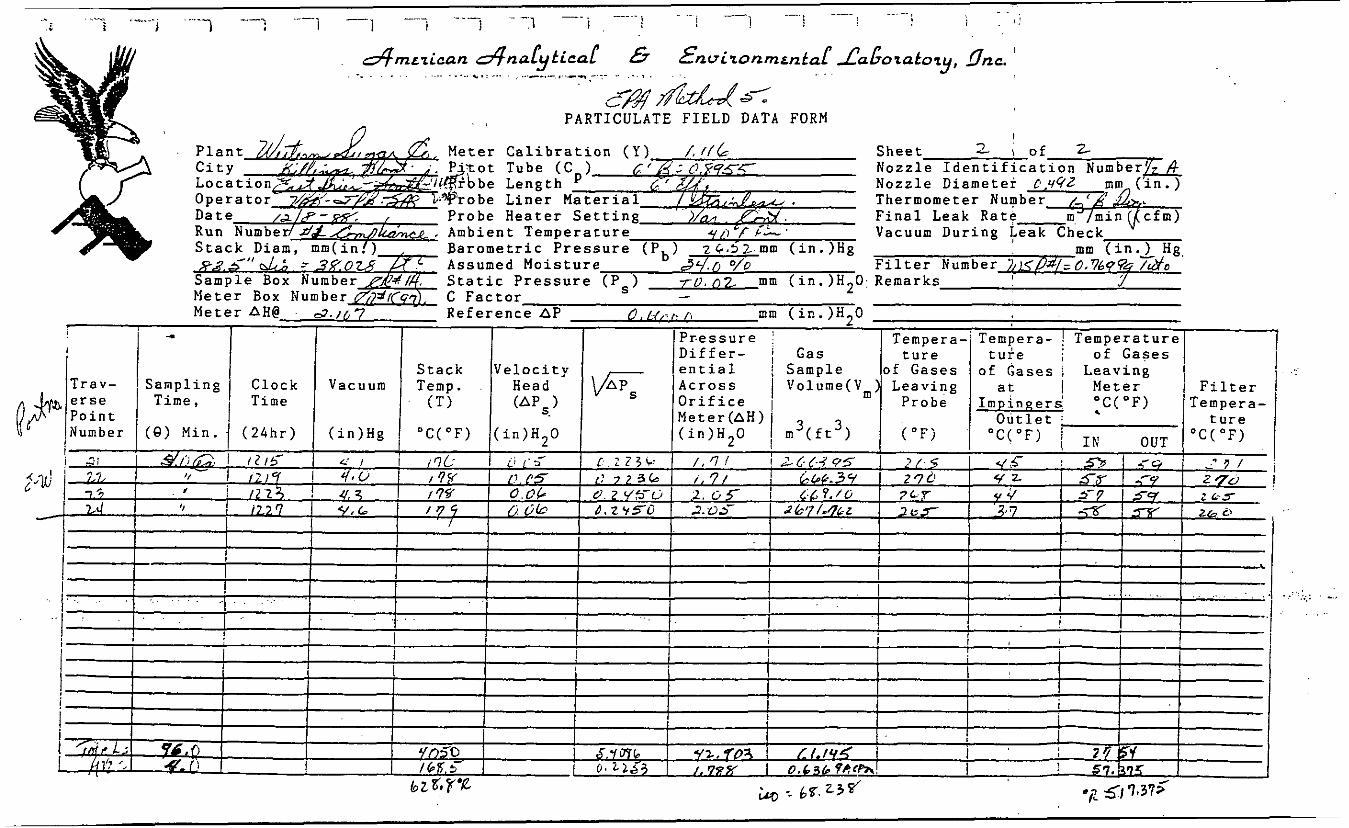
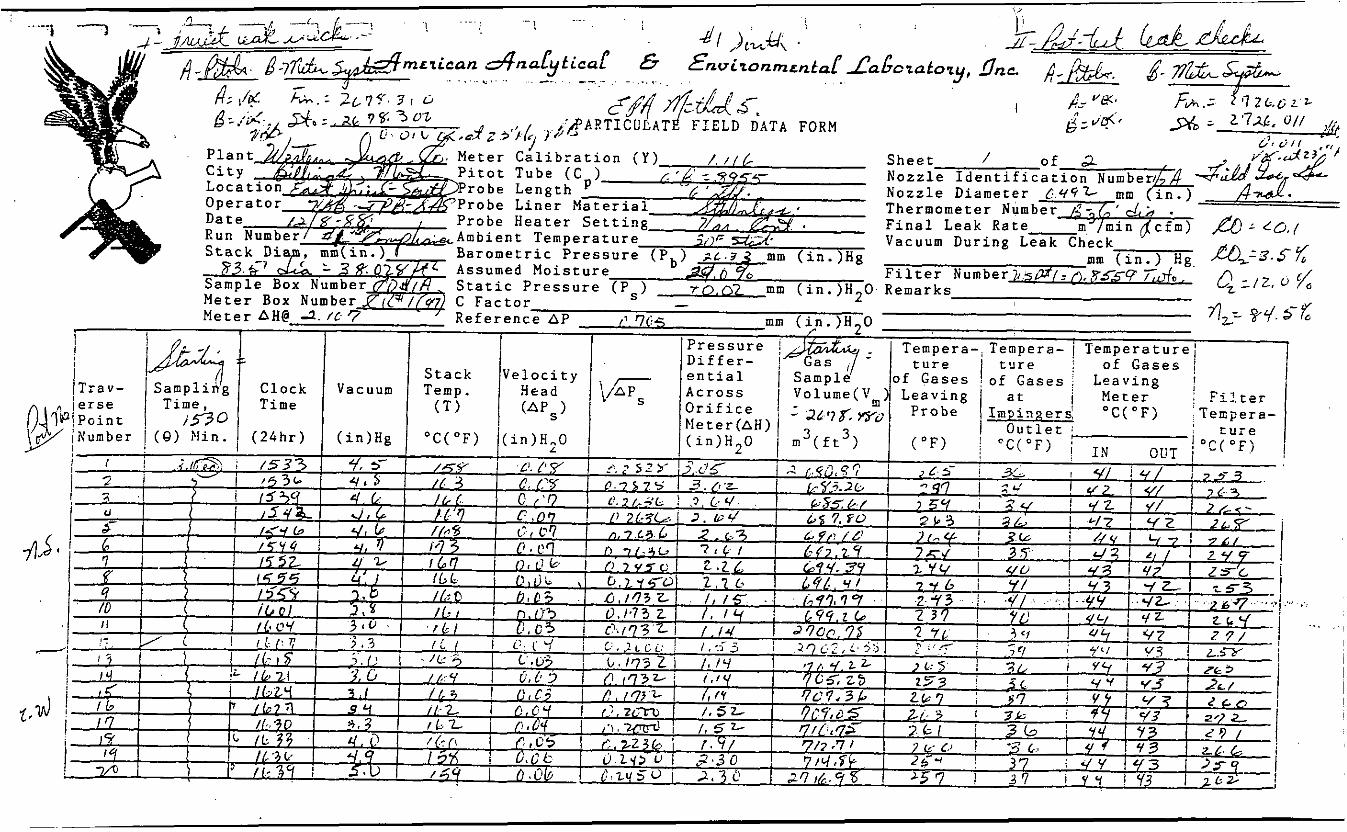
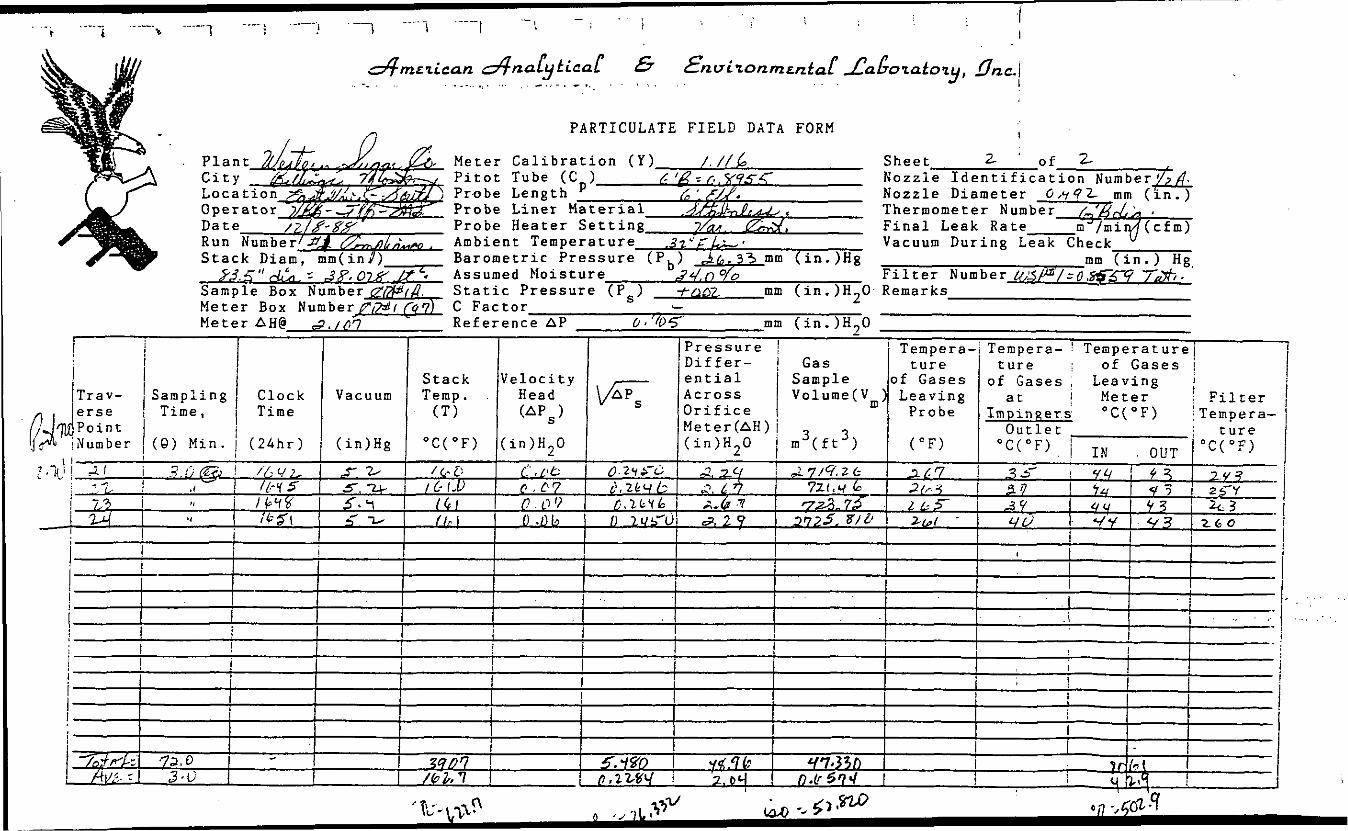
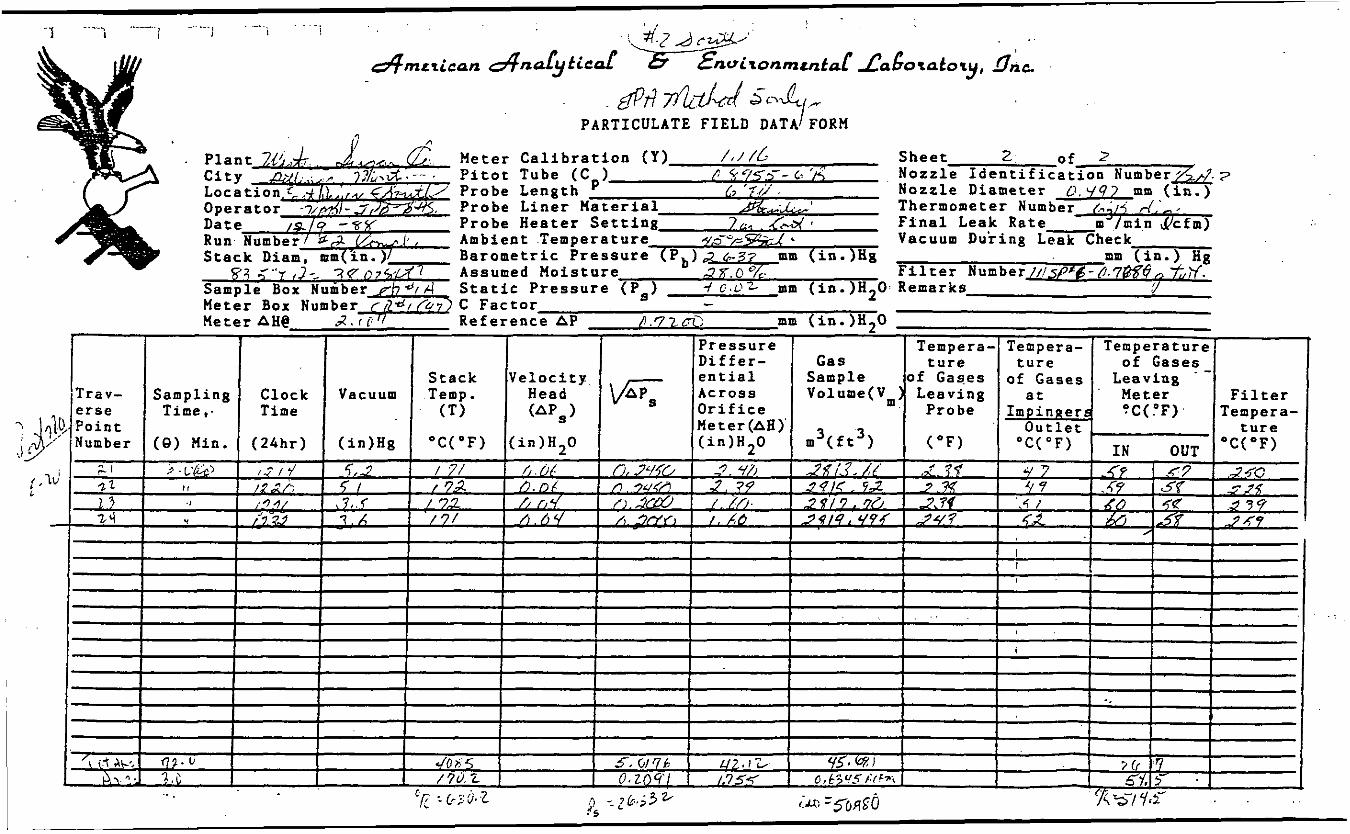
2. Particulate field data forms.
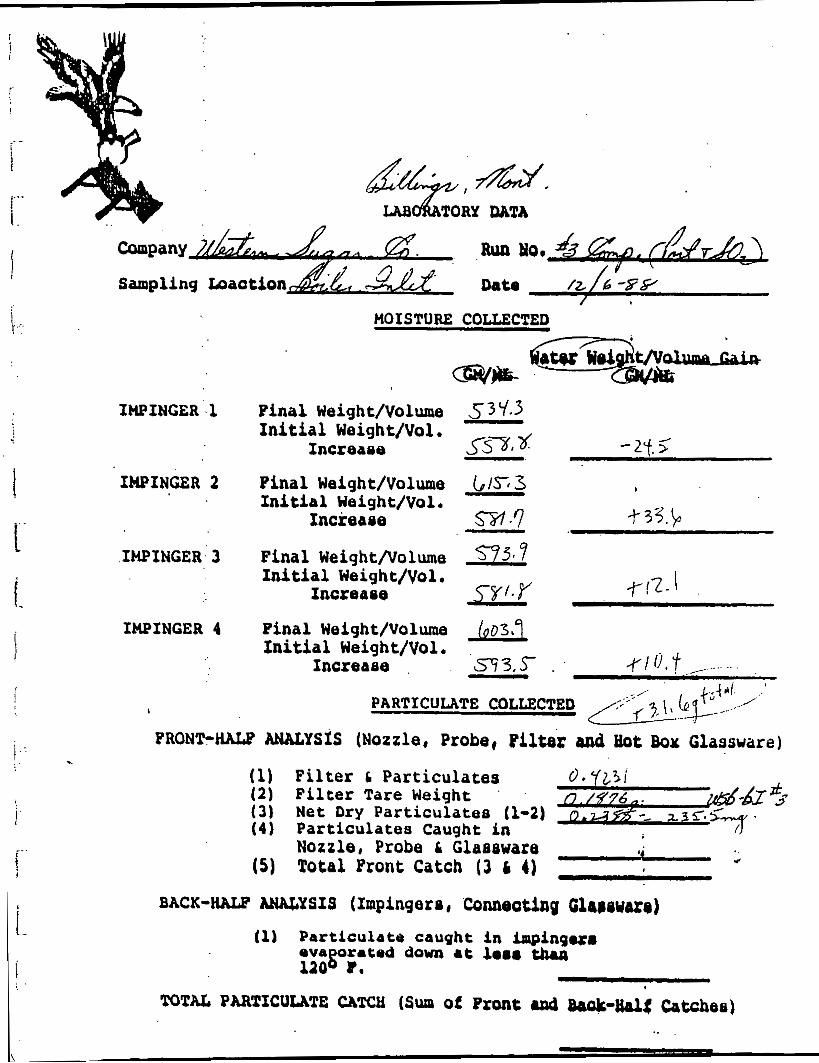
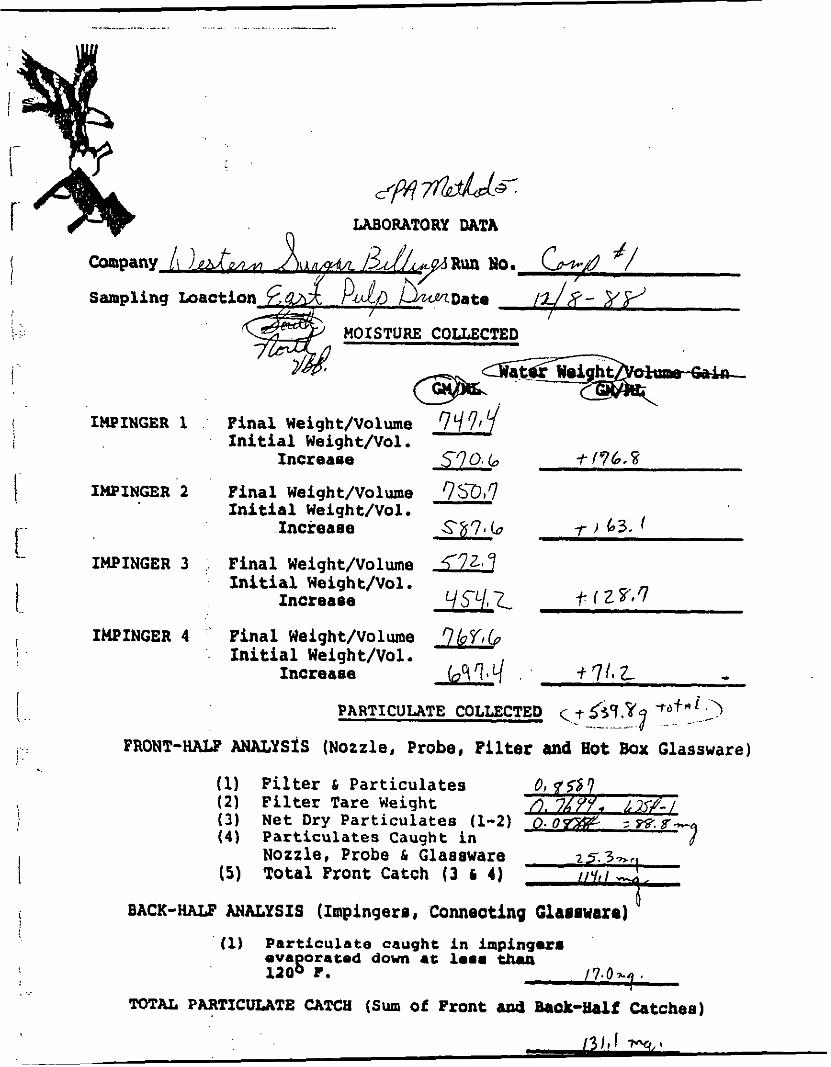
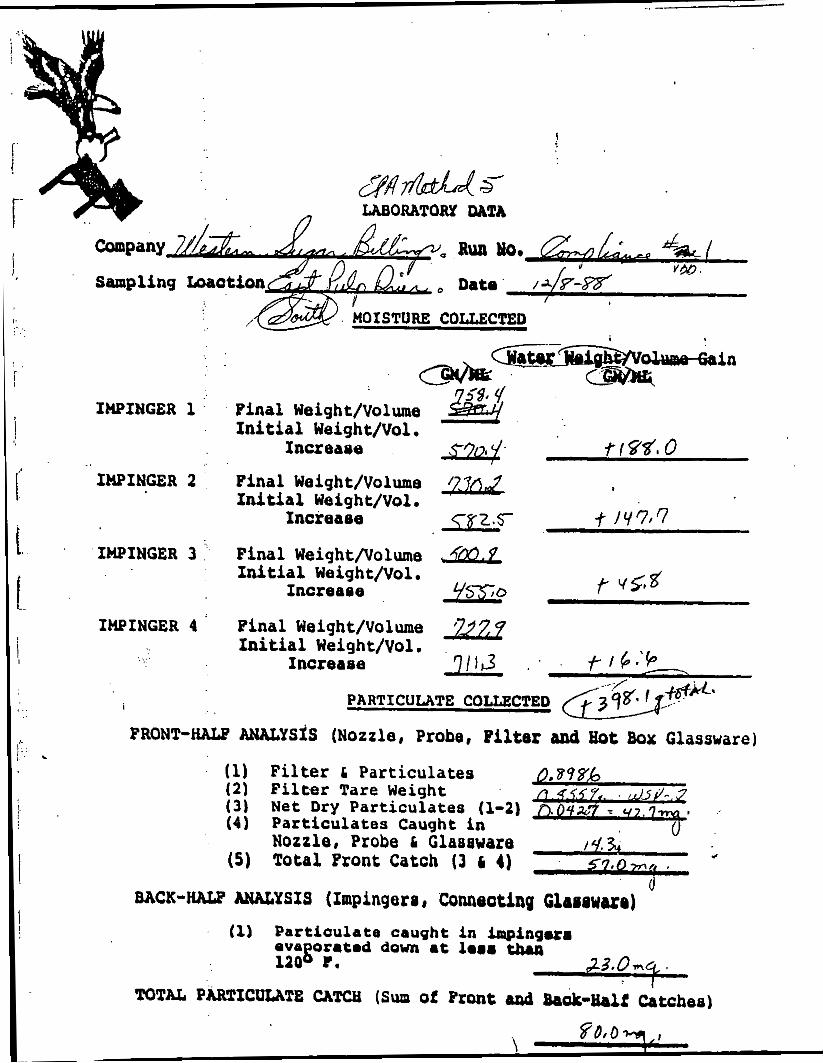
3 . Moisture and filter weight forms.
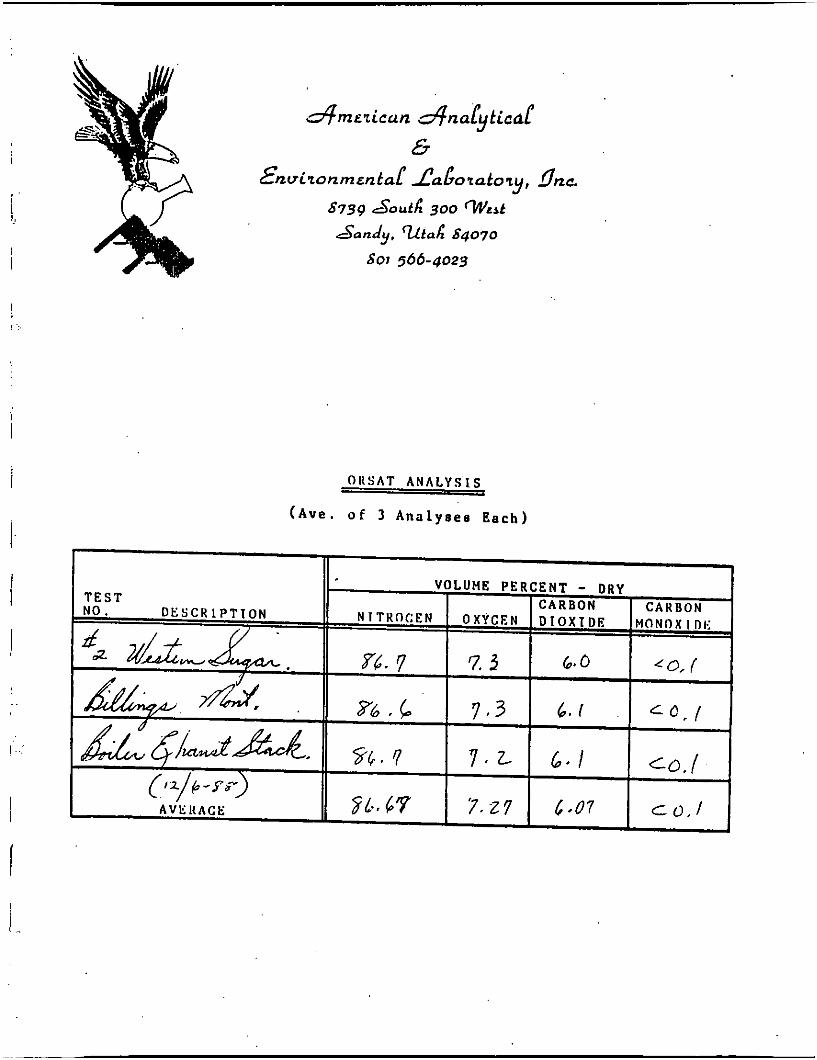
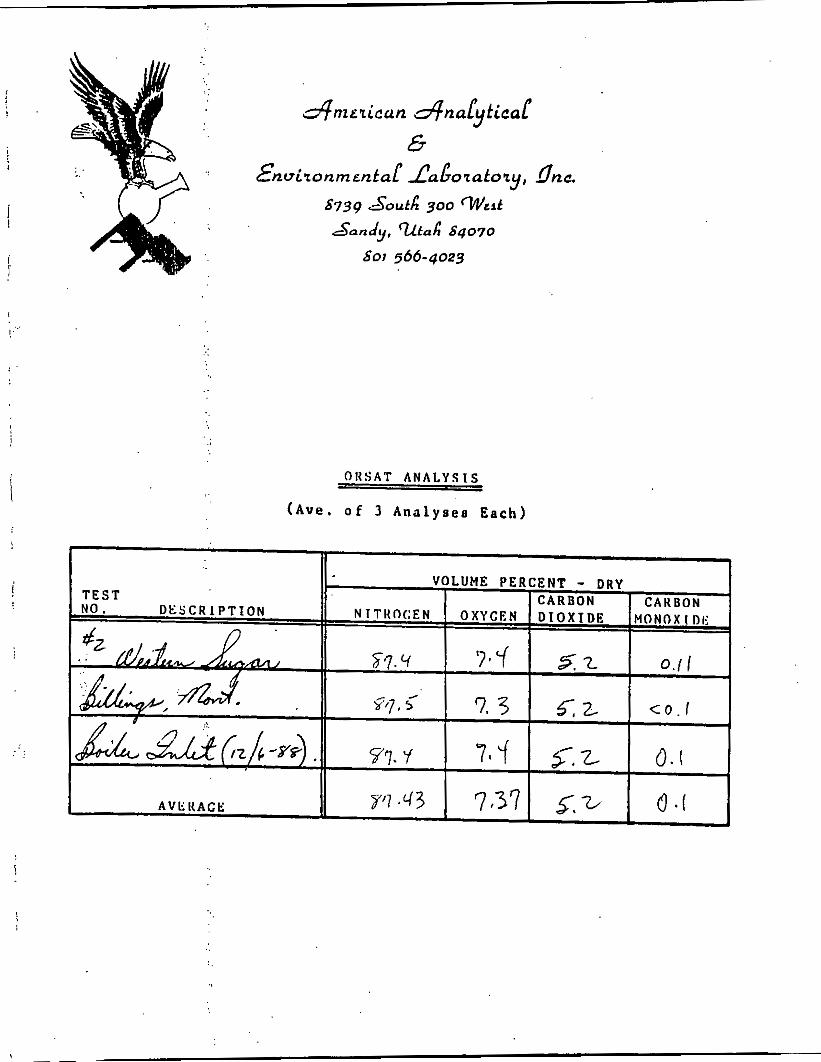
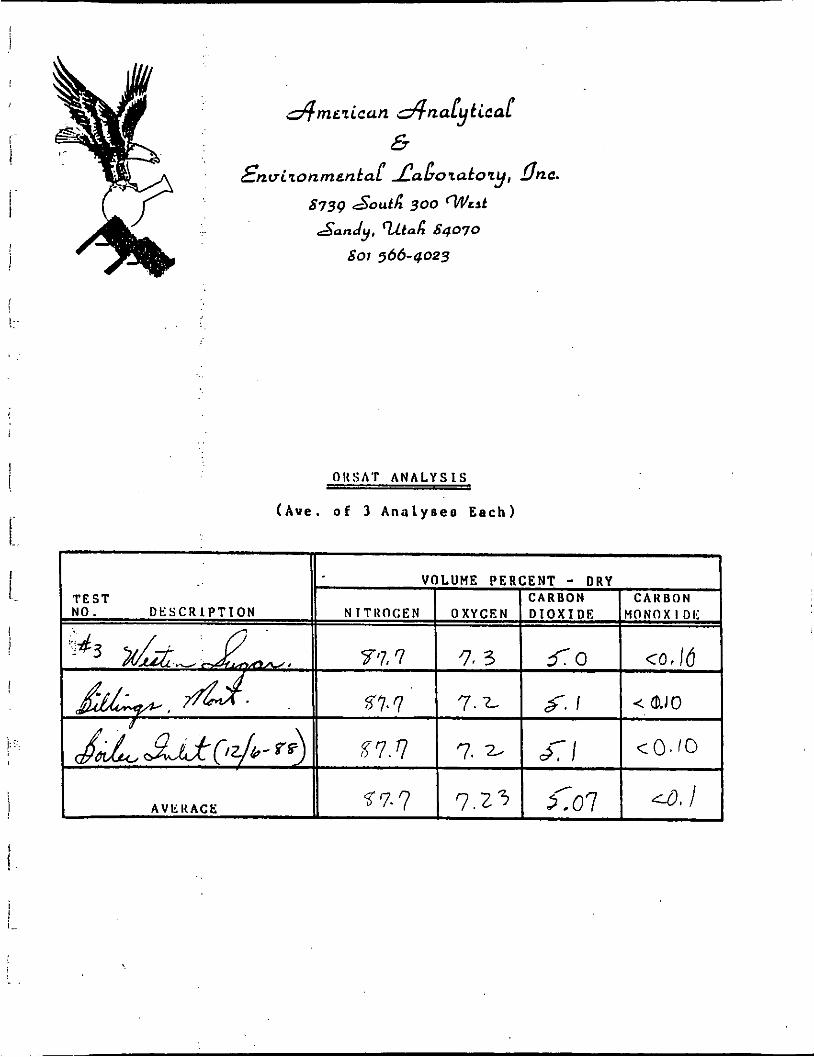
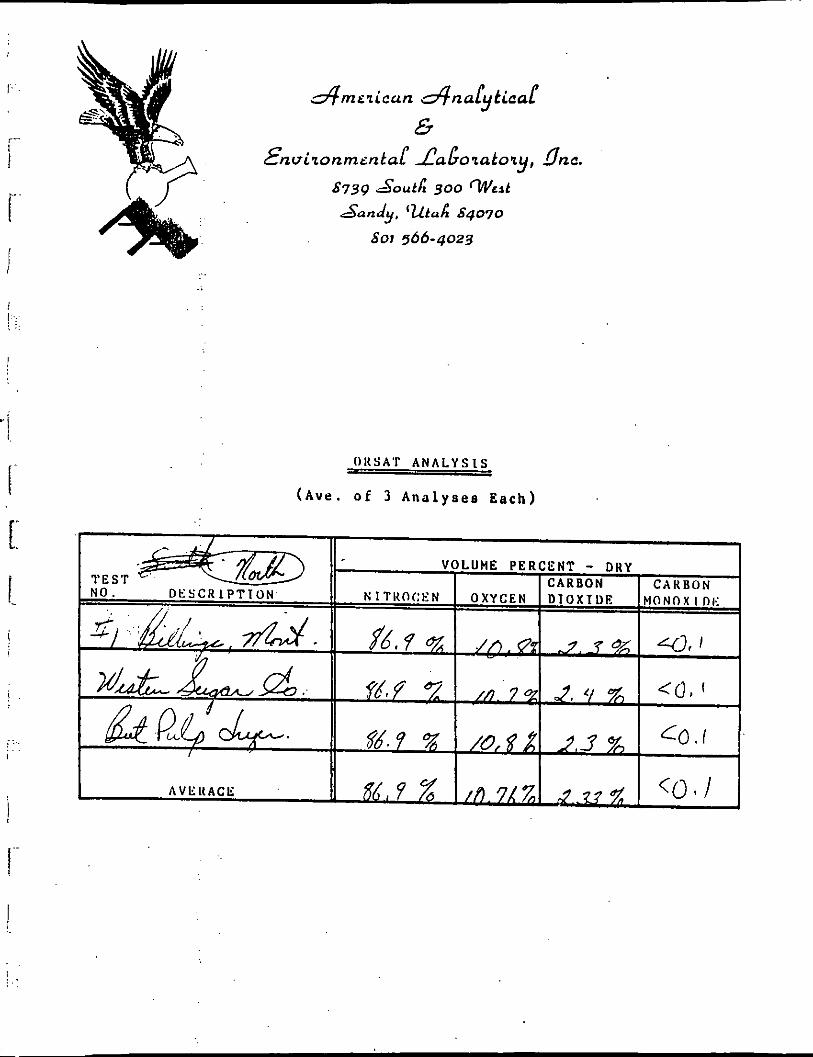
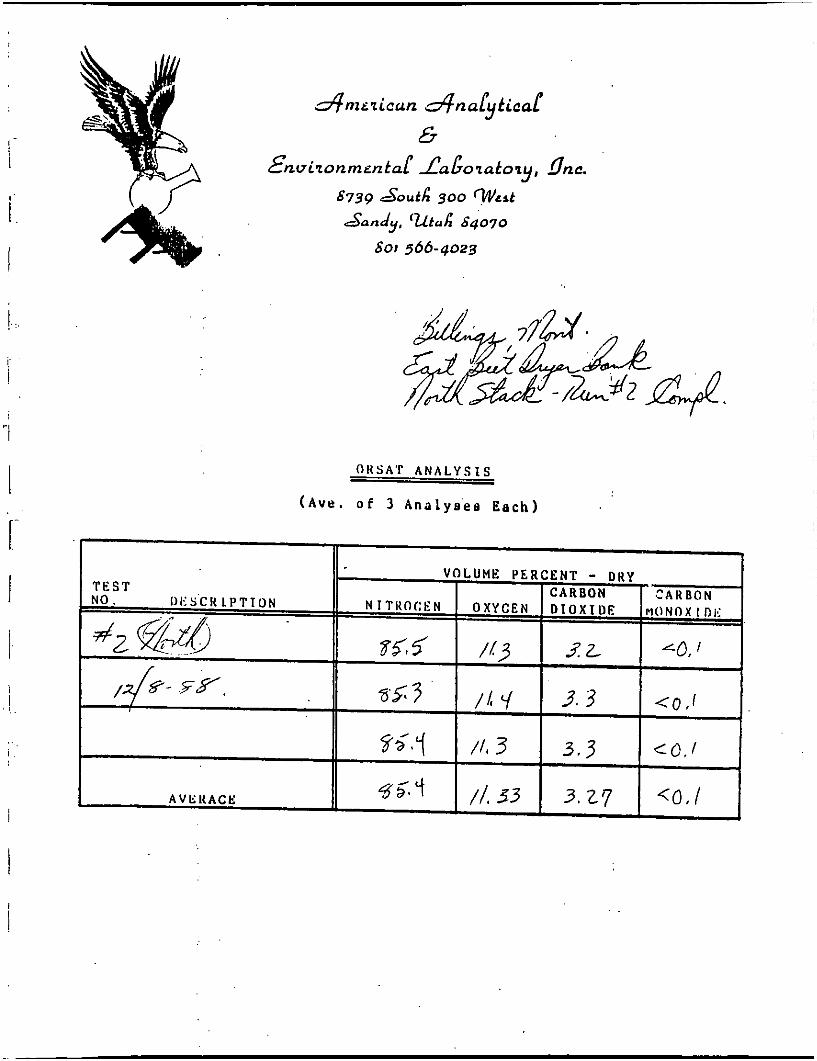
4 . Orsat analysis forms.
5 . Acetone wash and blank sheet.
6.
7. SO2 calculation forms.
SO3 and H2 SO4 and SO2 analysis sheets
B. East - Dryer Bank
Di!e to the fact that the dryer was being fired with natural
gas during the testing it was not required that SO2 emissions
bc measured at this time. The EPA Method 5 particulate data
w a s collected from the north and south stacks alternately for
a total of three ( 3 ) tests on each, or a total of three (3)
complete tests comprising of a test on both the north and south
stack. The total emission rate reflects the addition of one
south and one north stack test particulate loading.
The data from these tests are summarized in Tables IV a) and b).
Compliance data calculated from the raw data in Table IV, are
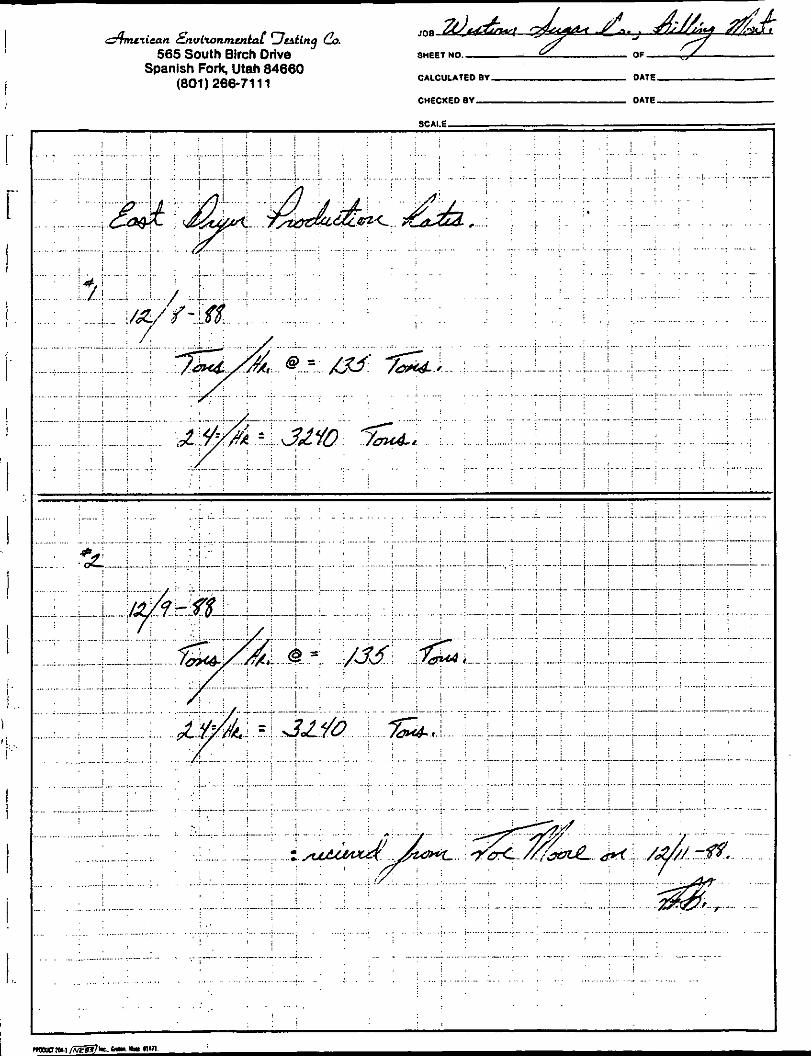
glven in Table V a) and b) - The average particulate loading
for a l l of the tests was 12.23 lbs/hr., which is 11.15% of the
allowable set by the Montana Air Quality Bureau (109.67 lbs/hr.
f c l i - 135 tons/day feed rate).
.. .
\
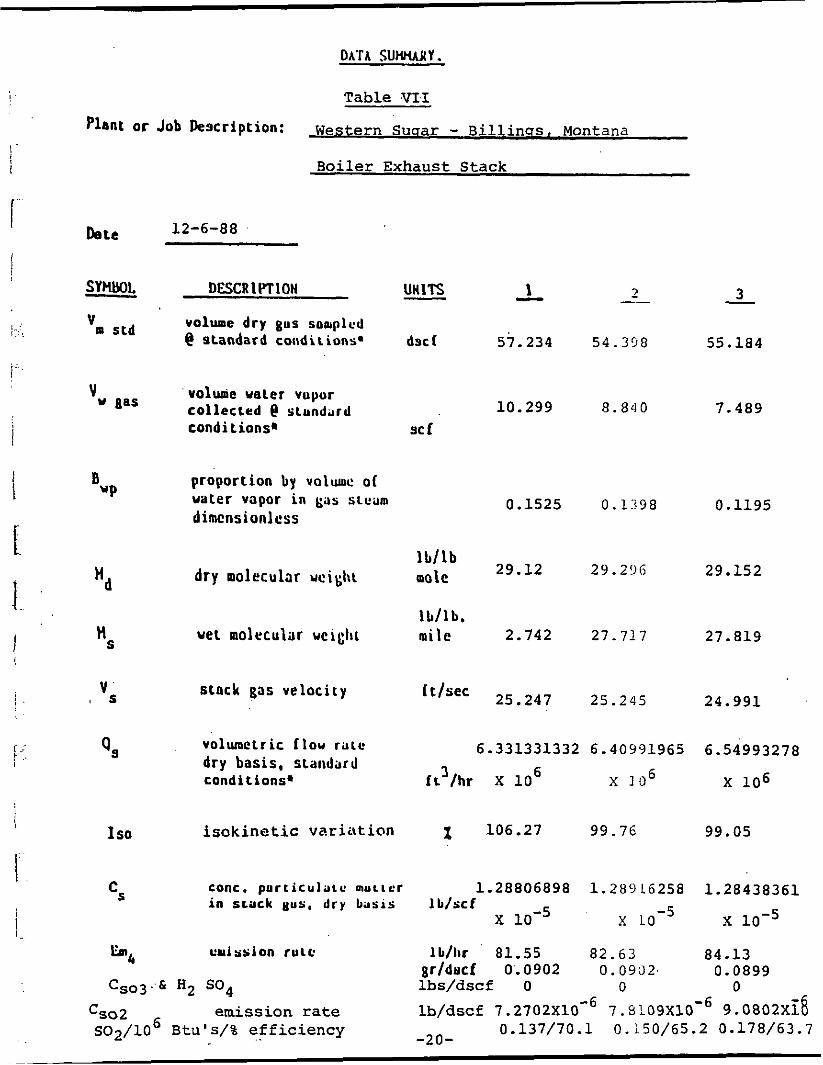
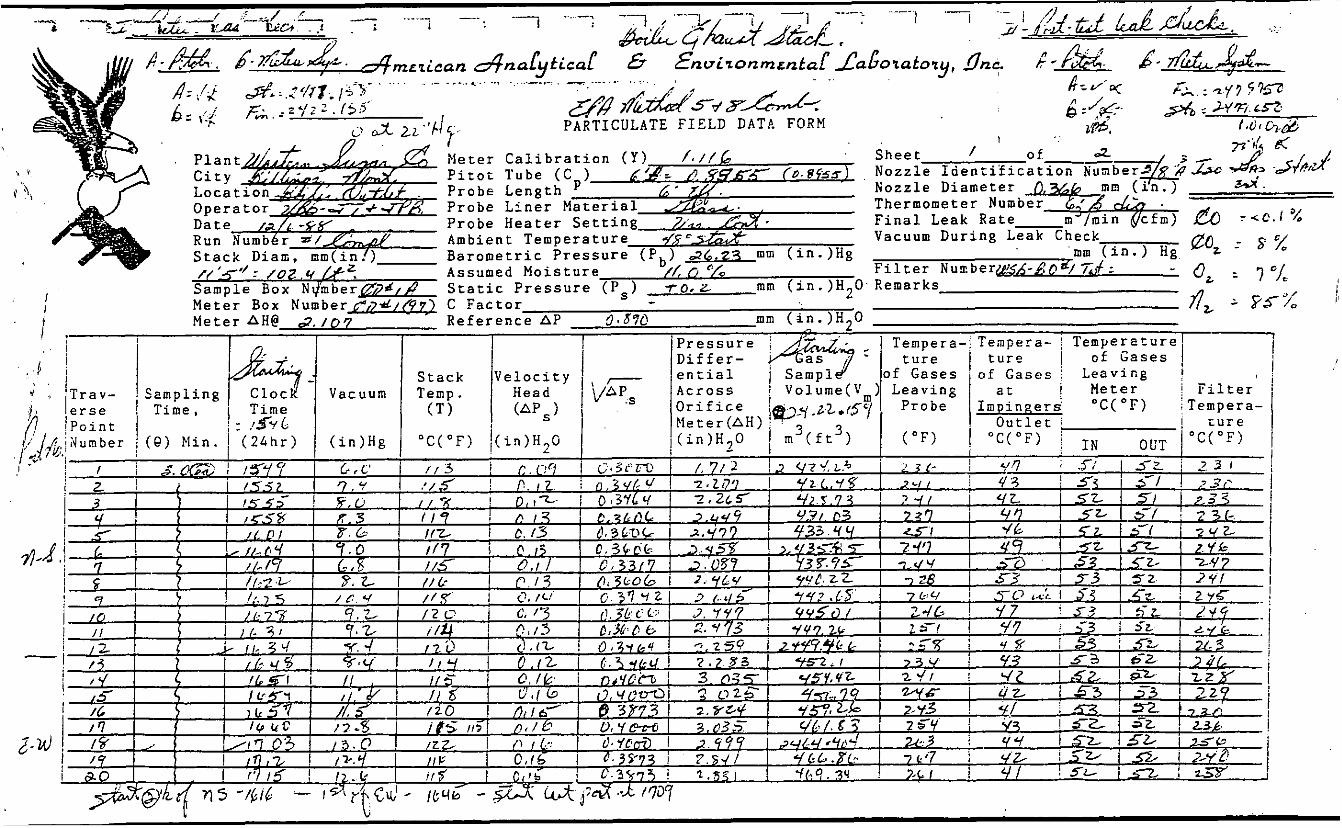
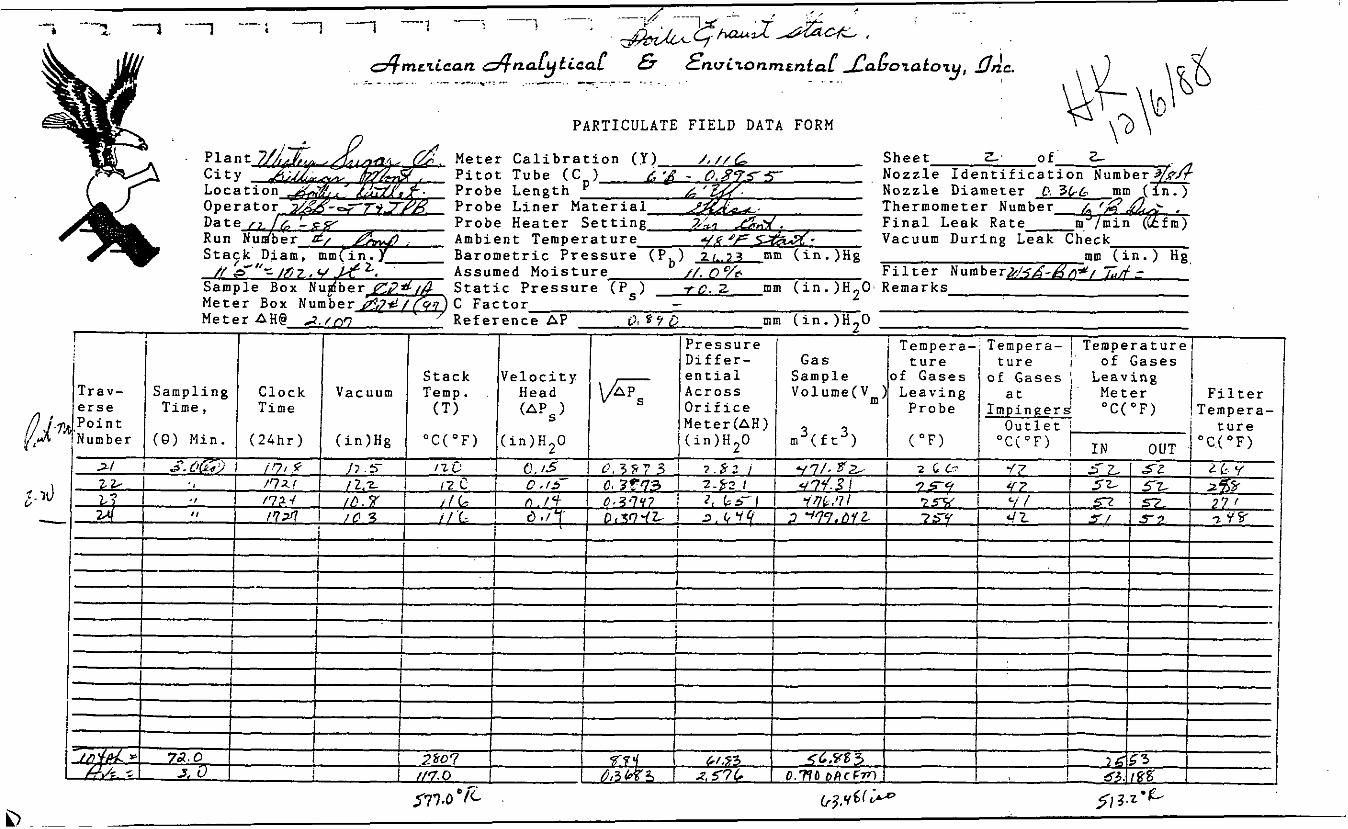
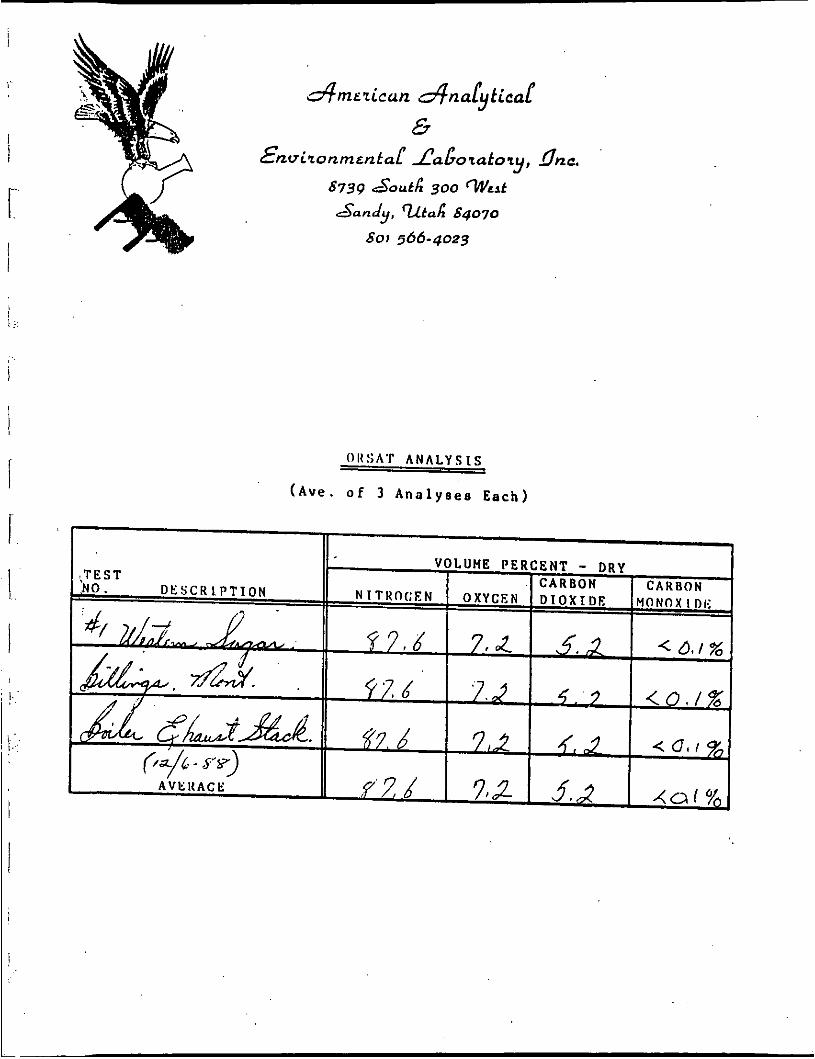
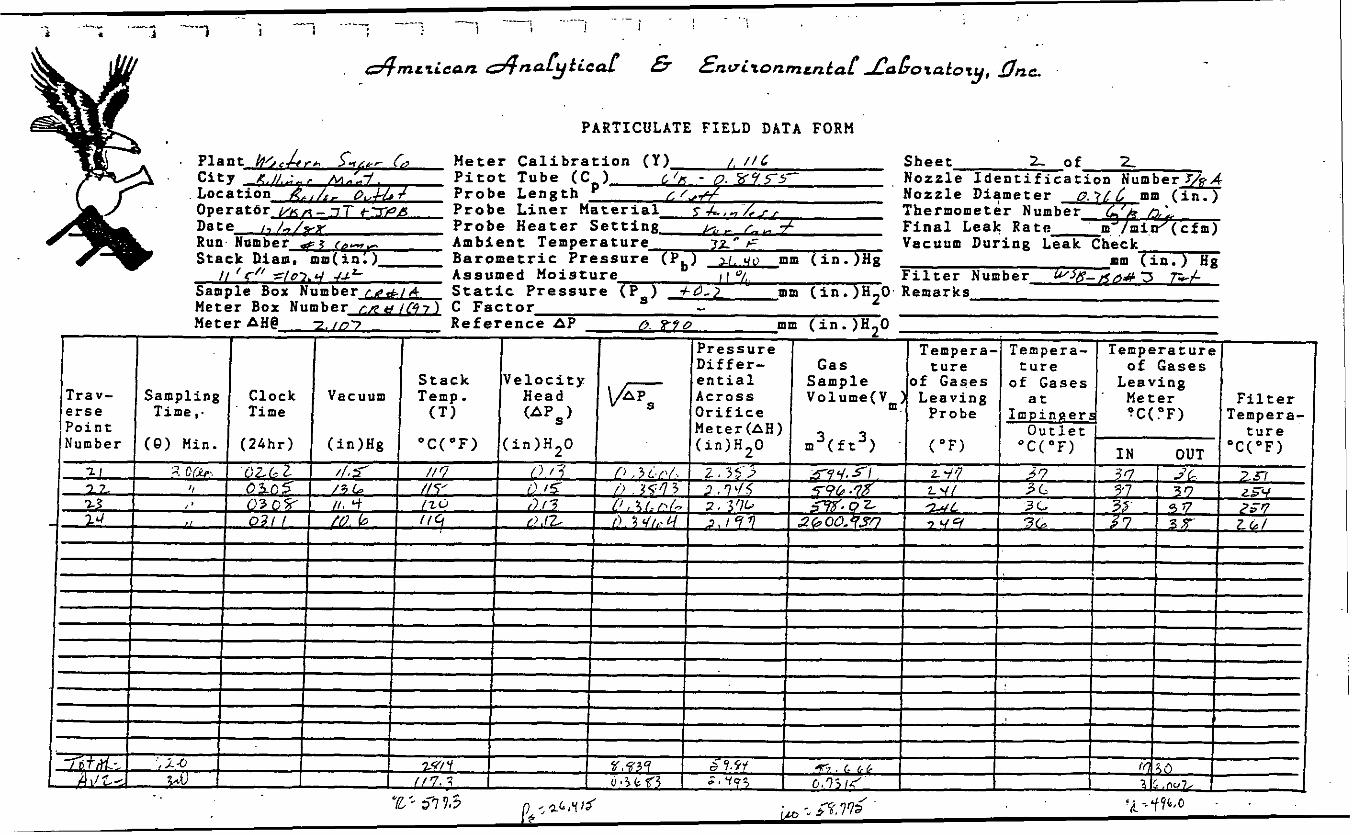
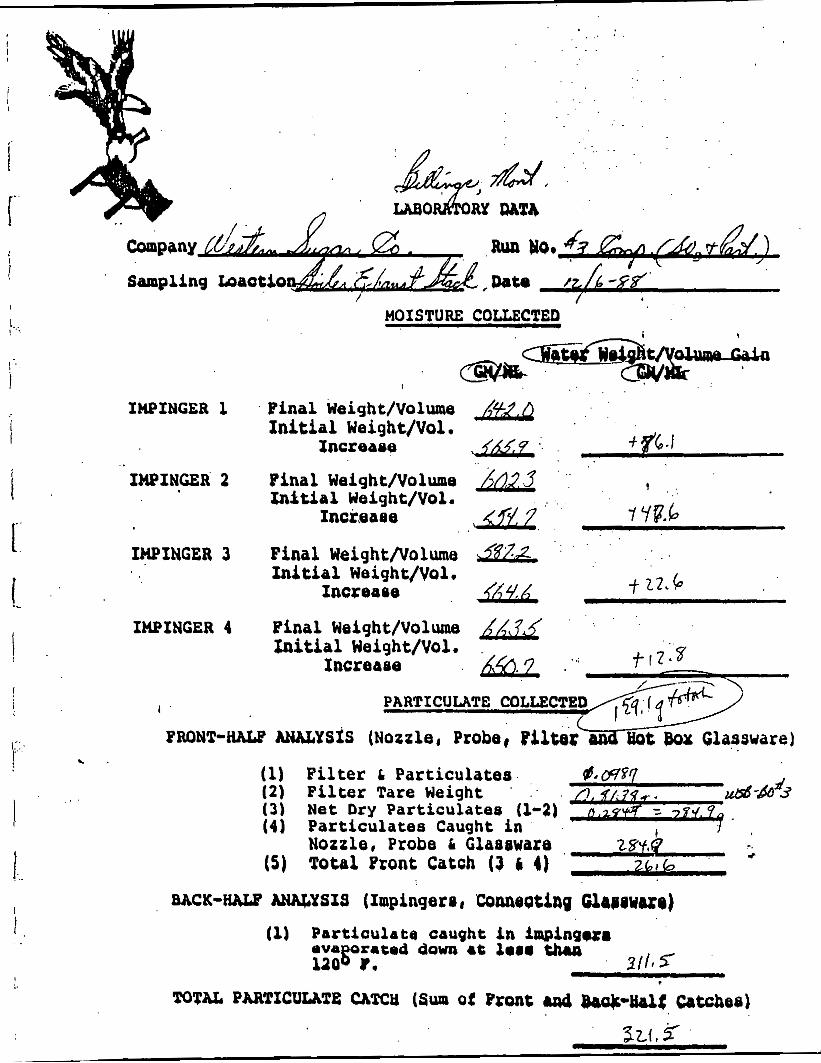
C. Boiler Exhaust Stack
Table VI, summarizes the data collected on the field and
laboratory data forms (see Appendix "B" for original forms)
during compliance testing. The calculated compliance data
from Table VI, is given in Table VII.
The average particulate matter eimission rate was 82.77 lbs/hr.
which is 94.41% of the allowable ceiling level set by the
Montana Air Quality Bureau for this source.
D. Boiler Scrubber Inlet Duct
At the pretest protocol meeting for the Western Sugar Plant
in Billings, a requirement was placed on the inlet duct to
conduct both particulate and sulfur testing.
tests on site showed that the heavy particulate loading in
this duct would make it impossible to conduct a isokinetic
particulate sampling at this location. The State observers
dropped the Method 5 requirement on site due to this problem.
However, in order to provide data to allow SO2 removal rates
through the scrubber a Xethod 8 test was coniiucted simultane-
ously on this inlet duct with each of the t!iree ( 3 ) boiler
exhaust stack tests.
Preliminary
Field and Laboratory data for the inlet duct to the boiler
scrubber are summarized on Table VIII.
is calculated from the field data and presentsd on Table IX.
The SO2 concentration
SO2 removal efficiencies given in Table I, were calculated
using the inlet and exhaust concentrations.
-14-
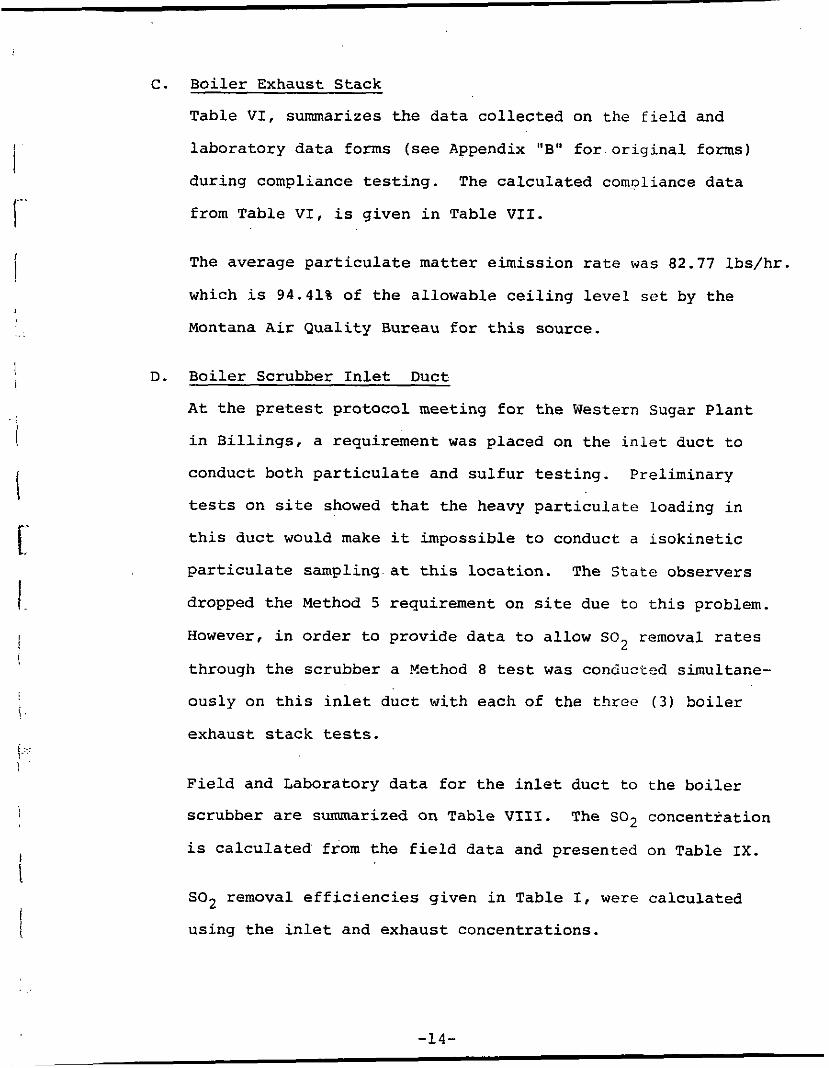
Table I V a ) -
FIELD AND LIBORATORY DATA.
Plant or Job Description: Western Sugar - Billings, Montana
DATE 12-8-88 N # l Sill N#2
SYMBOL DESCRIPTION 3 - 2 - 1 - volume dry gas sampled @ meter conditions
barometric pressure
ft3 61.145 47.330 45.745
"Hg abs 26.52 26.33 26.30
m
'b
A H average pressure drop in
V
1.788 2.04 1.878 H2° across the orifice meter
average gas meter temperaLure O F 57.4 42.9 40.2
meter coefficient 1.116 1.116 1.116
rota1 H,,O collected, impinge7s I I silica gel Nl 539.8 398.1 385.6
m
'i
T
W V
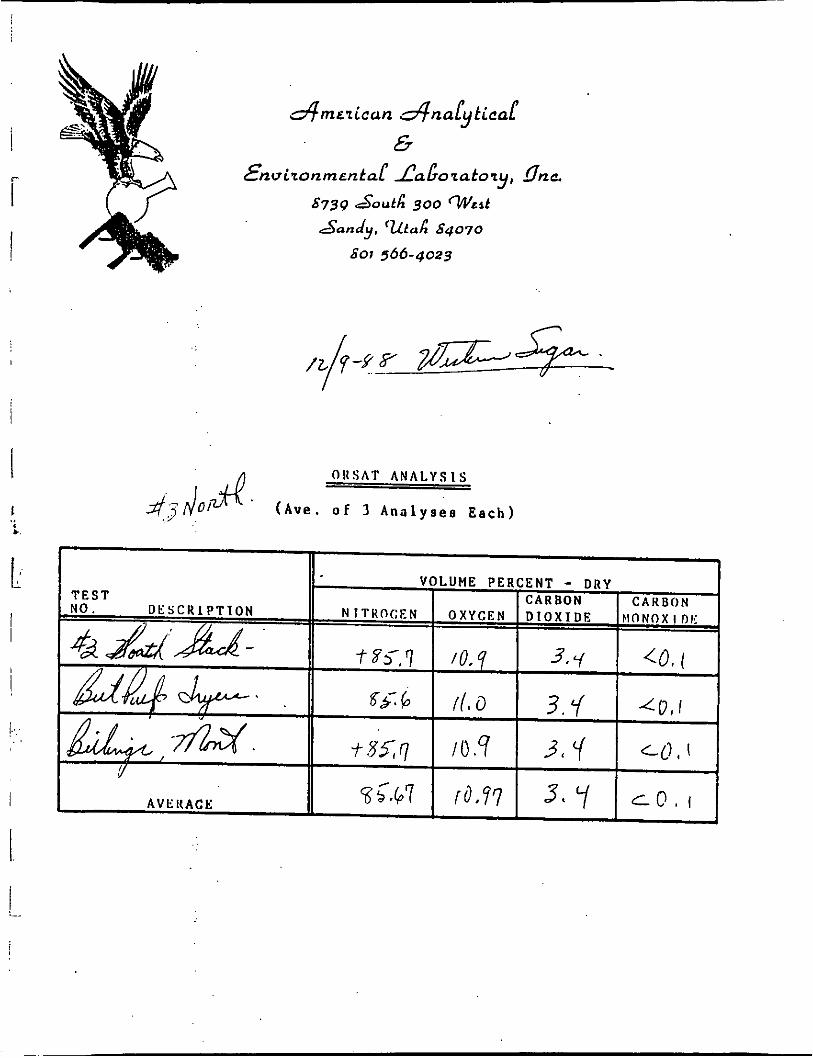
co2
O 2
%t co
nozzle dia. n H
1:::
a
%
z 85.0 86.9 85.4 -
in. 0 . 4 9 2 0.492 0.492
'F 168.5 162.7 167.1 stack temperature s T
-raa velocity. head of stack gas
in. "2O
0.2253 0.2284 0.2175
c pitoc tube coefficienc 0.8955 0.8955 0.8555 P static pressure in
+0.02 +0.02 +o. 02 pS
H2° 2
AS area stack ft . 38.028 38.028 38.028
min. 96.0 72.0 72.0
mg , ' 131.1 80.0 135.0
nec time of t e s t
Total particulates
Tt
Mg*
-15-
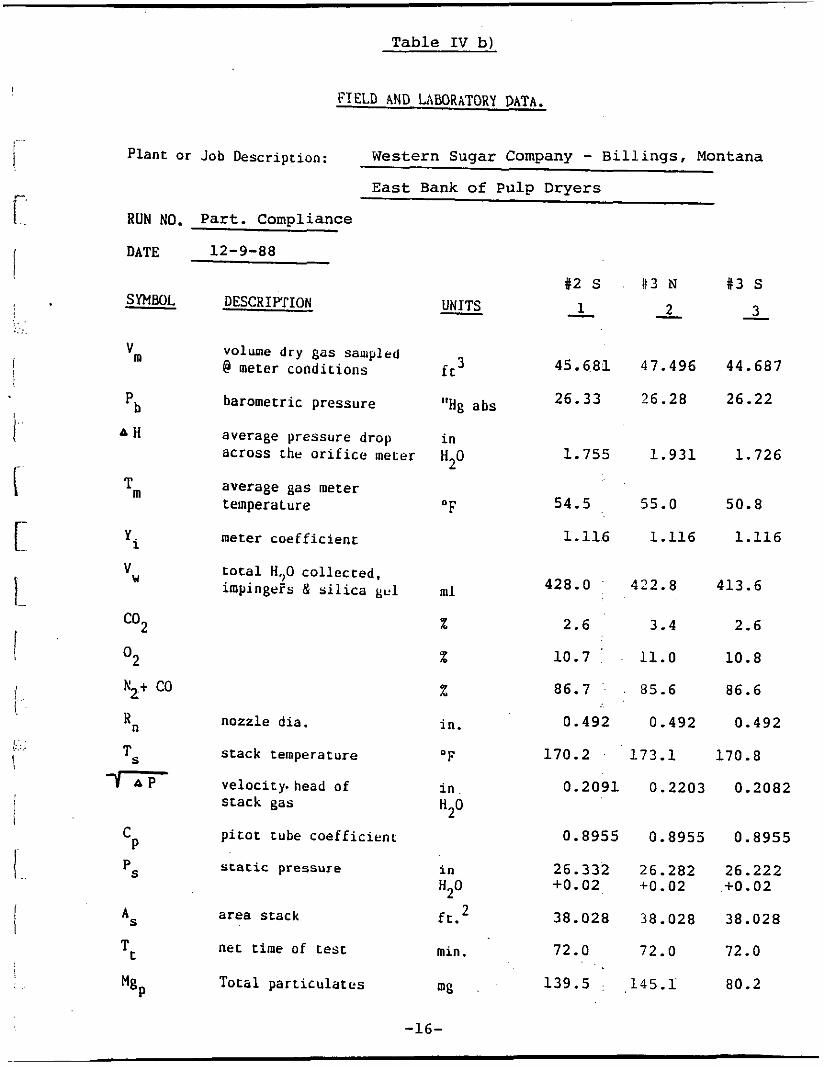
Table IV b)
FIELD AND LABORATORY DATA.
Plant or Job Description: Western Sugar Company - Billings, Montana East Bank of Pulp Dryers
RUN NO. Part. Compliance
DATE
SYMBOL - m V
'b A H
m T
Y.
V
1
W
c02
O2 N 2 t co
n H
T S
-ra?;-
C P
pS
S A
Tt
"%
12-9-88
DESCRIPTION
volume d r y gas sanlplrd @ meter condicioas
barometric pressure
average pressure drop across the o r i f i c e meter
average gas meter temperalure
meter coef f ic ien t
t o t a l H,,O col lec ted , impingefs & s i l i c a gel
nozzle dia.
stack temperature
velocity. head of s tack gas
p i t o t tube Coefficient
static pressure
area stack
net time of t e s t
Total pa r t i cu la t e s
#2 s it3 N 2 - 1 - UNITS -
45.681 47.496
26.33 26.28
f c 3
"Hg abs
-16-
i n
H2°
"F
ml
z z z in.
O F
i n H2°
i n
H2° 2 ft.
min.
mg
1.755 1.931
54.5 55.0
1.116 1.116
428.0 422.8
2.6 3.4
10.7 11.0
86.7 85.6
0.492 0.492
170.2 173.1
#3 s 3 -
44.687
26.22
1.726
50.8
1.116
413.6
2.6
10.8
86.6
0.492
170.8
0.2091 0.2203 0.2082
0.8955 0.8955 0.8955
26.332 26.282 26.222 +0.02 +o. 02 +o. 02 38.028 38.028 38.028
72.0 72.0 72.0
139.5 , 145.1 80.2
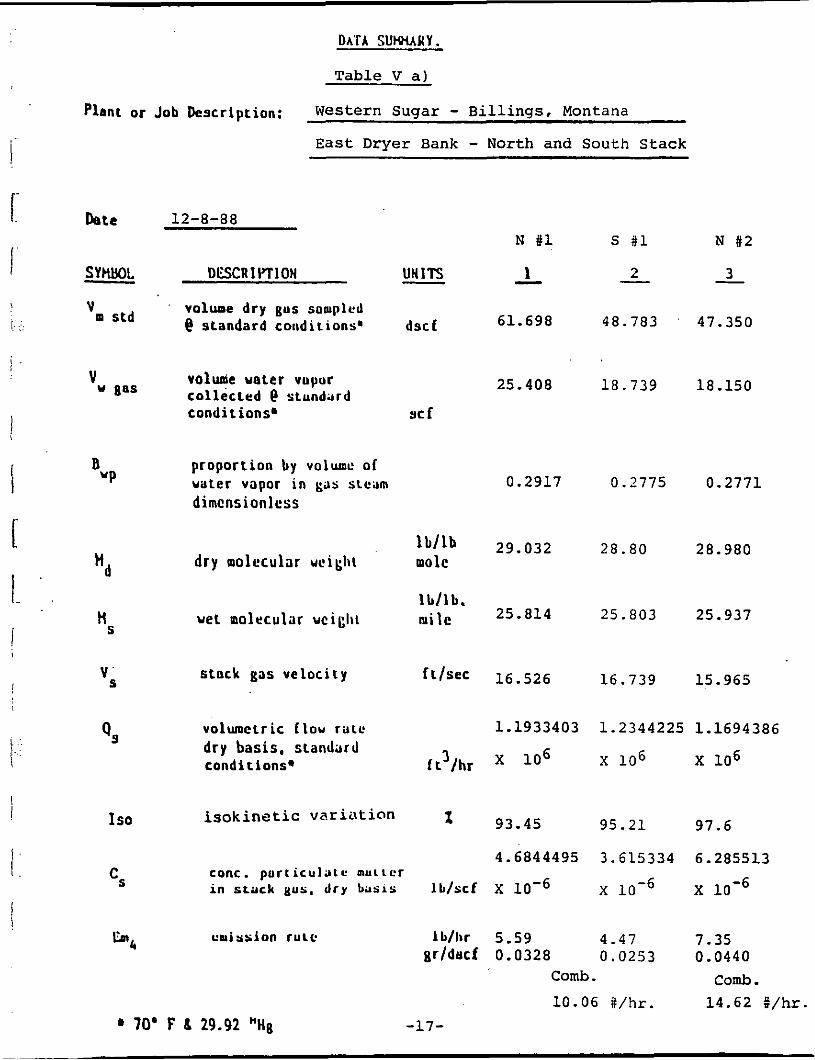
D A T A SUMMAMY.
T a b l e V a )
Plant or Job Description: Weste rn Sugar - B i l l i n g s , Montana
E a s t Dryer Bank - North and South Stack
Detc 12-8-88 N # 1 s t l N #2
2 3 - - 1 - U N I T S - SYHWL DUCR 1 MI OH - 'm std volume dry gus soepled
@ standard conditions.
volunie unter vupor collected e stundard Y gas
V
dscf 61.698 48.783 47.350
25.408 18 .739 18.150
condi Lions' Y t f
B proportion by v o l u c of W P uater vapor in gas stcam 0.2917 0.2775 0.2771
dimcnsionlcss
"/lb 29.032 28 .80 28.980 dry nolccular uc'ikIi\ molc 'd
1b111. wet nolecular ucichi m i l e 25.814 25.803 25.937
S n
16.526 16.739 15.965 v . stock gas velocity S
volumetric [IOU raic 1.1933403 1 .2344225 1.1694386
conditions. f t3/hr x 1 0 6 x 106 x 106 dry basis, standard 9,
93.45 95 .21 97.6 I so isok i ne tic v z\ r i it t ion I
4.6844495 3.615334 6.285513 conc. purriculatu mutter in stack MUS. d r y b a s i s Ib/scf X x 10-6 x l o - 6 cS
lh4 cluirsion rutc Ib/lir 5.59 4.47 7.35 gr/decf 0.0328 0 .0253 0.0440
comb. comb. 10.06 t/hr. 14.62 g/hr.
' 70' F 6 29.92 "Hg -17-
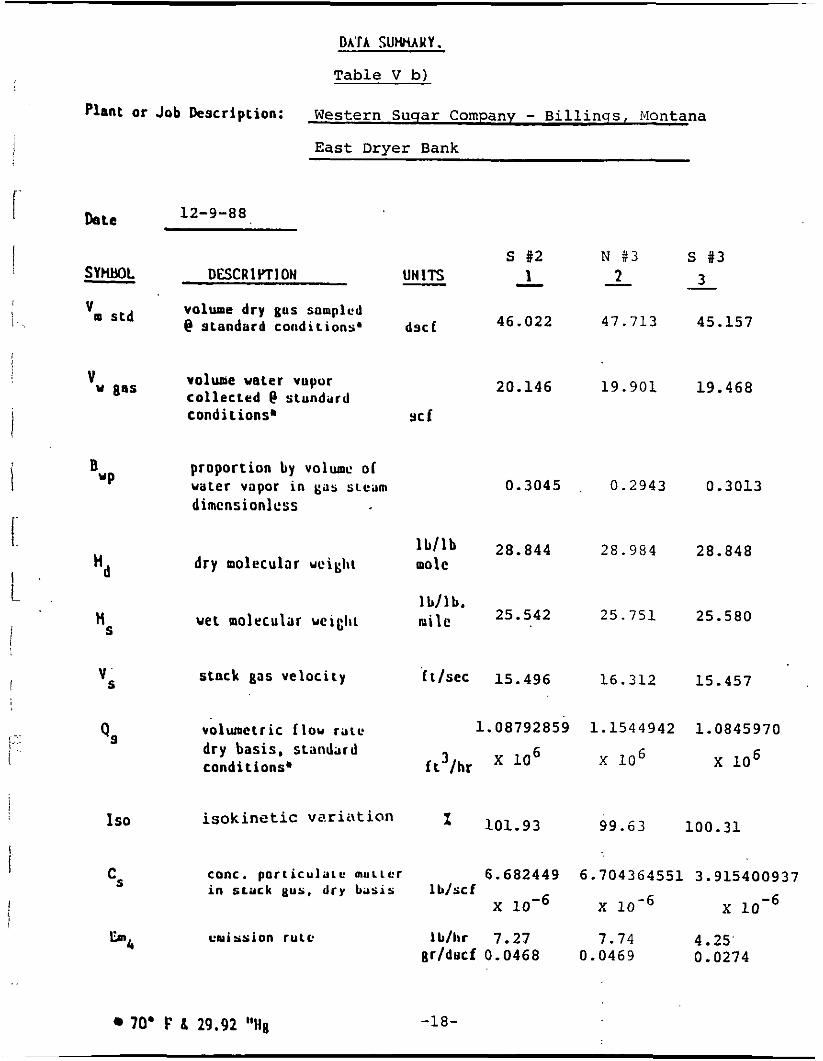
D A T A SUHHAIIY.
Table V b)
Plant or Job Description: Western Suqar Company - B i l l i n q s , Montana
E a s t Dryer Bank
12-9-88 Date
s 82 1 - - SYmOL DESCR 1 YT I ON U N l T S
"m 5 t d volume dry gus somplcd @ standard condirions' dsc f 46.022
volume water vuyur col lected I? stundilrd w gas V
~~
conditions* rcf
B proportion by vol~mc ol water vapor i n gas sLeam dimensionless
W P
20.146
N #3 s #3 3 - 2 -
47.713 45.157
19.901 19.468
0.3045 0.2943 0.3013
lb / lb 28.844 28.984 28.848 dr y molecular ucigbi mole 'd
S H
l L / l b . 25.542 25.751 25.580 wet molecular uciclii mile
stack gas velocity ft/sec 15. 496 16.312 15.457 V ' S
volumetric flow r a t e 1.08792859 1.1544942 1.0845970 a- -3
conditions* ft3/hr x lo6 x 106 x 106 dry basis , standard
101.93 99.63 100.31 Is0 i s o k i n e t i c v a r i a t i o n
conc. porticulaic muLter 6.682449 6.704364551 3.915400937 i n stack &us. d r y basis lb/scf
x 10-6 x 10-6 x 10-6 Emnq miss ion ruLc Jb/lir 7.27 7.74 4.25.
gr/dscf 0.0468 0.0469 0.0274
70' F S 29.92 "Hg -18-
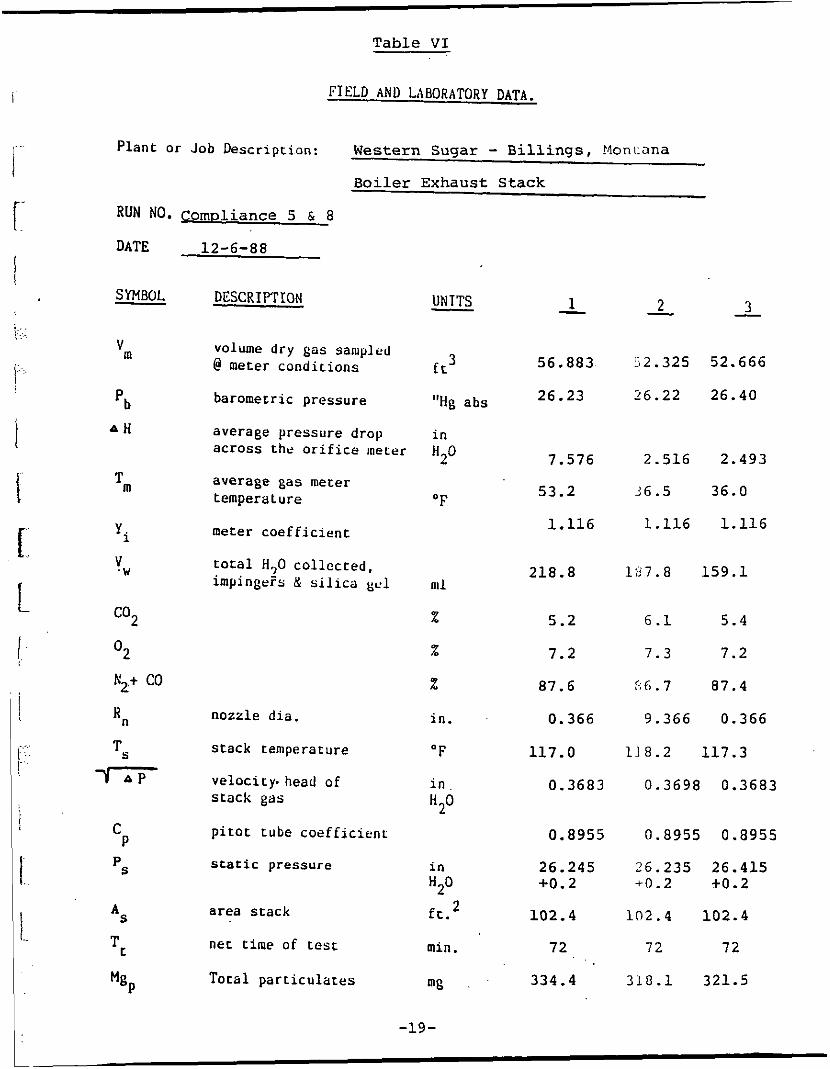
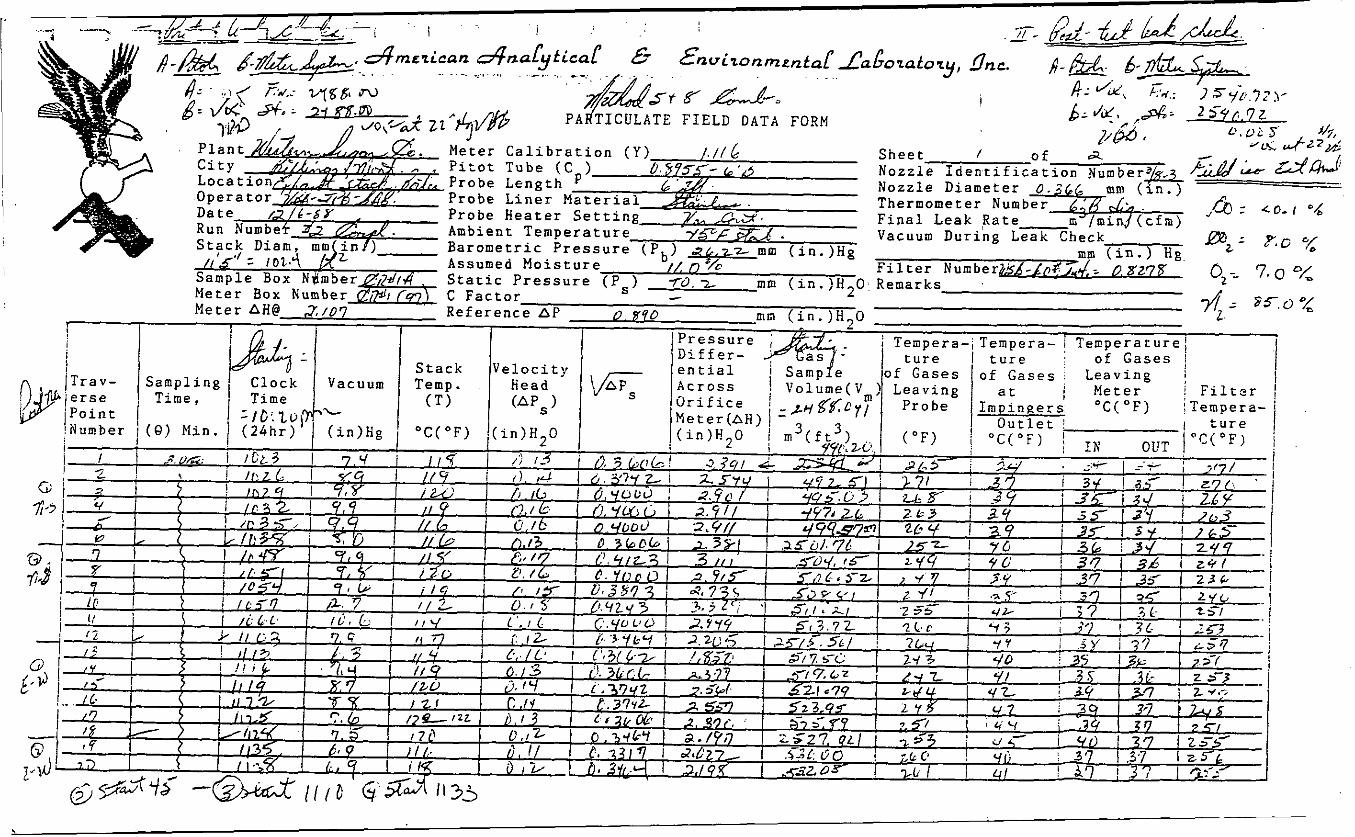
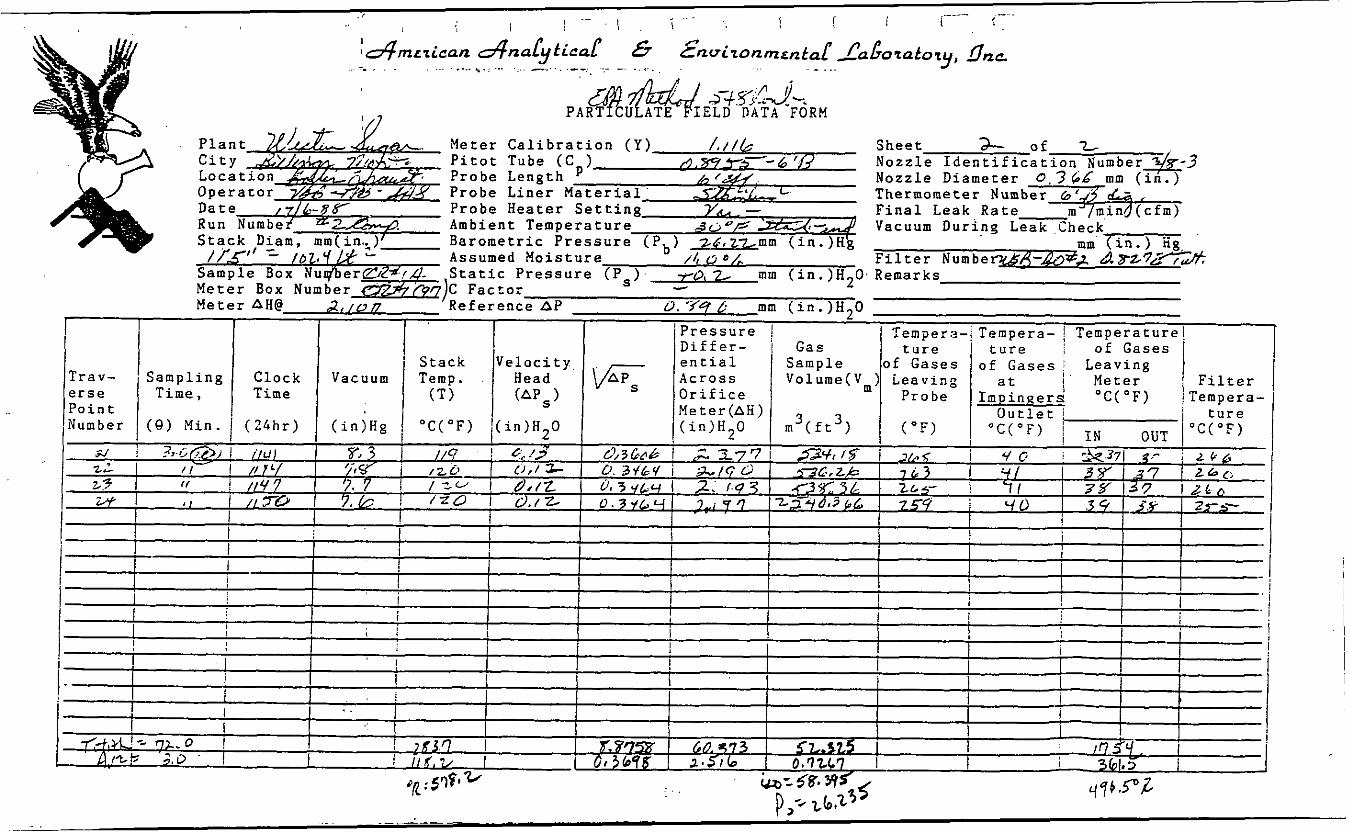
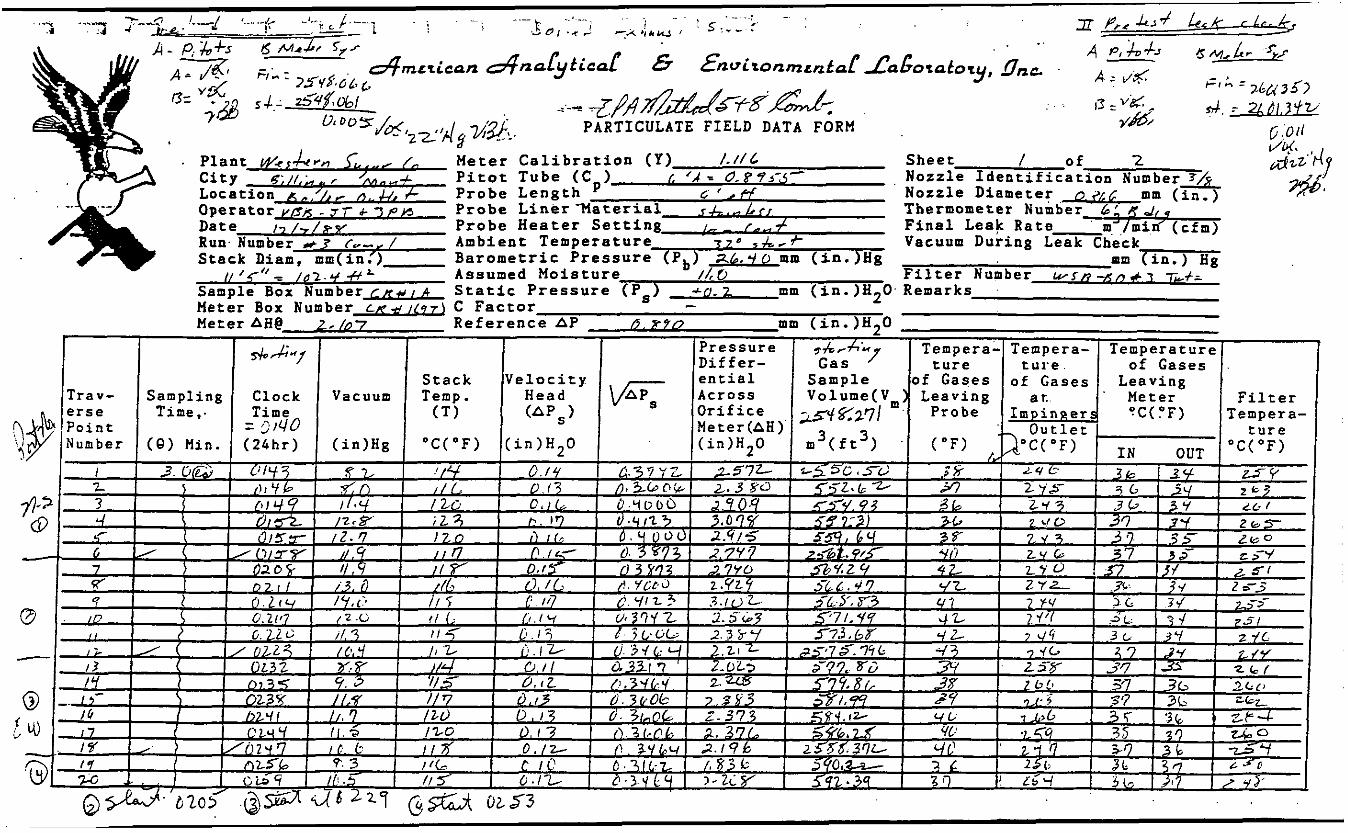
Table VI
FIELD ANI) LABORATORY DATA.
Plant or Job Description: Western Sugar - B i l l i n g s , YonLana
Boiler Exhaust Stack
RUN NO. c o m p l i a n c e 5 & 8
12-6-88 DATE
SYMBOL - m
'b
V
A H
m
'i
T
V ' W
c02
O2 K2t co
'n
-KT S T
C P
ps
AS
Tc
MgP
DESCRIPTION
volume dry gas sa~~pled @ meter conditions
barometric pressure
average pressure drop across the orifice meter
average gas meter temperature
meter coefficient
total H,>O collected, impingefs & silica gcl
nozzle dia.
stack temperature
velocity. head of stack gas
pitot tube coefficienr
static pressure
area stack
net time of test
Tocal particulates
UNTTS - 3 f t
"Hg abs
in H2°
OF
n i l
iz
iz
2
in.
"F
in H20
in H2°
2 ft.
min.
m6
-19-
3 - 2 - 1 - 56.883 52.325 52.666
2 6 - 2 3 56.22 26.40
7.576 2.516 2.493
53 .2 3 6 . 5 36.0
1 .116 1 . 1 1 6 1 .116
218.8 137 .8 1 5 9 . 1
5 .2 6 . 1 5.4
7 .2 7.3 7.2
87.6 1.6.7 87 .4
0.366 9.366 0.366
117.0 118.2 117 .3
0.3683 0.3698 0.3683
0.8955 0 .8955 0 .E955
26.245 26 .235 26.415 +0.2 t 0 . 2 +0.2
102.4 102 .4 102 .4
7 2 7 2 72
334.4 3 1 8 . 1 321.5
D A T A S U W Y .
Table VI1
Plant or Job kscription: Western Suqar - Billinss. Montana Boiler Exhaust Stack
12-6-88
1 - UNITS - DESCRl YTlOH
volume dry gus soapled @ sLandard condirions. dscf 57.234
volunie water vuyur collected @ stundilrd 10.299 conditions" rcf
proportion by volrunc of water vapor in gas stcam dimcnsionlcss
0.1525
29.12 l b / l b
dry molecular ucighi maole
l b / l b , we1 molecular w i g l i t mile 2.742
25.247 stack gas velocity
2 -_
54.398
8.840
0.1398
29.2!J6
27.717
25.245
3 - 55.184
7.489
0.1195
29.152
27.819
24.991
volumetric f l o u riltc 6.331331332 6.40991965 6.54993278 dry basis, standard conditions. It3/hr X l o 6 x IO6 x 106
isokinetic vzriittion I 106.27 99.76 99.05
conc. purriculatc muLtcr 1.28806898 1 .28916258 1 .28438361 in s u c k BUS. d r y b a s i s lb/scf
x LO-^ x ruiusion ruLc lb/lir 81.55 82 .63 84.13
gr/ducf 0.0902 0.0902. 0.0899 =s03.& HZ s04 lbs/dscf 0 0 0
c s 0 2 emission rate lb/dscf 7.2702X10⁻⁶ 7 .81_09X10-6 9.0802Xi.8 0.137/70.1 0.150/65.2 0.178/63.7
-20- S02/106 Btu's/% efficiency
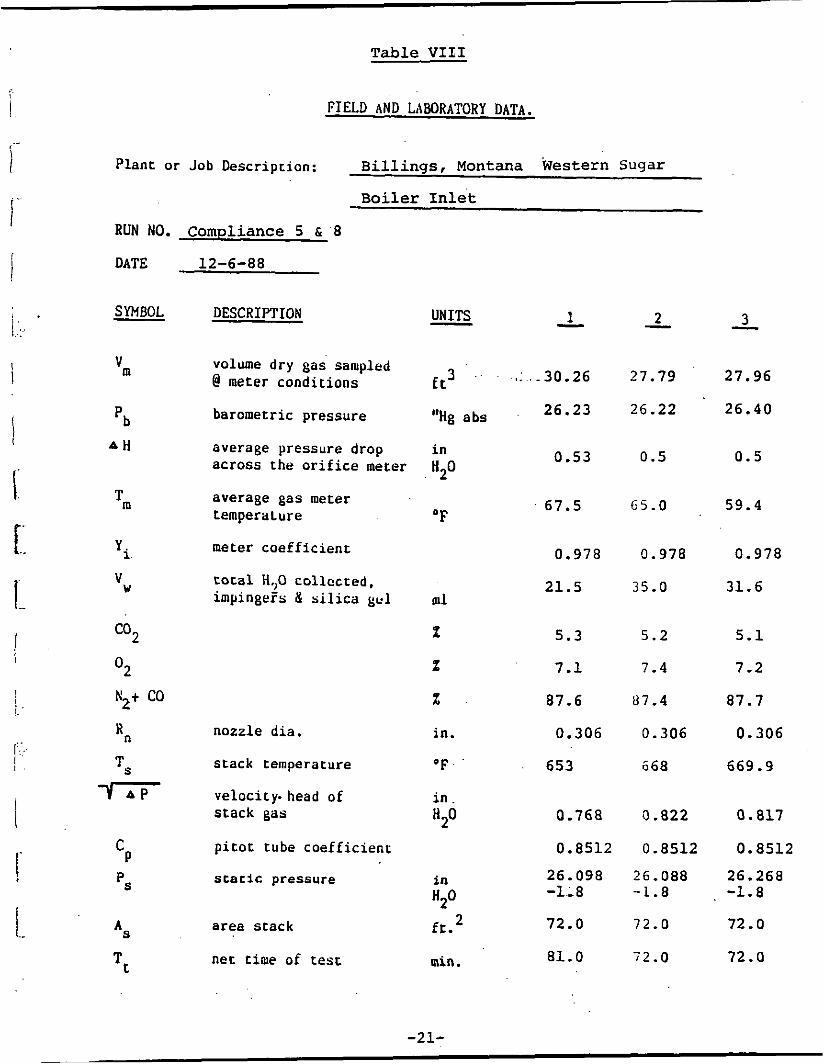
Table VI11
I , FIELD A N D LABORATORY DATA.
- i Plant or Job Description: Billings, Montana Western Sugar
Boiler Inlet
RUN NO. Compliance 5 & 8 i i DATE 12-6-88
UNITS - 3 - 2 - 1 I
SYMBOL DESCRIPTION
m V 27.96
volume dry gas sampled -30.26 27.79 @ meter conditions f t 3
'b barometric pressure
average pressure drop across the orifice meter
average gas meter temperaLure
meter coefficient
total H,)O collccted. impingefs 8 silica ge l
"Hg abs
in
26.23 26.22 26.40
0.5
59.4
A H 0.5 0.53
T m 67.5 65.0 O F
'i
W v
0.978
21.5
0.978
35.0
0.978
31.6 m i
c02
O2 t$t co
n I?
T S
T
x x
5.3
7.1
87.6
0.306
5.2
7.4
87.4
0.306
a i a
5.1
7.2
87.7
0.306
669.9
z in.
O F
nozzle dia.
stack temperature
velocity. head of stack gas
pitot tube coefficient
653
in. 0.768
0.8512
26.098 -1.i8
72.0
81.0
0.822
0.8512
26.088 -1.8
72.0
72.0
0.817
0.8512
26.268 . -1.8
72.0
72.0
P C
scacic pressure i n
"2O 2 f c . area stack
net time o f test Tt min .
-21-
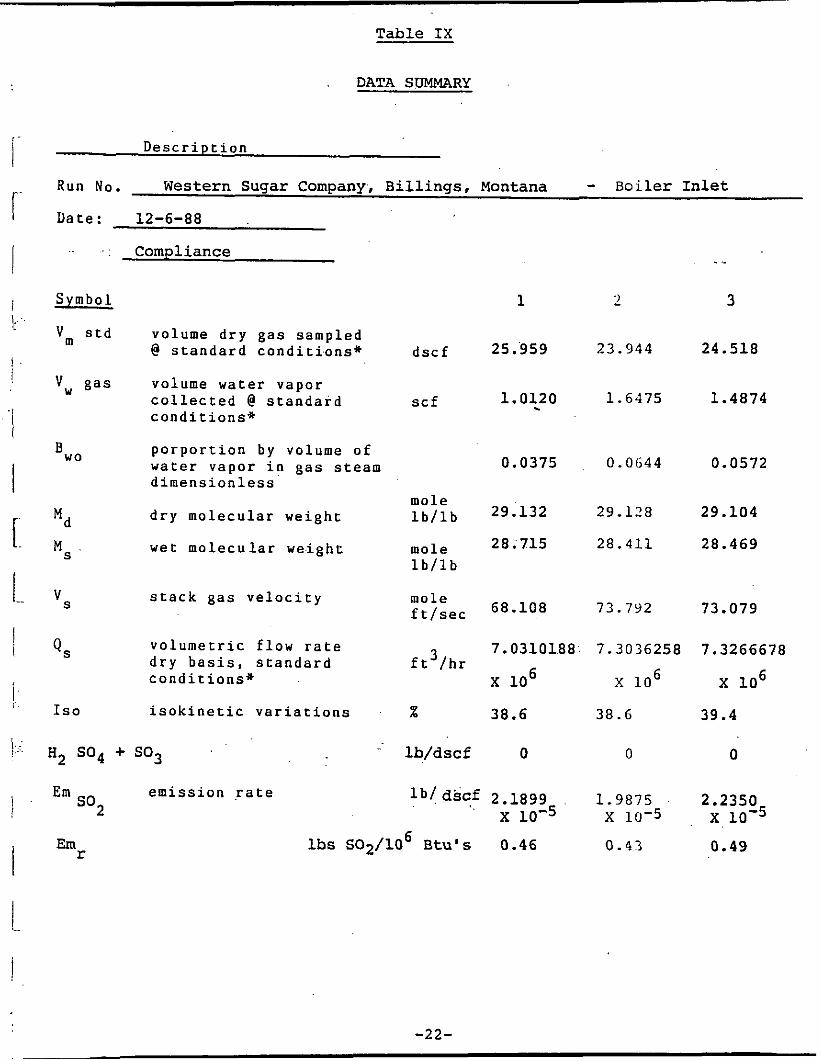
Table IX
r- I i I..
! !
, '1 I I i.. I i
!: ,
!::;
I !
I I- !
DATA SUMMARY
Description
Run NO. Western Sugar Company., Billings, Montana - Boiler Inlet
Date: 12-6-88
_ _ - . Compliance
Symbol 1 2 3
V m std
V" gas volume water vapor
volume dry gas sampled @ standard conditi.ons* dscf 25.959 23.944 24.518
1.0120 1.6475 1.4874 collected @ standard scf - conditions*
porportion by volume of water vapor in gas steam wo B
0.0375 0.0644 0.0572 dimensionless
dry molecular weight lb/lb 29.132 29.118 29 .lo4
wet molecular weight mole 28.715 28.411 28.469
mole Md M S
lb/lb
S V stack gas velocity
68.108 73.792 73.079 mole ftlsec
volumetric flow rate 7.0310188. 7.3036258 7.3266678 dry basis, standard ft3/hr
QS
Is0 isokinetic variations ,% 38.6 38.6 39.4
conditions* x lo6 x lo6 x lo6
H2 SO4 + SO3 - lb/dscf 0 0 0
lb / dscf 2.1899 1.9875 2.2350 Em emission rate
s02 x 10-5 x 10-5 x 10-5 lbs SO2/lO6 Btu's 0.46 0.43 0.49 r Em
-22-
I I I
~ .... I:. t:
, I ' I I f t I i ! I
kri \
I I
I. I i .. ..
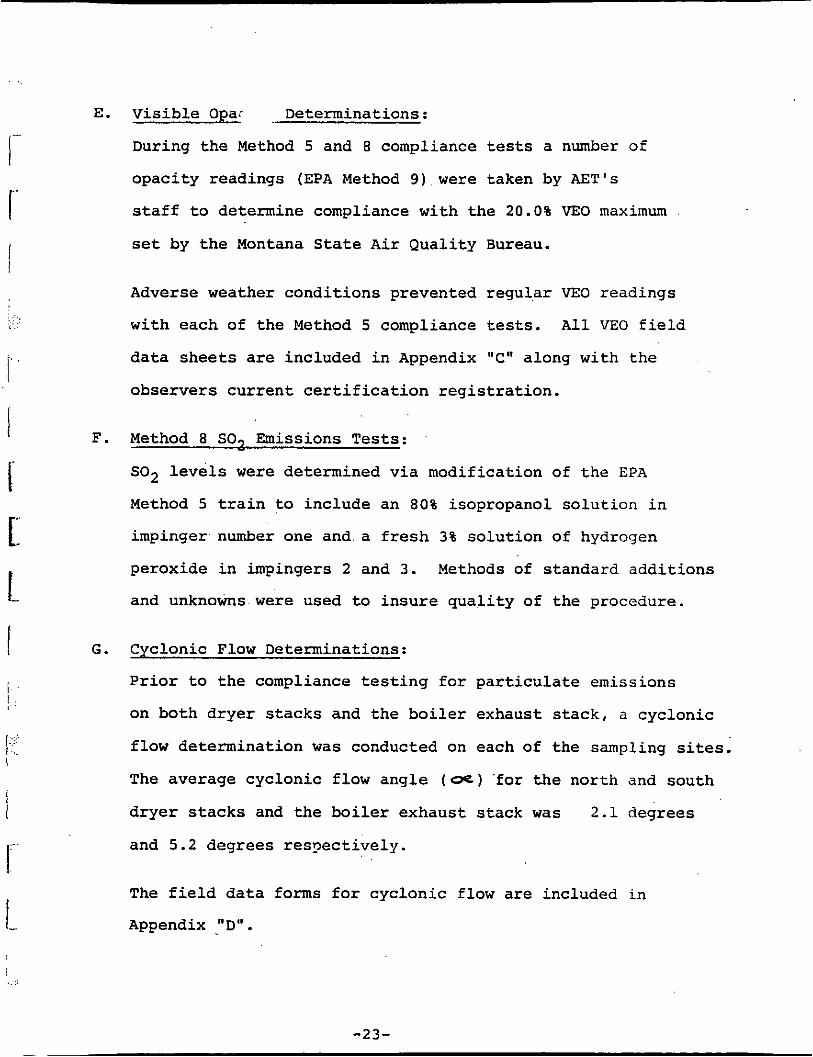
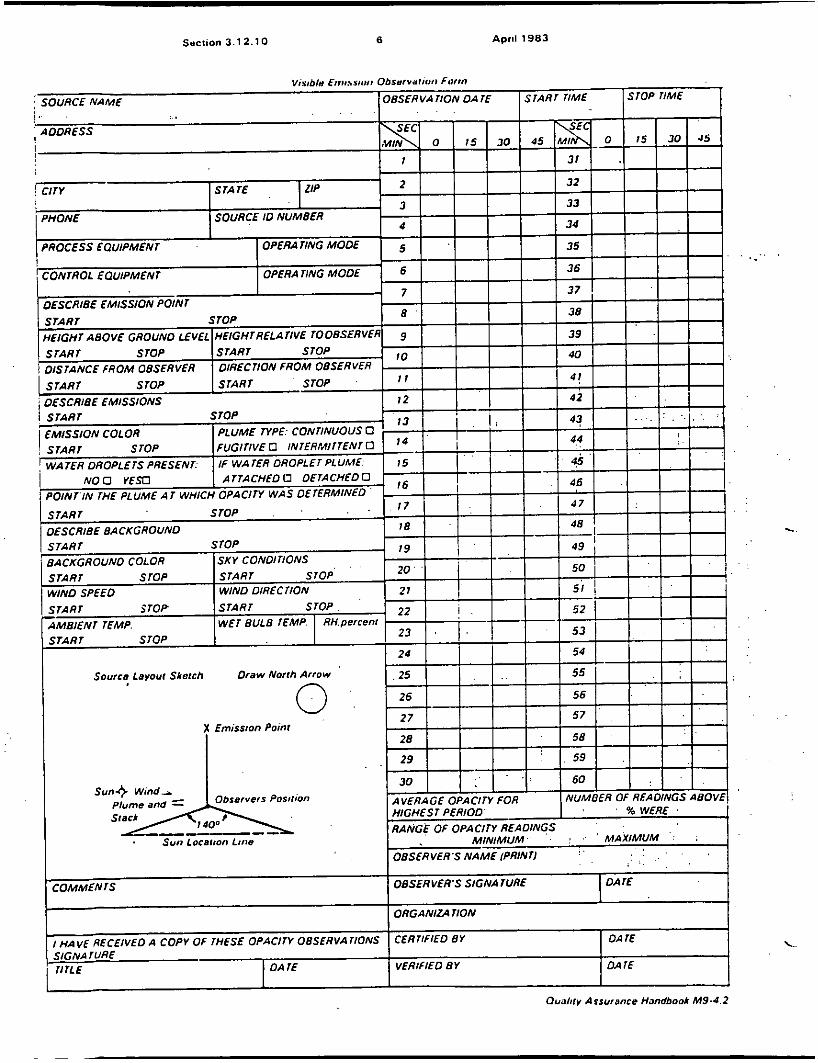
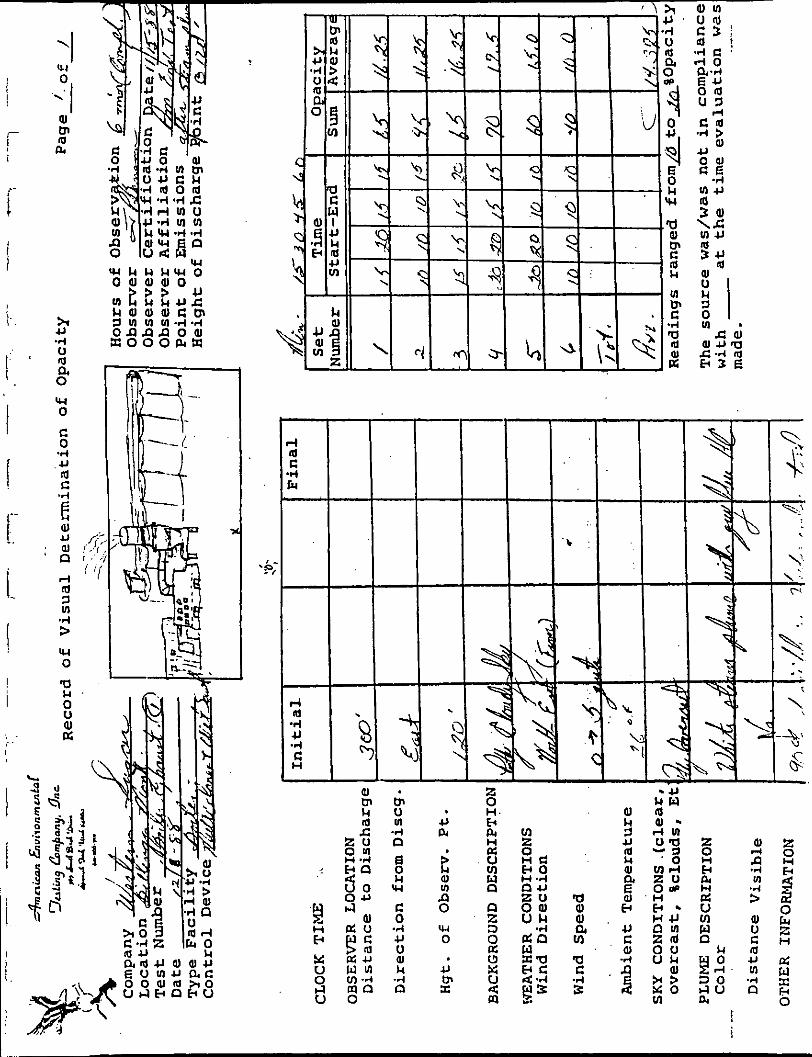
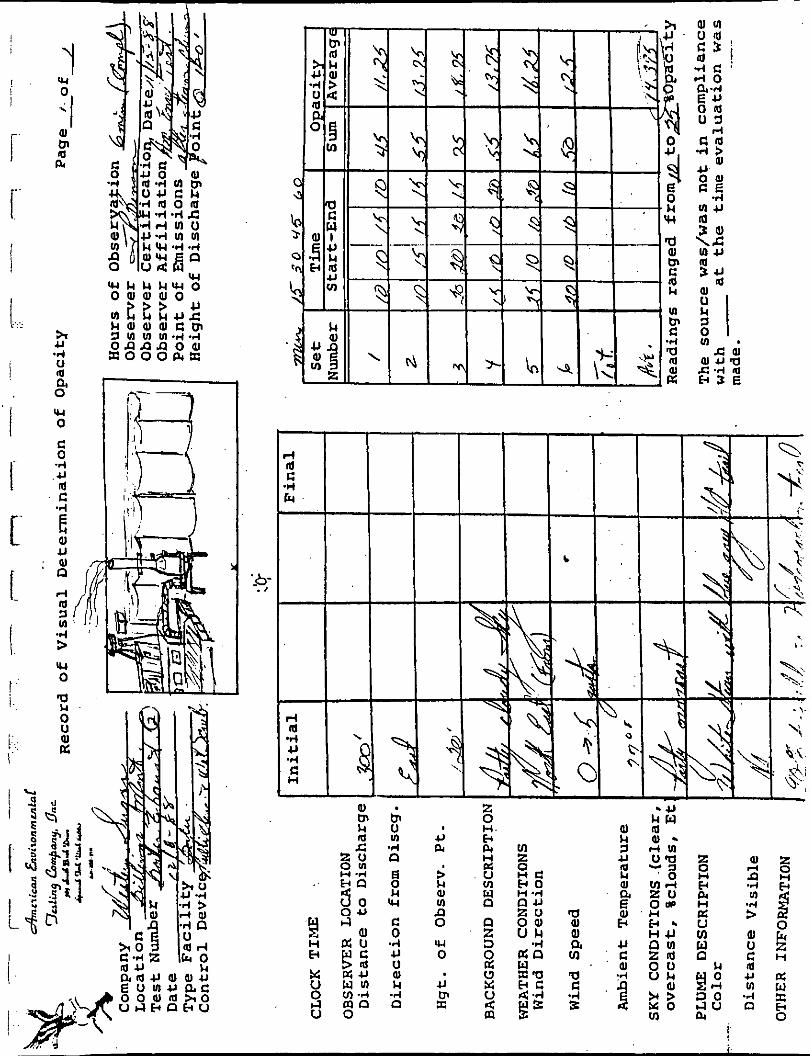
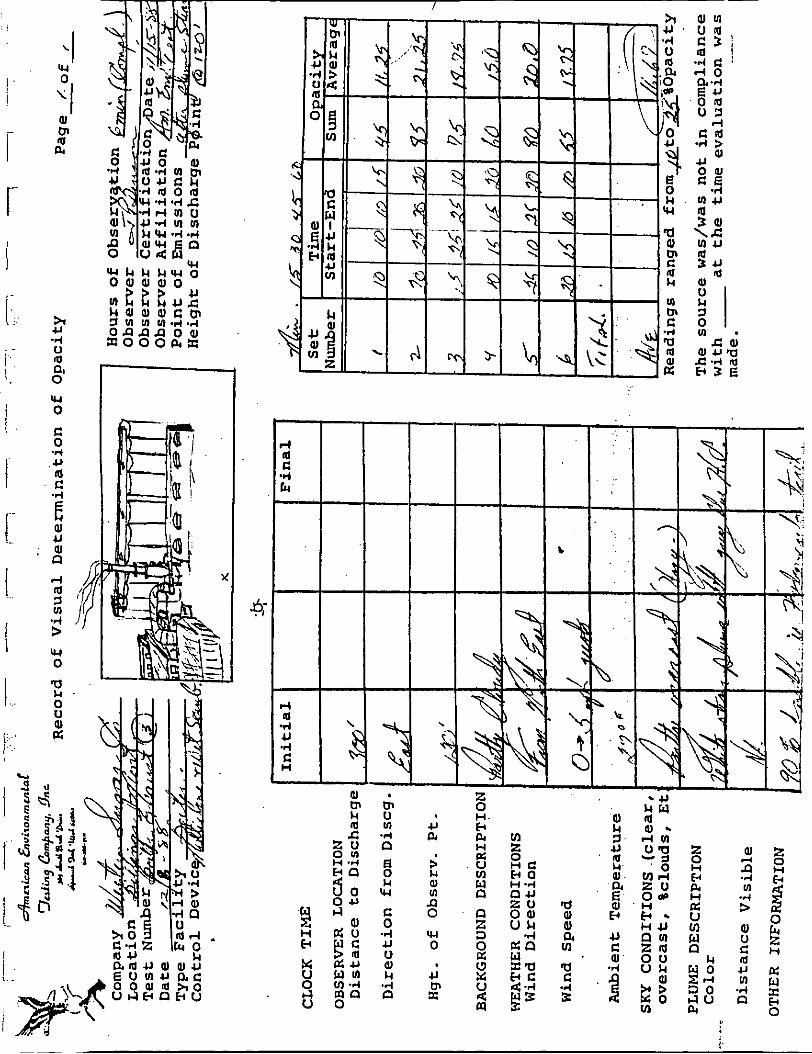
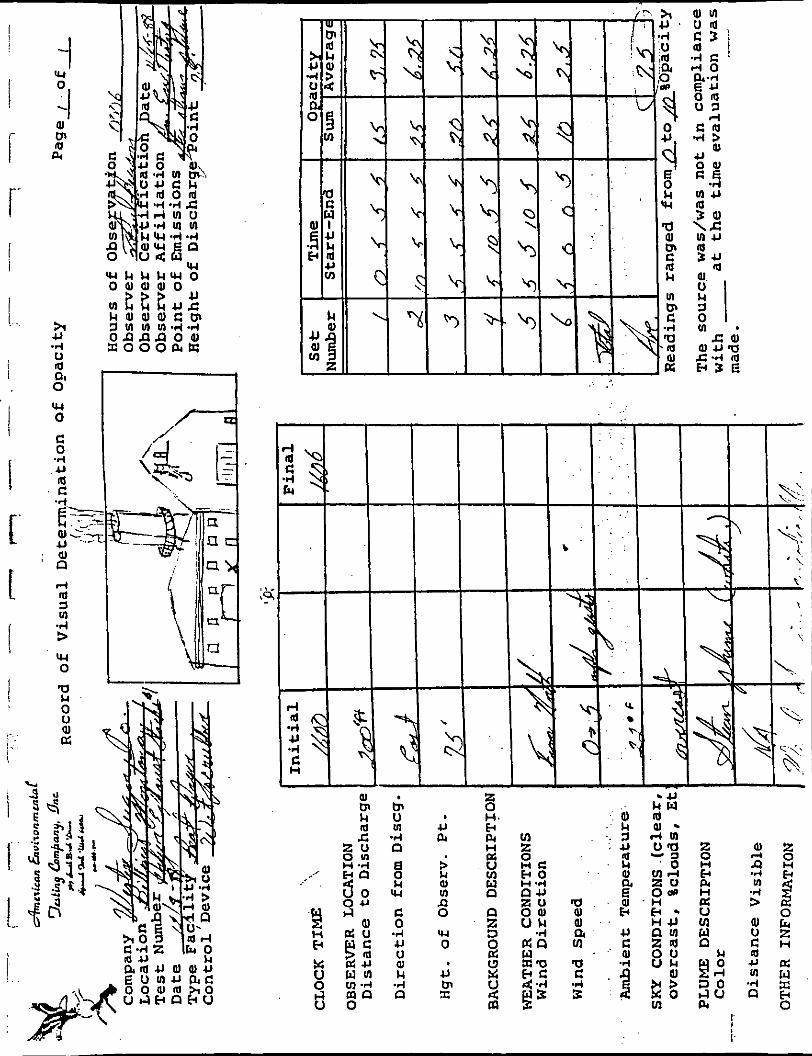
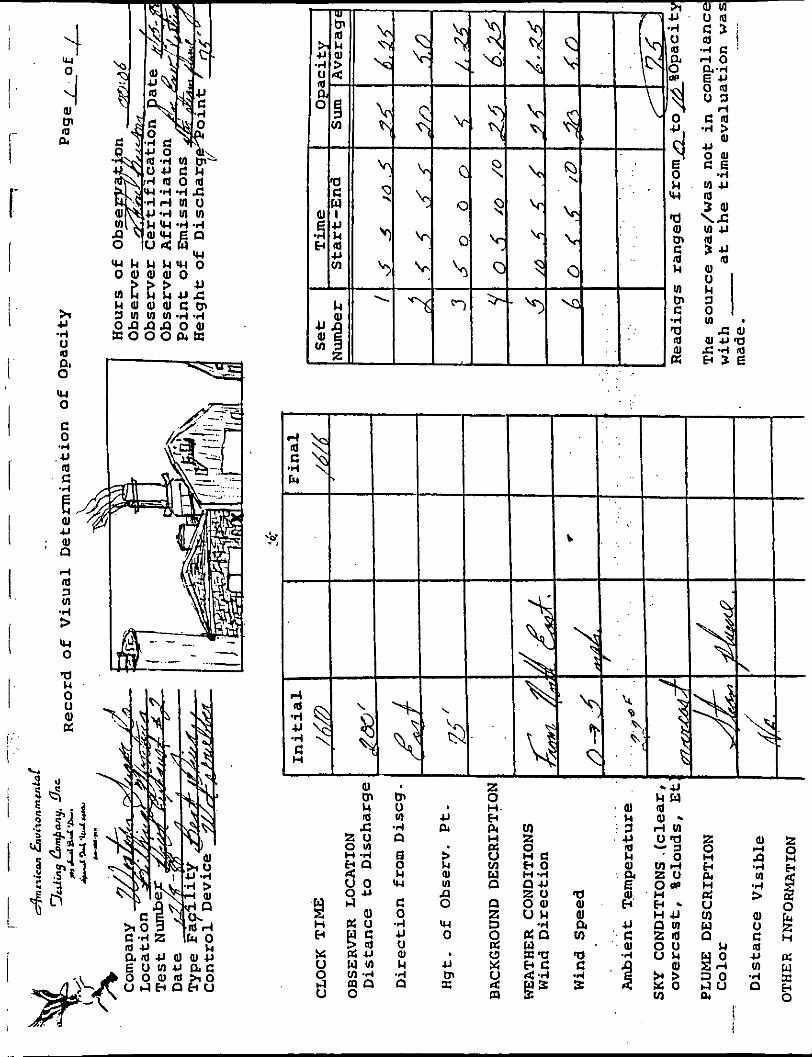
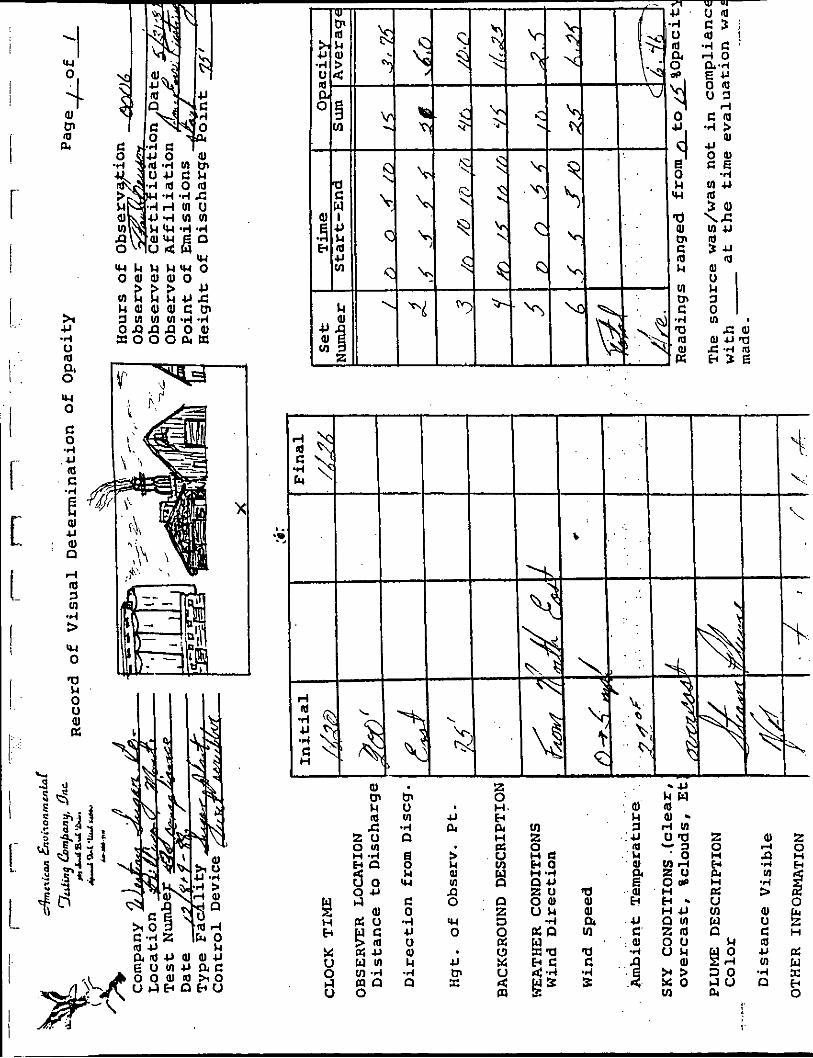
E. Visible Opar Determinations:
During the Method 5 and 8 compliance tests a number of
opacity readings (EPA Method 9) were taken by E T ' S
staff to determine compliance with the 20.0% VEO maximum
set by the Montana State Air Quality Bureau.
Adverse weather conditions prevented regular VEO readings
with each of the Method 5 compliance tests. All VEO field
data sheets are included in Appendix "C" along with the
observers current certification registration.
F. Method 8 SO, Emissions Tests: - SO2 levels were determined via modification of the EPA
Method 5 train to include an 80% isopropanol solution in
impinger number one and a fresh 3% solution of hydrogen
peroxide in impingers 2 and 3 . Methods of standard additions
and unknowns were used to insure quality of the procedure.
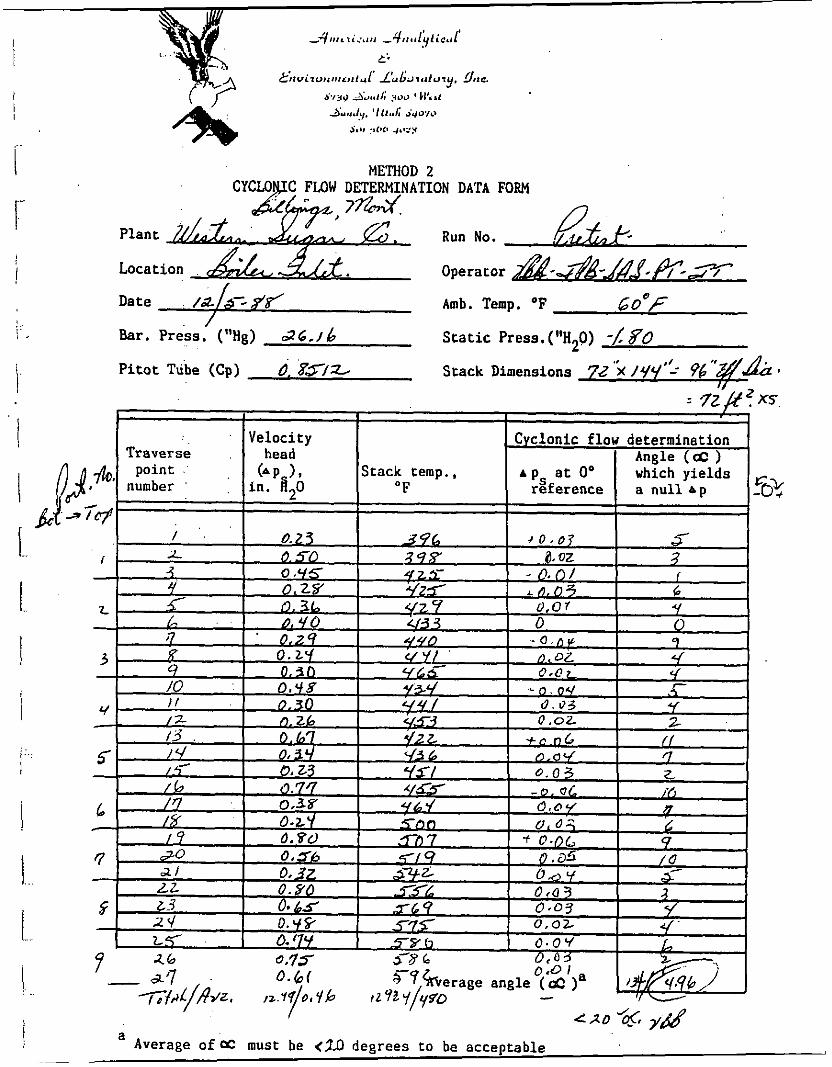
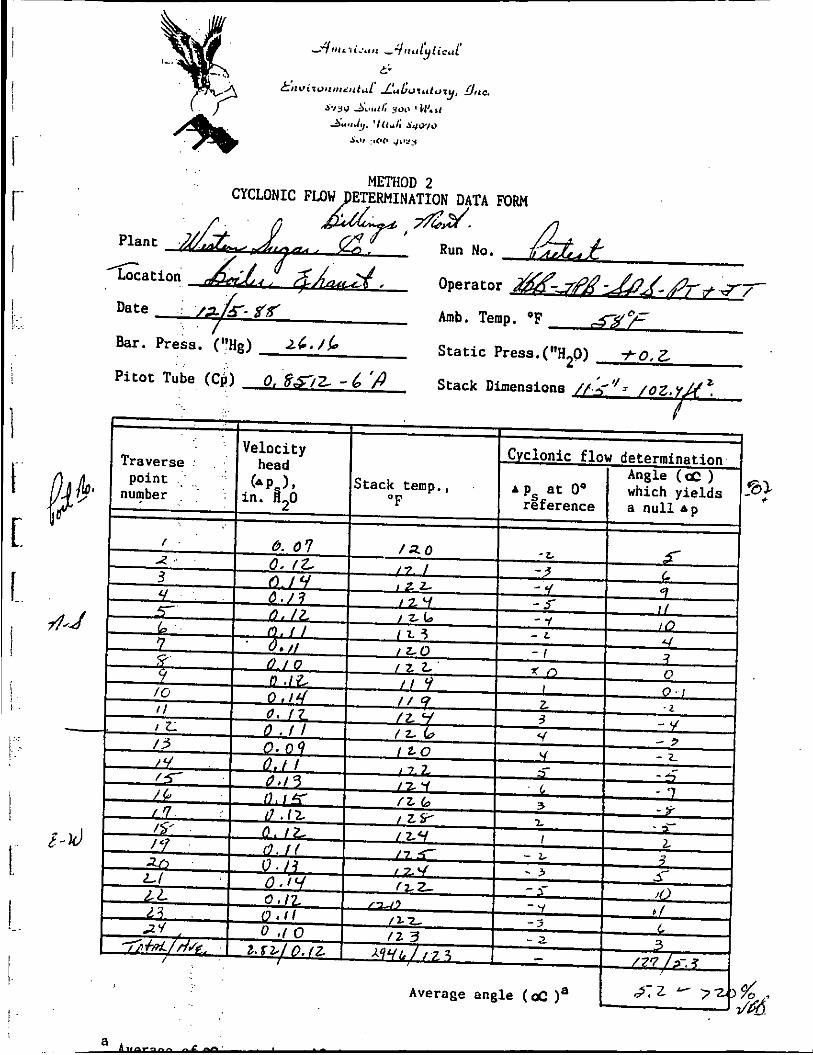
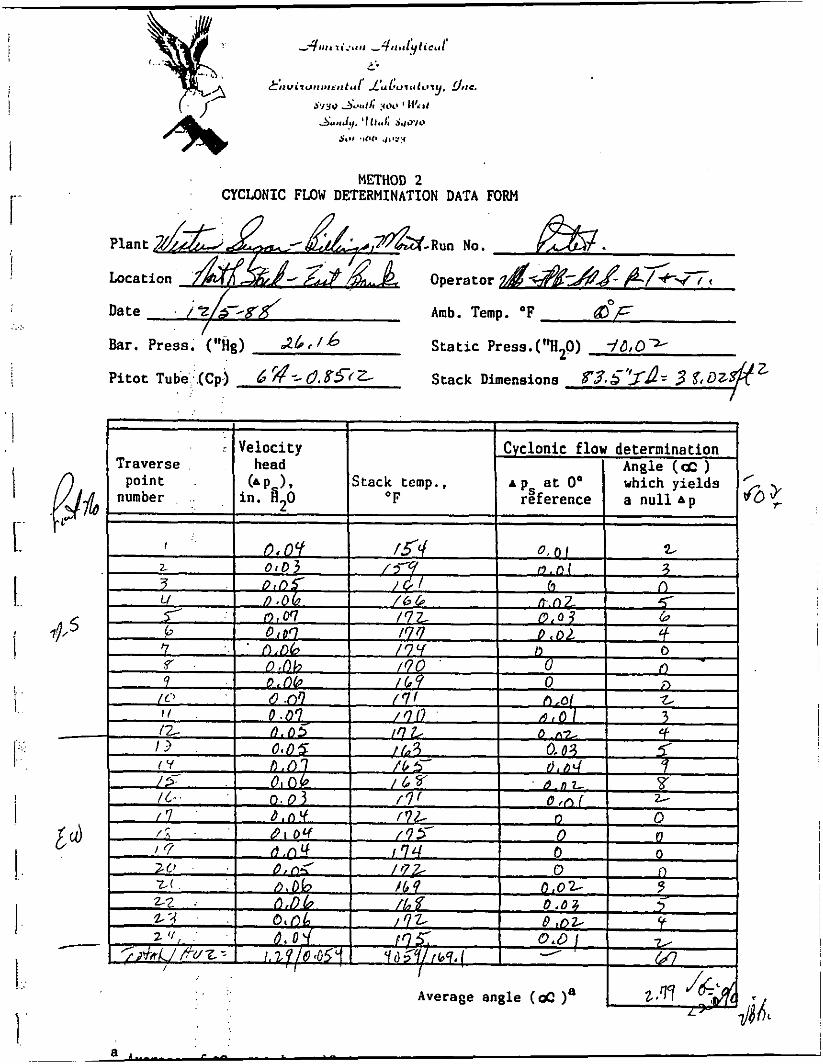
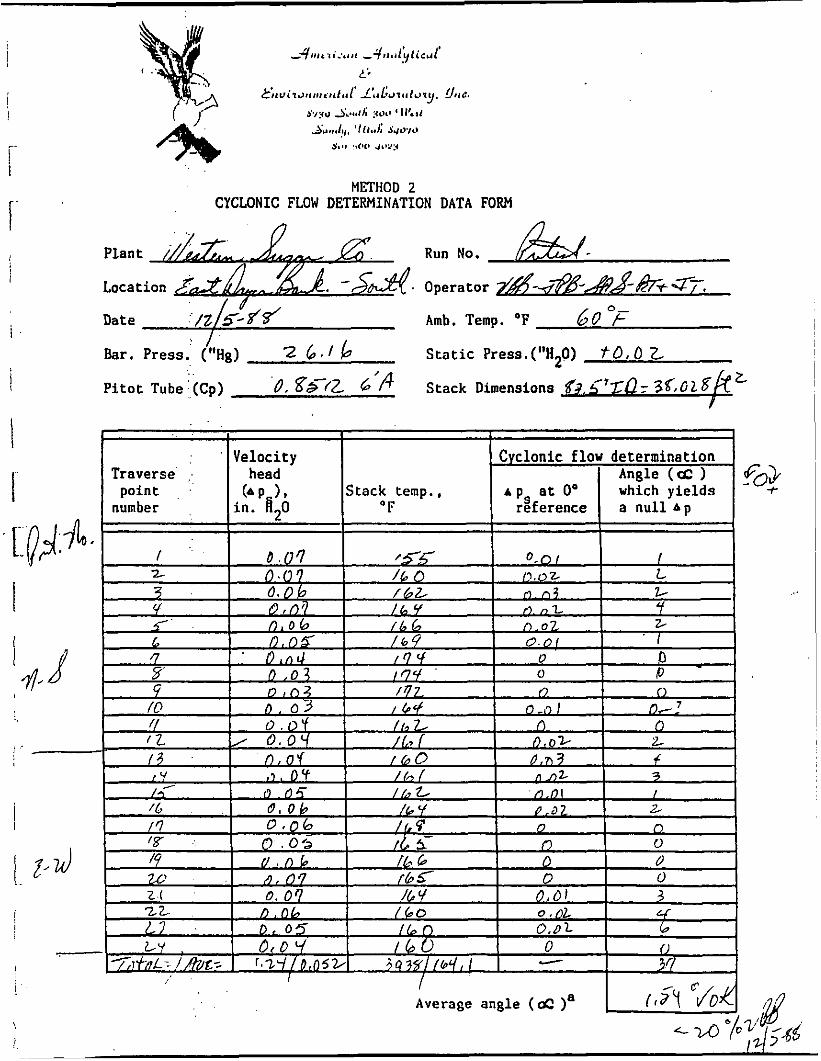
G. Cyclonic Flow Determinations:
Prior to the compliance testing for particulate emissions
on both dryer stacks and the boiler exhaust stack, a cyclonic
flow determination was conducted on each of the sampling sites.
The average cyclonic flow angle ( O e ) 'for the north and south
dryer stacks and the boiler exhaust stack was 2 . 1 degrees
and 5.2 degrees respectively.
The field data forms for cyclonic flow are included in
Appendix "D" .
-23-
i
i
APPENDIX "A"
( C a l i b r a t i o n Data)
<:..:
I
cl, ( 2 ) = c P ( S L d ) 7/"- :;I I1
0.01)
565 SouLh Birch or.
5tu i i i s I i I'ock, Utah 04660
8 0 1/ 2 6 6 -7 1.1 1 . . '
I-
I
. . '.
: ..:. .. - 1.:
i . ..
5. A I Ref erence
Point Number
I
Thermocouple '0 ten tionieter Ten1 erature
EC
3 3
I Q Y
L3b 31 0
Y YL
I y s b t
.. Tempera tureb difference .
B
'Type oE calibration Yystcm used. b r
Spanish Fork, Utah 8 4 6 6 0
8 0 l/ 2 6 6 -7 &l$
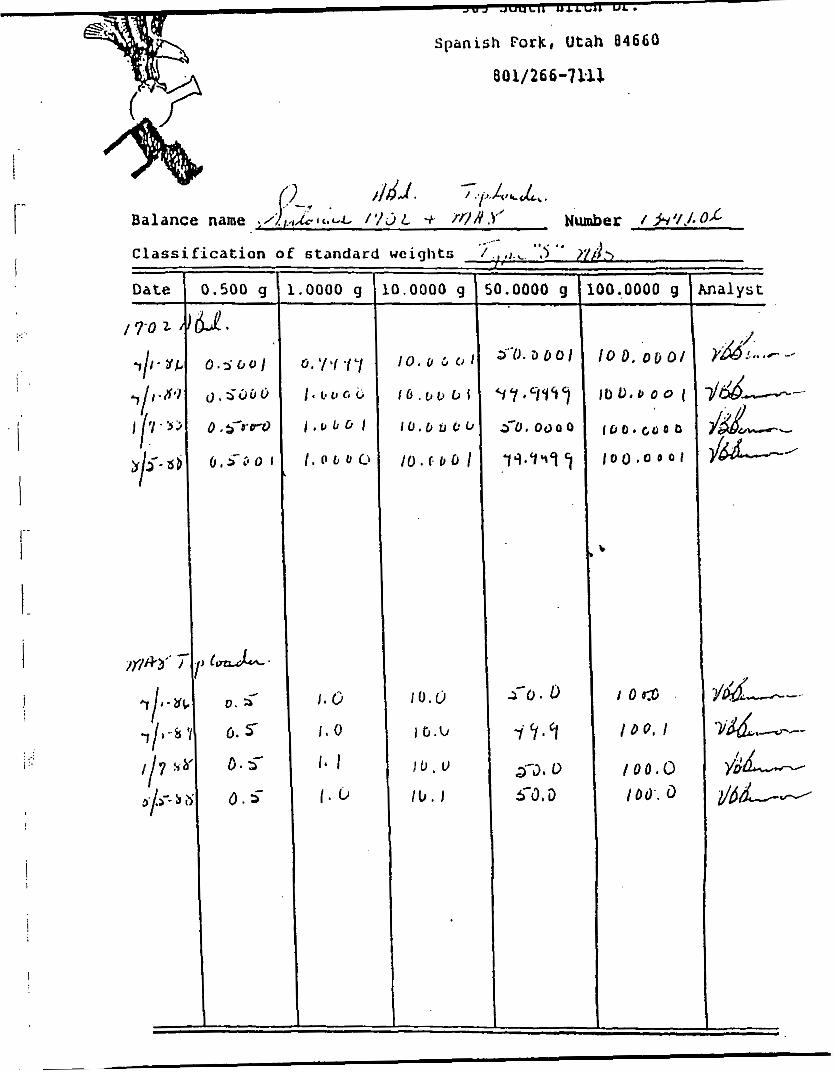
C l a s s i f i c a t i o n o f standard weights - i
:.: .
, .
‘ i I 1 . I. I i ’,
. . ,.. , _ i :.
!
1
~
I
.oooo g
REFERENCE:
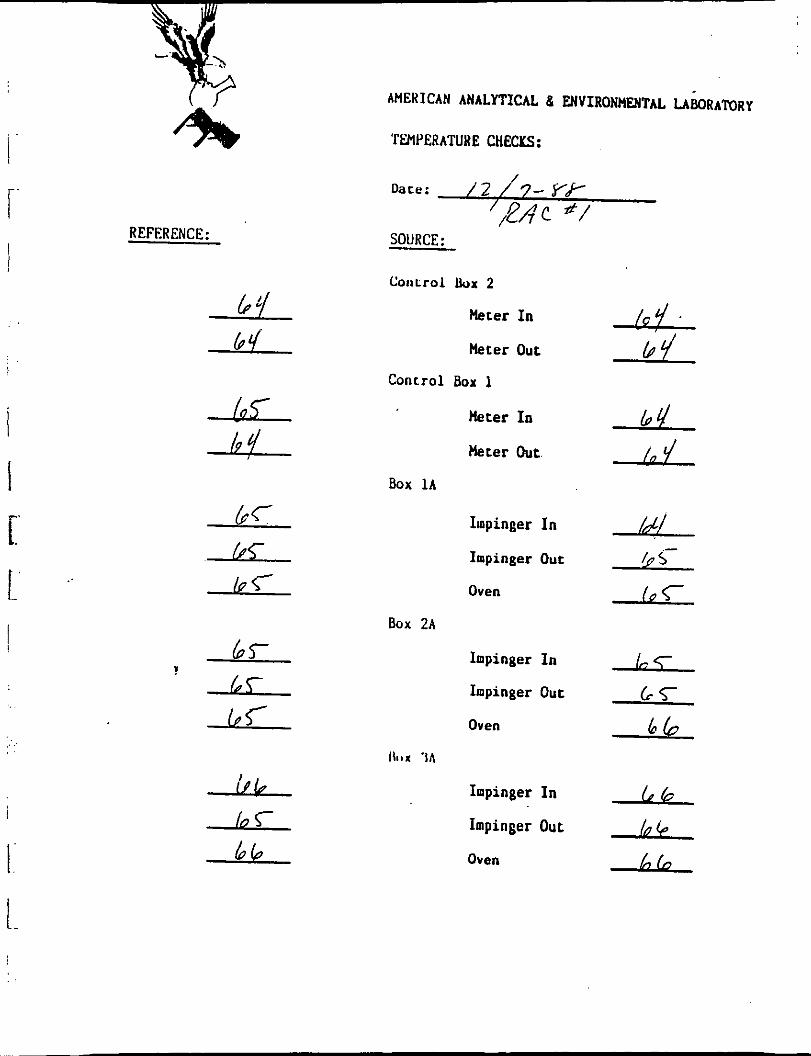
AMERICAN ANALYTICAL a ENVIRONMENTAL LABORATORY
TUPERATURE CHECKS:
/ Dare: / 2 / 7 - FP
'2AC / SOURCE:
CoiiLrol h x 2
Meter In
Meter Out
Conrrol Box 1
Heter In
Heter Out
Box 1A
Box 2A
Iapinger In
Impinger Out
Oven
Impinger In
Impinger Out
Oven
Iapinger In
Impinger Out
Oven
I
,:.
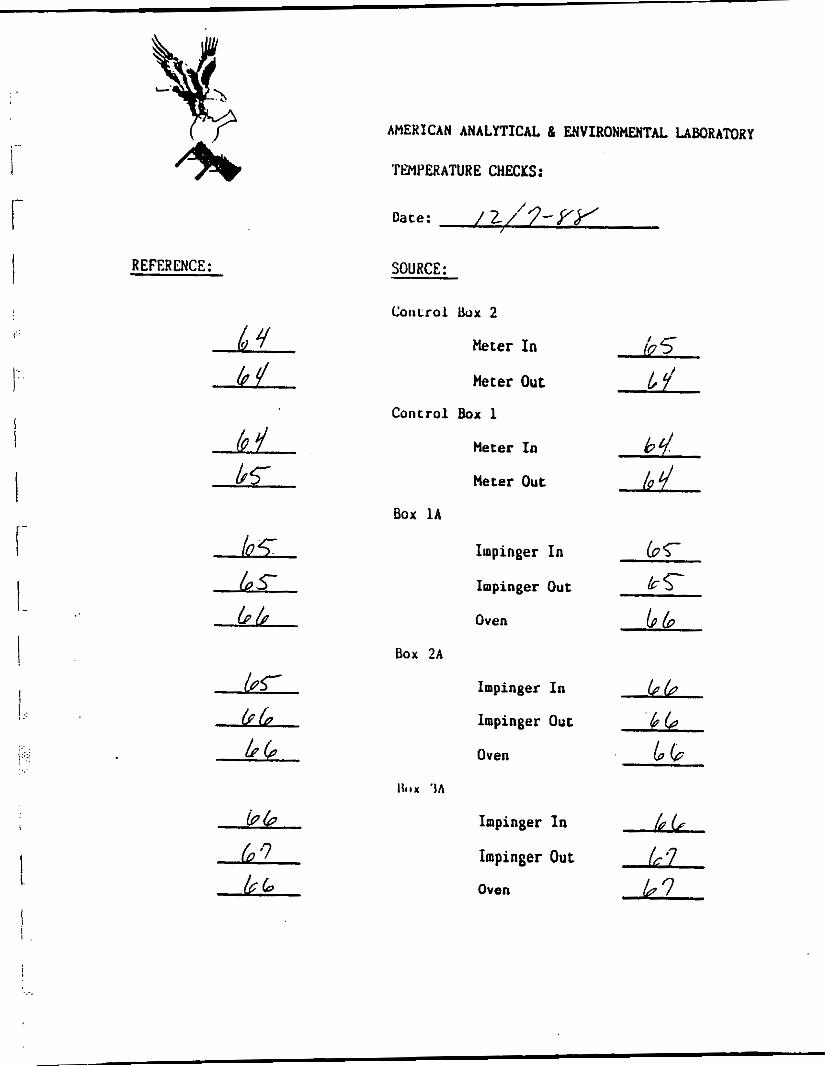
REFERENCE:
L k r
AMEHICAN ANALYTICAL 8 ENVIRONMENTAL LABORATORY
TMPEHATUWE CHECKS:
Dace: / 2/ '?-'KY
SOURCE:
CoiiLrol Uox 2
Meter In
Meter Out
Control Box 1
Meter In
Meter Out
Ilnpinger In
Impinger Out
Oven
Impinger In
Impinger Out
Oven
Impinger In
Impinger Out
Oven
6b
\ - I
i I:.:: ,. . ..
I i
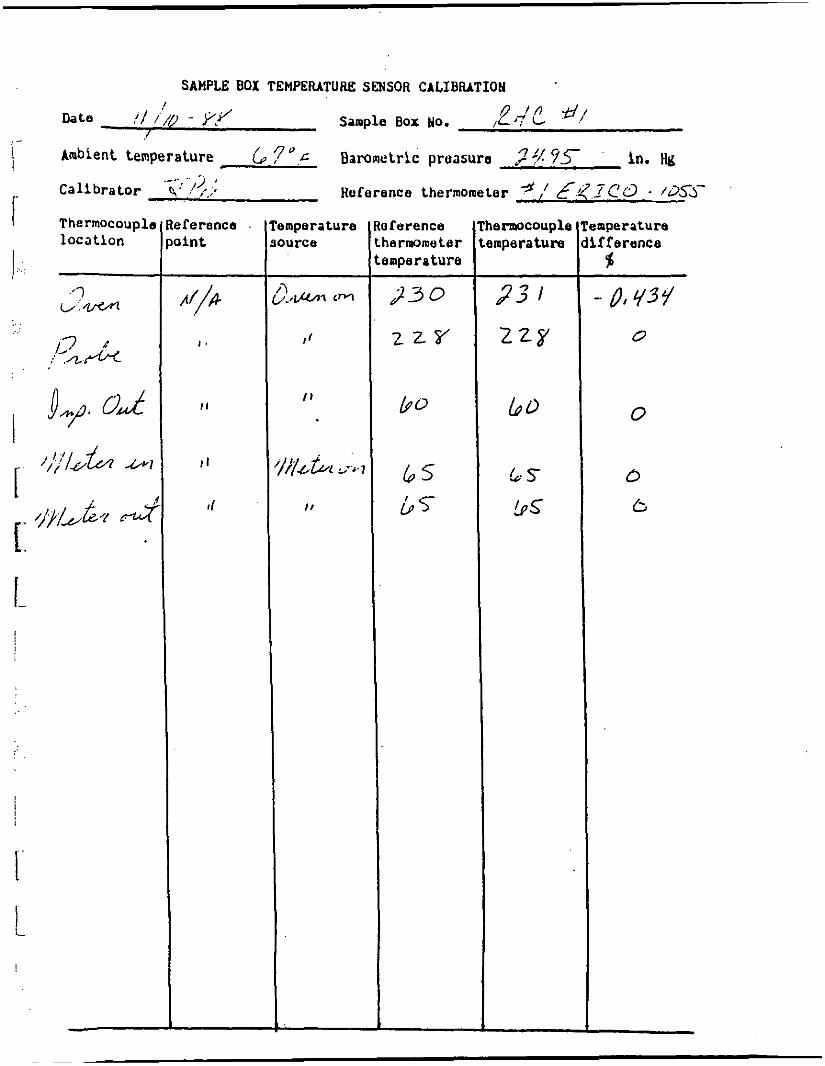
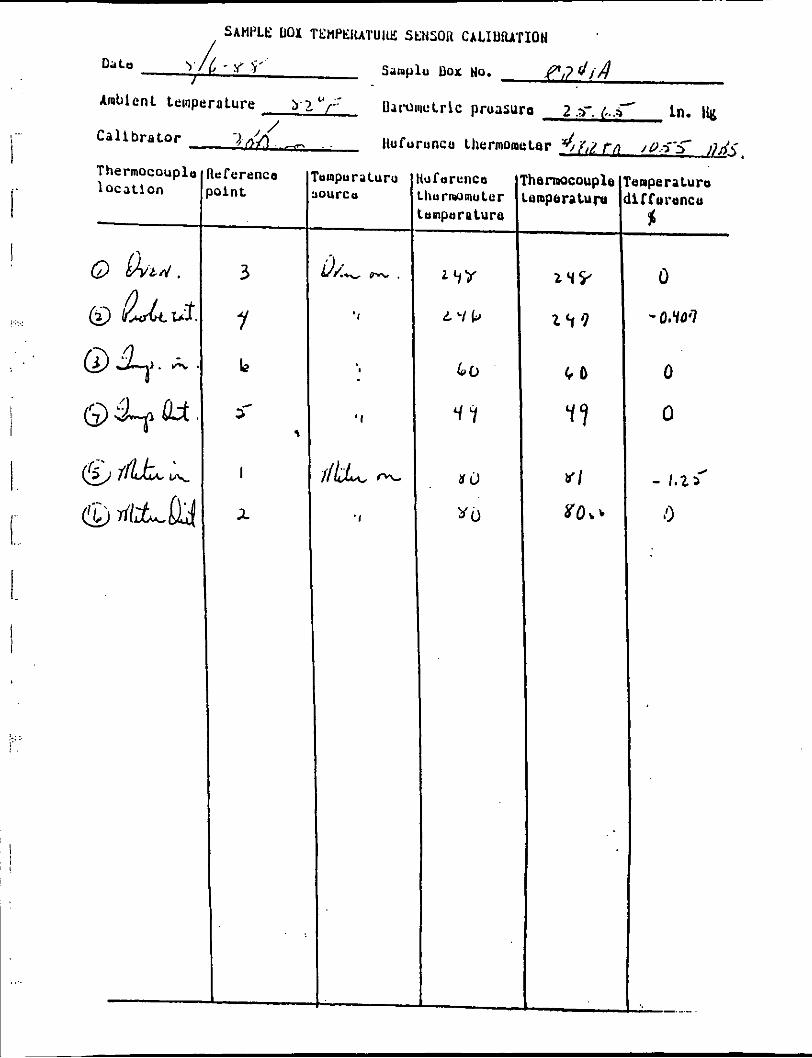
SAMPLE BOX TEMPERATURE SENSOR CALIBRATION I
Date I / i/o - J+' Sample Box No. ,&fy d/
Ambient tempera ture i ?'.c Barometric pruasura .- '7 :/* / I 7-y I
in. ..
Calibrator \',:'<,;; Reference thermometer -if/ &< .- . / ~ c d -
Thermocouple locatLon
iference l int
mperature iurce
iference ie rwme ter imperature
emcouple mperature
mperature if feronce
%
- 0'43L/ D
0 b
i --
I
i. I
!.::.:
I
i
I. II I. I I
I . . r , .
I I
' '. ~
.. .
Thermocouplp 1 o c a t l o n
:Terence l i n t
-
3
Y b
3- 1
I
3-
'ompura ourcu
' I
emcouple mprc ra turn
C D
7 9
0
- 0,voq
0
0
/ - 1.2a
0
nUI'Elt LOX C A L l B i N l ' I O N DATA AND CALCULATION FORM
(English u n i t s )
a I f t h t r c i s only one cliermoiutccr 00 rhc d r y gas mctcrI KCCQrd &he Ccmpcracuce under td.
Quality Assurance Handbook MS-i . 3 ~ (front sid6)
rn . . urn . L w Y L
u o
r*'
L al Y
2 u1 m m x C. 7)
al c LI
Lw 0
u1 m m e, al rl C 'rl
al c U
u4 ' 0
al
U Y U 0
r; .
0 0
Y
P E m
r) P
Y
VI 0 al
C. al >
al c Y
h
m m
m
n P al C .rl
Y m
- n L O
.. 0) C
I.
PI al c Y
rl rl
3 h h 0
Lw c U h
a l u
0 * V I m h M al u x P I C . E r r
a
m ;
m a l
h 2
o u u u u u I.
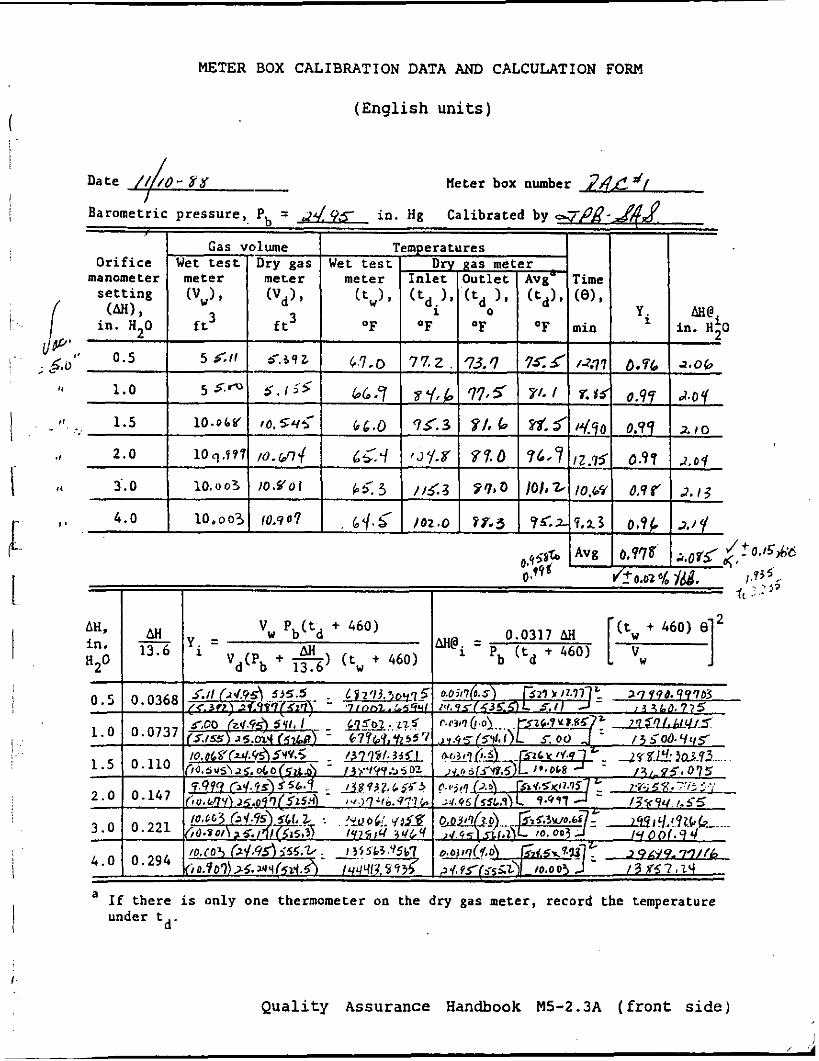
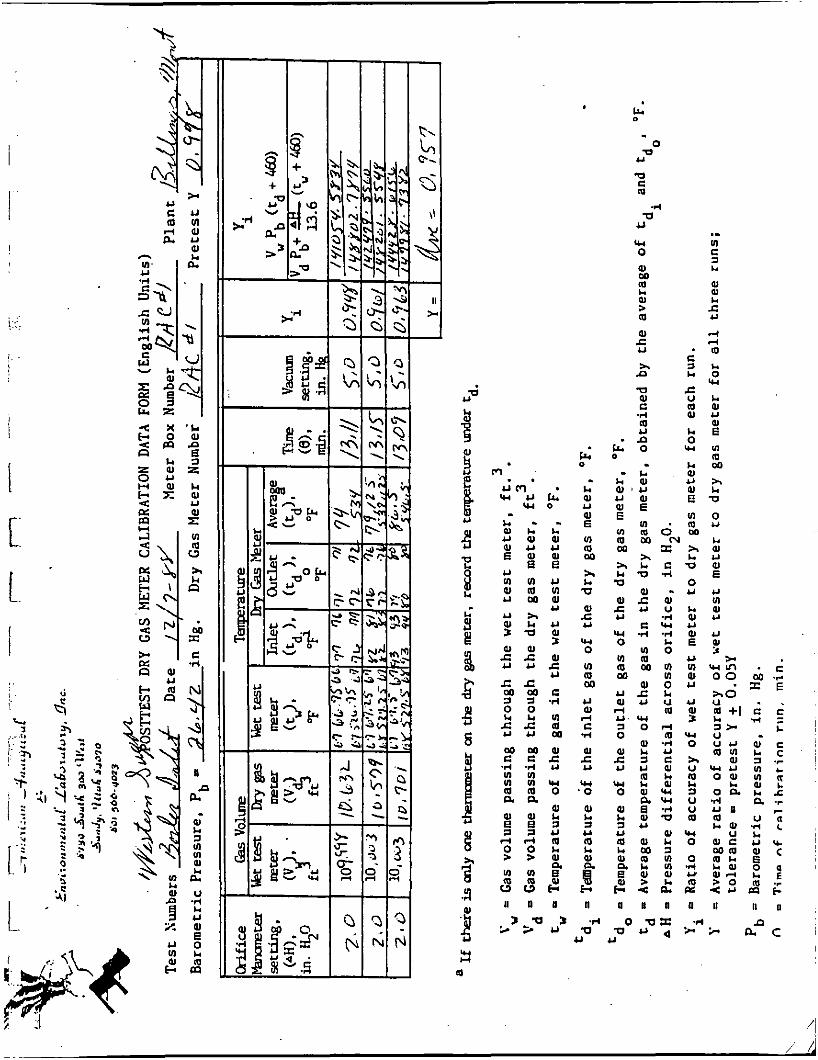
METER BOX CALIBRATION DATA AND CALCULATION FORM
- An 13.6
"2O I
(English uni ts ) (
Vw Pb(td + 4 6 0 ) 0.0317 AH [ (t;: 460) "1' An a@i = Pb ( td + 460) Y. =
1 v,j(pb ' 13.6) ( tv + 460)
i I f there i s only one thermometer on the dry gas meter, record the temperature under t
a
d '
I
Quality Assurance Handbook MS-2.3A (front side)
Y- a
la D .
0 Q
Y
Q C m
.r( P ... 4 J
W m 0 5 - al I. 00 m al * al al * > c m U
r.4 0 - * al Y al E VI m OD
x I4 Q
al c Y
W 0 0
OD
U al rl C * 0 e Y
VI ' 0
m
2! a U m I4 al n
8 II
i
!' &+I- 6.0) r66-71ri
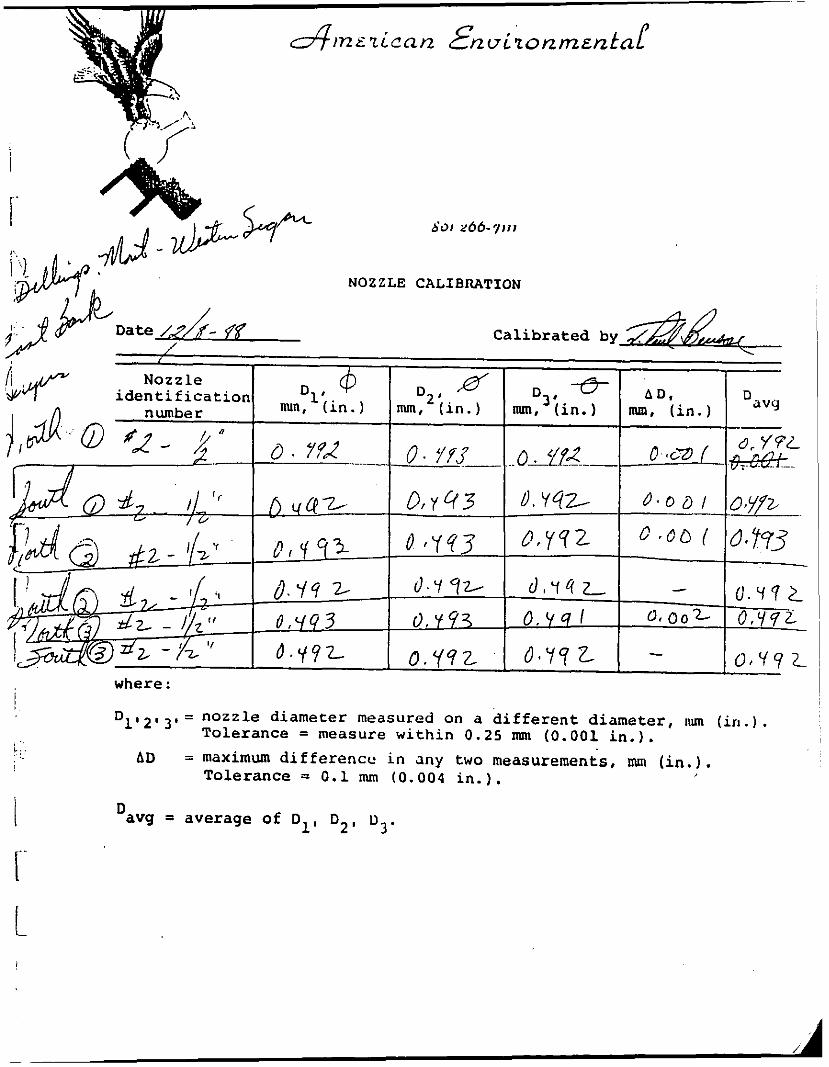
NOZZLE CALIBMTION
C a l i b r a t e d by + Nozzle
number ' w .1"" i d e n t i f i c a t i o l
__ A
where :
j nun, ( i n . ) nun. ( i n . ) I .~
u . r 4 L
I
i:. !
i I" t
D1,2, 3 , = nozzle diameter measured on a d i f f e r e n t d iameter , nun ( i n . ) . To lerance = measure w i t h i n 0 . 2 5 mm ( 0 . 0 0 1 i n . ) .
AD = maximum d i f f e r e n c e i n any two measurements, mm ( i n . ) . To lerance = 0 . 1 mm ( 0 . 0 0 4 i n . ) .
Davg = average of D 1, D2m u3*
!
i I
1 .:. I ..
! - I
I I
I I
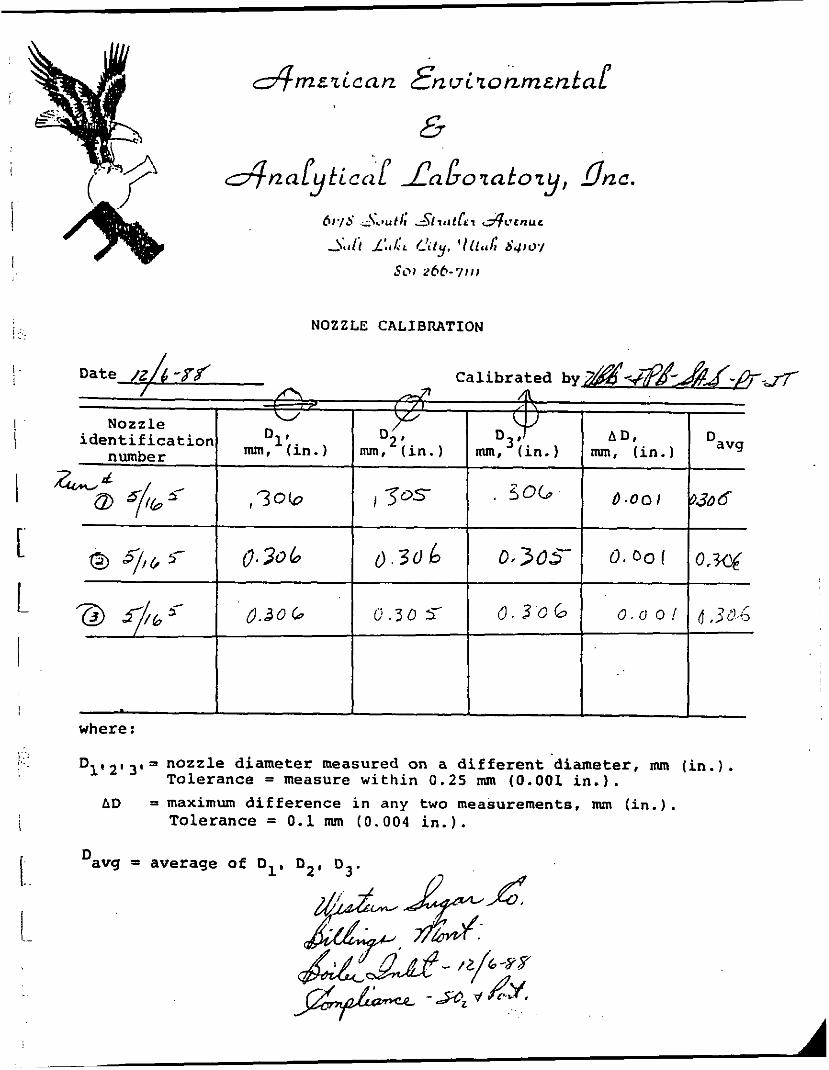
NOZZLE CALIBRATION
where :
Dl,2,3,= nozzle diameter measured on a different diameter, mm (in.). I Tolerance = measure within 0.25 mm (0.001 in.).
AD = m a x i m u m difference in any two measurements, nun (in.). Tolerance = 0.1 nun (0.004 in.). I
j
I' i j
i,
1.:.
. .
I
I I I t I. . .
. . .. . . ,
I
I ~'
I_
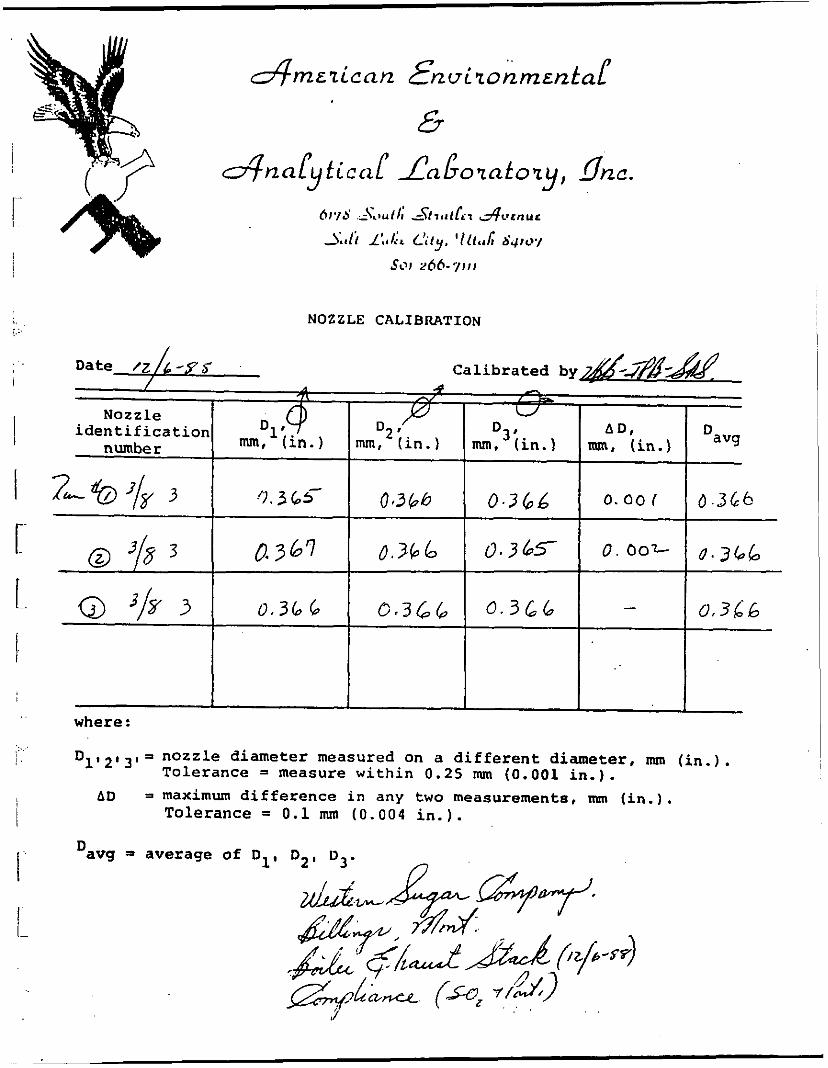
NOZZLE CALIBRATION
Date 6 -9s C a l i b r a t e d by&zH-&
Nozz le I I
number
n 4
i d e n t i f i c a t i o n
where :
= n o z z l e d iameter measured on a d i f f e r e n t d iameter , mm ( i n . ) . D 1 ' 2 ' 3 ' To lerance = measure w i t h i n 0 . 2 5 nun (0 .001 i n . ) . AD = maximum d i f f e r e n c e i n any t w o measurements, mm ( i n . ) .
Tolerance = 0 . 1 mm ( 0 . 0 0 4 i n . ) .
AI'PI'NUIX "U".
( F i e l d and Laboratory Forms).
L.
I I
/,I&< -/ ::L-./ .L, - _?
i .-- t "-?Z-jyliL- I%?4 3 x 0 ..: . :
c . ..
F, . : - l y? -. 512- . - . , . _ _ _ _ . _ ~ . . . . . , . . . . . _ _ , . . . I - . . . A:,/$ Jf.,.,"f?g.+[~;' . ' . '
bz ,../ F&.:2*;22./5:> . . I
,-
H e t e r C a l i b r a t i o n ( / d
i l P i t o t Tube ( C
mz = s x 0, 2 7
f l L 3 F.SZ 1,
N o z z l e Diameter
F i n a l Leak R a t e Vacuum D u r i n g L e a k Check
P r o b e L e n g t h P r o b e L i n e r P r o b e Heater S e t t i A m b i e n t T e m p e r a t u r e B a r o m e t r i c P r e s s u r e Assumed M o i s t u r e F i l t e r Nuxber&.&5-kOd/ 7,f:
< *>,
.mm ( i n . ) Hg - f ( ' < ' ' Z /oz.c, /HI
I S a m p l e Box N$'mberflW,/ S t a t i c P r e s s u r e Meter Box Numberp,;,tL/(97) C F a c t o r -
I i . ,j M e t e r AH@ d./07 . R e f e r e n c e AP 9 690 m m ( i n . ) H 2 0
i I I D i f f e r -
i . * I I P r e s s u r e j , ' 1 T e m p e r a - / T e n p e r a - ; Temyere ru re l 1 of Gases j "
S t a c k V e l o c i t y
1 ,
I I Stack I Tempera-'Tempera- i Temperature'
ture I ture 1 ' of Gases Velocity - i p entia1 I Sample i of Gases I of Gases ! Leavine !
ressure 1 Differ- ! Gas

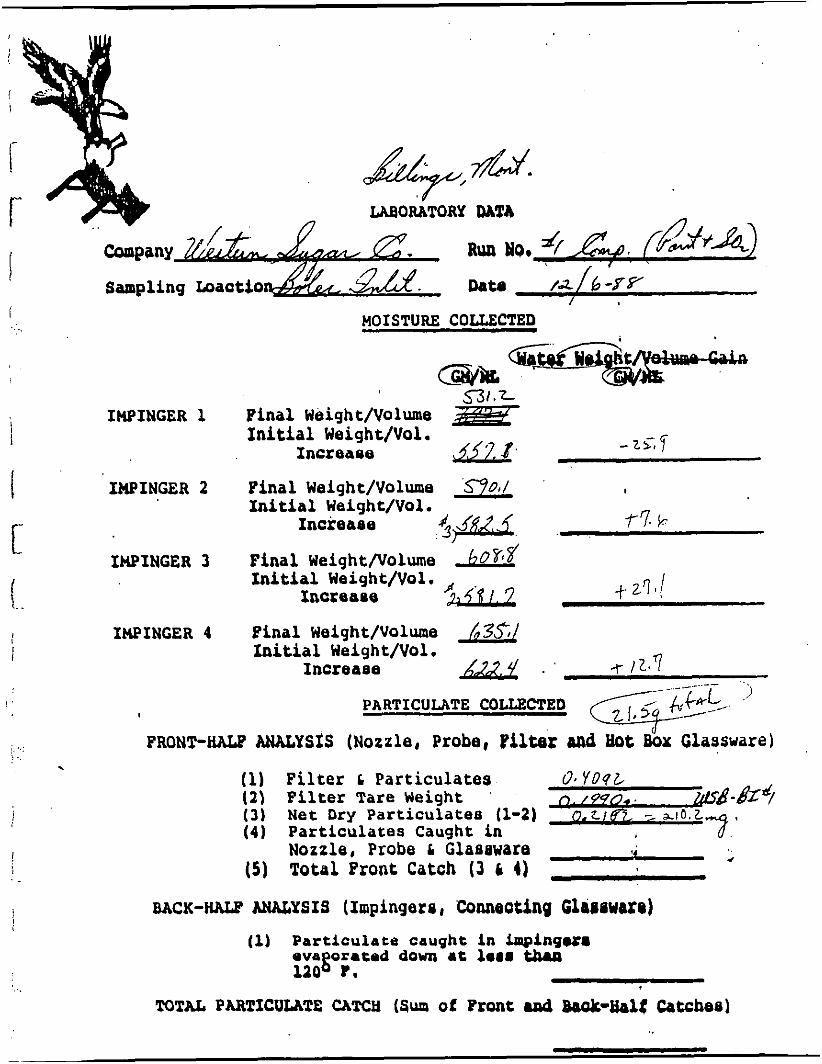
LABORATORY DATA
Sampling Iaaot lo 1
MOISTURE COLLECTED
aw@ IMPINCER 1 F i n a l Weiqht/Volume
I n i t i a l Weight/Vol. Increaoe
IMPINGER 2 Fina l Weight/Volue I n i t i a l Weigh t/Vol.
Increase
XMPXNGER 3 F ina l Weiqhtflolume I n i t i a l Weight/Vol.
Increcroe
IMPINGER 4 Final Weight/Volume I n i t i a l Weight/Vol.
Increaee & . -tl6.3
PARTICULATE
FRONT-HALF ANALYSIS (Nozzle, Prohe, Pilter and Hot Box Glasswdre) . (1) Filter c Part iculates (. , 3 ? p (2 ) F i l t e r Tare Weight n. gq77,- &.Bo*l
( 4 ) Part iculates Caught i n Nozzle, Probe L Glaesware
(5) Tota l Front Catch ( 3 L 4 )
-%f ( 3 1 Net Dry Particulate8 (1-2) 0,27522' L 29.5
az& we.
17'7.4 J *
BACK-WLF AN&YSIS (Impingere, Corneating Glasowore) (1) Part iculate caught i n ir~pingrrr
ova orated down at l a m eh.a 7aO 120 g Y .
7 TOTAL PARTICULATE ChTCti (Sum of Front rad Baak-Hal: Catchea)
33y-y -0
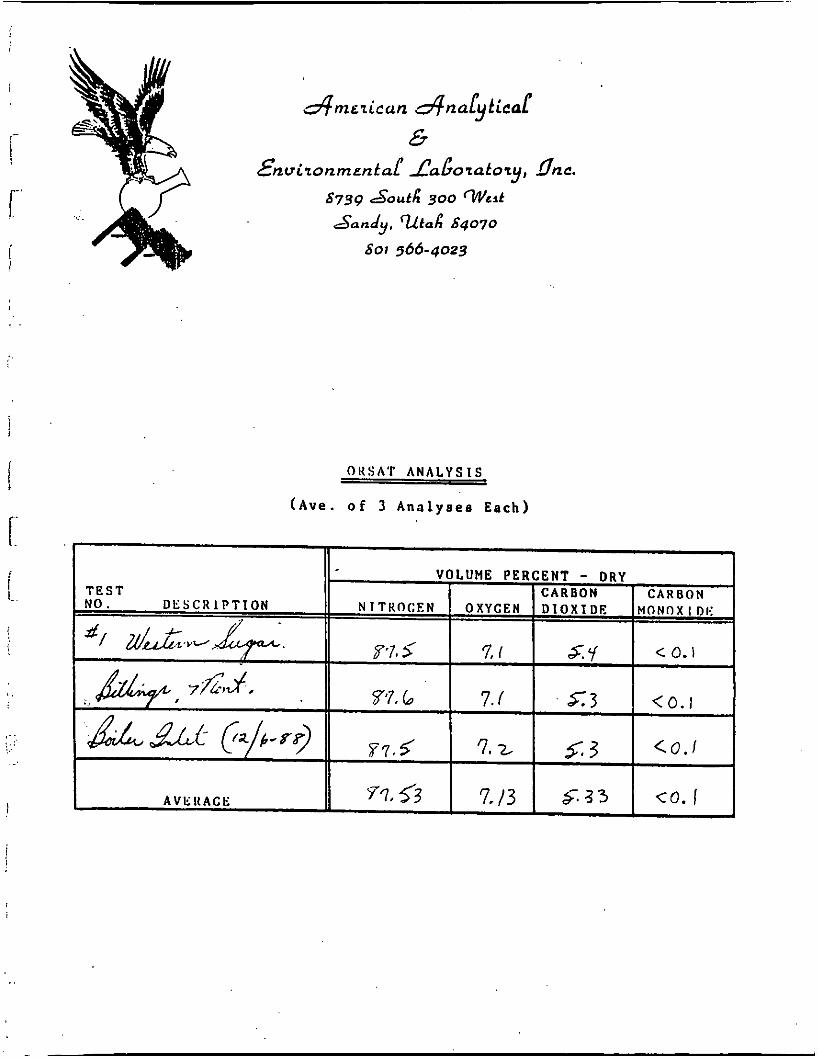
o4mrt icc ln 4naL j t icaP
6 €.nviionmzntaL' JaGotatoty, gnc .
6739 Soutf i 300 ' W c i t
Sandy, QtaX 64070
601 566-4023
( A v e . o f 3 A n a l y s e e Each)
n . . i / I 1
&m.-Lcan d * a & t i c a c zkAzonmcnto[ XaGOxatOy, gnc. 4-M. 6>& F. . .
A; 4, Gi,: ]5$!.77>.
Titot Tube (C Nozzle Diameter
Probe Liner Probe Heater Final Leak Rate
Barometric Press Assumed Moisture Static Pressure
Vacuum During Leak Check DLz ?.G F i 1 t e r N um be r,&A -L&J<~
m m (in.) Hg. 0. g 27 %
C l o c k T i m e
( 2 4 h r )
i l U J /I I L /
//Y 7 / I TO
i I I I / P r e s s u r e ! T e m p e r a - ! T e m p e r a - ! T e m p e r a t u r e 1
D i f f e r - , Gas
Me t e r ( A H ) O u t l e t j t u r e
t u r e I t u r e i o f Gases ' S t a c k V e 1 o c i t . y . e n t i a 1 S a m p l e o f Gases o f G a s e s ! L e a v i n g
I ' Meter F i l t e r 'C( 'F) . T e m p e r a - I
Vacuum Temp. . H e a d e Across V o l u m e ( V m ) L e a v i n g a t P r o b e I m p i n n e r s ( T ) (AP5) O r i f i c e
( i n ) H g " C ( " F ) ' ( i n ) H 2 0 I ( i n ) H 2 0 m3( f t 3 ) ( O F ) "C("F) j IN OUT I " C ( " F ) ! i -5517 3' i 2 6 6
I
7 6 3 7 1 L6 c: I 'f/ 1 CJtI 3- 0 . 3 ~ 6 ~ i A / V G 1 27 G* Z b F-2 3
(2 7-1 7q I 7 54 3 4 - . 1 Z T C I & # / Z d,q+&;y i 2' . 1.43 I +-JX3G ZL5- i ' 1 1 3. 7 ! /zu
//q ! Q#!3- &,3G& I s 177 i S % / 6 2/0 s i Y c . I 1 0
V l )
r, .
1 ' z b n !
I
! /zo 1 O . / Z 1 0 . 3 . / L . q I Zi-yd.5 b~
T r a v - I S a m p l i n g e r s e T i m e , P o i n t
l N u m b e r (0) M i n .
I ! I
I I
1 I
-
I I I I I ! I
I I I
I
I I I
I
I

LABOATORY DATA -
IMPINGER 1 F i n a l Weiqht/Volume I n i t i a l Weight/Vol.
Increaoe
IMPINGER 2 Fina l Weight/Volume I n i t i a l Weight/Vol.
Increase
IMPINGER 3 Final Weightflolume I n i t i a l Weight/Vol.
Increase
IMPINGER 4 Final Weight/Volume In i t i a l Weight/Vol.
Increase
tlOL.7
!
-t 2c I< I
FRONT-HALP ANALYSIS (Nozzle, Probe, Pi l t ex and U t Box Glassware) . (11 F i l t e r L Particulates 1, t o f s
( 4 ) Part iculates Caught i n
(2 ) F i l t e r Tare Weight $+2 *7q4 &-a0 dr ( 3 ) N e t Dry Particulates (1-2) < , z v q ,@- 2.7%
Nozzle, Probe L Claaeware 3s 0 (5 ) Total Front Catch ( 3 C 4 ) 30P. I *
BACK-WLF ANALYSIS (Impingers, COM@Othg GlaoUWate)
(1) Part iculate caught in impingar. ova oratrd down at 1ara thrrr 120 k I. 70
MTRL PARTICULATE U!KU (Sua Of Pront raQ aOa&-thl$ btchea)
i
i, i [ ! .:.
i
I i
i. I I ..
I .'
I I
I I I ^
&rnrTicun dnal9ticd c5
€nviionmmtaL' JaGo ioto y, LTnc.
6739 &ut/; 300 ( w d
S a n d y , Wtnd 64070
601 566-4023
OHSAT A N A L Y S I S
4 I_ P,AAJ &n*1,L- .5/
Meter C a l i b r a t i o n ( Y ) S h e e t 1 of 2 5;/1,;*" r /m"w+ , Nozzle I d e n t i f i c a t i o n N u m b e r a
Location n,.C/, + P r o b e L e n g t Nozzle Diameter 0 p , d mm ( i n . ) Operator vfifi - J F & y p n P r o b e L i n e r
Run. Number &r fw-"/ Ambient Temperatur S tack Iliam, mm(in.')
Thermometer Number 2: /r d,
Vacuum During Leak Check Date t , / - / ~ - y F i n a l Leak Rate m.a, imi.$ (cfm)
Assumed M o i s t u r . Remarks
. . .
..
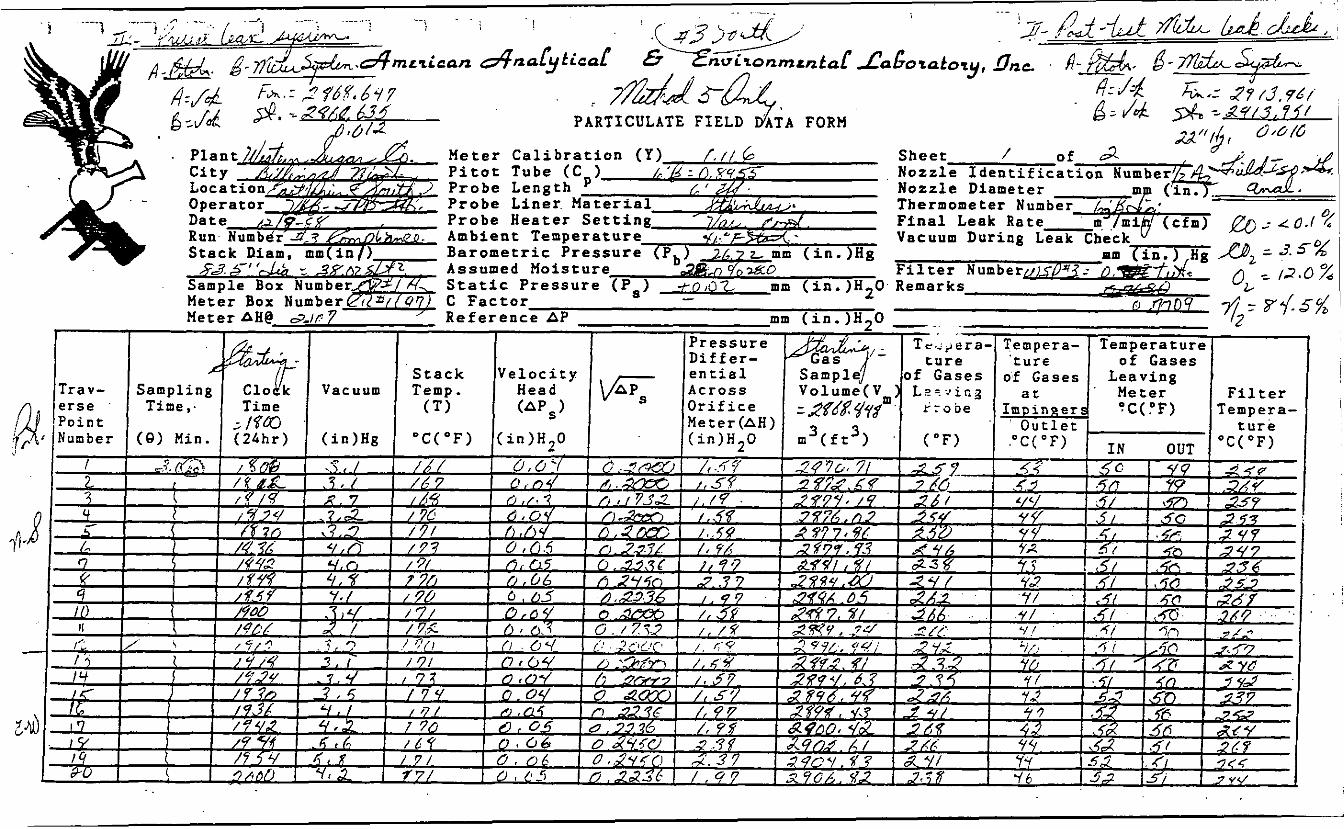
d m c r i c a n o4naGticoP €nvironmcntaP L h G o u z t q , gnc -
PARTICULATE FIELD DATA FORM
. P l a n t &<A,- h fn Meter C a l i b r a t i o n ( Y ) /, / / L S h e e t 2- of z C i t y a/,;,.? h a z y . P i t o t T u b e ( C ) L / f l - (9. vy5-5- N o z z l e I d e n t i f i c a t i o n N u m b e r L A L o c a t i o n k'.,/*. Q~,C$ / P r o b e L e n g t h /*& N o z z l e D i a m e t e r i n - O p e r a t o r L / K ~ - JT eYp5 P r o b e L i n e r Material S A , , 43f Thermomete r Number
m. m i , cfm) D a t e 1 , / + /yx P r o b e Heater S e t t i n g Run- Number 4 3 (a A-7- A m b i e n t T e m p e r a t u r e 3 z " F Vacuum D u r i n g Leak Check S t a c k Piam, mm(in:) Barometr ic P r e s mm *-
Sample Box Number A S t a t i c P r e s s u r e Meter Box Number cner/C9?1 C Factor
kfi r F- rn .f F i n a l Leak R a t e
/ I IC'' Z ( O > . J 44 L Assumed M o i s t u r e
IMPINGER 1 Final Weight/Volume && Initial Weight/Vol .
Increaoe d i u if6 .1
Incmaee a I YV.b 9 IMPINGER 2 Final Weight/Volune &?,3
I n i t i a l Weight/Vol.
IMPINGER 3 Final Weightfiolume d%'k2
-f 22.6 Initial Weight/Vol.
Increase
Initial Weight/Vol. IHPINGER 4 Final Weiqht/Volume /&',<
ff'l.8 Increoee L a ? /
PARTICULATE COLLECTED i
PRONT-HALP ANUYSiS (Nozzle, Probe, . (1) Filter L Particulates 16.0487 ( 3 ) Net Dry Particulatee (1-2) (4) Particulates Caught i n
(5) Total Pront Catch (3 6 4 )
WX-W ANASIYSJS (Impingere C~meating Gleoouuco)
(2) Pilter Tare Weight fl. f L 7 8 , . uLnl-gb?3 II , a q N - - ./.
I
+ Nozzle, Probe L Claaeware 2FfQ 26c 6
(1) Particulate cauqht i n iwinqum ova orated down a t l8rr thu, 12ak 1. 2111 €

! I
i l- i I
I.:. ...
I j
i '
1 1: (
i
!:
I-
I
.::.. ;. ..
! f
i
i- 1
I- i
f < - E739 &ut/; 300 wed
Sundy , Qtuh 64070 601 566-4023
O I t S A T A N A L Y S I S
( A v e . o f 3 Analysee Each)
.... ... ...... . ... . I Y :, ! 1 I - . _. . .__- I i
_.I. . .. I
..
- !
Trav- Sampling
Point /Number (€3) Nin.
Time,
3, o m I d 21
I 2: 1
< 1
I -3 :T 4 %
I i i
I Tempera-i Tempera- Temperature 1 ture of Gases of Gases; Leaving
Pressure 1 Differ- Gas 1 of Gases ture I Sample
I Filter Volume(Vm) Leaving at 1 Meter Probe Impingersl "C("F) (Tempera-
(OF) Outlet I i ture
: I oC("F) -1 "C( OF)
I Stack Velocity entia1
Clock Vacuum Temp. Head Across Time (T) (APs) Orifice
Meter(AH) I (24hr) (in)Hg 'C(''F) (in)H20 (in)H20 I m3(ft3) rs I7 1 7 L 5-J . L J 0 $0 0 / y 9 8: L3 i I 70 I & P j
LJC r 7 .e 5 O.%'Ob . I @a .L, J I I 74 r. 7 I c . / 7 I 2-LL L Y t I bq CPZ * ot I 7 L L "f
I I, f r x (. 5 Q . R d b c r?g 6 8 b-/ G u7 2-v b l !
0.vo a /-5. 5-3f'C
2r 7.2- < o r . 1< 5 - 0 4 . P D
* .2f I b YV 1 % Y L su5. . t c MJ I' F x z .L I/ 0 , C I L
4:z.f L 4 Y 6d f - 0 v 1. G 0'8 LF , * I 1
n.W.5 ,
, c
A
I I I-
- - - 4 r .21
- &I
I
I i I I I I I I 1 I ! !
1 I ! I
I 1
I i
I I
LX I I b , 325' I .- L 5 ! ' 6 5 3 - F I
I I
/ , i i 3 r:
I I I I 1
I / .- I
I i
I I I !
~ p . r - / = i 17.205 13.l-3 so.aLL ! O , ? L h L .0..63 0*4q5-& 4- D --n L * @ B ' . a 7. 6 7 -. I;. ~ 527. 5- 'F
I
1
! ? l o
!- r I ( . .
i I
I c 1..
I
I
;:.: ! ..
1
I !
. .
.
-. s1.r
IMPINGER 1 Final Weight/Volume Initial Weight/Vol.
Increaoe m IMPINCER 2 Final Weight/Volume -o,/
Initial WeighWVol. Increoee $+
Increase dm INPINGER 3 Final Weightflolume ,-d
Initial Weight/Vol.
IMPINCER 4 Final Weight/Volume 14351 Initial Weight/Vol.
Increoee M
- 2G# 'i
, r?. !r
4.21 ' I
I PARTICULATE COLLECTED
FRONT-HALP ANALYSIS (Nozzle, Probe, Filter
(1) Filter b Particulates $* Y 0 4 t
( 3 ) N e t Dry Particulate8 (1-2) O.C/f i> (2) Filter Tare Weight n./wa*. wA-&d/ (4) Particulates Caught in
4 . Nozzle, Probe c Clamware (5) Total Front Catch ( 3 L 4)
BACK-w ANALYSIS (Irapingero, 'CoConn@OtiAg G~400wOr0)
111 Particulate caught i n iPlpingu4 ova orated down a t 1.84 t&aa 110 8 r .
TOTAL PARTICULATE CATCU (Sum of PrOnt .ad BeOk-Ul$ Catch881
i
I t i
[
I .
!
I .
,- :.. :.:
I
,i i
oitsA*r A N A L Y S I S
(Ave. o f 3 A n r l y s e e Each)
II
A V E It A C E
~~
.3 -7 . -! .. t
* d m r t i c a n ..... dnaCytica1) . . . . ..... .... €nvitonmzntaP . . . . . L'aLoiatoy, gnc. - rl, /-+ 5y4. 0 4fd b: 'd
.. ~ . ^ ~-~ -__. - ff .?- . JUL,. 44
PARTICULATE FIELD DATA FGRX 9a.i
Meter Calibr Sheet / Pitot Tube (C Probe Length Probe Liner M Thermometer Number Probe Heater Ambient Temperatur Vacuum During Leak Check Barometric Pressur am (i . ) Hg, mz .4.ssume d No i s t ur e Static Pressure 0 Remarks
Final Leak Rate
Fiiter Number- -ATd> 7, = 0, =
Reference AP m m (in.)H20 71z = Nete:. AH@ a, OR 7 . Press ur'e ' c I
I Differ- ture Stack (Velocity. entia1 I Sample
' !T) (A?s) (Orifice 1 -y,l-, ,yz !Meter(AH) I - 3 3
I !(in)H,O 1 IT (ft ) I ( O F ; " (OF) i OU?
I
i I
Sampling Clock Vacuum Temp. . Head Across ! Volume(V Meter i Filter 'C("F) [Tempera-
Outlet 1 ture erse Time, Time I- Point j -
4h(i<umber ! [(€I) Min. j (24hr) ! .(in)Hg j "C("F) (in)H,O L n R n i 9 L I IN
. \
j-
i
I" !
1 ,i
! ...
! I
i i 1
IT ! ...
1
:.: :. ! '. . .
i i i i
: I i
I ! t . .
,&.&, , \ \ .
\
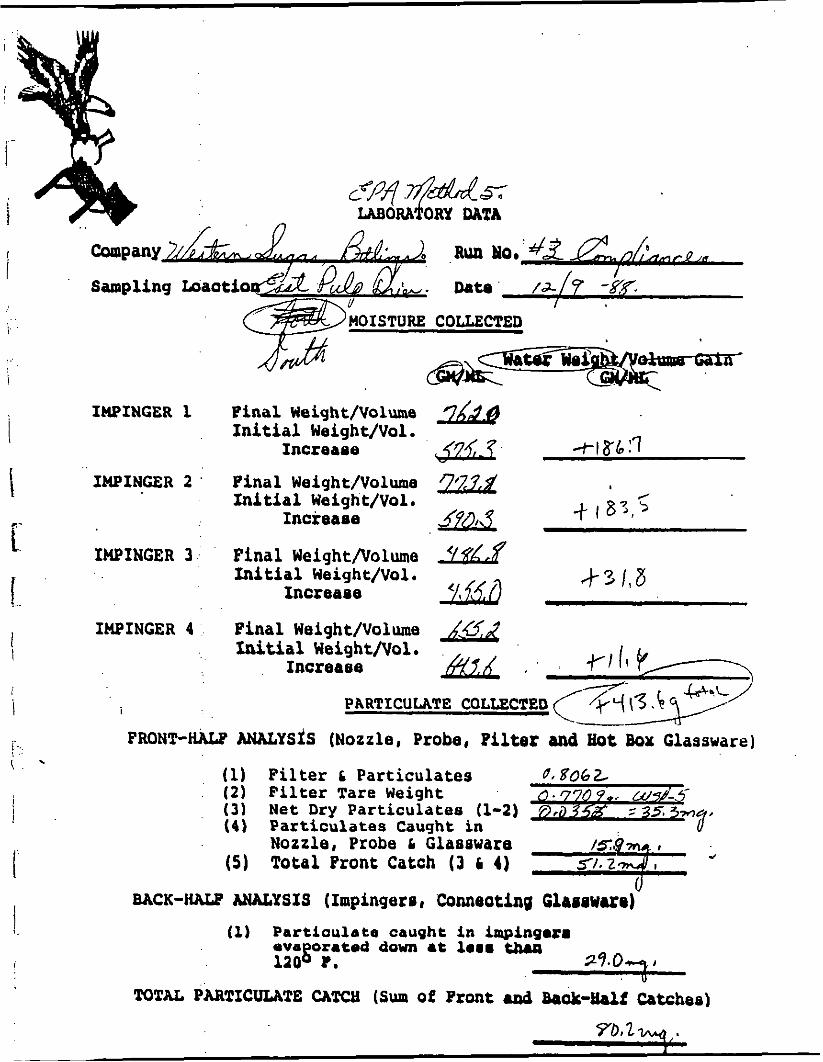
MOISTURE COLLECTED -__
- w n CGW G J U h
IMPINGER 1 Final Weightflolume Initial Weight/Vol .
Increaoe
UPINGER 2 Final Weight/Volw Initial Weight/Vol.
Increaee
IMPINGER 3 Final Weiqht/Volume Initial Weight/Vol.
Increaoe
IMPINGER 4 Final Weiqht/Volume Initial Weight/Vol.
Increaee -VI( c( -. b 1 4 . Y W ' -c-
PARTICULATE COLLECTED
PRONT-HALF ANALYSlS (Nozzle, Probe, Filter pad Hot Box Glassware) . (1) Filter L Particulates (2 ) Filter Tare Weight ( 3 ) Net Dry Particulates (1-2) (4 ) Particulates Caught in
Nozzle, Probe L Glaeeware (5) Total Front Catch ( 3 L 4 )
4 d
BACK-HALF ANALYSIS (Impingero, Conneatkg Glasowero) (1) Particulate caught in impinges.
ova orated down 4t lea. 1 2 4 1.
TOTAL PARTICULATE ChTcti ( S U Of PEOnt raQ U-WC Catchee)
i I
i I
i I
, ..
!'
i
i !
i f
. . , :
O R S A T A N A L Y S I S
( A v e . o f 3 Analyses Each)
II 1
- .. .. . T E S T VOLUME P E R C E N T -
I l l P V I
A V E I( A C E
! I / P r e s s u r e I i Temoera- i T e n l o e r e - i T e m D e r a t u r e i
I S t a c k / Y e l o c i t y H e a d
I I j i
C l o c k Vacuum 1 Temp. ( A P s ) j e rse T i m e ,
] P o i n t
. D i f f e r - ! Gas i o f Gases i
L e a v i n g . f e n t i a 1 S a m p l e A c r o s s O r i f i c e Me t e r ( A H )
. , . Volume(V,) L e a v i n g i Neter I F i l t e r
? r o b e 1 I m p i n R e r s ' " C ( " F ) j T e m p e r a - j t u r e
3 Y 1. sa 1 ' O u t l e t i iNumber 1 ( e ) M i n . ( 2 4 h r ) ( i n ) H g i ( i n ) H 2 0 I 1 ( in)H, ,O - m3!f t3) ( O F ) I 'C(OF) 1 IN OUT I"i!'Fj
. j (;.%c5 i , C r , I '7% i ;:.io 7 ,'. + j ; I ,-xrfi Iu ~ s i . 7 2 I ! ! J ? I r g I
MOISTURE COLLECTED
** IMPINGER 1 F ina l Weight/Volue
I n i t i a l Weight/Vol. Increaoe
IMPINGER 2 Fina l Weight/Volue I n i t i a l Weight/Vol.
Increaoe
IMPINGER 3 F ina l Weightflolume I n i t i a l weight/yol.
Incxeaoe
IMPINGER 4 F i n a l Weight/Volume I n i t i a l Weight/Vol.
Incream
-27. s
1- 33. b
; ,' f.4*/ /='+ h g - '
.- --*57.
- PARTICULATE COLLECTED
FRONT-HALF AHALYSlS (Nozzle, Probe, Filter and tlot Box Glassware) . (1) F i l t e r C Particulates O.yL3i
(3 ) Net Dry Par t i cu la t e8 (1-2) ( 4 ) P a r t i c u l a t e s Caught i n
Nozzle, Probe C Clamware (5) Total Front Catch (1 C 4 )
(2) F i l t e r Tare Weight n . / f 7 6". &-35- - 4 *
BACK-HALF WGYSIS (Impingere, Conneoting Glapsuaro) (1) Par t i cu la t e caught i n impingum
ova orated don, at lorr tR.a i a o 8 Y .
TOTAL PARTICULATE CATCH ( S U Of PEOnt raQ &&-Us CaGh88)
OItSA’P A N A L Y S I S
( A v e . o f 3 A n r l y s e o Each)
A V E K A C E
I I . . . . . . . . . . . . .
- I
{
I I
~~
I I I ! I I I I I I I . . . . .
I . . . . . . . .
. . . . . . . . . . I I . . . . . . .
! I .' I 1 . .
[ D i f f e r - Gas i o f Gases I I I e n t i a 1 i Sample
I I I I I I
I 8 I I I I I I I I
I I I I
F i l t e r / T e m p e r a - T r a v - I S a m p l i n g 1 C l o c k Vacuum Temp. H e a d v A P s A c r o s s 1 \rol;me(Vm) L e a v i n g a t I Meter e r s e T i m e , P o i n t
( A P s ) O r i f i c e I P r o b e I m p i n g e r s ' O C ( O F )
Meter (AH) O u t l e t ( T I
"C( 'F) ( i n ) H 7 0 ( i n ) H 7 0 I m ' ( f t 3 ) ( O F ) " C ( " F ) 1 Th' I , Number ( e ) X i n . ( i n ) H g
. . . . . . . . . . .... -.I
. . . . .
:
n
- . -. -. .. . . - . . . . ... . . . .. .. . .
4@M 3-
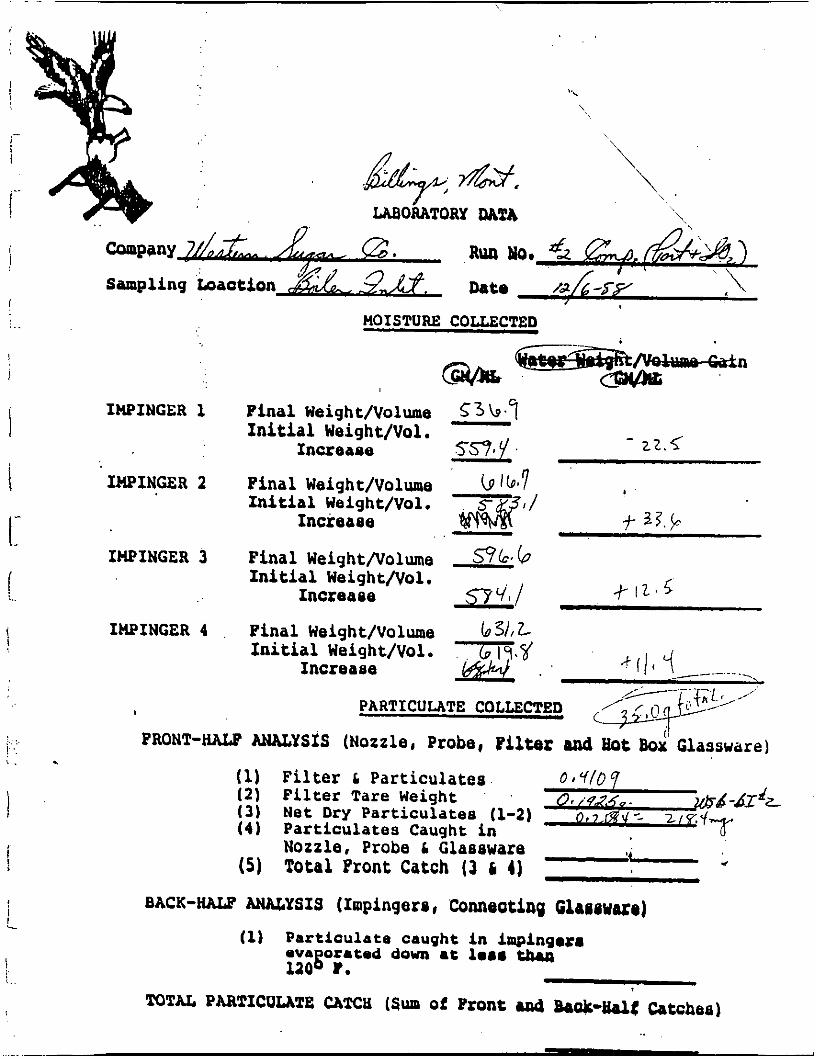
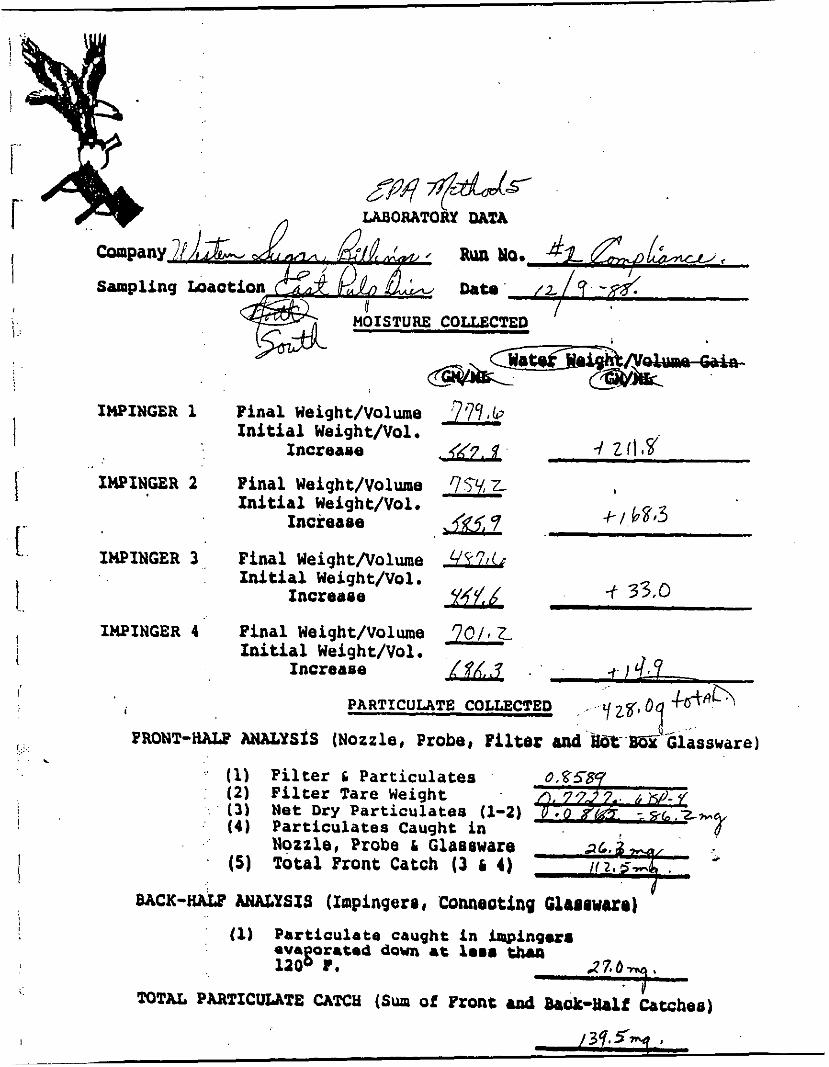
LABORATORY DATA
Sampling Loactio
MOISTURE COLLECTED
IMPINGER 1 Final Weight/Volume ‘114 71 f 570. b t 136.b
Initial Weight/Vol. Increase
Final Weight/Volume 353,7 Initial Weight/Vol. - IMPINGER 2
Increase Sa71 b 7 I 63. I
IMPINGER 3 Final Weight/Volume ‘5-7zq7 Initial Weight/Vol.
Increaoe Y SI1 2- f- I ZY.7
IhPINGER 4 Final Weight/Volume 7 Cp Initial Weight/Vol.
Increase bC1IJ-l t IL 2 - PARTICULATE COLLECTED < t g3Y.y _- - - _ _- 7 -
FRONT-HALP ANALYSXS (Nozzle, Probe, Filter and Hot Box Glassware)
(1) Filter t Particulates 0, gss7 (2) F i l t e r Tare Weight n. ZYY. kX/ - /
= 5%
( 3 ) Net Dry Particulates (1-2) 0.0- ( 4 ) Particulates Caught i n
Nozzle, Probe 6 Glassware 2 5 . 3-q (5) Total Front Catch (3 6 4 ) 4,-
b BACK-HALF ANALYSIS (Impingars COnneOting Glassware)
(1) Particulate caught in impingmra eva orated down at 1maa than 120 g ?. 17 .0*qe
8
TOTAL PARTICULATE CATCll (Sum of Front ard Baok-thlf Catches)
/3JtI m,i
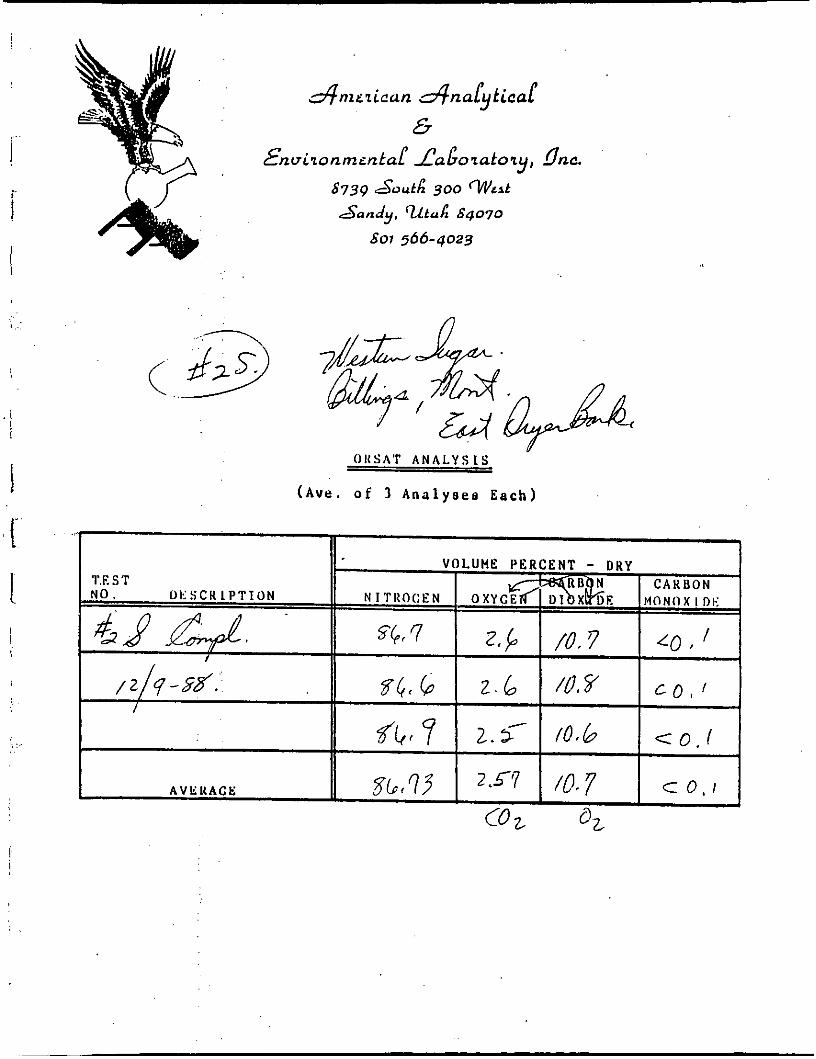
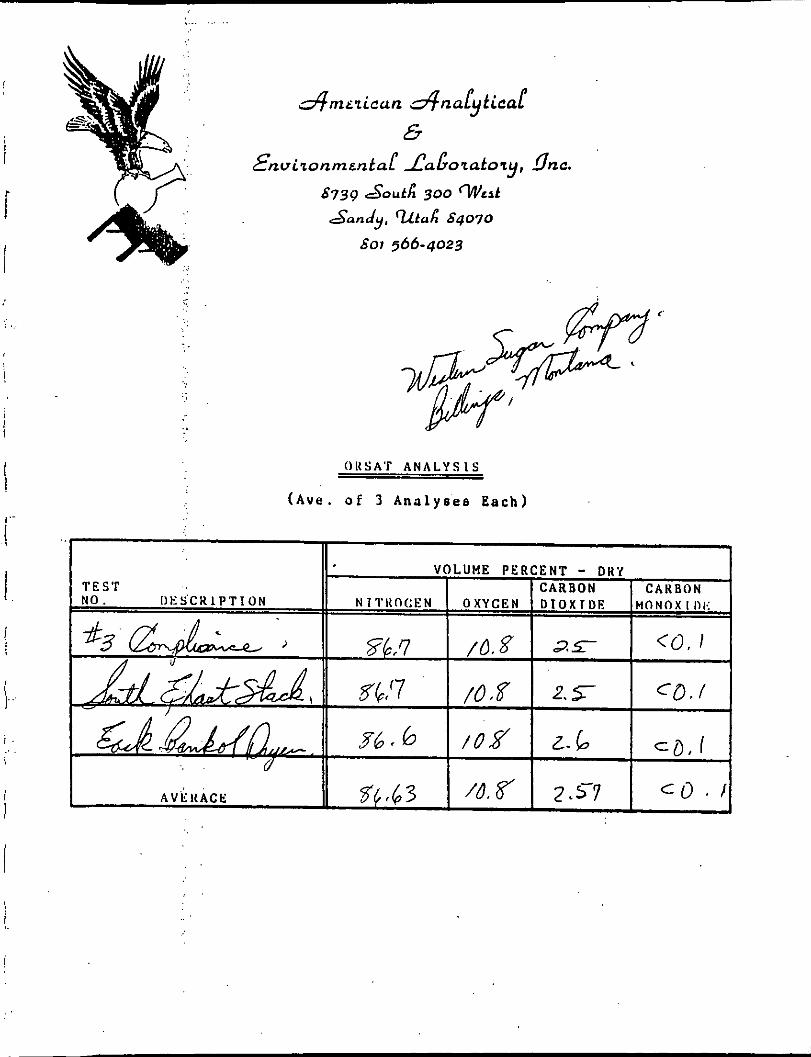
OI(SAT A N A L Y S I S
( A v e . o f 3 Analyses E a c h )
r-
d m r s i c a n &d''ticJ S L;rZsonmrntat LaLsatozy , g n e
/.- 2 -- - ' sv.7,- N o z z l e S h e e t
Thermometer Number
,jv7&&. PARTICULATE FIELD
/ N I . Meter C a l i b r a t i o n (Y) P i t o t Tube ( C p ) P r o b e L e n g t h P r o b e L i n e r M a t e r i a l m:,~ ,L. P r o b e Heater S e t t i n g Y- 4 L Y . F i n a l Leak R a t e Ambient T e m p e r a t u r e ?-3v?>lcvY ' Vacuum Dur ing Leak Check B a r o m e t r i c P r e s s u r e ( P ) 2 5.3'. m m ( in . ) I lg Assumed M o i s t u r e 3 6 - e S t a t i c P r e s s u r e .- m m (in. H20:Remarks C F a c t o r - - R e f e r e n c e AP 0 . 7 2 ~ m m ( i n . ) H 2 0
/ I!,?.
mm 'iTiTj7j 3-u.77/70 i d,r(l
P r e s s u r e Tempera- Tempera- T e m p e r a t u r e D i f f e r - Gas t u r e t u r e
E Volume(V ) L e a v i n g a t Meter , F i l t e r Sampl ing C l o c k Vacuum .Temp. . H e a d A c r o s s
Meter (AH)' O u t l e t ~ t u r e ( Q ) M i n . ( 2 6 h r ) (iU)Hg OC(OF) ( in)HZO ,c\ (in)HZO m 3 ( f t 3 ) ( O F ) IN "C( O F ) "C(OF)
of Gases _ - S t a c k V e l o c i t y . e n t i a 1 Sample of G a s e s of Gases L e a v i n g
Time ,. Time (TI (APs 1 O r i f i c e m' P r o b e I m b i n e e r s ?C(PF) , Tempera-
OUT /t 4 4 , 4// I Y
I I 3 C ' 6 Y 8 Y I I / 55' I 7 . S 1 /, c 2 77i I Y /).^7n*YJ 1 0 ,ny 5 . / I 7f
I .7. 5 / '7/ -0- I n,bq I # 6 Y I I 2 772,4d7 I .yo 137 263 I
t.._7(3tU . UrOY I 276 7, e/.? 2 5-2 ?<I c3 2 4 1 ?.C!&) .?; c, .7j '
7 , 2) I 6 !' ,/ 16 7-
~I Yd I r o 267 -768 0
4 2.h 5 I 3/ *d5' I 1.7 0 I
I 0,o lY ' . - .I I '
'1
I
5- LABORATORY DATA
I MOISTURE COLLECTED
I
IMPINGER 1 Final Weight/Volume ?L, iq + I 9 3 . 1 Initial WeightDol. I Increaoe a b a z
IMPINGER 2 Final Weight/Volume Tkdf Initial Weight/Vol.
4- I 7 5,\ i r Increase m
IMPINGER 3 Final Weight/Volume Initial Weightflol.
Increaoe +5 , $ AcL t I c
IMPINGER 4 Final Weight/Volume f
4- I / , ' & Initial Weight/Vol. I Increase &
i
. FRONT-HALO ANALYSiS (Nozzle, Probe, Filter and Hot Box Glassware)
(1) Filter L Particulates 0,s 679 (2) Filter Tare Weight (31 Net Dry Particulate8 (1-2) (41 Particulates Causht in
26.3,-q I .. ~ozzle, Probe L Glassware (5) Total Front Catch ( 3 CI 4 ) />3.o--.u:
A BACK-HALF AHALYSIS (Impingere, ameat ing a ~ o w ~ r ~ i
I (1) Particulate caught i n impingarr ova oratad down at la80 W 110 g F. / - L , O ~ ~
0 TOTAL PARTICULATE CATCH (Sum of Front and Baok-Wf Catchea)
/35<0 U
1 -
I .
I
1.:
i
"I
I
i
1 l- I 1. I I '. .
I
j
I i
&mciiccm &nabtical
G €nviionrnrntaC LhGoiato y, gnc.
6739 S o u t k 300 w e s t
Sandy. ' U t d 64070 601 566-4023
O R S A T A N A L Y S I S
( A v r . o f 3 A n a l y a ' e a E a c h )
T r a v -
* P r e s s u r e T e m p e r a - Te'rnpera- T e m p e r a t u r e o f Gases _ - D i f f e r - t u r e t u r e
e n t i a 1 S a m p l e of Gases o f Gases L e a v i n g T - . 2' S t a c k V e l o c i t y ,
Vo lume(Vm) L e a v i n g a t ' Meter F i l t e r S a m p l i n g &k Vacuum .Temp. . Head E A c r o s s
1 ., I
? . .....
I . ..
I . ... ... . .
* DYr? n W 5 . q PARTICULATE FIELD DATA FORM
Nozzle Diameter
Final Leak Rate Vacuum During Leak Check
obe Liner. Thermometer Number
'Ambient Temperatur
Assumed Moisture Static Pressure
. .
I
I c 1 I i .
1
IMPINGER 1 Final Weight/Volume ?qf[ f 20987
f- 158;l
4 39q
Initial Weight/Vol . IMPINGER 2 Final Weight/Volume
Initial Weight/Vol.
Increaee rLY 91 q
Increaee Lm! YSU1S
IMPINGER 3 Final Weightflolume q f i f Initial Weight/Vol.
Increaoe
Initial Weight/Vol.
- IMPINGER 4 Final Weight/Volume 69$(5-/
Increase 6793 i- , S I - .--,
PARTICULATE COLLECTED
FRONT-HALP ANALYSIS (Nozzle, Probe, Filter
(1) Filter 5 Particulates 0 . p q gq (2) Filter Tare Weight
( 4 ) Particulates Caught in Nozzle, Probe L Glaaeware
(5) Total Front Catch ( 3 L 4)
90. h&,,-&
27.& “ro,
- m Yt (3) Net Dry Particulates (1-2) Z o E f e
.I 1 3 3 b l mi./
1 BACK-HALF ANALYSIS (Impingaro, Corneating Glorowrre)
(1) Part i cu la te caught i n irPpingora ova oratod down at lor* a
1 2 . 0 * Q ~
120 a F. I
TOTAL PARTICULATE CATCH (Sum oC Prmt urd BaoL-blf Cotchea)
!
i I
I i
I I ..
I I
i I..: . .
I
I. I j
0 1 S A T A N A L Y S I S
(Ave . o f 3 A n c l l y a e e Each) .,
I ...... ...... ..... . , I
- .- e ! ' -7 ----i .---I l .. ~.,
i %
I ! ! i I
3Qmr.rican &noi+al) 6 €nuizonmmtaP . . . LhGoiatoy, gnc.i . . . . . . ...... .j. . . . . .. - . .- . . . . . , . . . I
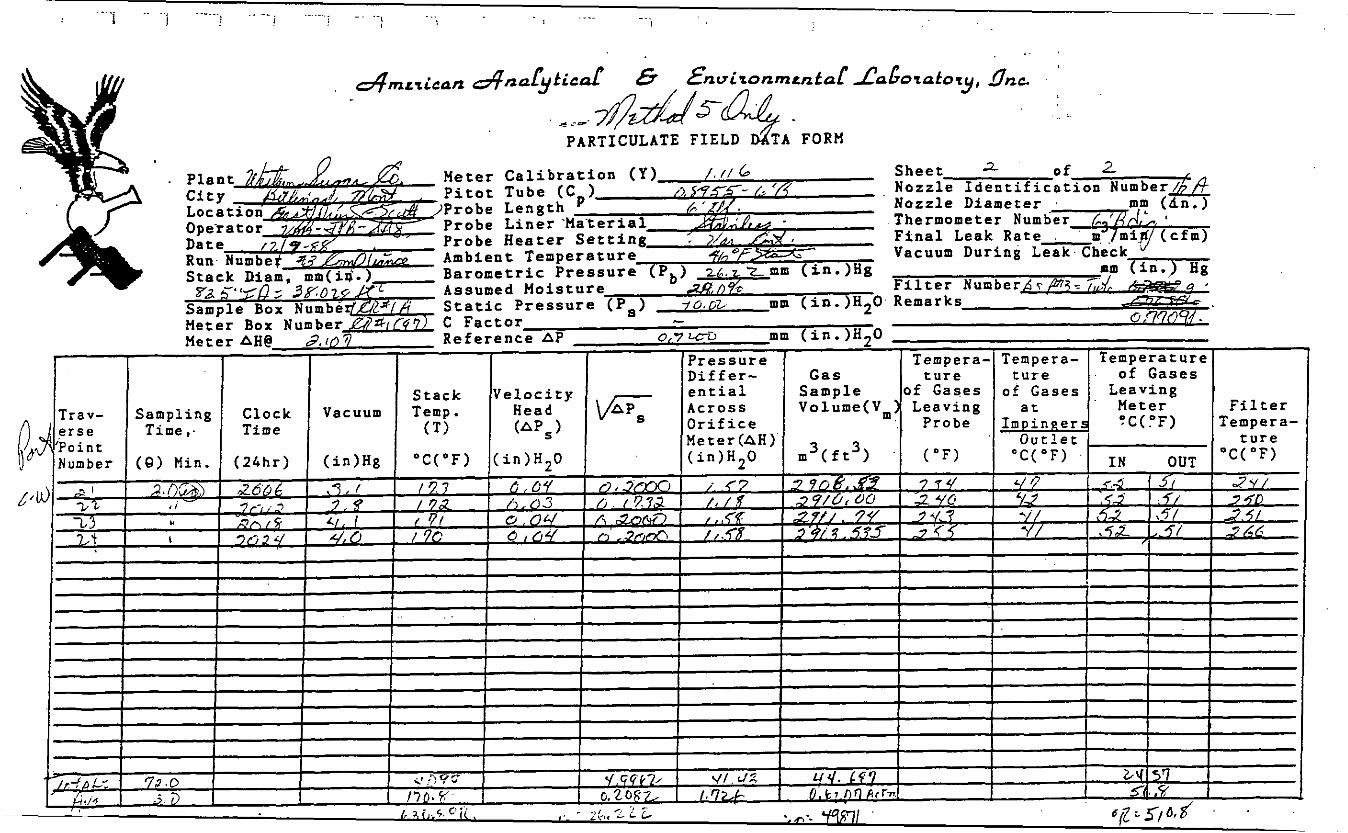
I PARTICULATE FIELD DATA FORM
, Meter C a l i b r a t i o n (Y) S h e e t 2 ' o f z P i t o t Tube ( C ) PTgT2Z5-& Nozzle I d e n t i f i c P r o b e L e n g t h N o z z l e D i a m e t e r P r o b e L i n e r Mater ia l T h e r m o m e t e r Numb P r o b e Heater S e t t i n g F i n a l L e a k R a t e md/mir+j(cfm) Ambien t T e m p e r a t u r e i- . ,
B a r o m e t r i c P r e s s u r e (P , ) .A& . 3 3 mm ( i n . ) H g mm ( i n . ) H g , Assumed Moi s f u r e 240 0 6 S t a t i c P r e s s u r e (P,) t o 0 2 mm ( i n . ) H 0. Remarks C F a c t o r L
Meter AH@ R e f e r e n c e A P 6 0 '(05
Vacuum D u r i n g Leak Check
'- = 0 .&3-q TnY- I .
2 m m ( i n . ) H ? O -
I 7 I
i ! ( P r e s s u r e ! 1 Tempera- , Tempera- I T e m p e r a t u r e ;
I i 7-- I i ! i ! I !
I I I i I I----- !
I I I I I I I I
I I I . . ! I I ' ' I I
I I I I . , 1 . ., I I I I I i ! I
. . . . . .
.... . .
IHPINGER 1 Final Weight/Volume Initial Weight/Vol.
Increaoe IMPINGER 2 Final Weight/Volume
Initial Weight/Vol. Increase
IMPINGER 3 Final Weightflolume Initial Weight/Vol.
Increaoe
IMPINGER 4 Final Weight/Volume Initial Weight/Vol .
Increase
PARTICULATE COLLECTED
P R 0 N T - W ANALYSIS (Nozzle, Probe, Pilter and Hot Box Glassware)
(11 Filter L Particulates 0.89 Yb (2) Filter Tare Weight ( 3 ) (4) Particulates Caught in
(5 )
4 Y,. ML5 J- Net Dry Particulates (1-2) $.09&7 = 47.7,,$,
Nozzle, Probe L Claeeware Total Front Catch ( 3 6 4 )
B A C K - W ANAGYSIS (Impingere, C o ~ e a t i a g Glpsowprs)
(I tq.34
4
(11 Partiaulate caught i n impingar8 ova orated down at 1888 W 120 k ?. b3.0mq.
. I TOTAL PARTICULATE ChTCIi (Sum O f P m n t opd Baok-ilalf Catches)

I
I i
!
, .. !.'.
, I
, I
t r 1..
i. I
!'.
1::
i
1 I .
. .
0 It S A T AN A L Y S 1 S
( A v e . o f 3 Analysee E a c h )
A V r5-. I ( . y 3 I1 A C E

-~~
Meter C a l i b r a t i o n ( Y ) I , / / L
Probe L e n g t h Probe L i n e r M a t e r i a l Probe Heater S e t t i n g
r.5455- &'A Thermometer Number
&d 7&!JL4 5&,- PARTICULhTE FIELD DATA FORM
Meter Calibration ( Y )
Thermometer Number Probe Heater Setting Final Leak Rate Ambient .Temperature
Assumed Moisture
Meter AH@ Reference AP
IHPINGER 1 Final Weight/Volume Initial Weight/Vol .
Increaoe
IMPINGER 2 Final Weight/Volume Initial Weight/Vol.
Increase
IMPINGER 3 Final Weightfiolume Initial Weight/Vol.
Increaoe
1 I I I
IHPINGER 4 Final Weight/Volume 7@/r 2 Initial Weigh t/Vol . I
Increase U ' I -t I - 9
I
8 PARTICULATE COLLECTED
PRONT-HALF IrNAtYSk?t (Nozzle, Probe, Filter sad I .
(1) Filter 5 Particulates 0.g5sy (2) Filter Tare Weight 77f7.. fiw-,' (3) (4) Particulates Caught i n I-7 Net Dry Particulates (1-2) G . 0 fm 2 l id,
Nozzle, Probe L Glaeeware Total Front Catch ( 3 & 4) (5)
BACK-HALF W Y S I S (Impingere Conneoting Glasouorsi (1) Particulate caught i n hpingora
ova orated down a t 1088 tiam 120 k F. 2z07T.q.
v M T A L PARTICULATE CATCH (SUI of Front .ad &&-blf btches)
I 134.5mq I
!
1 '
i I I .
I . . .
i
.. j !
1 1 ['
1 1~ I
1
8:::
!
i i
, .
(-9 7@& a
'224 0 I( S A T AN A L Y S I S
( A v e . o f 3 A n a l y s e s Each)
1 I1 I
7 f ' !Z J
N u m b e r
I
0 Y II)
I'
- . ~ . . .
--I - . i - ! . ... , - .. I
-a.
I , 1L .'I .
~ fl . . ---.~J,- '& ,j- (,& ,&.&&. . i
b-a. g.y&+A.&mczicnn XaGototoTy, gnc
d z / d FA.: ,28.t:f46y7
Meter C a l i b r S h e e t / P i t o t T u b e ( N o z z l e
N o z z l e Diameter P r o b e L e n g t h T h e r m o m e t e r Number P r o b e L i n e r . M
P r o b e Heater F i n a l L e a k Rate A m b i e n t T e m p e r a Vacuum D u r i n g L e a k Check Barometr ic P r e s
S t a t i c P r e s s u r e Remarks- L
mm 'n B2 = 3.5% A s s u m e d M o i s t u r F i l t e r Number L/)5543= 0 , S - f i l i c 0 = Q . O %
C Fac to r I? ,C?707 R e f e r e n c e A P mm ( i n . ) H 2 0 - _ . ~.
. .. P r e s s u r e T c . r r e r a - Tempera- T e m p e r a t u r e D i f f e r - o f Gases
at . Meter F i l t e r
t u r e ' t u r e of Gases omf G a s e s L e a v i n g
?C(PF) T e m p e r a -
S t a c k V e l o c i t y e n t i a l Vacuum Temp. Head A c r o s s V ol ume ( Vm ) L 2 =. .J i n 3
Time.. T ime ( T I CAPS) O r i f i c e =~'f'&',&f . r t - o b e I m p i n R e r g Meter(AH)
( 0 ) M i n . ( 2 4 h r ) ( i n ) H g OC("F) ( i n ) H 2 0 ( i n ) H 2 0 m 3 ( f t 3 > . ( O F ) o C ( ' F ) 5 /sa3
, oQmrrican AGoratory, gnc .
Meter C a l i b r S h e e t 1 o f 2 P i t o t T u b e ( C P r o b e L e n g t h Nozzle Diameter P r o b e L i n e r ’ P r o b e Heater A m b i e n t Temp
Assumed Moisture F i l t e r Numberpr/Z*iz, ,,,d Vacuum D u r i n g L e a k - Check
mm (in.)- Barometric P r e s s - ’ S t a t i c P r e s s Remarks S a m p l e Box Numbe@Ls(h
Meter Box Number k?k?&if4’71 C F a c t o r
IHPINGER 1 Final Wdght/VOlue In i t ia l Weight/Vol .
Increaoe +r8’6:1
IMPINGER 2 Final Weight/Volume 17/Zy,d + 1 8 3 5
In i t ia l Weight/Vol. 4-3 / , e ;
Ini t ia l Weight/Vol. Increase -5-984
IMPINGER 3 Final Weight/Volume ‘1d . f
Increme
IMPINCER 4 Final Weight/Volume Initial WeightDol.
Increaee
I PARTICULATE COLLECTED < - q q w
PRONT-HhLP ANALYSki (Nozzle, Probe, Pilter and Hot Box Glassware)
(1) Filter L Particulates 4. SO6 2- (2 ) Filter Tare Weight a. 770 9*, UYI’ - 4 (31 Net Dry Particulates (1-2) @,3?5g ( 4 ) Particulates Caught i n = 35 3ni7’
Nozzle, Probe L Glaeeware (51 Total Front Catch ( 3 L 4 )
BACK-HRLF ANALYSIS (Impingem, Conneoting G~OSOWUS)”
(1) Part iaulate caught i n impinqua ova orated down at la88 t&4a 120 k ?. 29.0- I
U TOTAL PARTICULATE CATCH (Sua Of Pront ud &ok-Wf Catches)
7’bt 2 h q , . 1
i
i I
i I !
i .,
!
I I
I 1.- I . I I
1 l - I
i .. .
I !
I I I
1
,. .
..
O I t S A ' P A N A L Y S I S
( A v e . o f 3 Analyeee Each)
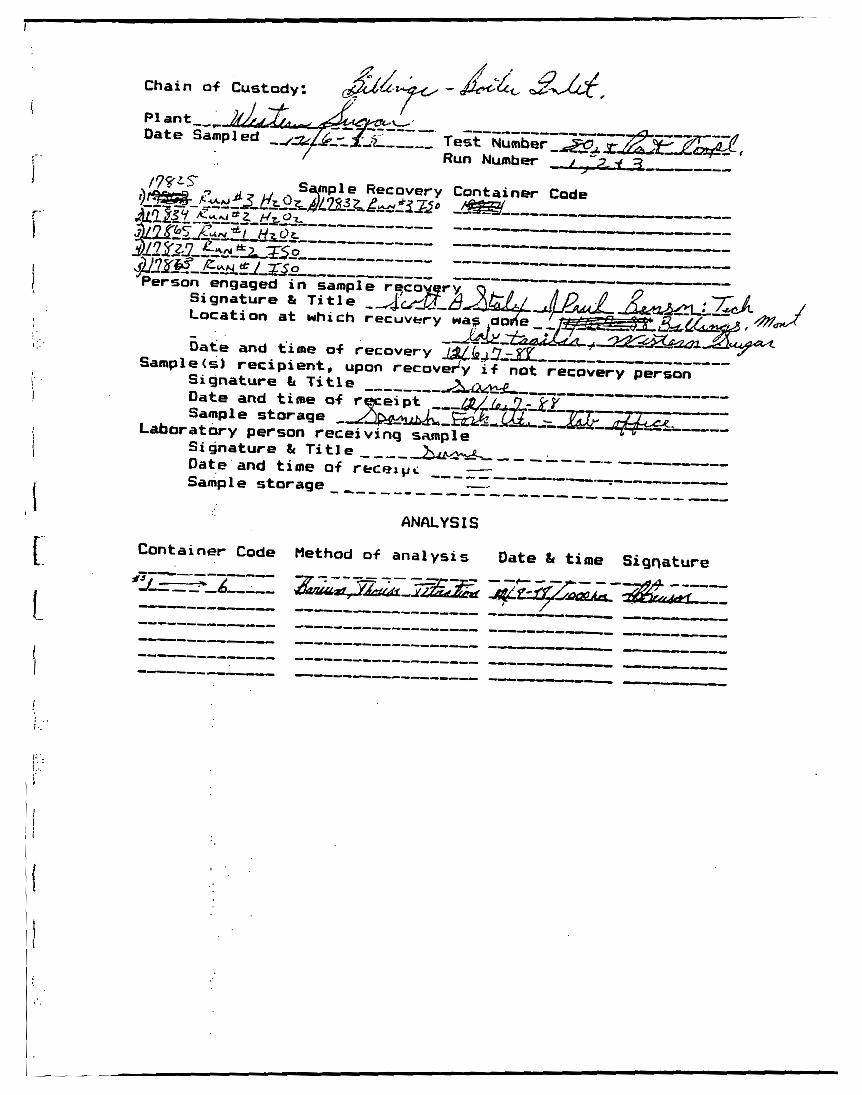
C h a i n o f C u s t o d y :
!
C o n t a i n e r Code
.. .
i
I
l- S I .. ...
! I
i
I 1. 1..
I
I i I
i , .
i:.:. 1
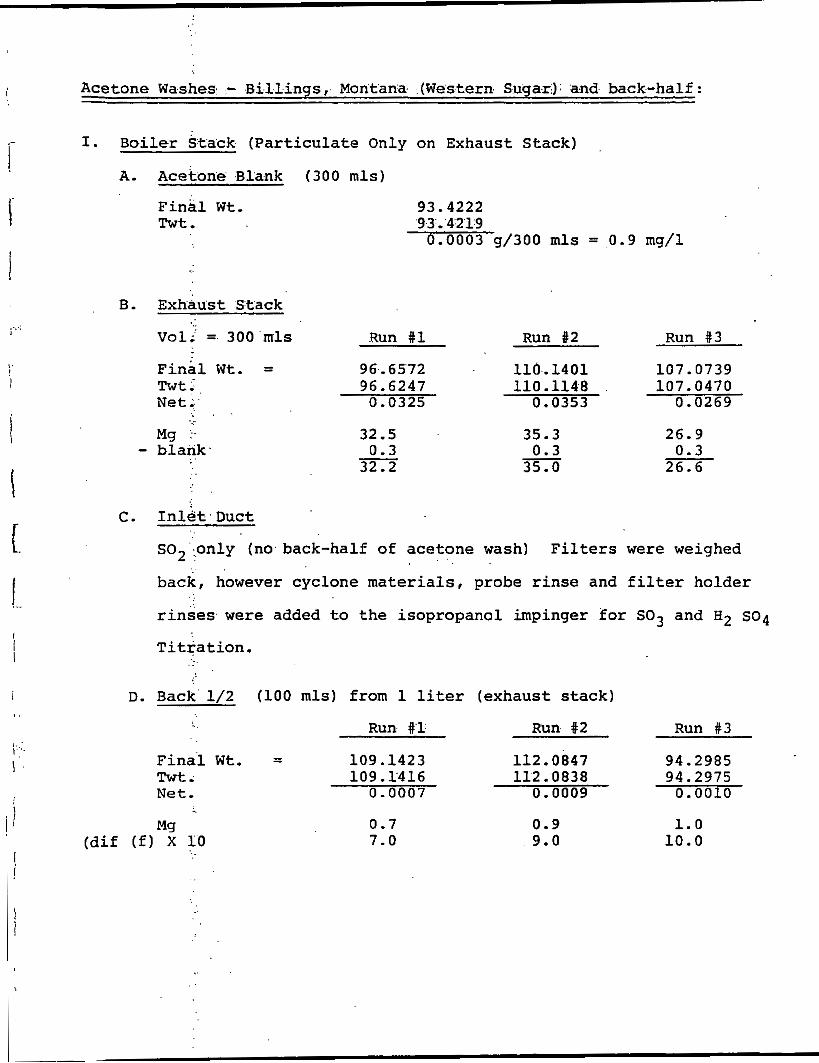
Acetone Washes - Billings, Montana (Western Sugar) and back-half: I. Boiler Stack (Particulate Only on Exhaust Stack)
A. Acetone Blank (300 m l s )
Final Wt. 9 3 . 4 2 2 2 Twt . 9 3 . 4 2 1 9
0 . 0 0 0 3 g /300 m l s = 0 . 9 mg/l
B. Exhaust Stack
Run #l Run 82 Run # 3 V o l ; = 300 mls
Final Wt. = 9 6 . 6 5 7 2 1 1 0 . 1 4 0 1 1 0 7 . 0 7 3 9 1 1 0 . 1 1 4 8 1 0 7 . 0 4 7 0 TWt . 9 6 . 6 2 4 7
Net- 0 . 0 3 2 5 0 . 0 3 5 3 0 . 0 2 6 9 -.
Mg >. - blank . .
3 2 . 5 0 . 3
3 2 . 2 -
3 5 . 3 0 . 3
3 5 . 0 -
2 6 . 9 0 . 3
2 6 . 6
C. 1nlet.Duct
SO2 only (no back-half of acetone wash) Filters were weighed
back, however cyclone materials, probe rinse and filter holder
rinses were added to the isopropanol impinger for SO3 and H2 SO4
Titration.
D. Back 1/2 (100 mls) from 1 liter (exhaust stack)
Run #1 Run 82 Run #3
1 0 9 . 1 4 2 3 1 1 2 . 0 8 4 7 9 4 . 2 9 8 5 Final Wt. - Twt . 1 0 9 . 1 4 1 6 1 1 2 . 0 8 3 8 9 4 . 2 9 7 5 Net. 0.0007 0 . 0 0 0 9 0.0010
-
0 . 7 7 . 0
0.9 1.0 9 . 0 1 0 . 0
!
i 3.
1 r: I !, .....
)
i
i I'
1.
1
\
I i
i
i.;. I
! i 1.
! i
I < .
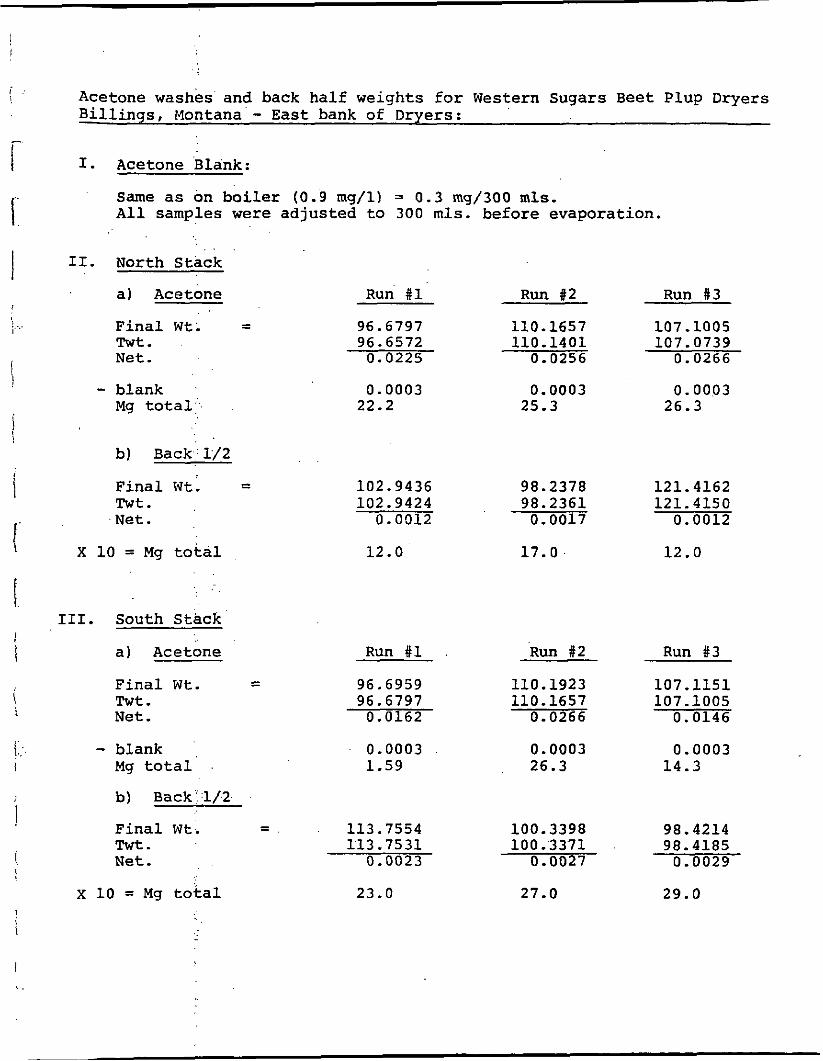
Acetone washes and back half weights fo r Western Sugars Beet Plup Dryers Billings, I4ontana - East bank of Dryers:
I. Acetone Blank:
Same as on boiler (0.9 mg/l) = 0.3 mg/300 mls. All samples were adjusted to 300 mls. before evaporation.
11. North Stack
a) Acetone
- Final Wt: - Twt . Net -
- blank Mg total
b) Back,:l/2
- Final Wt. - Twt * Net.
X 10 = Mg total
Run #1
96.6797 96.6572 0.0225
0.0003 22.2
102.9436 102.9424
0.0012
12.0
Run it2
110.1657 110.1401
0.0256
0.0003 25.3
98.2378 98.2361 0.0017
17.0
Run 83
107.1005 107.0739
0.0266
0.0003 26.3
121.4162 121.4150
0.0012
12.0
111. South Stack
a) Acetone Run #1 Run #2 Run #3
- Final Wt. - Twt . Net.
- blank Mg total
b) Back'l/2
96 6959 96.6797 0.0162
110.1923 107.1151 110.1657 107 - 1005
0.0266 0.0146
0.0003 0.0003 0.0003 1.59 26.3 14.3
Final Wt. - 113.7554 100.3398 98.4214 Twt. 113.7531 100.3371 98.4185 Net. 0.0023 0.0027 0.0029
-
x 10 = Mg total 23.0 27.0 29.0
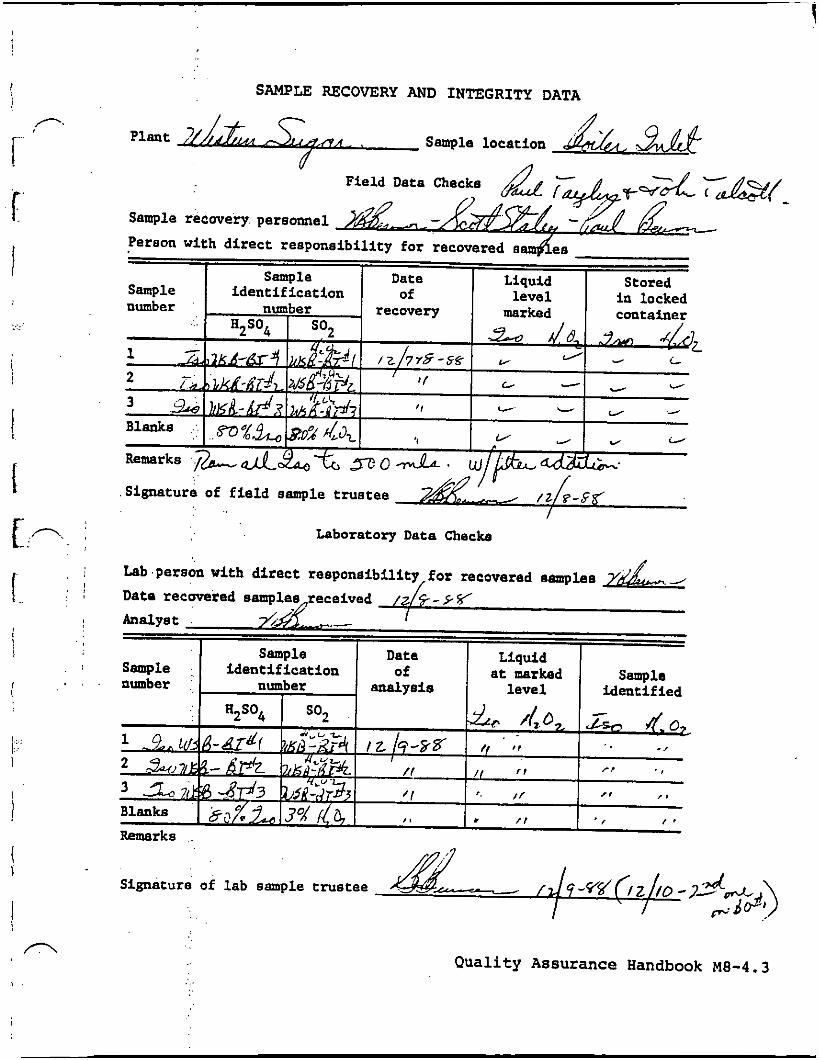
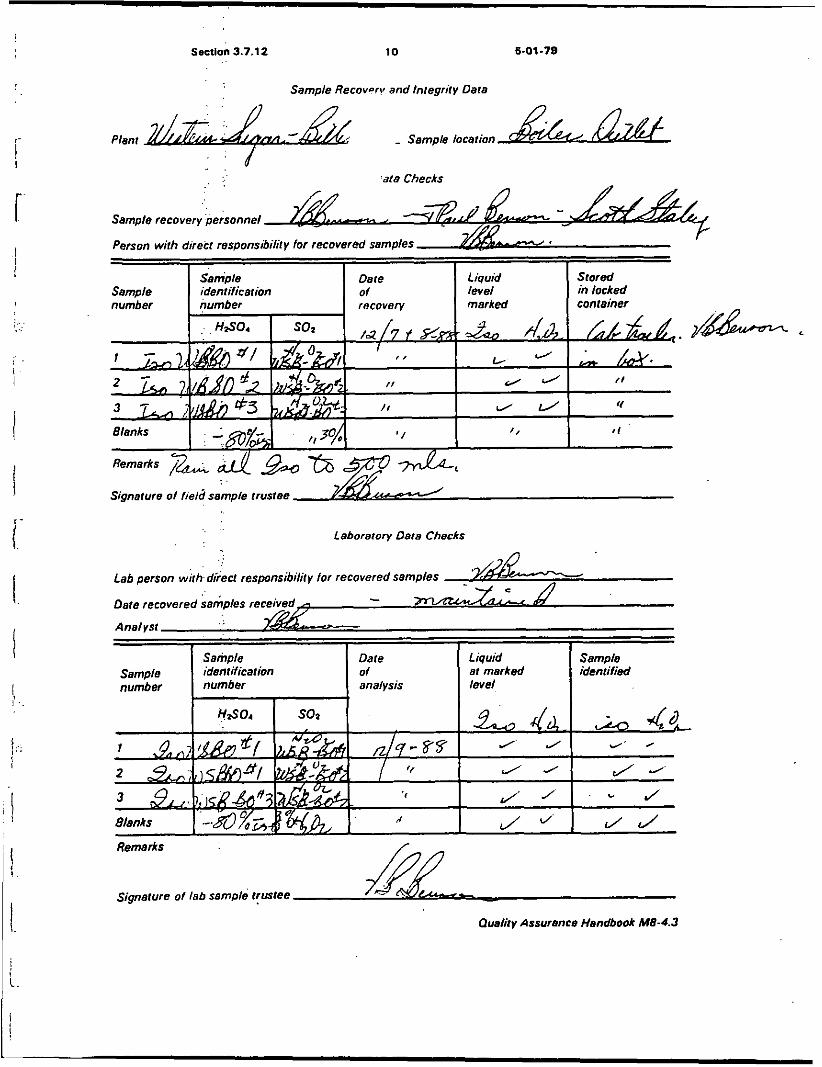
SAMPLE RECOVERY AND INTEGRITY DATA
A . Sample location Plant
U Field Data Checks
Sample recovery. personnel
Signatura of f ie ld eample trustee /2 8 - $ f /
Laboratory Data Checks '.
Lab.peraon with direct reaponei
Signature of lab sample trustee
Quality Assurance Handbook M8-4.3
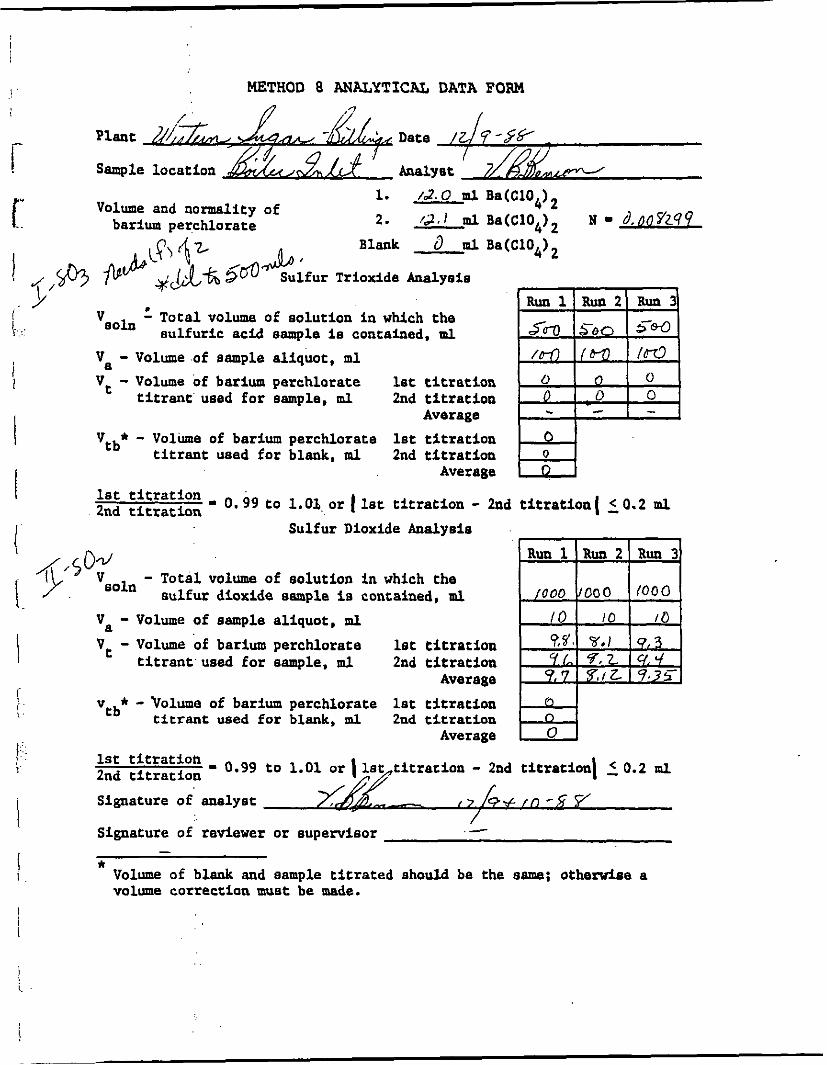
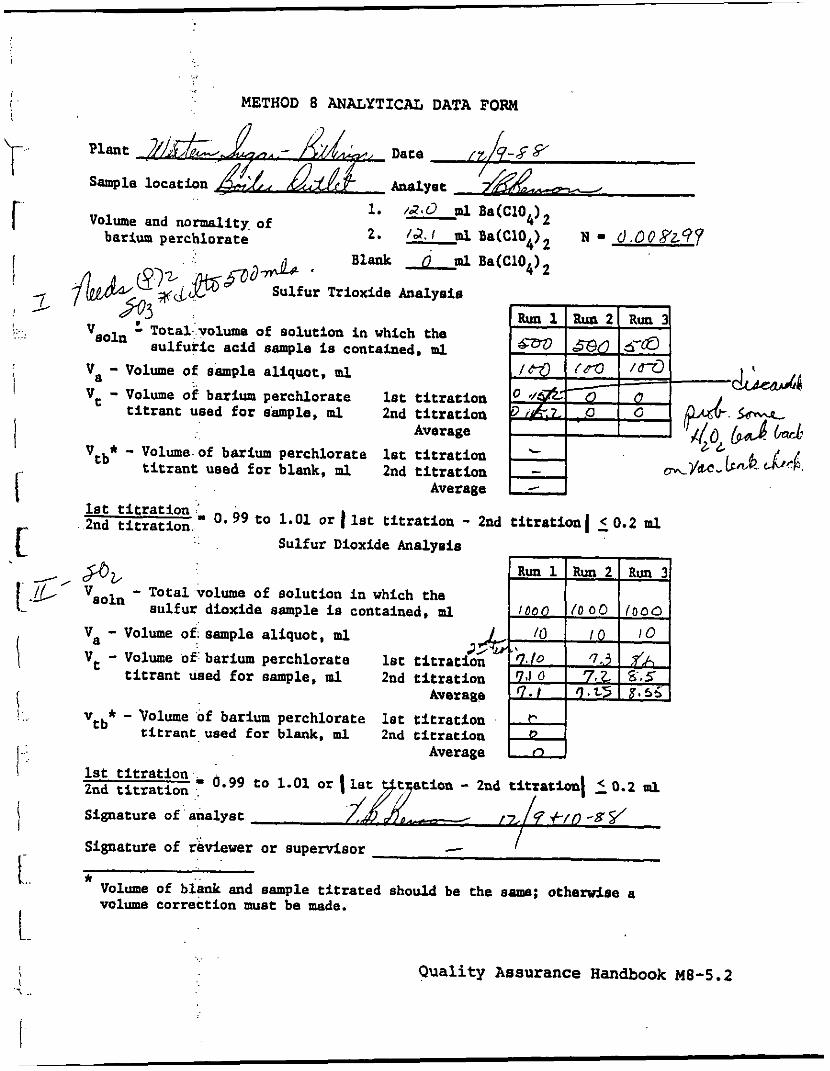
METHOD 8 ANALYTICAL DATA FORM
Plant Date /L. ? - g e -
Sample location Analyst
Volume and normality of barium perchlorate
1
. 12.0 ml Ba(C104)2
Blank d m l Ba(C104)2 2. #J,t m l Ba(C104)2 N - d,!OY249
Trioxide Analysis
I Total volume of solution in which the \ vso" sulfuric acid sample is contained. m l
Va - Volume of sample aliquot, ml
Vt - Volume of barium perchlorate i I let titration
2nd titration
1st titration Vtb* titrant used for blank, ml 2nd titration
Average
Ist titration - 0.99 to 1.01 or I 1st titration - 2nd titration1 (0.2 ml 2nd titration Sulfur Dioxide Analyeis
titrant used for sample. ml
- Volume of barium perchlorate Average I
I i 1
I
- Total volume of solution in which the Veoln
Va - Volume of sample aliquot, m l
Vt - Volume of barium perchlorate
aulfur dioxide sample is contained, m l
let titration titrant used for sample. m l 2nd titration
Average -Volume of barium perchlorate 1st titration
Vtb* titrant used for blank. ml 2nd titration Average
I I
lst titration - 0.99 to 1.0 titration - 2nd titration1 2 0.2 ml I
2nd titration
Signature of analyst - 1 7 ~ + / n % ,
Signature of reviewer or supervisor
1
/ 1
- * Volume of blank and sample titrated should be the sama; otherwise a volume correction must be made.
I I
I I I
1
j ' i
I' K 1 ... /
i , I I c: I.
I
j.'
I I
I
I: i
I
I
I
I .
L
1.
1.
I I !
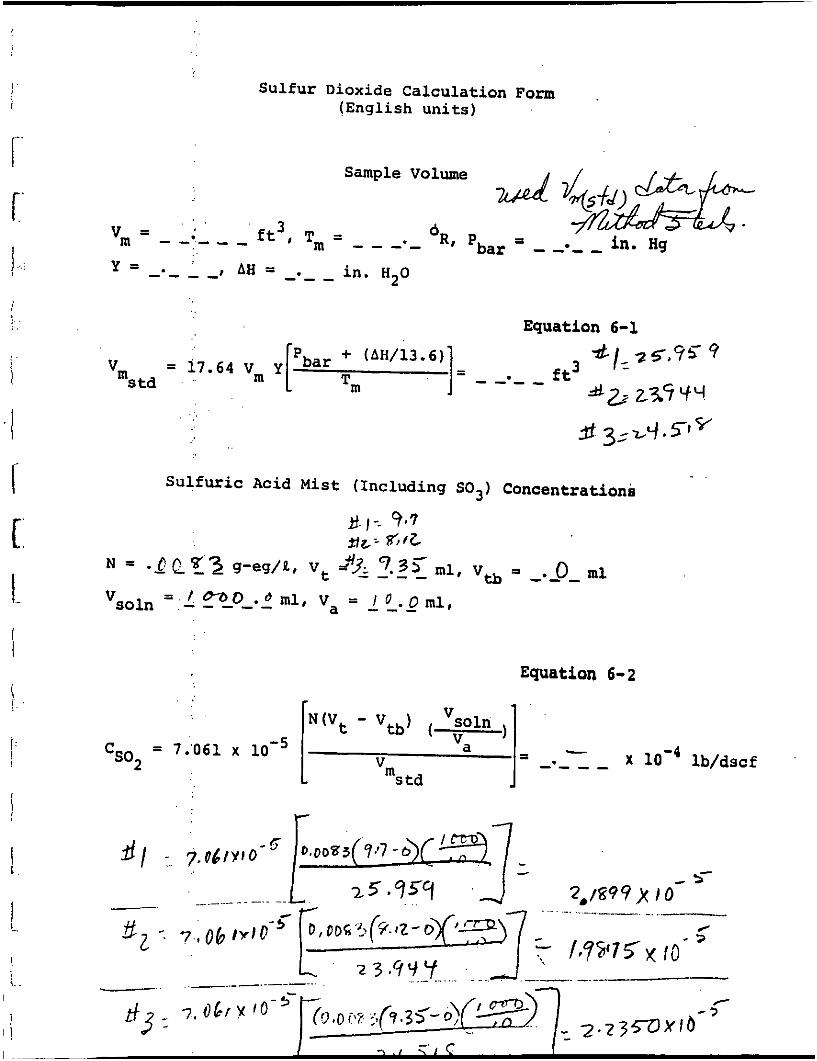
Sulfur Dioxide Calculation Form (English uni ts )
= 17 .64 vm Y s t d 'm
Sulfuric Acid M i s t (Including SOj) Concentrations
tf. \-- 9.7
Equation 6-2
3 . c X lb/dscf - - - -
r (I
Section 3.7.12 10 6-01-7s
Sample Recovorv and lnregriry Dale
Plant - Sample location
'at8 Checks
Sample recovery personnel
signature of fieid sampie rrustee
. .. Laboratory 0818 Checks
. . Lab person with. direcr responsibili~y for recovered samples
Dare recovered samples re
Remarks
Signature of lab sample tyStee
a ~ a l i f y AssuranC8 Handbook Ma-4.3
!
METHOD 8 ANALYTICAL DATA FORM I 1
7 !. 8:'. ,...
I'
Plant Date
Analyst /Z6d ml Ba(C104)?
Blank 0 m l Ba(C104)2
Volume and normality of barium perchlorate 2. - 1d.l ml Ba(C10Q2 N - Cl.ooh?qp
a d . Sulfur Trioxide Analysis
- Total volume of solution i n which the vsO1n s u l f u r i c acid sample is contained. m l
V8 - Volume of sample aliquot, ail
Vt - Volume of barium perchlorate l e t t i t r a t i o n 2nd t i t r a t i o n
Vrb* - Volume of barium perchlorata 1st t i t ra t ion 2nd titration
Average
t i t r a n t used f o r sample, ml Average
t i t r a n t used f o r blank, m l
lst titration - 0.99 t o 1.01 or I 1st t i t r a t i o n - 2nd titration1 5 0.2 ml F 2nd t i t r a t i o n
Sulfur Dioxide Analysis
- Total volume of solution i n which the 'I/ gL. i f I--- vsO1n
Va - Volume of sample al iquot , ml
Vt - Volume of barium perchlorate
su l fur dioxide sample is contained, ml
l e t t i trat t i t r a n t used f o r sample, ml
v * - Volume of barium perchlorate l e t t i t r a t i o n tb t i t r a n t used f o r blank, m l 2nd t l t r a t l o n
I I
lSt 2nd t i t r a t i o n - 0.99 t o 1.01 or I
i Signature of analyst f 7, I
2nd t i t r a t ion1 2 0.2 ml I I
I Signature of reviewer o r supervisor - *
Volume of blank and sample t i t r a t e d should be t h e same; otherwise a volume correction must be made.
I. I .- , ..
Quality Assurance Handbook M8-5.2
I
!
1~~ I
I ' I I , I..: L ..
. .
I ' '
'I I c 1. ! I
I
~i I '
, 1 '
t:' / ..
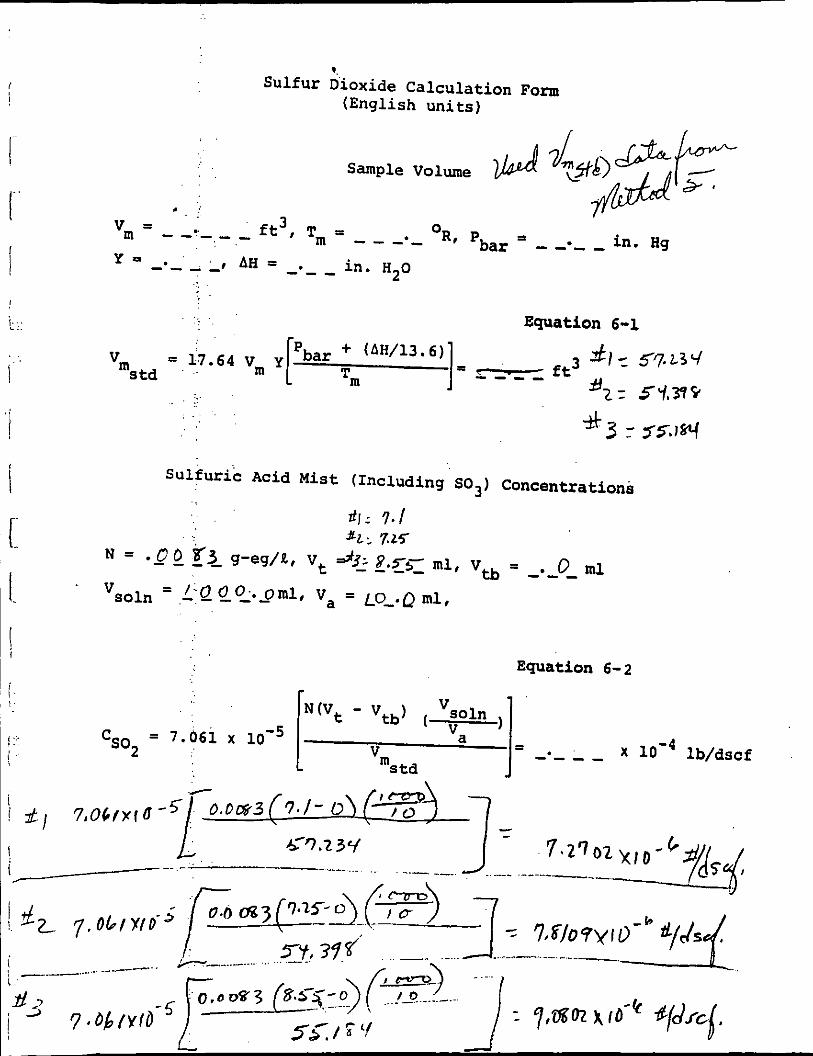
9. Sulfur D'ioxide Calculation Fom
(English un i t s )
Equation 6-1
fc3 I55Jkrl
Sulfuric A c i d M i s t (Including SO3) Concentrationi
Equation 6-2 1'". - 'tb) ( 7 1 'soln = 7 . 0 6 1 x a f . X lb/dscf
csoz - - - - vrn s t d
AI'I'LNDIX "C" . u
. .
section 3.12.10 6 April 1983
COMMENIS
I HAVE RECEIVED A COPY OF THESE OPACIW OBSERVATIONS SIGNAIUflE 11 I L E DA IE
Sourcq Layour Sketch Draw North Arrow
0 X Emission Point
J 06SERVERS SIGNAIURE DATE
ORGANIZA IlON
OA I€ CERTIFIED BY
VERIFIED BY DA IE
\
Sun Locmon Line
m a 0
TJ u 0 u QI a
0)
Lc m c
2 0 E .: 3: o u
-4 n
8 U w E 0 .A U 0
n
Q Lc 4
U
!i Q v) n 0 w 0
u b, X
!
U nl
?I a! ln
0
w 0
4J 0 1:
n
k W a m k P I - u ua m - a h 0 PI v 1 r l a 2 0 E 0-
5 a n PI H H * a, n u a CI ntn v1 c zm
"PI o u U h
PI N >
3 x o w
a r l u 1
i, i !
I ! !
I i r
I..
I
E I I I
I i
i I
i
2..
1.;. \
e 0 .4 .u m
. . :.
! !'
i
I 1 I
i I i I
i
I ' I I I I.
I. i :
i I
III 0, 0
W 0
E 0 4 .u c m
i i
r I I..:
i i. S I-
1. :
I
I
I
! .
/I:::
S L.
! j
I i
I I I
rl
7 VI ..( 3 Iu 0 Tl u 0 0 PI a
m
2 H & 5c V 0 A U
.PI a 8 I;(
W
U n4
z 0) bl n 0 w 0
U m z
2 0 U
a z 3
W X V
2
2
a 0) PI
In a 6 w x 5 5 & E c
*4 p 3
aJ i a .-I ln
aJ U c m 4.J bl .-I a
2 0 H
0 2 !2 H
e: w X E 0
STATE OF UTAH DIVISION OF ENVIRONMENTAL HEALTH
rhts DLIIIIII*, l".,, .. m4-r mism . .. ._
. .
i i
1.
r I
i
i I I.. 1.; I F 6 L I I. 1:;
i I. L I :.I I
I .
. . . .
. ..
. .
..:
...
. . . .
. .
. . . .
AI’I’KNIJI X “D”.
(E.lisccl1iliieous Data).
1% ...
Pitot Tube (Cp) 0. 85/25 Stack Dimensions 72 'h /!fq't- 96 ''&/A I /
= 72p. Z X S
i n . "20 O F reference a null A P 55%
i ! Velocity .Cyclonic flow determination
b P 1, Stack temp., ~p~ a t 0' which y i e l d s Traverse head Angle (6 )
I.. I.. 1 i I:.: j
I I... I.. j
I a Average of'= must be t?D degrees to be acceptable
METHOD 2 CYCLONIC FLOW DETERMINATION DATA FORM
. . :
!
!
i
1
i'
1' 1 i
i
i
i I
I I
METHOD 2 CYCLONIC FLOW DETERMINATION DATA FORM
Run No.
. Operator /&-+dZBA A-& -77. Amb. Temp. OF bo 7 S t a t i c Press.("HZO) f O . 0 1
P i t o t Tube (Cp) 0. g+-(z 6'b S t a c k Dimensions
which y i e l d s
Velocity Traverse head
p o i n t (AP 1, S t a c k temp. , number i n . B,o "F
...
-
I 2 1 I I I I 3 I I I
I I I 4 1 I
5 I
503
L a s . CAUSTIC. BOILER N A G 0 7 5 6
1 2 I I I I i
I 5 I I I I 1
I i i
z l I I I I I 3 1 I I I I 3 I
4 1 I I I 4 1 I I I
5
L a s . CAUSTIC, BOILER NALCO 756 NALCO 756
L B S . CAUSflC: BOILER
so; so3
. .
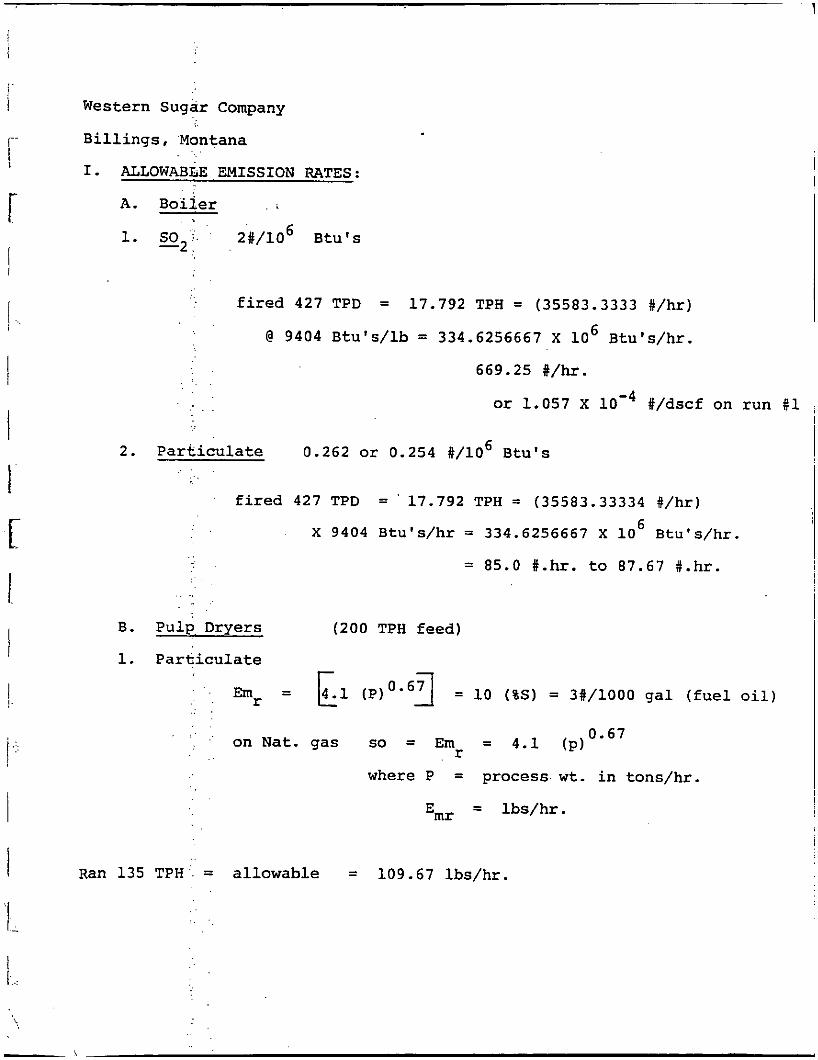
Western Sugar Company
B i l l i n g s , Montana
I. ALLOWABLE EMISSION RATES:
A. Boiier
1. so ' 2#/106 Btu ' s -2
f i red 427 TPD = 17.792 TPH = (35583.3333 #/hr )
@ 9404 B t u ' s / l b = 334.6256667 X lo6 Btu ' s /hr .
669.25 #/hr.
or 1.057 X #/dsc€ on run $1
2. Part iculate 0.262 o r 0.254 #/lo6 Btu ' s . .
f i red 427 TPD = '17.792 TPH = (35583.33334 # /h r )
x 9404 Btu ' s /h r = 334.6256667 X lo6 Btu ' s /h r
. . = 85.0 #.hr . t o 87.67 #.hr .
. . .. - .
B. Pulp, Dryers ( 2 0 0 TPH feed)
1. P a r i i i c u l a t e
= L1 ( P ) O e 6 I = 10 (%SI = 3#/1000 g a l ( f u e l oil) .. .:, '.. . mr . .
. : . 0.67 = 4 . 1 (p ) Emr ,. ' on N a t . gas so =
where P = process .wt . i n tons /hr .
= l b s / h r .
Ran 135 T P H . = a l lowab le = 109.67 l b s /h r .
I I
I. i- I i 1. i ' i I ! i
I I
I . I .
\
! . ( 1 : .
I i I
I ..
_. , 2 JOB d h r i c n n &viwn-tat Tuting a.
565 South Elrch Drive SWEET no. OF
CALCULAlED BV DATE Spanish Fork, Utah 84660
(801) 266-71 11
SCALE
. . . . : ! t . . , . ,
. . . . . . . . . . . . . . . . . . . . . . . . . . . . . . . . . .
~
: I : , . / : : I i ? "
; ! , , . .
! i
....... . .
............ .................................. ..........
, , . i > : : . .
. . . i , . . . .
. :
. . . .
' . >
i i ..! ! , , : , ,
I : / :
. . : . . . ..:.. . . . . . ;.. . . . . . 1 . . . . : ,
. .
. . . . . :. ,
. . . . . . . . . ~ . . . . . . . . . . . . . . . . . . . ................. . . . . .
i . , . . . . . . :
,...
, . . . . , . . . . . . . . . . . . . . . . . . . . . . . . . . . . . . . . . :. . . . . . . . . . . . . . . . . . . . .
. . ,
. .
. . . . . . . :, . . . . . . . I ......... : .....
: ......................................... . . . . . . . . . . . . . . . . . . . . . . . . . . ....... . .
~ ..l
,. ............. .................................. . . . . :'/ ... : ...
~ : / ; :~ :. . .
: / : I
: . : : ~...< jbZ4.4 A: @,,.=... j&.l j .L . I ~ ~
I . . . . . . . .
. . : : . .
. . . . . . . . . . . . . . . . . . . . . . i .
, : . . . . . . . . , ... ..., . . . . . . . . . . . . . . . . . . . . . . . .
. . . . . . . . . . . . . . . . . . . . . . . . .
............. , ................................. : . : . . . . . . . : : . . ... ..:. ........................
: : . .
.......................................... , .:../..;... . . j .... . i . ..... T.. . j 1 . . : . ...: . . i. . . I . . .T ................. ....... ~ ........ I ......... ....... I ....... 1 .......... :. ......... . . . . . 1 . : . .
, . : . . . i . . . : , . . : ,
............. .................. ......... . . . . . . . . . . . . . . . . . . . . . . . . . . . . . . . . . . . . . . . . . . . . . . . . . . . . . . . . . . . . . . . . . . . . . . . . . . . . . . . . . . . . . . . . . . . ;-. . . . . . . . : . . . . . .
i .
: : : / . . , . ' . . . ,
. . . . . . . . . . ...................... , . . . . . . ,#e . - .... ,..32r'o: . Y d t . ; . . ...... ; ........ ~ ............... .i ........ ~ ........... : ......... : :. .:... j . I. .; .2,;y.// : . . ......
/ I
. . . . . . . .
! : . . i
......................... ................... ............. . . . . . . . . . . . . . . . . . . . . . . . . . . . . . . . . . . . . . . . ............................ i . . . . : :
. . . . , . , . I /
. . / / I . . . . . . . . . . . . .
: : . . . . . . . . . i . , . . : : . , . .
. . . .
. . .
- . . : . : . : / . .
~ # . . . . : .
. . : , t
i i ,
: i , i
. . . . . .
i . . . : ! i j
: I : ' b ! . . , :
. . . . . . . . . . . . . . . . . . . . ................. . . . . . . . . . . . . . . . . . . . . . . . . . . . ............... .............. ... . ....... ...l. .i ~. .
. , ' : . . i . ,
. . . . . . : , . . : . . . . : * / ; :
. . . . : . , i . . . - : . .
. . . . . .
.............................................. . .
. . . . .
! . '
/ . . . . . . . . . . . . . .
i ; . . ! . .
: , . : . a : : : : . : . .
. . : / :
. . . . ...... .............................................. . . . . . . . . . -, ............ .- . . . . . . . . . . . . ..................... ^
:
. . i
. . ~ . . . . . . . . . . . . . . . . . . . . . . . . . . . . . . . . . . . . . . . ..,... .. . . . . . . . . . . . . . . . . . . . . . . . . . . . . . . . . . . . . . . . . . . . . . . . . . . . . . .
. . . . . . . . . . . . . . ...