Aona Yang measurement model for Honda CM724
220
Students Purchasing Intention for Automobile A Measurement Model for Honda Civic Aona Yang Boston University
Transcript of Aona Yang measurement model for Honda CM724

Students Purchasing Intention for Automobile
A Measurement Model for Honda Civic
Aona Yang
Boston University

CONTENT
I. INTRODUCTION...........................................................................................................................2
II. BACKGROUND RESEARCH......................................................................................................3The Client.....................................................................................................................................................3The Industry and Competitors....................................................................................................................6
III. LITERATURE REVIEW..........................................................................................................11External factors........................................................................................................................................12Internal Factors........................................................................................................................................24
IV. PROPOSED PREDICTORS FROM THE LITERATURE.......................................................30
V. THEORETICAL FRAMEWORK...............................................................................................37
VI. PROPOSED PREDICTORS WITHIN THE THEORY OF PLANNED BEHAVIOR...............40
VII. SELECTED PROPOSED PREDICTORS...............................................................................44
VIII. DEVELOPMENT OF MEASURES.......................................................................................47Multiple-item measures...........................................................................................................................50Single-item measures................................................................................................................................61
IX. DEVELOPMENT OF SURVEY INSTRUMENTS....................................................................65
X. DATA COLLECTION & ANALYSIS OF MEASURES............................................................73Step 1: Quantitative Pre-test...................................................................................................................73Step 2: Analysis of Content Validity and Reliability.............................................................................75
XI. REVISION OF SURVEY & CONCLUSIONS..........................................................................89
XII. REFERENCE...........................................................................................................................91
Appendix I. Final Survey Questionnaire.....................................................................................99
Appendix II. Coded Survey Questionnaire................................................................................105
Appendix III. Frequency Distribution.......................................................................................111
Appendix IV. Inter-item Correlation Matrix............................................................................139
Appendix V. Final Factor Analysis............................................................................................148
1

I. INTRODUCTION
Young people’s purchasing power for automobile has been significantly addressed these
years. However, according to IHS.inc (2013), young adults aged from 18 to 34 accounted for
30% less of new cars purchase in 2011, compared to sales from 2007 (IHC.inc, 2013). Experts
indicate that although Generation Y’s need for cars still exists, yet due to the tough job market
and the recovering economy, the young generation is becoming more “cautious” when seeking
out a new car (Driscoll, 2013). Honda Civic, a popular compact car line manufactured by Honda,
steps into the 43rd year of development in 2015(Honda, 2015). As a car model that mainly targets
on young market, Honda seeks to expand its customer base of college students, as well as find
out college students’ specific requirements for a new set of wheels, as a potential buyer group.
In this study, I will examine the following research question: what factors contribute to
college students’ purchase decisions of choosing a particular compact car model, as they are
exposed to such a competitive compact cars market and facing alternative choices. A
questionnaire survey will be submitted among students in Boston University, which tests how
certain variables influence the likelihood that college students choose the car model of Honda
Civic rather then other makes. Proposed predictors are adopted from previous studies pertaining
to college students’ purchasing behavior, certain automobile attributes and other latent factors.
Using quantitative research methods, this study will allow us to find whether the constructed
measurements are effective enough to capture particular beliefs and attitudes that college
students adopt, that may consequently affect their intention of purchasing automobiles.
2

II. BACKGROUND RESEARCH
The Client
Since its debut in 1972, the Honda Civic, a line of compact cars, has gone through 9 times
updates and revolution (Honda, 2015).
In 1974, Honda complemented the original two-door and three-door models of Civic
(introduced in 1972) and the 1973 style Honda CVCC together as the “sporty Honda Civic RS”
(Honda, 2015). Awarded as several “car of the year” from Europe, Japan and United States, the
first generation of Honda Civic gained an initial popularity worldwide.
During the early 1980’s, The Civic gradually gave up the style of two-door sedan, and
instead replaced it with a considerably increased dimension – 88.6 inches wheelbase for the
hatchback model and 91.3 inches for the wagon variant model (Punia, 2014). Meanwhile, all
Civic variants adopted the new CVCC engine, and the motor “came in two displacements,
namely 1,335cc which delivered 55hp of power, and 1,488cc that produced 67hp” separately
(Punia, 2014).
The fourth generation of the Civic upgraded its standard engine into a 5 variations 16-value
engine, in order to achieve greater efficiency and exceed higher speed (Honda, 2015). Along
with the fourth model, in 1991, Honda released fifth generation of the Civic line, with a
“futuristic aerodynamic form” and “flexible interior space”, mainly targeted on the young buyers
(Honda Worldwide, 2015).
The next generations of the Civic variants were dedicated to satisfy stronger demand in
increasing fuel efficiency. With the releasing of Honda Multimatic - “a new high-output,
3

continuously variable automatic transmission” (Honda,2015) – in 1995, the Civic variants
received “Car of Japan” two times separately in 1995 and 1996 (Honda,2015).
Ever since 2000, the Honda Civic continued its modern change. For the eighth generation,
Honda made two different platforms respectively for sedan /coupe, and for a hatchback designed
primarily for the European market. Because of this redesign, the Civic received another “Car of
the Year” honor in United States (Collier, 2006). The Civic line became the central of Honda’s
worldwide success. Until 2006, Honda has sold 16.5 million Civics worldwide (Collier, 2006).
The latest generation of the Honda Civic was first showed in 2011at the 2011 North
America International Auto Show. At the meantime, Honda is dedicated to add its new Eco
Assist technology to most models, building on its emphasis on small, fuel-efficient vehicles
(Green Car Congress, 2011). The Honda Eco Assist is an ecological drive assist system which
allows drivers to “maintain a fuel-efficient driving style” (Green Car Congress, 2011).
According to Green Car Congress, the Eco Assist system could effectively improve improved
their fuel economy on average by 10%, up to a maximum of 20%, after 300 drives (Green Car
Congress 2010).
In 2010, Honda Civic ended its production in Japan, as it no longer complied with the
Japanese Government dimension, as well as a nationwide reduction of consumers. Nevertheless,
the export market of Honda Civic and Civic Hybrid is still boosting (Takahashi, 2010).
For the safety part, according to the National Highway Traffic Safety Administration
(NHTSA) ‘s database of Honda Civics frontal crushing tests for different models, the eighth
generation Civic variants (both sedan and coupe) received a perfect 5-star (J.D Power, 2009).
4

Besides, the ninth generation also got a 5-star rating from frontal drivers in 2012, and another
two 5-star achievements rated respectively by side driver passengers and side rear passengers.
5
The Industry and Competitors
According to US.News’ annual ranking of 2015 best affordable compact cars, the top 6 car
models are Mazda3 by Mazda, Golf by Volkswagen, Civic by Honda, Soul by Kia, Cruze by
Chevrolet, and Focus by Ford. Mazda Mazda3 and Volkswagen Golf are tied for the first place,
with an average score of 8.8. Chevrolet Cruze and Ford Focus are tied for the fifth place
(U.S.News, 2015).
For the top three car models (Mazda Mazda3, Volkswagen Golf and Honda Civic), the
average prices are $18,051, $21,230, $18,765 respectively (U.S.News, 2015). For Mazda3, the
ranking shows that the most obvious advantage is the nimble handling and premium interior
quality. However, the model has a small cargo space in sedan that bellows the average standard
(U.S.News, 2015). By contrast, the Volkswagen golf and Honda Civic have better space
satisfaction. Besides, both three models show satisfactory performance on excellent fuel
efficiency.
Mazda Mazda3
Mazda3, also known as Mazda Axela in Japan, was first introduced in 2003. In October
2008, Mazda released the second generation of Mazda Alexa sedan at Los Angeles Auto Show
and the hatchback at the Bologna Auto Show.
In 2011, the updated version of the second generation of Mazda Axela was released in
Japan, and introduced in export market in the following year. This new facilitated Mazda3 was
the manufacturer’s first vehicle that installed their newly developed SkyActic technology, which 6

featured a SKYACTIV-G 2.0 that direct injects gasoline engine, and a SKYACTIV-DRIVE auto
transmission (Mazda, 2011). In addition, the new SkyActic tech also enabled a more enjoyable
driving experience, with a featured equipment of Mazda’s intelligent-Drive Master display. The
display ensured a smooth control of the vehicle, as well as useful hints to reduce fuel
consumption (Mazda, 2011). Taking all the new features into count, the newly facilitated 2nd
generation of Mazda3 indicated 4 advantages: “higher-quality design”, “predictable and
responsive handling”, “outstanding environmental performance”, as well as “enhanced safety
features”, according to Mazda’s official news release (Mazda, 2011).
The current redesigned Mazda3 generation was introduced in 2013 as a 2014 model
(Edmunds, 2015). New technology in terms of fuel economy and interior quality were featured
to the new model. Mazda stated that the new structure had a 30-percent improvement in torsional
rigidity, but curb weight reduced 60 to 100 pounds depending on trim level (Quiroga, 2013). A
review report of 2014 Mazda3 from CarandDriver.com said that although significant
dimensional changes had been made, you would realize the handsome and elegant model
appearance rather than these inches of differences when you first saw the new model (Quiroga,
2013). According to the latest review by Edmunds.com, the new generation of the model has a
better performance in quick accelerate. The new generation comes with two body styles, a sedan
and a hatchback, and both styles are available in 3i and 3s trims levels. For the United States
market, four model grades are available respectively as SV (2.0 Sedan), Sport (both Sedan and
Hatchback), Touring and Grand Touring (U.S.News, 2015).
According to road test adjusting by Edmunds.com, both 2.0-liter engine and 2.5-liter engine
did a goo job (Edmunds, 2015). It stated that both engines provide a quicker-above-average
7

acceleration performance, while the 2.5L engine only causes a “minimal drop in fuel economy”
(Edmunds, 2015).
Talking about sales, according to Automotive News, since August 2013, Mazda3’s sales
have fallen every month (Beene, 2014). Critiques claimed that the biggest reason for this sales
fall might be that Mazda didn’t offer the incentives that its competitors did. According to
AutoBlog.com reporter Bruce, “With the previous generation, the company offered more than
$2,700 on the hood to move them out, but the current model only carries about $1,233 in
markdowns” (Bruce, 2014).
Volkswagen Golf
The Volkswagen Golf, the second of most popular compact cars ranked by U.S.News, was
firstly introduced in 1974 by German automobile manufacturer Volkswagen. Through out its
history, most models of the Volkswagen Golf are in hatchback style. It leads the hatchback cars’
genre for years. The first generation of the Golf sold out one million within three years since its
debut. Thirty years later, the golf model has became one of the world’s best selling-model with a
built of 25 million (Kent, 2007). The Volkswagen golf won the World Car of the Year in 2009
with the Golf Mk6 model and in 2013 with the Mk7 model (Car of The Year, 2015).
According to retrieved data, most of the Golf’s models are manufactured in Germany. In
1974, Volkswagen presented the first generation of Golf as Golf Mk1, also known as
Volkswagen Rabbit in the United States market. Before, the Volkswagen’s best selling model as
well as the brand’s iconic product was the Beetle. Other models that were considered as the
8

Beetle’s competitors didn’t even reach close to its production figures (Edmunds, 2006).
However, instead of using a “curved metal that defined the Beetle’s appearance, the Golf model
adopted a “sharply creased lines”. In addition, in place of the Beetle’s two-door style, the Golf
was featured with two or four-door design with a large space cargo in the back because of its
hatchback nature (Edmunds, 2006).
In 1985, the second generation Golf Mk2 was released with a slightly grow in wheelbase
and both interior and exterior dimensions. The old name of the former generation of Golf sold in
United States - “Rabbit” was replaced by “Golf”. In 1987, the introduction of the new GTI
carried a new “DOHC, 16-value of the 1.8-liter four” power boost (Edmunds, 2006). For the next
couple of generations, the Golf and Golf GTI adopted other features changes in terms of
dimension and engine level-ups. In the year of 2006, the fifth generation golf was significantly
updated. The wheelbase stretches to 101.5 and the power base was upgraded to a new “2.5-liter
inline fibe-cylinder engine” (Edmunds 2006). Currently, the new seventh-generation of golf was
debuted in late 2012 at the Paris Motor Show (BBCTopGear, 2012). The Golf line comes with
all relevant driving systems, including gas-powered, diesel-powered, compressed natural gas-
powered, electricity-powered, and hybrid-powered.
In 2013, the Volkswagen Golf won the European Car of the Year award for the second time
(Volkswagen, 2013), as well as the World Car of the Year award (Ewing, 2013).
Kia Soul, Chevrolet Cruze and Ford Focus
9

According to 2015 Best Compact Cars ranking by U.S.News, the Kia Soul, Chevrolet Cruze
and Ford Focus were ranked from 4th to 6th (U.S.News, 2015). Besides, the 2015 Kia Sould also
ranked the 5th place in Best Affordable Small Cars ranking, in which the 2015 Honda Civic
ranked the 4th place (U.S.News, 2015).
According to the comparison chart, the three car models’ average prices are respectively
$16,206, $18,443, and $17,736. As for pros and cons, three models have different features. Both
Kia Soul and Chevrolet Cruze are named for their spacious cargo space. Kia Soul also featured
with “first-rate cabin materials”, whereas the Chevrolet Cruze is praised for its good ride and
handling balance. However, the common downside shared by these two models is the low fuel
economy for the class. As for the Ford Focus, the agile handling is known as its pros, while the
“small back seat space” and “unrefined automated manual transmission” are seen as its most
obvious downsides.
In terms of sales, CNNMoney reported that in the year of 2012, the Ford Focus total sales
reached to 1,020,410 cars globally, followed by Toyota Corolla, with 872,774 cars sold in 2012
(CNNMoney, 2013). As for the Chevrolet Cruze, China and U.S. markets are the two leading
markets that generates two thirds of all Cruze sales worldwide. Till 2014, GM(the manufacturer
of Chevrolet Cruze) has sold 1.13 million models in China and 900,000 in the U.S..
10

III. LITERATURE REVIEW
The previous section of this report has introduced the industry of current compact cars
manufacturing, the client’s developed history as well as several major competitors of Honda
Civic. The ultimate goal of this conducted research is to find out that as potential buyers, what
factors contribute to college students’ purchase decisions of choosing a particular compact car
model, as they are exposed to such a competitive compact cars market and facing alternative
choices.
Based on the understanding we’ve gained through former studies of the client, the
competitors and the industry, we will now review the literatures that are related to the topic, from
both business area and academia, to further understand the relationship between certain possible
variables and college students’ car selection. When searching literatures in BU library databases,
I typed in key words such as “automobile purchase”, “college students”, “driving behavior”, etc.
All of the literatures used in this research study are focusing on potential predictors and
factors that might affect college students’ purchasing behavior. Through the review and
evaluation of previous scholars’ research, I found a large amount of factors that could possibly
influence a college student’s car purchasing behavior. I integrated the past scholars’ work and
divided perceived variables into two primary categories: external factors and internal factors.
Within the category of “external factors”, obtained variables are divided into five subordinate
categories, which are: the people factor, the automobile features factor, the brand factor, the
online advertising factor and the public transportation factor, respectively. Whereas within the
category of “internal factors”, selected variables are more individual-centralized and human-
11

related. Those variables are divided four subordinate categories which are: the factor of
individuals’ psychological valuations, the factor of personal interests (in automobile or
enthusiasm in driving), the factor of demographic features, and the factor of Intended time-frame
for driving licensure (Sigurdadottir, Kaplan & Møller, 2014).
External factors
(1) The factor of people
The most apparent variable contained in this category is peer influence. A Study by Kyoto
University in 2013 focuses on peer’s influence on students’ car purchasing behaviors in
Bandung, an Indonesian city. The study indicates that in Indonesia, almost all the cities don't
have an advanced public transportation system besides the capital city Jakarta. Somehow the
lack of mass transportation development affected the significant increase of motorized vehicles
ownership in Indonesia (Belgiawan, Schmöcker, & Fujii, 2013).
Through review of previous studies, researches find a considerable amount of evidences to
back up their studies of peer influence’ importance towards car ownership in an “Indonesian
context” (Belgiawan et al., 2013). In addition, the researchers also aim to find out which group
of people might be affected by this peer influence most. The three hypotheses they formulate are:
1. The lower satisfaction people have with their current car, the higher the peer influence
appears; 2. The perceived regret has a positive correlation with the group influence (Belgiawan
et al., 2013); and 3. The more the group influence appears, the higher desire an individual may
feel to purchase a different car.
12

Researchers conduct a survey targets on 500 students (282 male and 218 female) age from
17-23 at Bandung Institute of Technology, who are considered to share various background.
Among which, 134 are valid respondents (students who have at least a car). The questionnaires
measurements are given on a 7-point scale. According to data analysis, the study finds a high
value of parents’ and siblings’ influence on students’ car purchasing behavior, which means
parents’ and siblings’ suggestions and advice might be valued a lot when students want to buy a
new car. Besides, the study finds a significant correlation between the level of satisfaction with
parents/siblings, which may imply that parents’ or siblings’ advice are accordance with students’
real need (Belgiwan et al., 2013). However, the study doesn’t confirm a significant relationship
between the level of satisfaction and the desire to buy a new car, as well as the peer influence in
students’ car upgrading desire.
(2) The factor of automobile features
Existing literatures have found that about three auto vehicle features might have impacts on
individuals’ choice of certain car models – Price (including overall price, insurance and extra
spend); fuel-efficiency; as well as safety and reliability).
An online survey conducted by auto insurance company the Progressive Group of Insurance
Companies (Business Wire, 2006) studied the how likely would the variable of price influence
consumers buying behaviors. The survey required participants to research new cars on a leading
vehicle valuation website - N.A.D.A. Appraisal Guides. The result indicates that most people
still regard the overall purchase price as the most important factor when they need to buy a new
car. The following factors are Make and Model, as well as Safety and Performance (Business 13

Wire, 2006). The result also shows that although consumers are aware of purchase price, they
usually ignore the other two important and valuable factors that related to price. The first one is
fuel factor, which is “how much it will cost to keep the fuel tank full” (Business Wire, 2006).
The other factor is the insurance factor since insurance usually “can be a significant cost of
owning and operating a vehicle” (Business Wire, 2006). The study concludes that even the most
savvy shopper may not be aware of the money they should pay for using and operating the car
other than the car purchase fee.
Another variable that is worth mention is fuel efficiency. A study by Kurani and Turrentine
from UC-Davis in 2004 aimed to find how would consumers think and behave related to the
concept of fuel economy or fuel efficiency when they purchase auto vehicles. Previous
researches about the relationship between perceived concepts of fuel economy were shaped by
“normative assumptions of economics” (Kurani & Turrentine, 2004), whereas in this newly
conducted research, researches focused more on helping policy makers to “ground future work”
(Kurani & Turrentine, 2004).
In this research study, Kurani and Turrentine interviewed 57 households and asked them to
report their feelings about the cars they owned, just bought and hope to buy in details. The
interviewees were divided into 10 sectors, which are pilot interviewees (households who used to
develop interview methods), college or graduate students, off-road vehicles users, state resource
agency employees, famers, computer industry workers, military households, financial job
workers, recreational industry workers and hybrid vehicle buyers, respectively (Kurani &
Turrentine, 2004).
14
Kurani and Turrentine found that because of consumers’ limited understanding, they
wouldn't realize the importance of making a long-term “economically rational decision”, which
means when given an option of paying more for a more “fuel-saving” version of car model,
customers usually can’t estimate the possible savings this could result in. Besides, the researches
also found that the phrase of “fuel-economy” was always considered belonged to
cheap/economic cars’ attributes, where as the phrase of “fuel-efficiency” was widely regarded as
an attribute of advanced engineered cars with high technology and quality (Kurani & Turrentine,
2004). According to interviewees’ report, people tried to convince themselves that fuel-economy
was related to saving money while fuel-efficiency was about saving fuel. Eventually, the study
suggested that most strategies addressed by automobile companies of educating consumers about
fuel cost savings would make them feel rather confused. Education work should be more focused
on “fuel efficiency and technical advances”. Also, an interesting finding from the study was that
based on some “emotional punch”, consumers may value fuel economy more if the car models
themselves were in shiny painted style (Kurani & Turrentine, 2004).
Another variable worth mention is the vehicles’ safety and reliability. A considerable
amount of previous literatures have found significant relationship between consumers’ perceived
reliability to a particular car model and their final purchase decision. Nevertheless, not all of
these studies find out positive or apparent correlations between automobile’s safety and their
related market performance.
Early in 1992, Virginia Commonwealth University scholars Hoffer, Pruitt and Reilly did a
research study on public-provided automotive safety information and related market responses
(Hoffer, Pruitt, & Reilly, 1992). The research specifically focused on whether the crash tests data
provided by certain public (government-run) institutes may influence the process of consumers’ 15
purchase decision making. They firstly investigated whether or how the market responses
correspond to “particularly poor test values” (Hoffer et al., 1992). They divided the test car
models into different groups by vehicle sizes and characteristics, in which they found among all
48 observations, 34 fell into the “family subcompact car category” (Hoffer et al., 1992). Next,
they tested another set of vehicles that had rather satisfied crash test results. Finally, in order to
find out the correlation between the market performances of studied vehicles and their crash test
results, they calculated the growth rates of certain vehicles models within three months right
after the crash test results’ announcement.
The data analysis showed that there was no obvious evidence that demonstrate automobile
sales growth influenced by their crash test results, though which the researchers confirmed the
publics disregarded the government car crash tests results when making their choice (Hoffer et
al., 1992).
However, there might be other “noises” that may affect the study’s accuracy of the
relationship between car reliability and buyers purchasing behavior. Recent studies still draw
attention on testing how important is automobile safety in buyers’ purchasing process. A study
by Monash University Accident Research Center in 2007 finds that consumers still put
significant interests in vehicles’ safety performance (Koppel, Charlton, Fildes, &Fitzharris,
2007). The aims of the study were to find the importance of car-safety features and how
important it is compared to other features. The researchers send out letter questionnaires to a
designed sample participants in Sweden as well as conducted telephone survey to another set of
participants in Spain (Koppel et al., 2007). According to data analysis, participants in this study
were more likely to rank safety as the most important feature when making a purchasing
decision. 16

Meanwhile, Koppel et al. (2007) also mentioned that as previous researches demonstrated,
consumers ranked price, appearance and reliability higher than safety feature. A possible
explanation for the different data result might be that the chosen participants of this study had all
recently purchased a new car. In terms of this, they were more likely to focus on the “actual”
performance of their owned cars. In addition, when participants were asked to “list up to three
factors” that they cared most concerning car safety, the top rank went to braking systems
including ABS and airbags. Besides the findings related to the feature of vehicle safety, it is also
interesting to understand the parameters that are associated with consumers’ ranking of “car-
safety is the most important feature” (Hoffer et al., 1992). According to collected responses,
these parameters include: gender, education level, age, drivers’ concern about crash tests, etc.
These findings do provide alternative referenced sources for my current research.
A more recent study in 2010 by Vrkljan and Anaby proves the same conclusion. In their
research, 2,002 Canadian drivers over 18 years old were asked to complete a survey, in which
they ranked their perceived importance of certain vehicle features from high to low (Vrkljan &
Anaby, 2010). The ANOVA tests suggest that safety and reliability (Vrkljan & Anaby, 2010). is
ranked highest among all of the features. Besides, the study also aims to test the effect of
different age and gender groups that might exert on individuals’ buying behavior. According to
Vrkljan and Anaby (2010), the collected data shows that younger generation, especially younger
males, who are also considered to be at a “higher risk of collision”, rated safety and reliability as
“least important” compared to other age and gender groups (Vrkljan & Anaby, 2010).
Furthermore, a study by Shaw and Pease (2010) examined whether individuals’ perceived
automobile security feature contributes to their willingness of recommending the purchase of a
certain car model (Shaw & Pease, 2010). The research team derived data from “Motoring 17

Which’s annual review of new and used cars” (Shaw & Pease, 2010). Result shows that vehicles
security has a significant impact on consumers’ willingness of recommend certain cat models.
(3) The factor of brand
A parsimonious model called NBD-Dirchlet of purchase incidence and brand choice was
first been introduced by Goodhardt, Ehrenberg and Chatfield in 1984 . In 2010, a study
conducted by Bennett and Graham further investigates consumers’ purchase behavior concerning
about brand to the category of automobile (Bennett & Graham, 2010). In this study, researchers
adopted a “two-purchase analysis”, which describes “two consecutive brand choices” of a
sample of buyers, including both repeating buyers and new buyers (Bennett & Graham, 2010).
Researchers collected their data from a motor fair held in Bangkok, capital of Thailand, in 2009.
Visitors were asked questions about their currently owned cars, the car they wanted to purchase
next, cars they owned before, etc. (Bennett & Graham, 2010). Then the collected answers were
compared to a published annual sales report from Toyota Motor Thailand Co..
From the data set, the study indicates that big auto firms like Toyota achieved a “slightly
higher” brand loyalty then others, with half of their existing customers would like to re-purchase
Toyota makes of cars for a second time (Bennett & Graham, 2010). Furthermore, the major
finding of this study is that Toyota’s growing sales rate, as well as its brand-share growth,
probably contributed by the first-time buyers. However, as college students, whom are mostly
considered as first-time buyers, their cognitive brand recognition and loyalty mainly comes from
what their parents, siblings or people surround them. In my study, the variable of brand-loyalty
will still be tested and related to their perceived brand reliability.
18
Another study in 2010 addressed attention on automobiles’ country of origin (Sohail &
Sahin, 2010). It analyzes the influence of this variable and the function it plays in consumers’
automobile selection (Sohail & Sahin, 2010). The study was conducted in Saudi Arabia, one of
the most fast-growing developing nations in the world. As Sohail and Sahin state, earlier studies
have shown that consumers show a preference of the products’ country of origin, and may prefer
to choose products from particular areas than others (Sohail & Sahin, 2010). They submitted a
questionnaire survey to Saudi Arabia males, since females in Saudi are “not legally permitted to
drive automobiles” and “are not key decision makers in the buying process” (Sohail & Sahin,
2010).
Data analysis shows that Japanese cars are highly rated by Saudi Arabia consumers as
“reliable” and “high-quality”. However, Japanese cars are seen not the “most socially
acceptable” cars (Sohail & Sahin, 2010). On the contrary, European cars achieve the highest
“socially acceptable” rating among participants. The researchers state that European cars are
considered to have the “greatest potential” for increasing sales growth in Saudi Arabia according
to participants’ preferences (Sohail & Sahin, 2010). Last but not least, United States automobile
brands earn a medium rating in all features. Another interesting fact that Sohail and Sahin
mentioned is that Saudi Arabians are very sensitive and responsive to country of origin
especially United States and some specific Western nations. Previous studies showed that Saudi
Arabian consumers are in the “forefront” in calling for boycotts of products that are
manufactured in the U.S. Thus, the international marketing work in Arab area must be
undertaken after a detailed market research in this area (Sohail & Sahin, 2010).
(4) The factor of online advertising influence
19

Social network site is one of the main places marketers choose to place advertisements on in
order to target younger generation and among which, college students are the key active users on
social networks (Chu, 2011; eMarketer, 2009) and are the “prime targets for SNSs advertising
campaigns” (Imran, 2014). Users adopted SNSs is still growing worldwide (Kozel, Klézl &
Pawlasová, 2013). In 2014, researchers conducted a study of social media pre-purchase search
effects on users’ attitudes among college students. A sample of 200 college students from
Islamabad was asked to complete a survey. Measurements are about students’ frequency or
willingness of clicking the advertising banners appeared on their social network sites. The data
analysis shows that when students show up a motivation of doing pre-purchase search online,
social media advertisements are proved to be an effective and mediate channel for SNSs users
(Imran, 2014). The findings provide advertisers, especially advertisers from South Asian
markets, a beneficial theoretical basis for promoting their products through SNSs advertising
banners. The researcher also suggests that SNSs advertisers should input specific products
information into their banner ads.
More related to my current research project for Honda Civic, another recent study in 2014
tests the relationship between online ads and automobile sales. They propose to explore the
effects of online advertising’s effects on vehicle sales including both search and non-search ads
(Peng, G. Zhang, S. Zhang, Dai & Li, 2014). Marketers usually seek out more effective
strategies due to limited marketing budget (Peng et al., 2014). Two research questions addressed
from the researchers are: 1. How does online advertising affect automobile sales and 2. Whether
both search and non-search ads have impact on automobile sales and what are the differences
(Peng et al., 2014).
20

The study collected sales data of 52 vehicle models in Chinese market, as well as each
model’s advertising spending data from a particular consulting company and a major search
engine company (Peng et al., 2014). According to the data analysis results, the study may
conclude that two different major findings: Frist, consumers who click on those non-search ads
on online platforms show a strong interests in corresponding car models. In other words, non-
search ads appeared online are effective for arousing brand awareness. However, those ads
clickers may not have a real intention to purchase cars concerning that these ads may appear
anywhere as long as consumers are scanning certain websites. Second, data shows that spending
on search ads have significant correlations with vehicle sales. The researchers explain that
consumers who initiate the search for specific car models are the one who own the willingness of
purchasing. Thus, automobile marketers need to focus more on search-ads when they have
demand on increasing sale growth, or otherwise focus more on non-search-ads if they want to
create brand awareness as well as enhance brand loyalty.
(5) The factor of transportation
The factor of public transportation contains variables including public transportation
provision (Cullinane, 2001), transport policy (Ozaki & Sevastyanova, 2011), as well as the
availability of grocery shopping (Bodor, Hutchinson & Rose, 2013).
Cuillinane’s study (2001) aimed to investigate whether the provision of prosperous public
transportation might reduce consumers’ willingness of buy new cars (Cullinane, 2001). The
study took Hong Kong as the experimental city, concerning that Hong Kong has been fully
covered by different kinds of public transportation. The study conducted a face-to-face
21

questionnaire survey among 389 college students among five universities in Hong Kong
(Cullinane, 2001). Collected data shows that students highly rated Hong Kong’s public
transportation since they were frequent users of it, and almost none of them own a car. Among
these students, 65% of them reported that they would not think about buying a car within the
next five years, and 33% of them reported they wouldn't buy a car within the next 10 years.
What's more, nearly 40% students stated that they don't need a car because of such a prosperous
public transportation system here. In addition, the pertaining to demographic backgrounds, the
attitude of car purchasing from male students was more “favorable” than female students
(Cullinane, 2001).
In 2011, scholars Ozaki and Sevastyanova’s did an analysis on consumers’ purchase
motivation of hybrid automobiles. They aimed to find out what drives consumers to adopt this
newly developed and “energy-sustainable” innovation. Meanwhile, they were also eager to
understand how can policies encourage or benefit them (Ozaki & Sevastyanova, 2011). In order
to achieve their research objectives, Ozaki and Sevastyanova did a questionnaire survey
contained 21 constructs. The survey was administered in 2009 and was sent to 4000 Toyota’s
customers who had purchased a Toyata Prius in the past two years (Ozaki & Sevastyanova,
2011). From their data set, they demonstrated several significant variables that have relationships
with consumers’ choice towards hybrid cars, including: Environmental benefits; social norms
and pressure, which means people’s respond to social culture and the group they belong;
practical compatibility; self-expression, which identifies individuals’ will of expressing personal
identity; positive attitudes towards new technology; as well as public transport policy (Ozaki &
Sevastyanova, 2011). Thus, researchers concluded several implications for policy makers. For
instance, as financial incentives and public transport policy appears to be important, policy
22

makers might come out more beneficial incentives to encourage hybrid car models purchasing.
Besides, tangible advantages should be made. According to Ozaki and Sevastyanova, “schemes
such as the cash-for- clunkers rebate programme need to be publicised more widely, and
provision of free/priority parking should be more extensive” (Ozaki & Sevastyanova, 2011).
Bodor, Hutchinson and Rose’s research study (2013) focused on car ownership and its
association with fruit and vegetable availability (Bodor, Hutchinson & Rose, 2013). Previous
study about individuals’ daily fruit and vegetable intake were mostly ignored the key aspect of
car ownership. Researches in this study state car ownership might provides individuals with
“greater mobility”, which allows households to shop more conveniently in local grocery stores or
“beyond neighborhood boundaries” (Bodor, Hutchinson & Rose, 2013).
The study was conducted in 2008 among 200 households from New Orleans. The data
showed that among people who don’t own a car, people’s daily intake of fruit and vegetables
was significantly associated with those shops’ located 2km away from their residence. However,
when the distance was limited to 500m -1km, this association seemed not that obvious.
Additionally, among individuals who owned cars, this fruit and vegetable availability didn't
affect intake, as previously assumed (Bodor, Hutchinson & Rose, 2013). We may thus infer that
if the residence or neighborhood people stay at is not convenient enough for daily grocery
shopping, they might grow a need for car purchasing. This indeed can be adopted as a variable
that contributes to my own study.
23

Internal Factors
(1) The factor of individuals’ psychological valuations
Existing literatures and studies demonstrate that not only tangible features attribute to
consumers’ purchasing behaviors, but also intangible factors such as psychological valuation
may also post effects on purchasing intentions. In 2002, Carrabine and Longhurst did a research
study about the place of cars among young generation (Carrabine & Longhurst, 2002), and it
leads to a conclusion that more wealthy young people’s perception of cars is related to
“anticipation”, “usage” and “meaning” (Carrabine & Longhurst, 2002).
Researchers adopt a qualitative research method to get a clearer and more detailed clue of
what young people’s daily lives contain, including pressures, happiness, as well as the ways they
interact with social cultures (Carrabine & Longhurst, 2002). 17-18 year olds students, whose
ages were considered to be the time that people reveal an initial interest of consuming
automobiles, were asked to report their current cultural life first. For instance, students were
required to give their rankings of things as television, music, sports and so on. Secondly, a focus
group discussion was generated to examine students’ feelings toward the most highly ranked
items, especially “music” (Carrabine & Longhurst, 2002). Next, semi-structured conversations
were made to examine details about their consumption practices of a range of activities,
including cars. Finally, researches made observation of certain participants who considered
themselves as “important” from previous interviews. According to content analysis, researchers
indicate that the sociology of car must resonate with the excitement that driving brings to
individuals as well as “the new horizons of sociability it seems to offer” (Carrabine & Longhurst,
2002).
24

In 2011, Bian and Forsythe draw their attention on the effect of individual characteristics on
U.S. and Chinese college students’ purchase intention for “luxury brands” (Bian & Forsythe,
2011). This research reveals a lot of interesting psychological variables that related to
individuals’ purchasing behavior, such as perceived need for uniqueness (NFU), self-
monitoring, self-expression attitude, etc. (Bian & Forsythe, 2011). A sample of 394 college
students from both U.S. and China were asked to participate a survey. The main finding of this
study is that consumers are more likely to choose brands that correspond to their self-values
(Bian & Forsythe, 2011). In addition, U.S. and Chinese students’ similarity avoidance differs
from each other. Chinese students tend to have higher similarity avoidance than U.S. students
(Bian & Forsythe, 2011). Besides, the data analysis shows that compared to U.S. students,
Chinese students seemed don't discriminate between self-expression attitude and self-
presentation attitude. In other word, Chinese students lack the ability to distinguish the difference
between self-image and social image (Bian & Forsythe, 2011).
A recent study in 2012 conducted by Chinese scholars examines Chinese college students’
“attitudes, social norms and aspiration of car ownership” (C. Zhu, Y. Zhu, Lu, He & Xia, 2012).
Researchers investigate college students’ perceived psychological values of car ownership. A
questionnaire survey was conducted in 2009, and the sample of students was chose from two
universities in southeast of China.
The researchers address that these students were chosen because they were “consumers with
greater future purchasing power” (Zhu et al., 2012). The study finds that there is a strong car-
ownership desire shared by Chinese college students. This desire of purchasing cars even
revealed at early ages when these students’ purchasing power is “still absent” (Zhu et al., 2012).
Besides, researchers also find out a strong effect of perceived psychosocial values of cars 25
including feelings of freedom, feelings of control, etc. Most of the students disagree that buying
a car is necessary for “traveling”. To tested population and even the general Chinese college
students, cars are more than a simply tool for transportation tool. To some point, the
psychosocial valuations’ impact outweighs the instrumental valuations of cars such as
convenience and speed (Zhu et al., 2012).
(2) The factor of personal interests
In 2011, Collin-Lange and Benediktsson investigated novice drivers’ automobile regime
and car usage. The study concentrated on how individuals, especially students age around 18,
enter the automobility regime, with focusing on individuals’ human components rather than
“systematic natures” of automobility (Collin-Lange & Benediktsson, 2011). For data collecting,
researchers submitted a questionnaire survey to 553 young people, age 16 to 21, in Iceland,
among which 54%(304) are females and 46%(249) are males. Collin-Lange and Benediktsson
pointed out that they chose this aging period because “16 is the legal age to start driving school”,
and the “upper age limit” is 21 (Collin-Lange & Benediktsson, 2011).
The questionnaire survey collected considerable amount of quantitative data such as “the
extent of driving license and car ownership”, distance between home and school, frequency of
car usage, etc. (Collin-Lange & Benediktsson, 2011). Futhermore, the questionnaires also asked
participants about their personal comments and reaction to specific questions pertaining to the
reason why they owned a car (if they reported they do), or extent of agreement of certain
statements about road safety, etc. (Collin-Lange & Benediktsson, 2011). The collected data from
participants showed several important findings. Firstly, young people in Iceland do use cars or
26

purchase cars from a “practical perspective” (Collin-Lange & Benediktsson, 2011), which means
young people find cars provide them flexibility and ability to be mobile. However, participants
argued that there are too many cars in Iceland at the moment and they wanted to change the
situation by adopting carpool or other related improvements to public transportation (Collin-
Lange & Benediktsson, 2011). Secondly, participants also showed social and cultural related
perspectives on car ownership rather than “pure practicaliy” (Collin-Lange & Benediktsson,
2011). They pointed out that they used cars not only for transportation purposes, but also for
social interaction. To sum up, Collin-Lange and Benediktsson concluded that young drivers have
“ambivalent” perception towards car ownership. They use cars for practical purposes, as well as
adding new interpretations on “car-based automobility” (Collin-Lange & Benediktsson, 2011).
(3) The factor of demographic features
It is no doubt that demographic features exert important roles in shaping young people’s
perception of automobile ownership and purchasing behavior. Almost all the earlier studies have
drown attention to demographic influences of college students purchasing behavior. As I’ve
already noted in previous review, Vrkljan and Anaby’s study in 2010 showed a significant
relations between genders and car-selection. From their data analysis, it’s not hard to find that
male students, who are considered to be at a higher risk of car crash, rated safety and reliability
feature as less important (Vrkljan & Anaby, 2010).
In my particular research for Honda Civic, I will adopt the demographic features that have
already been tested from former studies. I aim to test whether students from different
demographic backgrounds adopt different perspectives into automobile selection.
27

(4) The factor of Intended time-frame for driving licensure (Sigurdadottir, Kaplan &
Møller, 2014)
Earlier researches have proved that individuals’ attitudes toward car-ownership and car-
oriented behavior are shaped in their early age. Several studies conducted in recent years showed
that children and adolescents both adopt an attitude that they will obtain a driving license and
purchase a car when they grow into adults (Line, Chatterjee & Lyons, 2012; Kopnina &
Williams, 2013).
In 2014, Sigurdadottir, Kaplan and Møller conducted a research on adolescents intend time-
frame for driving licensure and car ownership, and the motivation for designing this time-frame
as well (Sigurdadottir, Kaplan & Møller, 2014). They submitted semi-structured interviews
among 50 Danish adolescents.
According to participants’ corresponding responds of their intended time-frame of driving
licensure and car ownership, researchers divided participants into three groups, relatively are:
“intended early car users”, “intended early license holders and later car users”, and “intended late
license holders and car users” (Sigurdadottir, Kaplan & Møller, 2014). Participants in the first
group are early adopters of automobiles. They are enthusiastic about automobility and other
auto-related lifestyles, including social networks. (Sigurdadottir, Kaplan & Møller, 2014).
Participants in the second group are car “pragmatists”, who seriously consider a long-term car-
oriented life style but also see the expenses as a barrier currently. The third group of participants
considers somehow shows no interest of car-oriented lifestyle either future car-ownership
(Sigurdadottir, Kaplan & Møller, 2014).
28
From content analysis, researchers indicate that family and the surrounded community plays
an important role in shaping adolescents’ attitudes towards car-ownership. For instance,
participants recalled their siblings and parents’ driving habits and travel patterns very accurately.
Thus expanding the social circle at families and communities may influence adolescents’ travel
habits (Sigurdadottir, Kaplan & Møller, 2014). Furthermore, car pragmatists (the second group)
are most motivated by “financial concerns” (Sigurdadottir, Kaplan & Møller, 2014). Last but not
least, although three groups share different valuation on personal car-oriented lifestyles, they all
“imagine a highly car-oriented” future (Sigurdadottir, Kaplan & Møller, 2014).
29
IV. PROPOSED PREDICTORS FROM THE LITERATURE
From previous literature reviews, we may identify a considerable amount of variables,
including both external and internal factors, which are related to different categories and might
affect consumers’ potential purchasing intentions. These proposed predictors are listed below.
For the readers’ convenience, I group these predictors in to nine sections which separately are:
People/peer influence; automobile attributes; brand features; online advertising influence; public
transportation; individuals’ psychological valuations; individuals’ personal interests;
demographic features and “other factors”.
Proposed Predictors of College Students’ Automobile Selection
People/Peer influence
Perceived peer influence from friends
Scholarly Sources: Koppel et al., 2007; Belgiwan et al., 2013
Perceived influence from parents
Scholarly Sources: Koppel et al., 2007; Belgiwan et al., 2013
Perceived peer influence from siblings
Scholarly Sources: Belgiwan et al., 2013
Automobile attributes
Assessment of overall purchase price
30

Scholarly Sources: Koppel et al., 2007; Sigurdadottir, Kaplan & Møller, 2014
Trade Sources: Business Wire, 2006
Perceived importance of makes and models
Scholarly Sources: Koppel et al., 2007
Trade Sources: Business Wire, 2006
Assessment of safety
Scholarly Sources: Koppel et al., 2007; Vrkljan & Anaby, 2010
Trade Sources: Business Wire, 2006
Assessment of performance
Scholarly Sources: Koppel et al., 2007; Vrkljan & Anaby, 2010
Trade Sources: Business Wire, 2006
Assessment of reliability
Scholarly Sources: Koppel et al., 2007; Vrkljan & Anaby, 2010
Trade Sources: Business Wire, 2006
Assessment of fuel price
Trade Sources: Business Wire, 2006
Assessment of insurance price
Trade Sources: Business Wire, 2006
Perceived attribute of fuel efficiency
Scholarly Sources: Kurani & Turrentine, 2004
Assessment of fuel consumption
Scholarly Sources: Koppel et al., 2007
Perceived attribute of fuel economy
Scholarly Sources: Kurani & Turrentine, 2004
31

Knowledge of car crash test results
Scholarly Sources: Hoffer et al., 1992
Assessment of car design/style
Scholarly Sources: Koppel et al., 2007; Vrkljan & Anaby, 2010
Perceived service quality of maintenance
Scholarly Sources: Koppel et al., 2007
Assessment of storage space
Scholarly Sources: Koppel et al., 2007; Vrkljan & Anaby, 2010
Beliefs in the function of ABS system
Scholarly Sources: Koppel et al., 2007
Beliefs in the function of airbags
Scholarly Sources: Koppel et al., 2007
Beliefs in the function of stability control system
Koppel et al., 2007
Beliefs in the function of braking systems
Scholarly Sources: Koppel et al., 2007
Perceived influence of car security system
Scholarly Sources: Shaw & Pease, 2010
Perceived driving comfort
Scholarly Sources: Vrkljan & Anaby, 2010
Brand features
Perception of brand loyalty
Scholarly Sources: Bennett & Graham, 2010
32

Brands’ country-origins
Scholarly Sources: Sohail & Sahin, 2010
Preference for Japanese Cars
Scholarly Sources: Sohail & Sahin, 2010
Preference for European Cars
Scholarly Sources: Sohail & Sahin, 2010
Preference for American Cars
Scholarly Sources: Sohail & Sahin, 2010
Preference for Korean Cars
Scholarly Sources: Sohail & Sahin, 2010
Online advertising influence
Perceived influence of Internet Commercial (not including social media)
Scholarly Sources: Belgiwan et al., 2013; Peng et al., 2014
Usage of SNSs
Scholarly Sources: Imran, 2014
Perceived influence of SNSs advertising
Scholarly Sources: Imran, 2014
Public transportation
Availability of public transportation
Scholarly Sources: Cullinane, 2001
33

Individuals’ psychological valuations
Willingnes of expressing personal identity
Scholarly Sources: Ozaki & Sevastyanova, 2011
Perceived need for uniqueness
Scholarly Sources: Bian & Forsythe, 2011
Attitudes toward social-function
Scholarly Sources: Bian & Forsythe, 2011
Perceived satisfaction of brand
Scholarly Sources: Bian & Forsythe, 2011
Psychological feeling of car ownership
Scholarly Sources: Zhu et al., 2012
Individuals’ personal interests
Perceived satisfaction with current car
Scholarly Sources: Belgiwan et al., 2013
Perceived regret with the current car
Scholarly Sources: Belgiwan et al., 2013
Desire of car upgrading
Scholarly Sources: Belgiwan et al., 2013
Perceived excitement of driving
Scholarly Sources: Carrabine & Longhurst, 2002
Perceived enthusiasm for automobiles
Scholarly Sources: Sigurdadottir, Kaplan & Møller, 2014
34

Other Factors:
Attitudes towards technology
Scholarly Sources: Ozaki & Sevastyanova, 2011
Perceived convenience of grocery shopping
Scholarly Sources: Bodor, Hutchinson & Rose, 2013
Perceived ease of travel
Scholarly Sources: Zhu et al., 2012
Perceived convenience of going to school
Scholarly Sources: Collin-Lange & Benediktsson, 2011
Perceived road safety
Scholarly Sources: Collin-Lange & Benediktsson, 2011
Holding of driver licenses
Scholarly Sources: Collin-Lange & Benediktsson, 2011
Intended time-frame for driving licensure
Scholarly Sources: Sigurdadottir, Kaplan & Møller, 2014
Demographic features
Students’ age
Scholarly Sources: Koppel et al., 2007; Ozaki & Sevastyanova, 2011; Bodor,
Hutchinson & Rose, 2013; Imran, 2014
Students’ gender
Scholarly Sources: Vrkljan & Anaby, 2010; Ozaki & Sevastyanova, 2011; Zhu et al.,
2012; Belgiwan et al., 2013; Bodor, Hutchinson & Rose, 2013; Sigurdadottir, Kaplan &
35

Møller, 2014
Household income
Scholarly Sources: Koppel et al., 2007; Ozaki & Sevastyanova, 2011; Belgiwan et al.,
2013
Car ownership
Scholarly Sources: Ozaki & Sevastyanova, 2011; Bodor, Hutchinson & Rose, 2013
Students’ degree program
Scholarly Sources: Zhu et al., 2012; Imran, 2014
36
V. THEORETICAL FRAMEWORK
In the former section, we listed 54 proposed predictors from the literature review. The
current study I’m conducting is mainly focusing on factors that drive college students’
automobile purchasing intention. Whilst these proposed predictors are all related to different
aspects of automobile features, individuals’ buying behaviors, as well as students’ demographic
background information, and the identifications of these predictors are extremely valuable.
However, since these predictors are derived from literatures that addressed different research
questions, used different research methods and undertake different contexts, a theoretical
framework, thus, should be adopted in order to group related predictors in a more reasonable
frame. The theoretical framework this study will employ is the Theory of Planned Behavior
(Ajzen & Fishbein, 1980).
The theory of planned behavior, also known as TPB, was proposed by Icek Ajzen in 1991,
in order to improve the prediction of particular actions by introducing perceived behavior control
(Ajzen, 1991). The theory is highly employed in studies of certain relationships between
attitudes, beliefs and behaviors, in the fields of public relations, advertising and other applied
mass media field.
Eight key variables that contained in this theory are: Behavioral Beliefs, Attitude Toward
the Behavior, Normative Beliefs, Subjective Norm, Control Beliefs, and Perceived Behavioral
Control, Interntion and Behavior (Ajzen, 1991). The following figure shows the diagram of TPB
theory.
37

Behavioral beliefs and attitude toward behavior:
According to Ajzen (1991), behavioral belief is individual’s belief about consequences of a
certain behavior (Ajzen, 1991). Whereas attitude toward a behavior is the degree of valuation
that individuals perceived as positive or negative (Ajzen, 1991).
Normative Beliefs and Subjective Norm:
The normative belief means an individuals’ perception of certain behavioral expectations
that refer to individuals or groups, or relevant family, friends or others’ belief of whether or not
he or she should perform certain behavior (Ajzen, 1991).
38
The subjective norm refers to individuals’ perceived social pressures of whether engaging
in particular behaviors or not (Ajzen, 1991). It's a perception of certain behaviors that are
influenced by “significant others” (Amjad & Wood, 2009).
Control beliefs and perceived behavioral control:
According to Ajzen (1991)’s interpretation, control beliefs refer to people’s beliefs about
presence of factors that may facilitate or impede certain behaviors (Ajzen, 1991). Perceived
behavior control illustrates individuals’ perceived ease of conducting a particular behavior
(Ajzen, 1991).
Intention and behavior:
Intention is an indication of individuals’ “readiness” to perform a behavior. It is also
considered to be the immediate antecedent of behavior (Ajzen, 1991). Last but not least, Ajzen
(1991) indicated that human behavior is individuals’ observable reaction/response to a given
situation (Ajzen, 1991).
In the model of TPB, human behavior was guided and influenced by three initial variables,
“behavioral beliefs”, “normative beliefs” and “control beliefs”. These three initial variables
firstly rise to “attitude toward behaviors”, “subjective norm” and “perceived behavioral control”
separately. In combination, “attitude toward behaviors”, “subjective norm” and “perceived
behavioral control” result in the formation of “intention”, and eventually intention may post
immediate and direct influence on behaviors (Ajzen, 1991).
39
VI. PROPOSED PREDICTORS WITHIN THE THEORY OF PLANNED BEHAVIOR
According to the theory of planned behavior, proposed predictors fit into the framework of
each constructed variables. Note that some predictors that fall outside of TPB model, as they are
considered as antecedents of behavioral belief. These predictors are also listed below. The
origins of predictors can be derived from previous section.
(1) Behavioral belief antecedents
Brands’ country-origins
Knowledge of car crash test results
Usage of SNSs
Willingness of expressing personal identity
(2) Behavioral beliefs
Assessment of overall purchase price
Perceived importance of makes and models
Assessment of performance
Perceived attribute of fuel efficiency
Assessment of fuel consumption
Perceived attribute of fuel economy
Assessment of car design/style
Perceived service quality of maintenance
Assessment of reliability
40

Perceived availability of storage space
Assessment of fuel price
Assessment of insurance price
Assessment of safety
Perceived Comfort
(3) Attitude toward the behavior
Perception of brand loyalty
Perceived satisfaction of brand
Preference for Japanese Cars
Preference for European Cars
Preference for American Cars
Preference for Korean Cars
Psychological value of car ownership
Perceived need for uniqueness
Attitudes toward social-function
Perceived satisfaction with current car
Perceived regret with the current car
Desire of car upgrading
Perceived excitement of driving
Perceived enthusiasm for automobiles
Attitudes towards technology
41

(4) Normative beliefs
Perceived peer/friends’ influence
Perceived influence from parents/siblings
Perceived influence of Internet Commercial (not including social media)
Perceived influence of SNSs advertising
(5) Subjective norms
Peer’s choice of automobiles
Parents/sibling’s choice of automobiles
Recommendation by websites
Usage of SNSs
(6) Control beliefs
Beliefs in the function of ABS system
Beliefs in the function of airbags
Beliefs in the function of stability control system
Beliefs in the function of braking systems
Perceived influence of car security system
(7) Perceived behavioral control
Perceived willingness of buying a new car
Assessment of driving safety
Perceived road safety
Perceived ease of travel
42

Perceived convenience of going to school
Perceived availability of public transportation
Perceived convenience of grocery shopping
(8) Past behavior
Frequency of driving
Holding of driver licenses
Intended time-frame for driving licensure
43

VII. SELECTED PROPOSED PREDICTORS
The selected predictors that will be used for the following study are listed below. Due to
limit of time and monetary constrains, I cannot cover all 54 predictors in our measurement
design section and apply them in our questionnaire survey. Thus, I listed 4908509 variables that
are: a. fit well in the TPB framework; b. mentioned in a variety of literatures.
(1) Behavioral beliefs
Assessment of overall purchase price
Assessment of performance
Perceived attribute of fuel efficiency
Assessment of car design/style
Perceived service quality of maintenance
Assessment of reliability
Perceived importance of makes and models
Perceived availability of storage space
Assessment of safety
Perceived Comfort
Assessment of fuel price
(2) Attitude toward the behavior
Perception of brand consciousness
Perceived satisfaction of brand
Preference for Japanese cars
44

Psychological value of car ownership
Perceived need for uniqueness
Attitudes toward social-function
(3) Normative beliefs
Perceived peer/friends’ influence
Perceived influence from parents/siblings
Perceived influence of SNSs advertising
(4) Subjective norms
Recommendation by websites
(5) Control beliefs
(None)
(6) Perceived behavioral control
Perceived ease of travel
Perceived convenience of going to school
Perceived availability of public transportation
(7) Other features
Age
Gender
Degree program
45

Car ownership
Holding of driver licenses
Intended time-frame for driving licensure
Intended time-frame for buying a car
46

VIII. DEVELOPMENT OF MEASURES
The ultimate goal of this project is to develop a set of measures and test if they could be
used to identify students’ automobile buying intention and allow researchers to capture the
information and variation. In order to accomplish this goal, I designed multiple-item measures
for 16 proposed predictors and labeled them from V1 to V16 separately. The adoption of
multiple-item measures would allow the researcher to quantify the errors going from construct to
each indicator and quantify the influence of error onto the indicators. Most of the measurements
were adapted from previous literatures, scholars’ journal, and the Marketing Scales Handbook
(Bruner, 2009). Sources were listed as below respectively for each measure. However, due to a
scarcity of pre-existing scales, I had to create original measures for some of the proposed
predictors.
Additionally, the creation of original measurements requires the researcher to stick to
several principles through which the research could maximize the probability to best capture the
variations through these self-report measures. The following principles were all retrieved from
the class notes of CM724 at Boston University, originally created by professor Michael Elasmar.
The outline of these principles is:
Forum: Language; length; focus
Content: Meaning; word choice; structure; order; assumed knowledge.
47

Language Simplicity is the key.
- The fewer numbers of syllables the better.
- Use spoken English. Avoid using slangs.
Length Length of measures:
- Short measures are better than long measures, except when
length clarifies meaning, or when length facilitates
information retrieval.
Length of response categories:
- Number of options for nominal measures
(categorical): no more than 10.
- Number of options for interval measures (scales): between 5
and 7
Length of instruments:
- A compromise needs to reach between the number of
concepts needed, the number of measures needed and the
time will take to complete the instruments.
- Web-administered or paper-administered surveys should not
exceed 15 minutes.
Focus Each measure should focus on a single dimension of a concept.
Meaning - Do not assume that participants are familiar with scientific
concepts, jargon of researchers or can engage in
computations even if these are basic.
- Transform everything into its simplest form.
- When attempting to convey meanings, provide a common
frame of reference whenever possible (you have to include a
definition to your participants).
Word-choice - Taking to account the subtleties of language when choosing
words used in the measures.
- Pay attention to the fanatic sound that it generates.
Structure - Double-negatives: Don’t use them.
48

- Placement of respond categories: Do not offer
response categories prior to stating question or providing the
statement to which they are asked to react.
Order General questions to specific questions.
Assumed
knowledge
Do not assume that the participants are familiar with the topic
that you’re researching.
The conducted measurements were listed as below.
49
Multiple-item measures
(1) Behavioral beliefs (Ajzen, 1991, 2006, 2009)
V1 Construct: Assessment of overall purchase price
Definition: An individual’s willingness of carefully evaluating a product’s overall price before purchasing.
Source: Due to a scarcity of pre-existing scales, all items were developed by the researcher.
For these questions, think about your purchase behavior. How much do you agree or disagree with the following statements?
Strongly Disagree
Disagree Neutral Agree Strongly Agree
V1-1 In general, I always carefully think about prices before buying.V1-2 Product price is what I care about most when I buy certain products.V1-3 I go for the price first rather than thinking about other features.V1-4 To me, the overall purchase price doesn't matter at all.
V2 Construct: Assessment of fuel price
Definition: An individual’s assessment of current price of gas/fuel.
Source: Due to a scarcity of pre-existing scales, all items were developed by the researcher.
For these questions, assuming you are going to buy a new car. How much do you agree or
disagree with the following statements?
Strongly Disagree
Disagree Neutral Agree Strongly Agree
V2-1 If the current gas price is high, I won’t consider buying a new car.V2-2 Fuel price is what I care a lot concerning about a new car
50

purchase.V2-3 I would be more likely to buy a car when the fuel price is considerable.V2-4 I don’t think fuel price would affect my willingness of buying a car.
V3 Construct: Assessment of insurance price
Definition: An individual’s assessment of insurance price related to a car.
Source: Due to a scarcity of pre-existing scales, all items were developed by the researcher.
For these questions, assuming you are going to buy a new car. How much do you agree or disagree with the following statements?
Strongly Disagree
Disagree Neutral Agree Strongly Agree
V3-1 I’d prefer a more reasonable insurance price when I am about to buy a new car.V3-2 I won’t consider too much about the insurance price when I am about to buy a new car.V3-3 I would carefully assess the price of car insurance when making a car purchase decision.V3-4 Price of insurance doesn’t bother me when buying a new car.
(2) Attitude toward the behavior (Ajzen, 1991, 2006, 2009)
V4 Construct: Perception of brand consciousness.
Definition: The degree to which a person is sensitive about brand names because they are viewed as communicating something about one’s self-concept.
Source: Items have been partially adapted from the Marketing Scales Handbook (Bruner,
51
2009), Scale “Brand Consciousness” as developed by Nan and Neo (2007). All other items are developed by the researcher.
For these questions, think about your purchase behavior and assume you are going to buy a new car. How much do you agree or disagree with the following statements?
Strongly Disagree
Disagree Neutral Agree Strongly Agree
V4-1 I pay attention to the brand of the car I’m going to buy.
V4-2 Sometimes I am willing to pay more money for a product because of its brand name.V4-3 I don’t care much about the brand’s name when it comes to car purchase.
V5 Construct: Perceived satisfaction of brand
Definition: The degree to which a person is sensitive about brand names because they are viewed as communicating something about one’s self-concept.
Source: Items have been partially adapted from Bian and Forsythe’s study (2011): Purchase intention for luxury brands: A cross cultural comparison, Journal of Business Research. All other items are developed by the researcher.
For these questions, think about your car ownership if you have a car, or assume your future car ownership if you don’t. How much do you agree or disagree with the following statements?
Strongly Disagree
Disagree Neutral Agree Strongly Agree
V5-1 Owning a certain brand of car would give me pleasure.V5-2 Owning a certain brand of car makes me feel good about myself.V5-3 I enjoy having my own car of a certain brand.V5-4 I don’t care much about having my own car of a particular brand.
52

V6 Construct: Preference for Japanese cars.
Definition: The degree to which a person highly prefers a car model manufactured by Japanese manufacturer.
Source: All items have been adapted from Sohail and Sahin’s study (2010): Country-of-origin effects on consumers' evaluations of automobiles: Perspectives from a Developing Nation.
For these questions, assume you are going to buy a new car. How much do you agree or disagree with the following statements?
V7 Construct: Psychological value of car ownership
Definition: Individual’s cognitive perception of owning private cars.
Source: Items have been partially adapted from Zhu et al.’s study (2012): Purchase intention for luxury brands: Perceptions and aspirations for car ownership among Chinese students attending two universities in the Yangtze Delta, China. All other items are developed by the researcher.
For these questions, think about your car ownership if you have a car, or assume your future car ownership if you don’t. How much do you agree or disagree with the following statements?
53
Strongly Disagree
Disagree Neutral Agree Strongly Agree
V6-1 Cars made in Japan are quite reliable and seem to last the desired length of time.V6-2 Cars made in Japan occupy a very strong competitive position in comparison to cars made by other countries.V6-3 Cars made in Japan are generally of a lower quality in comparison to others.V6-4 Cars made in Japan are always carefully produced.

Strongly Disagree
Disagree Neutral Agree Strongly Agree
V7-1 Owning a car is a symbol of my success in lifeV7-2 Owning a car makes me feel more in control of my lifeV7-3 Owning a car will be necessary in the future,V7-4 Cars are a symbol of successful modern life.
V8 Construct: Perceived need for uniqueness
Definition: Individual’s psychological need for being more unique than others.
Source: Items have been partially adapted from Bian and Forsythe’s study (2011): Purchase intention for luxury brands: A cross cultural comparison, Journal of Business Research.
For these questions, think about yourself and your purchase behavior. How much do you agree or disagree with the following statements?
Strongly Disagree
Disagree Neutral Agree Strongly Agree
V8-1 I often seek out for new products or brands that will add to my personal uniqueness.V8-2 I dislike brands or products that are purchased by everyone.V8-3 Having an eye for products that are interesting and unusual helps me in establishing a distinctive image.V8-4 I always try to find a more interesting version of ordinary products because I enjoy being original
V9 Construct: Attitudes toward social-function
Definition: The degree to which an individual thinks of buying certain products reflects his/her social status and personality.
Source: Items have been partially adapted from Bian and Forsythe’s study (2011): Purchase intention for luxury brands: A cross cultural comparison, Journal of Business Research. All
54

other items are developed by the researcher.
For these questions, think about yourself and your purchase behavior. How much do you agree or disagree with the following statements?
Strongly Disagree
Disagree Neutral Agree Strongly Agree
V9-1 The brands I chose reflect the kind of person I see myself to be.V9-2 The brands and products I bought help me express myself.V9-3 The brands and products I bought is a symbol of my social status.V9-4 The brands and products I chose fit me into certain social situations.
(3) Normative beliefs
V10 Construct: Perceived peer/friends’ influence
Definition: A consumer’s shopping tendency influenced by peer’s shopping experience or recommendations.
Source: Items were partially adapted from the Marketing Scales Handbook (Bruner, 2009), Scale “Opinion Leadership”, as developed by Lichtenstein et al. (1993). Items have been revised by the researcher for this study. All the other items were developed by the researcher.
For these questions, assume that you are going to buy a new car. How much do you agree or disagree with the following statements?
Strongly Disagree
Disagree Neutral Agree Strongly Agree
V10-1 I would ask my friends for information about my car purchase.V10-2 I consider my friends who have bought cars as experts in car purchasing.V10-3 I think of my friends as a good source of car information.V10-4 I would do the research myself rather than ask my friends who have bought cars before.
55
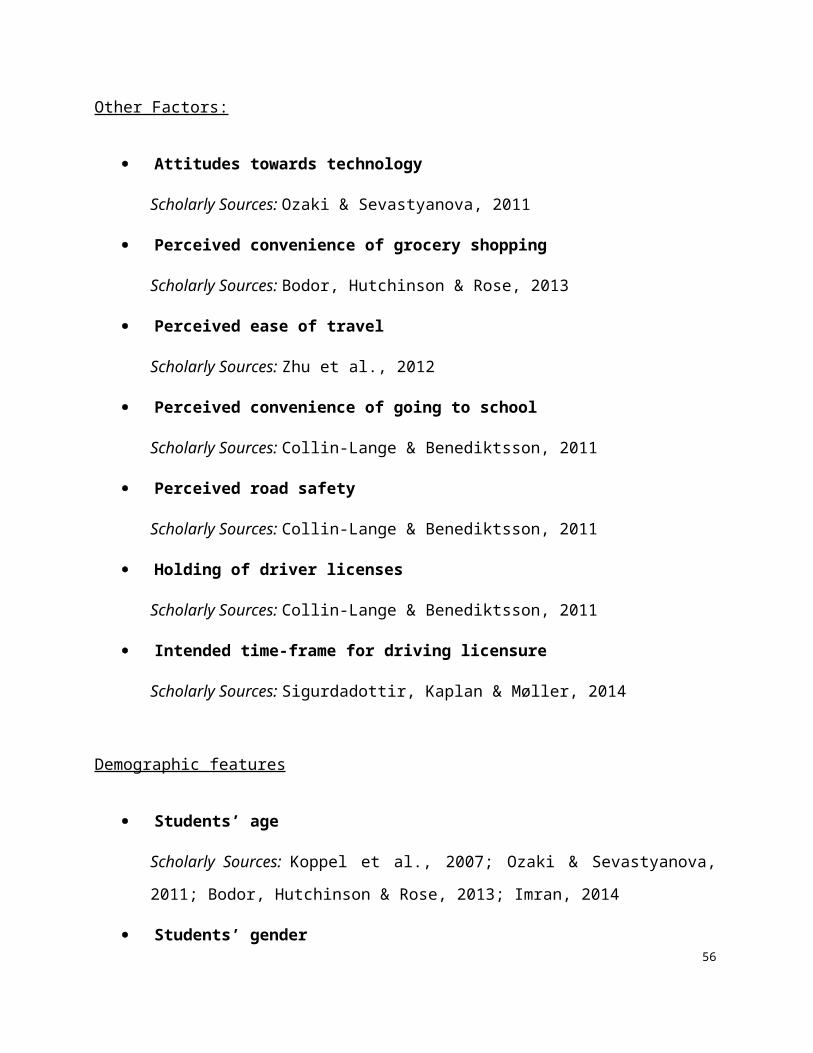
V11 Construct: Perceived influence from parents/siblings
Definition: A consumer’s shopping tendency is influenced by parents/siblings’ shopping experience or recommendations.
Source: Items were partially adapted from the Marketing Scales Handbook (Bruner, 2009), Scale “Opinion Leadership”, as developed by Lichtenstein et al. (1993). Items have been revised by the researcher for this study. All the other items were developed by the researcher.
For these questions, assume that you are going to buy a new car. How much do you agree or disagree with the following statements?
Strongly Disagree
Disagree Neutral Agree Strongly Agree
V11-1 I would seriously think over my parents and sibling’s advice when buying a new car.V11-2 I consider my parents and siblings’ recommendation on cars very valuable.V11-3 I would think of my parents/siblings’ driving experience first when I’m going to buy a car.V11-4 Parents and siblings’ recommendation doesn't have any effect on my car purchasing decision.
V12 Construct: Perceived influence of SNS advertising
Definition: To what extent an individual consider advertisements on SNSs to be effective.
Source: Items were partially (item one to four) adapted from Irman’s study (2014): Effects of pre-purchase search motivation on user attitudes toward online social network advertising: A case of university students. Item five was developed by the researcher.
For these questions, think of your social network sites’(SNSs) usage and purchase behavior. How much do you agree or disagree with the following statements?
56

Strongly Disagree
Disagree Neutral Agree Strongly Agree
V12-1I consider SNS advertising very essential.V12-2 I often click on SNS banner ads.V12-3 I like banner ads of products shown on SNSs.V12-4 SNS advertisement usually won’t catch my eyes.
(4) Subjective norms
V13 Construct: Recommendations by websites
Definition: To what extent an individual’s purchasing behavior would be affected by websites recommendation.
Source: Items were partially adapted from Irman’s study (2014): Effects of pre-purchase search motivation on user attitudes toward online social network advertising: A case of university students. Some of the items were revised by the researcher.
For these questions, assume that you are going to buy a new car. How much do you agree or disagree with the following statements?
Strongly Disagree
Disagree Neutral Agree Strongly Agree
V13-1 I do my online research to make informed car buying decisions
V13-2 I would use car rating websites to get in-depth information about products &services.V13-3 I would use car rating websites to learn how to solve problems involved in a purchase decision.V13-4 I use car rating websites to find information to reduce the risk of making a bad product/service choice.
57

(5) Perceived behavioral control
V14 Construct: Perceived ease of travel
Definition: The degree to which a consumer believes that going to another place for travel is free from effort.
Source: All items were partially adapted from Zhu et al.’s study (2012): Purchase intention for luxury brands: Perceptions and aspirations for car ownership among Chinese students attending two universities in the Yangtze Delta, China. Some of the items were revised by the researcher.
These questions pertain to your experience of travel. How much do you agree or disagree with the following statements?
Strongly Disagree
Disagree Neutral Agree Strongly Agree
V14-1 Owning a car will allow me to travel to more places I wish to go. A private car will allow me to travel fasterV14-2 Owning a car will allow me to travel faster.V14-3 Owning a car will allow me to transport more itemsV14-4 Owning a car will allow me to travel more comfortably.
V15 Construct: Perceived convenience of going to school
Definition: The degree to which participants consider it’s easy to go to school from where they live.
Source: Due to a scarcity of pre-existing scales, all items were developed by the researcher.
For these questions, think about your daily experience. How much do you agree or disagree with the following statements?
58

Strongly Disagree
Disagree Neutral Agree Strongly Agree
V15-1 It's very convenient for me to go to school from where I live.V15-2 To me going to school is easy and convenient, thanks to the transportation.V15-3 I suffered from going to school every day because of the transportation.V15-4 It’s fast and easy to go to school from where I live.
V16 Construct: Perceived availability of public transportation
Definition: The degree to which participants consider the local public transportation is reachable and convenient.
Source: Due to a scarcity of pre-existing scales, all items were developed by the researcher.
For these questions, think about your daily experience. How much do you agree or disagree with the following statements?
Strongly Disagree
Disagree Neutral Agree Strongly Agree
V16-1 I’m satisfied with our local public transportation.V16-2 Our local public transportation leads me to most of the place I want.V16-3 The local public transit systems here always cause me problems.V16-4 It’s very convenient and fast to take public transportation here rather than driving myself.
Single-item measures
Variable 1: Assessment of performance/car design/fuel efficiency/ reliability /availability of
59

storage space/safety/comfort
Definition: An individual’s assessment of different car attributes.
Source: Items were partially adapted from Koppel et al. (2007); Vrkljan & Anaby (2010); Business Wire, (2006); Kurani & Turrentine, (2004).
Assuming you are going to buy a new car. How important will you rank the following factors? (1=least important, 5=most important)
1 2 3 4 5
V17 Fuel efficiencyV18 Design/styleV19 ReliabilityV20 Makes and modelsV21 Storage spaceV22 SafetyV23 ComfortV24 Service quality of maintenance
Variable 2: Perceived satisfaction of brand
Definition: A customer’s level of satisfaction with several aspects of a brand
Source: Items were partially adapted from the Marketing Scales Handbook (Bruner, 2009), Scale #531 “Satisfaction with Car Brand”, as developed by Brown et al. (2005). All other items are developed by the researcher.
Think about the Japanese automobile manufacturer Honda. How satisfied are you with the following aspects of its compact car line Honda Civic. Even if you are not entirely sure, check the box that best describes your feeling or opinion. (1=least important, 5=most important)
1 2 3 4 5
V25 PriceV26 Fuel efficiencyV27 Appearance/DesignV28 ReliabilityV29 Power
V30 Storage spaceV31 SafetyV32 ComfortV34 Service quality of maintenance
60

Variable 3: Intended time-frame for buying a car
Definition: Frequency of using social networking sites.
Source: All items were adapted from Cullinane’s study in 2011: The relationship between car ownership and public transport provision: a case study of Hong Kong. Some of the items were revised by the researcher.
For the following statements, which one best describes your intended time-frame of buying a new car? (You may choose only one).
V35 I already have a car and I don’t need to buy a new one.
V36 I would like to buy a new car now.
V37 I will buy a car as soon as I could afford one.
V38 I might buy a car one day, but it’s not my primary concern.
V39 I have no intention of buying a car in the next 10 years
Variable 4: Likelihood of choosing a particular car brand.
Definition: An individuals reported likelihood to choose (1)Honda, (2) Mazda, (3) Toyota, (4) Volkswagen, (5)Nissan, (6) Chevrolet, (7) Buick, (8) Subaru, (9) Benz, (10) BMW, (11) Audi, (12) Kia, (13) Hyundai, (14) Jeep, (15) Scion, (16)Other if they were asked to buy a car today. Note that, although these measures are grouped together, they do not comprise a single construct.
IF you were choosing a car brand to buy TODAY, how likely would you be to select each of the following?
Very Unlikely
Somewhat Unlikely
Neutral Somewhat Likely
Very Likely
V40 Honda
V41 MazdaV42 Toyota
61

V43 VolkswagenV44 Nissan
V45 Hyundai
Or other: _______________________ (Please specify)
Variable 5: Holding of drivers’ licenses
Definition: Holding of drivers’ licenses
Yes No
V46 Do you own a legal driver’s license?
Variable 6: Car ownership
Definition: Personal car ownership
Yes No
V47 Have you ever owned a car?
Variable 7: Age
Definition: An individual’s age
V48 How old are you?
Variable 9: Gender
Definition: An individual’s gender
Male Female
V49 Are you male or female?
Variable 10: Academic level
Definition: An individual‟s academic level/grade
62

Freshman Sophomore Junior Senior Graduate
V50 Which of the following describes your current academic level?
63
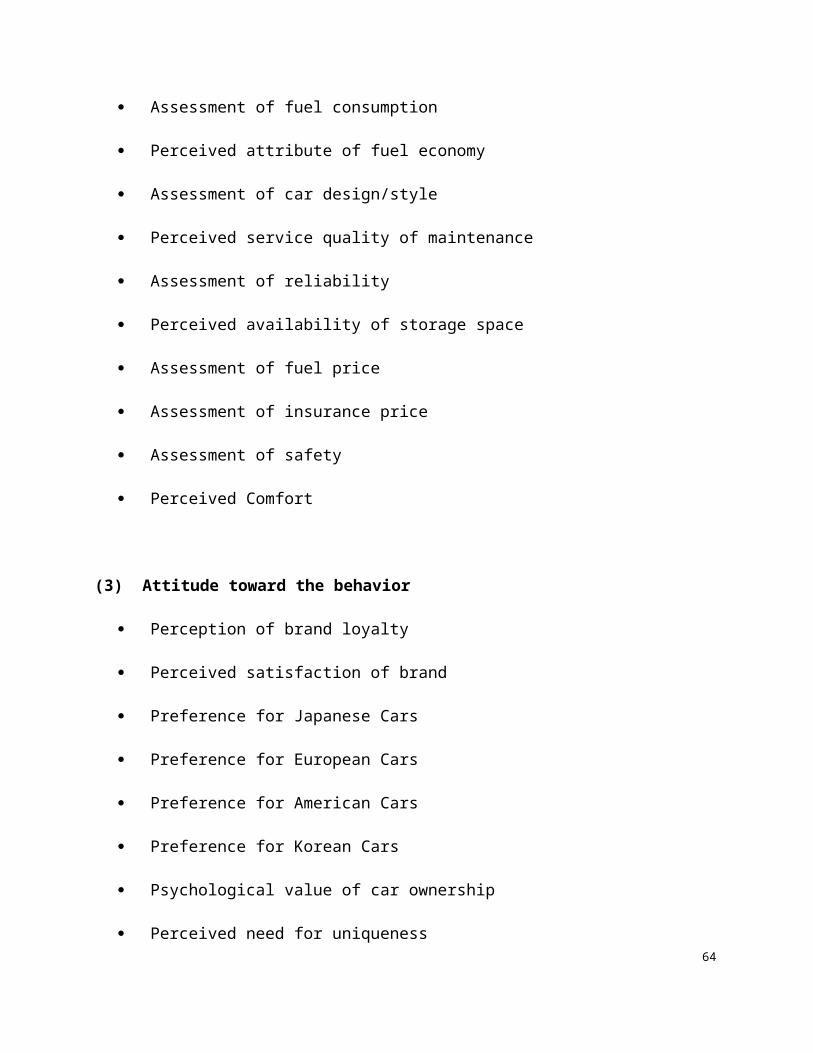
IX. DEVELOPMENT OF SURVEY INSTRUMENTS
In this section, I will provide an overview of the strategies I adopted to divide measurement
constructs into different sets and to develop the final questionnaires as well, according to the
measurement and survey developing principles mentioned previously.
First section
In order to follow the rules of “general to specific”, I strategically prioritize three relatively
“general” proposed predictors and their corresponding measurement items in this section, which
are: V1 – Assessment of overall purchase price; V8 – Perceived need for uniqueness; and V9 –
Attitudes toward social-function. Moreover, as for the introduction, the questionnaire included
the statement, “For the first part of questions, think about yourself your purchase behavior.
How much do you agree or disagree with the following statements? Even if you are not entirely
sure, check the box that best describes your feeling or opinion”. The first set of measures are
listed as below.
Strongly Disagree
Disagree Neutral Agree Strongly Agree
V1-1 In general, I always carefully think about prices before buying.V8-4 I always try to find a more interesting version of ordinary products because I enjoy being originalV9-2 The brands and products I bought help me express myself.V9-3 The brands and products I bought is a symbol of my social status.
64

V8-1 I often seek out for new products or brands that will add to my personal uniqueness.V8-2 I dislike brands or products that are purchased by everyone.V9-4 The brands and products I chose fit me into certain social situations.V1-2 Product price is what I care about most when I buy certain products.V9-1 The brands I choose reflect the kind of person I see myself to be.V1-3 I go for the price first rather than thinking about other features.V8-3 Having an eye for products that are interesting and unusual helps me in establishing a distinctive image.V1-4 To me, the overall purchase price doesn't matter at all.
Second section
For the next section, I chose the set of measurements that measures individuals attitudes
toward social networking advertisements. The intro statement is, “For our next questions, think
of your social network sites (SNSs) usage and purchase behavior. How much do you agree or
disagree with the following statements”. The proposed predictor concluded in this section was
V12 – Perceived influence of SNS advertising.
Strongly Disagree
Disagree Neutral Agree Strongly Agree
V12-1 I consider SNS advertising very essential.V12-2 I often click on SNS banner ads.V12-3 I like banner ads of products shown on SNSs.V12-4 SNS advertisement usually
65

won’t catch my eyes.
Third and fourth section
These two sections contain three predictors and their corresponding measures. The first set
of questions is mainly measuring students’ perception of their daily experience and usage of
transportation. The later set of questions measures their opinions about travel convenience
pertaining to car ownership. Three proposed predictors are: V14 – Perceived ease of travel; V15
– Perceived convenience of going to school; and V16 – Perceived availability of public
transportation. The measurements are listed as below:
Strongly Disagree
Disagree Neutral Agree Strongly Agree
V15-1 It's very convenient to go to school from where I live.V16-2 Local public transportation leads me to most of the places.V15-3 I suffered from going to school every day because of the transportation.V16-4 It’s very convenient and fast to take public transportation here rather than driving myself.V16-1 I’m satisfied with our local public transportation.V15-2 To me going to school is easy and convenient, thanks to the transportation.V16-3 The local public transit systems here always cause me problems.V15-4 It’s fast and easy to go to school from where I live.
Strongly Disagree
Disagree Neutral Agree Strongly Agree
V14-1 Owning a car will allow me to travel to more places I wish to go.
66

V14-2 Owning a car will allow me to travel faster.V14-3 Owning a car will allow me to transport more itemsV14-4 Owning a car will allow me to travel more comfortably.
Fifth and sixth section
The title of these two sections of questions stated as “think about your purchase behavior
and assume you are going to buy a new car. How much do you agree or disagree with the
following statements? Even if you are not entirely sure, check the box that best describes
your feeling or opinion”. I want participants to assume that they are going to purchase a new
car and their reaction to certain statements as well as their possible behaviors. Proposed
predictors contained to the fifth and sixth section are: V2 – Assessment of fuel price; V3 –
Assessment of insurance price; V4 – Perception of brand consciousness; V6 – Preference for
Japanese cars; V10 – Perceived peer/friends influence; V11 – Perceived influence from
parents/siblings; and V13 – Recommendations by websites.
Strongly Disagree
Disagree Neutral Agree Strongly Agree
V13-2 I would use car rating websites to get in-depth information about products &services.V4-2 Sometimes I am willing to pay more money for a product because of its brand name.V13-4 I use car rating websites to find information to reduce the risk of making a bad product/service choice.V13-1I do my online research to make informed car buying decisions.
67

V4-1 I pay attention to the brand of the car I’m going to buy.V13-3 I would use car rating websites to learn how to solve problems involved in a purchase decision.V4-3 I don’t care much about the brand’s name when it comes to car purchase.
Strongly Disagree
Disagree Neutral Agree Strongly Agree
V2-1 If the current gas price is high, I won’t consider buying a new car.V2-2 Fuel price is what I care a lot concerning about a new car purchase.V2-3 I would be more likely to buy a car when the fuel price is considerable.V2-4 I don’t think fuel price would affect my willingness of buying a car.
Strongly Disagree
Disagree Neutral Agree Strongly Agree
V3-3 I would carefully assess the price of car insurance when making a car purchase decision.V6-2 Cars made in Japan occupy a very strong competitive position in comparison to cars made by other countries.V3-4 Price of insurance doesn’t bother me when buying a new car.V6-4 Cars made in Japan are always carefully produced.V11-4 Parents and siblings’ recommendation doesn't post any effect on my car purchasing decision.
68

V10-2 I consider my friends who have bought cars as experts in car purchasing.V11-2 I consider my parents and siblings’ recommendation on cars very valuable.V10-4 I would do the research myself rather than ask my friends who have bought cars before.V3-1 I’d prefer a more reasonable insurance price when I am about to buy a new car.
Strongly Disagree
Disagree Neutral Agree Strongly Agree
V3-2 I won’t consider too much about the insurance price when I am about to buy a new car.V6-1 Cars made in Japan are Vuite reliable and seem to last the desired length of time.V11-3 I would think of my parents/siblings’ driving experience first when I’m going to buy a car.V11-1 I would seriously think over my parents and sibling’s advice when buying a new car.V10-3 I think of my friends as a good source of car information.V6-3 Cars made in Japan are generally of a lower quality in comparison to others.V10-1 I would ask my friends for information about my car purchase.
Seventh section
For this section, I chose the set of measurements that measures individuals attitudes toward
future car ownership. The intro statement is, “For these questions, think about your car
69

ownership if you have a car, or assume your future car ownership if you don’t. How much
do you agree or disagree with the following statements? Even if you are not entirely sure,
check the box that best describes your feeling or opinion”. The proposed predictors
concluded in this section are V5 – Perceived satisfaction of brand; and V7 – Psychological value
of car ownership.
Strongly Disagree
Disagree Neutral Agree Strongly Agree
V5-1 Owning a certain brand of car would give me pleasure.V7-2 Owning a car makes me feel more in control of my life.V5-3 I enjoy having my own car of a certain brand.V7-4 Cars are a symbol of successful modern life.V7-1 Owning a car is a symbol of my success in lifeV5-2 Owning a certain brand of car makes me feel good about myself.V7-3 Owning a car will be necessary in the future’V5-4 I don’t care much about having my own car of a particular brand.
Final section
This final section of measurements includes the set of designed single-item measures,
labeled from V17 to V50. I strategically set the order of these variables according to the
measurement design principles. The final set of questions is attached at the end of this report as
Appendix I.
70

X. DATA COLLECTION & ANALYSIS OF MEASURES
For this project, I planned a 2-step schedule for my data collection, including a pretest and
the final survey. Due to the fact that I myself am not a native English speaker, I conducted the
pre-test procedure through which I asked 5 native English speakers (3 graduate students from
Boston University; 1 undergraduate student from MIT; 1 undergraduate student from UCSD) to
pre-read the survey questionnaire and: a. fixed the minor grammatical errors; b. gave their
personal interpretations of each questions; c. reported if there were any sentences that didn't
make sense to them. The purpose of this pre-test is finding out if there were vague expressions of
measurements that might led to participants misunderstandings. Then I revised both the
language and format mistakes found by the pre-testers.
Due to the limitations on time, location and other factors, I decided to administer 2 separate
data collection ----- both offline and online data collection. The offline survey questionnaires
were sent to students at Boston University George Sherman Union, on Wednesday, March 25th.
The online questionnaires were conducted on Qualtrics.com, and send to Boston University
students via their @bu.edu emails.
Step 1: Quantitative Pre-test
After the data collection, a total of 129 surveys were collected (35 online and 94 offline).
After the qualitative check and review by the researcher, 119 valid questionnaires were kept and
the corresponding data were entered in SPSS for further analysis. In order to better track the
whole data analysis process, the researcher conducted a coding strategy for each variable. First
of all, the researcher coded each question in the final questionnaire with a serial number of its
71

corresponding variable. The coded survey questionnaire is attached as Appendix II (“Q”
represents questions’ order in final survey questionnaire; “V” represents variable order listed in
previous measurement design).
Next, sixty-four multiple-item measures for 16 five-point, Likert type variables were
assigned numerals from 1 to 5, with 1 representing the lowest level of likelihood and 5
representing the highest. As for single-item measures for nominal variables, the coding rules are
listed as below:
Coding Rule for Nominal Variables
Q8. (V46) Do you own a legal driver’s
license?
Yes 1
No 2
Q9. (V47) Have you ever owned a private
car?
Yes 1
No 2
Q10. (V35-V39) For the following
statements, which one best describes your
intended timeframe of buying a new car?
(Please select ONLY ONE).
V35 I already have a car and I
don’t need to buy a new one.
Yes 1
No 0
V36 I would like to buy a new car
now.
Yes 1
No 0
V37 I will buy a car as soon as I
could afford one.
Yes 1
No 0
V38 I might buy a car one day,
but it’s not my primary concern.
Yes 1
No 0
V 39 I have no intention of
buying a car in the next 10 years.
Yes 1
No 0
Q15. (V49) Are you male or female? Male 1
Female 2
Q16. (V50) Which of the following describes your current academic level
Freshman 1Sophomore 2Junior 3Senior 4Graduate 5
72

Having completed these steps, the researcher started to analyze the content validity and
reliability of each measure.
Step 2: Analysis of Content Validity and Reliability
After determining that the data was ready for further analysis, I listed my proposed item
groupings. Since all the measures were developed by the researcher, thus each variable (with
multiple-item measures) was seen as a proposed item group. The final proposed item groupings
were listed as below:
Proposed Item Groupings
V1 Assessment of overall purchase price Q1, Q8, Q10, RecodeQ12
V2 Assessment of fuel price Q36, Q37, Q38, Recode Q39
V3 Assessment of insurance price Q40, R-Q42, Q48, R-Q49
V4 Perception of brand consciousness Q30, Q33, Recode Q35
V5 Perceived satisfaction of brand Q56, Q58, Q61, Recode Q63
V6 Preference for Japanese cars Q41, Q43, Q50, Recode Q54
V7 Psychological value of car ownership Q57, Q59, Q60, Q62
V8 Perceived need for uniqueness Q2, Q5, Q6, Q11
V9 Attitudes toward social-function Q3, Q4, Q7, Q9
V10 Perceived peer/friends’ influence Q45, Recode Q47, Q53, Q55
V11 Perceived influence from parents/siblings Recode Q44, Q46, Q51, Q52
V12 Perceived influence of SNS advertising Q13, Q14, Q15, Recode Q16
V13 Recommendations by websites Q29, Q31, Q32, Q34
V14 Perceived ease of travel Q25, Q26, Q27, Q28
V15 Perceived convenience of going to school Q17, Recode Q19, Q22, Q24
V16 Perceived availability of public transportation Q18, Q20, Q21, Recode Q23
73

According to the groupings, the researcher first ran the frequencies distribution for each
indicator to check if there are any coding errors or outliers that might influence the later analysis.
The final frequencies output for each indicator is available in Appendix III of this report.
Next, in order to make sure each proposed grouping was reasonable, the researcher ran the
inter-item correlation matrix for each group of measures as an initial check and a correlation
matrix for all indicators. The SPSS output of inter-item correlation in each of the proposed
grouping can be found in Appendix IV. Two possible problematic groupings were listed as
below.
V1 Assessment of overall purchase price - Q1, Q8, Q10, RecodeQ12
As we can see from the correlation matrix, the indicator “To me, the overall purchase price
doesn’t matter at all” had a correlation coefficient of .129 and .052 respectively to indicators V1-
2 and V1-3. Thus I decided to delete this indicator (V1-4, RecodedQ12) for the later factor
analysis. After reviewing the indicator, the researcher qualitatively analyzed the measure and 74

found that the word of “at all” might be too extreme so that the participants didn't report a
relative correlated answer as for other questions.
V7 Psychological value of car ownership – Q57, Q59, Q60, Q62
In this grouping of indicators, the indicator “Owning a car will be necessary in the future”
had a correlation coefficient of .183 and .054 respectively to the indicators V7-4 and V7-1. Thus
I decided to delete this indicator (V7-3, Q62) for the later factor analysis. Similar to V1-4, the
researcher determined the word “necessary” delivered a feeling of absolution so that it affected
the consistency of this set of questions.
Having finished the initial checks of each set of indicators, the researcher preceded the
factor analysis to quantitatively address the content validity of proposed multiple item measures.
The factor analysis for this project was conducted in six stages. The description of each stage
was listed below:
75

Stages of Factor Analysis Conducted
Stage Description
One Rotated Varimax principle components factor analysis on all items, 16 factors
specified
Two Rotated Varimax principle components factor analysis on all items, 14 factors
specified
Three Rotated Varimax principle components factor analysis parts of the items, 14
factors specified; Indicators V13-2, V 15-2 deleted.
Four Rotated Varimax principle components factor analysis parts of the items, 13
factors specified; Indicators V13-2, V15-2, V10–1, V11-4 deleted; V4-
Percepetion of brand consciousness deleted.
*Five Rotated Varimax principle components factor analysis parts of the items, 13
factors specified; Indicators V13-2, V15-2, V10 –1, V11-4 deleted; V4-
Percepetion of brand consciousness deleted; V7 removed (temporarily).
*Six Rotated Varimax principle components factor analysis parts of the items, 13
factors specified; Indicators V13-2, V15-2, V10 –1, V11-4 deleted; V4-
Percepetion of brand consciousness deleted; V5 removed (temporarily).
In the first stage, the researcher ran the factor analysis and extracted 16 specified factors.
The SPSS result showed that 2 factor columns were “empty”, without any indicator grouped into
it. Thus the research determined to run a 14-facor analysis. In the second stage, although the
grouping appeared more reasonable than the first try, the factor loadings showed that two
indicators, V13-2 and V15-2, seemed hard to be grouped into the factor they supposed to be in.
some certain sets of indicators were grouped together as a single variable. As the factor loadings
are considered to be the correlation between the indicator and the corresponding factor, we may
conclude that there might be some errors in these two indicators. Thus in the next stage of factor
analysis, these two indicators were deleted.76

In the next stage of factor analysis, two major findings were showed through the SPSS
output: a. compared the past three times factor analysis and the rotated component matrix, V4 –
Perception of brand consciousness seemed couldn't be grouped as a single factor or combined to
other factors; b. other indicators were successfully grouped into certain factors together, however
V10-1 and V11-4 had relatively low factor loadings, compared to the other indicators’ factor
loadings within the same factor groups. According to these two findings, the researcher decided
to delete V10-1, V11-4, V4 – Perception of brand consciousness and run a 13-factor analysis.
After the above 4 stages, the proposed indicators were successfully grouped together. This
final matrix is available as Appendix V at the end of the report. According to the matrix, V8 -
Perceived need for uniqueness and V9 - Attitudes toward social-function were grouped together.
This is reasonable as these two variable and their measures were all about perceived
psychological uniqueness. Thus the researcher combined these two variables into a new variable
named Perceived personal uniqueness.
Another thing needs to be mentioned was that the original V5 – Perceived satisfaction of
brand and the original V7 – Psychological value of car ownership were grouped into one factor,
but apparently these two concepts do not overlap with each other. Then, the researcher carefully
reviewed the content of these two constructs and the contained measures. From this qualitative
analysis, the researcher found that V5 measured respondents’ attitudes toward brands, whereas
V7 measured respondents’ beliefs toward car ownership. According to the theoretical framework
mentioned above, attitude toward car brands might influence the beliefs toward car ownership.
Having this mindset, the research ran another two separate factor analysis, through which one of
the two variables (V5 and V7) was removed. The result showed that these two variables could be
considered as two separate factors. 77

Thus, after a total of six times factor analysis, the researcher concluded that 14 factors could
be retrieved from this project. The final groupings and the each indicator’ factor loading are
listed below:
Factor Loadings by Constructs
Construct IndicatorsFactor
Loading
Attitudes toward
brands
V5-1 Owning a certain brand of car would give me
pleasure.
0.7
V5-3 I enjoy having my own car of a certain brand. 0.853
V5-2 Owning a certain brand of car makes me feel
good about myself.
0.775
RecodeV5-4 I don’t care much about having my own
car of a particular brand.
0.668
Beliefs about car
ownership
V7-2 Owning a car makes me feel more in control of
my life.
0.46
V7-4 Cars are a symbol of successful modern life. 0.725
V7-1 Owning a car is a symbol of my success in life 0.725
Perceived
personal
uniqueness
V8-4 I always try to find a more interesting version of
ordinary products because I enjoy being original
0.712
V8-1 I often seek out for new products or brands that
will add to my personal uniqueness.
0.445
V8-2 I dislike brands or products that are purchased
by everyone.
0.484
V8-3 Having an eye for products that are interesting
and unusual helps me in establishing a distinctive
image.
0.565
78

V9-2 The brands and products I bought help me
express myself.
0.681
V9-3 The brands and products I bought is a symbol of
my social status.
0.48
V9-4 The brands and products I chose fit me into
certain social situations.
0.583
V9-1 The brands I choose reflect the kind of person I
see myself to be.
0.653
Assessment of
fuel price
V2-1 If the current gas price is high, I won’t consider
buying a new car.
0.856
V2-2 Fuel price is what I care a lot concerning about a
new car purchase.
0.893
V2-3 I would be more likely to buy a car when the
fuel price is considerable.
0.751
Recode V2-4 I don’t think fuel price would affect my
willingness of buying a car
0.811
Perceived
influence of SNS
advertising
V12-1 I consider SNS advertising very essential. 0.756
V12-2 I often click on SNS banner ads. 0.812
V12-3 I like banner ads of products shown on SNSs. 0.717
Recode V12-4 SNS advertisement usually won’t catch
my eyes.
0.545
Assessment of
insurance price
Price of insurance doesn’t bother me when buying a
new car.
0.817
I won’t consider too much about the insurance price
when I am about to buy a new car.
0.811
V3-3 I would carefully assess the price of car
insurance when making a car purchase decision.
0.527
V3-1 I’d prefer a more reasonable insurance price
when I am about to buy a new car.
0.691
79

Perceived ease of
travel
V14-1 Owning a car will allow me to travel to more
places I wish to go.
0.792
V14-2 Owning a car will allow me to travel faster. 0.572
V14-3 Owning a car will allow me to transport more
items
0.751
V14-4 Owning a car will allow me to travel more
comfortably.
0.723
Perceived
convenience of
going to school
V15-1 It's very convenient to go to school from where
I live.
0.811
V15-4 It’s fast and easy to go to school from where I
live.
0.784
Recode V15-3 I suffered from going to school every
day because of the transportation
0.653
Beliefs of
recommendations
by websites
V13-4 I use car rating websites to find information to
reduce the risk of making a bad product/service
choice.
0.791
V13-1I do my online research to make informed car
buying decisions.
0.787
V13-3 I would use car rating websites to learn how to
solve problems involved in a purchase decision.
0.807
Perceived
availability of
public
transportation
V16-2 Local public transportation leads me to most of
the places.
0.404
V16-4 It’s very convenient and fast to take public
transportation here rather than driving myself.
0.606
V16-1 I’m satisfied with our local public
transportation.
0.799
Recode V16-3 The local public transit systems here
always cause me problems.
0.805
Perceived
influence from
V11-2 I consider my parents and siblings’
recommendation on cars very valuable.
0.736
80

parents/siblings
V11-3 I would think of my parents/siblings’ driving
experience first when I’m going to buy a car.
0.726
V11-1 I would seriously think over my parents and
sibling’s advice when buying a new car.
0.643
Perceived
peer/friends’
influence
V10-2 I consider my friends who have bought cars as
experts in car purchasing.
0.697
V10-3 I think of my friends as a good source of car
information.
0.725
Recode V10-4 I would do the research myself rather
than ask my friends who have bought cars before.
0.671
Preference for
Japanese cars
V6-2 Cars made in Japan occupy a very strong
competitive position in comparison to cars made by
other countries.
0.505
V6-4 Cars made in Japan are always carefully
produced.
0.707
V6-1 Cars made in Japan are Vuite reliable and seem
to last the desired length of time.
0.832
Recode V6-3 Cars made in Japan are generally of a
lower quality in comparison to others.
0.425
Assessment of
overall purchase
price
V1-1 In general, I always carefully think about prices
before buying.
0.653
V1-2 Product price is what I care about most when I
buy certain products.
0.8
V1-3 I go for the price first rather than thinking about
other features.
0.795
Having determined this as a reasonable solution, the researcher then assessed the overall
measure of quantitative adequacy, also known as percentage of variance explained. The SPSS
81

output showed the cumulative percentage of variance explained by this solution was 69.804%.
Thus we may conclude that this factor analysis solution would be our final solution.
The final step of the content validity analysis would be assessing each new grouped
construct’s reliability coefficient. The table of computed items’ reliability is listed below:
Reliability Analysis by Constructs
Item Alpha if Item Deleted
Attitudes toward brands - Cronbach’s Alpha = .868
V5-1 Owning a certain brand of car would give me pleasure. .820
V5-3 I enjoy having my own car of a certain brand. .797
V5-2 Owning a certain brand of car makes me feel good about
myself.
.830
RecodeV5-4 I don’t care much about having my own car of a
particular brand.
.876
Beliefs about car ownership - Cronbach’s Alpha = .735
V7-2 Owning a car makes me feel more in control of my life. .818
V7-4 Cars are a symbol of successful modern life. .426
V7-1 Owning a car is a symbol of my success in life. .583
Perceived personal uniqueness - Cronbach’s Alpha = .833
V8-4 I always try to find a more interesting version of ordinary
products because I enjoy being original
.826
V8-1 I often seek out for new products or brands that will add to
my personal uniqueness.
.817
V8-2 I dislike brands or products that are purchased by everyone. .835
V8-3 Having an eye for products that are interesting and unusual
helps me in establishing a distinctive image.
.816
V9-2 The brands and products I bought help me express myself. .806
V9-3 The brands and products I bought is a symbol of my social
status.
.804
V9-4 The brands and products I chose fit me into certain social .806
82

situations.
V9-1 The brands I choose reflect the kind of person I see myself to
be.
.800
Assessment of fuel price - Cronbach’s Alpha = .865
V2-1 If the current gas price is high, I won’t consider buying a
new car.
.822
V2-2 Fuel price is what I care a lot concerning about a new car
purchase.
.796
V2-3 I would be more likely to buy a car when the fuel price is
considerable.
.863
Recode V2-4 I don’t think fuel price would affect my willingness
of buying a car
.825
Perceived influence of SNS advertising - Cronbach’s Alpha = .763
V12-1 I consider SNS advertising very essential. .738
V12-2 I often click on SNS banner ads. .625
V12-3 I like banner ads of products shown on SNSs. .719
Recode V12-4 SNS advertisement usually won’t catch my eyes. .741
Assessment of insurance price - Cronbach’s Alpha = .775
Recode V3-4 Price of insurance doesn’t bother me when buying a
new car.
.690
Recode V3-2 I won’t consider too much about the insurance price
when I am about to buy a new car.
.687
V3-3 I would carefully assess the price of car insurance when
making a car purchase decision.
.753
V3-1 I’d prefer a more reasonable insurance price when I am
about to buy a new car.
.740
Perceived ease of travel - Cronbach’s Alpha = .739
V14-1 Owning a car will allow me to travel to more places I wish
to go.
.721
V14-2 Owning a car will allow me to travel faster. .731
83

V14-3 Owning a car will allow me to transport more items .628
V14-4 Owning a car will allow me to travel more comfortably. .638
Perceived convenience of going to school - Cronbach’s Alpha = .733
V15-1 It's very convenient to go to school from where I live. .619
V15-4 It’s fast and easy to go to school from where I live. .641
Recode V15-3 I suffered from going to school every day because
of the transportation
.676
Beliefs of recommendations by websites - Cronbach’s Alpha = .807
V13-4 I use car rating websites to find information to reduce the
risk of making a bad product/service choice.
.763
V13-1I do my online research to make informed car buying
decisions.
.732
V13-3 I would use car rating websites to learn how to solve
problems involved in a purchase decision.
.714
Perceived availability of public transportation - Cronbach’s Alpha = .706
V16-2 Local public transportation leads me to most of the places. .665
V16-4 It’s very convenient and fast to take public transportation
here rather than driving myself.
.642
V16-1 I’m satisfied with our local public transportation. .602
Recode V16-3 The local public transit systems here always cause
me problems.
.661
Perceived influence from parents/siblings - Cronbach’s Alpha = .716
V11-2 I consider my parents and siblings’ recommendation on
cars very valuable.
.577
V11-3 I would think of my parents/siblings’ driving experience
first when I’m going to buy a car.
.731
V11-1 I would seriously think over my parents and sibling’s
advice when buying a new car.
.569
Perceived peer/friends’ influence - Cronbach’s Alpha = .586
V10-2 I consider my friends who have bought cars as experts in .488
84

car purchasing.
V10-3 I think of my friends as a good source of car information. .341
Recode V10-4 I would do the research myself rather than ask my
friends who have bought cars before.
.618
Preference for Japanese cars - Cronbach’s Alpha = .719
V6-2 Cars made in Japan occupy a very strong competitive
position in comparison to cars made by other countries.
.724
V6-4 Cars made in Japan are always carefully produced. .605
V6-1 Cars made in Japan are Vuite reliable and seem to last the
desired length of time.
.615
Recode V6-3 Cars made in Japan are generally of a lower quality
in comparison to others.
.677
Assessment of overall purchase price - Cronbach’s Alpha = .700
V1-1 In general, I always carefully think about prices before
buying.
.743
V1-2 Product price is what I care about most when I buy certain
products.
.485
V1-3 I go for the price first rather than thinking about other
features.
.561
According to the computed Cronbach’s Alpha shown above, the researcher found that
within the variable Beliefs about car ownership, if the indicator marked “V7-2 Owning a car
makes me feel more in control of my life” were deleted, the reliability coefficient would increase
by .083, and the Cronbach’s Alpha of the whole variable would raise to .818. Similarly, another
indicator in variable Perceived peer/friends’ influence, marked as “Recode V10-4 I would do the
research myself rather than ask my friends who have bought cars before”, decreased the
reliability coefficient of the whole variable. If deleted, the Cronbach’s Alpha would increase
85

to .618. The researcher decided to discard these two items. Thus, we may conclude that the final
14 constructs were reasonable and reliable for use.
XI. REVISION OF SURVEY & CONCLUSIONS
To sum up, following changes were made after the whole data analysis process (items
marked red were meant to be deleted). The revised survey questionnaire can be found in
Appendix VI at the end of this report.
Proposed Item Groupings
V1 Assessment of overall purchase price Q1, Q8, Q10, RecodeQ12
V2 Assessment of fuel price Q36, Q37, Q38, Recode Q39
V3 Assessment of insurance price Q40, R-Q42, Q48, R-Q49
V4 Perception of brand consciousness Q30, Q33, Recode Q35
V5 Perceived satisfaction of brand Q56, Q58, Q61, Recode Q63
V6 Preference for Japanese cars Q41, Q43, Q50, Recode Q54
V7 Psychological value of car ownership Q57, Q59, Q60, Q62
V8 Perceived need for uniqueness Q2, Q5, Q6, Q11
V9 Attitudes toward social-function Q3, Q4, Q7, Q9
V10
Perceived peer/friends’ influence Q45, Recode Q47, Q53, Q55
V1 Perceived influence from parents/siblings Recode Q44, Q46, Q51, Q5286

1
V12
Perceived influence of SNS advertising Q13, Q14, Q15, Recode Q16
V13
Recommendations by websites Q29, Q31, Q32, Q34
V14
Perceived ease of travel Q25, Q26, Q27, Q28
V15
Perceived convenience of going to school Q17, Recode Q19, Q22, Q24
V16
Perceived availability of public transportation Q18, Q20, Q21, Recode Q23
Through the whole measurement analysis process of this project, the researcher now has
been able to identify a relatively reliable and suitable survey questionnaires and certain
measurements for the client Honda, in order to find out the factors that drive college students’
automobile buying behavior. As for the client, Honda needs to administer the survey to a broader
range of randomly selected sample, to collect data that is more representative. Meanwhile,
further analysis (i.e. multiple regression test) could be conducted to test the real causal
relationships between proposed predictors and the DV. Hopefully, this final set of survey
instrument would help with collecting valuable data and eventually provided effective insights to
the client.
87

XII. REFERENCE
Ajzen, I. (1991). The theory of planned behavior. Organizational Behavior and Human Decision
Processes, 50 (2): 179-211. doi:10.1016/0749-5978(91)90020-T
Ajzen, I. (2006). Constructing a TPB questionnaire: Conceptual and methodological
considerations. Retrieved February 10, 2010, from http://www-
unix.oit.umass.edu/~aizen/pdf/tpb.measurement.pdf
Amjad, N., & Wood, A.M. (2009). Identifying and changing the normative beliefs about
aggression which lead young Muslim adults to join extremist anti-Semitic groups in Pakista.
Aggressive Behavior, Volume 35, pages 514–519 (2009),
from: http://personalpages.manchester.ac.uk/staff/alex.wood/amjadwood.pdf
BBCTopGear. (2012). Paris 2012: the new Golf GTI - BBC Top Gear. topgear.com. Retrieved
March 5, 2015, from:
http://www.topgear.com/uk/tags/Paris-Motor-Show-2012
Beene, R. (2014, March 17). Mazda3 a casualty of Civic-Corolla war. AutoNews.com. Retrieved
March 5, 2015, from:
http://www.autonews.com/article/20140317/OEM04/303179971/mazda3-a-casualty-of-
civic-corolla-war
Bennett, D., Graham, C. (2010). Is loyalty driving growth for the brand in front? A two-purchase
analysis of car category dynamics in Thailand. Journal Of Strategic Marketing [serial
online]. December 2010; 18(7):573-585. Available from: Business Source Complete,
Ipswich, MA. Accessed February 28, 2015.
88

Bian, Q., Forsythe, S.(2012). Purchase intention for luxury brands: A cross cultural comparison,
Journal of Business Research, Volume 65, Issue 10, October 2012, Pages 1443-1451, ISSN
0148-2963, http://dx.doi.org/10.1016/j.jbusres.2011.10.010.
Bodor, N., Hutchinson, P, L., Rose, D. (2013). Car ownership and the association between fruit
and vegetable availability and diet, Preventive Medicine, Volume 57, Issue 6, December
2013, Pages 903-905, ISSN 0091-7435, http://dx.doi.org/10.1016/j.ypmed.2013.10.003.
Bruce, C. (2014, March 18). Mazda3 sales off to rocky start despite massive critical acclaim
[UPDATE]. Autoblog.com. Retrieved March 5, 2015,
from: http://www.autoblog.com/2014/03/18/mazda3-sales-off-to-rocky-start-despite-
massive-critical-acclaim/
Bruner, G. C., II. (2009). Marketing scales handbook: A compilation of multi-item measures for
consumer behavior and advertising research (Vol. 5). Carbondale, IL: GCBII Productions.
Business Wire. (2006, Jan 04). There's more to the cost of a car than just the purchase price - but
don't tell that to shoppers! leading experts in buying and insuring cars team up to find out
what matters most to car buyers. Business Wire. Retrieved 2015, March 5, from
http://search.proquest.com/docview/445305034?accountid=9676
Car of the year (2015). Previous winners, Caroftheyear.org. Retrieved March 5, 2015, from:
http://www.caroftheyear.org/previous-winners/1992_1/coty
Chu, S-C. (2011). Viral advertising in social media: participation in Facebook groups and
responses among college-Aged users. Journal of Interactive Advertising, 12(1), 30-43.
http://dx.doi.org/10.1080/15252019.2011.10722189
89

Collier, J, G. (2006). Honda getting its groove back with Civic. Detroit Free Press.
Retrieved 2015 February 16, from: http://usatoday30.usatoday.com/money/autos/2006-05-
24-civics_x.htm
Collin-Lange, V., Benediktsson, K. (2011). Entering the regime of automobility: car ownership
and use by novice drivers in Iceland. Journal of Transport Geography, Volume 19, Issue 4,
July 2011, Pages 851-858, ISSN 0966-6923,
http://dx.doi.org/10.1016/j.jtrangeo.2010.10.012.
Cullinane, S. (2002). The relationship between car ownership and public transport provision: a
case study of Hong Kong, Transport Policy, Volume 9, Issue 1, January 2002, Pages 29-39,
ISSN 0967-070X, http://dx.doi.org/10.1016/S0967-070X(01)00028-2.
Driscoll, E (2013, April 29). Should college students lease or buy a car? Fox Business. Retrieved
March 4, 2015, from http://www.foxbusiness.com/personal-finance/2013/04/29/should-
college-students-lease-or-buy-car/
Edmunds. (2006). Volkswagen Golf history,edmunds.com. Retrieved March 5, 2015, from:
http://www.edmunds.com/volkswagen/golf/history.html
Edmunds. (2015). Mazda Mazda3 review, edmunds.com. Retrieved March 5, 2015, from:
http://www.edmunds.com/mazda/mazda3/
eMarketer.com (June, 2013). Social networking reaches nearly one in four around the world.
Retrieved August 25, 2013 from http://www.emarketer.com/Article/Social-Networking-
Reaches-Nearly-One-Four-Around-World/1009976.
Fajarindra, B., Schmöcker, J., Fujii, S. (2013). Effects of Peer Influence, satisfaction and regret
on car purchase desire. Procedia Environmental Sciences. Volume 17, 2013, Pages 485-
493, ISSN 1878-0296, http://dx.doi.org/10.1016/j.proenv.2013.02.063.
90

Goodhardt, G., Ehrenberg, A., & Chatfield, C. (1984). The Dirichlet: A comprehensive model of
buying behaviour. Journal of the Statistical Society, A, 147, 621–655.
Green Car Congress. (2010). Honda study dinds insight’s eco assist system results in average
10% improvement in fuel economy after 300 Drives, up to 20% max.
Greencarcongress.com. Retrieved March 5, 2015,
from: http://www.greencarcongress.com/2010/02/honda-study-finds-insights-eco-assist-
system-results-in-average-10-improvement-in-fuel-economy-after.html
Green Car Congress. (2011). Honda Civic Si Concept coupe and Civic Concept sedan debut at
NAIAS; hybrid and natural gas variants. Retrieved March 5, 2015, from:
http://www.greencarcongress.com/2011/01/civic-20110112.html
Hoffer, G., Pruitt, S., Reilly, R. (1992). Market responses to publicly-provided information: the
case of automotive safety. Applied Economics [serial online]. July 1992; 24(7): 661.
Available from: Business Source Complete, Ipswich, MA. Accessed February 22, 2015.
Honda. (2015). History of Honda Civic fifth generation. Retrieved March 5, 2015,
from:http://world.honda.com/CIVIC/generation05/
Honda. (2015). History of Honda Civic first generation. Retrieved March 5, 2015,
from: http://world.honda.com/CIVIC/generation01/
Honda. (2015). History of Honda Civic sixth generation. Retrieved March 5, 2015, from:
http://world.honda.com/CIVIC/generation06/
Honda. (2015). Honda multimatic CVT. Retrieved from Feb.16, from:
http://world.honda.com/CIVIC/technology08/
IHS.inc (2013, July). Automotive data reporting company Polk, IHS.com. Retrived March 5,
2015. From https://www.ihs.com/btp/polk.html
91

Imran, A, M. (2014). Effects of Pre-Purchase Search Motivation on User Attitudes toward
Online Social Network Advertising: A Case of University Students. Journal of
Competitiveness, 6 (2), 42-5510.7441/joc.2014.02.04
J.D. Power. (2009). 2009 Honda Civic DX (M5) Sedan ratings, prices, trims, summary.
JDPower.com. Retrieved March 5, 2015, from:
http://autos.jdpower.com/research/Honda/Civic/2009/Sedan/index.htm
Kent, G. (2007 March 30). VW Golf build passes 25 million. CarMagzine.co. Retrieved March
5, 2015, from: http://www.carmagazine.co.uk/car-news/industry-news/volkswagen/vw-golf-
build-passes-25-million-/
Kopnina, H., Williams, M., 2013. Car attitudes in children from different socio-economic
backgrounds in the Netherlands. Transport Policy, Volume 24, November 2012, Pages 118-
125, ISSN 0967-070X, http://dx.doi.org/10.1016/j.tranpol.2012.07.010.
Koppel, S., Charlton, J., Fildes, B., & Fitzharris, M. (2008). How important is vehicle safety in
the new vehicle purchase process? Accident Analysis & Prevention, Volume 40, Issue 3,
May 2008, Pages 994-1004, ISSN 0001-4575, http://dx.doi.org/10.1016/j.aap.2007.11.006.
Kozel R., Klézl V., & Pawlasová P. (2013). The verification of structural decision-making model
for evaluating education on Facebook. Journal of Competitiveness, 5(3), 76-89. http://
dx.doi.org/10.7441/joc.2013.03.06
Krisher, T. (2010, August 19). Why Honda is growing as Detroit falls behind. SFGate.
Retrieved 2011-10-16, from: http://www.sfgate.com/cgi-bin/article.cgi?f=/c/a/2008/07/03/
BUUM11IVF4.DTL&type=autos
92

Kurani, K, S.,Turrentine, T, S. (2004). Automobile buyer decisions about fuel economy and fuel
efficiency. Institute of Transportation Studies. UC Davis: Institute of Transportation Studies
(UCD). Retrieved from: http://www.escholarship.org/uc/item/6zq891d1
Line, T., Chatterjee, K., Lyons, G., 2012. Applying behavioral theories to studying the influence
of climate change on young people’s future travel intentions. Transportation Research Part
D: Transport and Environment, Volume 17, Issue 3, May 2012, Pages 270-276, ISSN
1361-9209, http://dx.doi.org/10.1016/j.trd.2011.12.004.
Mazda. (2011). Mazda launches second SKYACTIV model in Japan: face-lifted Axela
Volkswagen Golf, Mazda.com. Retrieved March 5, 2015, from:
http://www.mazda.com/publicity/release/2011/201109/110927a.html
NHTSA. (2012). NHTSA crash test results database. SafeCar.gov. Retrieved March 5, 2015,
from: http://www.safercar.gov/Safety+Ratings?
cmpid=EX&agency=ED&outlet=GS&campaignsubcampaign=BrandedSafetyRatingsGener
al-NHTSA&creative=61270802465&keyword=%2Bnhtsa%20%2Bcrash%20%2Btest
%20%2Bratings
O’Toole, J. (2013, April 10). Ford Focus is world's best-selling car. CNNMoney.com. Retrieved
March 5, 2015, from: http://money.cnn.com/2013/04/09/autos/ford-focus/
Ozaki, R., Sevastyanova, K. (2011). Going hybrid:
an analysis of consumer purchase motivations. Energy Policy, 2011, Vol. 39(5), pp.2217-
2227. Doi:10.1016/j.enpol.2010.04.024
Peng, J., Zhang, G., Zhang, S., Dai, X., & Li, J. (2014). Effects of online advertising on
automobile sales. Management Decision, Vol. 52 No. 5, 2014 pp. 834-851. DOI
10.1108/MD-10-2012-0753
93

Punia, B. (2014). The Honda Civic – A legend, a time capsule on wheels. Retrieved Feb. 16,
2015, from: http://www.gaadi.com/blog/the-honda-civic-a-legend-a-time-capsule-on-wheels
Quiroga, T. (2014,July). 2014 Mazda3 frist drive review, CarandDriver.com. Retrieved March
5, 2015, from: http://www.caranddriver.com/reviews/2014-mazda-3-first-drive-review
Shaw, D., & Pease, K. (2010). Car security and the decision to recommend purchase. Crime
Prevention and Community Safety, 12(2), 91-98. doi:http://dx.doi.org/10.1057/cpcs.2010.3
Sigurdardottir, B., Kaplan, S., Møller, M. (2014). The motivation underlying adolescents׳
intended time-frame for driving licensure and car ownership: A socio-ecological approach,
Transport Policy, Volume 36, November 2014, Pages 19-25, ISSN 0967-070X,
http://dx.doi.org/10.1016/j.tranpol.2014.07.001.
Sohail, M., Sahin, O. (2010). Country-of-Origin Effects on Consumers' Evaluations of
Automobiles: Perspectives from a Developing Nation. Journal Of International Consumer
Marketing [serial online]. July 2010; 22(3):245-257. Available from: Business Source
Complete, Ipswich, MA. Accessed February 22, 2015.
Steven J. Ewing (2013, March 29). Volkswagen Golf named 2013 World Car of the
Year. Autoblog.com. Retrieved March 5, 2015, from:
http://www.autoblog.com/2013/03/28/volkswagen-golf-named-2013-world-car-of-the-year/
Takahashi, Y.(2010, November 16). Honda to End Civic Sales in Japan. The Wall Street Journal.
Retrieved 2010-12-28, from
http://www.wsj.com/articles/SB10001424052748704312504575617920923449974
U.S.News (2015). Best affordable small cars ranking. USNews.com. Retrieved March 5, 2015,
from: http://usnews.rankingsandreviews.com/cars-trucks/rankings/Affordable-Small-Cars/
94

U.S.News. (2015). Best affordable compact cars rankings. USNews.com. Retrieved March 4,
2015, from: http://usnews.rankingsandreviews.com/cars-trucks/rankings/Affordable-
Compact-Cars/
U.S.News. (2015). Car Comparison (Mazda3, Golf, Civic). USNews.com, Retrieved March
5, 2015, from: http://usnews.rankingsandreviews.com/cars-trucks/compare/?trims=12758-
371867_12516-369074_12857-373206
U.S.News. (2015). Car Comparison (Soul, Cruze & Focus). USNews.com. Retrieved March
5, 2015, from: http://usnews.rankingsandreviews.com/cars-trucks/compare/?trims=12815-
372408_12666-371478_12665-373274
VolksWagen. (2013). Car of the Year twice - 1992 & 2013. Volkswagen.co. Retrieved March
5, 2015, from: http://www.volkswagen.co.uk/new/golf-vii/explore/reviews-and-awards
Vrkljan, B, H., Anaby, D. What vehicle features are considered important when buying an
automobile? an examination of driver preferences by age and gender, Journal of Safety
Research, Volume 42, Issue 1, February 2011, Pages 61-65, ISSN 0022-4375,
http://dx.doi.org/10.1016/j.jsr.2010.11.006.
Wayland, M. (2014, Aug 28). GM: Chevy Cruze sales top 3 million. live.com. Retrieved March
5, 2015,
fro
m:http://www.mlive.com/auto/index.ssf/2014/08/gm_chevy_cruze_sales_top_3_mil.html
Zhu, C., Zhu, Y., Lu, R., He, R., Xia, Z., (2012). Perceptions and aspirations for car ownership
among Chinese students attending two universities in the Yangtze Delta, China. Journal of
Transport Geography, 2012, Vol.24, pp.315-323. doi:10.1016/j.jtrangeo.2012.03.011
95

Appendix I. Final Survey Questionnaire
1. For the first part of questions, think about yourself and your purchase behavior. How much do you agree or disagree with the following statements? Even if you are not entirely sure, check the box that best describes your feeling or opinion.
Strongly Disagree
Disagree Neutral Agree Strongly Agree
In general, I always think carefully about prices before buying.I always try to find a more interesting version of ordinary products because I enjoy being unique.The brands and products I buy help me express myself.The brands and products I buy are a symbol of my social status.I often seek out new products or brands that will add to my personal uniqueness.I dislike brands or products that are purchased by everyone.
Strongly Disagree
Disagree Neutral Agree Strongly Agree
The brands and products I choose fit me into certain social situations.Product price is what I care about most when I buy certain products.The brands I choose reflect the kind of person I see myself to be.I go for the price first rather than thinking about other features.Having an eye for products that are interesting and unusual helps me in establishing a distinctive image.
Student Opinion SurveyWe are conducting this study to learn about students’ opinions concerning a variety of current
topics. Thank you for taking the time to complete our survey. Your responses are anonymous.
96

To me, the overall purchase price doesn't matter at all.
2. For our next questions, think of your social network sites (SNSs) usage and purchase behavior. How much do you agree or disagree with the following statements?
Strongly Disagree
Disagree Neutral Agree Strongly Agree
I consider SNS advertising very essential.
I often click on SNS banner ads.I like banner ads of products shown on SNSs.
SNS advertisement usually won’t catch my eyes.
3. Our next questions are about your daily experience. How much do you agree or disagree with the following statements? Even if you are not entirely sure, check the box that best describes your feeling or opinion.
Strongly Disagree
Disagree Neutral Agree Strongly Agree
It's very convenient to go to school from where I live.
Local public transportation leads me to most places.
I suffer from going to school every day because of the transportation.It’s very convenient and fast to take public transportation here rather than driving.I’m satisfied with our local public transportation.
To me going to school is easy and convenient, thanks to public transportation.The local public transit system is problematic.It’s fast and easy to go to school from where I live.
4. This set of questions pertains to your experience of travel. How much do you agree or disagree with the following statements? Even if you are not entirely sure, check the box that best describes your feeling or opinion.
Strongly Disagree
Disagree Neutral Agree Strongly Agree
Owning a car will allow me to travel to more places I wish to go.Owning a car will allow me to travel faster.Owning a car will allow me to transport more itemsOwning a car will allow me to travel more comfortably.
97

5. For this part of our questions, think about your purchase behavior and assume you are going to buy a new car. How much do you agree or disagree with the following statements? Even if you are not entirely sure, check the box that best describes your feeling or opinion.
Strongly Disagree
Disagree Neutral Agree Strongly Agree
I would use car rating websites to get in-depth information about products &services.
Sometimes I am willing to pay more money for a product because of its brand name.
I use car rating websites to find information to reduce the risk of making a bad product/service choice.I do my online research to make informed car buying decisions.I pay attention to the brand of the car I’m going to buy.
I would use car rating websites to learn how to solve problems involved in a purchase decision.I don’t care much about the brand’s name when it comes to car purchase.
6. For our next questions, assuming you are going to buy a new car. How much do you agree or disagree
with the following statements? Even if you are not entirely sure, check the box that best describes your
feeling or opinion.
Strongly Disagree
Disagree Neutral Agree Strongly Agree
If the current price of gas is high, I won’t consider buying a new car.When purchasing a new car, I care about the price of gas.I would be more likely to buy a car when the price of gas is affordable.I don’t think the price of gas would affect my willingness to buy a car.
98

Strongly Disagree
Disagree Neutral Agree Strongly Agree
I would carefully assess the price of car insurance when making a car purchase decision.
Cars made in Japan occupy a very strong competitive position in comparison to cars made by other countries.Price of insurance doesn’t bother me when buying a new car.Cars made in Japan are always carefully produced.Parents and siblings’ recommendations don’t affect my car purchasing decision.I consider my friends who have bought cars as experts in car purchasing.I consider my parents and siblings’ recommendations on cars very valuable.I would do the research myself rather than ask my friends who have bought cars before.I’d prefer a more reasonable insurance price when I am about to buy a new car.
Strongly Disagree
Disagree Neutral Agree Strongly Agree
I won’t consider the insurance price when I am about to buy a new car.Cars made in Japan are quite reliable and seem to last the desired length of time.I would think of my parents/siblings’ driving experience first when I’m going to buy a car.I would seriously think over my parents and sibling’s advice when buying a new car.I think of my friends as a good source of car information.Cars made in Japan are generally of a lower quality in comparison to others.I would ask my friends for information about my car purchase.
7. For these questions, think about your car ownership if you have a car, or assume your future car ownership if you don’t. How much do you agree or disagree with the following statements? Even if you are not entirely sure, check the box that best describes your feeling or opinion.
99

Strongly Disagree
Disagree Neutral Agree Strongly Agree
Owning a certain brand of car would give me pleasure.Owning a car makes me feel more in control of my life.I enjoy having my own car of a certain brand.Cars are a symbol of successful modern life.Owning a car is a symbol of success in life
Owning a certain brand of car makes me feel good about myself.Owning a car will be necessary in the future’I don’t care much about owning a car of a particular brand.
Please answer the following questions about yourself:
8. Do you own a legal driver’s license?
Yes No
9. Have you ever owned a car?
Yes No
10. For the following statements, which one best describes your intended time-frame of buying a new
car? (Please select ONLY ONE ).
I already have a car and I don’t need to buy a new one. I would like to buy a new car now. I will buy a car as soon as I could afford one. I might buy a car one day, but it’s not my primary concern. I have no intention of buying a car in the next 10 years
11. Now, assuming you are going to buy a new car TODAY. How important will you rank the following
factors? (1=least important, 5=most important)
1 2 3 4 5
Fuel efficiency
Design/style
Reliability
Makes/models
Storage space
Safety
Comfort
Service quality of maintenance
100

12. IF you were going to buy a new car TODAY, how likely would you be to select each of the following brands? Even if you are not entirely sure, check the box that best describes your feeling or opinion.
Very Unlikely
Somewhat Unlikely
Neutral Somewhat Likely
Very Likely
HondaMazdaToyota
VolkswagenNissan
Hyundai
Or other: _______________________ (Please specify)
13. Think about the Japanese automobile manufacturer Honda. How satisfied are you with the following aspects of its compact car line Honda Civic. Even if you are not entirely sure, check the box that best describes your feeling or opinion. (1=least important, 5=most important)
1 2 3 4 5
PriceFuel efficiency
Appearance/DesignReliability
PowerStorage space
SafetyComfort
Service quality of maintenance
14. How old are you? ___________ years old
15. Are you male or female? Male Female
16. Which of the following describes your current academic level:
Freshman Sophomore Junior Senior Graduate
That concludes our survey. Thanks for your time.
101

Appendix II. Coded Survey Questionnaire
1. For the first part of questions, think about yourself and your purchase behavior. How much do you agree or disagree with the following statements? Even if you are not entirely sure, check the box that best describes your feeling or opinion.
Strongly Disagree
Disagree Neutral Agree Strongly Agree
V1-1 In general, I always carefully think about prices before buying.
Q1
V8-4 I always try to find a more interesting version of ordinary products because I enjoy being original
Q2
V9-2 The brands and products I bought help me express myself.
Q3
V9-3 The brands and products I bought is a symbol of my social status.
Q4
V8-1 I often seek out for new products or brands that will add to my personal uniqueness.
Q5
V8-2 I dislike brands or products that are purchased by everyone.
Q6
V9-4 The brands and products I chose fit me into certain social situations.
Q7
V1-2 Product price is what I care about most when I buy certain products.
Q8
V9-1 The brands I choose reflect the kind of person I see myself to be.
Q9
V1-3 I go for the price first rather than thinking about other features.
Q10
V8-3 Having an eye for products that are interesting and unusual helps me in establishing a distinctive image.
Q11
V1-4 To me, the overall purchase price doesn't Q12
Student Opinion SurveyWe are conducting this study to learn about students’ opinions concerning a variety of current
topics. Thank you for taking the time to complete our survey. Your responses are anonymous.
102

matter at all. R R R R R
2. For our next questions, think of your social network sites’(SNSs) usage and purchase behavior. How much do you agree or disagree with the following statements?
Strongly Disagree
Disagree Neutral Agree Strongly Agree
V12-1 I consider SNS advertising very essential. Q13
V12-2 I often click on SNS banner ads. Q14V12-3 I like banner ads of products shown on SNSs. Q15
V12-4 SNS advertisement usually won’t catch my eyes. R R R R R
Q16
3. Our next questions are about your daily experience. How much do you agree or disagree with the following statements? Even if you are not entirely sure, check the box that best describes your feeling or opinion.
Strongly Disagree
Disagree Neutral Agree Strongly Agree
V15-1 It's very convenient to go to school from where I live.
Q17
V16-2 Local public transportation leads me to most of the places.
Q18
V15-3 I suffered from going to school every day because of the transportation. R R R R R
Q19
V16-4 It’s very convenient and fast to take public transportation here rather than driving myself.
Q20
V16-1 I’m satisfied with our local public transportation. Q21
V15-2 To me going to school is easy and convenient, thanks to the transportation.
Q22
V16-3 The local public transit systems here always cause me problems. R R R R R
Q23
V15-4 It’s fast and easy to go to school from where I live. Q24
4. This set of questions pertains to your experience of travel. How much do you agree or disagree with the following statements? Even if you are not entirely sure, check the box that best describes your feeling or opinion.
Strongly Disagree
Disagree Neutral Agree Strongly Agree
V14-1 Owning a car will allow me to travel to more places I wish to go.
Q25
V14-2 Owning a car will allow me to travel faster. Q26
103

V14-3 Owning a car will allow me to transport more items
Q27
V14-4 Owning a car will allow me to travel more comfortably.
Q28
5. For this part of our questions, think about your purchase behavior and assume you are going to buy a new car. How much do you agree or disagree with the following statements? Even if you are not entirely sure, check the box that best describes your feeling or opinion.
Strongly Disagree
Disagree Neutral Agree Strongly Agree
V13-2 I would use car rating websites to get in-depth information about products &services.
Q29
V4-2 Sometimes I am willing to pay more money for a product because of its brand name.
Q30
V13-4 I use car rating websites to find information to reduce the risk of making a bad product/service choice.
Q31
V13-1I do my online research to make informed car buying decisions.
Q32
V4-1 I pay attention to the brand of the car I’m going to buy.
Q33
V13-3 I would use car rating websites to learn how to solve problems involved in a purchase decision.
Q34
V4-3 I don’t care much about the brand’s name when it comes to car purchase. R R R R R
Q35
6. For our next questions, assuming you are going to buy a new car. How much do you agree or disagree
with the following statements? Even if you are not entirely sure, check the box that best describes your
feeling or opinion.
Strongly Disagree
Disagree Neutral Agree Strongly Agree
V2-1 If the current gas price is high, I won’t consider buying a new car.
Q36
V2-2 Fuel price is what I care a lot concerning about a new car purchase.
Q37
V2-3 I would be more likely to buy a car when the fuel price is considerable.
Q38
V2-4 I don’t think fuel price would affect my willingness of buying a car. R R R R R
Q39
104

Strongly Disagree
Disagree Neutral Agree Strongly Agree
V3-3 I would carefully assess the price of car insurance when making a car purchase decision.
Q40
V6-2 Cars made in Japan occupy a very strong competitive position in comparison to cars made by other countries.
Q41
V3-4 Price of insurance doesn’t bother me when buying a new car. R R R R R
Q42
V6-4 Cars made in Japan are always carefully produced. Q43V11-4 Parents and siblings’ recommendation doesn't post any effect on my car purchasing decision. R R R R
Q44
V10-2 I consider my friends who have bought cars as experts in car purchasing.
Q45
V11-2 I consider my parents and siblings’ recommendation on cars very valuable.
Q46
V10-4 I would do the research myself rather than ask my friends who have bought cars before. R R R R R
Q47
V3-1 I’d prefer a more reasonable insurance price when I am about to buy a new car.
Q48
Strongly Disagree
Disagree Neutral Agree Strongly Agree
V3-2 I won’t consider too much about the insurance price when I am about to buy a new car. R R R R R
Q49
V6-1 Cars made in Japan are Vuite reliable and seem to last the desired length of time.
Q50
V11-3 I would think of my parents/siblings’ driving experience first when I’m going to buy a car.
Q51
V11-1 I would seriously think over my parents and sibling’s advice when buying a new car.
Q52
V10-3 I think of my friends as a good source of car information.
Q53
V6-3 Cars made in Japan are generally of a lower quality in comparison to others. R R R R R
Q54
V10-1 I would ask my friends for information about my car purchase.
Q55
105

7. For these questions, think about your car ownership if you have a car, or assume your future car ownership if you don’t. How much do you agree or disagree with the following statements? Even if you are not entirely sure, check the box that best describes your feeling or opinion.
Strongly Disagree
Disagree Neutral Agree Strongly Agree
V5-1 Owning a certain brand of car would give me pleasure.
Q56
V7-2 Owning a car makes me feel more in control of my life.
Q57
V5-3 I enjoy having my own car of a certain brand. Q58V7-4 Cars are a symbol of successful modern life. Q59V7-1 Owning a car is a symbol of my success in life
Q60
V5-2 Owning a certain brand of car makes me feel good about myself.
Q61
V7-3 Owning a car will be necessary in the future’ Q62V5-4 I don’t care much about having my own car of a particular brand. R R R R R
Q63
Please answer the following questions about yourself:
8. V46 Do you own a legal driver’s license?
Yes 1 No 2
9. V47 Have you ever owned a private car?
Yes 1 No 2
10. For the following statements, which one best describes your intended time-frame of buying a new car ?
(Please select ONLY ONE ). (0/1)
V35 I already have a car and I don’t need to buy a new one. V36 I would like to buy a new car now. V37 I will buy a car as soon as I could afford one. V38 I might buy a car one day, but it’s not my primary concern. V 39 I have no intention of buying a car in the next 10 years
11. Now, assuming you are going to buy a new car TODAY. How important will you rank the following factors?
(1=least important, 5=most important)
1 2 3 4 5V17 Fuel efficiencyV18 Design/styleV19 ReliabilityV20 Makes/modelsV21 Storage space
106

V22 SafetyV23 ComfortV24 Service quality of maintenance
12. IF you were going to buy a new car TODAY, how likely would you be to select each of the following brands? Even if you are not entirely sure, check the box that best describes your feeling or opinion.
Very Unlikely
Somewhat Unlikely
Neutral Somewhat Likely
Very Likely
V40 Honda
V41 MazdaV42 Toyota
V43 VolkswagenV44 Nissan
V45 Hyundai
Or other: _______________________ (Please specify) Vo1
13. Think about the Japanese automobile manufacturer Honda. How satisfied are you with the following aspects of its compact car line Honda Civic. Even if you are not entirely sure, check the box that best describes your feeling or opinion. (1=least important, 5=most important)
1 2 3 4 5
V25 PriceV26 Fuel efficiencyV27 Appearance/DesignV28 ReliabilityV29 PowerV30 Storage spaceV31 SafetyV32 ComfortV33 Service quality of maintenance
14. V48 How old are you? ___________ years old
15. V49 Are you male or female? Male Female
16. V50 Which of the following describes your current academic level:
Freshman Sophomore Junior Senior Graduate
107

Appendix III. Frequency Distribution
V1 Assessment of overall purchase price - Q1, Q8, Q10, RecodeQ12
Statistics
V1-1 In general, I
always carefully think about prices
before buying.
V1-2 Product price is what I
care about most when I buy certain products.
V1-3 I go for the price first rather than
thinking about other features.
To me, the overall
purchase price doesn't matter
at all.
NValid 119 99 118 119
Missing 0 20 1 0
V1-1 In general, I always carefully think about prices before buying.
Frequency Percent Valid Percent Cumulative Percent
Valid
1 3 2.5 2.5 2.5
2 6 5.0 5.0 7.6
3 17 14.3 14.3 21.8
4 61 51.3 51.3 73.1
5 32 26.9 26.9 100.0
Total 119 100.0 100.0
V1-2 Product price is what I care about most when I buy certain products.
Frequency Percent Valid Percent Cumulative Percent
Valid 1 4 3.4 4.0 4.0
2 26 21.8 26.3 30.3
3 35 29.4 35.4 65.7
4 22 18.5 22.2 87.9
5 12 10.1 12.1 100.0108
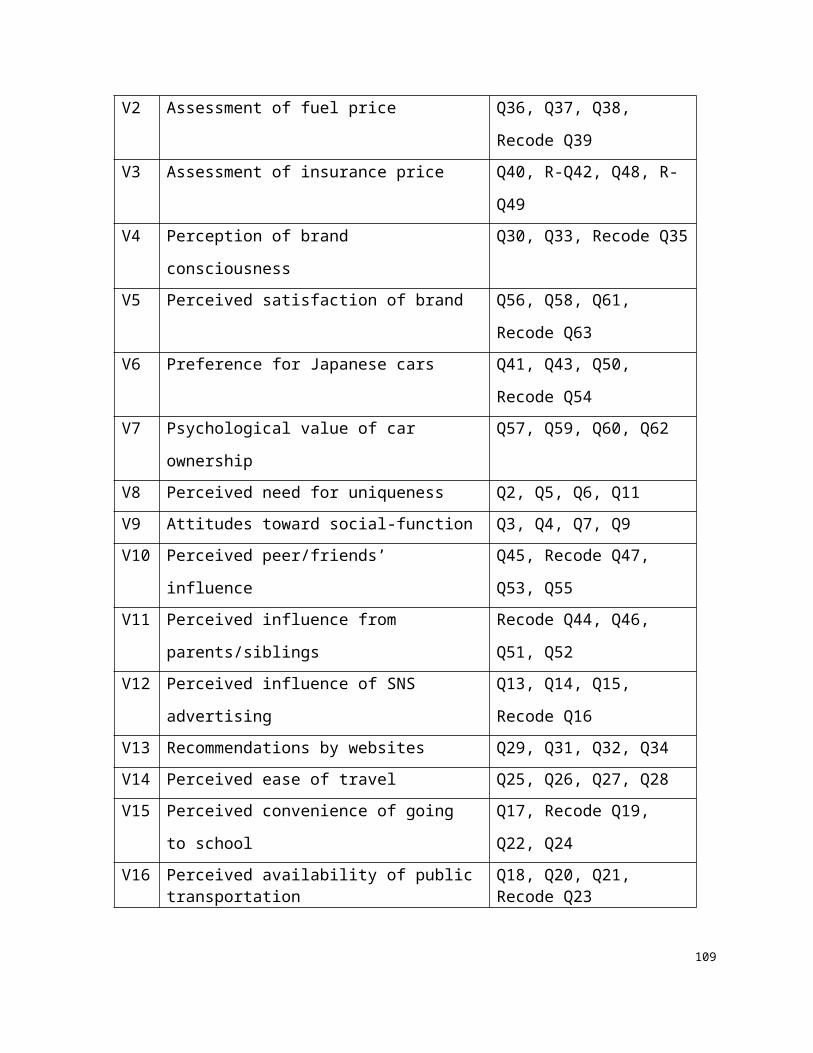
Total 99 83.2 100.0Missing System 20 16.8Total 119 100.0
V1-3 I go for the price first rather than thinking about other features.
Frequency Percent Valid Percent Cumulative Percent
Valid
1 9 7.6 7.6 7.6
2 48 40.3 40.7 48.3
3 36 30.3 30.5 78.8
4 21 17.6 17.8 96.6
5 4 3.4 3.4 100.0
Total 118 99.2 100.0Missing System 1 .8Total 119 100.0
To me, the overall purchase price doesn't matter at all.
Frequency Percent Valid Percent Cumulative Percent
Valid
1.00 4 3.4 3.4 3.4
2.00 7 5.9 5.9 9.2
3.00 20 16.8 16.8 26.1
4.00 60 50.4 50.4 76.5
5.00 28 23.5 23.5 100.0
Total 119 100.0 100.0
V2 Assessment of fuel price – Q36, Q37, Q38, Recode Q3
Statistics
109

V2-1 If the current gas
price is high, I won’t consider buying a new
car.
V2-2 Fuel price is what I care a lot concerning about a new
car purchase.
V2-3 I would be more likely to
buy a car when the fuel price is considerable.
I don’t think fuel price would affect my
willingness of buying a car
NValid 119 119 119 119
Missing 0 0 0 0
V2-1 If the current gas price is high, I won’t consider buying a new car.
Frequency Percent Valid Percent Cumulative Percent
Valid
1 8 6.7 6.7 6.7
2 34 28.6 28.6 35.3
3 44 37.0 37.0 72.3
4 26 21.8 21.8 94.1
5 7 5.9 5.9 100.0
Total 119 100.0 100.0
V2-2 Fuel price is what I care a lot concerning about a new car purchase.
Frequency Percent Valid Percent Cumulative Percent
Valid
1 6 5.0 5.0 5.0
2 23 19.3 19.3 24.4
3 34 28.6 28.6 52.9
4 46 38.7 38.7 91.6
5 10 8.4 8.4 100.0
Total 119 100.0 100.0
V2-3 I would be more likely to buy a car when the fuel price is considerable.
Frequency Percent Valid Percent Cumulative Percent
110

Valid
1 5 4.2 4.2 4.2
2 12 10.1 10.1 14.3
3 31 26.1 26.1 40.3
4 59 49.6 49.6 89.9
5 12 10.1 10.1 100.0
Total 119 100.0 100.0
I don’t think fuel price would affect my willingness of buying a car
Frequency Percent Valid Percent Cumulative Percent
Valid
1.00 13 10.9 10.9 10.9
2.00 40 33.6 33.6 44.5
3.00 33 27.7 27.7 72.3
4.00 27 22.7 22.7 95.0
5.00 6 5.0 5.0 100.0
Total 119 100.0 100.0
V3 Assessment of insurance price – Q40, Recode Q42, Q48, Recode Q49
Statistics
V3-3 I would carefully
assess the price of car
insurance when making a car
purchase decision.
V3-1 I’d prefer a more
reasonable insurance price
when I am about to buy a
new car.
Price of insurance
doesn’t bother me when
buying a new car.
I won’t consider too
much about the insurance price
when I am about to buy a
new car.
NValid 119 119 119 119
Missing 0 0 0 0
V3-1 I’d prefer a more reasonable insurance price when I am about to buy a new car.
111

Frequency Percent Valid Percent Cumulative Percent
Valid
2 4 3.4 3.4 3.4
3 19 16.0 16.0 19.3
4 74 62.2 62.2 81.5
5 22 18.5 18.5 100.0
Total 119 100.0 100.0
Price of insurance doesn’t bother me when buying a new car.
Frequency Percent Valid Percent Cumulative Percent
Valid
1.00 6 5.0 5.0 5.0
2.00 19 16.0 16.0 21.0
3.00 35 29.4 29.4 50.4
4.00 49 41.2 41.2 91.6
5.00 10 8.4 8.4 100.0
Total 119 100.0 100.0
Price of insurance doesn’t bother me when buying a new car.
Frequency Percent Valid Percent Cumulative Percent
Valid
1.00 6 5.0 5.0 5.0
2.00 19 16.0 16.0 21.0
3.00 35 29.4 29.4 50.4
4.00 49 41.2 41.2 91.6
5.00 10 8.4 8.4 100.0
Total 119 100.0 100.0
I won’t consider too much about the insurance price when I am about to buy a new car.
112

Frequency Percent Valid Percent Cumulative Percent
Valid
1.00 2 1.7 1.7 1.7
2.00 15 12.6 12.6 14.3
3.00 22 18.5 18.5 32.8
4.00 62 52.1 52.1 84.9
5.00 18 15.1 15.1 100.0
Total 119 100.0 100.0
V4 Perception of brand consciousness – Q30, Q33, Recode Q35
Statistics
V4-2 Sometimes I am willing to
pay more money for a
product because of its brand name.
V4-1 I pay attention to the brand of the car
I’m going to buy.
I don’t care much about the brand’s name when it comes
to car purchase.
NValid 119 118 119
Missing 0 1 0
V4-2 Sometimes I am willing to pay more money for a product because of its brand name.
Frequency Percent Valid Percent Cumulative Percent
Valid
1 5 4.2 4.2 4.2
2 15 12.6 12.6 16.8
3 27 22.7 22.7 39.5
4 58 48.7 48.7 88.2
5 14 11.8 11.8 100.0
Total 119 100.0 100.0
V4-1 I pay attention to the brand of the car I’m going to buy.
113

Frequency Percent Valid Percent Cumulative Percent
Valid
1 1 .8 .8 .8
2 2 1.7 1.7 2.5
3 22 18.5 18.6 21.2
4 62 52.1 52.5 73.7
5 31 26.1 26.3 100.0
Total 118 99.2 100.0Missing System 1 .8Total 119 100.0
V4-1 I pay attention to the brand of the car I’m going to buy.
Frequency Percent Valid Percent Cumulative Percent
Valid
1 1 .8 .8 .8
2 2 1.7 1.7 2.5
3 22 18.5 18.6 21.2
4 62 52.1 52.5 73.7
5 31 26.1 26.3 100.0
Total 118 99.2 100.0Missing System 1 .8Total 119 100.0
V5 Perceived satisfaction of brand – Q56, Q58, Q61, Recode Q63
Statistics
V5-1 Owning a certain brand of car would give me pleasure.
V5-3 I enjoy having my own car of a certain
brand.
V5-2 Owning a certain brand of car makes me
feel good about myself.
I don’t care much about
having my own car of a
particular brand.
NValid 118 119 119 119
Missing 1 0 0 0
V5-1 Owning a certain brand of car would give me pleasure.
114

Frequency Percent Valid Percent Cumulative Percent
Valid
1 2 1.7 1.7 1.7
2 7 5.9 5.9 7.6
3 25 21.0 21.2 28.8
4 60 50.4 50.8 79.7
5 24 20.2 20.3 100.0
Total 118 99.2 100.0Missing System 1 .8Total 119 100.0
V5-3 I enjoy having my own car of a certain brand.
Frequency Percent Valid Percent Cumulative Percent
Valid
1 1 .8 .8 .8
2 7 5.9 5.9 6.7
3 32 26.9 26.9 33.6
4 57 47.9 47.9 81.5
5 22 18.5 18.5 100.0
Total 119 100.0 100.0
V5-2 Owning a certain brand of car makes me feel good about myself.
Frequency Percent Valid Percent Cumulative Percent
Valid
1 2 1.7 1.7 1.7
2 16 13.4 13.4 15.1
3 34 28.6 28.6 43.7
4 53 44.5 44.5 88.2
5 14 11.8 11.8 100.0
Total 119 100.0 100.0
I don’t care much about having my own car of a particular brand.
115

Frequency Percent Valid Percent Cumulative Percent
Valid
1.00 4 3.4 3.4 3.4
2.00 20 16.8 16.8 20.2
3.00 44 37.0 37.0 57.1
4.00 45 37.8 37.8 95.0
5.00 6 5.0 5.0 100.0
Total 119 100.0 100.0
V6 Preference for Japanese cars - Q41, Q43, Q50, Recode Q54
Statistics
V6-2 Cars made in Japan occupy a very
strong competitive position in
comparison to cars made by
other countries.
V6-4 Cars made in Japan
are always carefully
produced.
V6-1 Cars made in Japan
are Vuite reliable and seem to last the desired
length of time.
Cars made in Japan are
generally of a lower quality in comparison to
others.
NValid 119 119 119 118
Missing 0 0 0 1
V6-2 Cars made in Japan occupy a very strong competitive position in comparison to cars made by other countries.
Frequency Percent Valid Percent Cumulative Percent
Valid 1 2 1.7 1.7 1.7
2 12 10.1 10.1 11.8
3 54 45.4 45.4 57.1
4 38 31.9 31.9 89.1116

5 13 10.9 10.9 100.0
Total 119 100.0 100.0
V6-4 Cars made in Japan are always carefully produced.
Frequency Percent Valid Percent Cumulative Percent
Valid
1 5 4.2 4.2 4.2
2 17 14.3 14.3 18.5
3 59 49.6 49.6 68.1
4 32 26.9 26.9 95.0
5 6 5.0 5.0 100.0
Total 119 100.0 100.0
V6-1 Cars made in Japan are Vuite reliable and seem to last the desired length of time.
Frequency Percent Valid Percent Cumulative Percent
Valid
1 5 4.2 4.2 4.2
2 10 8.4 8.4 12.6
3 68 57.1 57.1 69.7
4 30 25.2 25.2 95.0
5 6 5.0 5.0 100.0
Total 119 100.0 100.0
Cars made in Japan are generally of a lower quality in comparison to others.
Frequency Percent Valid Percent Cumulative Percent
Valid
1.00 4 3.4 3.4 3.4
2.00 10 8.4 8.5 11.9
3.00 48 40.3 40.7 52.5
4.00 45 37.8 38.1 90.7
5.00 11 9.2 9.3 100.0
Total 118 99.2 100.0
117

Missing System 1 .8Total 119 100.0
V7 Psychological value of car ownership – Q57, Q59, Q60, Q62
Statistics
V7-2 Owning a car makes me feel more in control of my
life.
V7-4 Cars are a symbol of successful
modern life.
V7-1 Owning a car is a symbol of my success
in life
V7-3 Owning a car will be
necessary in the future’
NValid 119 119 119 119
Missing 0 0 0 0
V7-2 Owning a car makes me feel more in control of my life.
Frequency Percent Valid Percent Cumulative Percent
Valid
2 4 3.4 3.4 3.4
3 29 24.4 24.4 27.7
4 62 52.1 52.1 79.8
5 24 20.2 20.2 100.0
Total 119 100.0 100.0
V7-4 Cars are a symbol of successful modern life.
Frequency Percent Valid Percent Cumulative Percent
Valid
1 7 5.9 5.9 5.9
2 14 11.8 11.8 17.6
3 47 39.5 39.5 57.1
4 35 29.4 29.4 86.6
5 16 13.4 13.4 100.0
Total 119 100.0 100.0
118

V7-1 Owning a car is a symbol of my success in life
Frequency Percent Valid Percent Cumulative Percent
Valid
1 6 5.0 5.0 5.0
2 30 25.2 25.2 30.3
3 41 34.5 34.5 64.7
4 32 26.9 26.9 91.6
5 10 8.4 8.4 100.0
Total 119 100.0 100.0
V7-3 Owning a car will be necessary in the future’
Frequency Percent Valid Percent Cumulative Percent
Valid
1 1 .8 .8 .8
2 6 5.0 5.0 5.9
3 25 21.0 21.0 26.9
4 55 46.2 46.2 73.1
5 32 26.9 26.9 100.0
Total 119 100.0 100.0
V8 Perceived need for uniqueness – Q2, Q5, Q6, Q11
Statistics
119

V8-4 I always try to find a
more interesting version of ordinary products because I
enjoy being original
V8-1 I often seek out for
new products or brands that will add to my
personal uniqueness.
V8-2 I dislike brands or
products that are
purchased by everyone.
V8-3 Having an eye for products that are
interesting and unusual helps me in establishing
a distinctive image.
NValid 119 119 119 119
Missing 0 0 0 0
V8-4 I always try to find a more interesting version of ordinary productsbecause I enjoy being original
Frequency Percent Valid Percent Cumulative Percent
Valid
1 5 4.2 4.2 4.2
2 6 5.0 5.0 9.2
3 37 31.1 31.1 40.3
4 51 42.9 42.9 83.2
5 20 16.8 16.8 100.0
Total 119 100.0 100.0
V8-1 I often seek out for new products or brands that will add to my personal uniqueness.
Frequency Percent Valid Percent Cumulative Percent
120

Valid
1 3 2.5 2.5 2.5
2 14 11.8 11.8 14.3
3 47 39.5 39.5 53.8
4 43 36.1 36.1 89.9
5 12 10.1 10.1 100.0
Total 119 100.0 100.0
V8-2 I dislike brands or products that are purchased by everyone.
Frequency Percent Valid Percent Cumulative Percent
Valid
1 5 4.2 4.2 4.2
2 39 32.8 32.8 37.0
3 40 33.6 33.6 70.6
4 23 19.3 19.3 89.9
5 12 10.1 10.1 100.0
Total 119 100.0 100.0
V8-3 Having an eye for products that are interesting and unusual helps me in establishing a distinctive image.
Frequency Percent Valid Percent Cumulative Percent
Valid
1 1 .8 .8 .8
2 13 10.9 10.9 11.8
3 43 36.1 36.1 47.9
4 54 45.4 45.4 93.3
5 8 6.7 6.7 100.0
Total 119 100.0 100.0
V9 Attitudes toward social-function – Q3, Q4, Q7, Q9
Statistics
121

V9-2 The brands and products I
bought help me express myself.
V9-3 The brands and products I bought is a
symbol of my social status.
V9-4 The brands and products I
chose fit me into certain
social situations.
V9-1 The brands I
choose reflect the kind of
person I see myself to be.
NValid 118 119 119 100
Missing 1 0 0 19
V9-2 The brands and products I bought help me express myself.
Frequency Percent Valid Percent Cumulative Percent
Valid
1 3 2.5 2.5 2.5
2 7 5.9 5.9 8.5
3 25 21.0 21.2 29.7
4 60 50.4 50.8 80.5
5 23 19.3 19.5 100.0
Total 118 99.2 100.0Missing System 1 .8Total 119 100.0
V9-3 The brands and products I bought is a symbol of my social status.
Frequency Percent Valid Percent Cumulative Percent
Valid
1 6 5.0 5.0 5.0
2 23 19.3 19.3 24.4
3 38 31.9 31.9 56.3
4 38 31.9 31.9 88.2
5 14 11.8 11.8 100.0
Total 119 100.0 100.0
V9-4 The brands and products I chose fit me into certain social situations.
122

Frequency Percent Valid Percent Cumulative Percent
Valid
1 1 .8 .8 .8
2 11 9.2 9.2 10.1
3 31 26.1 26.1 36.1
4 65 54.6 54.6 90.8
5 11 9.2 9.2 100.0
Total 119 100.0 100.0
V9-1 The brands I choose reflect the kind of person I see myself to be.
Frequency Percent Valid Percent Cumulative Percent
Valid
1 4 3.4 4.0 4.0
2 17 14.3 17.0 21.0
3 23 19.3 23.0 44.0
4 42 35.3 42.0 86.0
5 14 11.8 14.0 100.0
Total 100 84.0 100.0Missing System 19 16.0Total 119 100.0
V10 Perceived peer/friends’ influence – Q45, Recode Q47, Q53, Q55 Statistics
V10-2 I consider my friends who have bought
cars as experts in car
purchasing.
I would do the research
myself rather than ask my friends who have bought cars before.
V10-3 I think of my friends as a good source of car information.
V10-1 I would ask my friends for information about my car
purchase.
NValid 119 119 119 119
Missing 0 0 0 0
V10-2 I consider my friends who have bought cars as experts in car purchasing.
123

Frequency Percent Valid Percent Cumulative Percent
Valid
1 9 7.6 7.6 7.6
2 30 25.2 25.2 32.8
3 28 23.5 23.5 56.3
4 42 35.3 35.3 91.6
5 10 8.4 8.4 100.0
Total 119 100.0 100.0
I would do the research myself rather than ask my friends who have bought cars before.
Frequency Percent Valid Percent Cumulative Percent
Valid
1.00 8 6.7 6.7 6.7
2.00 33 27.7 27.7 34.5
3.00 40 33.6 33.6 68.1
4.00 34 28.6 28.6 96.6
5.00 4 3.4 3.4 100.0
Total 119 100.0 100.0
V10-3 I think of my friends as a good source of car information.
Frequency Percent Valid Percent Cumulative Percent
Valid
1 2 1.7 1.7 1.7
2 8 6.7 6.7 8.4
3 40 33.6 33.6 42.0
4 55 46.2 46.2 88.2
5 14 11.8 11.8 100.0
Total 119 100.0 100.0
V10-1 I would ask my friends for information about my car purchase.
124

Frequency Percent Valid Percent Cumulative Percent
Valid
1 1 .8 .8 .8
2 6 5.0 5.0 5.9
3 24 20.2 20.2 26.1
4 69 58.0 58.0 84.0
5 19 16.0 16.0 100.0
Total 119 100.0 100.0
V11 Perceived influence from parents/siblings – Recode Q44, Q46, Q51, Q52 Statistics
Parents and siblings’
recommendation doesn't post any effect on
my car purchasing decision.
V11-2 I consider my parents and
siblings’ recommendation on cars very
valuable.
V11-3 I would think of my
parents/siblings’ driving
experience first when I’m going
to buy a car.
V11-1 I would seriously think
over my parents and
sibling’s advice when buying a
new car.
NValid 118 119 119 119
Missing 1 0 0 0
Parents and siblings’ recommendation doesn't post any effect on my car purchasing decision.
Frequency Percent Valid Percent Cumulative Percent
Valid
1.00 4 3.4 3.4 3.4
2.00 5 4.2 4.2 7.6
3.00 25 21.0 21.2 28.8
4.00 69 58.0 58.5 87.3
5.00 15 12.6 12.7 100.0
Total 118 99.2 100.0Missing System 1 .8Total 119 100.0
125

V11-2 I consider my parents and siblings’ recommendation on cars very valuable.
Frequency Percent Valid Percent Cumulative Percent
Valid
2 4 3.4 3.4 3.4
3 30 25.2 25.2 28.6
4 68 57.1 57.1 85.7
5 17 14.3 14.3 100.0
Total 119 100.0 100.0
V11-3 I would think of my parents/siblings’ driving experience first when I’m going to buy a car.
Frequency Percent Valid Percent Cumulative Percent
Valid
2 14 11.8 11.8 11.8
3 22 18.5 18.5 30.3
4 77 64.7 64.7 95.0
5 6 5.0 5.0 100.0
Total 119 100.0 100.0
V11-1 I would seriously think over my parents and sibling’s advice when buying a new car.
Frequency Percent Valid Percent Cumulative Percent
Valid
1 1 .8 .8 .8
2 5 4.2 4.2 5.0
3 28 23.5 23.5 28.6
4 73 61.3 61.3 89.9
5 12 10.1 10.1 100.0
Total 119 100.0 100.0
V12 Perceived influence of SNS advertising – Q13, Q14, Q15, Recode Q16
126

Statistics
V12-1 I consider SNS
advertising very essential.
V12-2 I often click on SNS banner ads.
V12-3 I like banner ads of
products shown on SNSs.
SNS advertisement usually won’t
catch my eyes.
NValid 119 119 119 119
Missing 0 0 0 0
V12-1 I consider SNS advertising very essential.
Frequency Percent Valid Percent Cumulative Percent
Valid
1 12 10.1 10.1 10.1
2 31 26.1 26.1 36.1
3 32 26.9 26.9 63.0
4 34 28.6 28.6 91.6
5 10 8.4 8.4 100.0
Total 119 100.0 100.0
V12-2 I often click on SNS banner ads.
Frequency Percent Valid Percent Cumulative Percent
Valid
1 38 31.9 31.9 31.9
2 41 34.5 34.5 66.4
3 23 19.3 19.3 85.7
4 15 12.6 12.6 98.3
5 2 1.7 1.7 100.0
Total 119 100.0 100.0
V12-3 I like banner ads of products shown on SNSs.
Frequency Percent Valid Percent Cumulative Percent
Valid 1 38 31.9 31.9 31.9
127
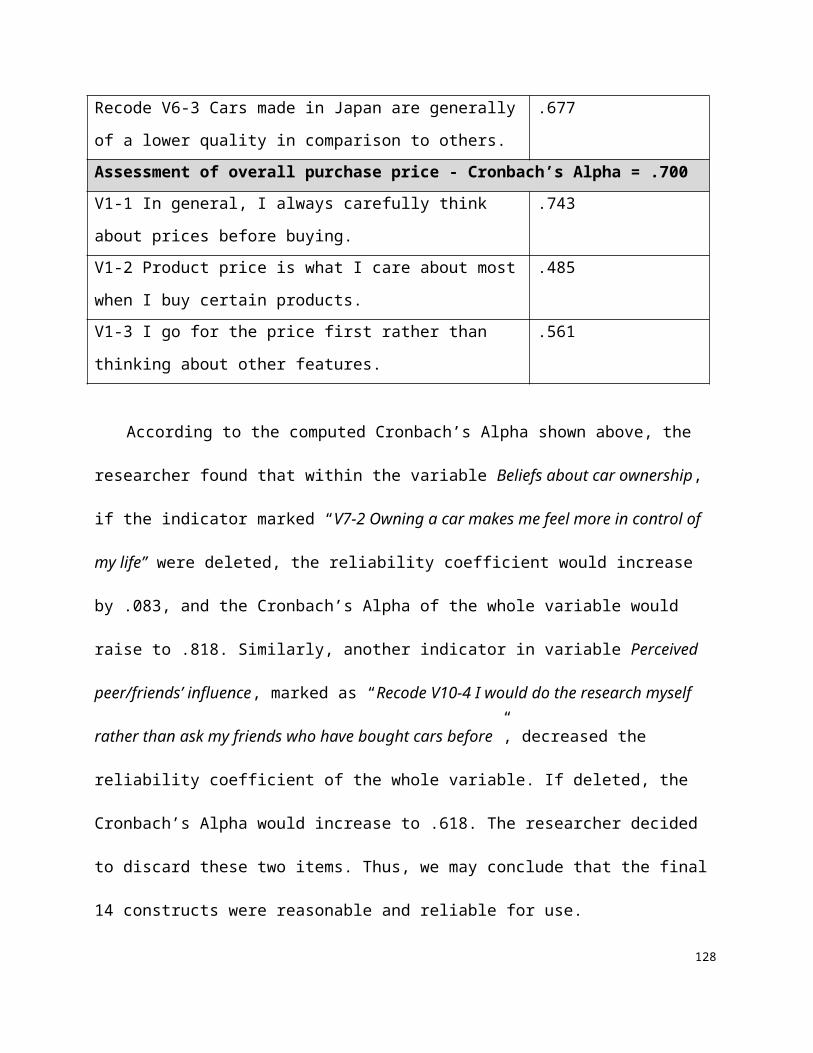
2 38 31.9 31.9 63.9
3 29 24.4 24.4 88.2
4 7 5.9 5.9 94.1
5 7 5.9 5.9 100.0
Total 119 100.0 100.0
SNS advertisement usually won’t catch my eyes.
Frequency Percent Valid Percent Cumulative Percent
Valid
1.00 18 15.1 15.1 15.1
2.00 38 31.9 31.9 47.1
3.00 30 25.2 25.2 72.3
4.00 28 23.5 23.5 95.8
5.00 5 4.2 4.2 100.0
Total 119 100.0 100.0
V13 Recommendations by websites – Q29, Q31, Q32, Q34
Statistics
V13-2 I would use car rating
websites to get in-depth
information about products
&services.
V13-4 I use car rating websites
to find information to reduce the risk
of making a bad
product/service choice.
V13-1I do my online research
to make informed car
buying decisions.
V13-3 I would use car rating websites to learn how to
solve problems involved in a
purchase decision.
NValid 119 119 119 119
Missing 0 0 0 0
128
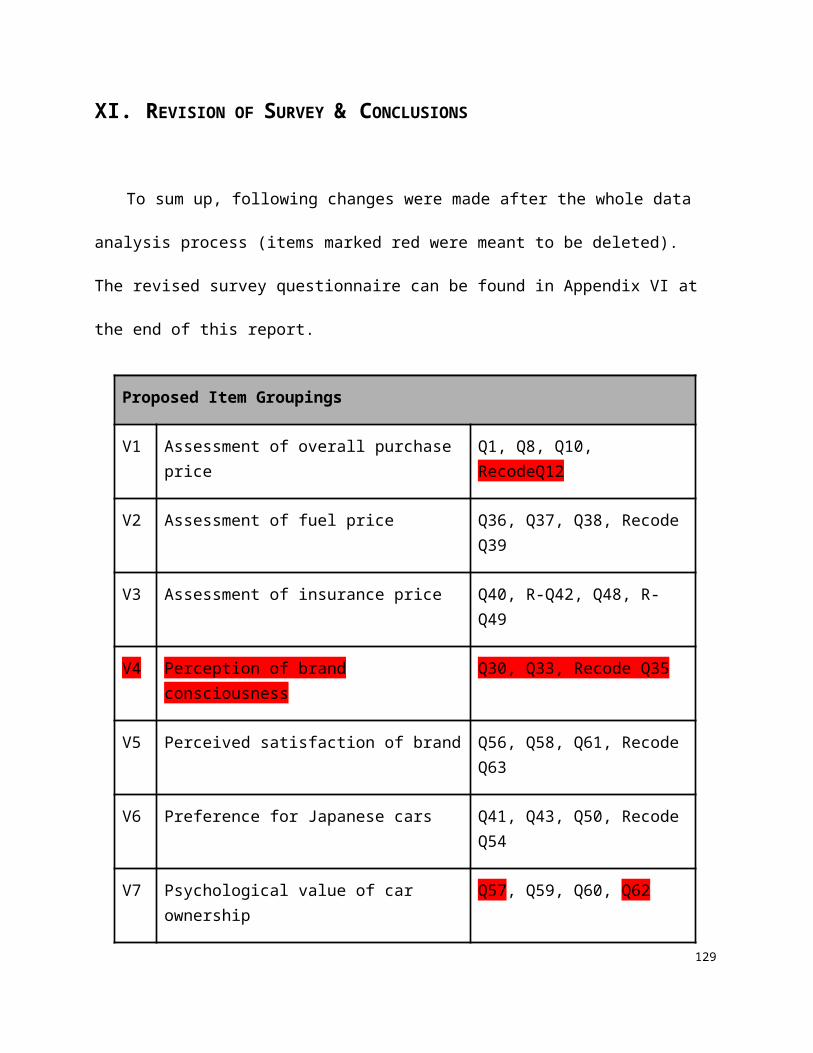
V13-2 I would use car rating websites to get in-depth information about products &services.
Frequency Percent Valid Percent Cumulative Percent
Valid
1 2 1.7 1.7 1.7
2 7 5.9 5.9 7.6
3 29 24.4 24.4 31.9
4 57 47.9 47.9 79.8
5 24 20.2 20.2 100.0
Total 119 100.0 100.0
V13-4 I use car rating websites to find information to reduce the risk of making a bad product/service choice.
Frequency Percent Valid Percent Cumulative Percent
Valid
1 3 2.5 2.5 2.5
2 10 8.4 8.4 10.9
3 17 14.3 14.3 25.2
4 67 56.3 56.3 81.5
5 22 18.5 18.5 100.0
Total 119 100.0 100.0
V13-1I do my online research to make informed car buying decisions.
Frequency Percent Valid Percent Cumulative Percent
Valid
1 1 .8 .8 .8
2 5 4.2 4.2 5.0
3 14 11.8 11.8 16.8
4 63 52.9 52.9 69.7
5 36 30.3 30.3 100.0
Total 119 100.0 100.0
129
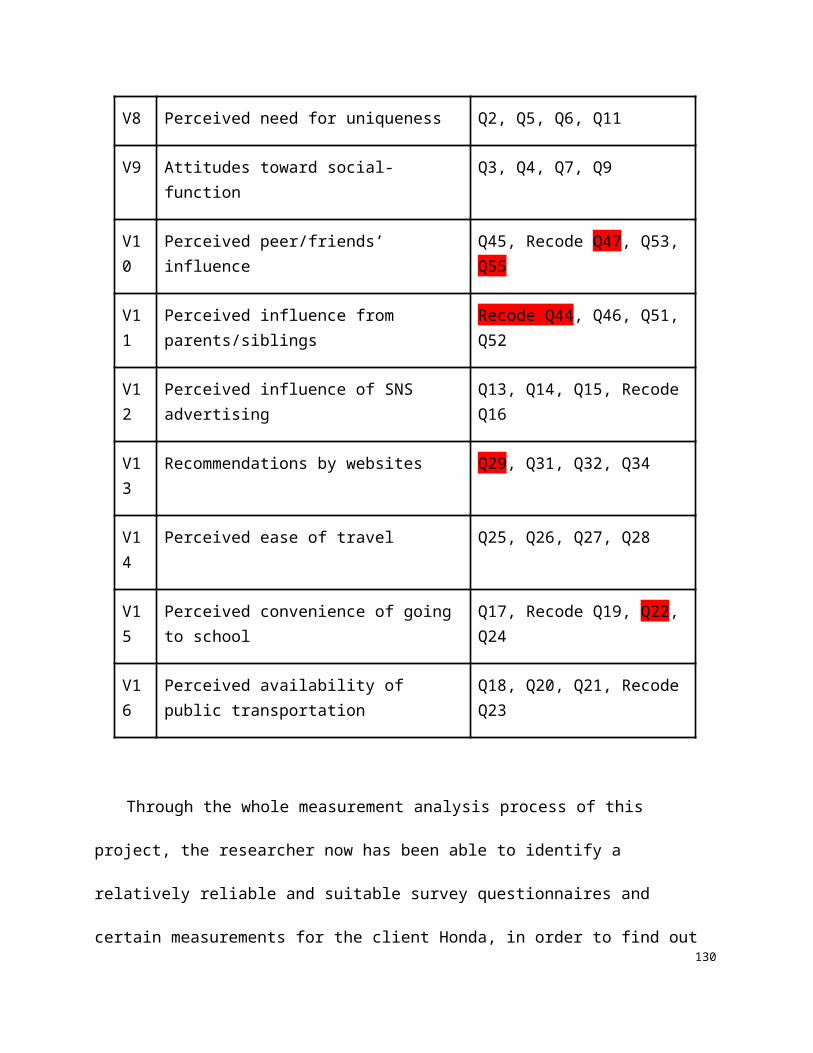
V13-3 I would use car rating websites to learn how to solve problems involved in a purchase decision.
Frequency Percent Valid Percent Cumulative Percent
Valid
1 2 1.7 1.7 1.7
2 11 9.2 9.2 10.9
3 25 21.0 21.0 31.9
4 57 47.9 47.9 79.8
5 24 20.2 20.2 100.0
Total 119 100.0 100.0
V14 Perceived ease of travel – Q25, Q26, Q27, Q28
Statistics
V14-1 Owning a car will allow me to travel to more places I
wish to go.
V14-2 Owning a car will allow
me to travel faster.
V14-3 Owning a car will allow me to transport
more items
V14-4 Owning a car will allow
me to travel more
comfortably.
NValid 119 119 119 119
Missing 0 0 0 0
V14-1 Owning a car will allow me to travel to more places I wish to go.
Frequency Percent Valid Percent Cumulative Percent
Valid
1 1 .8 .8 .8
2 2 1.7 1.7 2.5
3 11 9.2 9.2 11.8
4 59 49.6 49.6 61.3
5 46 38.7 38.7 100.0
Total 119 100.0 100.0
130

V14-2 Owning a car will allow me to travel faster.
Frequency Percent Valid Percent Cumulative Percent
Valid
1 1 .8 .8 .8
2 9 7.6 7.6 8.4
3 20 16.8 16.8 25.2
4 57 47.9 47.9 73.1
5 32 26.9 26.9 100.0
Total 119 100.0 100.0
V14-3 Owning a car will allow me to transport more items
Frequency Percent Valid Percent Cumulative Percent
Valid
2 3 2.5 2.5 2.5
3 10 8.4 8.4 10.9
4 59 49.6 49.6 60.5
5 47 39.5 39.5 100.0
Total 119 100.0 100.0
V14-4 Owning a car will allow me to travel more comfortably.
Frequency Percent Valid Percent Cumulative Percent
Valid
2 3 2.5 2.5 2.5
3 8 6.7 6.7 9.2
4 64 53.8 53.8 63.0
5 44 37.0 37.0 100.0
Total 119 100.0 100.0
V15 Perceived convenience of going to school – Q17, Recode Q19, Q22, Q24
131

Statistics
V15-1 It's very convenient to go to school from where I
live.
V15-2 To me going to school
is easy and convenient,
thanks to the transportation.
V15-4 It’s fast and easy to go to school from where I live.
I suffered from going to school
every day because of the transportation
NValid 119 117 119 119
Missing 0 2 0 0
V15-1 It's very convenient to go to school from where I live.
Frequency Percent Valid Percent Cumulative Percent
Valid
1 5 4.2 4.2 4.2
2 9 7.6 7.6 11.8
3 10 8.4 8.4 20.2
4 57 47.9 47.9 68.1
5 38 31.9 31.9 100.0
Total 119 100.0 100.0
V15-2 To me going to school is easy and convenient, thanks to the transportation.
Frequency Percent Valid Percent Cumulative Percent
Valid
1 11 9.2 9.4 9.4
2 26 21.8 22.2 31.6
3 39 32.8 33.3 65.0
4 35 29.4 29.9 94.9
5 6 5.0 5.1 100.0
Total 117 98.3 100.0Missing System 2 1.7Total 119 100.0
132

V15-4 It’s fast and easy to go to school from where I live.
Frequency Percent Valid Percent Cumulative Percent
Valid
1 7 5.9 5.9 5.9
2 9 7.6 7.6 13.4
3 29 24.4 24.4 37.8
4 51 42.9 42.9 80.7
5 23 19.3 19.3 100.0
Total 119 100.0 100.0
I suffered from going to school every day because of the transportation
Frequency Percent Valid Percent Cumulative Percent
Valid
1.00 4 3.4 3.4 3.4
2.00 9 7.6 7.6 10.9
3.00 21 17.6 17.6 28.6
4.00 60 50.4 50.4 79.0
5.00 25 21.0 21.0 100.0
Total 119 100.0 100.0
V16 Perceived availability of public transportation – Q18, Q20, Q21, Recode Q23
Statistics
V16-2 Local public
transportation leads me to most of the
places.
V16-4 It’s very convenient and
fast to take public
transportation here rather than driving
myself.
V16-1 I’m satisfied with
our local public transportation.
The local public transit systems
here always cause me problems.
NValid 118 119 119 119
Missing 1 0 0 0
V16-2 Local public transportation leads me to most of the places.
133

Frequency Percent Valid Percent Cumulative Percent
Valid
1 5 4.2 4.2 4.2
2 17 14.3 14.4 18.6
3 10 8.4 8.5 27.1
4 56 47.1 47.5 74.6
5 30 25.2 25.4 100.0
Total 118 99.2 100.0Missing System 1 .8Total 119 100.0
V16-1 I’m satisfied with our local public transportation.
Frequency Percent Valid Percent Cumulative Percent
Valid
1 13 10.9 10.9 10.9
2 28 23.5 23.5 34.5
3 31 26.1 26.1 60.5
4 44 37.0 37.0 97.5
5 3 2.5 2.5 100.0
Total 119 100.0 100.0
The local public transit systems here always cause me problems.
Frequency Percent Valid Percent Cumulative Percent
Valid
1.00 12 10.1 10.1 10.1
2.00 43 36.1 36.1 46.2
3.00 40 33.6 33.6 79.8
4.00 23 19.3 19.3 99.2
5.00 1 .8 .8 100.0
Total 119 100.0 100.0
The local public transit systems here always cause me problems.
134

Frequency Percent Valid Percent Cumulative Percent
Valid
1.00 12 10.1 10.1 10.1
2.00 43 36.1 36.1 46.2
3.00 40 33.6 33.6 79.8
4.00 23 19.3 19.3 99.2
5.00 1 .8 .8 100.0
Total 119 100.0 100.0
135
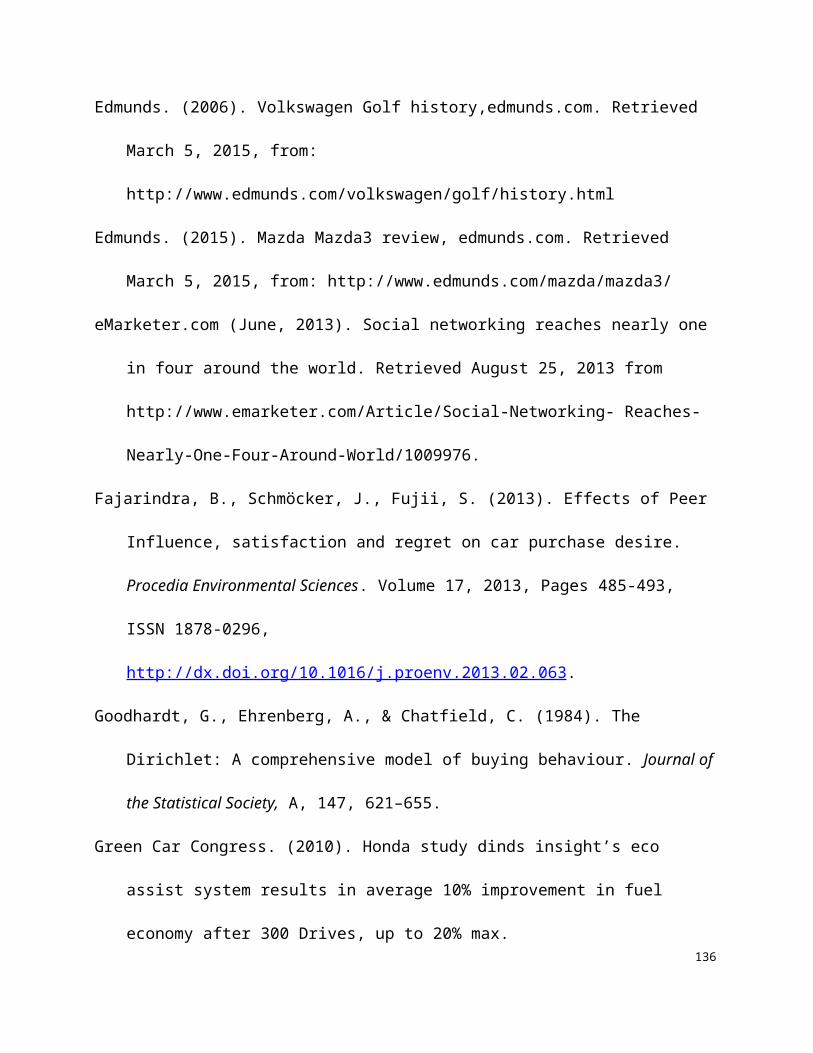
Appendix IV. Inter-item Correlation Matrix
V1 Assessment of overall purchase price - Q1, Q8, Q10, RecodeQ12
V2 Assessment of fuel price – Q36, Q37, Q38, Recode Q39136
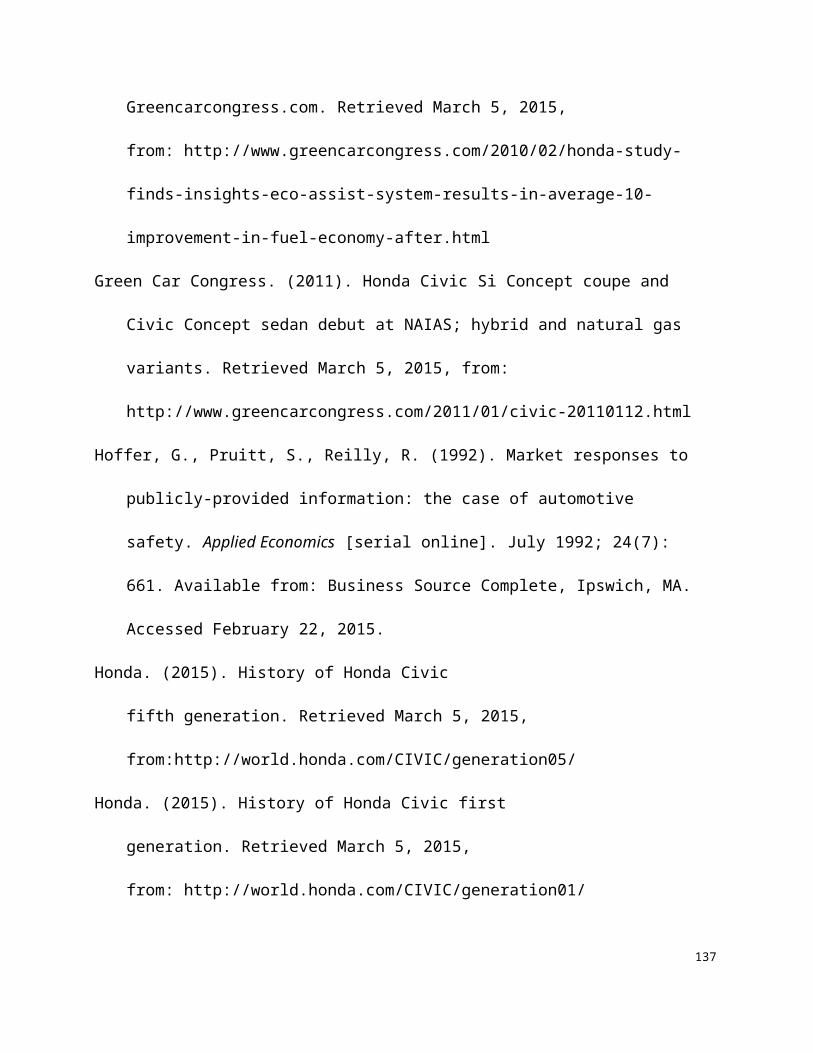
V3 Assessment of insurance price – Q40, Recode Q42, Q48, Recode Q49
V4 Perception of brand consciousness – Q30, Q33, Recode Q35
137

V5 Perceived satisfaction of brand – Q56, Q58, Q61, Recode Q63
V6 Preference for Japanese cars - Q41, Q43, Q50, Recode Q54
138
V7 Psychological value of car ownership – Q57, Q59, Q60, Q62
139

V8 Perceived need for uniqueness – Q2, Q5, Q6, Q11
V9 Attitudes toward social-function – Q3, Q4, Q7, Q9
140

V10 Perceived peer/friends’ influence – Q45, Recode Q47, Q53, Q55
V11 Perceived influence from parents/siblings – Recode Q44, Q46, Q51, Q52
141

V12 Perceived influence of SNS advertising – Q13, Q14, Q15, Recode Q16
V13 Recommendations by websites – Q29, Q31, Q32, Q34
142

V14 Perceived ease of travel – Q25, Q26, Q27, Q28
V15 Perceived convenience of going to school – Q17, Recode Q19, Q22, Q24
143

V16 Perceived availability of public transportation – Q18, Q20, Q21, Recode Q23
144

Appendix V. Final Factor Analysis
Total Variance Explained
Component Initial Eigenvalues Rotation Sums of Squared Loadings
Total % of Variance Cumulative % Total % of Variance Cumulative %
1 7.552 13.986 13.986 5.217 9.661 9.661
2 4.818 8.922 22.908 3.542 6.558 16.220
3 3.834 7.100 30.008 3.318 6.144 22.364
4 3.334 6.175 36.183 3.018 5.590 27.953
5 3.013 5.580 41.762 2.985 5.528 33.482
6 2.506 4.641 46.403 2.662 4.929 38.411
7 2.344 4.341 50.744 2.642 4.892 43.303
8 2.058 3.812 54.556 2.572 4.762 48.066
9 1.984 3.674 58.230 2.473 4.579 52.644
10 1.753 3.246 61.476 2.389 4.423 57.068
11 1.662 3.078 64.554 2.365 4.380 61.448
12 1.495 2.768 67.322 2.312 4.281 65.729
13 1.340 2.482 69.804 2.200 4.075 69.804
14 1.145 2.121 71.924
15 1.037 1.920 73.844
16 1.007 1.864 75.709
17 .889 1.646 77.355
18 .848 1.570 78.925
19 .794 1.470 80.395
20 .767 1.421 81.817
145

21 .714 1.323 83.139
22 .653 1.210 84.349
23 .644 1.193 85.542
24 .596 1.104 86.646
25 .555 1.028 87.674
26 .531 .984 88.658
27 .514 .953 89.611
28 .490 .908 90.518
29 .460 .851 91.370
30 .436 .808 92.177
31 .407 .753 92.930
32 .386 .715 93.645
33 .353 .653 94.299
34 .325 .602 94.901
35 .297 .549 95.451
36 .270 .500 95.951
37 .242 .449 96.400
38 .228 .422 96.822
39 .209 .387 97.209
40 .195 .361 97.569
41 .179 .332 97.902
146

Total Variance Explained
Component Initial Eigenvalues Rotation Sums of Squared Loadings
Total % of Variance Cumulative % Total % of Variance Cumulative %
42 .155 .287 98.189
43 .137 .255 98.443
44 .123 .227 98.670
45 .108 .199 98.869
46 .103 .192 99.061
47 .098 .182 99.243
48 .089 .164 99.407
49 .082 .152 99.559
50 .066 .123 99.682
51 .055 .102 99.784
52 .048 .089 99.872
53 .036 .067 99.939
54 .033 .061 100.000
Extraction Method: Principal Component Analysis.
147

148

149

150

151

Appendix VI. Revised Survey Questionnaire
1. For the first part of questions, think about yourself and your purchase behavior. How much do you agree or disagree with the following statements? Even if you are not entirely sure, check the box that best describes your feeling or opinion.
Strongly Disagree
Disagree Neutral Agree Strongly Agree
In general, I always think carefully about prices before buying.I always try to find a more interesting version of ordinary products because I enjoy being unique.The brands and products I buy help me express myself.The brands and products I buy are a symbol of my social status.I often seek out new products or brands that will add to my personal uniqueness.I dislike brands or products that are purchased by everyone.
Strongly Disagree
Disagree Neutral Agree Strongly Agree
The brands and products I choose fit me into certain social situations.Product price is what I care about most when I buy certain products.The brands I choose reflect the kind of person I see myself to be.I go for the price first rather than thinking about other features.Having an eye for products that are interesting
Student Opinion SurveyWe are conducting this study to learn about students’ opinions concerning a variety of current
topics. Thank you for taking the time to complete our survey. Your responses are anonymous.
152

and unusual helps me in establishing a distinctive image.
2. For our next questions, think of your social network sites (SNSs) usage and purchase behavior. How much do you agree or disagree with the following statements?
Strongly Disagree
Disagree Neutral Agree Strongly Agree
I consider SNS advertising very essential.
I often click on SNS banner ads.I like banner ads of products shown on SNSs.
SNS advertisement usually won’t catch my eyes.
3. Our next questions are about your daily experience. How much do you agree or disagree with the following statements? Even if you are not entirely sure, check the box that best describes your feeling or opinion.
Strongly Disagree
Disagree Neutral Agree Strongly Agree
It's very convenient to go to school from where I live.
Local public transportation leads me to most places.
I suffer from going to school every day because of the transportation.It’s very convenient and fast to take public transportation here rather than driving.I’m satisfied with our local public transportation.
The local public transit system is problematic.It’s fast and easy to go to school from where I live.
4. This set of questions pertains to your experience of travel. How much do you agree or disagree with the following statements? Even if you are not entirely sure, check the box that best describes your feeling or opinion.
Strongly Disagree
Disagree Neutral Agree Strongly Agree
Owning a car will allow me to travel to more places I wish to go.Owning a car will allow me to travel faster.Owning a car will allow me to transport more itemsOwning a car will allow me to travel more comfortably.
5. For this part of our questions, think about your purchase behavior and assume you are going to 153

buy a new car. How much do you agree or disagree with the following statements? Even if you are not entirely sure, check the box that best describes your feeling or opinion.
Strongly Disagree
Disagree Neutral Agree Strongly Agree
I use car rating websites to find information to reduce the risk of making a bad product/service choice.I do my online research to make informed car buying decisions.I would use car rating websites to learn how to solve problems involved in a purchase decision.
6. For our next questions, assuming you are going to buy a new car. How much do you agree or
disagree with the following statements? Even if you are not entirely sure, check the box that best
describes your feeling or opinion.
Strongly Disagree
Disagree Neutral Agree Strongly Agree
If the current price of gas is high, I won’t consider buying a new car.When purchasing a new car, I care about the price of gas.I would be more likely to buy a car when the price of gas is affordable.I don’t think the price of gas would affect my willingness to buy a car.
Strongly Disagree
Disagree Neutral Agree Strongly Agree
I would carefully assess the price of car insurance when making a car purchase decision.Cars made in Japan occupy a very strong competitive position in comparison to cars made by other countries.Price of insurance doesn’t bother me when buying a new car.Cars made in Japan are always carefully produced.I consider my friends who have bought cars as experts in car purchasing.I consider my parents and siblings’ recommendations on cars very valuable.I’d prefer a more reasonable insurance price when I am about to buy a new car.
154

Strongly Disagree
Disagree Neutral Agree Strongly Agree
I won’t consider the insurance price when I am about to buy a new car.Cars made in Japan are quite reliable and seem to last the desired length of time.I would think of my parents/siblings’ driving experience first when I’m going to buy a car.I would seriously think over my parents and sibling’s advice when buying a new car.I think of my friends as a good source of car information.Cars made in Japan are generally of a lower quality in comparison to others.
7. For these questions, think about your car ownership if you have a car, or assume your future car ownership if you don’t. How much do you agree or disagree with the following statements? Even if you are not entirely sure, check the box that best describes your feeling or opinion.
Strongly Disagree
Disagree Neutral Agree Strongly Agree
Owning a certain brand of car would give me pleasure.I enjoy having my own car of a certain brand.Cars are a symbol of successful modern life.Owning a car is a symbol of success in lifeOwning a certain brand of car makes me feel good about myself.I don’t care much about owning a car of a particular brand.
Please answer the following questions about yourself:
8. Do you own a legal driver’s license?
Yes No
9. Have you ever owned a car?
Yes No
10. For the following statements, which one best describes your intended time-frame of buying a
155

new car? (Please select ONLY ONE ).
I already have a car and I don’t need to buy a new one. I would like to buy a new car now. I will buy a car as soon as I could afford one. I might buy a car one day, but it’s not my primary concern. I have no intention of buying a car in the next 10 years
11. Now, assuming you are going to buy a new car TODAY. How important will you rank the following
factors? (1=least important, 5=most important)
1 2 3 4 5
Fuel efficiency
Design/style
Reliability
Makes/models
Storage space
Safety
Comfort
Service quality of maintenance
12. IF you were going to buy a new car TODAY, how likely would you be to select each of the following brands? Even if you are not entirely sure, check the box that best describes your feeling or opinion.
Very Unlikely
Somewhat Unlikely
Neutral Somewhat Likely
Very Likely
HondaMazdaToyota
VolkswagenNissan
Hyundai
Or other: _______________________ (Please specify)
13. Think about the Japanese automobile manufacturer Honda. How satisfied are you with the following aspects of its compact car line Honda Civic. Even if you are not entirely sure, check the box that best describes your feeling or opinion. (1=least important, 5=most important)
156

1 2 3 4 5Price
Fuel efficiencyAppearance/Design
ReliabilityPower
Storage spaceSafety
ComfortService quality of maintenance
14. How old are you? ___________ years old
15. Are you male or female? Male Female
16. Which of the following describes your current academic level:
Freshman Sophomore Junior Senior Graduate
That concludes our survey. Thanks for your time.
157