(Imprimir hijos que agreden a sus padres intervención grupal - julia masip)

RSA European Conference 2012: Networked regions and cities in times of fragmentation: Developing smart, sustainable and inclusive places. Delft, The Netherlands (13th – 16th May 2012)
1
“Towards a methodology to identify and characterize
urban sub-centres: Employment Entropy Information versus
Employment Density”
Masip Tresserra, Jaume†
ABSTRACT: In last decades, the spatial structure of the metropolitan areas has been characterized by an urban dynamics towards a more polynucleated structure, breaking with the paradigm of the monocentric city. The specialized literature has studied these polynucleated urban structures by identifying the nuclei (sub-centres) that are within of the metropolitan areas. According to this objective, there are two approaches to identify sub-centres: by analyzing the employment or population density and by studying the mobility flows. Although, huge efforts have been done in the density approach, there are still some uncertainty points to solve: the density analysis could not identify and characterize simultaneously the sub-centres. That means distinguish those sub-centres that only attract workers (in-commuting flows) or retain their resident workers to those sub-centres that are able to attract flows and retain their resident employed population at the same time. In this paper, a new integrated methodology to identify and characterize simultaneously urban sub-centres is proposed by using an Employment Entropy function. In comparison with the density models, now it is possible to identify sub-centres and characterize them by “emerging” or “large-mature” by analyzing their Employment Entropy Information. In doing so, the Employment Entropy Information of each municipality is divided into two Entropy Information functions: the resident workers -RW- and the in-commuting flows -IF- Entropy Information functions. So, the paper is organized as following: firstly, the efficacy of the proposed methodology is tested in the Barcelona Metropolitan Region from 1991 to 2001 and secondly, the impact of these identified and characterized sub-centres on the urban spatial structure is studied by analyzing the evolution of polycentrism level and their influence on the urban hierarchy. The results suggest that in comparison with identifying sub-centres by using the standard density model, the municipalities identified as sub-centres by using “this double” Employment Entropy Information functions are more dominant in terms of in-commuting flows, more self-contained, and its influence on the urban structure are more significant, entailing a more polynucleated metropolitan structure. KEYWORDS: Urban spatial structure, sub-centres, polycentrism, metropolitan areas & new urban economy JEL CODES: R0, R11, R12 & R14
† PhD Candidate, Master Science in Urban Management and Valuation, Architect. Centre of Land Policy and Valuations, CA1, Polytechnic University of Catalonia, Av.Diagonal 649, 4th Floor, 08028. Barcelona, Spain. Email: [email protected].
January 10, 2012

RSA European Conference 2012: Networked regions and cities in times of fragmentation: Developing smart, sustainable and inclusive places. Delft, The Netherlands (13th – 16th May 2012)
2
1. INTRODUCTION Polycentricity may be defined as that process by which a city gradually distances itself from a spatial structure characterized by the existence of a single employment centre, moving towards a new one where various employment centres of the same or different hierarchic order coexist. The existence of polycentric urban structures is increasingly evident both in Europe and in the United States. Nevertheless, their origin tends to be different in origin according to Champion (2001) and Clark & Kuijpers-Linde (1994). In the United States, polycentricity arises mainly from employment decentralisation: new subcentres appear at the periphery, colonising a space that is either normally empty or occupied by dwellings under low-density conditions. This first origin of polycentrism is situated within the framework of the Monocentric city Model studied by Alonso (1964), Muth (1969) and Mills (1972). Thus, for instance references have been included to congestion, the mechanism for fixing equilibrium wages, the spatial impact of agglomeration economics, or to the relationship between the costs of product transport and of commuting. These have been the theoretical framework from which the polycentricity of North American cities has been focused and the most relevant work related to that are the studies of Fujita & Owaga (1982), Sullivan (1986), Wieand (1987), White (1990), Henderson & Slade (1993), Anas & Kim (1996), Anas, Arnott & Small (1998), Anas (2000), Berliant et al. (2002), Fujita & Mori (2005), Berliant & Wang (2008) and Tabuchi (2009) for example. This rise of polycentric city in North American cities is explained by McMillen (2001a, pg.15): “theoretical models of urban structure are based on the assumption that all jobs are located in the central business district (CBD). Although this assumption was never literally true, it is useful approximation for a traditional city in which the CBD holds the only large concentration of jobs. As metropolitan areas have become increasingly decentralized, traditional CBD have come to account for a much smaller proportion of jobs than in the past large employment districts have arisen outside of central cities that rival the traditional city center as places of work. When these districts are large enough to have significant effects on urban spatial structure, they are referred to in the urban economics literature as employment subcenters”, at the time that McMillen & Smith (2003, pg.321) explain the benefits of this new urban spatial structure: “polycentric urban areas combine many of advantages of big and small urban areas. Whereas the CBD offers firms the advantages of significant agglomerations economies, it also requires high wages to compensate for expansive and time-consuming commutes. Employment subcenters that resemble small CBDs have arisen in the suburbs of many urban areas. When sufficiently large to quality an urban area for the polycentric label, employment subcentres offers firms some of the benefits of agglomeration while reducing commuting costs, wages and land prices. Edge cities, industrial districts, technology parks, university campuses, peripheral centers of employment in general, collect that which CBD expels. Since the mid-eighties there has appeared a substantial amount of literature propounding different methodologies for identifying subcentres that have emerged over time. Gordon et al. (1986), Heikkila et al. (1989), Giuliano & Small (1991), Song (1994), Clark & Kuijpers-Linde (1994), Gordon & Richardson (1996), McDonald (1987), McDonald & McMillen (1990), McDonald & Prather (1994), McMillen & McDonald (1997, 1998a, 1998b), Cervero & Wu (1997), Bogart & Ferry (1999), Craig & Ng (2001), Anderson & Bogart (2001), Shearmur & Coffey (2002), McMillen & Lester (2003), McMillen (2003a, 2003b, 2004) and Readfearn (2007) among others. The results of this string of applied studies confirm the validity and extension of polycentrism in North American cities, even though the number of subcentres identified in each study may vary considerably depending on the method used or the numerical or statistical reference thresholds.

RSA European Conference 2012: Networked regions and cities in times of fragmentation: Developing smart, sustainable and inclusive places. Delft, The Netherlands (13th – 16th May 2012)
3
In the case of Europe, polycentricity has been presented as the result of the evolving of pre-existing hierarchic urban system where the different centres have been functionally integrated due to the reduction of transport costs. Relationships that in the past were of a vertical origin (between centres of a different order) are being increasingly replaced by horizontal relationships (between centres of the same order), which has led to the role played by the different centres making up the system no longer being explained only by the specificity of the services they offer, but rather also by the activity sectors in which they specialize. The metaphor of the hierarchic tree characteristic of the Central Place Theory proposed by Christaller (1933) and then by Lösch (1940) has been replaced by that of the network paradigm proposed by Dematteis (1990, 1991a, 1991b), Emmanuel & Dematteis (1990), Camagni (1993, 1994), Camagni & Salone (1993) and Batten (1995). The idea is that, as previously disconnected labour market areas become integrated functionally, there arises the possibility that the different centres specialize in certain sectors with the aim of making greatest use of the Marshall-like economies of location. Thus, the hierarchic scheme of a system of christallerian type cities is no longer useful, since the horizontal relationships gain importance in relation to the vertical ones. So, since the middle of the 20th
century, regional migratory flows have showed down in Europe, in such a way that big cities seem to have arrived at a stable population size. This is not however strictly true. The city continues expanding spatially, although not so much by a process of absorption, but rather by integration Champion (2001). Those smaller-sized population and activity centres which in the past were able to resist a trajectory of own growth and were situated far enough away are being integrated into the field of influence of the main city as it has explained by Hohenberg & Lees (1995). Cities like Naples, Marseilles, Toulouse, Turin, Florence, Frankfurt, Helsinki, Stockholm, Oslo and Barcelona would be in this group of polycentric cities with an outstanding centre CSD (1999). In other cases, cities of a similar size which by their proximity maintain a relationship based on a certain rivalry, have seen how their areas of worker attraction are overlapping, taking on the form of a city of cities without a clear dominant centre. Holland’s Randstad studied by Lambooy (1998), Meijers (2006, 2007, 2008) and Lambregts (2009) and the so-called Belgian diamond studied in this case by Dieleman & Faludi (1998) are two outstanding example where similarly ranked cities merge Champion (2001).
In some sense, the reference theoretical framework has been adapted to the conditions in each place. In the North America case, the creation of subcentres is in general a relatively recent phenomenon linked to the decentralisation trends of population and employment as it is explained for instance by Alperovich (1983), Giuliano & Small (1993, 1999), Small & Song (1994), Coffey & Shearmur (2002), McMillen (2003b) and Leslie (2010). At the other extreme, the subcentres of European polycentric systems tend to be medium sized cities with a long history as Hohenberg & Lees (1995) and Hohenberg (2004) have explained. The problem is that the reality is usually situated somewhere between the two extremes. Not all the subcenters of North American cities are a result of recent employment decentralisation, nor all the subcentres of European urban systems have their origin in a remote past. In that sense Hohenberg (2004, pg. 49) explains that the European urban model from the origin of their cities onward two sets of forces have driven the process of their urban development, expressed respectively in central places and networks: “the historic process of urbanization, at least in the central place system, seems akin to the “Big Bang” model of cosmology. All centres were created very early, and their subsequent evolution is principally a structuring and selection to form an orderly hierarchic system. On the other hand, the formation of new centres or sub-centres, of concern to economic geographers and location theorists, responds

RSA European Conference 2012: Networked regions and cities in times of fragmentation: Developing smart, sustainable and inclusive places. Delft, The Netherlands (13th – 16th May 2012)
4
to the logic of the network system”. To be able to deal with the shades of grey that suggests the need for a detailed examination of the reality of the situation, it would be desirable to integrate both theoretical approaches, but this unfortunately has not occurred yet. One of the effects deriving from the disconnection produced between the two theoretical approaches is that they have generated clearly separate applied research strategies. In the North American instance, the emphasis has been placed on the need to find some methodology that enables subcentres to be identified in a thorough and objective way. In the European case, research was been mainly directed towards the change of economic base of the systems centres as well as towards all that referring to the relationship between centres, whether they belong to the same or different hierarchical order. Therefore, the aim of this study is proposing a new integrated methodology in order to identify urban subcentres that are suitable with the hierarchic and complex European urban systems where centres have been emerged mostly as a result of an integration or coalescence process between old and pre-existing cities, Champion (2001) as well as suitable with the decentralisation process from a single and congested Central Business District (CBD). In order words, in this study is proposed a new methodology to identify subcentres that are “places to work” (employment subcentres) and subcentres that are “places to work and live” (urban subcentres). That means distinguish those sub-centres that only attract workers (in-commuting flows) or retain their resident workers to those sub-centres that are able to attract flows and retain their resident employed population at the same time. To do so, the identification of intrametropolitan subcentres is carried out in this work by analyzing the functional characteristics of places in the Barcelona Metropolitan Region from 1991 to 2001 rather than their morphological features. Thus, in order to identify metropolitan subcentres (commuting) flows between urban nodes (municipalities) have been analyzed together with the supply of urban functions. The rest of the paper is organized as follows. In section 2 a review of literature is carried out, distinguishing the major static and morphological methodologies in order to identify subcentres, from those that use flows and that are based on an interaction. Section 3 presents the study case and data. Section 4 is devoted to explain the new integrated methodology to identify and characterize urban subcentres in the Barcelona Metropolitan Region from 1991 to 2001 and testing its efficacy with other standard density methodologies. Section 5 analyses the impact of these identified and characterized subcentres on the population and employment density from 1991 to 2001. Finally, Section 6 sets out the main conclusions of the study.
2. LITERATURE REVIEW The literature on the identification of subcentres has evolved over the years gaining objectivity, thoroughness and replicability. The first studies that identified subcentres by making use of information provided by some official agency as is studied by Greene (1980) and Griffith (1981a, 1981b) or by the fact of being historical areas, Erickson & Gentry (1985) and Heikkila et al. (1989) among others. For example Greene (1980) defines employment centers as areas with double the average employment density. Although this group of studies provided interesting material, it can only be seen as a first step in the expansion of a literature whose aim is an interesting mixture of simplicity and objectivity. Beyond the first attempt at identification, the studies carried out to date can be grouped into five categories:

RSA European Conference 2012: Networked regions and cities in times of fragmentation: Developing smart, sustainable and inclusive places. Delft, The Netherlands (13th – 16th May 2012)
5
The first method consists of using consists of using a reference thresholds. The majority of studies that apply this method consider a double threshold, one the number of jobs and another for employment density. In North America, the most relevant work are the studies carried out by Giuliano & Small (1991), Song (1994), Cervero & Wu (1997, 1998), McMillen & McDonald (1997), McMillen & McDonald (1998a, 1998b), Bogart & Ferry (1999), Anderson & Bogart (2001), McMillen & Lester (2003) and McMillen (2003b). Otherwise, in Europe, within the context of the Barcelona Metropolitan Region, the most remarkable works are: Asensio (2000), Martori & Suriñac (2002), Muñiz et al. (2005), Muñiz et al. (2008) and García-Lopez (2007, 2010a). However, there are some studies add an additional threshold for the ratio of jobs per resident population, for example in the study carried out by Shearmur & Coffey (2002) or other studies that combine the using of thresholds with the identification of density peaks, these are the cases of Muñiz et al. (2003b) and García-López (2010b). Giuliano & Small (1991) define a subcentre as a set of contiguous tracts that have a minimum employment density of 10 employees per acre each and, together have at least 10.000 employees and identifies 32 subcenters in the Los Angeles area. According to McMillen (2001a, pg.17-18) the Giuliano & Small (1991) method to identify subcentres is sensitive to the cutoff point used for minimum employment density and total subcentre employment: “data sets with small tracts are more likely to have pockets with low employment density, which reduces the number of subcentres identified using the Giuliano & Small procedure” and “local knowledge must guide the choice of cutoff points, limiting the analysis to familiar metropolitan areas”. This observation led McMillen & McDonald (1998a, 1998b) to work with proximity instead of contiguity: two tracts are proximate to one another if they are within 1,5 miles, but the number of subcentres is again sensitive to the definition of proximity. García-Lopez (2007, 2010a) suggested that subcentres are zones with a density higher than the metropolitan average and at least 1% of metropolitan employment and in the case of Shearmur & Coffey (2002), which –following the idea of McDonald (1987)- identify as subcentres the contiguous TAZs that show an employment to resident worker ratio greater than 1 and a number of jobs of at least 5.000 units. Therefore, the cutoff approach is subject to a certain degree of discretion, since this method is often guided by trials and errors as well as by some local knowledge of the place under analysis as McMillen (2001b, pg.449) has explained. However, a certain degree of discretion is used in every method of identification, even in econometric ones, where certain statistical confidence level has to be chosen. The second method is based on interaction procedures that seem particularly sound for Europe, which is characterized by a lot of small, historically determined urban centres. European metropolitan areas are formed mostly by three forces or modes as it is explained by Champion (2001, pp.664): the centrifugal mode, the incorporation mode and the fusion mode1
1 According to Champion (2001): “the centrifugal mode is base on the monocentric city, where the continuing growth of the city imposes such severe strains (for example, escalating land rents in the CBD and growing problems of access to the central area from the ever more distant outer residential areas) that the most affected production and service services are squeezed out to alternative centres that in due course may, in combination or indeed separately, come to rival the original centre size. The incorporation mode consists in a large urban centre expanding its urban field so that it incorporates smaller centres in the surrounding area that had previously been largely self-sufficient in terms of both employment and services, with these other centres then forming a more powerful catalyst for attracting extra non-residential activities than the centres emerging through the centrifugal mode and perhaps providing an ever stronger challenge to the main centre. Finally, the fusion mode is based on the fusion of several previously independent centres of similar size, as a result of their own separate growth in overall size and lateral extent and particularly because the improvement of transport links between them.
in which the majority of these metropolitan areas are the result of such process of coalescence and are characterized by a dominant centre, which is surrounded by other smaller centres,
RSA European Conference 2012: Networked regions and cities in times of fragmentation: Developing smart, sustainable and inclusive places. Delft, The Netherlands (13th – 16th May 2012)
6
forming contemporary polycentric metropolitan areas. As it is said in Section 1, most European metropolitan subcentres did not result from a simple process of decentralisation of the city centre. From this perspective, metropolitan subcentres can be seen as the central places within a given metropolitan area, the places that organize functionally, their surrounding territory. The literature on the identification of subcentres based on the analysis of the data on mobility can be found in America, for example in the work of Bourne (1989) and Gordon & Richardson (1996), in Europe due to the studies of Clark & Kuijpers-Linde (1994) and Veneri (2010) and finally, in the context of the Barcelona Metropolitan Region are relevant the works of ATM (1998), Burns et al. (2001), Roca et al. (2009), Roca et al. (2011), Masip (2011a) and Masip & Roca (2012-forthcoming). Bourne (1989) visually analyses commuting flows for Canadian cities. Gordon & Richardson 81996) follow a trip-generation density approach for Los Angeles in 1980, analyzing the distribution of traffic flows among TAZs and identifying 18 subcentres. In addition, Gordon & Richardson (1996) argue that with dynamic methodologies it is possible to grasp the role of subcentres not only as employment concentrations, but also as focal points of a metropolitan area, regarding the urban function that subcentres supply to their neighbor territory. In Europe, Burns et al. (2001) identifying subcentres in Spanish metropolitan areas by selecting the municipalities that show a net entry of at least 15%. Roca et al. (2009) and Roca et al. (2011) identify subcentres in the Barcelona Metropolitan System and in Barcelona & Madrid respectively by using an interaction value2
2 The interaction value is expressed as follows:
defined by Roca & Moix (2005). According to Roca et al. (2009, pg. 2860): “the analysis of mobility allows for the detection of true subcentres, understood as the generators of true metropolitan structure. The subcentres, from this specific point of view cannot only be understood as local peaks in the topography of the employment density surface. Rather, they must configure nodes of the metropolitan structure that imply significant tensions of urban mobility. The subcentres should constitute real poles of influence and territorial reference that surround them in cultural, social and economic aspects. In order to be truly considered as centres, they should generate authentic cities within their surroundings and, therefore configure a metropolis as a city of cities”. Veneri (2010) identifies subcentres in two Italian Metropolitan Areas by using an interaction procedure based on two interaction indicators: the flow centrality ratio (FCi) and the productive completeness (PCi). The former, according to Veneri (2010) reveals the capacity of a node to dominate its surrounding territory from a functional point of view. The latter, approximates the variety of functions supplied by each urban node, starting from the idea that, besides attracting a great number of commuters a metropolitan subcentre must have a minimum degree of productive variety, which can be thought of a sign of the wide range of urban functions supplied by a given mode. Thus, Veneri (2010) defines as a subcentre those municipalities that both their flow centrality ratio and productive completeness are higher than 1. By using this approach, Veneri (2010) identifies 3 subcentres in the Rome Metropolitan Area and 10 subcentres in the Milan Metropolitan Area.
ij
ji
ji
ijij LTLRWP
fLTLRWP
fIV
22
+= where IVij is the interaction value
between the zones (i) and (j); (fij) and (fji) are the existing commuting flows; RWP is the resident employed population; and LTL are the locally based workplaces within zones (i) and (j). The interaction value according Roca et al. (2009, pg. 2846) has a special interest over other indicators of urban interaction, given that it weights the flows by virtue of the totality of the ‘masses’ of the zones. In addition, this weighting is carried out in a ‘transitive’ way, considering not only the attraction in one direction (e.g. the ‘larger’ over the ‘smaller’), but also in the opposite direction.
RSA European Conference 2012: Networked regions and cities in times of fragmentation: Developing smart, sustainable and inclusive places. Delft, The Netherlands (13th – 16th May 2012)
7
More recently, these interaction or functional approaches have been used also for the analysis of spatial configuration at regional urban system, Green (2007), at the level of national urban systems, for example the works of Limtanakool et al. (2007, 2009) or even at the global level, Derudder et al. (2003). The work of Limtanakool propose a set of spatial interaction indices, trying to quantify the symmetry, the strength and the structure of the urban system by using data about commuting flows. The third group of studies uses a criterion based on the identification of peaks, e.g. set of contiguous census sections that present a local maximum with respect to the area that surrounds them, whether it be employment density as the studies carried out by Gordon et al. (1986), Craig & Ng (2001), Muñiz et al. (2003a) and Readfearn (2007) or the ratio of jobs per resident population as the works of McDonald (1987) and McDonald & McMillen (1990). Craig & Ng (2001), propose a nonparametric estimation procedure to obtain smoothed employment density estimates for Houston. Using quantile regression approach, they focus on the 95th percentile of the employment density distribution. According to McMillen (2001a, pg.18) Craig & Ng’s procedure is not as sensitive to the unit of analysis as the McDonald (1987) and Giuliano & Small (1991) procedures3. Muñiz et al. (2003a) follow a similar approach, using estimated spline functions to identify density peaks, but probably the most relevant work is the non-parametric method developed by Readfearn (2007, pg.521) because contrast sharply with McMillen’s applications. Readfearn’s procedure estimates a non-parametric employment surface occurs locally –with a subsample- that is kept sufficiently small to keep intact the structure of local employment density. According to Readfearn (2007) this is necessary in order to identify subcentres, as the general spatial trends in employment density using a larger windows size largely mask independent local concentrations of employment in which local maxima on the density surface become candidate to subcentre. However, although non-parametric approaches have the advantages that are flexible, allowing the slope of density functions to vary across the metropolitan area as it is explained in McMillen (2001a, pg. 18), these approaches have some problems in terms of F-tests as it is explained in McMillen (1996, pg. 107) as well as they also require some local knowledge when the window size of the local weighted regression (LWR) has to be defined. McDonald (1987, pg.243) gave five definitions of employment subcentres that at first appear to be reasonable: 1) a secondary peak in gross employment density, 2) net employment density, 3) employment-population ratio, 4) gross population density and 5) net population density. Finally, McDonald (1987, pg.245) suggest that local peaks in gross employment density and the employment-population ratio are the best indicator of employment subcenters and McDonald’s (1987, pg. 246) subcentre definition is: “a zone is considered to be an employment subcentre if its value for the measure in gross employment density or employment –population ratio exceeds the value for each contiguous4
3 Though larger tracts lead to smoother employment density functions, larger subcentres will procedure a rise in the function whether the data set includes acres, quarter sections or square miles. However, the Craig & Ng (2001) procedure requires some local knowledge to choose which sites are subcentres within rings around the CBD, and the imposition of symmetry around the CBD is unsuited to cities that are distinctly asymmetric due to varied terrain or multiple subcentres. 4 According to McDonald (1987), typically a zone has four contiguous zones: one that is closer to the CBD, two that are approximately the same distance from the CBD and one that is further from the CBD. According to this definition given by McDonald, a zone cannot be an employment subcentre if its gross employment density (or employment-population ratio) is equal to or less than that for any of these four zones. In particular, a zone cannot be an employment subcentre if gross employment density (or employment-population ratio) declines with distance to the CBD.
zone”. However, the studies of McDonald (1987) and McDonald & McMillen (1990) define potential subcentres as zones
RSA European Conference 2012: Networked regions and cities in times of fragmentation: Developing smart, sustainable and inclusive places. Delft, The Netherlands (13th – 16th May 2012)
8
with higher gross employment density than all contiguous tracts, but these approaches are only adequate for large tracts, due to may identify small zones as subcentres when they are surrounded by others with little or no employment. The fourth method consists of identifying the positive residuals estimated from an exponential employment density function as McDonald & Prather (1994) or with a combination of non-parametrical and semi-parametric methods as McMillen (2001b, 2003a) and finally, the recently study carried out by Leslie (2010) in which identifies subcentres in the city of Phoenix by using Kernel smoothing process for both employment and establishment density. McDonald & Prather (1994), identify possible employment subcentres by examining the residuals from a monocentric regression model of employment density. After extensive tests5
5 McDonald & Prather (1994) tested seven different functional forms of employment density as follows: (1) 𝐷𝐷(𝑋𝑋) = 𝐷𝐷0 − 𝐵𝐵𝑋𝑋 + 𝑢𝑢 . (2) 𝐷𝐷(𝑋𝑋) = 𝐷𝐷0 − 𝐵𝐵𝑋𝑋 + 𝐴𝐴𝑋𝑋2 + 𝑢𝑢 . (3) 𝐷𝐷(𝑋𝑋) = 𝐷𝐷0 − 𝐵𝐵𝑋𝑋 + 𝐴𝐴 �1
𝑋𝑋� + 𝑢𝑢 . (4) 𝐿𝐿𝐿𝐿𝐷𝐷(𝑋𝑋) =
𝐿𝐿𝐿𝐿𝐷𝐷0 − 𝐵𝐵𝑋𝑋 + 𝑢𝑢 . (5) 𝐿𝐿𝐿𝐿𝐷𝐷(𝑋𝑋) = 𝐿𝐿𝐿𝐿𝐷𝐷0 − 𝐵𝐵𝑋𝑋 + 𝐴𝐴𝑋𝑋2 + 𝑢𝑢 . (6) 𝐿𝐿𝐿𝐿𝐷𝐷(𝑋𝑋) = 𝐿𝐿𝐿𝐿𝐷𝐷0 − 𝐵𝐵𝑋𝑋 + 𝐴𝐴 �1𝑋𝑋� + 𝑢𝑢 and (7)
𝐿𝐿𝐿𝐿𝐷𝐷(𝑋𝑋) = 𝐿𝐿𝐿𝐿𝐷𝐷0 − 𝐴𝐴𝐿𝐿𝐿𝐿𝑋𝑋 + 𝑢𝑢 . The use of a model with D(x) as the dependent variable generates according to McDonald & Prather (1994, pg.205) severe heteroskedasticity problem. The estimated variance of (u) declines with distance to the CBD. Such a result is especially problematic because the identification of employment subcentres is to be based on examination of residuals. After checked for heteroskedasticity in the functions 4-7, McDonald & Prather (1994) claim that the negative exponential function (4) passes these test for unbiasedness and homoskedasticity. The other three functions that use LnD (x) as the dependent variable also pass the test for homoskedasticity but the double-log function (7) does not pass the test of lack of bias. Thus, far the simple negative exponential (4) has emerged as the best functional form.
, McDonald & Prather (1994) conclude that a simple negative exponential employment density function suffices for this purpose and they identify 3 subcentres in Chicago in 1980: O’Hare Airport, Schaumburg and DuPage country. McMillen (2001b, pg. 449), proposed a two-stage non-parametric and semi-parametric for identifying subcentres with the aim to be less sensitive to the unit of measurement than most existing procedures, readily reproducible by other researchers and that it can be applied to metropolitan areas that the researcher does not known well. The first stage of McMillen’s procedure is based on a nonparametric estimator, locally weighted regression, to smooth employment density. The estimate of a site’s employment density is obtained according to McMillen (2001b) by weighted least squares, with more weight given to nearby tracts. Potential subcentres are sites with significant positive residuals. Thus, a potential subcentre is a site with unusually large density after broad spatial trends are accounted for. In the second stage, McMillen (2001b) uses a semi-parametric regression to determine whether the potential subcentres have significant effects on employment density. The non-parametric part of the regression captures the effect of distance from the CBD using a flexible Fourier form. Thus, according to McMillen’s procedure the results are conditioned on distance from CBD, but the CBD gradient can vary spatially. The final list of subcenters includes the sites providing significant explanatory power in the employment density function. The procedure according to (McMillen 2001b, pg.449) captures the idea that a subcentre is an area with an employment density that is significantly higher than would be expected based only on its distance from CBD. Finally, McMillen (2003a) used hybrid approach to identify subcentres. According to McMillen (2003a, pg.58) this hybrid approach by using contiguity matrices has the advantages over both the Giuliano & Small (1991) and the McMillen (2001b) approaches. In the first stage, the hybrid approach follows Giuliano & Small (1991) and includes tracts that exceed a minimum density level. In the second stage, allows the cut-off points to vary across cities and spatially within a city by using a non-parametric estimator initially to smooth the employment surface. According to McMillen (2003a), candidate to subcentre sites are tracts with significantly
RSA European Conference 2012: Networked regions and cities in times of fragmentation: Developing smart, sustainable and inclusive places. Delft, The Netherlands (13th – 16th May 2012)
9
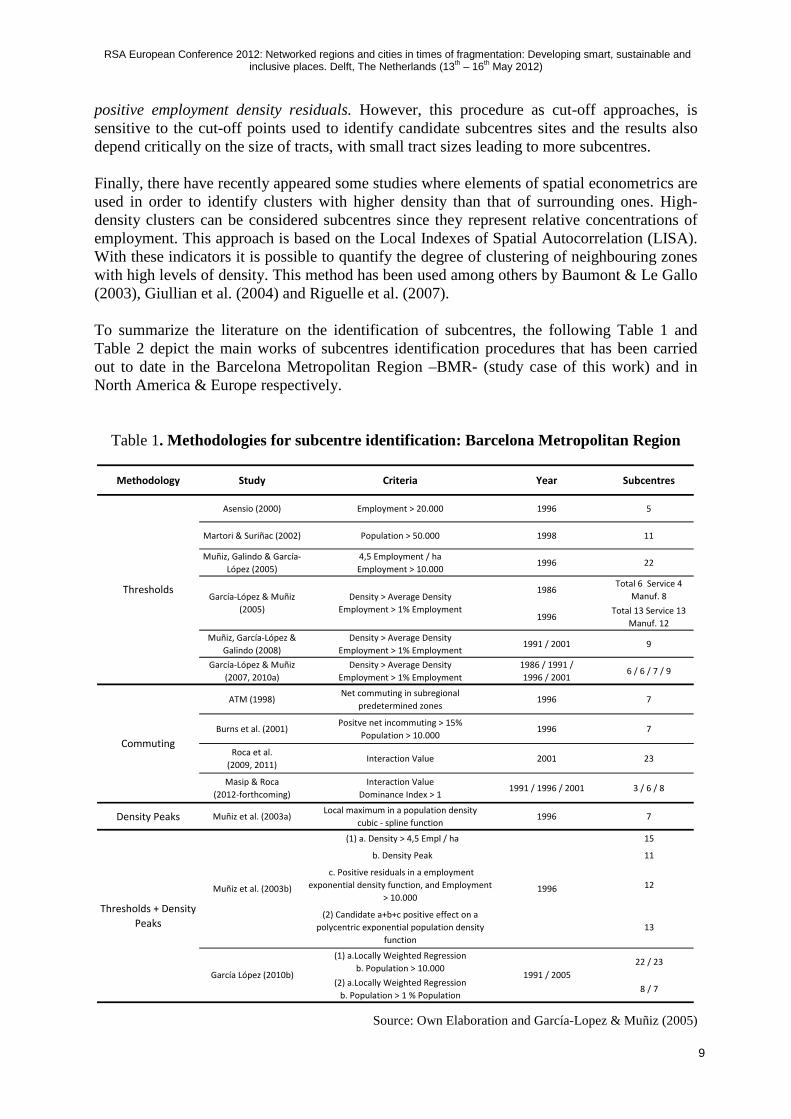
positive employment density residuals. However, this procedure as cut-off approaches, is sensitive to the cut-off points used to identify candidate subcentres sites and the results also depend critically on the size of tracts, with small tract sizes leading to more subcentres. Finally, there have recently appeared some studies where elements of spatial econometrics are used in order to identify clusters with higher density than that of surrounding ones. High-density clusters can be considered subcentres since they represent relative concentrations of employment. This approach is based on the Local Indexes of Spatial Autocorrelation (LISA). With these indicators it is possible to quantify the degree of clustering of neighbouring zones with high levels of density. This method has been used among others by Baumont & Le Gallo (2003), Giullian et al. (2004) and Riguelle et al. (2007). To summarize the literature on the identification of subcentres, the following Table 1 and Table 2 depict the main works of subcentres identification procedures that has been carried out to date in the Barcelona Metropolitan Region –BMR- (study case of this work) and in North America & Europe respectively.
Table 1. Methodologies for subcentre identification: Barcelona Metropolitan Region
Source: Own Elaboration and García-Lopez & Muñiz (2005)
Methodology Study Criteria Year Subcentres
Asensio (2000) Employment > 20.000 1996 5
Martori & Suriñac (2002) Population > 50.000 1998 11
Muñiz, Galindo & García-López (2005)
4,5 Employment / ha Employment > 10.000
1996 22
1986Total 6 Service 4
Manuf. 8
1996Total 13 Service 13
Manuf. 12Muñiz, García-López &
Galindo (2008)Density > Average Density
Employment > 1% Employment1991 / 2001 9
García-López & Muñiz (2007, 2010a)
Density > Average Density Employment > 1% Employment
1986 / 1991 / 1996 / 2001
6 / 6 / 7 / 9
ATM (1998)Net commuting in subregional
predetermined zones1996 7
Burns et al. (2001)Positve net incommuting > 15%
Population > 10.0001996 7
Roca et al. (2009, 2011)
Interaction Value 2001 23
Masip & Roca (2012-forthcoming)
Interaction Value Dominance Index > 1
1991 / 1996 / 2001 3 / 6 / 8
Density Peaks Muñiz et al. (2003a)Local maximum in a population density
cubic - spline function1996 7
(1) a. Density > 4,5 Empl / ha 15
b. Density Peak 11
c. Positive residuals in a employment exponential density function, and Employment
> 10.00012
(2) Candidate a+b+c positive effect on a polycentric exponential population density
function13
(1) a.Locally Weighted Regression b. Population > 10.000
22 / 23
(2) a.Locally Weighted Regression b. Population > 1 % Population
8 / 7
Thresholds
Commuting
1996Muñiz et al. (2003b)
Thresholds + Density Peaks
García-López & Muñiz (2005)
Density > Average Density Employment > 1% Employment
García López (2010b) 1991 / 2005

RSA European Conference 2012: Networked regions and cities in times of fragmentation: Developing smart, sustainable and inclusive places. Delft, The Netherlands (13th – 16th May 2012)
10
Table 2. Methodologies for subcentre identification: North America & Europe
Source: Own Elaboration and García-Lopez & Muñiz (2005)
Methodology Study Criteria City - Year Subcentres
Giuliano & Small (1991)Density > 25 Empl. / ha Employment > 10.000
Los Angeles 1980 32
Song (1994)Density > 37 Empl. / ha Employment > 35.000
Los Angeles 1980 6
Cervero & Wu (1997, 1998)
Density > 17 Empl. / ha Employment > 10.000
San Francisco 1990 22
McMillen & McDonald (1997)
Density > 25 Empl. / ha Employment > 10.000
Negative subcentre density gradientChicago 1980 20
McMillen & McDonald (1998a) (1998b)
Density > 25 Empl. / ha Employment > 10.000
Negative subcentre density gradientChicago 1990 20
Bogart & Ferry (1999)Density > 20 Empl. / ha Employment > 10.000
Cleveland 1990 9
Cleveland 1990 9Indianapolis 1990 11
Portland 1990 11Sant Luis 1990 11Montreal 1996 16Toronto 1996 17
Ottawa-Hull 1996 7Vancouver 1996 13
Chicago 1970 9Chicago 1980 13Chicago 1990 15Chicago 2000 32Chicago 2020 24
Bourne (1989) Commuting Flows Canada 27
South. California 1980-1990 5Randstad 1980-1990 5
Gordon & Richardson (1996)
Density trop generation > 0,80 Standard deviation
Los Angeles 1980 18
Rome 2001 3Milan 2001 10
McDonald (1987) Density or Employment / Population Chicago 1970 9
Chicago 1956 8Chicago 1970 9
Gordon et al. (1986) Employment Density Los Angeles 1980 18
Craig & Ng (2001) Employment Density Houston 7
Readfearn (2007) Employment Density
Locally Weigted Regression (LWR)Los Angeles 2000 41
McDonald & Prather (1994)
Exponential function Chicago 1980 3
Chicago 1980 33Dallas 1980 28
Houston 1980 25Los Angeles 1990 19
New Orleans 1990 2San Francisco 1990 22
Atlanta 1990 8 /4Baltimore 1990 18 / 18
Boston 1990 9 / 11New York 1990 27 / 38
Philadelphia 1990 8 / 4Baumont & Le Gallo
(2003)Local Indexes of Spatial Autocorrelation (LISA) Dijon 1999 4
Giullian et al. (2004) Local Indexes of Spatial Autocorrelation (LISA) Ile de France 1978 - 1997 3 / 7
Brussels 2001 5Antwerp 2001 2
Ghent 2001 7Liège 2001 7
Veneri (2010)
Clark & Kuijpers-Linde (1994)
Flow ratio centrality (FCi) > 1 Productive Completeness > 1
Commuting FlowsCommuting
Thresholds
Anderson & Bogart (2001)
Density > 20 Empl. / ha Employment > 10.000
Shearmur & Coffey (2002)
Employment > 50.000 Employment / Population > 1
McMillen & Lester (2003) McMillen (2003b)
Density > 15 Empl. / acre Employment > 10.000
Density or Employment / PopulationMcDonald & McMillen
(1990)
Density Peaks
a) Locally Weighted Regression b) Flexible Fourier with subcentre distance
McMillen (2001b)
Residues
Spatial Econometrics
Local Indexes of Spatial Autocorrelation (LISA)Riguelle et al. (2007)
Contiguity Matrices a) cut-off points > 10.000
b) Locally Weigted RegressionMcMillen (2003a)

RSA European Conference 2012: Networked regions and cities in times of fragmentation: Developing smart, sustainable and inclusive places. Delft, The Netherlands (13th – 16th May 2012)
11
3. STUDY CASE & DATA The Barcelona Metropolitan Region (BMR) –Figure 1- was delimited in 1966 by the Esquema Director de l’Àrea Metropolitana. Made up of 164 municipalities, the region covers an area of 323,000 ha in a radius of 55km. Nowadays, the Barcelona Metropolitan Region (BMR) is the second most dense urban area, the fourth most populated and the eight most extensive in Europe. It generates 12% of Spain GDP and more than 20% of Spanish exports. With over 65 per cent of the Catalan population in 2001 (4.390.413 inhabitants) and employment (1.822.000 jobs), the BMR is the main urban agglomeration in Catalonia. The city of Barcelona (marked in dark in Figure 1) is the main centre of the region and the continuous built-up area surpasses its administrative limits, taking in 12 adjacent municipalities6
Figure 1. The Barcelona Metropolitan Region
Source: Own Elaboration In this study, the data of employment come from the forced mobility (residence-to-work) query for the years 1991, 1996 and 2001 at Catalonia scale. The data of population come from the Spanish population census for 1991 and 2001 and from the municipality register for 1996, which are produced by the Instituto Nacional de Estadística (INE). The calculation of distances (km) by road between municipalities respect to the CBD-Barcelona and the identified subcentres is carried out using GIS software.
. Five outlying municipalities (Mataró, Terrassa, Sabadell, Vilafranca del Penedès and Vilanova i la Geltrú) are medium sized towns which in the past accounted for a significant proportion of the services consumed by nearby towns. Today, they still have a high level of self-containment and a net balance of entries in journeys due to work or study. Since 1980s, population and employment decentralisation towards other cities have entailed that many firms have moved towards the outskirts in search of proximity to access to main roads, entailing that other cities have emerged as an important nodes within the BMR. These are the cases of Granollers, Martorell, Rubí, Sant Cugat del Vallès and Cerdanyola del Vallès.
6 Badalona, Cornellà, Esplugues del Llobregat, L’Hospitalet, Montgat, El Prat de Llobregat, Sant Adrià del Besòs, Sant Boi de Llobregat, Sant Feliu de Llobregat, Sant Joan Despí, Sant Just Desvern and Santa Coloma.
RSA European Conference 2012: Networked regions and cities in times of fragmentation: Developing smart, sustainable and inclusive places. Delft, The Netherlands (13th – 16th May 2012)
12
4. A NEW APPROACH TO IDENTIFY AND CHARACTERIZE SUBCENTRES As we could see in the previous section, there is a vast literature on the identification of subcentres. Each different methodology to identify them entails a different concept about what a subcentre is. In the case of North America as it is explained in the introduction, the majority of works aimed at the identification of employment subcentres adopt morphological and density-based methodologies, which are based on the bid-rent theoretical tradition. These empirical approaches are particularly suitable with the idea that a subcentre emerge as a consequence of processes of employment decentralisation from the Central Business District (CBD) to the hinterland, due to high congestion and land prices. For example, McMillen (2001a, pg.17) defines employment subcenters “as nodes that combine many of the advantages of CBD and suburban locations. Highways and public transportation can serve subcenters much as they serve the CBD, bringing in an ample supply of workers from distant locations” and “the diversity of business types may be lower than is the city, but large subcenters sometimes appear to mimic the diversity of CBDs while offering lower land and commuting costs. Large subcentres offer employment and shopping opportunities for which nearby residents are willing to pay a premium. As predicted by the monocentric city model for locations near the CBD, the rise in land values near subcenters leads to configurations with smaller lot sizes and higher population density that look like small cities” or McMillen & Smith (2003, pg. 322) taking into account the definition of McMillen (2001b, pg. 448) claim “researchers have been used two criteria to guide subcentre definition, (i) mimicking the traditional definition of an urban area, a subcentre is defined as an area with significantly higher employment densities than surrounding areas and (ii) second, a subcentre should be large enough to have significant effect on the overall spatial structure of the urban area, leading to local rises in population density, land prices and perhaps housing prices” and finally McMillen (2004, pg.225) “an employment subcentre is a concentration of firms large enough to have significant effects on the overall spatial distribution of population employment and land prices” and “large subcentres can look remarkably similar to a traditional central business district, with thousands of workers employed in a wide variety of industries”. In comparison with the North American subcentre conception, that stands for an employment centre, in Europe, the concept of subcentre, is closely link to the concept of urban subcentre: a node that could organize their surrounding territory though a supply of a wider set of urban function or in words of Roca et al. (2009, pg. 2860): “the subcentres should constitute real poles of influence and territorial reference that surround them in cultural, social and economic aspects. In order to be truly considered as centres, they should generate authentic cities within their surroundings and, therefore configure a metropolis as a city of cities”. Thus, as it has mentioned in the previous sections, the subcentre definition in Europe is more closely connected with the Central Place theoretical tradition. In fact, European Metropolitan Areas emerge mostly as the result of an integration or coalescence process between old and existing cities, and their urban systems have increasingly become more hierarchical and complex in terms of urban functions, Champion (2001). In addition, apart from this divergence between the subcentre definitions according to the different methodologies to identify them, another “uncertainty point in the literature” comes out when the researchers try to characterize them into different economic activities or distinguish which subcentres are come from an integration or a decentralisation urban process: there is no any methodology in the specialized literature that could identify and characterize the subcentres simultaneously. In that sense, some studies have used the cluster

RSA European Conference 2012: Networked regions and cities in times of fragmentation: Developing smart, sustainable and inclusive places. Delft, The Netherlands (13th – 16th May 2012)
13
analysis in order to characterize the identified subcentres. For instance Giuliano & Small (1991, pg. 177) have characterized the 32 identified subcentres by using a cut-off approach into five clusters: (i) specialized manufacturing, (ii) mixed industrial, (iii) mixed service, (iv) specialized entertainment, and finally (v) specialized service7
In the context of Europe and the Barcelona Metropolitan Region, this question has been analyzed by Muñiz et al. (2005), Muñiz et al. (2008), García-López & Muñiz (2010a) and García-Lopez (2010b). The first attempt has been carried out by Muñiz et al. (2005, pg. 12) in which by using three urban indicators: the coefficient of diversification, the coefficient of location and their population in 1900, they classified the 22 identified subcentres into high level integrated subcentres, decentralized subcentres and low level integrated subcentres
, McMillen & McDonald (1998b, pg.158), classify the 20 identified subcentres for the Metropolitan Area of Chicago into six groups: (i) old satellite cities -3-, (ii) old industrial suburbs -3-, (iii) post World War II industrial suburbs -6-, (iv) newer industrial / retail suburbs -2-, (v) edge cities -3- and finally (vi) service and retail centers -3- or McMillen (2003b, pg. 3) that has categorized subcentres by looking for groups with similar employment compositions, and finding the next sectors: manufacturing, retail, services, transportation, communication and utilities (TCU), finance, insurance, and real estate (FIRE) and government. Other studies have used urban indicators as the location quotients of the identified subcentres in order to characterize them, for example Bogart & Ferry (1999, pg. 2105) characterize the subcentres into three groups: downtown, service provision and manufacturing centres or Coffey & Shearmur (2002, pg. 364) that have classified the subcentres according to their employment-pole structure into primary poles, secondary poles, isolated poles at the time that they also classify them into total employment, FIRE sector and its four individual components and the business service sector and its eight individual components.
8. This classification has turned firstly into integrated subcentres and decentralized subcentres in Muñiz et al. (2008) and then into Christallerian subcentres and decentralized subcentres9
7 Giuliano & Small (1991, pg. 179), define (i) the specialized manufacturing subcentres -7- as centres have the smallest shares of retail and service-related employment. They include several areas located near airports and specializing in aerospace manufacturing, and several older, diversified manufacturing centers and these centers tend to be smaller ones all but one being in the bottom half of the size distribution, (ii) mixed industrial subcentres -9- are centres that contain a broad mix of industries with somewhat more production-oriented industries and less service-oriented industries than the average center, but these centers tend to be larger than the average, (iii) the mixed service subcentres -11- are centers that contains what we might term ‘traditional downtowns’: centers with a broad mix of employment, somewhat weighted toward services. These cities functioned as independent centres and they are dispersed through the region, indicating that they play a role at all scales and locations, (iv) the specialized entertainment subcentres -2- consist of the two major entertainment centers and finally (v) the specialized services subcentres -3- are centres that consist of service industries account for over 90 per cent of their employment. 8 In the group of high level integrated subcentres, Muñiz et al. (2005) find the subcentres of Vilanova i la Geltrú, Vilafranca del Penedès, Martorell, Sabadell, Terrassa, Granollers and Mataró. These subcentres have high values of the three used indicators. The decentralized subcentres (low values of population in 1900) are: Rubí, Sant Cugat del Vallès, Cerdanyola del Vallès, Montcada, Barberà del Vallès and Santa Perpètua de Mogoda. Finally, the low level integrated subcentres are: Premià de Mar, Arenys de Mar, Calella, Malgrat de Mar, Castelldefels, Sant Sadurní d’Anoia, Sant Pere Riudabitlles, Pineda de Mar and Sant Celoni. 9 The integrated subcentres according to Muñiz et al. (2008) are: Mataró, Terrassa, Sabadell and Vilanova i la Geltrú meanwhile the decentralized subcentres are: Cerdanyola del Vallès, Rubí, Martorell, Sant Cugat del Vallès i Granollers
as García-López & Muñiz (2010a, pg.3048) and García-López (2010b, pg.125) have proposed. According to these studies, a Christallerian subcentre consist of medium sized cities which in the past were to some extent functionally autonomous from CBD (Barcelona) and they cannot be classified as dormitory or satellite cities because they have a high job ratio and have a considerable population (100.000 or more). Thus, these cities are the result of a long period of
RSA European Conference 2012: Networked regions and cities in times of fragmentation: Developing smart, sustainable and inclusive places. Delft, The Netherlands (13th – 16th May 2012)
14
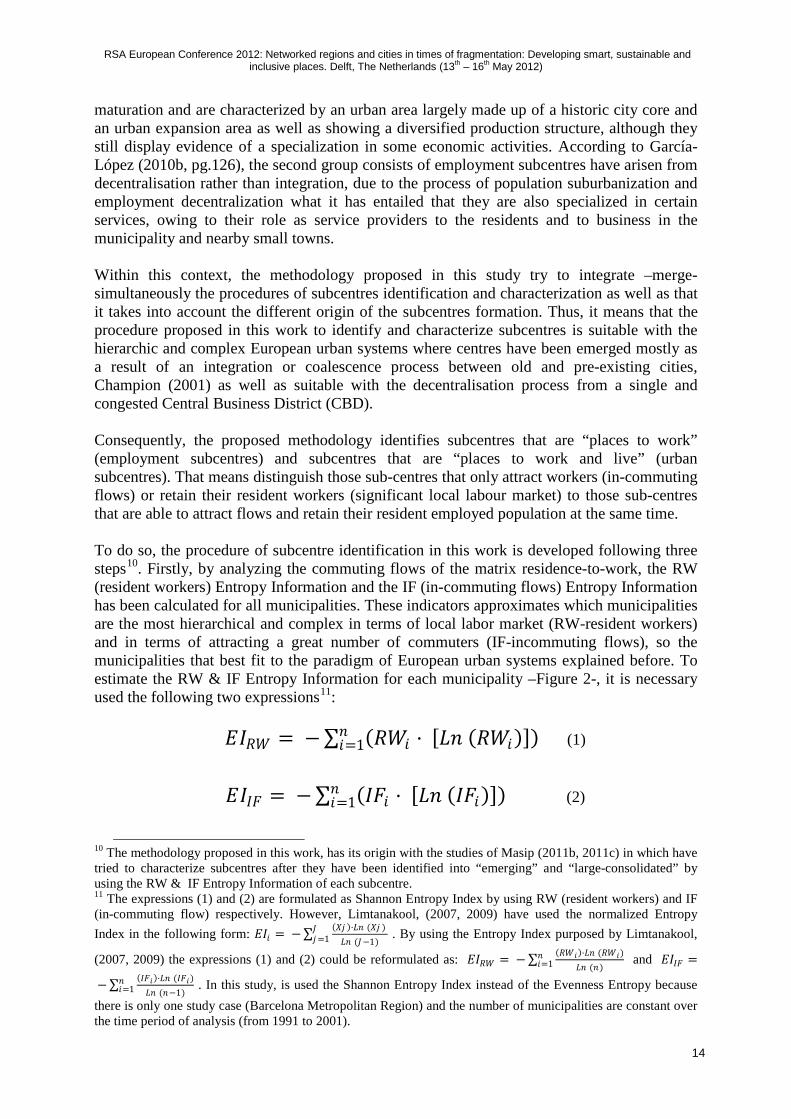
maturation and are characterized by an urban area largely made up of a historic city core and an urban expansion area as well as showing a diversified production structure, although they still display evidence of a specialization in some economic activities. According to García-López (2010b, pg.126), the second group consists of employment subcentres have arisen from decentralisation rather than integration, due to the process of population suburbanization and employment decentralization what it has entailed that they are also specialized in certain services, owing to their role as service providers to the residents and to business in the municipality and nearby small towns. Within this context, the methodology proposed in this study try to integrate –merge- simultaneously the procedures of subcentres identification and characterization as well as that it takes into account the different origin of the subcentres formation. Thus, it means that the procedure proposed in this work to identify and characterize subcentres is suitable with the hierarchic and complex European urban systems where centres have been emerged mostly as a result of an integration or coalescence process between old and pre-existing cities, Champion (2001) as well as suitable with the decentralisation process from a single and congested Central Business District (CBD). Consequently, the proposed methodology identifies subcentres that are “places to work” (employment subcentres) and subcentres that are “places to work and live” (urban subcentres). That means distinguish those sub-centres that only attract workers (in-commuting flows) or retain their resident workers (significant local labour market) to those sub-centres that are able to attract flows and retain their resident employed population at the same time. To do so, the procedure of subcentre identification in this work is developed following three steps10. Firstly, by analyzing the commuting flows of the matrix residence-to-work, the RW (resident workers) Entropy Information and the IF (in-commuting flows) Entropy Information has been calculated for all municipalities. These indicators approximates which municipalities are the most hierarchical and complex in terms of local labor market (RW-resident workers) and in terms of attracting a great number of commuters (IF-incommuting flows), so the municipalities that best fit to the paradigm of European urban systems explained before. To estimate the RW & IF Entropy Information for each municipality –Figure 2-, it is necessary used the following two expressions11
10 The methodology proposed in this work, has its origin with the studies of Masip (2011b, 2011c) in which have tried to characterize subcentres after they have been identified into “emerging” and “large-consolidated” by using the RW & IF Entropy Information of each subcentre. 11 The expressions (1) and (2) are formulated as Shannon Entropy Index by using RW (resident workers) and IF (in-commuting flow) respectively. However, Limtanakool, (2007, 2009) have used the normalized Entropy Index in the following form: 𝐸𝐸𝐼𝐼𝑖𝑖 = −∑ (𝑋𝑋𝑋𝑋 )·𝐿𝐿𝐿𝐿 (𝑋𝑋𝑋𝑋 )
𝐿𝐿𝐿𝐿 (𝐽𝐽−1)𝐽𝐽𝑋𝑋=1 . By using the Entropy Index purposed by Limtanakool,
(2007, 2009) the expressions (1) and (2) could be reformulated as: 𝐸𝐸𝐼𝐼𝑅𝑅𝑅𝑅 = −∑ (𝑅𝑅𝑅𝑅𝑖𝑖)·𝐿𝐿𝐿𝐿 (𝑅𝑅𝑅𝑅𝑖𝑖)𝐿𝐿𝐿𝐿 (𝐿𝐿)
𝐿𝐿𝑖𝑖=1 and 𝐸𝐸𝐼𝐼𝐼𝐼𝐼𝐼 =
−∑ (𝐼𝐼𝐼𝐼𝑖𝑖)·𝐿𝐿𝐿𝐿 (𝐼𝐼𝐼𝐼𝑖𝑖)𝐿𝐿𝐿𝐿 (𝐿𝐿−1)
𝐿𝐿𝑖𝑖=1 . In this study, is used the Shannon Entropy Index instead of the Evenness Entropy because
there is only one study case (Barcelona Metropolitan Region) and the number of municipalities are constant over the time period of analysis (from 1991 to 2001).
:
𝐸𝐸𝐼𝐼𝑅𝑅𝑅𝑅 = −∑ (𝑅𝑅𝑅𝑅𝑖𝑖 · [𝐿𝐿𝐿𝐿 (𝑅𝑅𝑅𝑅𝑖𝑖)])𝐿𝐿𝑖𝑖=1 (1)
𝐸𝐸𝐼𝐼𝐼𝐼𝐼𝐼 = −∑ (𝐼𝐼𝐼𝐼𝑖𝑖 · [𝐿𝐿𝐿𝐿 (𝐼𝐼𝐼𝐼𝑖𝑖)])𝐿𝐿
𝑖𝑖=1 (2)

RSA European Conference 2012: Networked regions and cities in times of fragmentation: Developing smart, sustainable and inclusive places. Delft, The Netherlands (13th – 16th May 2012)
15
Where (𝑅𝑅𝑅𝑅𝑖𝑖 · [𝐿𝐿𝐿𝐿 (𝑅𝑅𝑅𝑅𝑖𝑖)]) and (𝐼𝐼𝐼𝐼𝑖𝑖 · [𝐿𝐿𝐿𝐿 (𝐼𝐼𝐼𝐼𝑖𝑖)]) are the RW Entropy Information & IF Entropy Information for each municipality and EIRW & EIIF are the RW Entropy Index and IF Entropy Index for the whole of the metropolitan area. The higher RW Entropy Information & IF Entropy Information for municipality (i), the higher is the weight of this municipality (i) in terms of RW & IF for the whole of the metropolitan area because RWi & IFi
Figure 2. Employment (LTL) Entropy Information: RW + IF Entropy Information
are the probability (proportion) to find RW & IF in the municipality (i) within this metropolitan area.
Source: Own Elaboration As a consequence, the higher is the RW (resident workers) Entropy Information for a given municipality, the higher is its functional urban hierarchy and complexity in terms of local labour market. Thus, the higher is the capacity of this given municipality to retain its occupied workers and being functionally autonomous from other urban nodes. For the same reason, the higher is the IF (in-commuting flows) Entropy Information for a given municipality, the higher is its capacity to attract workers and being an important node of employment within all the metropolitan area. Thus, after the RW and IF Entropy Information have separately calculated, we can find two types of municipalities:
1. Municipalities that have a higher value of RW and IF Entropy Information. Thus, urban nodes that have a hierarchical local labor market, what it means that they could retain their occupied workers and being enough attractive in residential terms to have population. In addition, these nodes are highly diverse to attract workers from other urban nodes of the metropolitan area.
2. Municipalities that have a higher value of RW or IF Entropy Information. Thus, urban nodes that are functionally hierarchical in terms of their local labor market, or nodes are important “places to work” due to their capacity to attract workers.

RSA European Conference 2012: Networked regions and cities in times of fragmentation: Developing smart, sustainable and inclusive places. Delft, The Netherlands (13th – 16th May 2012)
16
The second step of the identification and characterization procedure is based on identify the positive residuals estimated from an exponential RW Entropy Information function and from an exponential IF Entropy Information function. To do so, is used the exponential function form that McDonald & Prather (1994) has proposed as the best functional form12. Thus, these double exponential Employment Entropy Information functions can be formulated as follows:
RW(EI)Infx = C + βDistx−CBD (3)
IF(EI)Infx = C + βDistx−CBD (4) Where RW(EI)Infx and IF(EI)Infx are the RW and IF Entropy Informations at municipality (x), C is the constant which is argued to be the RW and IF Entropy Informations at CBD and Distx-CBD
Figure 3. Employment (LTL=RW+IF) Density function versus Double Employment Entropy functions (RW and IF Entropy Information functions)
Source: Own Elaboration
is the distance between CBD and the municipality (x).
12 As it is explained in the previous section, McDonald & Prather (1994), identify possible employment subcentres by examining the residuals from a monocentric regression model of employment density. After tested seven different functional forms of employment density, they conclude that the simple negative exponential has emerged as the best functional form: CBDxx BDkLnD −+= where Dx is the employment density at municipality (x), K is the constant which is argued to be the density at CBD, and Dx-CBD is the distance between CBD and municipality (x).

RSA European Conference 2012: Networked regions and cities in times of fragmentation: Developing smart, sustainable and inclusive places. Delft, The Netherlands (13th – 16th May 2012)
17
In that sense, the proposed procedure to identity subcentres has integrated the origin of North-American studies in order to identify subcentres. With computing the RW & IF Entropy Information of each municipality in function of the distance to the CBD, the procedure adopts a morphological methodology which is based on the bid-rent theoretical tradition but in this case instead of using employment density, is used a double employment entropy information (resident workers entropy and in-commuting flows entropy). In the following Figure 3, for example, it is possible to compare the standard employment density function with the double employment (RW +IF) Entropy information functions for the Barcelona Metropolitan Region in 2001. As the graphics depicted, when it is computed the double Entropy functions it is possible to identify more clearly the nodes that are above of the standard deviation, so the nodes that are more hierarchical and complex in terms of resident workers and in-commuting flows (or in one of these) within the metropolitan area. Meanwhile when it is computed only the standard employment density function, this evidence is less clearly and it is possible to identify as a candidate to subcentre some small municipalities with low employment density but that it appears as a subcentre because their location is too far from the CBD, in our case, from Barcelona. In order to analyze these three models, the next Table 3 contains the results of applying the aforementioned expressions using the Barcelona Metropolitan Region data in 200113
Table 3. Models with standard Employment Density and RW & IF Entropy Information for the Barcelona Metropolitan Region in 2001
Source: Own Elaboration
.
It can be observed that although the three models are significant and have the expect sign: e.g. the bigger is the distance to CBD, the lower is the density, the model which fits better is the standard employment density, since its R2
13 In this work only is presented the results in 2001. The results of these three models for 1991 and 1996 are not presented because it leads us to the same conclusions.
and the Anova’s F statistics have a higher value in comparison with the RW and IF Entropy Information models. However, that is not meaning that the employment density model is the better model in order to identify urban subcentres: is expected that the functional urban hierarchy and complexity have to be explained by using other explanatory variables than only the distance to the CBD. As we will see in the following sections, the urban subcentres by using this new procedure are more dominant in terms of in-
Ln Employment Density (2001)RW (resident workers)
Entropy Information (2001)IF (in-commuting flows)
Entropy Information (2001)
Adjusted R2 0,301 0,138 0,267
F 67,103 25,991 58,976F (sig) 0 0 0
Constant 8,149*** 0,046*** 0,064***Constant (t-value) 45,949 7,295 10,535Constant (sig) 0 0 0
Dist. Bcn-CBD -0,040*** -0,001*** -0,001***Dist. Bcn-CBD (t-value) -8,192 -5,098 -7,680Dist. Bcn-CBD (sig) 0 0 0
***, **, * variables significant at 99 per cent, 95 per cent and 90 per cent respectively
RSA European Conference 2012: Networked regions and cities in times of fragmentation: Developing smart, sustainable and inclusive places. Delft, The Netherlands (13th – 16th May 2012)
18
commuting flows, more self-contained, and their influence on the urban structure are more significant (having a major influence on the overall metropolitan employment). Finally, the third step of the proposed methodology consists in selecting the positive residuals of the two previous explained Employment Entropy functions (3) and (4). The municipalities that have positive residuals in these two Employment Entropy functions are defined as subcentres and characterized simultaneously with the following conditions:
1. The municipalities that have both positive residuals in the RW and IF Entropy Information functions as defined as “large-consolidated” subcentres14
2. The municipalities that have positive residuals in RW or IF Entropy Information functions as defined as “emerging” subcentres. These nodes are able to structure and being an important economic node of attraction within the metropolitan area, but they also tend to be mono-specialized and having a small or medium size population due to their origin is the employment and population decentralization from the CBD. Thus, this kind of subcentre fits to the decentralized subcentres definition that García-López & Muñiz (2010a, pg.3048) and García-López (2010b, pg.125) have proposed in their studies.
. These urban nodes tend to be over-specialized in more than one economic activity, so they are diverse, having a signification population and they are able to retain their occupied workers, so they have an important local labour market as well as being attractive to grasp a higher mass of workers (in-commuting flows) from elsewhere in the metropolitan area. This kind of subcentres, from this point of view are suitable with the McMillen’s (2004, pg. 255) large subcentres definition: “large subcentres can look remarkably similar to a traditional central business district, with thousands of workers employed in a wide variety of industries” at the time that they are complex and hierarchical in terms of local market. These subcentres it also satisfy the definition of what a urban subcentre is according to Roca’s et al. (2009, pg 2860) definition: “the subcentres should constitute real poles of influence and territorial reference that surround them in cultural, social and economic aspects. In order to be truly considered as centres, they should generate authentic cities within their surroundings and, therefore configure a metropolis as a city of cities”.
Summarizing, the proposed methodology in this work, in order to identify and characterize simultaneously the urban subcentres is an objective procedure in which there is no local knowledge in the identification criterions in comparison with other methodologies explained before at the time that it tries to be replicable to other metropolitan areas.
4.1. Results In this section the results of the above-mentioned procedure are reported and compared with those emerging using the traditional density-based method of Giuliano & Small (1991) but using the thresholds proposed by García-López & Muñiz (2005, 2007, 2010a)15
14 The subcentres defined as “large-consolidated” are fit to the definition of Christallerian subcentres that Muñiz et al. (2008) have proposed. 15 Is used the employment thresholds proposed by García-López & Muñiz (2005, 2007, 2010a) instead of the Giuliano & Small’s thresholds because the García-López & Muñiz studies are focused on the Barcelona Metropolitan Region (the same study case of this work).
and the density method of McDonald & Prather (1994).

RSA European Conference 2012: Networked regions and cities in times of fragmentation: Developing smart, sustainable and inclusive places. Delft, The Netherlands (13th – 16th May 2012)
19
As regards of the methodology proposed in this work, the following Figures 4-6 and Table 4, represent the identified “large-consolidated” and “emerging” subcentres from 1991 to 2001 in the Barcelona Metropolitan Region.
Figure 4. Municipalities identified as possible subcentres in 1991 for the Barcelona Metropolitan Region
Source: Own Elaboration
Figure 5. Municipalities identified as possible subcentres in 1996 for the Barcelona Metropolitan Region
Source: Own Elaboration
Sabadell
Terrassa
Barcelona - CBD
Mataró
Granollers
Badalona
Vilanova i la Geltrú
Vilafranca del Penedès
Barcelona - CBD
Mataró
Granollers
Badalona
Hospitalet de Llobregat
Cornellà de Llobregat
Vilanova i la Geltrú
Vilafranca del Penedès
Sabadell
Terrassa
Martorell
Rubí

RSA European Conference 2012: Networked regions and cities in times of fragmentation: Developing smart, sustainable and inclusive places. Delft, The Netherlands (13th – 16th May 2012)
20
Figure 6. Municipalities identified as possible subcentres in 2001 for the Barcelona Metropolitan Region
Source: Own Elaboration
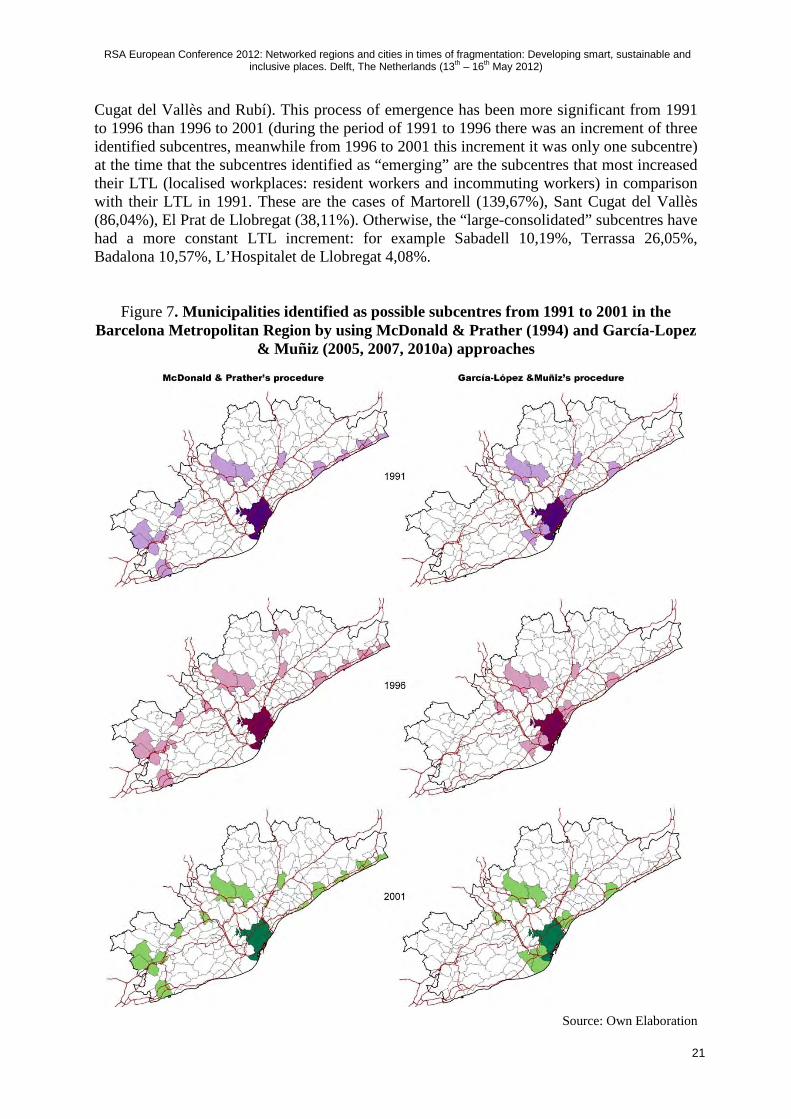
Table 4. Municipalities identified as possible subcentres from 1991 to 2001 in the Barcelona Metropolitan Region
Source: Own Elaboration The last Figures 4-6 and Table 4 highlight that from 1991 to 2001 in the Barcelona Metropolitan Region, there has been a process of emergence of subcentres linked to the infrastructure nodes (Martorell, Rubí) as well as in the north of the CBD-Barcelona (Sant
Municipality (name) 1991 1996 2001
% Increment LTL (2001-1991) in
comparison with their LTLs in 1991
Distance to CBD (Barcelona)
Barcelona CBD CBD CBD -0,36% -Sabadell Large-Consolidated Large-Consolidated Large-Consolidated 10,19% 21,36 Terrassa Large-Consolidated Large-Consolidated Large-Consolidated 26,05% 24,90 Mataró Emerging Emerging Large-Consolidated 16,15% 31,26 Badalona Large-Consolidated Large-Consolidated Large-Consolidated 10,57% 11,43 Hospitalet de Llobregat (L') Large-Consolidated Large-Consolidated Large-Consolidated 4,08% 5,14 Vilanova i la Geltrú Emerging Emerging Emerging 29,40% 46,17 Granollers Large-Consolidated Large-Consolidated Large-Consolidated 25,69% 28,62 Vilafranca del Penedès Emerging Emerging 23,88% 46,21 Rubí Emerging Large-Consolidated 43,82% 21,47 Martorell Emerging Emerging 139,67% 27,26 Cornellà de Llobregat Emerging Emerging 25,35% 9,56 Prat de Llobregat (El) Emerging 38,11% 12,25 Sant Cugat del Vallès Emerging 86,04% 12,07
8 urban sub-centres 11 urban sub-centres 12 urban sub-centres Average (14,95%) Average (33,73)
Vilanova i la Geltrú
El Prat de Llobregat
Sabadell
Terrassa
Barcelona - CBD
Mataró
Granollers
Badalona
Hospitalet de Llobregat
Cornellà de Llobregat
Martorell
Rubí
Sant Cugat del Vallès
RSA European Conference 2012: Networked regions and cities in times of fragmentation: Developing smart, sustainable and inclusive places. Delft, The Netherlands (13th – 16th May 2012)
21
Cugat del Vallès and Rubí). This process of emergence has been more significant from 1991 to 1996 than 1996 to 2001 (during the period of 1991 to 1996 there was an increment of three identified subcentres, meanwhile from 1996 to 2001 this increment it was only one subcentre) at the time that the subcentres identified as “emerging” are the subcentres that most increased their LTL (localised workplaces: resident workers and incommuting workers) in comparison with their LTL in 1991. These are the cases of Martorell (139,67%), Sant Cugat del Vallès (86,04%), El Prat de Llobregat (38,11%). Otherwise, the “large-consolidated” subcentres have had a more constant LTL increment: for example Sabadell 10,19%, Terrassa 26,05%, Badalona 10,57%, L’Hospitalet de Llobregat 4,08%.
Figure 7. Municipalities identified as possible subcentres from 1991 to 2001 in the Barcelona Metropolitan Region by using McDonald & Prather (1994) and García-Lopez
& Muñiz (2005, 2007, 2010a) approaches
Source: Own Elaboration

RSA European Conference 2012: Networked regions and cities in times of fragmentation: Developing smart, sustainable and inclusive places. Delft, The Netherlands (13th – 16th May 2012)
22
Figure 7 shows the identified subcentres by using two traditional density-based methods: identifying positive residuals as McDonald & Prather (1994) and using thresholds in the way that García-López & Muñiz (2005, 2007, 2010a) has been proposed16
1. Dominance Index (DI)
. Comparing the results of these two methodologies with the proposed procedure in this work, it lead us to conclude that the proposed methodology have both advantages of these procedures: (i) identifying subcentres with a significant mass critic in terms of employment (advantage of using a correct thresholds) and identifying subcentres in function of their distance from the CBD (advantage of McDonalds & Prather’s procedure and one of the drawbacks of cut-off approaches). However, in order to compare in more detail the identified subcentres according to these three approaches and testing the “validity” of the proposed methodology it has been calculated the following urban indicators using data from the Barcelona Metropolitan Region at municipal level in 2001. The indicators are:
17
2. Diversity Index
: it determines the capacity of a subcentre to attract workers from the whole of the metropolitan area and being a dominant employment node.
18
3. Location coefficient (LC): is expected that subcentres with centrality functions are diversified
19
: is calculated the (LC) of FIRE (finance, insurance and real estate) activities, the LC of retail activities and the LC of qualified manufacturing. It is expected to find that subcentres specialized in these economic activities.
Table 5. Subcentres by using the proposed procedure in 2001: urban indicators
Source: Own Elaboration
16 To know the criterions of these two methodologies to identify subcentres, see Table 1 and Table 2. 17 The DI is calculated as follows: 𝐷𝐷𝐼𝐼𝑢𝑢−𝑠𝑠𝑢𝑢𝑠𝑠 =
𝐼𝐼𝐼𝐼(𝑖𝑖)𝐼𝐼𝐼𝐼𝑚𝑚𝑚𝑚𝐿𝐿
where IF(i) are the in-commuting flows of a given
municipality, IFma are the total in-commuting flows of a given metropolitan area, (n) are the total number of municipalities and 𝐼𝐼𝐼𝐼𝑚𝑚𝑚𝑚
𝐿𝐿 is the average attractiveness in terms of in-commuting flows. Thus if a municipality its
DI > 1, it can be considered as a dominant node within this given metropolitan area. 18 It has been used the Shannon Index: H = −∑ Ln(Pi
ni=1 x) ∗ Pi(x) , where Pi(x) is the probability to find a (x)
element (e.g.: employment in a given retail firm) in municipality (i). The sum is multiplied by (-1) in order to get a positive indicator. Thus, the bigger is H, the higher the diversity. 19 The LC is calculated as follows: LC =
LTLx iLTLi
∑ LTLxini
∑ LTLxinix
where LTL are the localized workplaces, (x) is a given
industry of economical activity and (i) is a given municipality of the metropolitan area.
Municipality (name)LTL (localised workplaces)
PopulationDominance Index (DI)
Diversity Index
Location coefficient (LC)
FIRE
Location coefficient (LC)
Retail
Location coefficient (LC) Manufacturing
Barcelona (CBD) 743.594 1.505.325 51,78 2,414 1,415 0,958 0,573 Sabadell 68.401 185.170 4,83 2,275 1,084 1,093 1,014 Terrassa 66.510 174.756 3,35 2,206 0,802 1,117 1,108 Mataró 41.997 107.191 2,26 2,195 0,748 1,114 1,223 Badalona 54.381 208.994 4,36 2,243 0,712 1,274 0,973 Hospitalet de Llobregat (L') 65.642 242.480 7,11 2,288 0,793 1,209 0,879 Vilanova i la Geltrú 18.730 53.421 0,98 2,284 0,675 1,263 0,929 Granollers 31.047 53.681 3,87 2,165 0,800 1,090 1,260 Rubí 27.282 60.303 2,62 1,768 0,530 0,823 2,014 Martorell 23.555 22.537 3,98 1,562 0,524 0,576 2,355 Cornellà de Llobregat 27.385 81.145 3,76 2,172 0,910 1,442 1,040 Prat de Llobregat (El) 31.362 63.139 3,97 2,113 0,770 0,978 1,095 Sant Cugat del Vallès 26.593 55.825 3,50 2,350 1,370 0,868 0,847

RSA European Conference 2012: Networked regions and cities in times of fragmentation: Developing smart, sustainable and inclusive places. Delft, The Netherlands (13th – 16th May 2012)
23
Comparing the Tables 5 and 6, the results show that the 12 subcentres identified by the proposed methodology are: (i) more dominant in terms of in-commuting flows (most subcentres identified by using McDonald & Prather’s method their Dominance Index are < 1, for example: Castellví de la Marca, Sant Martí Sarroca or Canet de Mar), (ii) more specialized in FIRE and retail economic activities (e.g. Sant Cugat del Vallès and Badalona, L’Hospitalet de Llobregat and Cornellà del Llobregat respectively) and finally (iii) more significant in terms of employment and population mass critic (e.g. Castellví de la Marca and Sant Martí de Sarroca have less than 750 localised workplaces and 5000 population).
Table 6. Subcentres by using McDonald & Prather’s method in 2001: urban indicators
Source: Own Elaboration However, when it is compared the results of Tables 5 and 7, the differences between the 12 subcentres identified by the proposed methodology and the identified subcentres by using the cut-off approach proposed as García-López & Muñiz are less significant: (i) in terms of employment and population mass critic the identify subcentres by using both approaches are similar, (ii) in terms of being a dominant nodes it may be that the identified subcentres by using the proposed procedure are quite more dominant, e.g. Sant Cugat del Vallès with a Dominance Index of 3,50 it has not been identified by using the cut-off approach and finally (iii) in terms of Diversity Index and the three analyzed Location coefficients both subcentres by using the two approaches obtain similar results but with the exception again of Sant Cugat del Vallès (subcentre with a higher value of specialization -1,370- in FIRE activities). In conclusion, after being analyzed the identified subcentres by using the selected urban indicators, is clear that the proposed methodology in this work, could identify subcentres that are more dominant, with a higher mass critic in terms of population and employment, are
Municipality (name)LTL (localised workplaces)
PopulationDominance Index (DI)
Diversity Index
Location coefficient (LC)
FIRE
Location coefficient (LC)
Retail
Location coefficient (LC) Manufacturing
Barcelona (CBD) 743.594 1.505.325 51,78 2,414 1,415 0,958 0,573 Arenys de Mar 4.031 12.819 0,31 2,451 0,596 1,001 0,701 Calella 5.213 13.814 0,48 2,341 0,644 1,189 0,364 Canet de Mar 2.812 10.585 0,14 2,212 0,628 0,946 1,222 Castellví de la Marca 470 1.434 0,04 1,923 0,270 0,496 1,532 Granollers 31.047 53.681 3,87 2,165 0,800 1,090 1,260 Llagosta (La) 4.576 12.124 0,60 1,835 0,473 0,800 1,916 Malgrat de Mar 5.083 14.246 0,29 2,224 0,490 1,122 0,955 Martorell 23.555 22.537 3,98 1,562 0,524 0,576 2,355 Mataró 41.997 107.191 2,26 2,195 0,748 1,114 1,223 Pineda de Mar 6.547 20.871 0,39 2,235 0,665 0,963 1,078 Premià de Mar 5.596 26.555 0,45 2,361 0,785 1,229 0,794 Sabadell 68.401 185.170 4,83 2,275 1,084 1,093 1,014 Vilassar de Mar 5.304 17.374 0,58 2,373 0,762 1,199 0,779 Sant Martí Sarroca 720 2.512 0,08 2,245 0,401 0,913 0,947 Sant Sadurní d'Anoia 4.762 9.805 0,35 1,909 0,382 0,974 1,772 Santa Margarida i els Monjos 3.165 4.834 0,42 1,489 0,304 0,654 2,444 Terrassa 66.510 174.756 3,35 2,206 0,802 1,117 1,108 Vilafranca del Penedès 13.000 30.807 1,10 2,295 0,989 1,317 0,841 Vilanova i la Geltrú 18.730 53.421 0,98 2,284 0,675 1,263 0,929

RSA European Conference 2012: Networked regions and cities in times of fragmentation: Developing smart, sustainable and inclusive places. Delft, The Netherlands (13th – 16th May 2012)
24
diverse and specialized in central economic activities such as FIRE, retail and qualified manufacturing. Table 7. Subcentres by using García-López & Muñiz’s method in 2001: urban indicators
Source: Own Elaboration
5. SUBCENTRE INFLUENCE ON THE EMPLOYMENT AND POPULATION DENSITY PATTERNS
In the literature a usual way to validate the municipalities that are identified as subcentres is to test whether or not they modify the overall employment and population metropolitan density functions after having controlled the distance to CBD. In order to meet the aims of this section (measure the influence of the identified subcentres by using the proposed methodology) we estimate a polycentric density function with the same objective as the traditional monocentric density function: to explain the value of employment and population density in each municipalities (our case of this work) depending on their location and on their distance to the structuring elements of the city, mainly employment centres (CBD and subcentres). The estimated coefficients of these distances are the so-called gradients and their values and significances measure their influence. For the case of a polycentric spatial structure, this study has adopted the most commonly model, proposed by McDonald & Prather (1994). This polycentric spatial structure model is formulated as follows:
D(dCBD ) = D0e−αdCBD +βdSUB−1 +∈ (5)
Applying neperian logarithm to (5) we obtain:
LnD(dCBD ) = LnD0 − αdCBD + βdSUB−1 + ε (6)
However, the employment and population location is also influenced by the proximity (distance and/or time) of transportation infrastructures. For this reason, in this work, it is computed its effect by extending the previous equation (6) with the average time that the
Municipality (name)LTL (localised workplaces)
PopulationDominance Index (DI)
Diversity Index
Location coefficient (LC)
FIRE
Location coefficient (LC)
Retail
Location coefficient (LC) Manufacturing
Barcelona (CBD) 743.594 1.505.325 51,78 2,414 1,415 0,958 0,573 Badalona 54.381 208.994 4,36 2,243 0,712 1,274 0,973 Cornellà de Llobregat 27.385 81.145 3,76 2,172 0,910 1,442 1,040 Granollers 31.047 53.681 3,87 2,165 0,800 1,090 1,260 Hospitalet de Llobregat (L') 65.642 242.480 7,11 2,288 0,793 1,209 0,879 Martorell 23.555 22.537 3,98 1,562 0,524 0,576 2,355 Mataró 41.997 107.191 2,26 2,195 0,748 1,114 1,223 Prat de Llobregat (El) 31.362 63.139 3,97 2,113 0,770 0,978 1,095 Sabadell 68.401 185.170 4,83 2,275 1,084 1,093 1,014 Sant Boi de Llobregat 23.239 79.463 2,33 2,188 0,636 1,281 1,102 Santa Coloma de Gramanet 19.078 116.064 1,41 2,321 0,705 1,409 0,664 Terrassa 66.510 174.756 3,35 2,206 0,802 1,117 1,108

RSA European Conference 2012: Networked regions and cities in times of fragmentation: Developing smart, sustainable and inclusive places. Delft, The Netherlands (13th – 16th May 2012)
25
employed population takes to reach their workplaces from their residences (accessibility to the workplace, residence-to-work commuting time)20
Where D(d
:
LnD(dCBD ) = LnD0 − αdCBD + βdSUB−1 − μATR−W + ε (7)
CBD) is the employment density at a distance dCBD from the CBD and at a distance
dSUB from the subcentre, D0 is estimated employment density in the CBD, α is the density gradient associated with the distance to the CBD21, d-1
SUB is the inverse of the distance to the nearest subcentre22, β is corresponding its density gradient23, ATR-W
While the interpretation of the coefficient of the distance to the CBD or the accessibility to the workplace can be done directly, the interpretation of the estimated coefficient for the inverse of the distance of the nearest subcentre is the opposite. For example a positive (negative) coefficient indicates that the employment density growth is less (greater) as we move away from the subcentre under consideration. In addition, a negative and significant accessibility to the workplace gradient (µ<0) would confirm the influence of transportation infrastructure. In that sense, the Figure 8 (appendix of this work) depicts simultaneously the changes in terms of transportation infrastructures and the subcentre identification. The following Table 8 shows the results of the polycentric spatial structure model by using the previous equation (7)
is the average time of residence-to-work commuting, µ is the density gradient associated with the accessibility to the workplace (infrastructure influence) and Ɛ is the error term.
24
20 The data of average time (in minutes) comes from the Spanish population census in 1991 and 2001 and from the municipality register for 1996, which are produced by the Instituto Nacional de Estadística (INE). 21 The density gradient expresses the density’s percentage variation in the event of a marginal increase of the distance to the center. In an exponential function, the gradient is constant for any distance. 22 The use of an inverted distance enables multicolinearity problems to be eliminated (McDonald & Prather, 1994). For the same reason, and following the example of studies like those of McMillen & McDonald (1998), McMillen & Lester (2003) and McMillen (2004), in this work has used a single variable that adopts the distance to the nearest subcentre. 23 Observe that working with a direct distance for the case of the CBD and an inverted distance for the nearest subcentre that means recognizing that the CBD’s influence (in our case Barcelona) is greater than that of the subcentre for long distances. 24 The equation (7) is estimated by ordinary least squares.
according to the proposed procedure in this work and to the other methodologies to identify subcentres explained in the previous section. The Table 8 highlights all the models are statistical significant and meet the requirements of OLS calibration. The density gradients associated with the distance to the CBD (α) and with the distance to the nearest subcentre (β) are significant for all models and years. The negative sign of (α) gradient implies that the employment density decreases as we move away from the distance to the CBD and the positive sign of (β) gradient also implies that the employment density decreases as we move away from the nearest subcentre. Thus, both CBD and the identified subcentres for all models exert and influence on the employment location pattern and on its density. In addition, the negative and significant accessibility to workplace gradient (µ) for all models and years confirm the influence of transportation infrastructure on the employment location. The negative sign of (µ) gradient entails that the employment density decreases as the average commuting time residence-to-work increases (less accessibility). So, it is expected that the infrastructure gradient and its significance level increase over time showing an increase in their structuring role (the average commuting time residence-to-work in 2001 is low than in 1991 due to the improvements in terms of transportation infrastructure).

RSA European Conference 2012: Networked regions and cities in times of fragmentation: Developing smart, sustainable and inclusive places. Delft, The Netherlands (13th – 16th May 2012)
26
Table 8. Influence of the identified subcentres on the overall employment density from 1991 to 2001 in the Barcelona Metropolitan Region
Source: Own Elaboration However, the municipalities identified as subcentres by using the proposed methodology (by using a double RW and IF Entropy Information functions) are more efficient in the explanation of overall metropolitan employment density that those identified by using the other two methodologies. Although from 1991 to 2001, the R2 of this model has decreased from 0,507 to 0,501, this model has the higher value of R2 for all analyzed years in comparison with the R2
of the other two considered models. Furthermore, the density gradient of subcentre (β) is higher in the case of subcentres detected by using the proposed procedure that from those prioritized by using McDonald & Prather’s method and García-López & Muñiz’s method, although in this last case this difference is less relevant (1,578***; 1,603***; 1,443*** in relation to 0,196**; 0,362***; 0,592*** and 1,168***; 1,519***; 1,349*** respectively). Therefore, the municipalities identified as subcentres by the proposed methodology (double RW and IF Entropy Information functions) have a bigger influence on the employment density function. This observation, could lead us to ask if the Employment density-based methodologies to identify subcentres are enough efficient for achieve their goal or on the contrary, if the Employment Entropy that synthesizes the urban hierarchy and complexity of the urban systems has emerged as the best methodology to identify urban subcentres (and also employment subcentres).
In addition, by analyzing the density gradient of the distance to the nearest subcentre and its significance level it is possible to determine if the spatial structure have become more polycentric or dispersed for the analyzed time period. According to García-López & Muñiz (2007) four situations are possible: (i) an increment of the subcentre gradient value as well as its significance level what it means an increment of polycentricity with low scope, (ii) an increment of the subcentre gradient value but its significance level has decreased what it means a urban dynamic towards a polycentricity with low scope and towards a dispersion (low density), (iii) a reduction of the subcentre gradient value and an increment of its significance level, in this case it means a urban dynamic towards a polycentricity with high scope and finally (iv) a reduction the subcentre gradient value as well as its significance level what it entails an unequivocal process towards dispersion.
Methodology:
OLS gradients estimates model (equation 7)
1991 (1)
1996 (2)
2001 (3)
1991 (4)
1996 (5)
2001 (6)
1991 (7)
1996 (8)
2001 (9)
Ln Do (constant) 10,070*** 11,377*** 10,966*** 9,941*** 11,297*** 10,881*** 9,691*** 11,106*** 10,860***
(t-value) (15,897) (19,507) (22,460) (16,516) (19,288) (20,176) (15,808) (18,922) (19,890)
β (dist. nearest subcentre) 0,196** 0,362*** 0,592*** 1,168*** 1,519*** 1,349*** 1,578*** 1,603*** 1,443***
(t-value) (2,001) (4,654) (6,915) (3,583) (4,692) (4,082) (3,682) (5,053) (4,140)
α (distance to BCN - CBD) -0,045*** -0,060*** -0,058*** -0,036*** -0,047*** -0,045*** -0,040*** -0,051*** -0,046***
(t-value) (-8,125) (-11,787) (-13,225) (-6,573) (-8,688) (-8,537) (-7,629) (-9,867) (-8,961)
µ (time residence-to-work) -0,075*** -0,122*** -0,116*** -0,090*** -0,144** -0,134*** -0,074*** -0,131*** -0,130***
(t-value) (-3,496) (-5,818) (-6,084) (-4,449) (-7,041) (-6,566) (-3,672) (-6,445) (6,350)
Adjusted R2 0,298 0,416 0,459 0,340 0,498 0,487 0,355 0,507 0,501
F 22,339 41,448 46,046 26,793 51,036 50,653 27,646 52,691 51,596
F (sig) 0 0 0 0 0 0 0 0 0
***, **, * variables significant at 99 per cent, 95 per cent and 90 per cent respectively
McDonald & Prahter García-López & Muñiz Proposed methodology
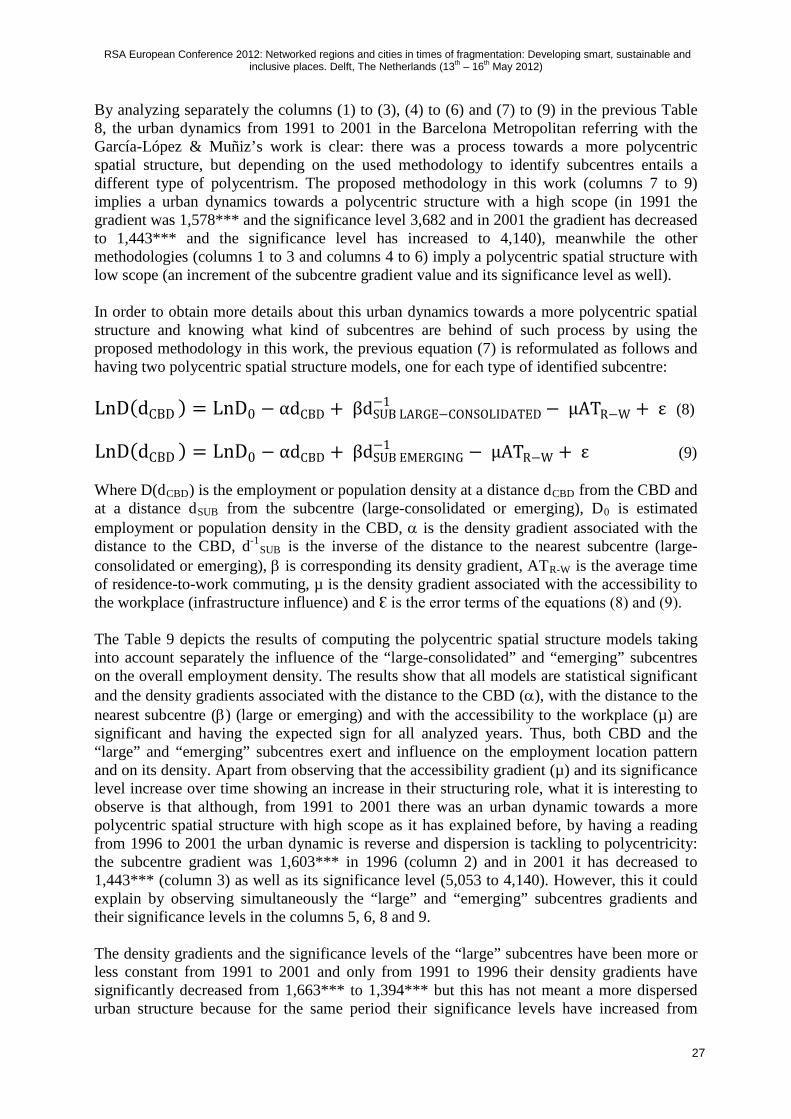
RSA European Conference 2012: Networked regions and cities in times of fragmentation: Developing smart, sustainable and inclusive places. Delft, The Netherlands (13th – 16th May 2012)
27
By analyzing separately the columns (1) to (3), (4) to (6) and (7) to (9) in the previous Table 8, the urban dynamics from 1991 to 2001 in the Barcelona Metropolitan referring with the García-López & Muñiz’s work is clear: there was a process towards a more polycentric spatial structure, but depending on the used methodology to identify subcentres entails a different type of polycentrism. The proposed methodology in this work (columns 7 to 9) implies a urban dynamics towards a polycentric structure with a high scope (in 1991 the gradient was 1,578*** and the significance level 3,682 and in 2001 the gradient has decreased to 1,443*** and the significance level has increased to 4,140), meanwhile the other methodologies (columns 1 to 3 and columns 4 to 6) imply a polycentric spatial structure with low scope (an increment of the subcentre gradient value and its significance level as well). In order to obtain more details about this urban dynamics towards a more polycentric spatial structure and knowing what kind of subcentres are behind of such process by using the proposed methodology in this work, the previous equation (7) is reformulated as follows and having two polycentric spatial structure models, one for each type of identified subcentre: LnD(dCBD ) = LnD0 − αdCBD + βdSUB LARGE−CONSOLIDATED
−1 − μATR−W + ε (8) LnD(dCBD ) = LnD0 − αdCBD + βdSUB EMERGING
−1 − μATR−W + ε (9) Where D(dCBD) is the employment or population density at a distance dCBD from the CBD and at a distance dSUB from the subcentre (large-consolidated or emerging), D0 is estimated employment or population density in the CBD, α is the density gradient associated with the distance to the CBD, d-1
SUB is the inverse of the distance to the nearest subcentre (large-consolidated or emerging), β is corresponding its density gradient, ATR-W
is the average time of residence-to-work commuting, µ is the density gradient associated with the accessibility to the workplace (infrastructure influence) and Ɛ is the error terms of the equations (8) and (9).
The Table 9 depicts the results of computing the polycentric spatial structure models taking into account separately the influence of the “large-consolidated” and “emerging” subcentres on the overall employment density. The results show that all models are statistical significant and the density gradients associated with the distance to the CBD (α), with the distance to the nearest subcentre (β) (large or emerging) and with the accessibility to the workplace (µ) are significant and having the expected sign for all analyzed years. Thus, both CBD and the “large” and “emerging” subcentres exert and influence on the employment location pattern and on its density. Apart from observing that the accessibility gradient (µ) and its significance level increase over time showing an increase in their structuring role, what it is interesting to observe is that although, from 1991 to 2001 there was an urban dynamic towards a more polycentric spatial structure with high scope as it has explained before, by having a reading from 1996 to 2001 the urban dynamic is reverse and dispersion is tackling to polycentricity: the subcentre gradient was 1,603*** in 1996 (column 2) and in 2001 it has decreased to 1,443*** (column 3) as well as its significance level (5,053 to 4,140). However, this it could explain by observing simultaneously the “large” and “emerging” subcentres gradients and their significance levels in the columns 5, 6, 8 and 9. The density gradients and the significance levels of the “large” subcentres have been more or less constant from 1991 to 2001 and only from 1991 to 1996 their density gradients have significantly decreased from 1,663*** to 1,394*** but this has not meant a more dispersed urban structure because for the same period their significance levels have increased from

RSA European Conference 2012: Networked regions and cities in times of fragmentation: Developing smart, sustainable and inclusive places. Delft, The Netherlands (13th – 16th May 2012)
28
3,900 to 4,402. Thus, the point is that the “emerging” subcentres have increased extremely their density gradients and their significance levels from 1991 to 1996 (1,578*** to 1,612*** and 3,816 to 5,318 respectively) at the point that its gradient and significance level are higher than the “large” subcentres in 1996 for then loosing these increments during the last time period (1,298*** and 3,972 respectively). Consequently, the reduction of the density gradients and the significance levels of the subcentres from 1996 to 2001 (columns 2 and 3) is explained by the emergence of important “emerging” subcentres in 1996 such as Martorell and Rubí (see Figure 5) and then by the loss of weight in terms of density gradients and significant levels for the “emerging” subcentres in 2001 due to the disappearance of the “emerging” subcentre of Vilafranca del Penedès, the transformation of Rubí into “large” subcentre and the inability to the new “emerging” subcentre of Sant Cugat del Vallès to thwart these urban dynamics (see Figure 5 and 6). Table 9. Influence of the “emerging” and “large-consolidated” subcentres on the overall
employment density from 1991 to 2001 in the Barcelona Metropolitan Region
Source: Own Elaboration The Table 10 presents the results of the influence of the “large-consolidated” and “emerging” subcentres on the overall population density. As previously, the results show that all models are statistical significant and both CBD and the “large” and “emerging” subcentres exert and influence on the population location pattern and on its density. However, as the residential activity tends to more dispersed than the economic activity, the influence of “large” and “emerging” subcentres on the population density are less in comparison with the employment density (Table 9): the R2 of the population density models are quite low in comparison with the R2
OLS gradients estimates models (equations 7, 8, 9)
1991 (7)
1996 (7)
2001 (7)
1991 (8)
1996 (8)
2001 (8)
1991 (9)
1996 (9)
2001 (9)
Ln Do (constant) 9,691*** 11,106*** 10,860*** 9,743*** 11,252*** 10,938*** 9,926*** 11,299*** 10,976***
(t-value) (15,808) (18,922) (19,890) (16,085) (18,944) (20,113) (16,548) (19,711) (20,247)
β (dist. nearest subcentre) 1,578*** 1,603*** 1,443***
(t-value) (3,682) (5,053) (4,140)
β (dist. nearest large subcentre) 1,663*** 1,394*** 1,364***
(t-value) (3,900) (4,402) (4,002)
β (dist. nearest emerg. subcentre) 1,578*** 1,612*** 1,298***
(t-value) (3,816) (5,318) (3,972)
α (distance to BCN - CBD) -0,040*** -0,051*** -0,046*** -0,038*** -0,051*** -0,047*** -0,043*** -0,052*** -0,048***
(t-value) (-7,629) (-9,867) (-8,961) (-7,249) (-9,631) (-9,148) (-8,256) (-10,484) (-9,489)
µ (time residence-to-work) -0,074*** -0,131*** -0,130*** -0,078*** -0,134*** -0,131*** -0,077*** -0,135*** -0,130***
(t-value) (-3,672) (-6,445) (6,350) (-3,888) (-6,460) (-6,379) (-3,838) (-6,708) (-6,302)
Adjusted R2 0,355 0,507 0,501 0,348 0,489 0,498 0,346 0,514 0,497
F 27,646 52,691 51,596 28,429 49,125 50,917 28,122 54,285 50,774
F (sig) 0 0 0 0 0 0 0 0 0
***, **, * variables significant at 99 per cent, 95 per cent and 90 per cent respectively
of the employment density models (for example 0,285; 0,398 and 0,362 in relation to 0,355; 0,507 and 0,501 respectively) as well as in terms of density gradients and significance levels of all subcentres (columns 1 to 3), “large” subcentres (columns 4 to 6) and “emerging” subcentres (columns 7 to 9). For example taking into account all identified subcentres their density gradients and significance levels in terms of population density are 1,504***; 1,389***; 1,155*** and 3,557; 4,375; 3,205 in relation to 1,578***; 1,603***; 1,443*** and

RSA European Conference 2012: Networked regions and cities in times of fragmentation: Developing smart, sustainable and inclusive places. Delft, The Netherlands (13th – 16th May 2012)
29
3,682; 5,053 ; 4,140 respectively (Table 9). Thus, the urban dynamic from 1991 to 2001 in the Barcelona Metropolitan Region in terms of population depicts a different situation than in terms of employment: from 1991 to 1996 there was a process towards a polycentricity with a higher scope (a reduction of the subcentre gradient values and an increment of its significance levels) and from 1996 to 2001 there was an urban trend towards dispersion due to the reduction of the subcentre gradient values and its significance levels. Table 10. Influence of the “emerging” and “large-consolidated” subcentres on the overall
population density from 1991 to 2001 in the Barcelona Metropolitan Region
Source: Own Elaboration In order to give more explanations about the urban dynamics from 1991 to 2001 in terms of employment and population patterns, it has been calculated the following urban indicators using data from the Barcelona Metropolitan Region at municipal level in 1991, 1996 and 2001, at the time that these selected indicators has been calculated at a disaggregated level: taking into account the whole of the metropolitan region, the CBD (Barcelona), the identified subcentres and the rest of the metropolitan region. The indicators are:
1. Employment (LTL) Entropy Index25
25 The Employment (LTL) Entropy Index is calculated as follows: 𝐸𝐸𝐼𝐼𝐿𝐿𝐿𝐿𝐿𝐿 = −∑ (𝐿𝐿𝐿𝐿𝐿𝐿𝑖𝑖 · [𝐿𝐿𝐿𝐿 (𝐿𝐿𝐿𝐿𝐿𝐿𝑖𝑖)])𝐿𝐿
𝑖𝑖=1 where EILTL is the LTL Entropy Index for the whole of the metropolitan system, (𝐿𝐿𝐿𝐿𝐿𝐿𝑖𝑖 · [𝐿𝐿𝐿𝐿 (𝐿𝐿𝐿𝐿𝐿𝐿𝑖𝑖)]) is the LTL Entropy Information for each analyzed spatial unit (e.g. municipality) and finally LTLi is the probability (proportion) to find LTL in the analyzed spatial unit (i) (e.g. municipality) within the metropolitan area.
: this indicator ranges from 0 to ∞ and it measures how the total flows interaction is distributed among nodes. Values close to 0 means that almost trips are toward a single node, hence the region should be strongly monocentric. Conversely, high values indicate strong entropy of flows, hence a strong interaction among nodes, which is compatible which a polycentric urban structure. However, this very general indicator may not strictly describe the degree of polycentricity in terms of employment, but also the dispersion of activities over the territory, which would even describe features of urban sprawl. For that reason, it is
OLS gradients estimates models (equations 7, 8, 9)
1991 (7)
1996 (7)
2001 (7)
1991 (8)
1996 (8)
2001 (8)
1991 (9)
1996 (9)
2001 (9)
Ln Do (constant) 9,674*** 10,471*** 10,297*** 9,718*** 10,587*** 10,340*** 9,894*** 10,639*** 10,400***
(t-value) (15,997) (17,823) (18,246) (16,278) (17,919) (18,470) (16,738) (18,500) (18,563)
β (dist. nearest subcentre) 1,504*** 1,389*** 1,155***
(t-value) (3,557) (4,375) (3,205)
β (dist. nearest large subcentre) 1,604*** 1,232*** 1,138***
(t-value) (3,818) (3,911) (3,243)
β (dist. nearest emerg. subcentre) 1,522*** 1,393*** 1,012***
(t-value) (3,735) (4,581) (2,997)
α (distance to Barcelona - CBD) -0,033*** -0,039*** -0,036*** -0,032*** -0,039*** -0,036*** -0,036*** -0,041*** -0,037***
(t-value) (-6,455) (-7,693) (-6,690) (-6,090) (-7,536) (-6,809) (-7,051) (-8,190) (-7,120)
µ (time residence-to-work) -0,036* -0,065*** -0,066*** -0,039** -0,067*** -0,067*** -0,039** -0,068*** -0,066***
(t-value) (-1,792) (-3,189) (-3,118) (-1,986) (-3,253) (-3,149) (-1,942) (-3,383) (-3,096)
Adjusted R2 0,285 0,398 0,362 0,293 0,384 0,363 0,291 0,404 0,357
F 21,460 33,922 29,104 22,303 32,030 29,226 22,027 34,834 28,472
F (sig) 0 0 0 0 0 0 0 0 0
***, **, * variables significant at 99 per cent, 95 per cent and 90 per cent respectively

RSA European Conference 2012: Networked regions and cities in times of fragmentation: Developing smart, sustainable and inclusive places. Delft, The Netherlands (13th – 16th May 2012)
30
also computed the % LTL Entropy Information and the % LTL in CBD (Barcelona), in subcentres and in the rest of the metropolitan region.
Table 11. Urban structure dynamics in Barcelona Metropolitan Region 1991-2001
Source: Own Elaboration
1991 1996 2001
LTL Entropy Index (Metropolitan Region) 2,80311 3,02504 3,11043
Mean 0,01730 0,01856 0,01897 Median 0,00667 0,00799 0,00793
Std.Desv. 0,03499 0,03582 0,03581 Population Entropy Index (Metropolitan Region) 3,06342 3,22943 3,33110
Mean 0,01891 0,01981 0,02031 Median 0,00707 0,00820 0,00902
Std.Desv. 0,03900 0,03857 0,03795 IF Entropy Index (Metropolitan Region) 3,20152 3,38897 3,50235
Mean 0,01976 0,02079 0,02136 Median 0,00687 0,00852 0,00888
Std.Desv. 0,03665 0,03704 0,03673 OF Entropy Index (Metropolitan Region) 3,68177 3,85332 3,99287
Mean 0,02273 0,02364 0,02435 Median 0,00917 0,01073 0,01266
Std.Desv. 0,04040 0,03804 0,03623 IF Entropy Index - OF Entropy Index (difference) -0,48026 -0,46435 -0,49052Dominance Index 164 164 164
Mean 1 1 1 Median 0,16103 0,20847 0,22016
Std.Desv. 4,97575 4,42506 4,14021
BARCELONA (Municipality - CBD of the Metropolitan Region) METHOD TO IDENTIFY SUB-CENTRES: RW & IF Entropy Inf.
Dominance Index 62,44639 55,30324 51,78247 % Dominance Index 38,55% 33,93% 31,57%
LTL Entropy Information 0,35284 0,36283 0,36507 % LTL Entropy Information 12,59% 11,99% 11,74%
LTL in CBD 746.249 640.357 743.594 % LTL in CBD 47,80% 43,05% 41,43%
Population in CBD 1.643.542 1.508.805 1.505.325 % Population in CBD 38,54% 35,69% 34,29%
Population Entropy Information 0,36747 0,36771 0,36701 % Population Entropy Information 12,00% 11,39% 11,02%
SUBCENTRES (within the Metropolitan Region) METHOD TO IDENTIFY SUB-CENTRES: RW & IF Entropy Inf.
Number of Subcentres 8 11 12
Dominance Index 26,79658 37,75792 44,59327 % Dominance Index 16,54% 23,16% 27,19%
LTL Entropy Information 0,71106 0,89531 0,99669 % LTL Entropy Information 25,37% 29,60% 32,04%
LTL in subcentres 312.918 363.217 482.885 % LTL in subcentres 20,04% 24,42% 26,90%
Population in subcentres 1.065.835 1.199.595 1.308.642 % Population in subcentres 24,99% 28,37% 29,81%
Population Entropy Information 0,81277 0,96558 1,04111 % Population Entropy Information 26,53% 29,90% 31,25%
REST OF THE METROPOLITAN REGION METHOD TO IDENTIFY SUB-CENTRES: RW & IF Entropy Inf.
Dominance Index 72,75703 69,93884 67,62426 % Dominance Index 44,91% 42,91% 41,23%
LTL Entropy Information 1,73920 1,76690 1,74867 % LTL Entropy Information 62,05% 58,41% 56,22%
LTL beyond nuclei 502.151 483.924 568.307 % LTL beyond nuclei 32,16% 32,53% 31,66%
Population beyond nuclei 1.555.045 1.519.648 1.576.446 % Population beyond nuclei 36,47% 35,94% 35,91%
Population Entropy Information 1,88318 1,89614 1,92299 % Population Entropy Information 61,47% 58,71% 57,73%
Urban Structure (Barcelona Metropolitan Region)

RSA European Conference 2012: Networked regions and cities in times of fragmentation: Developing smart, sustainable and inclusive places. Delft, The Netherlands (13th – 16th May 2012)
31
2. Population Entropy Index26
3. IF (in-commuting flows) Entropy Index and the OF (out-commuting flows) Entropy Index
: this indicator it also ranges from 0 to ∞ and it measures how the population is distributed among nodes. For the same reason, that the previous indicator, it is calculated the % Population Entropy Information and the % Population in CBD (Barcelona), in subcentres (identified by using the proposed methodology in this work), and in the rest of the metropolitan region.
27
4. Dominance Index (DI): as it has explained in the previous section 4.1.
: these indicators measure the relation between the labour and residential market. The IF Entropy Index considers the capacity of a node (IF Entropy Information) to be hierarchical in terms of being an important node in terms of employment and on the contrary, as the OF Entropy Index considers the workers that are leaving their residence to work in other places, a higher value of OF Entropy Index entails that this node (OF Entropy Information) would be significant in terms of being a residence node. Thus, as the labour market tends to be more concentrated than the residential one (more dispersed), the OF Entropy Index tends to have a higher value of Entropy Index. Therefore the higher is the difference between these two indexes the higher is the separation between the residential and labour markets.
The previous Table 11 confirms what we have observed previously (Tables 9 and 10) by analyzing the density gradients and the significance levels of the identified subcentres: a more polycentric structure in 2001 but in which this urban dynamic towards polycentrism has been more accentuated from 1991 to 1996 than 1996 to 2001. The increment of Employment (LTL) Entropy Index (2,80311 to 3,11043) and Population Entropy Index (3,06342 to 3,33110) from 1991 to 2001 (Table 11) combined with the increment of % Population, % LTL, and Dominance Index (DI) in the identified subcentres as well as the reduction of these indicators in the CBD (Barcelona) and in the rest of the metropolitan area leads to a more polycentric structure in terms of employment and population. However, in terms of population is where exists a quite difference in comparison with the results that this study has found before (Table 10): meanwhile by analyzing the population density gradients and the significance levels of the identified subcentres the results lead to a more dispersed are from 1996 to 2001, by analyzing the share of population and the share of population Entropy Information in CBD, subcentres and the rest of the metropolitan in the same time period the results entail a reverse conclusion. This it could explain due to from 1996 to 2001 the areas (municipalities) that are nearby of the identified subcentres has been increased more proportionally their population and consequently the population density gradients of the identified subcentres have decreased.
6. CONCLUSIONS In this work an integrated methodology has been proposed for the identification and characterization of intrametropolitan subcentres. Different from other methodologies that are mainly based on morphological measures (e.g. employment density), the proposed method focuses on the hierarchical functional interactions among nodes and on the different origin of the subcentre formation. Thus, this methodology is suitable with the hierarchic and complex
26 The Population Entropy Index is formulated as follows: 𝐸𝐸𝐼𝐼𝑃𝑃𝑃𝑃𝑃𝑃 = −∑ (𝑃𝑃𝑃𝑃𝑃𝑃𝑖𝑖 · [𝐿𝐿𝐿𝐿 (𝑃𝑃𝑃𝑃𝑃𝑃𝑖𝑖)])𝐿𝐿
𝑖𝑖=1 the interpretation of the expression is the same as the Employment (LTL) Entropy Index. 27 The IF and OF Entropy Index are calculated as follows: 𝐸𝐸𝐼𝐼𝐼𝐼𝐼𝐼−𝐼𝐼𝐿𝐿𝑃𝑃𝑅𝑅𝐹𝐹 = −∑ (𝐼𝐼𝐼𝐼𝑖𝑖 · [𝐿𝐿𝐿𝐿 (𝐼𝐼𝐼𝐼𝑖𝑖)])𝐿𝐿
𝑖𝑖=1 and 𝐸𝐸𝐼𝐼𝑃𝑃𝑂𝑂𝐿𝐿−𝐼𝐼𝐿𝐿𝑃𝑃𝑅𝑅𝐹𝐹 = −∑ (𝑃𝑃𝐼𝐼𝑖𝑖 · [𝐿𝐿𝐿𝐿 (𝑃𝑃𝐼𝐼𝑖𝑖)])𝐿𝐿
𝑖𝑖=1 the interpretation is the same as the other Entropy expressions.

RSA European Conference 2012: Networked regions and cities in times of fragmentation: Developing smart, sustainable and inclusive places. Delft, The Netherlands (13th – 16th May 2012)
32
European urban systems where centres have been emerged mostly as a result of an integration or coalescence process as well as suitable with the decentralisation process from a single and congested Central Business District (CBD). Consequently, the proposed methodology identifies subcentres that are “places to work” (employment subcentres) and subcentres that are “places to work and live” (urban subcentres). That means according to the proposed methodology, distinguish those sub-centres that only attract workers (in-commuting flows) or retain their resident workers (significant local labour market) to those sub-centres that are able to attract flows and retain their resident employed population at the same time. The results suggest that in comparison with identifying sub-centres by using the mainly Employment density methodologies, the municipalities identified as sub-centres by using “this double” Employment Entropy Information functions are more dominant in terms of in-commuting flows, more self-contained, and its influence on the urban structure are more significant, entailing a more polynucleated metropolitan structure. This conclusion, could lead us to ask if the Employment density-based methodologies to identify subcentres are enough efficient for achieve their goal and if the Employment Entropy that synthesizes the urban hierarchy and complexity of the urban systems has emerged as the best methodology to identify urban subcentres. So, does employment density death to identify urban subcentres?
7. APPENDIX Figure 8. Subcentres and changes of transportation infrastructure from 1991 to 2001 in
the Barcelona Metropolitan Region
Note: in grey, highways and freeways in 1991; in dark, highways and freeways in 1996 and in red, highways and freeways by 2026 according to the Territorial Plan of Barcelona Metropolitan Region. Referring with the subcentres identified in 2001: in grey, the subcentres and CBD (Barcelona) in 1991, in dark the subcentres that appeared in 1996 and in blue, the last two new subcentres identified in 2001.
Source: Own Elaboration

RSA European Conference 2012: Networked regions and cities in times of fragmentation: Developing smart, sustainable and inclusive places. Delft, The Netherlands (13th – 16th May 2012)
33
REFERENCES ALONSO, W. (1964). Location and Land Use: Towards a general history of land rent
. Cambridge, Mass. Harvard University Press.
ALPEROVICH, G. (1983). Determinants of Urban Population Density Functions: A procedure for Efficent Estimates
. Regional Science and Urban Economics 13, pg. 287-295.
ANAS, A.; KIM, I. (1996). General Equilibrium Models of Polycentric Urban Land Use with Endogenous Congestion and Job Agglomeration
. Journal of Urban Economics 40, pp.232-256.
ANAS, A.; ARNOTT, R.; SMALL, K. (1998). Urban Spatial Structure
. Journal of Economic Literature, Vol.36, No.3, pp.1426-1464.
ANAS, A.; ARNOTT, R.; SMALL, K. (2000). The Panexponential Monocentric Model
. Journal of Urban Economics 47, pp.165-179
ANDERSON, N.; BOGART, W (2001). The structure of sprawl. Identifying and Characterizing Employment Centers in Polycentric Metropolitan Areas
. American Journal of Economics and Sociology, Vol. 60, No.1.
ASENSIO, J. (2000). Cambios en la Forma Urbana y Demanda de Transporte
. Tesis doctoral, Departament d’Economia Aplicada, Universitat Autonòma de Barcelona.
ATM (1998). Diagnosi del sistema I Directrius del Pla Director d’Infraestructures
. Barcelona.
BATTEN, D. (1995). Network cities: Creative Urban Agglomerations for the 21th Century
, Urban Studies, 32, pp. 313-327.
BAUMONT, C.; LE GALLO, J. (2003). Spatial Analysis of Employment and Population Density: The Case of the Agglomeration of Dijon, 1999
. Discussion Papers, REAL 03-T-6.
BERLIANT, M.; PENG, S-H.; WANG, P. (2002). Production Externalities and Urban Configuration
. Journal of Economic Theory 104, 275-303.
BERLIANT, M.; WANG, P. (2008). Urban growth and subcenter formation: A trolley ride from the Staples Center to Disneyland and the Rose Bowl
. Journal of Urban Economics 63, pp.679-693
BOGART, W.T.; FERRY, W.C. (1999). Employment Centers in Greater Cleveland: Evidence of Evolution in a Formerly Monocentric City
. Urban Studies, Vol. 36, No.12, 2099-2110.
BOURNE, L.S. (1989). Are New Urban Forms Emerging?. Empirical Tests for Canadian Urban Areas
, The Canadian Geographer 33, pp.312-327.
BURNS, M.; MOIX. M.; ROCA, J. (2001). Contrasting Indications of Polycentrism within Spain’s Metropolitan Urban Regions
. Paper for the Eight European Estate Society Conference, Alicante, June 26-29
CAMAGNI, R. (1993). Le Retti di Città in Lombardia. Introduzzione e Sintesi della Recerca
, in CAMAGNI, R. and G. DE BLASIO (Eds.), Le Reti de Città: Teoria, Politiche e Analisi nell’Area Padana Milan, Franco Angeli.
CAMAGNI, R. (1994). From City Hierarchy to City Network: Reflections about An Emerging Paradigm
, in CUADRADO-ROURA, J.R., P.NIJKAMP and P.SALVA (Eds.), Moving Frontiers, Economic Restructuring, Regional Development and Emerging Networks. Avebury.
CAMAGNI, R., SALONE, C. (1993). Network Urban Structures in Northern Italy: Elements for a Theoretical Framework
, Urban Studies, 30, pp. 1053-1064.
CERVERO, R.; WU, K-L. (1997). Polycentrism, commuting, and residential location in the San Francisco Bay Area
. Environment and Planning A. Volume 29(5), pages 865-886.

RSA European Conference 2012: Networked regions and cities in times of fragmentation: Developing smart, sustainable and inclusive places. Delft, The Netherlands (13th – 16th May 2012)
34
CERVERO, R., WU, K.L. (1998). Sub-centring and Commuting: Evidence from the San Francisco Bay Area, 1980-90
. Urban Studies, Vol.35, No.7, pp.1059-1076.
CHAMPION, A.G. (2001). A Changing Demopraphic Regime and Evolving Polycentric Urban Regions: Consequences for the Size, Composition and Distribution of City Populations
. Urban Studies, Vol.38, No.4, pp.657-677
CHRISTALLER, W. (1933). Die zentralen Orte in Suddeutschland
, Jena: Gustav Fisher Verlag.
CLARK, W.A.V.; KUIJPERS-LINDE, M. (1994). Commuting on Restructuring Urban Regions
. Urban Studies, Vol.31, No.3, 465-483.
COFFEY, W.J.; SHEARMUR, R.G. (2002). Agglomeration and Dispersion of High-order Service Employment in the Montreal Metropolitan Region, 1981-96
. Urban Studies, Vol. 39, No.3, pp.359-372.
COMMITTEE ON SPATIAL DEVELOPMENT - CSD (1999). European Spatial Development Perspective: Towards Balanced and Sustainable Development of the Territory of the EU
. Final Discussion at the Meeting of Ministers responsible for Regional/Spatial Planning of the European Union, Postdam, 10/11 May 1999
CRAIG, G.S.; NG, P.T. (2001). Using Quantile Smoothing Splines to Identify Employment Subcentres in a Multicentric Urban Area
. Journal of Urban Economics 49, 100-120.
DEMMATTEIS, G. (1990). Modelli Urbani a Rete. Considerazioni Preliminari
, in CURTI, F, and L. DIAPPI (Eds.), Gerarchie e Reti di Città: Tendenze e Politiche. Milan, Franco Angeli.
DEMMATTEIS, G. (1991a). Sistema Locali Nucleari e Sistemi a Rete. Un Contributo Geografico all’Interpretazione delle Dinamiche Urbane
, in Bertuglia, C.S. and A. LA BELLA (Eds.), Sistema Urbani, Franco Angeli.
DEMATTEIS, G. (1991b). Il Sistema Urbano
, in FUA, G. (Ed.), Orientamenti per la politica del territorio. Milan Franco, Angeli.
DERUDDER, B.; TAYLOR, P.J.; WITLOX, F.; CATALANO, G. (2003). Hierarchical Tendencies and Regional Patterns in the World City Network: A Global Urban Analysis of 234 Cities
. GaWC Research Bulletin 88. Published in Regional Studies, 37 (9), pp.875-886.
DIELEMAN, F.M.; FALUDI, A. (1998). Polynucleated Metropolitan Regions in Northwest Europe
, European Planning Studies, 6, pp.365-377.
ERICKSON, R.A.; GENTRY, M. (1985). Suburban Nucleations. Geographical Review
, Vol.75, No.1, pp.19-31
EMMANUEL, C.; DEMATTEIS, G. (1990). Reti Urbane Minori e Desconcentrazione Metropolitane nella Padania Centro-Occidentale
, in MARTELLATO, D. and F. SFORZI (Eds.), Studi sui Sistema Urbani. Milan, Franco Angeli.
FUJITA, M.; OGAWA, H. (1982). Multiple equilibria and structural transition of non-monocentric urban configurations
. Regional Science and Urban Economics 12, pp.161-196
FUJITA, M.; MORI, T. (2005). Frontiers of the New Economic Geography
. RSAI, published by Blackwell Publishing.
GARCÍA-LÓPEZ, Miquel-Àngel; MUÑIZ, Ivan. (2005). Employment descentralization: polycentric compaction or sprawl?. The case of the Barcelona Metropolitan Region 1986-1996
. Document de Treball 05.11. Departament Economia Aplicada. UAB.
GARCÍA-LÓPEZ, M.A.; MUÑIZ. (2007). ¿Policentrismo o dispersión?. Una aproximación desde la nueva economía urbana
. Investigaciones Regionales. 11, pg.25-43.
GARCÍA-LÓPEZ, Miquel-Àngel; MUÑIZ, Ivan. (2010a). Employment Decentralisation: Polycentricity or Scatteration? The Case of Barcelona. Urban Studies 47 (14) 3045-3056.

RSA European Conference 2012: Networked regions and cities in times of fragmentation: Developing smart, sustainable and inclusive places. Delft, The Netherlands (13th – 16th May 2012)
35
GARCÍA-LÓPEZ, Miquel-Àngel. (2010b). Population suburbanization in Barcelona, 1991-2005: Is its Spatial structure changing?
. Journal of Housing Economics 19 (2010) 119-132.
GIULIANO, G.; SMALL, K. (1991). Subcentres in the Los Angeles region
. Regional Science and Urban Economics 21. 163-182.
GIULIANO, G.; SMALL, K. (1993). Is the Journey to Work explained by Urban Structure?
. Urban Studies, Vol.30, No.9; pp.1485-1500.
GIULIANO, G.; SMALL, K. (1999). The determinants of growth of employment subcenters
. Journal of Transport Geography, 7, pp.189-201
GORDON, P.; RICHARDSON, H.W.; WONG, H.L. (1986). The Distribution of Population and Employment in a Polycentric City: The Case of Los Angeles
. Environment and Planning A, 18, pp.161-173.
GORDON, P.; RICHARDSON, H.W. (1996). Beyond Polycentricity: The Dispersed Metropolis, Los Angeles, 1970-1990
. Journal of the American Planning Association, Vol.62, No.3, pp.289-295.
GREEN, D (1980). Recent Trends in urban spatial structure
. Growth and Change, 10, pp.29-40.
GREEN, N. (2007). Functional Polycentricity: A formal Definition in Terms of Social Network Analysis
. Urban Studies, Vol. 44, No. 11, pp.2077-2103
GRIFFITH, D.A. (1981a). Evaluating the transformation from a monocentric to a polycentric city
. Professional Geographer, 33 (2), pp.189-196
GRIFFITH, D.A. (1981b). Modelling Urban Population Density in a Multi-Centered City
. Journal of Urban Economics 9, pp.298-310
GUILLAIN, R.; LE GALLO, J.; BOITEUX-ORAIN, C. (2004). The Evolution of the Spatial and Sectoral Patterns in Ille-De-France over 1978-1997
, LEG Working Paper Economie 2004/02
HEIKKILA, E., GORDON, P.; KIM, J., PEISER, R., RICHARDSON, H, DALE-JOHNSON,D. (1989). What Happened to the CBD-distance gradient?. Land Values in a polycentric city
. Environment and Planning A, 21, pp. 221-232.
HENDERSON, J.V.; SLADE, E. (1993). Development Games in Non-Monotonic Cities
. Journal of Urban Economics, 34, pp.207-229.
HOHENBERG, P.M.; LEES, L.H. (1995). The Making of Urban Europe 1000-1994
. Harvard University Press, Cambridge, Massachusetts, and London, England.
HOHENBERG, P.M. (2004). The Historical geography of European Cities: An interpretive essay
. Rensselaer Polytechnic Institute (Emeritus). Handbook of Regional and Urban Economics. Volume 4, 2004. Pages 3021-3052
LAMBREGTS, B. (2009). The Polycentric Metropolis Unpacked. Concepts, Trends and Policy in the Randstad Holland
. Academisch Proefschrift, Universiteit van Amsterdam. ISBN:978-90-7524-698-8
LAMBOOY, J.G. (1998). Polynucleation and Economic Development: The Randstad
. European Planning Studies, 6:4, pp.457-466
LÖSCH, A. (1940). Die Räumliche Ordung der Wirstchaft
, Jena: Gustav Fischer.
LESLIE, T.F. (2010). Identification and Differentiation of Urban Centers in Phoenix Through a Multi-Criteria Kernel-Density Approach
. International Regional Science Review 33(2), pp.205-235.
LIMTANAKOOL, N.; DIJST, M.; SCHWANEN, T. (2007). A theoretical framework and methodology for characterizing national urban systems on the basis of flows of people: empirical evidence for France and Germany. Urban Studies, Vol.44, No.11, pp.2123-2145

RSA European Conference 2012: Networked regions and cities in times of fragmentation: Developing smart, sustainable and inclusive places. Delft, The Netherlands (13th – 16th May 2012)
36
LIMTANAKOOL, N.; DIJST, M.; SCHWANEN, T. (2009). Developments in the Dutch urban system on the basis of flows
. Regional Studies, Vol.43, Issue 2, pp. 179-196
MARTORI, J.C.; SURIÑACH, J. (2002). Urban Population Density Functions: The Case of the Barcelona Region
. Documents de Recerca. Universitat de Vic.
MASIP TRESSERRA, J. (2011a). Growth of the metropolitan limits and its influence on the urban structure. A retrospective analysis (1991-2001) for the Barcelona Metropolitan Region. 58th
Annual North American Meetings of the Regional Science Association International (NARSC-RSAI). Miami, 9-12 November 2011. In: E-Prints UPC – UPCommons, Polytechnic University of Catalonia.
MASIP TRESSERRA, J. (2011b). Polycentrism and emerging sub-centres in the restructuring of metropolitan systems. The case of Barcelona Metropolitan Region (RMB). 24th
European Regional Science Association International (ERSA) Summer School. Luxembourg, 4-13 July 2011. In: E-Prints UPC –UPCommons, Polytechnic University of Catalonia.
MASIP TRESSERRA, J. (2011c). Polycentrism and emerging sub-centres in the restructuring of metropolitan systems. The case of Barcelona Metropolitan Region (RMB). 58th
Annual North American Meetings of the Regional Science Association International (NARSC-RSAI).Miami, 9-12 November 2011. In: E-Prints UPC –UPCommons, Polytechnic University of Catalonia.
MASIP, J.; ROCA, J. (2012-forthcoming). Anàlisi retrospectiu del sistema metropolità de Barcelona i la seva influència en l’estructura urbana
. ACE: Architecture, City and Environment. ISSN 1886-4805
MCDONALD, John F. (1987). The identification of Urban Employment Subcentres
. Journal of Urban Economics 21, 242-258.
MCDONALD, John, F.; MCMILLEN, Daniel P. (1990). Employment Subcenters and Land Values in a Polycentric Urban Area: the Case of Chicago
. Environment and Planning A, 22, pp.1561-1574.
MCDONALD, John F.; PRATHER, Paul J. (1994). Suburban Employment Centres: The Case of Chicago
. Urban Studies, Vol. 31, No. 2; 1994 201-218.
MCMILLEN, Daniel P. (1996). One hundred Fifty Years of Land Values in Chicago: A Nonparametric Approach
. Journal of Urban Economics 40, 100-124, Article No.0025.
MCMILLEN, Daniel P.; MCDONALD, John F. (1997). A Nonparametric Analysis of Employment Density in a polycentric city. Journal of Regional Science
, Vol. 37.; No.4, 1997, pp. 591-612.
MCMILLEN, Daniel P.; MCDONALD, John F. (1998a). Population Density in Suburban Chicago: A bid-rent approach
. Urban Studies, Vol. 35, No.7; 1119-1130.
MCMILLEN, Daniel P.; MCDONALD, John F. (1998b). Suburban Subcentres and Employment Density in Metropolitan Chicago
. Journal of Urban Economics 43, 157-180.
MCMILLEN, Daniel P. (2001a). Polycentric urban structure: The case of Milwaukee
. Federal Reserve Bank of Chicago.
MCMILLEN, Daniel P. (2001b). Nonparametric Employment Subcenter Identification
. Journal of Urban Economics 50, 448-473.
MCMILLEN, Daniel P. (2003a). Identifying Sub-centres Using Contiguity Matrices
. Urban Studies, Vol. 40. No.1, 57-69.
MCMILLEN, Daniel P. (2003b). Employment subcentres in Chicago: Past, present, and future
. 2Q/2003. Economic Perspectives.

RSA European Conference 2012: Networked regions and cities in times of fragmentation: Developing smart, sustainable and inclusive places. Delft, The Netherlands (13th – 16th May 2012)
37
MCMILLEN, Daniel P.; SMITH, Stefani C. (2003). The number of subcentres in large urban areas
. Journal of Urban Economics 53 (2003) 321-338.
MCMILLEN, Daniel P.; LESTER, William T. (2003). Evolving subcentres: employment and population densities in Chicago, 1970-2020
. Journal of Housing Economics 12, 60-81
MCMILLEN, Daniel P. (2004). Employment Densities, Spatial Autocorrelation, and Subcentres in Large Metropolitan Areas
. Journal of Regional Science, Vol. 44, No.2, 2004, pp. 225-243.
MEIJERS, Evert. (2006). From central place to network model: theory and evidence of a paradigm change
. Tijdschrift voor Economische en Sociale Geografie. Vol. 98, No.2, pp. 245-259.
MEIJERS, E. (2007). Synergy in Polycentric Urban Regions: Complementarity, organizing capacity and critical mass
. Thesis Delft University of Technology. Sustainable Urban Areas. IOS Press.
MEIJERS, E.. (2008). Stein’s ‘Regional City’ concept revisited. Critical mass and Complementarity in contemporary urban networks
. Tijdschrift voor Economische en Sociale Geografie, 79(5).
MILLS, E.S. (1972). Studies in the Spatial Structure of the Urban Economy
, Baltimore, MD: Johns Hopkins, University Press
MUÑIZ, Ivan; GALINDO, Anna; GARCÍA-LÓPEZ, Miquel-Àngel (2003a). Cubic Spline Population Density Functions and satellite city delimitation: the case of Barcelona
. Urban Studies, Vol.40, No.7, 1303-1321.
MUÑIZ, Ivan; GALINDO, Anna; GARCÍA-LÓPEZ, Miquel-Àngel (2003b). ¿Es Barcelona una ciudad policéntrica?.
Document de Treball 03.09. Universitat Autònoma de Barcelona.
MUÑIZ, Ivan; GALINDO, Anna; GARCÍA-LÓPEZ, Miquel-Àngel (2005). Decentralisation, Integration and Polycentrism in Barcelona
. Document de Treball 05.12. Universitat Autònoma de Barcelona.
MUÑIZ, Ivan; GARCÍA-LÓPEZ, Miquel-Àngel; GALINDO, Anna (2008). The effect of Employment sub-centres on Population Density in Barcelona
. Urban Studies 45(3) 627-649.
MUTH, R. F. (1969). Cities and housing
, Chicago, Chicago University Press.
READFEARN, C.L. (2007). The topography of metropolitan employment: Identifying centers of employment in a polycentric urban area
. Journal of Urban Economics, 61, pp.519-541.
RIGUELLE, F.; THOMAS, I.; VERHETSEL, A. (2007). Measuring urban polycentrism: A European case study and its implications
. Journal of Economic Geography 7, pp.193-215.
ROCA, J.; MOIX, M. (2005). The interaction value: its scope and Limits as an Instrument for Delimiting Urban Systems
. Regional Studies, Vol.39, pp.357-373.
ROCA, J.; MARMOLEJO, C.; MOIX, M. (2009). Urban Structure and Polycentrism: Towards a Redefinition of the Subcentre Concept
. Urban Studies, 46(13), 2841-2868.
ROCA, J.; ARELLANO, B.; MOIX, M. (2011). Estructura Urbana, Policentrismo y Sprawl. Los ejemplos de Madrid y Barcelona
. Ciudad y Territorio, Estudios Territoriales. Vol.XLIII, núm.168, p.299-321
SHEARMUR, R.; COFFEY, W.J. (2002). A tale of four cities: intrametropolitan employment distribution in Toronto, Montreal, Vancouver and Ottawa-Hull, 1981-1996
. Environment and Planning A, vol. 34, pp.557.598.
SMALL, K.A.; SONG, S. (1994). Population and Employment Densities: Structure and Change
. Journal of Urban Economics 36, pp.292-313.
SONG, S. (1994). Modelling Worker Residence Distribution in the Los Angeles Region
. Urban Studies, Vol.31, No.9, 1533-1544.

RSA European Conference 2012: Networked regions and cities in times of fragmentation: Developing smart, sustainable and inclusive places. Delft, The Netherlands (13th – 16th May 2012)
38
SULLIVAN, A.M. (1986). A General Equilibrium Model with Agglomerative Economies and Decentralized Employment
. Journal of Urban Economics 20, pp.55-74
TABUCHI, T. (2009). Self-organizing marketplaces
. Journal of Urban Economics 66, pp.179-185
WIEAND, K.F. (1987). An extension of the Monocentric Urban Spatial Equilibrium Model to a Multicenter Setting: The Case of the Two-Center City
. Journal of Urban Economics, 21, pp.259-271
WHITE, M.J. (1990). Commuting and Congestion: A Simulation Model of a Decentralized Metropolitan Area
, Journal of the American Real State and Urban Economics Association, 18, pp.335-368.
VENERI, P. (2010). The identification of Sub-centres in two Italian Metropolitan Areas: A Functional Approach. Quaderno di Recerca nº343. Università Politecnica delle Marche. Dipartimento di Economia.