“The Value of Pavement Preservation From the County ... - P… · “The Value of Pavement...
30
“The Value of Pavement Preservation From the County Perspective” George A. Johnson Western Region Vice President National Association of County Engineers Director, Transportation and Land Management Agency County of Riverside, California
Transcript of “The Value of Pavement Preservation From the County ... - P… · “The Value of Pavement...

“The Value of Pavement Preservation From the County Perspective”
George A. Johnson Western Region Vice President
National Association of County Engineers Director, Transportation and Land Management Agency
County of Riverside, California

National Association of County Engineers (NACE)
“Local Roads Matter Campaign”
County Engineers Association of California (CEAC)
“Local Streets and Roads Needs Assessment”
Riverside County Experience


local roads matter! National Association of County Engineers

USDOT Bureau of Transportation Statistics Condition of U.S. Roadways by Functional System

local roads matter! National Association of County Engineers
The fatality rate on local roads is twice that on the interstate system. Inadequate traffic controls and signals, poor pavement conditions and problems with geometry and alignment all contribute to an unacceptable safety record that requires national attention and investment.

local roads matter! National Association of County Engineers
Over 56% of fatal crashes (23,260 in 2007) occur on rural roadways
NACE supports a “Toward Zero Fatalities” policy goal that seeks a 50% reduction in fatalities and serious injuries during the next authorization period
Improving the Highway Safety Improvement Program (HSIP) and dedicating increased HSIP funding to local road safety improvements
Continuing the High Risk Rural Road Program (HRRR) and increasing the authorization level to $1 billion
Streamlining FHWA project review and approval for local road safety improvements that do not involve capacity increases, acquisition of real estate, and are under $500,000 in value

The Congressionally chartered National Surface Transportation Policy and Revenue Study Commission estimates:
Need $240 billion annually for 10 years in Federal funding for highway, road and bridge infrastructure
Current spending is $68 billion annually
One-time stimulus American Recovery and Investment Act of $26.7 billion

NACE Legislative Reauthorization Positions:
Support an aggressive Safety Program for making local Roads Safer through a “Toward Zero Fatalities” policy goal
Implement Project Streamlining for Low Cost Safety Improvement Projects
Preserve and enhance the set aside for Federal Highway Bridge Replacement and Rehabilitation Program (HBRRP)
Support Congressional action for legislation to raise the federal gas tax in the next reauthorization an additional 10 cents to achieve a $73 billion program by 2015
Promote alternative funding, such as Tolls, Public-Private Partnerships and Vehicle Miles Traveled

NACE Emphasis on Pavement Preservation Nearly half of NACE affiliate state associations have already begun
communicating the importance of our nations roads
Needs Assessment Reports and Documents
Arizona California
Indiana Iowa
Michigan Minnesota
New Jersey New York
North Dakota Ohio
Oklahoma South Dakota
Washington
To learn more about the nationwide needs assessments, visit
“Local Roads Matter” on the NACE Website:
http:/www.countyengineers.org/LRM/index.htlm

Let’s act as if they do.
It is time to address all of our nation’s highway and bridge investment needs, from the commuter’s driveway to the interstate and home again
Create a strong partnership between federal, state and local governments
We can restore balance and proportionality in road funding through an effective and thoughtful surface transportation re-authorization

Objective: Report condition of local road system and quantify funding
Key Questions:
1. What are the existing pavement conditions? 2. How much will it cost to bring pavements to an acceptable level? 3. How much will it cost to maintain pavements at optimal conditions? 4. How much is the funding shortfall and what are the solutions? Breakdown of Maintained Centerline Miles by Agency

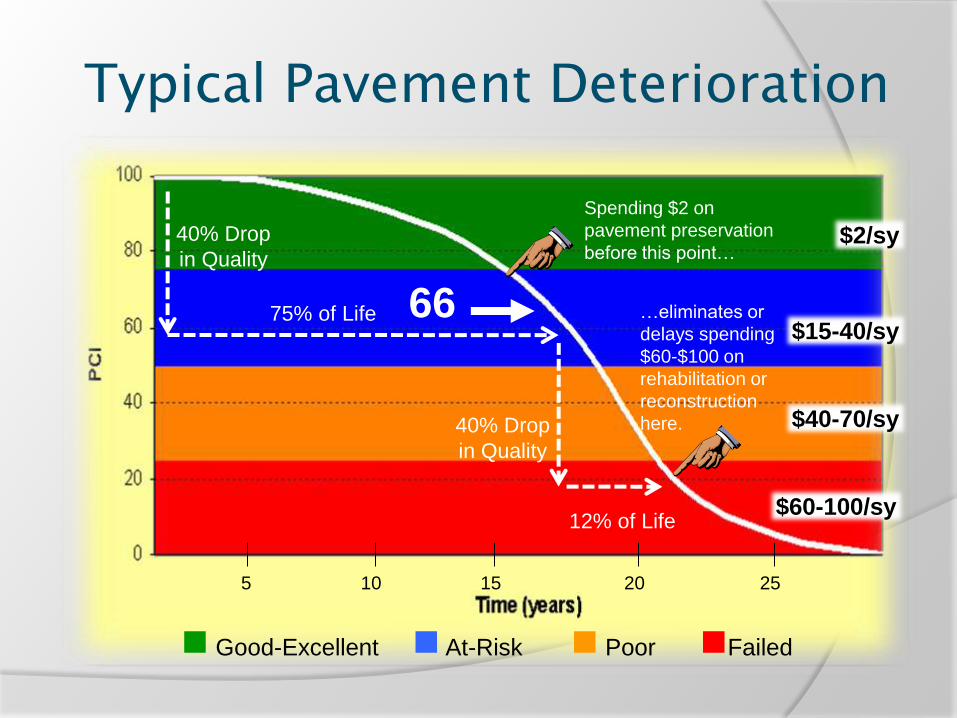
Typical Pavement Deterioration
66
$2/sy
$15-40/sy
$40-70/sy
$60-100/sy
75% of Life
40% Drop
in Quality
40% Drop
in Quality
12% of Life
Spending $2 on
pavement preservation
before this point…
…eliminates or
delays spending
$60-$100 on
rehabilitation or
reconstruction
here.
Good-Excellent At-Risk Poor Failed
5 10 15 20 25

Pavement Preservation – the sensible approach
Cost effective use of taxpayer money
Preserve and maintain roads in good condition
Deteriorated roads are more expensive to repair
Study costs developed to achieve good pavement condition or Best Management Practices (BMP)
Improve pavement to condition that only requires preventative maintenance, i.e., slurry seals, chip seals, thin overlays
More environmentally friendly than pavement rehabilitation or reconstruction
Least impact on public mobility and commerce

Total 10 Year Shortfall ($B)
Transportation Asset
10 Year Needs
Existing Funding
10 Year Shortfall
Pavements $ 70.5 $ 14.2 ($ 56.3)
Essential Components
$ 29.1 $ 6.8 ($ 22.6)
Total Shortfall $78.9
Equivalent to a 53 cent per gallon gas tax increase.

Riverside County has 7,300 square miles and is the 4th largest county in California
1990 Population
1.17 million
2000 Population
1.55 million
2010 Population
2.24 million
2035 Projection Population
3.60 million

Nationally 11th Largest County by Population
COUNTY STATE POP (M) COUNTY SEAT
1. LA CA 9.80 Los Angeles
2. Cook IL 5.20 Chicago
3. Harris TX 4.07 Houston
4. Maricopa AZ 4.02 Phoenix
5. San Diego CA 3.05 San Diego
6. Orange CA 3.02 Santa Ana
7. Kings NY 2.50 Brooklyn
8. Dallas TX 2.49 Dallas
9. Miami-Dade FL 2.48 Miami
10. Queens NY 2.30 Queens
11.RIVERSIDE CA 2.20 RIVERSIDE 12. San Bernardino CA 2.02 San Bernardino

How large is Riverside County?

Riverside County Transportation Priorities for 2600 Mile Road System
Improve Safety
Maintain Existing Road System
(Pavement Preservation)
Expand Road System to Accommodate Growth and Promote Economic Development

Federal and State Funds
1993 – Last Federal Fuel Tax Increase
1994 – Last State Gas Tax Increase
2002 – State Voters Approved Proposition 42
Dedicated Sales Tax to Transportation
2011 – State Approved Prop 42/Gas Tax Swap

Measure “A”
Original ½ cent sales tax measure – passed in 1988 – expired
June 2009.
Measure extended by the voters in November 2002 – 30 year
extension starting in 2009 through 2039.
Generate about $4.5 Billion over 30 years.

TUMF Program Basics
Western County TUMF (WRCOG) Established in 2003
Will generate about $5 Billion in transportation funding assessed to new development in Western Riverside County to fund roads, bridges, interchanges, transit
Improvements needed by 2035
Coachella Valley TUMF Established in 1989
Based on Priority Network
Projected to generate $600 – 700 Million
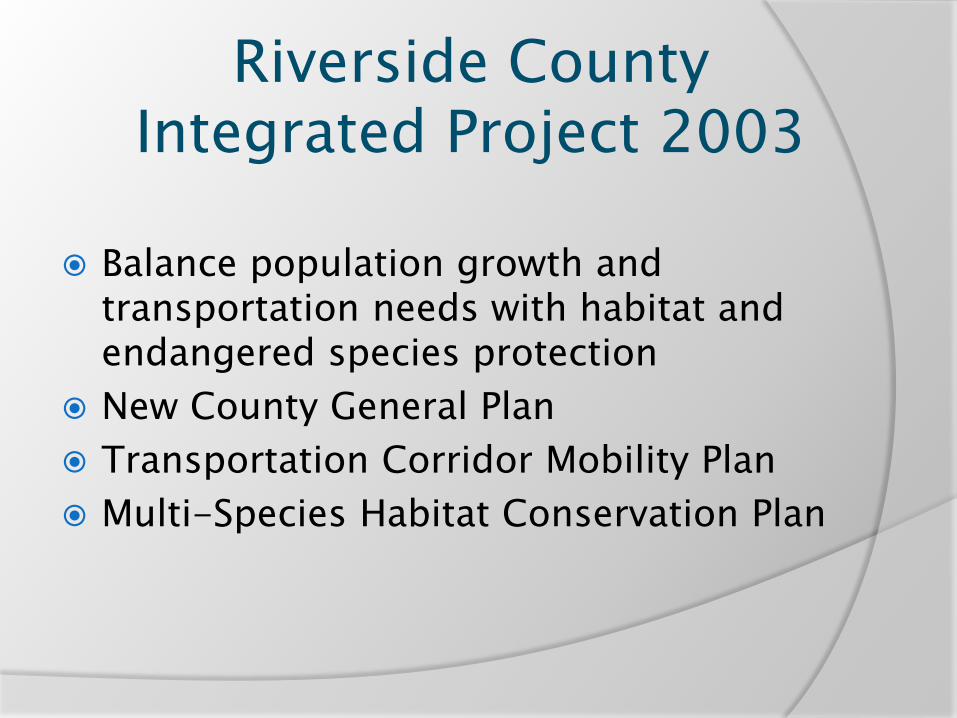
Riverside County Integrated Project 2003
Balance population growth and transportation needs with habitat and endangered species protection
New County General Plan
Transportation Corridor Mobility Plan
Multi-Species Habitat Conservation Plan

Riverside County 10-Year Transportation Improvement
Program Valued at $1.5 Billion
Create Jobs
Promote Economic Development
Improve County Road Safety
Maintain County Road System
Replace Deficient Bridges
Expand Major Arterials, Highways and Interchanges

95/96 96/97 97/98 98/99 99/00 00/01 01/02 02/03 03/04 04/05 05/06 06/07 07/08 08/09 09/10
67 66 69 70 70 70 70 70 71 71 70 70 70 71 72
Countywide
Riverside County Historical PCI (Pavement Condition Index)*

Collisions Per Road Mile
0.02 0.02 0.03 0.03 0.03 0.02 0.03 0.03 0.02 0.01
0.52 0.53 0.52
0.62 0.67 0.67
0.62 0.56
0.53
0.44
0.83
1.00 1.00 0.99
1.09 1.13 1.11
1.03
0.95
0.76
1.37
1.54 1.55
1.63
1.78 1.82
1.76
1.62
1.50
1.21
0.00
0.20
0.40
0.60
0.80
1.00
1.20
1.40
1.60
1.80
2.00
2000 2001 2002 2003 2004 2005 2006 2007 2008 2009
Co
llis
ion
s P
er
Mile o
f M
ain
tain
ed
Ro
ad
Fatal Collisions per Road Mile Injury Collisions per Road Mile
PDO Collisions per Road Mile Total Collisions per Road Mile

Road Miles Treated vs. PCI Trend
49 59
123
62 45 54 46
75
44 61
24
248
88
213
126 162
97
282
161
169
187
110
0
10
20
30
40
50
60
70
80
90
100
0
50
100
150
200
250
300
350
400
99/00 00/01 01/02 02/03 03/04 04/05 05/06 06/07 07/08 08/09 09/10
PA
VEM
EN
T C
ON
DIT
ION
IN
DEX
RO
AD
S T
REA
TED
(C
EN
TERLIN
E M
ILES)
FISCAL YEAR
Preservation
Rehabilitation
PCI
Preservation includes Chip Seal, Slurry Seal, and Cape Seal. Rehabilitation includes Overlays and Reconstruction.

Funding vs. PCI Trend
11.2
18.1
13.7
17.1
11.3
14.5
19.2
23.3
31.8
23.7
19.7
2.5
2.7
2.7
2.6
3.1
3.1
3.8
5.5
7.0
9.0
3.1
0
10
20
30
40
50
60
70
80
90
100
0
5
10
15
20
25
30
35
40
45
99/00 00/01 01/02 02/03 03/04 04/05 05/06 06/07 07/08 08/09 09/10
PA
VEM
EN
T C
ON
DIT
ION
IN
DEX
DO
LLA
RS (M
ILLIO
NS)
FISCAL YEAR
Preservation
Rehabilitation
PCI
Preservation includes Chip Seal, Slurry Seal, and Cape Seal. Rehabilitation includes Overlays and Reconstruction.

Action Plan -
Implement Pavement Preservation Strategy to Stretch Funding Dollars
Increase Transportation Funding
Create Strong Partners at Federal, State and Local Level
Get the Message Out to all levels of government: Increase Transportation Funding!
Thank you.