Chlitina Holding Limited 1 Chlitina Holding Limited Group Introduction.

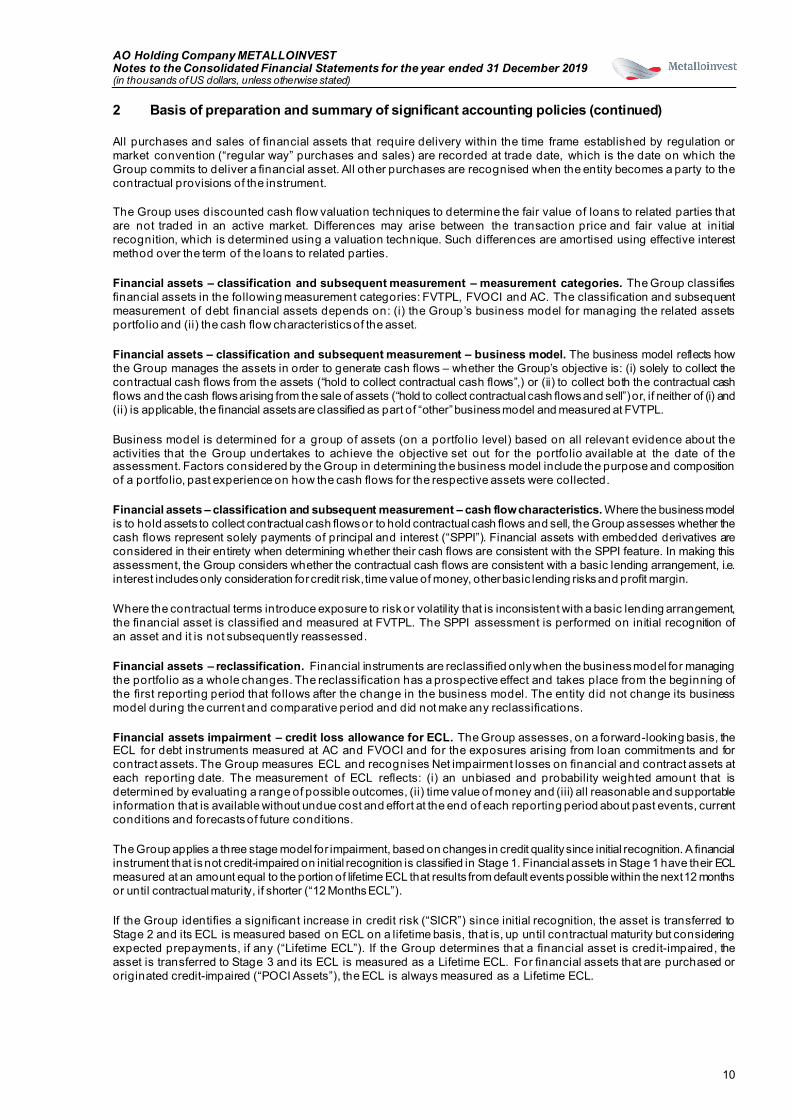
AO Holding Company METALLOINVEST
International Financial Reporting Standards Consolidated Financial Statements and Independent Auditor’s Report
31 December 2019

AO Holding Company METALLOINVEST Consolidated Financial Statements for the year ended 31 December 2019
Contents
INDEPENDENT AUDITOR’S REPORT CONSOLIDATED FINANCIAL STATEMENTS
Consolidated Statement of Financial Position......................................................................................................................1 Consolidated Statement of Profit or Loss and Other Comprehensive Income...................................................................2 Consolidated Statement of Cash Flows................................................................................................................................3 Consolidated Statement of Changes in Equity.....................................................................................................................4 Notes to the Consolidated Financial Statements 1 General information....................................................................................................................................................5 2 Basis of preparation and summary of significant accounting policies .....................................................................5 3 Critical accounting estimates and judgements .......................................................................................................15 4 Adoption of new or revised standards and interpretations.....................................................................................17 5 New accounting pronouncements ...........................................................................................................................18 6 Segment information ................................................................................................................................................18 7 Property, plant and equipment ................................................................................................................................21 8 Intangible assets and goodwill.................................................................................................................................22 9 Equity investments ...................................................................................................................................................24 10 Loans advanced .......................................................................................................................................................25 11 Other non-current assets .........................................................................................................................................26 12 Inventories ................................................................................................................................................................27 13 Trade and other receivables ....................................................................................................................................27 14 Cash and cash equivalents......................................................................................................................................28 15 Share capital and other reserves ............................................................................................................................29 16 Short-term and long-term borrowings .....................................................................................................................30 17 Income taxes ............................................................................................................................................................31 18 Liability to the regional administration .....................................................................................................................33 19 Employee benefit obligations...................................................................................................................................33 20 Accounts payable .....................................................................................................................................................35 21 Sales .........................................................................................................................................................................35 22 Cost of sales .............................................................................................................................................................35 23 Distribution expenses...............................................................................................................................................35 24 General and administrative expenses.....................................................................................................................36 25 Operating income/(expenses) – net ........................................................................................................................36 26 Finance income and costs .......................................................................................................................................36 27 Earnings per share ...................................................................................................................................................37 28 Balances and transactions with related parties ......................................................................................................37 29 Contingencies, commitments and operating risks..................................................................................................38 30 Financial risk management and fair value of financial instruments .......................................................................39 31 Events after the reporting date ................................................................................................................................44
AO PricewaterhouseCoopers Audit White Square Office Center 10 Butyrsky Val Moscow, Russian Federation, 125047 T: +7 (495) 967 6000, F:+7 (495) 967 6001, www.pwc.ru
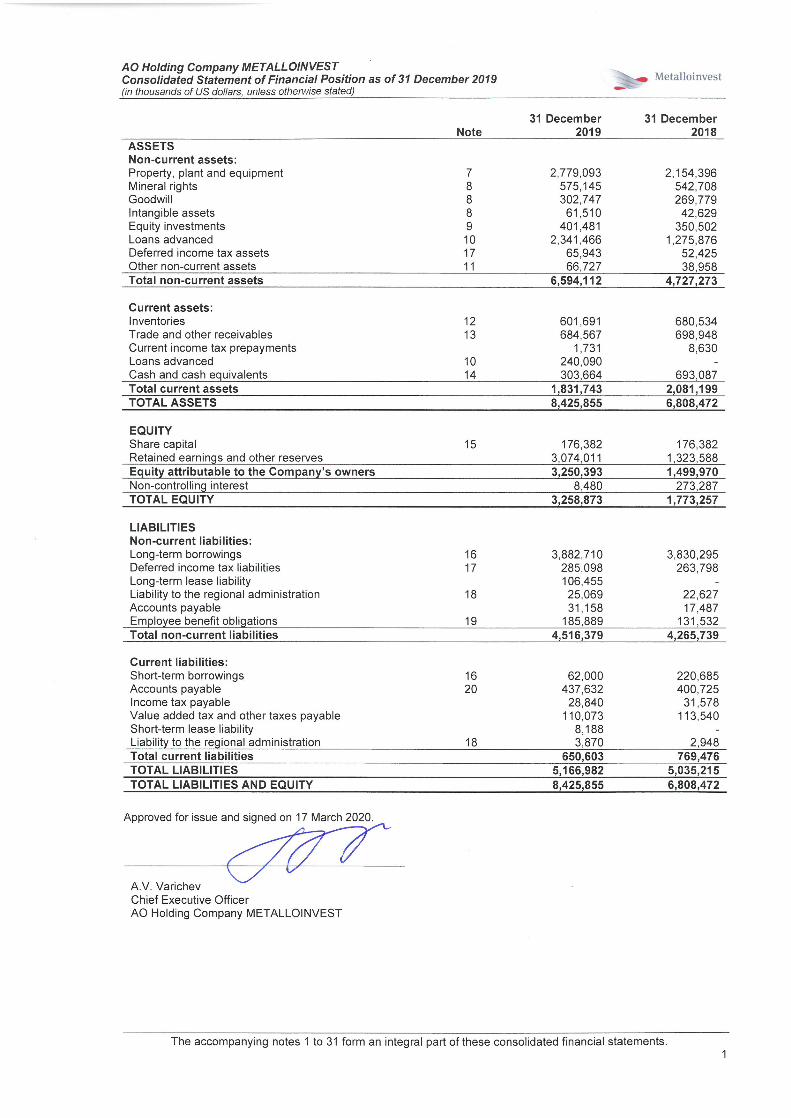
Independent Auditor’s Report To the Shareholders of AO Holding Company METALLOINVEST:
Our opinion In our opinion, the consolidated financial statements present fairly, in all material respects, the consolidated financial position of AO Holding Company METALLOINVEST (the “Company”) and its subsidiaries (together – the “Group”) as at 31 December 2019, and its consolidated financial performance and its consolidated cash flows for the year then ended in accordance with International Financial Reporting Standards (IFRS). What we have audited The Group’s consolidated financial statements comprise:
• the consolidated statement of financial position as of 31 December 2019; • the consolidated statement of profit or loss and other comprehensive income for the year then
ended;
• the consolidated statement of cash flows for the year then ended; and • the consolidated statement of changes in equity for the year then ended;
the notes to the consolidated financial statements, which include significant accounting policies and other explanatory information.
Basis for opinion We conducted our audit in accordance with International Standards on Auditing (ISAs). Our responsibilities under those standards are further described in the Auditor’s responsibilities for the audit of the consolidated financial statements section of our report. We believe that the audit evidence we have obtained is sufficient and appropriate to provide a basis for our opinion. Independence We are independent of the Group in accordance with the International Ethics Standards Board for Accountants’ Code of Ethics for Professional Accountants (IESBA Code) and the ethical requirements of the Auditor’s Professional Ethics Code and Auditor’s Independence Rules that are relevant to our audit of the consolidated financial statements in the Russian Federation. We have fulfilled our other ethical responsibilities in accordance with these requirements and the IESBA Code.

ii
Our audit approach Overview
Overall Group materiality: USD 80,000 thousand, which represents 5% of weighted average profit before tax.
• We conducted audit work at all significant reporting units in both the Russian Federation and abroad.
• Each significant reporting unit was audited by component teams based in the Russian Federation, Switzerland and Cyprus.
• Our audit scope addressed 96% of the Group’s revenues and 96% of the Group’s absolute value of underlying profit before tax.
Introduction of a new automated accounting system.
As part of designing our audit, we determined materiality and assessed the risks of material misstatement in the consolidated financial statements. In particular, we considered where management made subjective judgments; for example, in respect of significant accounting estimates that involved making assumptions and considering future events that are inherently uncertain. As in all of our audits, we also addressed the risk of management override of internal controls, including among other matters consideration of whether there was evidence of bias that represented a risk of material misstatement due to fraud. Materiality The scope of our audit was influenced by our application of materiality. An audit is designed to obtain reasonable assurance whether the consolidated financial statements are f ree from material misstatement. Misstatements may arise due to fraud or error. They are considered material if individually or in aggregate, they could reasonably be expected to influence the economic decisions of users taken on the basis of the consolidated financial statements. Based on our professional judgment, we determined certain quantitative thresholds for materiality, including the overall Group materiality for the consolidated financial statements as a whole as set out in the table below. These, together with qualitative considerations, helped us to determine the scope of our audit and the nature, timing and extent of our audit procedures and to evaluate the effect of misstatements, if any, both individually and in aggregate on the consolidated financial statements as a whole.
Overall Group materiality USD 80,000 thousand (2018: USD 62,000 thousand)
How we determined it 5% of five year weighted average profit before tax giving a higher weight to the current year and lower weight to the preceding years
Rationale for the materiality benchmark applied
We chose profit before tax as the benchmark because, in our view, it is the benchmark against which the performance of the Group is commonly measured by users, and is a generally accepted benchmark. Due to fluctuations of profit in different years, we considered it more appropriate to use a five-year weighted average as a benchmark. We chose 5% which is consistent with quantitative materiality thresholds used for profit-oriented companies in this sector. This is consistent with the basis for our materiality calculation in the previous year.
Materiality
Group scoping
Key audit matters

iii
How we tailored our Group audit scope Considering our ultimate responsibility for the opinion on the Group’s consolidated financial statements we are responsible for the direction, supervision and performance of the Group audit. In this context, we tailored the scope of our audit and determined the nature and extent of the audit procedures for components of the Group to ensure that we performed sufficient work to enable us to provide an opinion on the consolidated financial statements as a whole. Determining factors were the structure of the Group, the financial significance and/or risk profile of the Group entities and activities, the accounting processes and controls, and the industry in which the Group operates. On this basis, we selected Group entities for which an audit of financial information or specific balances was considered necessary. We also included tax, valuation and actuarial specialists in our group audit team. The group audit was focused on the significant components in the Russian Federation and abroad. These components include Group entities which are individually financially significant. Each of these components required an audit of their complete set of financial information. For components that are not individually financially significant, but that are important to achieve sufficient coverage on individual items, we performed an audit of a complete set of financial information or an audit of one or more account balances and disclosures. For the significant components in the Russian Federation, including the four main production plants based in Kursk, Belgorod and Orenburg regions, we performed the audit work ourselves. For the foreign components located in Switzerland and Cyprus, we used component auditors from other PwC network firms who are familiar with the local laws and regulations to perform this audit work. Where the work was performed by the component auditors, we as the group auditor determined the level of involvement we needed to have in the audit work at those components to be able to conclude whether suf ficient appropriate audit evidence had been obtained as a basis for our opinion on the Group’s consolidated financial statements as a whole. We issued specific instructions to the audit teams of the components in our audit scope. These instructions included our risk analysis, materiality and audit approach for key audit areas. The group engagement team regularly communicated with all component auditors and in the current year, the group audit team visited local management of Metalloinvest Trading AG and the related PwC component auditors in Switzerland. The Group’s consolidation, financial statements disclosures and a number of complex items were audited by the group engagement team. The group engagement team audited the accounting treatment of significant reporting items such as financial assets measured at fair value, annual goodwill impairment testing, segment information, pension liabilities and others. By performing the above procedures at components, combined with additional procedures at the Group level, we have obtained sufficient and appropriate audit evidence regarding the financial information of the Group as a whole to provide a basis for our opinion on the consolidated financial statements.

iv
Key audit matters Key audit matters are those matters that, in our professional judgment, were of most significance in our audit of the consolidated financial statements of the current period. These matters were addressed in the context of our audit of the consolidated financial statements as a whole, and in forming our opinion thereon, and we do not provide a separate opinion on these matters.
Key audit matter How our audit addressed the key audit matter
Introduction of a new automated accounting system In 2018, the Group’s subsidiaries AO Lebedinsky GOK and PAO Mikhailovsky GOK (mining segment) introduced a new integrated f inancial and business management system using the SAP S/4HANA business suite. In 2019, the Group continued the implementation and since 1 July 2019, the new system was introduced at the remaining major Group’s subsidiaries: AO Oskol Electrometallurgical Plant, AO Ural Steel (steel segment) and Metalloinvest Trading AG (trading segment). This year we focused on the implementation of SAP system on Metalloinvest Trading AG due to significance of changes in financial reporting processes, specifics and difference in business processes of the trading company comparing to the production entities of the Group and, consequently, potential risks of material misstatements that may arise in case of system malfunction.
We performed the following audit procedures for Metalloinvest Trading AG: Understand and evaluate control environment We obtained an understanding of IT general controls and determined whether they have been implemented. We obtained an understanding of controls relevant to our audit, evaluated the design of those controls, and determined whether they have been implemented. Migration of data We tested the completeness and accuracy of data migration to the new accounting system, in particular, we: • checked the migration of all balances on
accounts; • analysed the classification of balances on
accounts in the new accounting system. Substantive testing We paid special attention to the accounting for inventories as one of the most complex areas and, in particular, we performed: • reconciliation of all purchased inventory with
the sales data of production entities of the Group for 2019;
• sample testing with a higher level of assurance of railway freight transportation expenses for the second half of 2019;
• sample testing with a higher level of assurance of the year-end inventory costing including transportation costs incurred before the moment of sale;
• testing of finished goods net realizable value calculation.
Based on the procedures performed we did not identify any material misstatements in financial statements arising from the transition to the new automated accounting system.

v
Other information Management is responsible for the other information. The other information comprises the Group’s annual report for the year ended 31 December 2019 and the issuer’s report for the 1st quarter 2020 (but does not include the consolidated financial statements and our auditor’s report thereon), which are expected to be made available to us after the date of this auditor’s report. Our opinion on the consolidated financial statements does not cover the other information and we do not and will not express any form of assurance conclusion thereon. In connection with our audit of the consolidated financial statements, our responsibility is to read the other information identified above and, in doing so, consider whether the other information is materially inconsistent with the consolidated financial statements or our knowledge obtained in the audit, or otherwise appears to be materially misstated. When we read the other information identified above, if we conclude that there is a material misstatement therein, we are required to communicate the matter to those charged with governance.
Responsibilities of management and those charged with governance for the consolidated financial statements Management is responsible for the preparation and fair presentation of the consolidated financial statements in accordance with IFRS, and for such internal control as management determines is necessary to enable the preparation of consolidated financial statements that are f ree from material misstatement, whether due to fraud or error. In preparing the consolidated financial statements, management is responsible for assessing the Group’s ability to continue as a going concern, disclosing, as applicable, matters related to going concern and using the going concern basis of accounting unless management either intends to liquidate the Group or to cease operations, or has no realistic alternative but to do so. Those charged with governance are responsible for overseeing the Group’s financial reporting process.
Auditor’s responsibilities for the audit of the consolidated financial statements Our objectives are to obtain reasonable assurance about whether the consolidated financial statements as a whole are f ree from material misstatement, whether due to fraud or error, and to issue an auditor’s report that includes our opinion. Reasonable assurance is a high level of assurance, but is not a guarantee that an audit conducted in accordance with ISAs will always detect a material misstatement when it exists. Misstatements can arise from fraud or error and are considered material if , individually or in the aggregate, they could reasonably be expected to influence the economic decisions of users taken on the basis of these consolidated financial statements. As part of an audit in accordance with ISAs, we exercise professional judgment and maintain professional scepticism throughout the audit. We also: • Identify and assess the risks of material misstatement of the consolidated financial statements,
whether due to f raud or error, design and perform audit procedures responsive to those risks, and obtain audit evidence that is sufficient and appropriate to provide a basis for our opinion. The risk of not detecting a material misstatement resulting from fraud is higher than for one resulting from error, as f raud may involve collusion, forgery, intentional omissions, misrepresentations, or the override of internal control.
• Obtain an understanding of internal control relevant to the audit in order to design audit procedures that are appropriate in the circumstances, but not for the purpose of expressing an opinion on the effectiveness of the Group’s internal control.
• Evaluate the appropriateness of accounting policies used and the reasonableness of accounting estimates and related disclosures made by management.


AO Holding Company METALLOINVEST Consolidated Statement of Profit or Loss and Other Comprehensive Income for the year ended 31 December 2019 (in thousands of US dollars, unless otherwise stated)
The accompanying notes 1 to 31 form an integral part of these consolidated financial statements. 2
Note 2019 2018 Sales 21 6,960,373 7,187,023 Cost of sales 22 (3,194,572) (3,267,838) Gross profit 3,765,801 3,919,185 Distribution expenses 23 (1,084,135) (856,080) General and administrative expenses 24 (328,312) (347,718) Other operating income/(expenses), net 25 (217,093) 6,805 Operating profit 2,136,261 2,722,192 Finance income 26 203,558 118,454 Finance costs 26 (361,554) (333,182) Change in credit loss allowance on loans advanced, net 14,419 (19,429) Foreign exchange gain/(loss) from borrowings and loans advanced, net 225,868 (379,476) Profit before income tax 2,218,552 2,108,559 Income tax charge 17 (487,552) (461,378) Profit for the year 1,731,000 1,647,181 Other comprehensive income: Items that will not be reclassified to profit or loss: Fair value gain/(loss) arising on equity investments 9,15 14,089 (16,603) Remeasurements of employee benefit obligations (31,535) 13,190 Currency translation differences 293,995 (293,648) Total other comprehensive income/(loss) for the year 276,549 (297,061) Total comprehensive income for the year 2,007,549 1,350,120 Profit is attributable to: Owners of the Company 1,676,897 1,602,348 Non-controlling interests 54,103 44,833 1,731,000 1,647,181 Total comprehensive income is attributable to: Owners of the Company 1,953,446 1,305,287 Non-controlling interests 54,103 44,833 2,007,549 1,350,120 Basic and diluted earnings per ordinary share for profit attributable to the owners of the Company (in USD per share) 27 0.0224 0.0214

AO Holding Company METALLOINVEST Consolidated Statement of Cash Flows for the year ended 31 December 2019 (in thousands of US dollars, unless otherwise stated)
The accompanying notes 1 to 31 form an integral part of these consolidated financial statements. 3
Note 2019 2018 Cash flows from operating activities: Profit before income tax 2,218,552 2,108,559 Reconciliation between profit before income tax and net cash from operating activities:
Depreciation of property, plant and equipment 269,285 252,894 Amortisation of intangible assets and mineral rights 43,023 37,437 Finance costs, net 26 157,996 214,728 Foreign exchange (gain)/loss (132,551) 281,643 Change in credit loss allowance on loans advanced, net (14,419) 19,429 Other (18,359) 18,980
Changes in: Inventories 155,409 (211,417) Trade and other receivables 78,347 (275,619) Trade and other payables (26,054) 44,896 Employee benefit obligations (6,267) (18,766)
Income tax paid (503,619) (460,056) Interest paid (283,564) (316,500) Premium paid on early redemption of guaranteed notes and unsecured corporate bonds 16 (6,558) - Other finance charges (4,882) (648) Net cash from operating activities 1,926,339 1,695,560 Cash flows from investing activities: Purchases of property, plant and equipment and intangible assets (516,812) (441,020) Loans advanced (1,181,972) (1,802,372) Repayments of loans advanced 146,093 1,234,708 Interest received 13,549 69,855 Other 365 69 Net cash used in investing activities (1,538,777) (938,760) Cash flows from financing activities: Repayment of borrowings 16 (1,178,901) (725,523) Lease payments 16 (5,161) - Proceeds from borrowings 16 931,827 640,289 Acquisition of additional interest in subsidiaries (222,547) (74,215) Proceeds from disposal of interest in subsidiaries - 166,045 Transaction costs on disposal of interest in subsidiaries - (2,270) Dividends paid by the Group’s subsidiaries to non-controlling interests (279) (956) Dividends paid to the owners of the Company 15 (302,863) (434,682) Net cash used in financing activities (777,924) (431,312) Effect of exchange rate changes on cash and cash equivalents 939 (22,773) Net (decrease)/increase in cash and cash equivalents (389,423) 302,715 Cash and cash equivalents at the beginning of the year 693,087 390,372 Cash and cash equivalents at the end of the year 303,664 693,087

AO Holding Company METALLOINVEST Consolidated Statement of Changes in Equity for the year ended 31 December 2019 (in thousands of US dollars, unless otherwise stated)
The accompanying notes 1 to 31 form an integral part of these consolidated financial statements. 4
Attributable to owners of the Company
Note Share
capital Other
reserves Retained earnings Total
Non-controlling
interests Total
equity Balance at 1 January 2018 176,382 (1,684,846) 2,278,404 769,940 1,088 771,028 Profit for the year - - 1,602,348 1,602,348 44,833 1,647,181 Other comprehensive income/(loss) Fair value loss on equity investments 9,15 - (16,603) - (16,603) - (16,603) Remeasurements of employee benefit obligations - - 13,190 13,190 - 13,190 Currency translation differences 15 - (293,648) - (293,648) - (293,648) Total other comprehensive income/(loss) - (310,251) 13,190 (297,061) - (297,061) Total comprehensive income/(loss) for the year ended 31 December 2018 - (310,251) 1,615,538 1,305,287 44,833 1,350,120 Acquisition of additional interest in subsidiaries - - (101,160) (101,160) 26,545 (74,615) Disposal of interest in subsidiaries - - (34,743) (34,743) 201,921 167,178 Cancellation of treasury shares in subsidiary - - (262) (262) 262 - Dividends declared by the Group’s subsidiaries to non-controlling interests - - - - (1,362) (1,362) Dividends declared by the Company 15 - - (439,092) (439,092) - (439,092) Balance at 31 December 2018 176,382 (1,995,097) 3,318,685 1,499,970 273,287 1,773,257 Profit for the year - - 1,676,897 1,676,897 54,103 1,731,000 Other comprehensive income/(loss) Fair value gain on equity investments 9,15 - 14,089 - 14,089 - 14,089 Remeasurements of employee benefit obligations - - (31,535) (31,535) - (31,535) Currency translation differences 15 - 293,995 - 293,995 - 293,995 Total other comprehensive income/(loss) - - 308,084 (31,535) 276,549 - 276,549 Total comprehensive income for the year ended 31 December 2019 - - 308,084 1,645,362 1,953,446 54,103 2,007,549 Acquisition of additional interest in subsidiaries - - 96,179 96,179 (318,910) (222,731) Cancellation of unclaimed dividends to non-controlling interests to retained earnings - - 1,707 1,707 - 1,707 Dividends declared by the Company 15 - - (300,909) (300,909) - (300,909) Balance at 31 December 2019 176,382 (1,687,013) 4,761,024 3,250,393 8,480 3,258,873

AO Holding Company METALLOINVEST Notes to the Consolidated Financial Statements for the year ended 31 December 2019 (in thousands of US dollars, unless otherwise stated)
5
1 General information
These consolidated financial statements have been prepared in accordance with International Financial Reporting Standards for the year ended 31 December 2019 for AO Holding Company METALLOINVEST (the “Company”) and its subsidiaries (the “Group”). The Group’s principal business activity is the production and sale of iron ore products and ferrous metals. These products are sold both in Russia and abroad. The Company is incorporated and domiciled in Russia. The address of its registered office is Rublyovskoye shosse, 28, Moscow, Russia. The Group’s manufacturing facilities are primarily based in the Kursk, Belgorod and Orenburg regions.
At 31 December 2019 and 2018, USM Metalloinvest LLC (a 100%-owned direct subsidiary of HС USM LLC) owned a 100% stake in the Company.
At 31 December 2019 and 2018, the major beneficial owner of the Company was Alisher B. Usmanov, who owned a 49% stake in HC USM LLC.
The following table sets out the major subsidiaries of the Group:
Entity Activity
Nominal ownership, % 31 December
2019 31 December
2018 OOO Management Company METALLOINVEST Management company 100% 100% AO Lebedinskiy Mining and Processing Works (“LGOK”) Production and sale of iron ore products 100% 100% AO Oskol Electrometallurgical Plant (“OEMK”)
Production and sale of ferrous metal products 100% 100%
PAO Mikhailovsky Mining and Processing Works (“MGOK”) Production and sale of iron ore products 100% 89.317%
AO Ural Steel (“Ural Steel”) Production and sale of ferrous metal products 100% 100%
OOO Ural Scrap Company Collection and processing of scrap 100% 100% Metalloinvest Trading AG (Switzerland) Iron ore and steel products trading 100% 100%
2 Basis of preparation and summary of significant accounting policies
Basis of preparation. These consolidated financial statements have been prepared in accordance with International Financial Reporting Standards (“IFRS”) under the historical cost convention except as described below. The principal accounting policies applied in the preparation of these consolidated financial statements are set out below. Apart from the accounting policy changes resulting from the adoption of IFRS 16 effective from 1 January 2019, these policies have been consistently applied to all the periods presented.
Consolidated financial statements. Subsidiaries are those investees, including structured entities, that the Group controls because the Group (i) has power to direct the relevant activities of the investees that significantly affect their returns, (ii) has exposure, or rights, to variable returns from its involvement with the investees, and (iii) has the ability to use its power over the investees to affect the amount of the investor’s returns. The existence and effect of substantive rights, including substantive potential voting rights, are considered when assessing whether the Group has power over another entity. For a right to be substantive, the holder must have a practical ability to exercise that right when decisions about the direction of the relevant activities of the investee need to be made. The Group may have power over an investee even when it holds less than the majority of the voting power in an investee. In such a case, the Group assesses the size of its voting rights relative to the size and dispersion of holdings of the other vote holders to determine if it has de-facto power over the investee. Protective rights of other investors, such as those that relate to fundamental changes of the investee’s activities or apply only in exceptional circumstances, do not prevent the Group from controlling an investee. Subsidiaries are consolidated from the date on which control is transferred to the Group (acquisition date) and are deconsolidated from the date that control ceases.
The acquisition method of accounting is used to account for the acquisition of subsidiaries. Identifiable assets acquired and liabilities and contingent liabilities assumed in a business combination are measured at their fair values at the acquisition date, irrespective of the extent of any non-controlling interest.
The Group measures non-controlling interest on a transaction by transaction basis, either at: (a) fair value, or (b) the non-controlling interest's proportionate share of net assets of the acquiree.

AO Holding Company METALLOINVEST Notes to the Consolidated Financial Statements for the year ended 31 December 2019 (in thousands of US dollars, unless otherwise stated)
6
2 Basis of preparation and summary of significant accounting policies (continued)
Goodwill is measured by deducting the net assets of the acquiree from the aggregate of the consideration transferred for the acquiree, the amount of non-controlling interest in the acquiree and the fair value of an interest in the acquiree held immediately before the acquisition date. Any negative amount (“negative goodwill”) is recognised in profit or loss, after management reassesses whether it identified all the assets acquired and all the liabilities and contingent liabilities assumed and reviews the appropriateness of their measurement.
The consideration transferred for the acquiree is measured at the fair value of the assets given up, equity instruments issued and liabilities incurred or assumed, including the fair value of assets or liabilities from contingent consideration arrangements, but excludes acquisition related costs such as advisory, legal, valuation and similar professional services. Transaction costs incurred for issuing equity instruments are deducted from equity; transaction costs incurred for issuing debt are deducted from its carrying amount and all other transaction costs associated with the acquisition are expensed.
Intercompany transactions, balances and unrealised gains on transactions between Group companies are eliminated; unrealised losses are also eliminated unless the transaction provides evidence of an impairment of the asset transferred. The Company and all of its subsidiaries use uniform accounting policies consistent with the Group’s policies.
Non-controlling interest is that part of the net results and of the equity of a subsidiary attributable to interests, which are not owned, directly or indirectly, by the Company. Non-controlling interest forms a separate component of the Group’s equity.
When the group ceases to consolidate or equity account for an investment because of a loss of control or significant influence, any retained interest in the entity is remeasured to its fair value with the change in carrying amount recognised in profit or loss. This fair value becomes the initial carrying amount for the purposes of subsequently accounting for the retained interest as an associate, joint venture or financial asset. In addition, any amounts previously recognised in other comprehensive income in respect of that entity are accounted for as if the group had directly disposed of the related assets or liabilities. This may mean that amounts previously recognised in other comprehensive income are reclassified to profit or loss.
Transactions with non-controlling interests. The Group treats transactions with non-controlling interests as transactions with equity owners of the Group. For purchases from non-controlling interests, the difference between any consideration paid and the relevant share acquired of the carrying value of net assets of the subsidiary is recorded in equity. Gains or losses on disposals to non-controlling interests are also recorded in equity.
Foreign currency translation. The functional currency of each of the Group’s consolidated entities is the currency of the primary economic environment in which the entity operates. The Company’s functional currency is the national currency of Russia, Russian roubles (“RUB”); the Group’s presentation currency is US Dollar (“USD”) as it is considered by management to be more relevant presentation currency for users of the consolidated financial statements of the Group.
Monetary assets and liabilities are translated into each entity’s functional currency at the official exchange rate of the Central Bank of Russia (the “Central Bank”) at the respective end of the reporting period. Foreign exchange gains and losses resulting from settlement of transactions and from translation of monetary assets and liabilities into each entity’s functional currency at year-end official exchange rates of the Central Bank are recognised in profit or loss. Translation at year-end rates does not apply to non-monetary items that are measured at historical cost.
Non-monetary items measured at fair value in a foreign currency, including equity investments, are translated using the exchange rates at the date when the fair value was determined. Effects of exchange rate changes on non-monetary items measured at fair value in a foreign currency are recorded as part of the fair value gain or loss.
The results and financial position of each Group entity (the functional currency of none of which is a currency of a hyperinflationary economy) are translated into the presentation currency as follows:
(i) assets and liabilities for each statement of financial position are translated at the closing rate at the end of the respective reporting period;
(ii) income and expenses are translated at average exchange rates (unless this average is not a reasonable approximation of the cumulative effect of the rates prevailing on the transaction dates, in which case income and expenses are translated at the dates of the transactions);
(iii) components of equity are translated at the historical rate; and
(iv) all resulting exchange differences are recognised in other comprehensive income.
When control over a foreign operation is lost, the previously recognised exchange differences on translation to a different presentation currency are reclassified from other comprehensive income to profit or loss for the year as part of the gain or loss on disposal. On partial disposal of a subsidiary without loss of control, the related portion of accumulated currency translation differences is reclassified to non-controlling interest within equity.

AO Holding Company METALLOINVEST Notes to the Consolidated Financial Statements for the year ended 31 December 2019 (in thousands of US dollars, unless otherwise stated)
7
2 Basis of preparation and summary of significant accounting policies (continued)
Goodwill and fair value adjustments arising on the acquisition of a foreign entity are treated as assets and liabilities of the foreign entity and translated at the closing rate.
At 31 December 2019, the principal exchange rates used for translating foreign currency balances were USD 1 = RUB 61.9057 (31 December 2018: USD 1 = RUB 69.4706), EUR 1 = RUB 69.3406 (31 December 2018: EUR 1 = RUB 79.4605).
Income and expenses for the year were translated to presentation currency at quarterly average exchange rates.
Quarterly average exchange rates/ Year
For the three months ended
31 March
For the three months ended
30 June
For the three months ended 30 September
For the three months ended
31 December 2019 66.1271 64.5584 64.5685 63.7192 2018 56.8803 61.7998 65.5323 66.4822
Segment reporting. Operating segments are reported in a manner consistent with the internal reporting provided to the Group’s chief operating decision maker. Segments whose revenue, result or assets are 10% or more of all the segments are reported separately.
Property, plant and equipment. Property, plant and equipment are stated at historical acquisition or construction cost less accumulated depreciation and provision for impairment, where required.
Subsequent costs are included in the asset’s carrying amount or recognised as a separate asset, as appropriate, only when it is probable that future economic benefits associated with the item will flow to the Group and the cost of the item can be measured reliably. The carrying amount of any replaced part is derecognised. All other repairs and maintenance are recognised in profit or loss in the financial period in which they are incurred.
At each end of the reporting period management assesses whether there is any indication of impairment of property, plant and equipment. If any such indication exists, management estimates the recoverable amount, which is determined as the higher of an asset’s fair value less costs to sell and its value in use. The carrying amount is reduced to the recoverable amount and the impairment loss is recognised in profit or loss. An impairment loss recognised for an asset in prior years is reversed if there has been a change in the estimates used to determine the recoverable amount. Gains and losses on disposals determined by comparing proceeds with carrying amount are recognised in profit or loss.
Depreciation. Land is not depreciated. Depreciation on other items of property, plant and equipment is calculated using the straight-line method to allocate their cost to their residual values over their estimated useful lives:
Useful lives in years Buildings 7 to 135 Plant and equipment 3 to 30 Transport 5 to 20 Other 2 to 10
Included into Buildings group are tailings embankments which estimated useful lives vary from 60 to 135 years, useful life of the other buildings items vary from 7 to 50 years.
The residual value of an asset is the estimated amount that the Group would currently obtain from disposal of the asset less the estimated costs of disposal, if the asset was already of the age and in the condition expected at the end of its useful life. The residual value of an asset is nil if the Group expects to use the asset until the end of its physical life. The assets’ residual values and useful lives are reviewed, and adjusted if appropriate, at the end of each reporting period.
Capitalisation of borrowing costs. Borrowing costs directly attributable to the acquisition, construction or production of assets that necessarily take a substantial time to get ready for intended use or sale (qualifying assets) are capitalised as part of the costs of those assets.
Capitalisation of borrowing costs continues up to the date when the assets are substantially ready for their use or sale.
The Group capitalises borrowing costs that could have been avoided if it had not made capital expenditure on qualifying assets. Borrowing costs capitalised are calculated at the Group’s average funding cost (the weighted average interest cost is applied to the expenditures on the qualifying assets), except to the extent that funds are borrowed specifically for the purpose of obtaining a qualifying asset. Where this occurs, actual borrowing costs incurred less any investment income on the temporary investment of those borrowings are capitalised.

AO Holding Company METALLOINVEST Notes to the Consolidated Financial Statements for the year ended 31 December 2019 (in thousands of US dollars, unless otherwise stated)
8
2 Basis of preparation and summary of significant accounting policies (continued)
Stripping costs. The Group separates two different types of stripping costs that are incurred in surface mining activity: a) stripping activity asset; and b) current stripping costs. Stripping activity asset is created as part of usual surface activity in order to obtain improved access to further quantities of minerals that will be mined in future periods. Current stripping costs are costs that are incurred in order to mine the mineral ore only in current period.
The Group recognises a stripping activity asset if, and only if, all of the following are met: 1) it is probable that the future economic benefit (improved access to the ore body) associated with the stripping activity will flow to the entity; 2) the entity can identify the component of the ore body for which access has been improved; and 3) the costs relating to the improved access to that component can be measured reliably.
After initial recognition, stripping activity assets are carried at cost less accumulated depreciation and impairment loss. Depreciation is calculated using the units of production method. Stripping asset is recognised within property, plant and equipment.
Right-of-use assets. The Group recognises a right-of-use asset and a corresponding lease liability at the commencement date of the lease. The right-of-use asset is initially measured at cost comprising of the lease liability, lease payments made at or before the commencement date, any initial direct costs and other lease related costs.
Contracts may contain both lease and non-lease components. The Group allocates the consideration in the contract to the lease and non-lease components based on their relative stand-alone prices.
The right-of-use asset is depreciated on a straight-line basis from the commencement date to the earlier of: the end of the useful life of the underlying asset or the end of the lease term. The lease term may include periods covered by an option to extend (or terminate) the lease, whenever the lease is reasonably certain to be extended (or not terminated). Management assesses extension and termination options of the leases on a regular basis.
Right-of-use assets are accounted for within "Property, plant and equipment" in the consolidated statement of financial position and are subject to testing for impairment, whenever there are indications that the asset may be impaired.
The right-of-use assets mainly comprised administrative offices lease contracts and are depreciated over 2 to 15 years.
Intangible assets. The Group’s intangible assets other than goodwill have finite useful lives and primarily include acquired computer software licences, licenced technology and customer relationships acquired in business combinations. Intangible assets are amortised using the straight-line method over their estimated useful lives of three to ten years for acquired computer software licences and customer relationships, and of twenty five to thirty years for licenced technology. Intangible assets are assessed for impairment whenever there is an indication that the intangible assets may be impaired.
If impaired, the carrying amount of intangible assets is written down to the higher of value in use and fair value less costs to sell.
Goodwill. Goodwill on acquisitions of subsidiaries is presented separately in the consolidated statement of financial position. Goodwill on acquisitions of associates is included in investment in associates. Goodwill is carried at cost less accumulated impairment losses, if any.
The Group tests goodwill for impairment at least annually and whenever there are indications that goodwill may be impaired. Goodwill is allocated to the cash-generating units, or groups of cash-generating units, that are expected to benefit from the synergies of the business combination. Such units or group of units represent the lowest level at which the Group monitors goodwill and are not larger than an operating segment. Gains or losses on disposal of an operation within a cash generating unit to which goodwill has been allocated include the carrying amount of goodwill associated with the operation disposed of, generally measured on the basis of the relative values of the operation disposed of and the portion of the cash-generating unit which is retained.
Mineral rights. In accordance with provisions of IFRS 3 Business Combinations mineral rights acquired in business combinations are recorded at their fair values at the date of acquisition, based on their appraised fair value. Other mineral rights and licences are recorded at cost.
Mineral rights stated at 31 December 2019 and 2018 represent mainly mineral rights recognised as a result of acquisition of MGOK in December 2006, which grant access to reserves that will be extracted over periods in excess of 100 years. The appraised value of these rights reflects expected cash flows over thirty years from the date of acquisition, since the impact of cash flows beyond this period is not material. The Group's production plans for these reserves are such that there is no material difference between amortisation calculated using the units of production and using the straight-line method. These rights are therefore amortised on a straight line basis over thirty years.

AO Holding Company METALLOINVEST Notes to the Consolidated Financial Statements for the year ended 31 December 2019 (in thousands of US dollars, unless otherwise stated)
9
2 Basis of preparation and summary of significant accounting policies (continued)
Advances issued. Advances issued are carried at cost less provision for impairment. An advance issued is classified as non-current when the goods or services relating to the advance issued are expected to be obtained after one year, or when the advance issued relates to an asset, which will itself be classified as non-current upon initial recognition. If there is an indication that the assets, goods or services relating to an advance issued will not be received, the carrying value of the advance issued is written down accordingly and a corresponding impairment loss is recognised in profit or loss.
Inventories. Inventories are stated at the lower of cost and net realisable value. Cost of inventory is determined using the weighted average method. The cost of finished goods and work in progress comprises raw material, direct labour, other direct costs and related production overheads (based on normal operating capacity) but excludes borrowing costs. Net realisable value is the estimated selling price in the ordinary course of business, less the cost of completion and distribution expenses.
Financial instruments – key measurement terms. Fair value is the price that would be received to sell an asset or paid to transfer a liability in an orderly transaction between market participants at the measurement date. The best evidence of fair value is the price in an active market. An active market is one in which transactions for the asset or liability take place with sufficient frequency and volume to provide pricing information on an ongoing basis.
Fair value of financial instruments traded in an active market is measured as the product of the quoted price for the individual asset or liability and the number of instruments held by the entity. This is the case even if a market’s normal daily trading volume is not sufficient to absorb the quantity held and placing orders to sell the position in a single transaction might affect the quoted price.
Valuation techniques such as discounted cash flow models or models based on recent arm’s length transactions or consideration of financial data of the investees are used to measure fair value of certain financial instruments for which external market pricing information is not available. Fair value measurements are analysed by level in the fair value hierarchy as follows: (i) level one are measurements at quoted prices (unadjusted) in active markets for identical assets or liabilities, (ii) level two measurements are valuations techniques with all material inputs observable for the asset or liability, either directly (that is, as prices) or indirectly (that is, derived from prices), and (iii) level three measurements are valuations not based on solely observable market data (that is, the measurement requires significant unobservable inputs). Transfers between levels of the fair value hierarchy are deemed to have occurred at the end of the reporting period.
Transaction costs are incremental costs that are directly attributable to the acquisition, issue or disposal of a financial instrument. An incremental cost is one that would not have been incurred if the transaction had not taken place. Transaction costs include fees and commissions paid to agents (including employees acting as selling agents), advisors, brokers and dealers, levies by regulatory agencies and securities exchanges, and transfer taxes and duties. Transaction costs do not include debt premiums or discounts, financing costs or internal administrative or holding costs.
Amortised cost (“AC”) is the amount at which the financial instrument was recognised at initial recognition less any principal repayments, plus accrued interest, and for financial assets less any allowance for expected credit losses (“ECL”). Accrued interest includes amortisation of transaction costs deferred at initial recognition and of any premium or discount to the maturity amount using the effective interest method. Accrued interest income and accrued interest expense, including both accrued coupon and amortised discount or premium (including fees deferred at origination, if any), are not presented separately and are included in the carrying values of the related items in the consolidated statement of financial position.
The effective interest method is a method of allocating interest income or interest expense over the relevant period, so as to achieve a constant periodic rate of interest (effective interest rate) on the carrying amount. The effective interest rate is the rate that exactly discounts estimated future cash payments or receipts (excluding future credit losses) through the expected life of the financial instrument or a shorter period, if appropriate, to the gross carrying amount of the financial instrument. The effective interest rate discounts cash flows of variable interest instruments to the next interest repricing date, except for the premium or discount which reflects the credit spread over the floating rate specified in the instrument, or other variables that are not reset to market rates. Such premiums or discounts are amortised over the whole expected life of the instrument. The present value calculation includes all fees paid or received between parties to the contract that are an integral part of the effective interest rate. For assets that are purchased or originated credit impaired (“POCI”) at initial recognition, the effective interest rate is adjusted for credit risk, i.e. it is calculated based on the expected cash flows on initial recognition instead of contractual payments.
Financial instruments – initial recognition. Financial instruments at fair value though profit or loss (“FVTPL”) are initially recorded at fair value. All other financial instruments are initially recorded at fair value adjusted for transaction costs. Fair value at initial recognition is best evidenced by the transaction price. A gain or loss on initial recognition is only recorded if there is a difference between fair value and transaction price which can be evidenced by other observable current market transactions in the same instrument or by a valuation technique whose inputs include only data from observable markets. After the initial recognition, an ECL allowance is recognised for financial assets measured at AC and investments in debt instruments measured at fair value though other comprehensive income (“FVOCI”), resulting in an immediate accounting loss.
AO Holding Company METALLOINVEST Notes to the Consolidated Financial Statements for the year ended 31 December 2019 (in thousands of US dollars, unless otherwise stated)
10
2 Basis of preparation and summary of significant accounting policies (continued)
All purchases and sales of financial assets that require delivery within the time frame established by regulation or market convention (“regular way” purchases and sales) are recorded at trade date, which is the date on which the Group commits to deliver a financial asset. All other purchases are recognised when the entity becomes a party to the contractual provisions of the instrument.
The Group uses discounted cash flow valuation techniques to determine the fair value of loans to related parties that are not traded in an active market. Differences may arise between the transaction price and fair value at initial recognition, which is determined using a valuation technique. Such differences are amortised using effective interest method over the term of the loans to related parties.
Financial assets – classification and subsequent measurement – measurement categories. The Group classifies financial assets in the following measurement categories: FVTPL, FVOCI and AC. The classification and subsequent measurement of debt financial assets depends on: (i) the Group’s business model for managing the related assets portfolio and (ii) the cash flow characteristics of the asset.
Financial assets – classification and subsequent measurement – business model. The business model reflects how the Group manages the assets in order to generate cash flows – whether the Group’s objective is: (i) solely to collect the contractual cash flows from the assets (“hold to collect contractual cash flows”,) or (ii) to collect both the contractual cash flows and the cash flows arising from the sale of assets (“hold to collect contractual cash flows and sell”) or, if neither of (i) and (ii) is applicable, the financial assets are classified as part of “other” business model and measured at FVTPL.
Business model is determined for a group of assets (on a portfolio level) based on all relevant evidence about the activities that the Group undertakes to achieve the objective set out for the portfolio available at the date of the assessment. Factors considered by the Group in determining the business model include the purpose and composition of a portfolio, past experience on how the cash flows for the respective assets were collected.
Financial assets – classification and subsequent measurement – cash flow characteristics. Where the business model is to hold assets to collect contractual cash flows or to hold contractual cash flows and sell, the Group assesses whether the cash flows represent solely payments of principal and interest (“SPPI”). Financial assets with embedded derivatives are considered in their entirety when determining whether their cash flows are consistent with the SPPI feature. In making this assessment, the Group considers whether the contractual cash flows are consistent with a basic lending arrangement, i.e. interest includes only consideration for credit risk, time value of money, other basic lending risks and profit margin.
Where the contractual terms introduce exposure to risk or volatility that is inconsistent with a basic lending arrangement, the financial asset is classified and measured at FVTPL. The SPPI assessment is performed on initial recognition of an asset and it is not subsequently reassessed.
Financial assets – reclassification. Financial instruments are reclassified only when the business model for managing the portfolio as a whole changes. The reclassification has a prospective effect and takes place from the beginning of the first reporting period that follows after the change in the business model. The entity did not change its business model during the current and comparative period and did not make any reclassifications.
Financial assets impairment – credit loss allowance for ECL. The Group assesses, on a forward-looking basis, the ECL for debt instruments measured at AC and FVOCI and for the exposures arising from loan commitments and for contract assets. The Group measures ECL and recognises Net impairment losses on financial and contract assets at each reporting date. The measurement of ECL reflects: (i) an unbiased and probability weighted amount that is determined by evaluating a range of possible outcomes, (ii) time value of money and (iii) all reasonable and supportable information that is available without undue cost and effort at the end of each reporting period about past events, current conditions and forecasts of future conditions.
The Group applies a three stage model for impairment, based on changes in credit quality since initial recognition. A financial instrument that is not credit-impaired on initial recognition is classified in Stage 1. Financial assets in Stage 1 have their ECL measured at an amount equal to the portion of lifetime ECL that results from default events possible within the next 12 months or until contractual maturity, if shorter (“12 Months ECL”).
If the Group identifies a significant increase in credit risk (“SICR”) since initial recognition, the asset is transferred to Stage 2 and its ECL is measured based on ECL on a lifetime basis, that is, up until contractual maturity but considering expected prepayments, if any (“Lifetime ECL”). If the Group determines that a financial asset is credit-impaired, the asset is transferred to Stage 3 and its ECL is measured as a Lifetime ECL. For financial assets that are purchased or originated credit-impaired (“POCI Assets”), the ECL is always measured as a Lifetime ECL.

AO Holding Company METALLOINVEST Notes to the Consolidated Financial Statements for the year ended 31 December 2019 (in thousands of US dollars, unless otherwise stated)
11
2 Basis of preparation and summary of significant accounting policies (continued)
Financial assets – write-off. Financial assets are written-off, in whole or in part, when the Group exhausted all practical recovery efforts and has concluded that there is no reasonable expectation of recovery. The write-off represents a derecognition event. Indicators that there is no reasonable expectation of recovery include: a significant financial difficulty of the counterparty as evidenced by its financial information that the Group obtains; the considered bankruptcy of the counterparty or a financial reorganisation; an adverse change in the payment status of the counterparty as a result of changes in the national or local economic conditions that impact the counterparty; or the value of collateral, if any, significantly decreases as a result of deteriorating market conditions. The Group may write-off financial assets that are still subject to enforcement activity when the Group seeks to recover amounts that are contractually due, however, there is no reasonable expectation of recovery.
Financial assets – derecognition. The Group derecognises financial assets when (a) the assets are redeemed or the rights to cash flows from the assets otherwise expire or (b) the Group has transferred the rights to the cash flows from the financial assets or entered into a qualifying pass-through arrangement whilst (i) also transferring substantially all the risks and rewards of ownership of the assets or (ii) neither transferring nor retaining substantially all the risks and rewards of ownership but not retaining control.
Control is retained if the counterparty does not have the practical ability to sell the asset in its entirety to an unrelated third party without needing to impose additional restrictions on the sale.
Financial assets – modification. The Group sometimes renegotiates or otherwise modifies the contractual terms of the financial assets. The Group assesses whether the modification of contractual cash flows is substantial considering, among other, the following factors: any new contractual terms that substantially affect the risk profile of the asset, significant change in interest rate, change in the currency denomination, new collateral or credit enhancement that significantly affects the credit risk associated with the asset or a significant extension of a loan when the borrower is not in financial difficulties.
If the modified terms are substantially different, the rights to cash flows from the original asset expire and the Group derecognises the original financial asset and recognises a new asset at its fair value. The date of renegotiation is considered to be the date of initial recognition for subsequent impairment calculation purposes, including determining whether a SICR has occurred. The Group also assesses whether the new loan or debt instrument meets the SPPI criterion. Any difference between the carrying amount of the original asset derecognised and fair value of the new substantially modified asset is recognised in profit or loss, unless the substance of the difference is attributed to a capital transaction with owners.
In a situation where the renegotiation was driven by financial difficulties of the counterparty and inability to make the originally agreed payments, the Group compares the original and revised expected cash flows to assets whether the risks and rewards of the asset are substantially different as a result of the contractual modification. If the risks and rewards do not change, the modified asset is not substantially different from the original asset and the modification does not result in derecognition. The Group recalculates the gross carrying amount by discounting the modified contractual cash flows by the original effective interest rate (or credit-adjusted effective interest rate for POCI financial assets), and recognises a modification gain or loss in profit or loss.
Financial liabilities – measurement categories. Financial liabilities are classified and subsequently measured at AC, except for (i) financial liabilities at FVTPL: this classification is applied to derivatives, financial liabilities held for trading (e.g. short positions in securities), contingent consideration recognised by an acquirer in a business combination and other financial liabilities designated as such at initial recognition and (ii) financial guarantee contracts and loan commitments.
Financial liabilities – derecognition. Financial liabilities are derecognised when they are extinguished (i.e. when the obligation specified in the contract is discharged, cancelled or expires).
An exchange between the Group and its original lenders of debt instruments with substantially different terms, as well as substantial modifications of the terms and conditions of existing financial liabilities, are accounted for as an extinguishment of the original financial liability and the recognition of a new financial liability. The terms are substantially different if the discounted present value of the cash flows under the new terms, including any fees paid net of any fees received and discounted using the original effective interest rate, is at least 10% different from the discounted present value of the remaining cash flows of the original financial liability. In addition, other qualitative factors, such as the currency that the instrument is denominated in, changes in the type of interest rate, new conversion features attached to the instrument and change in loan covenants are also considered. If an exchange of debt instruments or modification of terms is accounted for as an extinguishment, any costs or fees incurred are recognised as part of the gain or loss on the extinguishment. If the exchange or modification is not accounted for as an extinguishment, any costs or fees incurred adjust the carrying amount of the liability and are amortised over the remaining term of the modified liability.

AO Holding Company METALLOINVEST Notes to the Consolidated Financial Statements for the year ended 31 December 2019 (in thousands of US dollars, unless otherwise stated)
12
2 Basis of preparation and summary of significant accounting policies (continued)
Modifications of liabilities that do not result in extinguishment are accounted for as a change in estimate using a cumulative catch up method, with any gain or loss recognised in profit or loss, unless the economic substance of the difference in carrying values is attributed to a capital transaction with owners.
Offsetting financial instruments. Financial assets and liabilities are offset and the net amount reported in the statement of financial position only when there is a legally enforceable right to offset the recognised amounts, and there is an intention to either settle on a net basis, or to realise the asset and settle the liability simultaneously. Such a right of set off (a) must not be contingent on a future event and (b) must be legally enforceable in all of the following circumstances: (i) in the normal course of business, (ii) in the event of default and (iii) in the event of insolvency or bankruptcy.
Cash and cash equivalents. Cash and cash equivalents includes cash in hand, deposits held at call with banks, and other short-term highly liquid investments with original maturities of three months or less. Bank deposits held for longer than three months that are repayable on demand within several working days without penalties or that can be redeemed/withdrawn, subject to the interest income forfeited, are classified as cash equivalents if the deposits are held to meet short-term cash needs and there is no significant risk of a change in value as a result of an early withdrawal. Other term deposits are included into short-term investments.
Restricted balances are excluded from cash and cash equivalents for the purposes of the cash flow statement. Balances restricted from being exchanged or used to settle a liability for at least twelve months after the end of the reporting period are included in other non-current assets. Bank overdrafts are shown within borrowings in current liabilities. Cash flows arising from overdrafts movements are reported on a net basis in cash flow statement within financing activities.
Trade and other receivables. Trade and other receivables are initially recognised at fair value and are subsequently carried at AC using the effective interest method.
Trade and other payables. Trade payables are accrued when the counterparty performs its obligations under the contract and are recognised initially at fair value and subsequently carried at AC using the effective interest method.
Equity investments. Equity investments that are not held for trading are initially recognised at fair value and designated at FVOCI. Fair value gains and losses on equity investments are presented in OCI, there is no subsequent reclassification of fair value gains and losses to profit or loss following the impairment or derecognition of the investment.
Loans advanced. Loans advanced are initially recognised at fair value and are subsequently measured depending on business model applied by the Group for each particular loan advanced and cash flow characteristics. As at 31 December 2019 and 2018 the Group hold loans advanced measured at AC and FVTPL.
Share capital. Ordinary shares are classified as equity. Incremental costs directly attributable to the issue of new shares are shown in equity as a deduction, net of tax, from the proceeds.
Where the Company or its subsidiaries purchase the Company’s equity instruments (treasury shares), the consideration paid, including any directly attributable incremental costs, net of income taxes, is deducted from retained earnings until the equity instruments are reissued, disposed of or cancelled. Where such shares are subsequently sold or reissued, any consideration received, net of any directly attributable incremental transaction costs and the related income tax effects, is included in retained earnings.
Dividends. Dividends are recognised as a liability and deducted from equity in the period in which they are declared and approved. Any dividends declared after the reporting period and before the financial statements are authorised for issue are disclosed in the subsequent events note.
Short-term employee benefits. Wages, salaries, contributions to the Russian state medical and social insurance funds, paid annual leave and sick leave, bonuses, and non-monetary benefits (such as health services and kindergarten services) are accrued in the year in which the associated services are rendered by the employees of the Group and are included within labour costs in operating expenses. Contributions to the Russian state pension fund are treated as defined contribution plan.
Pension and other post-employment benefits. Group companies operate both funded and unfunded post-employment benefits plans. Typically, defined benefit plans define an amount of pension benefit that an employee will receive on retirement, usually dependent on one or more factors such as age, years of service and compensation.
The liability recognised in the statement of financial position in respect of defined benefit pension plans is the present value of the defined benefit obligation at the end of the reporting period date less the fair value of any plan assets. The defined benefit obligation is calculated annually by independent actuaries using the projected unit credit method.

AO Holding Company METALLOINVEST Notes to the Consolidated Financial Statements for the year ended 31 December 2019 (in thousands of US dollars, unless otherwise stated)
13
2 Basis of preparation and summary of significant accounting policies (continued)
The present value of the defined benefit obligation is determined by discounting the estimated future cash outflows using interest rates of government bonds that have maturities approximating those of the related pension liability.
Actuarial gains and losses arising from experience adjustments and changes in actuarial assumptions are recognised immediately in other comprehensive income as they arise.
Past-service costs are recognised immediately in profit or loss.
Income taxes. The income tax charge is calculated on the basis of the tax laws enacted or substantively enacted by the end of the reporting period in the countries where the company’s subsidiaries and associates operate and generate taxable income, primarily Russia. The income tax charge/credit comprises current tax and deferred tax and is recognised in profit or loss for the year, except to the extent that it relates to transactions that are recognised in other comprehensive income or directly in equity. In this case, the tax is also recognised in other comprehensive income or directly in equity, respectively.
Current tax is the amount expected to be paid to or recovered from the taxation authorities in respect of taxable profits or losses for the current and prior periods. Taxes, other than on income, are recorded within operating expenses.
Deferred income tax is provided using the balance sheet liability method for tax loss carry forwards and temporary differences arising between the tax bases of assets and liabilities and their carrying amounts for financial reporting purposes. In accordance with the initial recognition exemption, deferred taxes are not recorded for temporary differences arising on initial recognition of an asset or a liability in a transaction other than a business combination if the transaction, when initially recorded, affects neither accounting nor taxable profit. Deferred tax liabilities are not recorded for temporary differences arising on initial recognition of goodwill or subsequently for goodwill which is not deductible for tax purposes. Deferred tax balances are measured at tax rates enacted or substantively enacted at the end of the reporting period which are expected to apply to the period when the temporary differences will reverse or the tax loss carry forwards will be utilised. Deferred tax assets and liabilities are netted only within the individual companies of the Group. Deferred tax assets for deductible temporary differences and tax loss carry forwards are recorded only to the extent that it is probable that future taxable profit will be available against which the deductions can be utilised.
Deferred income tax is provided on temporary differences arising from investments in subsidiaries and associates, except where the timing of the reversal of the temporary difference is controlled by the Group and it is probable that the temporary difference will not reverse in the foreseeable future.
The Group's uncertain tax positions are reassessed by management at the end of each reporting period. Liabilities are recorded for income tax positions that are determined by management as more likely than not to result in additional taxes being levied if the positions were to be challenged by the tax authorities. The assessment is based on the interpretation of tax laws that have been enacted or substantively enacted by the end of the reporting period and any known court or other rulings on such issues. Liabilities for penalties, interest and taxes other than on income are recognised based on management’s best estimate of the expenditure required to settle the obligations at the end of the reporting period.
Value added tax. Output value added tax related to sales is payable to tax authorities on the earlier of (a) collection of receivables from customers or (b) delivery of goods or services to customers. Input VAT is generally recoverable against output VAT upon receipt of the VAT invoice. The tax authorities permit the settlement of VAT on a net basis. VAT related to sales and purchases is recognised in the consolidated statement of financial position on a gross basis and disclosed separately as an asset and liability. Where provision has been made for the ECL of receivables, the impairment loss is recorded for the gross amount of the debtor, including VAT.
Provisions for liabilities and charges. Provisions for liabilities and charges are non-financial liabilities of uncertain timing or amount. They are accrued when the Group has a present legal or constructive obligation as a result of past events, it is probable that an outflow of resources will be required to settle the obligation, and a reliable estimate of the amount can be made. Where there are a number of similar obligations, the likelihood that an outflow will be required in settlement is determined by considering the class of obligations as a whole. A provision is recognised even if the likelihood of an outflow with respect to any one item included in the same class of obligations may be small.
Where the Group expects a provision to be reimbursed, for example under an insurance contract, the reimbursement is recognised as a separate asset, but only when the reimbursement is virtually certain.
Provisions are measured at the present value of the expenditures expected to be required to settle the obligation using a pre-tax rate that reflects current market assessments of the time value of money and the risks specific to the obligation. The increase in the provision due to passage of time is recognised as interest expense.

AO Holding Company METALLOINVEST Notes to the Consolidated Financial Statements for the year ended 31 December 2019 (in thousands of US dollars, unless otherwise stated)
14
2 Basis of preparation and summary of significant accounting policies (continued)
Lease liabilities. The lease liability is initially measured at the present value of fixed lease payments that are not paid at the commencement date. Lease payments are discounted using the interest rate implicit in the lease. If that rate cannot be readily determined, the lessee's individual incremental borrowing rate is used.
Lease payments associated with short-term leases of equipment and vehicles and all leases of low-value assets are recognised on a straight-line basis as an expense in profit or loss. Short-term leases are leases with a lease term of 12 months or less. Low-value assets comprise IT equipment and small items of office furniture.
Lease payments that depend on cadastral value of the property or land are variable payments that do not depend on an index or a rate, therefore these lease payments are not included in measurement of a lease liability and are recognised as an expense as they occur.
Extension options (or period after termination options) are only included in the lease term if the lease is reasonably certain to be extended (or not terminated). Lease payments to be made under reasonably certain extension options are also included in the measurement of the liability.
The lease liability is subsequently measured at amortised cost using the effective interest method and remeasured in case of change in the lease term, lease modification or revised lease payments. The amount of remeasurement is recognised as a change in the carrying value of right-of-use assets.
Lease payments are allocated between principal and finance costs. The finance costs are charged to profit or loss over the lease period so as to produce a constant periodic rate of interest on the remaining balance of the liability for each period.
Revenue recognition. Revenue is income arising in the course of the Group’s ordinary activities. Revenue is recognised in the amount of transaction price. Transaction price is the amount of consideration to which the Group expects to be entitled in exchange for transferring control over promised goods or services to a customer, excluding the amounts collected on behalf of third parties.
Sales of goods. Sales are recognised when control of the goods has transferred, being when the goods are delivered to the customer, the customer has full discretion over the goods, and there is no unfulfilled obligation that could affect the customer’s acceptance of the goods. Delivery occurs when the goods have been shipped to the specific location, the risks of obsolescence and loss have been transferred to the customer, and either the customer has accepted the goods in accordance with the contract, the acceptance provisions have lapsed, or the Group has objective evidence that all criteria for acceptance have been satisfied.
No element of financing is deemed present as the sales are made with an average credit term of 60 days, which is consistent with market practice.
Sales of transportation services. The Group provides transportation services to the customer after control over goods has passed, revenue from transportation services is considered to be a separate performance obligation and is recognised over the time of the service rendering.
Revenue from providing services is recognised in the accounting period in which the services are rendered. Revenue is recognised based on the actual service provided to the end of the reporting period as a proportion of the total services to be provided because the customer receives and uses the benefits simultaneously. This is determined based on the actual days in transit relative to the total expected days in transit.
Where the contracts include multiple performance obligations, the transaction price is allocated to each separate performance obligation based on the stand-alone selling prices.
Estimates of revenues, costs or extent of progress toward completion are revised if circumstances change. Any resulting increases or decreases in estimated revenues or costs are reflected in profit or loss in the period in which the circumstances that give rise to the revision become known by management.
The customer pays the fixed amount based on a payment schedule. If the services rendered by the Group exceed the payment, a contract asset is recognised. If the payments exceed the services rendered, a contract liability is recognised.
Financing components. The Group does not expect to have any contracts where the period between the transfer of the promised goods or services to the customer and payment by the customer exceeds one year. As a consequence, the Group does not adjust any of the transaction prices for the time value of money.

AO Holding Company METALLOINVEST Notes to the Consolidated Financial Statements for the year ended 31 December 2019 (in thousands of US dollars, unless otherwise stated)
15
2 Basis of preparation and summary of significant accounting policies (continued)
Interest income. Interest income is recorded for all debt instruments on an accrual basis using the effective interest method. This method defers, as part of interest income, all fee received between the parties to the contract that are an integral part of the effective interest rate, all other premiums or discounts.
For financial assets that are originated or purchased credit-impaired, the effective interest rate is the rate that discounts the expected cash flows (including the initial expected credit losses) to the fair value on initial recognition (normally represented by the purchase price). As a result, the effective interest is credit-adjusted.
Interest income is calculated by applying the effective interest rate to the gross carrying amount of financial assets, except for (i) financial assets that have become credit impaired (Stage 3), for which interest revenue is calculated by applying the effective interest rate to their AC, net of the ECL provision, and (ii) financial assets that are purchased or originated credit impaired, for which the original credit-adjusted effective interest rate is applied to the AC.
Earnings per share. Earnings per share are determined by dividing the profit or loss attributable to owners of the Company by the weighted average number of participating shares outstanding during the reporting year.
Accounting policies before 1 January 2019.
Operating leases. Where the Group is a lessee in a lease which does not transfer substantially all the risks and rewards incidental to ownership from the lessor to the Group, the total lease payments, including those on expected termination, are charged to profit or loss on a straight-line basis over the period of the lease.
3 Critical accounting estimates and judgements
The Group makes estimates and assumptions that affect the amounts recognised in the financial statements and the carrying amounts of assets and liabilities within the next financial year. Estimates and judgements are continually evaluated and are based on management’s experience and other factors, including expectations of future events that are believed to be reasonable under the circumstances. Management also makes certain judgements, apart from those involving estimations, in the process of applying the accounting policies. Judgements that have the most significant effect on the amounts recognised in the financial statements and estimates that can cause a significant adjustment to the carrying amount of assets and liabilities within the next financial year include:
(a) Remaining useful life of property, plant and equipment and mineral rights
The estimation of the useful lives of items of property, plant and equipment and mineral rights is a matter of judgement based on experience with similar assets. The future economic benefits embodied in assets are consumed principally through use. However, other factors, such as technical or commercial obsolescence and wear and tear, often result in a reduction of the economic benefits embodied in the assets. Management assesses remaining useful lives in accordance with the current technical conditions of the assets and estimated period during which the assets are expected to earn benefits for the Group. The following primary factors are considered: (a) expected usage of the assets; (b) expected physical wear and tear, which depends on operational factors and maintenance programme; and (c) technical or commercial obsolescence arising from changes in market conditions.
The Group extracts iron ore from land owned by government authorities. The Group obtains licences and pays exploration and production taxes to explore and produce iron ore from fields covered by the licences. The licences expire in 2034, but they may be extended at the Group’s initiative provided the Group is in compliance with licence terms. The estimated remaining useful life of some property, plant and equipment and mineral rights is beyond the expiration dates of the related licences. Management believes that the Group is currently in compliance with licence terms and will be able to extend the licences. Any changes to this assumption could significantly affect prospective depreciation and amortisation charges and asset carrying values.
(b) Obligations related to the retirement of long-lived assets
Based on the current requirements under Russian law and various contractual agreements associated with the licences and the expected life of the reserves, the Group has estimated its discounted obligations related to the retirement of its long-lived assets as immaterial.
(c) Related party transactions
In the normal course of business the Group enters into transactions with its related parties (Note 28). IFRS 9 requires initial recognition of financial instruments based on their fair values. Judgement is applied in determining if transactions are priced at market or non-market interest rates, where there is no active market for such transactions. The basis for such judgement is pricing for similar types of transactions with unrelated parties and effective interest rate analysis.

AO Holding Company METALLOINVEST Notes to the Consolidated Financial Statements for the year ended 31 December 2019 (in thousands of US dollars, unless otherwise stated)
16
3 Critical accounting estimates and judgements (continued)
(d) Tax legislation
Russian tax, currency and customs legislation is subject to varying interpretations. Refer to Note 29.
(e) Employee benefit obligations
The Group’s estimates for employee benefit obligations are based on currently available information. Actual results may differ from the estimates, and the Group’s estimates may be revised in the future, either negatively or positively. Employee benefit obligations are periodically adjusted based on updated actuarial assumptions. The principal assumptions used in valuation of employee benefit obligations are the discount rate and the inflation rate (Note 19).
(f) Fair value of financial assets
The fair value of financial assets that are not traded in an active market is determined by using valuation techniques. The Group uses its judgement to select a variety of methods and make assumptions that are mainly based on market conditions existing at the end of each reporting period. The Group has used discounted cash flow analysis for financial assets that are not traded in active markets. These calculations require the use of estimates as further detailed in Note 9 and Note 30.
(g) Stripping costs
The Group incurs waste removal costs (stripping costs) during the production phase of its surface mining operations. Stripping costs (production stripping costs) are incurred both in relation to the inventory produced in that period and the creation of improved access to the ore in the future. The former are included as part of the costs of inventory, while the latter are capitalised as a stripping activity asset, when certain criteria are met. Judgement is required to distinguish between stripping costs related to cost of inventory production and those related to a stripping activity asset.
In order to comply with IFRIC 20 “Stripping costs in the production phase of a surface mine” requirements, the Group has to identify the separate components of the ore body. A separate identifiable component is a specific volume of the iron ore body access to which is improved as a result of the stripping activities. Judgement is required to identify these components and to determine expected volumes of waste to be stripped and ore to be mined in each of identified components. Such assessments are based on the approved mine development plan.
(h) Deferred income tax asset recognition
The recognised deferred tax assets represent income taxes recoverable through future deductions from taxable profits and are recorded in the statement of financial position. Deferred income tax assets are recorded to the extent that realisation of the related tax benefit is probable. This includes temporary difference expected to reverse in the future and the availability of sufficient future taxable profit against which the deductions can be utilised. The future taxable profits and the amount of tax benefits that are probable in the future are based on the medium term business plan prepared by management and extrapolated results thereafter. The business plan is based on management expectations that are believed to be reasonable under the circumstances.
(i) ECL measurement
Measurement of ECLs is a significant estimate that involves determination methodology, models and data inputs. The following components have a major impact on credit loss allowance: definition of default, significant increase in credit risk (“SICR”), probability of default (“PD”), exposure at default (“EAD”), and loss given default (“LGD”). The Group regularly reviews and validates inputs to the models to reduce any differences between expected credit loss estimates and actual credit loss experience.
(j) Depreciation of right-of-use assets
In determining the lease term, the Group considers all facts and circumstances that create an economic incentive to exercise an extension option (or not exercise a termination option) in its perpetual administrative office lease contracts. Extension options (or periods after termination options) are only included in the lease term if the lease is reasonably certain to be extended (or not terminated). For leases of offices the following factors are normally the most relevant:
• If there are significant penalties to terminate (or not extend), the Group is typically reasonably certain to extend (or not terminate) the lease.
• If any leasehold improvements are expected to have a significant remaining value, the Group is typically reasonably certain to extend (or not terminate) the lease.
Otherwise, the Group considers other factors including historical lease durations and the costs and business disruption required to replace the leased asset.

AO Holding Company METALLOINVEST Notes to the Consolidated Financial Statements for the year ended 31 December 2019 (in thousands of US dollars, unless otherwise stated)
17
4 Adoption of new or revised standards and interpretations
Adoption of IFRS 16 Leases. Effective 1 January 2019, the Group adopted IFRS 16 “Leases” using the modified retrospective approach allowing not to restate comparative information but rather recognise the cumulative effect of the initial application on the opening retain earnings.
As at 1 January, the Group recognised right-of-use assets in amount of USD 103,025 thousand, which comprise corresponding lease liabilities.
At the transition date the lease liability was measured as the present value of the fixed contractual lease payments. Lease liabilities were discounted at a weighted average incremental borrowing rate varied from 2,88% to 8,47% depending on currency and lease contract term.
The Group used the following practical expedients when applying IFRS 16:
• Applied the exemption not to recognise right-of-use assets and liabilities for leases with less than 12 months of lease term and leases of low-value assets. The payments associated to these leases will be recognised as an expense on a straight-line basis over the lease term. Low-value assets comprise IT-equipment and small items of office furniture.
• Used hindsight when determining the lease term, to determine if the contract contains options to extend or terminate the lease.
• The use of single discount rate for a portfolio of leases with reasonably the same characteristic.
A reconciliation of future minimum operating lease payments to recognised lease liabilities is as follows:
Total future minimum lease payments for operating leases as at 31 December 2018: 299,537 Less: variable payments not based on index or rate (113,602) Less: low-value leases recognised on a straight-line basis as an expense (3,465) Less: future lease payments for operating leases with a term of less than 12 months (1,225) Effect of discounting to present value (78,220) Lease liability recognised as at 1 January 2019 103,025
A breakdown of leases recognised as right-of-use assets is as follows:
1 January 2019 Buildings 101,796 Machinery and equipment 1,229 Total leases recognised as right-of-use assets 103,025
The significant new accounting policies applied in the current period are described in Note 2.
The following amended standards became effective for the Group from 1 January 2019, but did not have any material impact on the Group:
• IFRIC 23 “Uncertainty over Income Tax Treatments” (issued on 7 June 2017 and effective for annual periods beginning on or after 1 January 2019).
• Prepayment Features with Negative Compensation – Amendments to IFRS 9 (issued on 12 October 2017 and effective for annual periods beginning on or after 1 January 2019).
• Long-term Interests in Associates and Joint Ventures – Amendments to IAS 28 (issued on 12 October 2017 and effective for annual periods beginning on or after 1 January 2019).
• Annual Improvements to IFRSs 2015-2017 cycle – amendments to IFRS 3, IFRS 11, IAS 12 and IAS 23 (issued on 12 December 2017 and effective for annual periods beginning on or after 1 January 2019).
• Amendments to IAS 19 “Plan Amendment, Curtailment or Settlement” (issued on 7 February 2018 and effective for annual periods beginning on or after 1 January 2019).

AO Holding Company METALLOINVEST Notes to the Consolidated Financial Statements for the year ended 31 December 2019 (in thousands of US dollars, unless otherwise stated)
18
5 New accounting pronouncements
Certain new standards and interpretations have been issued that are mandatory for the annual periods beginning on or after 1 January 2020 or later, and which the Group has not early adopted:
• Sale or Contribution of Assets between an Investor and its Associate or Joint Venture – Amendments to IFRS 10 and IAS 28 (issued on 11 September 2014 and effective for annual periods beginning on or after a date to be determined by the IASB).
• IFRS 17 "Insurance Contracts" (issued on 18 May 2017 and effective for annual periods beginning on or after 1 January 2021).
• Amendments to the Conceptual Framework for Financial Reporting (issued on 29 March 2018 and effective for annual periods beginning on or after 1 January 2020).
• Definition of a business – Amendments to IFRS 3 (issued on 22 October 2018 and effective for acquisitions from the beginning of annual reporting period that starts on or after 1 January 2020).
• Definition of materiality – Amendments to IAS 1 and IAS 8 (issued on 31 October 2018 and effective for annual periods beginning on or after 1 January 2020).
• Interest rate benchmark reform – Amendments to IFRS 9, IAS 39 and IFRS 7 (issued on 26 September 2019 and effective for annual periods beginning on or after 1 January 2020).
• Classification of liabilities as current or non-current – Amendments to IAS 1 (issued on 23 January 2020 and effective for annual periods beginning on or after 1 January 2022).
Unless otherwise described above, the new standards and interpretations are not expected to affect significantly the Group’s consolidated financial statements.
6 Segment information
Operating segments are components that engage in business activities that may earn revenues or incur expenses, whose operating results are regularly reviewed by the chief operating decision maker (CODM) and for which discrete financial information is available. The functions of the CODM are performed by the senior management board of the Group.
Management has determined the operating segments based on the types of products produced and services provided and from which each reportable segment derives its revenues. The development and approval of strategies, market and risk analysis, setting of goals are undertaken in line with the segments determined.
The Group is organised on the basis of the following reportable operating segments:
• Mining – production and sale of iron ore products and co-products (includes LGOK and MGOK);
• Steel – production and sale of ferrous metal products (includes OEMK, Ural Steel and OOO Ural Scrap Company);
• Trading – overseas trading of the Group’s products (includes Metalloinvest Trading AG, Metalloinvest Logistics DWC LLC and Metalloinvest Logistics AG).
Other activities have been included in the “All other segments” column. These activities include central management, certain services and investment activities, activities of Hamriyah Steel FZC and KMA-Energosbyt.
The CODM reviews management accounting information which is based on the financial information prepared in accordance with Russian accounting standards (RAS) or IFRS and adjusted to meet internal reporting requirements. Such financial information differs in certain aspects from the information presented in accordance with IFRS.
Sales between segments are carried out at arm’s length. Revenue from external parties reported to the CODM of the Group is measured in a manner consistent with that in profit or loss.
The CODM evaluates the performance of each segment and the overall performance of the Group based on Management EBITDA and Adjusted EBITDA. Management EBITDA is determined based on management accounting information, while Adjusted EBITDA is determined based on IFRS accounts. EBITDA is calculated as profit before tax adjusted for depreciation and amortisation, foreign exchange gain or loss, interest income and expense and certain other non-cash and extraordinary items. Since EBITDA is not a standard IFRS measure, the Group’s definition may differ from that of other companies.

AO Holding Company METALLOINVEST Notes to the Consolidated Financial Statements for the year ended 31 December 2019 (in thousands of US dollars, unless otherwise stated)
19
6 Segment information (continued)
In 2019, the Group started integration of IFRS principles into management accounting. Accordingly, since 2019, Management EBITDA of the mining and other segments (previously calculated based on RAS figures) includes an adjustments for capitalisation of stripping costs, lease expenses and other not material IFRS adjustments. Previously these items were included in a reconciliation of Management to Adjusted EBITDA. Comparative information was not restated. As at 31 December 2019 measurement of Management EBITDA of the steel and trading segments has not yet changed.
Segment financial information reviewed by the CODM includes working capital as a measure of reportable segments’ assets. Working capital consists of inventories and certain receivables and payables. Working capital is determined based on management accounting information. Since working capital is not a standard IFRS measure, the Group’s definition may differ from that of other companies. Starting from 2019 Working capital of the steel segment includes an adjustment for the unrealised profits. Previously this was included in a reconciliation of Working capital to the total consolidated assets. Comparative information was not restated.
Segment information for the year ended 31 December 2019 is as follows:
Mining Steel Trading All other
segments Eliminations Total 2019 External revenue 1,614,891 1,466,223 3,650,073 229,186 - 6,960,373 Inter-segment revenue 2,303,457 1,400,158 36 555,086 (4,258,737) - Total revenue 3,918,348 2,866,381 3,650,109 784,272 (4,258,737) 6,960,373 Adjusted EBITDA 2,425,655 118,238 (18,146) (11,960) - 2,513,787 Management EBITDA 2,391,529 69,722 (11,937) 35,237 - 2,484,551 Depreciation and amortization 175,825 70,660 137 93,992 - 340,614 Interest income 42,516 5,897 377 122,947 - 171,737 Inter-segment interest income 9,276 58,021 - 55,906 (123,203) - Interest expense 89,606 31,500 9,093 122,105 - 252,304 Inter-segment interest expense 49,090 29,969 - 44,144 (123,203) - Income tax charge/(credit) 442,430 22,585 (1,125) 15,001 - 478,891 Working capital 454,158 246,950 (22,948) 93,366 - 771,526 Capital expenditure 251,790 119,487 581 22,291 - 394,149
Segment information for the year ended 31 December 2018 is as follows:
Mining Steel Trading All other
segments Eliminations Total 2018 External revenue 1,651,673 1,546,396 3,688,831 300,123 - 7,187,023 Inter-segment revenue 2,023,385 1,932,439 69,538 563,410 (4,588,772) - Total revenue 3,675,058 3,478,835 3,758,369 863,533 (4,588,772) 7,187,023 Adjusted EBITDA 2,266,513 653,681 42,173 (28,332) - 2,934,035 Management EBITDA 2,188,703 697,859 19,844 2,772 - 2,909,178 Depreciation and amortization 119,240 69,047 452 36,274 - 225,013 Interest income 7,658 24,846 473 67,682 - 100,659 Inter-segment interest income 26,155 44,362 - 64,278 (134,795) - Interest expense 114,586 34,858 14,417 126,540 - 290,401 Inter-segment interest expense 60,196 42,845 - 31,754 (134,795) - Income tax charge/(credit) 357,368 107,952 (833) 10,610 - 475,097 Working capital 377,521 452,493 (91,860) 93,574 - 831,728 Capital expenditure 212,925 82,678 114 34,533 - 330,250

AO Holding Company METALLOINVEST Notes to the Consolidated Financial Statements for the year ended 31 December 2019 (in thousands of US dollars, unless otherwise stated)
20
6 Segment information (continued)
A reconciliation of EBITDA to profit for the year is as follows:
2019 2018 Management EBITDA for reportable segments 2,449,314 2,906,406 All other segments Management EBITDA 35,237 2,772 Total Management EBITDA 2,484,551 2,909,178 Adjustments to EBITDA arising from differences in management accounting and requirements of IFRS: Capitalisation of elements of cost of non-current assets recognised as expenses in profit or loss in management accounting - 46,749 Reverse of expenses in profit or loss recognised as non-current assets in management accounting 1,060 38 Additional (loss)/gain on disposal of property, plant and equipment (445) 38 Unrealised profits adjustment 30,071 (80,099) Effect arising from differences in management accounting and requirements of IFRS at the foreign trader (10,294) 26,746 Employee benefit obligations adjustment 2,314 18,002 Other adjustments 6,530 13,383 Total Adjusted EBITDA 2,513,787 2,934,035 Other reconciling items: Depreciation and amortisation (312,308) (290,331) Finance income 203,558 118,454 Finance costs (361,554) (333,182) Foreign exchange gain/(loss) 132,551 (281,643) Change in credit loss allowance on loans advanced, net 14,419 (19,429) Change in credit loss allowance on accounts receivable, net 20,817 (19,345) Other 7,282 Income tax charge (487,552) (461,378) Profit for the year 1,731,000 1,647,181
A reconciliation of working capital to total assets is as follows:
31 December
2019 31 December
2018 Working capital for reportable segments 678,160 738,154 All other segments working capital 93,366 93,574 Segment liabilities for reportable and other segments 509,376 647,592 Unrealised profits adjustment 11,504 (73,181) Recognition of prepaid expenses in profit or loss for the year (103) (110) Additional provision for impairment of inventory (4,124) (3,986) Additional provision for impairment of receivables - (19,345) Recognition of current assets recognised as non-current assets in management accounting - 7,273 Other (190) (1,859) Unallocated:
Non-current assets 6,594,112 4,727,273 Cash and cash equivalents 303,664 693,087 Current loans advanced 240,090 -
Total consolidated assets 8,425,855 6,808,472
Substantially all of the Group’s non-current non-financial assets are located in Russia. Non-current non-financial assets located in foreign countries are mainly represented by assets of Hamriyah Steel FZC (UAE), which are fully impaired at 31 December 2019 and 2018.
The Group’s revenues are analysed by products in Note 21.
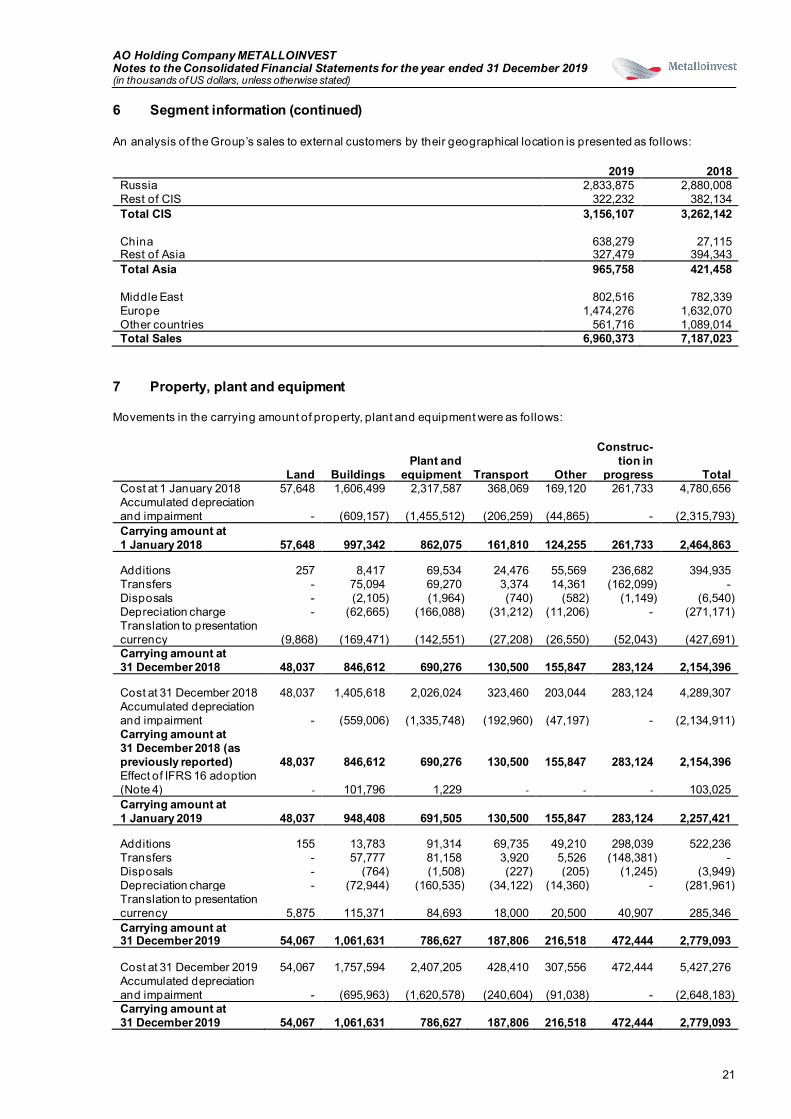
AO Holding Company METALLOINVEST Notes to the Consolidated Financial Statements for the year ended 31 December 2019 (in thousands of US dollars, unless otherwise stated)
21
6 Segment information (continued)
An analysis of the Group’s sales to external customers by their geographical location is presented as follows:
2019 2018 Russia 2,833,875 2,880,008 Rest of CIS 322,232 382,134 Total CIS 3,156,107 3,262,142 China 638,279 27,115 Rest of Asia 327,479 394,343 Total Asia 965,758 421,458 Middle East 802,516 782,339 Europe 1,474,276 1,632,070 Other countries 561,716 1,089,014 Total Sales 6,960,373 7,187,023
7 Property, plant and equipment
Movements in the carrying amount of property, plant and equipment were as follows:
Land Buildings Plant and
equipment Transport Other
Construc-tion in
progress Total Cost at 1 January 2018 57,648 1,606,499 2,317,587 368,069 169,120 261,733 4,780,656 Accumulated depreciation and impairment - (609,157) (1,455,512) (206,259) (44,865) - (2,315,793) Carrying amount at 1 January 2018 57,648 997,342 862,075 161,810 124,255 261,733 2,464,863 Additions 257 8,417 69,534 24,476 55,569 236,682 394,935 Transfers - 75,094 69,270 3,374 14,361 (162,099) - Disposals - (2,105) (1,964) (740) (582) (1,149) (6,540) Depreciation charge - (62,665) (166,088) (31,212) (11,206) - (271,171) Translation to presentation currency (9,868) (169,471) (142,551) (27,208) (26,550) (52,043) (427,691) Carrying amount at 31 December 2018 48,037 846,612 690,276 130,500 155,847 283,124 2,154,396 Cost at 31 December 2018 48,037 1,405,618 2,026,024 323,460 203,044 283,124 4,289,307 Accumulated depreciation and impairment - (559,006) (1,335,748) (192,960) (47,197) - (2,134,911) Carrying amount at 31 December 2018 (as previously reported) 48,037 846,612 690,276 130,500 155,847 283,124 2,154,396 Effect of IFRS 16 adoption (Note 4) - 101,796 1,229 - - - 103,025 Carrying amount at 1 January 2019 48,037 948,408 691,505 130,500 155,847 283,124 2,257,421 Additions 155 13,783 91,314 69,735 49,210 298,039 522,236 Transfers - 57,777 81,158 3,920 5,526 (148,381) - Disposals - (764) (1,508) (227) (205) (1,245) (3,949) Depreciation charge - (72,944) (160,535) (34,122) (14,360) - (281,961) Translation to presentation currency 5,875 115,371 84,693 18,000 20,500 40,907 285,346 Carrying amount at 31 December 2019 54,067 1,061,631 786,627 187,806 216,518 472,444 2,779,093 Cost at 31 December 2019 54,067 1,757,594 2,407,205 428,410 307,556 472,444 5,427,276 Accumulated depreciation and impairment - (695,963) (1,620,578) (240,604) (91,038) - (2,648,183) Carrying amount at 31 December 2019 54,067 1,061,631 786,627 187,806 216,518 472,444 2,779,093

AO Holding Company METALLOINVEST Notes to the Consolidated Financial Statements for the year ended 31 December 2019 (in thousands of US dollars, unless otherwise stated)
22
7 Property, plant and equipment (continued)
At 31 December 2019, carrying value of capitalised stripping activity asset was USD 190,052 thousand (31 December 2018: USD 135,824 thousand) included in Other property, plant and equipment.
At 31 December 2019, certain bank borrowings were secured by items of property, plant and equipment with the carrying amount of USD 604 thousand (31 December 2018: USD 559 thousand).
In 2019 the Group capitalised borrowing costs of USD 14,183 thousand (2018: USD 13,038 thousand) in property, plant and equipment at the capitalisation rate of 6.54% (2018: 8.31%).
In 2019 depreciation of right-of-use assets amounted to USD 9,603 thousand; at 31 December 2019 carrying value of right-of-use assets was USD 109,672 thousand and included mainly in Buildings category.
8 Intangible assets and goodwill
Acquired and internally generated
software licences Licenced
technology Total Cost at 1 January 2018 42,973 6,745 49,718 Accumulated amortisation and impairment (26,805) (3,208) (30,013) Carrying amount at 1 January 2018 16,168 3,537 19,705 Additions 33,831 129 33,960 Disposals - - - Amortisation charge (3,925) (220) (4,145) Translation to presentation currency (6,285) (606) (6,891) Carrying amount at 31 December 2018 39,789 2,840 42,629 Cost at 31 December 2018 54,821 3,153 57,974 Accumulated amortisation and impairment (15,032) (313) (15,345) Carrying amount at 31 December 2018 39,789 2,840 42,629 Additions 24,188 - 24,188 Disposals - - - Amortisation charge (10,848) (211) (11,059) Translation to presentation currency 5,416 336 5,752 Carrying amount at 31 December 2019 58,545 2,965 61,510 Cost at 31 December 2019 72,842 3,539 76,381 Accumulated amortisation and impairment (14,297) (574) (14,871) Carrying amount at 31 December 2019 58,545 2,965 61,510
In 2019 the Group capitalised borrowing costs of USD 708 thousand (2018: USD 2,346 thousand) in intangible assets at the capitalisation rate of 6.54% (2018: 8.31%).
Mineral rights
Movements in the carrying amount of mineral rights were as follows:
2019 2018 Carrying amount at 1 January 542,708 675,593 Additions - 14,060 Amortisation charge (32,405) (33,309) Translation to presentation currency 64,842 (113,636) Carrying amount at 31 December 575,145 542,708

AO Holding Company METALLOINVEST Notes to the Consolidated Financial Statements for the year ended 31 December 2019 (in thousands of US dollars, unless otherwise stated)
23
8 Intangible assets (continued)
Goodwill
Goodwill is allocated to the Group’s cash-generating units (CGUs), which represent the lowest level within the Group at which the goodwill is monitored by management, as follows:
CGU 1 January
2018
Currency translation difference
31 December 2018
Currency translation difference
31 December 2019
MGOK 203,371 (34,750) 168,621 20,605 189,226 LGOK 98,754 (16,874) 81,880 10,006 91,886 Ruslime 13,146 (2,246) 10,900 1,332 12,232 Zheleznogorsky Brick Plant 6,789 (1,160) 5,629 688 6,317 TOREX 3,316 (567) 2,749 337 3,086 Total amount of goodwill 325,376 (55,597) 269,779 32,968 302,747
For the purpose of annual impairment testing of goodwill related to CGUs LGOK and MGOK as at 31 December 2019, management decided to use the most recent detailed calculations of these СGUs’ recoverable amounts made in a preceding period as these calculations substantially exceeded carrying amounts of the CGUs and there were no significant changes in the assets, liabilities and underlying businesses of the CGUs in 2019.
The recoverable amount of a CGU is determined based on value-in-use calculations. These calculations used pre-tax cash-flow projections based on financial budgets approved by management and forecasts for a 10-12 year period and considering a number of factors including production volumes forecasts, future sales prices, foreign currency exchange rates, etc. Cash flows beyond this period were extrapolated using estimated terminal growth rates.
For MGOK and LGOK CGUs the range of key assumptions for a forecasted period used in the most recent value-in-use calculations as at 31 December 2018 were as follows:
31 December
2018 Iron ore price(1), USD/t 67-78 Foreign exchange rate, RUB/USD 67-75 Consumer price index, % 3.3-4.0 Terminal growth rate, % 4.0 Pre-tax discount rate, % 17.2-18.3
(1) 62%Fe, CFR China
The range of key assumptions for a forecasted period used for value-in-use calculations of the remaining CGUs were as follows:
31 December
2019 31 December
2018 Consumer price index, % 3.4-4.0 3.3-4.0 Terminal growth rate, % 3.9 4.0 Pre-tax discount rate, % 15.4-16.9 17.2-18.3
Production volumes. Estimated production volumes are based on historical data, current capacity and utilisation rates, taking into account some development plans established by management. The production flows of each CGU are computed using appropriate individual economic models.
Sales prices for iron ore products, pellets and HBI are projected in accordance with pricing formulas used in existing sales agreements which are linked to global price indices and foreign exchange rates. These assumptions are based on consensus forecasts prepared by investment banks and analytical agencies.
EBITDA margin is based on current margin levels with adjustments made to reflect expected changes in sales prices for iron ore, key raw materials and changes in the sales mix.
Consumer price index is an average cash costs growth rate for the Russian Federation based on recent available government forecasts and industry reports for short-term and long-term periods.
Based on the results of these calculations the Group concluded that at 31 December 2019 and 2018 no impairment charge was required. If the estimated annual growth rate and the pre-tax discount rate applied to the cash flows of the CGUs had been 2% lower and 2% higher, respectively, than management estimates goodwill would still have not been impaired.

AO Holding Company METALLOINVEST Notes to the Consolidated Financial Statements for the year ended 31 December 2019 (in thousands of US dollars, unless otherwise stated)
24
9 Equity investments
2019 2018 At 1 January 350,502 428,863 Fair value gain/(loss) 14,089 (16,603) Translation difference 36,890 (61,758) At 31 December 401,481 350,502
31 December
2019 31 December
2018 Listed securities: Nautilus Minerals Inc x 5,042 Unlisted securities: Nautilus Minerals Inc
- x
OOO South Ural Mining & Processing Works 59,606 45,432 AO HC BMC 341,875 300,028 Total 401,481 350,502
Nautilus Minerals Inc. is an exploration stage company engaged in exploration and development of the ocean floor for copper and gold rich seafloor massive sulphide deposits in the western Pacific Ocean. Nautilus Minerals Inc. is registered in Canada.
As at 31 December 2018 the market value of the Group’s interest in Nautilus Minerals Inc. (approximately 19.2%) based on Toronto Stock Exchange (TSX) quotation was USD 5,042 thousand. In 2019 Nautilus Minerals Inc. entered into an insolvency proceeding and was delisted from TSX. As at 31 December 2019, the Group measured its investment in Nautilus Minerals Inc. as nil. In 2019 the Group recognised a fair value loss of USD 5,042 thousand (2018: loss of USD 10,998 thousand) in respect of the investment in other comprehensive income.
OOO South Ural Mining & Processing Works. At 31 December 2019 and 2018, the Group holds a 19.9% share in OOO South Ural Mining & Processing Works, a cement producer.
OOO South Ural Mining & Processing Works is a limited liability company and is not publicly traded. The fair value of the investment is estimated by reference to the projected cash flows discounted at the post-tax RUB-nominated rate of 14.81% (2018: 15.85%) based on the market interest rates.
In 2019 the Group recognised a fair value gain of USD 14,174 thousand (2018: loss of USD 6,072 thousand) in other comprehensive income.
At 31 December 2019, if the post-tax RUB-nominated rate was 1.0% (31 December 2018: 1.0%) lower/higher with all other variables held constant, the estimated fair value of the investment would have been USD 11,065 thousand higher and USD 9,208 thousand lower, respectively (31 December 2018: USD 6,773 thousand higher and USD 5,753 thousand lower, respectively).
As at 31 December 2019 and 2018, the Group’s share in OOO South Ural Mining & Processing Works is pledged to third parties as collateral with respect to the investee’s obligations. Management does not expect any losses associated with this pledge.
AO HC BMC is a development stage company engaged in development of the Udokan copper deposit in Russia. AO HC BMC is not publicly traded.
At 31 December 2018, the Group held a 19.15% share in AO HC BMC. In 2019 share capital of AO HC BMC was increased and as a result the Group’s share was diluted to 17.93%.
At 31 December 2019, the fair value of the investment is determined by estimating cash flows of AO HC BMC in nominal terms for a period till 2035, cash flows beyond this period were extrapolated using estimated terminal growth rate. At 31 December 2018, the fair value of the investment was determined by estimating cash flows of AO HC BMC in real terms for a period till 2046. Changes in the DCF model were introduced in order to make the model used for the fair value assessment consistent with the financial model provided to the banks that arranged financing to AO HC BMC for the development of the project.
The discounted cash flows models are based on the capital expenditure budgets for the first stage of the development of the Udokan copper deposit with the capacity of 12 million tons of ore per year, mine-plan prepared with the help of technical consultant and long-term copper and silver price consensus forecast, provided by analytical agencies.

AO Holding Company METALLOINVEST Notes to the Consolidated Financial Statements for the year ended 31 December 2019 (in thousands of US dollars, unless otherwise stated)
25
9 Equity investments (continued)
In 2019 the Group recognised a fair value gain of USD 4,957 thousand (2018: gain of USD 468 thousand) in respect of the investment in other comprehensive income.
The key assumptions used to determine fair value to which the calculation is the most sensitive include:
31 December
2019 31 December
2018 Amount of capital expenditure required to complete the construction of mining and metallurgical facilities, USD million (2019: nominal terms, 2018: real terms)
1,166 1,184
Copper price, USD/t 7,130-7,408 for 2022-2023
with further increase on inflation 6,400 (real long-
term price) USD-nominated discount rate, % (2019: nominal terms, 2018: real terms) 11.58 10.27
RUB/USD exchange rate 65.3-70 for 2020-2024
with further increase by 1,7% p.a. 64 Terminal growth rate, % 2.17 x
At 31 December 2019 the sensitivity of the fair value assessment to these parameters is as follows:
Change in assumption: future copper prices (5%) (2.5%) 0% 2.5% 5% Fair value 283,673 312,782 341,875 370,984 400,076 Change in assumption: discount rate (1.0%) (0.5%) 0% 0.5% 1.0% Fair value 408,815 373,552 341,875 313,267 287,292 Change in assumption: the level of capital expenditure (10%) (5%) 0% 5% 10% Fair value 368,060 354,975 341,875 328,742 315,593 Change in assumption: USD exchange rate (10%) (5%) 0% 5% 10% Fair value 258,151 302,218 341,875 377,752 410,382
10 Loans advanced
31 December 2019
31 December 2018
Long-term Loans advanced to related parties 2,354,443 1,286,426 Loans advanced to third parties 3,162 3,566 Less: credit loss allowance (16,139) (14,116) Total long-term loans advanced 2,341,466 1,275,876 Short-term Loans advanced to related parties 248,447 22,210 Less: credit loss allowance (8,357) (22,210) Total short-term loans advanced 240,090 - Total loans advanced 2,581,556 1,275,876
The carrying amounts of the Group’s loans advanced are denominated in the following currencies:
31 December
2019 31 December
2018 RUB 1,772,883 1,006,914 USD 808,673 268,962 Total 2,581,556 1,275,876
Loans advanced bear contractual interest rates ranging as follows:
Currency Year end
interest rate 31 December
2019 Year end
interest rate 31 December
2018 Fixed interest rates USD 6.7%-7.1% 808,673 6.8%-10% 268,962 RUB 1.0%-10.6% 1,772,883 5.5%-10.3% 1,006,914 Total 2,581,556 1,275,876

AO Holding Company METALLOINVEST Notes to the Consolidated Financial Statements for the year ended 31 December 2019 (in thousands of US dollars, unless otherwise stated)
26
10 Loans advanced (continued)
At 31 December 2019, the fair values of loans advanced exceeded their carrying values by USD 96,886 thousand. At 31 December 2018 the fair values of loans advanced were lower than their carrying values by USD 16,663 thousand.
The following table discloses the changes in the credit loss allowance and gross carrying amount for loans carried at amortised cost between the beginning and the end of the year:
Credit loss allowance Gross carrying amount Stage 1 Stage 3
Total
Stage 1 Stage 3
Total (12-months
ECL)
(lifetime ECL for credit impaired)
(12-months ECL)
(lifetime ECL for credit impaired)
At 1 January 2018 (11,340) (8,220) (19,560) 865,374 8,220 873,594 Transfer to credit-impaired (from Stage 1 to Stage 3) 15,737 (15,737) - (15,737) 15,737 - New originated and other increases in the gross carrying amount (24,242) - (24,242) 1,875,677 - 1,875,677 Derecognised during the period and other decreases in the gross carrying amount 4,813 - 4,813 (1,296,771) - (1,296,771) Total movements with impact on credit loss allowance charge for the year (3,692) (15,737) (19,429) 563,169 15,737 578,906 Foreign exchange and currency translation differences, net 1,831 832 2,663 (139,466) (832) (140,298) At 31 December 2018 (13,201) (23,125) (36,326) 1,289,077 23,125 1,312,202 New originated and other increases in the gross carrying amount (4,504) - (4,504) 1,328,524 - 1,328,524 Derecognised during the period and other decreases in the gross carrying amount 1,929 16,994 18,923 (160,431) (16,994) (177,425) Total movements with impact on credit loss allowance charge for the year (2,575) 16,994 14,419 1,168,093 (16,994) 1,151,099 Foreign exchange and currency translation differences, net (1,412) (1,177) (2,589) 141,574 1,177 142,751 At 31 December 2019 (17,188) (7,308) (24,496) 2,598,744 7,308 2,606,052
11 Other non-current assets
31 December
2019 31 December
2018 Long-term receivables 9,523 6,249 Total financial assets within other non-current assets 9,523 6,249 Advances to suppliers of property, plant and equipment 54,219 30,365 Less: provision for impairment of advances to suppliers (34) (192) Advances to suppliers of property, plant and equipment, net 54,185 30,173 Other 3,019 2,536 Total other non-current assets 66,727 38,958

AO Holding Company METALLOINVEST Notes to the Consolidated Financial Statements for the year ended 31 December 2019 (in thousands of US dollars, unless otherwise stated)
27
12 Inventories
31 December
2019 31 December
2018 Raw materials 327,635 380,577 Work in progress 36,237 72,398 Semi-finished and finished products 237,819 227,559 Total 601,691 680,534
At 31 December 2019, no inventories were pledged as security for borrowings (31 December 2018: USD 98,301 thousand).
In 2019 the Group recognised inventory write-down to net realisable value of USD 35 thousand in cost of sales in the statement of profit or loss and other comprehensive income. In 2018 the Group recognised reversal of a previous inventory write-down of USD 464 thousand.
13 Trade and other receivables
31 December
2019 31 December
2018 Trade receivables 519,154 567,565 Less credit loss allowance (6,839) (24,777) Trade receivables, net 512,315 542,788 Other financial receivables 2,121 6,961 Less: credit loss allowance (960) (2,137) Other receivables, net 1,161 4,824 Total financial assets within trade and other receivables 513,476 547,612 VAT 94,084 84,704 Advances to suppliers 65,883 60,289 Other receivables 10,275 4,554 Other taxes receivable 849 1,789 Total trade and other receivables 684,567 698,948
The carrying amounts of trade and other receivables approximate their fair values.
At 31 December 2019, no trade receivables arising from export contracts (31 December 2018: 50,927 thousand USD) were pledged as security for borrowings.
At 31 December 2019, trade and other receivables of USD 117,216 thousand (31 December 2018: USD 58,840 thousand) were past due but not impaired. These receivables relate to a number of independent customers and other debtors for whom the Group expects full repayment.
As at 31 December 2019, ageing of trade and other receivables was as follows:
Current Up to 3
months 3 to 12
months Over 12 months
31 December 2019
Trade receivables 395,311 103,828 11,550 8,465 519,154 Less credit loss allowance - - (24) (6,815) (6,839) Trade receivables – net 395,311 103,828 11,526 1,650 512,315 Other financial receivables 949 18 189 965 2,121 Less: credit loss allowance - - - (960) (960) Other receivables – net 949 18 189 5 1,161 Total financial assets within trade and other receivables 396,260 103,846 11,715 1,655 513,476

AO Holding Company METALLOINVEST Notes to the Consolidated Financial Statements for the year ended 31 December 2019 (in thousands of US dollars, unless otherwise stated)
28
13 Trade and other receivables (continued)
As at 31 December 2018, ageing of trade and other receivables was as follows:
Current Up to 3
months 3 to 12
months Over 12 months
31 December 2018
Trade receivables 503,587 57,128 413 6,437 567,565 Less credit loss allowance (19,345) (22) - (5,410) (24,777) Trade receivables – net 484,242 57,106 413 1,027 542,788 Other financial receivables 4,530 966 106 1,359 6,961 Less: credit loss allowance - (820) - (1,317) (2,137) Other receivables – net 4,530 146 106 42 4,824 Total financial assets within trade and other receivables
488,772
57,252
519
1,069 547,612
The following table explains the changes in the credit loss allowance for trade and other financial receivables under ECL model between the beginning and the end of the annual period:
2019 2018 Trade receivables At 1 January 24,777 14,347 Provision for impaired receivables during the year 755 19,650 Receivables written off during the year as uncollectible (5) (5,398) Unused amounts reversed (20,656) (2,545) Translation to presentation currency 1,968 (1,277) At 31 December 6,839 24,777
Other financial receivables At 1 January 2,137 3,079 Provision for impaired receivables during the year 465 581 Receivables written off during the year as uncollectible - (874) Unused amounts reversed (1,841) (168) Translation to presentation currency 199 (481) At 31 December 960 2,137
The Group does not hold any collateral as security.
The carrying amounts of the Group's trade and other receivables are denominated in the following currencies:
31 December
2019 31 December
2018 RUB 398,510 427,688 USD 216,060 223,054 EUR 44,419 40,258 Other currencies 25,578 7,948 Total 684,567 698,948
14 Cash and cash equivalents
Cash and cash equivalents comprise the following:
31 December
2019 31 December
2018 Cash on hand 216 362 RUB-denominated balances with banks 11,836 36,909 Foreign currency denominated balances with banks 80,578 271,954 Foreign currency denominated bank deposits 24,898 360,031 RUB-denominated bank deposits 186,136 23,831 Total 303,664 693,087

AO Holding Company METALLOINVEST Notes to the Consolidated Financial Statements for the year ended 31 December 2019 (in thousands of US dollars, unless otherwise stated)
29
14 Cash and cash equivalents (continued)
At 31 December 2019, foreign currency bank deposits denominated in USD bear an annual interest rate of 0.01%-0.9% (31 December 2018: 0.7%-1.6%). At 31 December 2019, there were no EUR-denominated bank deposits. At 31 December 2018, foreign currency bank deposits denominated in EURO bear an annual interest rate of 0.01%-0.55%. At 31 December 2019, RUB-denominated bank deposits bear an annual interest rate of 1%-6.05% (31 December 2018: 5.75%-7.5%).
At 31 December 2019 and 2018, no cash was restricted.
15 Share capital and other reserves
At 31 December 2019 and 2018, the Company’s share capital consists of one class of shares, ordinary shares, totalling 74,917,060 thousand shares with par value of RUB 0.05 or USD 0.0017 per share. All issued ordinary shares are fully paid. At 31 December 2019 and 2018, share capital includes an adjustment for the effect of hyperinflation of USD 49,207 thousand.
Par value,
USD
Number of outstanding
shares, thousand
Ordinary shares, USD thousand
Issued and fully paid
share capital, USD thousand
At 31 December 2019 0.0017 74,917,060 176,382 176,382 At 31 December 2018 0.0017 74,917,060 176,382 176,382
At 31 December 2019 and 2018, the total authorised number of ordinary shares (including issued and fully paid) is 154,616,060 thousand shares with a par value of RUB 0.05 or USD 0.0017 per share.
All ordinary shares rank equally with regard to the Company’s residual assets. The holders of ordinary shares are entitled to receive dividends as declared and are entitled to one vote per share at the Company’s annual and extraordinary shareholders meetings.
Dividends declared and paid during the year were as follows:
2019 2018 Dividends payable at 1 January - - Dividends declared during the year 300,909 439,092 Dividends paid during the year (302,863) (434,682) Currency translation difference 1,954 (4,410) Dividends payable at 31 December - - Dividends per share declared during the year, in USD 0.0040 0.0059
All dividends were declared and paid in Russian roubles.
In accordance with Russian legislation, the Company distributes profits as dividends on the basis of financial statements prepared in accordance with Russian Accounting Standards. The Company’s statutory accounting reports are the basis for profit distribution and other appropriations. Russian legislation identifies the basis of distribution as the net profit. The Company’s net statutory profit for 2019, as reported in the annual statutory reporting forms was USD 1,024,012 thousand (2018: net statutory profit of USD 725,893 thousand) and the closing balance of the accumulated profit, including the current year net statutory result, totalled USD 1,426,489 thousand (31 December 2018: USD 597,850 thousand). However, this legislation and other statutory laws and regulations are open to legal interpretation and, accordingly, management believes that at present it would not be appropriate to disclose an amount for the distributable reserves in these financial statements.
Other reserves
Equity
investments
Currency translation differences Total
Balance at 1 January 2018 (2,985) (1,681,861) (1,684,846) Currency translation differences - (293,648) (293,648) Fair value loss on equity investments (16,603) - (16,603) Balance at 31 December 2018 (19,588) (1,975,509) (1,995,097) Currency translation differences - 293,995 293,995 Fair value gain on equity investments 14,089 - 14,089 Balance at 31 December 2019 (5,499) (1,681,514) (1,687,013)

AO Holding Company METALLOINVEST Notes to the Consolidated Financial Statements for the year ended 31 December 2019 (in thousands of US dollars, unless otherwise stated)
30
16 Short-term and long-term borrowings
31 December
2019 31 December
2018 Long-term borrowings 2,359,260 2,125,997 Guaranteed notes 797,735 1,129,531 Unsecured corporate bonds 725,715 574,767 Total long-term borrowings 3,882,710 3,830,295 Short-term borrowings 35,679 44,386 Short-term part of guaranteed notes 6,467 10,314 Short-term part of unsecured corporate bonds 19,174 16,757 Bank overdraft 680 149,228 Total short-term borrowings 62,000 220,685 Total 3,944,710 4,050,980
The carrying amounts of the Group’s borrowings are denominated in the following currencies:
31 December
2019 31 December
2018 RUB 1,319,210 1,221,105 USD 1,818,686 2,547,965 EUR 806,814 281,910 Total 3,944,710 4,050,980
a) Bank borrowings and overdrafts
Bank borrowings and overdrafts bear interest rates ranging as follows:
Currency Year end
interest rate 31 December
2019 Year end
interest rate 31 December
2018 Floating interest rates USD 3.4%-3.8% 1,014,484 3.5%-6.5% 1,408,120 EUR 0.4%-1.1% 253,028 0.4%-1.1% 281,910 1,267,512 1,690,030 Fixed interest rates EUR 1.0%-1.4% 553,786 - - RUB 7.8%-11.7% 574,321 8.5%-11.7% 629,581 1,128,107 629,581 Total 2,395,619 2,319,611
At 31 December 2019, the long-term borrowings of USD 1,567,214 thousand (31 December 2018: USD 1,258,210 thousand) and short-term borrowings of USD 418 thousand (31 December 2018: USD 697 thousand) were secured by certain sales transactions between the Group’s entities. The short-term borrowings of USD 19 thousand were secured by property, plant and equipment (31 December 2018: USD 189 thousand and long-term borrowings of USD 16 thousand).
At 31 December 2018, bank overdrafts of USD 149,228 thousand were secured by inventories and export proceeds arising from revenue contracts (Notes 12, 13).
At 31 December 2019, the fair values of borrowings exceeded their carrying amounts by USD 65,074 thousand (31 December 2018: USD 74,339 thousand).
b) Guaranteed notes
At 31 December 2019, the Group’s guaranteed notes include USD 800,000 thousand 4.85% guaranteed notes issued in May 2017 with maturity in 2024.
In May and October 2019 the Group repaid USD 332,729 thousand of 5.625% guaranteed notes issued in April 2013 ahead of schedule. The Group paid a premium of USD 5,773 thousand due to early repayment of 5.625% guaranteed notes.
The market value of the guaranteed notes as at 31 December 2019 was USD 866,006 thousand (31 December 2018: USD 1,112,695 thousand).
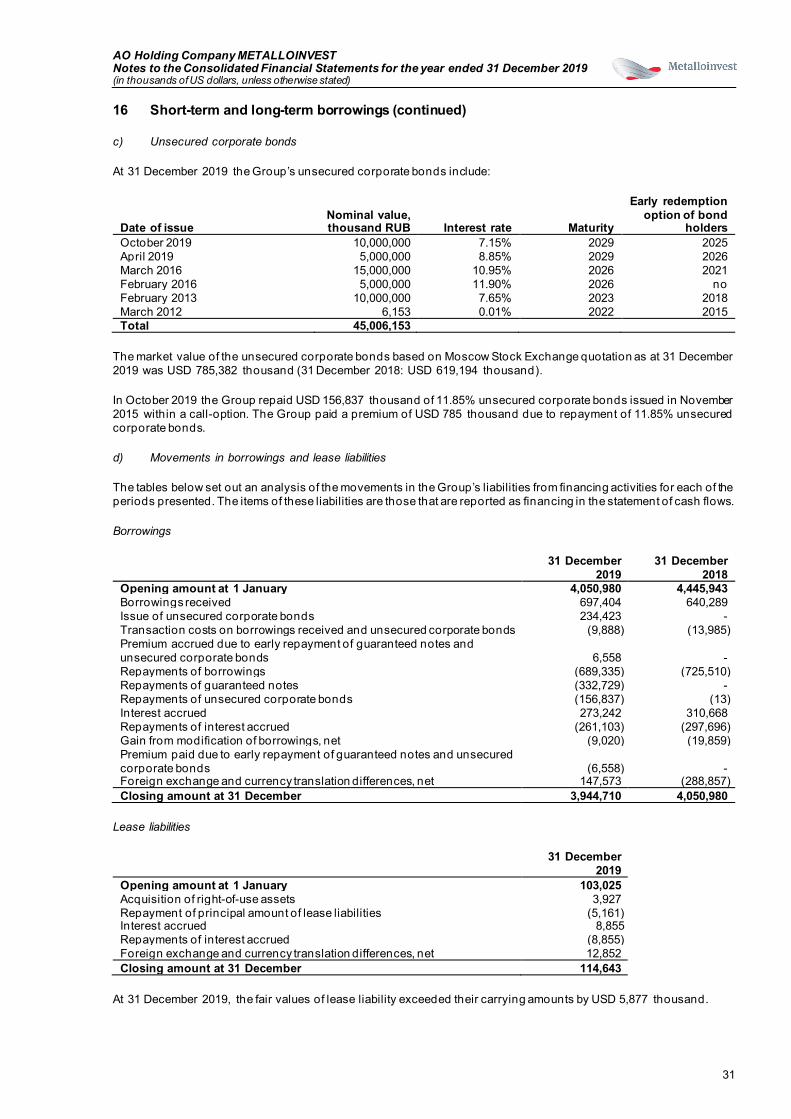
AO Holding Company METALLOINVEST Notes to the Consolidated Financial Statements for the year ended 31 December 2019 (in thousands of US dollars, unless otherwise stated)
31
16 Short-term and long-term borrowings (continued)
c) Unsecured corporate bonds
At 31 December 2019 the Group’s unsecured corporate bonds include:
Date of issue Nominal value, thousand RUB Interest rate Maturity
Early redemption option of bond
holders October 2019 10,000,000 7.15% 2029 2025 April 2019 5,000,000 8.85% 2029 2026 March 2016 15,000,000 10.95% 2026 2021 February 2016 5,000,000 11.90% 2026 no February 2013 10,000,000 7.65% 2023 2018 March 2012 6,153 0.01% 2022 2015 Total 45,006,153
The market value of the unsecured corporate bonds based on Moscow Stock Exchange quotation as at 31 December 2019 was USD 785,382 thousand (31 December 2018: USD 619,194 thousand).
In October 2019 the Group repaid USD 156,837 thousand of 11.85% unsecured corporate bonds issued in November 2015 within a call-option. The Group paid a premium of USD 785 thousand due to repayment of 11.85% unsecured corporate bonds.
d) Movements in borrowings and lease liabilities
The tables below set out an analysis of the movements in the Group’s liabilities from financing activities for each of the periods presented. The items of these liabilities are those that are reported as financing in the statement of cash flows.
Borrowings
31 December
2019 31 December
2018 Opening amount at 1 January 4,050,980 4,445,943 Borrowings received 697,404 640,289 Issue of unsecured corporate bonds 234,423 - Transaction costs on borrowings received and unsecured corporate bonds (9,888) (13,985) Premium accrued due to early repayment of guaranteed notes and unsecured corporate bonds 6,558 - Repayments of borrowings (689,335) (725,510) Repayments of guaranteed notes (332,729) - Repayments of unsecured corporate bonds (156,837) (13) Interest accrued 273,242 310,668 Repayments of interest accrued (261,103) (297,696) Gain from modification of borrowings, net (9,020) (19,859) Premium paid due to early repayment of guaranteed notes and unsecured corporate bonds (6,558) - Foreign exchange and currency translation differences, net 147,573 (288,857) Closing amount at 31 December 3,944,710 4,050,980
Lease liabilities
31 December
2019 Opening amount at 1 January 103,025 Acquisition of right-of-use assets 3,927 Repayment of principal amount of lease liabilities (5,161) Interest accrued 8,855 Repayments of interest accrued (8,855) Foreign exchange and currency translation differences, net 12,852 Closing amount at 31 December 114,643
At 31 December 2019, the fair values of lease liability exceeded their carrying amounts by USD 5,877 thousand.

AO Holding Company METALLOINVEST Notes to the Consolidated Financial Statements for the year ended 31 December 2019 (in thousands of US dollars, unless otherwise stated)
32
17 Income taxes
Income tax charge comprises the following:
2019 2018 Current income tax charge 504,309 453,908 Deferred tax charge (16,757) 7,470 Income tax charge 487,552 461,378
The income tax rate applicable to the majority of the Group’s 2019 and 2018 income is 20%.
A reconciliation between the expected and the actual taxation charge is provided below.
2019 2018 Profit before income tax 2,218,552 2,108,559 Theoretical tax charge at statutory rate of 20% 443,710 421,712 Tax effect of items which are not deductible or assessable for taxation purposes:
Charitable donations 18,299 16,076 Social costs 3,659 1,201 Foreign exchange differences 3,528 (7,669) Defined benefit obligation expenses 3,261 1,661 Change in credit loss allowance on loans advanced, net (2,884) 3,886 Other non-deductible expenses 13,400 12,993
Unrecognised deferred tax asset 8,317 557 Effect of different tax rates in countries in which the Group operates (3,738) 9,533 Withholding tax on intercompany dividends paid - 1,089 Under provision of current tax in prior years - 2,904 Recognition of previously derecognised deferred tax asset - (2,565) Income tax charge 487,552 461,378
Differences between IFRS and Russian statutory taxation regulations give rise to temporary differences between the carrying amounts of assets and liabilities for financial reporting purposes and their tax bases.
The tax effect of movements in these temporary differences is detailed below and is recorded at the rate of 20%.
31 December
2018
Effect of IFRS 16
adoption 1 January
2019
Credited/
(charged) to profit or loss
Translation to presentation
currency
31 December
2019 Tax effect of deductible temporary differences and tax loss carry forwards: Trade and other receivables 5,472 - 5,472 (4,582) 460 1,350 Accounts payable and other liabilities 11,763 - 11,763 (539) 1,413 12,637 Lease liabilities - 20,605 20,605 (186) 2,509 22,928 Inventories 7,878 - 7,878 (7,566) 617 929 Loans advanced 8,871 - 8,871 8,287 1,988 19,146 Tax loss carry forwards 29,822 - 29,822 32,963 5,152 67,937 Other 1,686 - 1,686 (841) 167 1,012 Tax effect of taxable temporary differences: Property, plant and equipment (157,190) (20,605) (177,795) (17,308) (22,518) (217,621) Intangible assets and mineral rights (106,096) - (106,096) 5,844 (12,697) (112,949) Short-term and long-term borrowings (13,221) - (13,221) 690 (1,584) (14,115) Other (358) - (358) (5) (46) (409) Total net deferred tax liability (211,373) - (211,373) 16,757 (24,539) (219,155)

AO Holding Company METALLOINVEST Notes to the Consolidated Financial Statements for the year ended 31 December 2019 (in thousands of US dollars, unless otherwise stated)
33
17 Income taxes (continued)
1 January
2018
Credited/ (charged) to profit or loss
Translation to presentation
currency
31 December
2018 Tax effect of deductible temporary differences and tax loss carry forwards: Trade and other receivables 3,048 2,821 (397) 5,472 Accounts payable and other liabilities 11,645 2,565 (2,447) 11,763 Inventories 7,940 2,025 (2,087) 7,878 Loans advanced 6,781 3,287 (1,197) 8,871 Tax loss carry forwards 37,995 (1,806) (6,367) 29,822 Other 1,425 514 (253) 1,686 Tax effect of taxable temporary differences: Property, plant and equipment (170,588) (17,105) 30,503 (157,190) Intangible assets and mineral rights (134,594) 6,201 22,297 (106,096) Short-term and long-term borrowings (9,241) (5,816) 1,836 (13,221) Other (334) (156) 132 (358) Total net deferred tax liability (245,923) (7,470) 42,020 (211,373)
The Group has not recognised a deferred tax liability in respect of temporary differences associated with undistributed earnings of subsidiaries. The Group controls the timing of the reversal of those temporary differences. At 31 December 2019, undistributed earnings of subsidiaries totaled USD 3,381,735 thousand, including earnings of USD 3,313,171 thousand which are subject to tax rate on intragroup dividends of 0% (31 December 2018: USD 2,837,784 thousand and USD 2,748,917 thousand respectively). For undistributed earning not subject to 0% tax rate the Group does not expect their reversal in the foreseeable future.
At 31 December 2019, the Group has not recognised a deferred tax asset of USD 204,510 thousand (31 December 2018: USD 44,325 thousand) in respect of losses amounting to USD 1,022,550 thousand (31 December 2018: USD 221,624 thousand) that can be carried forward against future taxable income. Since 1 January 2017 carryover of the tax losses is not limited in time.
18 Liability to the regional administration
In 2005 AO Ural Steel, a subsidiary of the Group, entered into a long-term agreement with the Orenburg region administration to pay out EUR 134 million of a financial support by December 2034. In 2015, the Group and the Orenburg region administration signed an additional agreement to convert the outstanding EUR-denominated amount of the financial support into RUB using a fixed exchange rate of RUB 44.22 for 1 EUR. The liability is accounted at amortised cost.
The present value of the liability matures as follows: 31 December
2019 31 December
2018 Not later than 1 year 3,870 2,948 Later than 1 year and not later than 5 years 11,697 10,208 Later than 5 years 13,372 12,419 28,939 25,575
At 31 December 2019, the fair value of the liability to the regional administration exceeded its carrying amount by USD 13,416 thousand (31 December 2018: USD 9,673 thousand).
19 Employee benefit obligations
The Group’s companies operate defined benefit plans. All the plans are final salary pension plans, which provide benefits to members in the form of lump sum payments upon retirement and pension payable for life. The level of lump sum payments provided depends on members' length of service and their salary in the final years leading up to retirement. Amount of pension payments is fixed and generally updated in line with inflation index.
The principal assumptions used for actuarial valuations were as follows:
31 December
2019 31 December
2018 Discount rate 6.3% 8.6% Inflation rate 4.0% 4.1% Expected rate of salary increase 4.0% 4.1% Future pension increases 4.0% 4.1%

AO Holding Company METALLOINVEST Notes to the Consolidated Financial Statements for the year ended 31 December 2019 (in thousands of US dollars, unless otherwise stated)
34
19 Employee benefit obligations (continued)
The amounts recognised in the statement of financial position were determined as follows:
31 December
2019 31 December
2018 Present value of defined benefit obligations 186,981 132,573 Fair value of plan assets (1,092) (1,041) Liability in the statement of financial position 185,889 131,532
The movement in the fair value of the plan asset over the year is as follows:
2019 2018 Asset at beginning of the year 1,041 1,275 Contributions 6,906 7,115 Remeasurements (61) (24) Expected return on plan assets 93 90 Payments (7,012) (7,199) Translation to presentation currency 125 (216) Asset at end of the year 1,092 1,041
The movement in defined benefit obligations over the year is as follows:
2019 2018 Obligation at beginning of the year 132,573 182,121 Service cost 4,048 4,809 Past service cost 644 (9,301) Interest cost 11,624 12,240 Remeasurements:
Loss from change in demographic assumptions 451 1,100 Loss/(gain) from change in financial assumptions 32,922 (10,867) Experience gain (1,899) (3,423)
Benefits paid (11,065) (14,358) Translation to presentation currency 17,683 (29,748) Obligation at end of the year 186,981 132,573
The Group recognised contributions to the Russian state pension fund of USD 122,327 thousand as part of labour costs in 2019 (2018: USD 119,569 thousand).
The sensitivity of the overall employee benefit obligations to changes in principal assumptions:
Principal assumption Change in assumption
Effect on the carrying amount
31 December 2019
31 December 2018
Discount rate Increase by 0.5% Decrease by (9,742) (5,826) Decrease by 0.5% Increase by 10,748 6,347 Inflation rate Increase by 0.5% Increase by 8,828 5,333 Decrease by 0.5% Decrease by (8,029) (4,911)
The above sensitivity analysis is based on a change in an assumption while holding all other assumptions constant. When calculating the sensitivity of the defined benefit obligation the same method has been applied as when calculating the pension liability recognised within the statement of financial position. The methods and types of assumptions used in preparing the sensitivity analysis did not change compared to the previous period.
Expected contributions to the defined benefit plans for the year ending 31 December 2020 are USD 11,780 thousand. The weighted average duration of the defined benefit obligations at 31 December 2019 is 11-13 years (31 December 2018 9-10 years).

AO Holding Company METALLOINVEST Notes to the Consolidated Financial Statements for the year ended 31 December 2019 (in thousands of US dollars, unless otherwise stated)
35
20 Accounts payable
31 December
2019 31 December
2018 Trade payables 256,997 238,201 Other financial payables 13,513 22,706 Total financial liabilities within trade and other payables 270,510 260,907 Wages payable 86,173 68,993 Advances from customers 50,075 48,170 Accrued liabilities and other payables 30,874 22,655 Total accounts payable 437,632 400,725
At 31 December 2019, included in other financial payables is USD 8,326 thousand representing trade receivable balance of the Group’s companies sold to a third party (31 December 2018: USD 7,246 thousand).
The carrying amounts of the Group's trade and other payables are denominated in the following currencies:
31 December
2019 31 December
2018 RUB 322,124 292,761 USD 72,529 73,573 EUR 31,817 25,955 Other currencies 11,162 8,436 Total 437,632 400,725
The carrying amounts of trade and other payables approximate their fair values.
21 Sales 2019 2018
Steel and rolled products 2,612,483 2,969,708 Iron ore pellets 1,770,315 1,413,553 Hot briquetted iron 1,146,823 1,262,838 Pig iron 630,490 851,806 Iron ore 627,274 505,329 Scrap 11,789 11,116 Other revenue 161,199 172,673 Total 6,960,373 7,187,023
22 Cost of sales 2019 2018
Materials and components 1,534,365 1,679,802 Labour costs 464,285 464,867 Electricity 474,613 436,854 Natural gas 304,735 305,938 Depreciation and amortisation 247,294 243,049 Land, property and other taxes 53,603 61,537 Amortisation of mineral rights 32,405 33,309 Repairs and maintenance 23,631 14,362 Other 59,641 28,120 Total 3,194,572 3,267,838
23 Distribution expenses 2019 2018
Transportation expenses 998,259 785,831 Labour costs 35,101 28,876 Packing materials 13,553 8,190 Depreciation 9,086 6,219 Customs duties 1,912 2,823 Other expenses 26,224 24,141 Total 1,084,135 856,080

AO Holding Company METALLOINVEST Notes to the Consolidated Financial Statements for the year ended 31 December 2019 (in thousands of US dollars, unless otherwise stated)
36
24 General and administrative expenses
2019 2018 Labour costs 191,924 176,560 Depreciation and amortisation 23,523 7,755 Legal and consultancy expenses 14,679 24,973 Security 11,165 11,281 Repairs and maintenance 7,423 7,196 Business trips 5,436 4,895 Materials and fuel 4,934 6,522 Short-term and low value lease expenses (2018: rent) 4,158 18,883 Bank charges 4,674 2,944 Change in credit loss allowance on accounts receivable, net (21,943) 17,750 Other 82,339 68,959 Total 328,312 347,718
25 Operating income/(expenses) – net
2019 2018 Foreign exchange (loss)/gain on operating activities, net (93,317) 97,833 Charity expenses (91,444) (80,381) Social costs (13,295) (6,885) Loss on disposal of inventory (5,800) (240) Gain/(loss) on disposal of property, plant and equipment 2,970 (3,959) Other (16,207) 437 Total (217,093) 6,805
26 Finance income and costs
Finance income
2019 2018 Interest income on loans advanced 165,501 90,068 Gain from modification of borrowings (Note 16) 19,422 19,859 Interest income on cash accounts/bank deposits 9,979 7,471 Gain from modification of loans advanced (Note 28) 3,309 - Fair value gain on initial recognition of loans advanced (Note 28) 3,055 - Unwinding of discounting of accounts receivable 1,895 736 Other finance income 397 320 Finance income 203,558 118,454
Finance costs
2019 2018 Interest expense on borrowings 258,336 298,296 Loss from prolongation of loans advanced (Note 28) 28,633 - Fair value loss on initial recognition of loans advanced (Note 28) 24,840 16,764 Interest expense on defined benefit obligations 11,531 12,240 Loss from modification of borrowings (Note 16) 10,402 - Interest expense on lease liabilities 8,855 - Premium accrued due to early repayment of guaranteed notes and unsecured corporate bonds (Note 16) 6,558 - Unwinding of discounting of liability to the regional administration 3,822 3,925 Unwinding of discounting of accounts payable 3,624 - Other charges relating to debt financing 4,953 1,957 Finance costs 361,554 333,182

AO Holding Company METALLOINVEST Notes to the Consolidated Financial Statements for the year ended 31 December 2019 (in thousands of US dollars, unless otherwise stated)
37
27 Earnings per share
The Company has no dilutive potential ordinary shares. Therefore, the diluted earnings per share equal the basic earnings per share. Basic earnings per share are calculated by dividing the profit attributable to ordinary shareholders of the Company by the weighted average number of ordinary shares in issue during the year.
2019 2018 Profit for the year attributable to ordinary shareholders 1,676,897 1,602,348 Weighted average number of ordinary shares in issue (thousand) 74,917,060 74,917,060 Basic and diluted earnings per ordinary share (USD per share) 0.0224 0.0214
28 Balances and transactions with related parties
Parties are considered to be related if one party has the ability to control the other party, is under common control, or can exercise significant influence or joint control over the other party in making financial or operational decisions as defined by IAS 24, Related Party Disclosures. In considering each possible related party relationship, attention is directed to the substance of the relationship, not merely the legal form. Other related parties at 31 December 2019 and 2018 include entities significantly influenced by owners of the Company. The owners of the Company are disclosed in Note 1.
The nature of the relationships with related parties with whom the Group entered into significant transactions or had significant balances outstanding at 31 December 2019 and 2018 are detailed below:
(i) Balances and transactions with the owners of the Company
Loans advanced to the owners of the Company: 2019 2018 Beginning of the year 931,217 704,746 Loans advanced during the year 561,972 1,451,691 Repayments of loans advanced (4,286) (1,101,559) Interest income accrued 113,301 70,694 Fair value loss on initial recognition of loans advanced, net (21,975) (16,764) Interest received - (57,905) Change in credit loss allowance on loans advanced, net (2,635) (1,526) Foreign exchange and currency translation differences, net 132,254 (118,160) End of the year 1,709,848 931,217
At 31 December 2019 loan commitments to owners of the Company amounted to USD 371,129 thousand (31 December 2018: USD 88,959 thousand).
(ii) Balances and transactions with other related parties
Loans advanced to other related parties: 2019 2018 Beginning of the year 341,879 145,973 Loans advanced during the year 620,000 346,264 Repayments of loans advanced (141,384) (129,550) Loss from prolongation of loans advanced (28,633) - Gain from modification of loans advanced 3,309 - Interest income accrued 51,836 18,780 Fair value gain on initial recognition of loans advanced, net 190 - Interest received (2,425) (3,646) Change in credit loss allowance on loans advanced, net 16,209 (17,872) Foreign exchange and currency translation differences, net 7,565 (18,070) End of the year 868,546 341,879 Year-end balances:
31 December 2019
31 December 2018
Trade accounts receivable 1,646 2,304 Other receivables 6,878 5,463 Trade accounts payable 9,438 5,397 Lease liabilities 112,466 -

AO Holding Company METALLOINVEST Notes to the Consolidated Financial Statements for the year ended 31 December 2019 (in thousands of US dollars, unless otherwise stated)
38
28 Balances and transactions with related parties (continued)
Transactions carried out during the year: 2019 2018 Sales of goods and services 13,020 12,096 Purchases of raw materials and consumables 10,731 9,646 Purchases of services 8,193 20,765 Acquisition of additional interest in subsidiaries - 56,644 Finance income 2,909 669 Interest expense on lease liabilities 8,764 -
At 31 December 2019 loan commitments to other related parties amounted to USD 21,468 thousand (31 December 2018: USD 40,219 thousand).
(iii) Key management personnel compensation
Key management personnel comprises senior management board and Board of Directors. Compensation of key management personnel consists of monthly remuneration, annual performance bonus contingent on operating results and contributions to the Russian state pension and social funds.
Total key management personnel compensation included in general and administrative expenses amounted to USD 49,706 thousand (2018: USD 43,321 thousand).
29 Contingencies, commitments and operating risks
(i) Commitments
As at 31 December 2019, the Group had contractual commitments of USD 212,610 thousand (31 December 2018: USD 250,088 thousand) for the purchase of property, plant and equipment and intangible assets.
(ii) Tax contingencies
Russian tax legislation which was enacted or substantively enacted at the end of the reporting period, is subject to varying interpretations when being applied to the transactions and activities of the Group. Consequently, tax positions taken by management and the formal documentation supporting the tax positions may be challenged by the tax authorities. Russian tax administration is gradually strengthening, including the fact that there is a higher risk of review of tax transactions without a clear business purpose or with tax incompliant counterparties. Fiscal periods remain open to review by the authorities in respect of taxes for three calendar years preceding the year when decisions about the review was made. Under certain circumstances reviews may cover longer periods.
The Russian transfer pricing legislation is generally aligned with the international transfer pricing principles developed by the Organisation for Economic Cooperation and Development (OECD) but has specific characteristics. This legislation provides the possibility for tax authorities to make transfer pricing adjustments and impose additional tax liabilities in respect of controlled transactions (transactions with related parties and some types of transactions with unrelated parties), provided that the transaction price is not arm’s length. Management has implemented internal controls to be in compliance with this transfer pricing legislation.
Tax liabilities arising from transactions between companies within the Group are determined using actual transaction prices. It is possible, with the evolution of the interpretation of the transfer pricing rules, that such transfer prices could be challenged. The impact of any such challenge cannot be reliably estimated; however, it may be significant to the financial position and/or the overall operations of the Group.
The Group includes companies incorporated outside of Russia. The tax liabilities of the Group are determined on the assumption that these companies are not subject to Russian profits tax, because they do not have a permanent establishment in Russia. This interpretation of relevant legislation may be challenged, but the impact of any such challenge cannot be reliably estimated currently; however, it may be significant to the financial position and/or the overall operations of the Group. The Controlled Foreign Company (CFC) legislation introduced Russian taxation of profits of foreign companies and non-corporate structures (including trusts) controlled by Russian tax residents (controlling parties). The CFC income is subject to a 20% tax rate. Management doesn’t expect any significant payments in respect of its foreign subsidiaries profits due to new CFC legislation.
As Russian tax legislation does not provide definitive guidance in certain areas, the Group adopts, from time to time, interpretations of such uncertain areas that reduce the overall tax rate of the Group. While management currently estimates that the tax positions and interpretations that it has taken can probably be sustained, there is a possible risk that an outflow of resources will be required should such tax positions and interpretations be challenged by the tax authorities. The impact of any such challenge cannot be reliably estimated; however, it may be significant to the financial position and/or the overall operations of the Group.

AO Holding Company METALLOINVEST Notes to the Consolidated Financial Statements for the year ended 31 December 2019 (in thousands of US dollars, unless otherwise stated)
39
29 Contingencies, commitments and operating risks (continued)
At 31 December 2019 and 2018, management estimates that the Group has no possible obligation from exposure to other than remote tax risks. Management will vigorously defend the entity's positions and interpretations that were applied in determining taxes recognised in these financial statements if these are challenged by the authorities.
(iii) Environmental matters
The enforcement of environmental regulation in Russia is evolving and the enforcement posture of government authorities is continually being reconsidered. The Group periodically evaluates its obligations under environmental regulations. As obligations are determined, they are recognised immediately. Potential liabilities, which might arise as a result of changes in existing regulations, civil litigation or legislation, cannot be estimated but could be material. In the current enforcement climate under existing legislation, management believes that there are no significant liabilities for environmental damage.
(iv) Legal proceedings
During the year, the Group was involved in a number of court proceedings (both as a plaintiff and a defendant) arising in the ordinary course of business. In the opinion of management, there are no current legal proceedings or other claims outstanding, which could have a material effect on the result of operations or financial position of the Group and which have not been accrued or disclosed in these consolidated financial statements.
(v) Operating environment
The Russian Federation displays certain characteristics of an emerging market. Its economy is particularly sensitive to oil and gas prices. The legal, tax and regulatory frameworks continue to develop and are subject to frequent changes and varying interpretations (Note 29 (ii)). The Russian economy continues to be negatively impacted by ongoing political tension in the region and international sanctions against certain Russian companies and individuals. Firm oil prices, low unemployment and rising wages supported a modest growth of the economy in 2019. The operating environment has a significant impact on the Group’s operations and financial position.
Management is taking necessary measures to ensure sustainability of the Group’s operations. However, the future effects of the current economic situation are difficult to predict and management’s current expectations and estimates could differ from actual results.
30 Financial risk management and fair value of financial instruments
Financial risk factors
The risk management function within the Group is carried out in respect of financial risks, operational risks and legal risks. Financial risks comprise market risk (including foreign exchange risk, interest rate risk and price risk), credit risk and liquidity risk. The primary objectives of the financial risk management function are to establish risk limits and then ensure that exposure to risks stays within these limits. The Group’s overall risk management focuses on the unpredictability of financial markets and seeks to minimise potential adverse effects on the Group’s financial performance.
The operational and legal risk management functions are intended to ensure proper functioning of internal policies and procedures to minimise operational and legal risks.
Market risk
The Group takes on exposure to market risks. Market risks arise from open positions in (a) foreign currencies and, (b) interest bearing assets and liabilities. Management sets limits on the value of risk that may be accepted, which is monitored on a regular basis. However, the use of this approach does not prevent losses outside of these limits in the event of more significant market movements.
Sensitivities to market risks included below are based on a change in one factor while holding all other factors constant. In practice this is unlikely to occur and changes in some of the factors may be correlated – for example, changes in interest rates and changes in foreign currency rates.
(i) Foreign exchange risk
The Group operates internationally and is exposed to foreign exchange risk arising from various currency exposures, primarily with respect to the USD and the EUR. Foreign exchange risk arises from recognised assets and liabilities denominated in currency other than the functional currency of the entity.

AO Holding Company METALLOINVEST Notes to the Consolidated Financial Statements for the year ended 31 December 2019 (in thousands of US dollars, unless otherwise stated)
40
30 Financial risk management and fair value of financial instruments (continued)
Market risk (continued)
(i) Foreign exchange risk (continued)
The Group does not have formal arrangements to mitigate foreign exchange risks of its operations. However, management monitors the net monetary position of the Group’s financial assets and liabilities denominated in foreign currencies on a regular basis.
The analysis below includes only monetary assets and liabilities. Investments in equities and non-monetary assets are not considered to give rise to any material currency risk.
At 31 December 2019, if the Russian rouble had weakened/strengthened by 15% (31 December 2018: 20%) against the USD with all other variables held constant, post-tax profit for the year and equity would have been USD 66,763 thousand (31 December 2018: USD 271,520 thousand) lower/higher, mainly as a result of foreign exchange losses/gains on translation of US dollar-denominated borrowings, loans advanced, accounts payable, trade receivables and cash and cash equivalents.
At 31 December 2019, if the Russian rouble had weakened/strengthened by 15% (31 December 2018: 20%) against the EUR with all other variables held constant, post-tax profit for the year and equity would have been USD 94,139 thousand (31 December 2018: USD 36,140 thousand) lower/higher (2018: higher/lower), mainly as a result of foreign exchange losses/gains on translation of EUR-denominated borrowings, accounts payable, trade receivables and cash and cash equivalents.
(ii) Interest rate risk
Interest rate risk arises from movements in interest rates which could affect the Group’s financial position and cash flows.
The interest rate risk profile of the Group was as follows:
31 December
2019 31 December
2018 Fixed rate instruments Financial assets 2,799,468 1,659,738 Financial liabilities (2,847,957) (2,386,527) (48,489) (726,789) Variable rate instruments Financial assets - - Financial liabilities (1,267,512) (1,690,030) (1,267,512) (1,690,030)
All other financial instruments are non-interest bearing.
Cash flow sensitivity analysis for variable rate instruments
The Group’s interest rate risk arises from borrowings. Borrowings received at variable rates expose the Group to cash flow interest rate risk. During 2019 and 2018, the Group’s borrowings received at variable rates were denominated in the USD and the EUR.
Monitoring of current market interest rates and analysis of the Group’s interest-bearing position is performed by the Group’s corporate finance department as a part of the interest rate risk management procedures. Monitoring is performed taking into consideration refinancing, renewal of existing positions and alternative financing.
At 31 December 2019, if interest rates on USD-denominated borrowings throughout the year had been 1 pp (31 December 2018: 1 pp) higher/lower with all other variables held constant, post-tax profit for the year would have been USD 8,408 thousand (31 December 2018: USD 11,514 thousand) lower/higher as a result of higher/lower interest expense and income on floating rate borrowings; other components of equity would not have changed.
At 31 December 2019, if interest rates on EUR-denominated borrowings throughout the year had been 1 pp (31 December 2018: 1 pp) higher/lower with all other variables held constant, post-tax profit for the year would have been USD 2,216 thousand (31 December 2018: USD 2,481 thousand) lower/higher, as a result of higher/lower interest expense on floating rate borrowings; other components of equity would not have changed.
The Group does not have fixed rate financial instruments carried at fair value. Therefore, a change in interest rates at the end of the reporting period would not affect the Group’s comprehensive income.
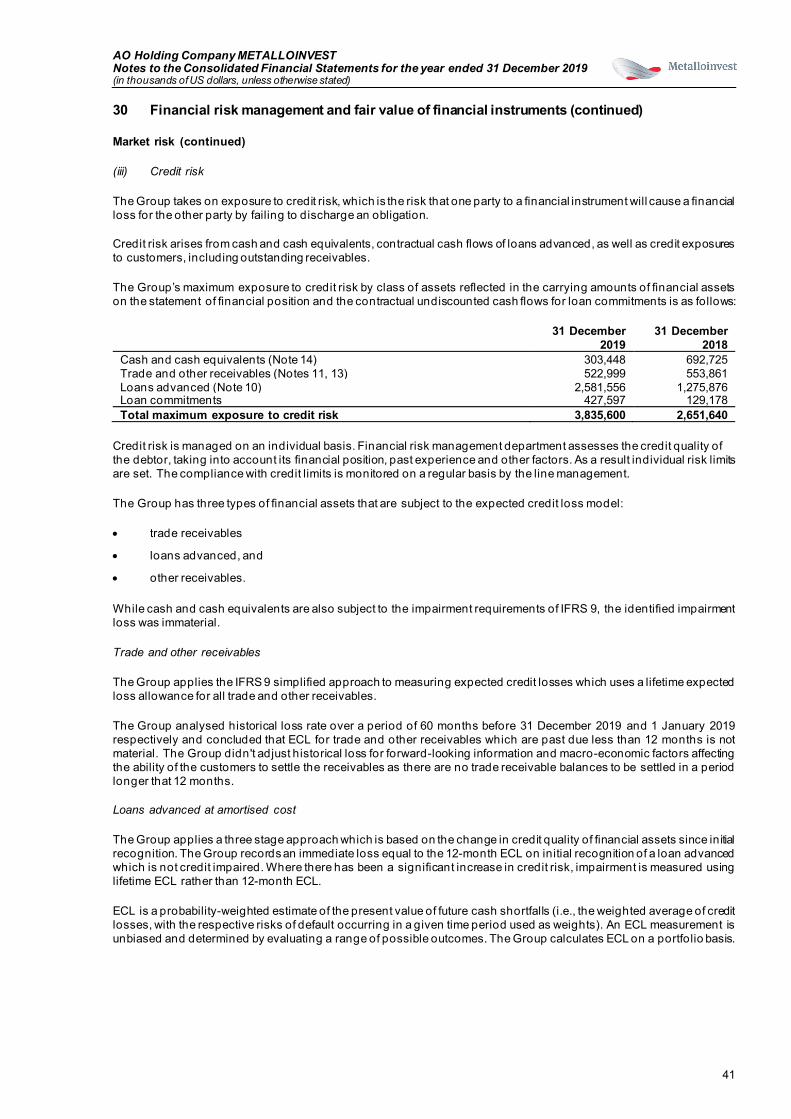
AO Holding Company METALLOINVEST Notes to the Consolidated Financial Statements for the year ended 31 December 2019 (in thousands of US dollars, unless otherwise stated)
41
30 Financial risk management and fair value of financial instruments (continued)
Market risk (continued)
(iii) Credit risk
The Group takes on exposure to credit risk, which is the risk that one party to a financial instrument will cause a financial loss for the other party by failing to discharge an obligation.
Credit risk arises from cash and cash equivalents, contractual cash flows of loans advanced, as well as credit exposures to customers, including outstanding receivables.
The Group’s maximum exposure to credit risk by class of assets reflected in the carrying amounts of financial assets on the statement of financial position and the contractual undiscounted cash flows for loan commitments is as follows:
31 December
2019 31 December
2018 Cash and cash equivalents (Note 14) 303,448 692,725 Trade and other receivables (Notes 11, 13) 522,999 553,861 Loans advanced (Note 10) 2,581,556 1,275,876 Loan commitments 427,597 129,178 Total maximum exposure to credit risk 3,835,600 2,651,640
Credit risk is managed on an individual basis. Financial risk management department assesses the credit quality of the debtor, taking into account its financial position, past experience and other factors. As a result individual risk limits are set. The compliance with credit limits is monitored on a regular basis by the line management.
The Group has three types of financial assets that are subject to the expected credit loss model:
• trade receivables
• loans advanced, and
• other receivables.
While cash and cash equivalents are also subject to the impairment requirements of IFRS 9, the identified impairment loss was immaterial.
Trade and other receivables
The Group applies the IFRS 9 simplified approach to measuring expected credit losses which uses a lifetime expected loss allowance for all trade and other receivables.
The Group analysed historical loss rate over a period of 60 months before 31 December 2019 and 1 January 2019 respectively and concluded that ECL for trade and other receivables which are past due less than 12 months is not material. The Group didn't adjust historical loss for forward-looking information and macro-economic factors affecting the ability of the customers to settle the receivables as there are no trade receivable balances to be settled in a period longer that 12 months.
Loans advanced at amortised cost
The Group applies a three stage approach which is based on the change in credit quality of financial assets since initial recognition. The Group records an immediate loss equal to the 12-month ECL on initial recognition of a loan advanced which is not credit impaired. Where there has been a significant increase in credit risk, impairment is measured using lifetime ECL rather than 12-month ECL.
ECL is a probability-weighted estimate of the present value of future cash shortfalls (i.e., the weighted average of credit losses, with the respective risks of default occurring in a given time period used as weights). An ECL measurement is unbiased and determined by evaluating a range of possible outcomes. The Group calculates ECL on a portfolio basis.

AO Holding Company METALLOINVEST Notes to the Consolidated Financial Statements for the year ended 31 December 2019 (in thousands of US dollars, unless otherwise stated)
42
30 Financial risk management and fair value of financial instruments (continued)
Market risk (continued)
(iii) Credit risk (continued)
ECL measurement is based on four components used by the Group: Probability of Default (PD), Exposure at Default (EAD), Loss Given Default (LGD) and Discount Rate:
• EAD – an estimate of exposure at a future default date, taking into account expected changes in exposure after the reporting date, including repayments of principal and interest.
• PD – an estimate of the likelihood of default to occur over a given time period.
• LGD – an estimate of the loss arising on default. It is based on the difference between the contractual cash flows due and those that the lender would expect to receive, including from any collateral.
The expected losses are discounted to present value at the end of the reporting period. The discount rate represents the effective interest rate for the financial instrument or an approximation thereof.
For purposes of measuring PD, the Group defines default as a situation when the exposure meets one or more of the following criteria:
• the borrower is more than 90 days past due on its contractual payments; • the borrower meets the unlikeliness-to-pay criteria listed below:
the borrower is insolvent; it is becoming likely that the borrower will enter bankruptcy.
The Group assesses the credit quality of the borrower and assigns internal credit risk grade. Internal credit grades are mapped on external credit ratings scale. The PD is then identified using publicly available information on default rates for these external credit ratings.
To assess whether there is a significant increase in credit risk, the Group compares credit risk grade assigned on the asset as at the reporting date with the risk of default as at the date of initial recognition. It considers available reasonable and supportive forwarding-looking information. Especially the following indicators are incorporated:
• internal credit grade;
• actual or expected significant adverse changes in business, financial or economic conditions that are expected to cause a significant change to the borrower’s ability to meet its obligations;
• actual or expected significant changes in the operating results of the borrower;
• significant increases in credit risk on other financial instruments of the same borrower.
Regardless of the analysis above, a significant increase in credit risk is presumed if a debtor is more than 30 days past due in making a contractual payment.
An instrument is considered to no longer be in default when it no longer meets the default criteria that was applicable to the relevant counterparty.
The Group determine LGD based on publicly available information on average recovery statistics.
The ECL measurement for loan commitments includes the same steps as described above for on-balance sheet exposures and differs with respect to EAD calculation. The EAD is a product of credit conversion factor (“CCF”) and amount of the commitment.
Cash and cash equivalents. Cash and cash equivalents are placed in major multinational and Russian banks with independent credit ratings. The banks are assessed to ensure exposure to credit risk is limited to an acceptable level. No bank balances and term deposits are past due or impaired.

AO Holding Company METALLOINVEST Notes to the Consolidated Financial Statements for the year ended 31 December 2019 (in thousands of US dollars, unless otherwise stated)
43
30 Financial risk management and fair value of financial instruments (continued)
Market risk (continued)
(iii) Credit risk (continued)
Analysis by credit quality of cash and cash equivalents is as follows:
31 December 2019 31 December 2018
Cash Cash
equivalents Cash Cash
equivalents Rating Low credit risk (A-AAA) 65,027 100 63,917 35,641 Medium credit risk (B-BBB) 25,092 209,792 207,981 344,476 High credit risk - - 93 - Unrated 2,295 1,142 36,872 3,745 Total 92,414 211,034 308,863 383,862
The Group is not exposed to significant concentrations of credit risk. At 31 December 2019, the Group had 8 counterparties, each having an aggregated receivables balances of over USD 12,923 thousand (31 December 2018: 8 counterparties, each having an aggregated receivables balances of over USD 17,273 thousand). The total aggregate amount of these balances was USD 322,970 thousand (31 December 2018: USD 268,622 thousand) or 62% (31 December 2018: 48%) of the total amount of trade and other receivables.
Liquidity risk
Liquidity risk is defined as the risk that an entity will encounter difficulty in meeting obligations associated with financial liabilities. The Group’s finance department is responsible for managing liquidity risk, including funding, settlements, and related processes and policies. The operational, capital, tax and other requirements and obligations of the Group are considered in the management of liquidity risk.
Management utilises cash flow forecasts and other financial information to ensure it has sufficient cash to meet operational needs. Such forecasts take into consideration the Group’s debt financing plans and covenant compliance. Surplus cash held by the operating subsidiaries above balance required for working capital management is invested in term deposits. The liquidity position is monitored and regular liquidity stress testing under a variety of scenarios covering both normal and more severe market conditions is performed by the finance department.
The table below analyses the Group’s financial liabilities by their remaining contractual maturity. The amounts disclosed in the maturity table are the contractual undiscounted cash flows. Such undiscounted cash flows differ from the amount included in the statement of financial position because the balance sheet amount is based on discounted cash flows.
As at 31 December 2019 Less than
1 year Between
1 and 3 years Between
3 and 5 years Over
5 years Borrowings 267,723 1,423,194 2,278,062 811,899 Trade and other payables 270,510 25,464 - - Liability to the regional administration 4,395 8,678 9,671 49,197 Loan commitments 427,597 - - - Lease liability 14,567 25,280 26,083 129,740 Total 984,792 1,482,616 2,313,816 990,836
As at 31 December 2018 Less than
1 year Between
1 and 3 years Between
3 and 5 years Over
5 years Borrowings 468,331 1,722,311 1,457,896 1,381,517 Trade and other payables 260,906 11,874 338 - Liability to the regional administration 3,347 7,800 8,178 48,130 Loan commitments 129,178 - - - Total 861,762 1,741,985 1,466,412 1,429,647
When the amount payable is not fixed, the amount disclosed is determined by reference to the conditions existing at the reporting date. Foreign currency payments are translated using the exchange rate at the end of the reporting period.
Capital risk management
The Group’s objectives when managing capital are to safeguard the Group’s ability to continue as a going concern in order to provide returns for shareholders and benefits for other stakeholders and to maintain an optimal capital structure to reduce the cost of capital. The Group determines capital as total equity as shown in the consolidated statement of financial position.

AO Holding Company METALLOINVEST Notes to the Consolidated Financial Statements for the year ended 31 December 2019 (in thousands of US dollars, unless otherwise stated)
44
30 Financial risk management and fair value of financial instruments (continued)
Fair value of financial instruments
Fair value measurements are analysed by level in the fair value hierarchy as follows: (i) level one are measurements at quoted prices (unadjusted) in active markets for identical assets or liabilities, (ii) level two measurements are valuations techniques with all material inputs observable for the asset or liability, either directly (that is, as prices) or indirectly (that is, derived from prices), and (iii) level three measurements are valuations not based on observable market data (that is, unobservable inputs). Management applies judgement in categorising financial instruments using the fair value hierarchy. If a fair value measurement uses observable inputs that require significant adjustment, that measurement is a Level 3 measurement. The significance of a valuation input is assessed against the fair value measurement in its entirety.
Financial instruments carried at fair value. Equity investments are carried in the statement of financial position at their fair value.
The levels in the fair value hierarchy into which the fair value measurements are categorised are as follows:
2019 2018 Level 1 Level 2 Level 3 Level 1 Level 2 Level 3
FINANCIAL ASSETS Equity investments Equity securities x x 401,481 5,042 x 345,460 Loans advanced x x - x x - Total financial assets carried at fair value x x 401,481 5,042 x 345,460
As at 31 December 2018 included in Level 1 were the Group’s investments in Nautilus Minerals Inc. shares. During 2019 Nautilus Minerals Inc. was delisted from TSX and transferred into Level 3 (Note 9).
As at 31 December 2019 and 2018, included in Level 3 were the Group’s investments in OOO South Ural Mining & Processing Works and AO HC BMC (Note 9).
At 31 December 2019 and 2018, loans advanced measured at FVTPL (Level 3) included certain loans advanced that did not met the SPPI criterion.
Financial assets carried at amortised cost. The fair value of floating rate instruments is normally their carrying amount. The estimated fair value of fixed interest rate instruments is based on estimated future cash flows expected to be received discounted at current interest rates for new instruments with similar credit risk and remaining maturity. Discount rates used depend on the credit risk of the counterparty. The fair values of loans advanced were determined using valuation techniques and included in level 2 of the fair value hierarchy. At 31 December 2019, the discount rates used for calculation of fair values ranged from 4.2% to 12.4% depending on the length and currency of the asset (31 December 2018: from 5.4% to 14.3%).
Liabilities carried at amortised cost. The fair values of guaranteed notes and unsecured corporate bonds are based on quoted market prices and included in level 1 of the fair value hierarchy. Fair values of borrowings and liability to the regional administration were determined using valuation techniques and included in level 2 of the fair value hierarchy. The estimated fair value of fixed interest rate instruments with stated maturity was estimated based on expected cash flows discounted at current interest rates for new instruments with similar credit risk and remaining maturity. At 31 December 2019, the discount rates used for calculation of fair values ranged from 1.28% to 12.24% depending on the maturity and currency of the liability (31 December 2018: from 2.04% to 12.24%).
31 Events after the reporting date
In January 2020 the Group committed to a plan to sell its subsidiary AO Ural Steel, part of its Steel segment, to a third party. Management expects to complete the sale during the second quarter of 2020.
In February 2020 the Company issued USD 156 375 thousand 6.55% RUB-denominated unsecured corporate bonds with maturity in 2030 and a call option in 2023 and a put option in 2026.