ANZ NATIONAL BANK LIMITED · • Markets provide risk management services on foreign exchange,...
26
AUSTRALIA AND NEW ZEALAND BANKING GROUP LIMITED - ANZ NEW ZEALAND REGISTERED BANK DISCLOSURE STATEMENT FOR THE SIX MONTHS ENDED 31 MARCH 2018 NUMBER 38 | ISSUED MAY 2018
-
Upload
nguyenlien -
Category
Documents
-
view
214 -
download
0
Transcript of ANZ NATIONAL BANK LIMITED · • Markets provide risk management services on foreign exchange,...

AUSTRALIA AND NEW ZEALAND BANKING GROUP LIMITED - ANZ NEW ZEALAND
REGISTERED BANK DISCLOSURE STATEMENT
FOR THE SIX MONTHS ENDED 31 MARCH 2018 NUMBER 38 | ISSUED MAY 2018

Australia and New Zealand Banking Group Limited - ANZ New Zealand REGISTERED BANK DISCLOSURE STATEMENT FOR THE SIX MONTHS ENDED 31 MARCH 2018
CONTENTS DISCLOSURE STATEMENT
Condensed Consolidated Interim Financial Statements (Financial Statements)
Income Statement 2
Statement of Comprehensive Income 2
Balance Sheet 3
Condensed Cash Flow Statement 4
Statement of Changes in Equity 4
Notes to the Financial Statements 5
Registered Bank Disclosures
General Disclosures 11
Additional Financial Disclosures 12
Asset Quality 17
Credit and Market Risk Exposures and Capital Adequacy 18
Insurance Business 19
Directors' and New Zealand Chief Executive Officer's Statement 20
Independent Auditor’s Review Report 21 SUPPLEMENTARY INFORMATION
Bank Financial Strength Dashboard 23
Other Information 24
GLOSSARY OF TERMS In this Registered Bank Disclosure Statement (Disclosure Statement) unless the context otherwise requires:
Bank means ANZ Bank New Zealand Limited.
Banking Group means the Bank and all its controlled entities.
Immediate Parent Company means ANZ Funds Pty Limited, which is the immediate parent company of ANZ Holdings (New Zealand) Limited.
Ultimate Parent Bank means Australia and New Zealand Banking Group Limited.
Overseas Banking Group means the worldwide operations of Australia and New Zealand Banking Group Limited including its controlled entities.
New Zealand business means all business, operations, or undertakings conducted in or from New Zealand identified and treated as if it were conducted by a company formed and registered in New Zealand.
NZ Branch means the New Zealand business of the Ultimate Parent Bank.
ANZ New Zealand, We or Our means the New Zealand business of the Overseas Banking Group.
UDC means UDC Finance Limited.
Registered Office is Level 10, 171 Featherston Street, Wellington, New Zealand, which is also ANZ New Zealand’s address for service.
RBNZ means the Reserve Bank of New Zealand.
APRA means the Australian Prudential Regulation Authority.
the Order means the Registered Bank Disclosure Statements (Overseas Incorporated Registered Banks) Order 2014.
Any term or expression which is defined in, or in the manner prescribed by, the Order shall have the meaning given in or prescribed by the Order.

Australia and New Zealand Banking Group Limited - ANZ New Zealand Unaudited
INCOME STATEMENT
6 months to 31 Mar 18 31 Mar 17
Note NZ$m NZ$m
Interest income 3,248 3,202
Interest expense 1,676 1,668
Net interest income 1,572 1,534
Other operating income 2 372 309
Net funds management and insurance income 204 133
Share of associates' profit 1 1
Operating income 2,149 1,977
Operating expenses 747 730
Profit before credit impairment and income tax 1,402 1,247
Credit impairment charge 5 70 40
Profit before income tax 1,332 1,207
Income tax expense 368 338
Profit after income tax 964 869
STATEMENT OF COMPREHENSIVE INCOME
6 months to
31 Mar 18 31 Mar 17
NZ$m NZ$m
Profit after income tax 964 869
Items that will not be reclassified to profit or loss
Actuarial gain on defined benefit schemes 2 19
Income tax expense relating to items that will not be reclassified (1) (5)
Total items that will not be reclassified to profit or loss 1 14
Items that may be reclassified subsequently to profit or loss
Unrealised losses recognised directly in equity (6) (15)
Realised losses transferred to income statement 3 6
Income tax credit relating to items that may be reclassified 1 2
Total items that may be reclassified subsequently to profit or loss (2) (7)
Total comprehensive income for the period 963 876
The notes to the financial statements form part of and should be read in conjunction with these financial statements 2

Australia and New Zealand Banking Group Limited - ANZ New Zealand Unaudited
BALANCE SHEET
31 Mar 18 30 Sep 17
As at Note NZ$m NZ$m
Assets
Cash 2,752 2,338
Settlement balances receivable 763 536
Collateral paid 1,634 1,415
Trading securities 8,416 7,663
Investments backing insurance contract liabilities 152 123
Derivative financial instruments 7,990 9,749
Current tax assets 8 -
Available-for-sale assets 6,609 6,360
Net loans and advances 4 123,169 121,968
Assets held for sale 11 3,225 3,065
Other assets 712 683
Life insurance contract assets 669 636
Investments in associates - 7
Premises and equipment 354 367
Goodwill and other intangible assets 3,266 3,275
Total assets 159,719 158,185
Liabilities
Settlement balances payable 1,742 1,687
Collateral received 760 613
Deposits and other borrowings 7 111,510 108,013
Derivative financial instruments 7,893 9,894
Current tax liabilities - 45
Deferred tax liabilities 210 189
Liabilities held for sale 11 1,017 1,088
Payables and other liabilities 1,114 1,161
Employee entitlements 119 119
Other provisions 60 66
Debt issuances 8 23,818 23,997
Total liabilities (excluding head office account) 148,243 146,872
Net assets (excluding head office account) 11,476 11,313
Equity
Share capital and initial head office account 8,055 8,055
Reserves 46 48
Retained earnings 3,375 3,210
Total equity and initial head office account 11,476 11,313
The notes to the financial statements form part of and should be read in conjunction with these financial statements 3

Australia and New Zealand Banking Group Limited - ANZ New Zealand Unaudited
CONDENSED CASH FLOW STATEMENT 31 Mar 18 31 Mar 17
For the six months ended NZ$m NZ$m
Cash flows from operating activities Interest received 3,261 3,214
Interest paid (1,687) (1,666)
Other cash inflows provided by operating activities 527 447
Other cash outflows used in operating activities (1,181) (1,121)
Cash flows from operating profits before changes in operating assets and liabilities 920 874
Net changes in operating assets and liabilities 381 (847)
Net cash flows provided by operating activities 1,301 27
Cash flows from investing activities
Cash inflows provided by investing activities 35 -
Cash outflows used in investing activities (18) (26)
Net cash flows used in investing activities 17 (26)
Cash flows from financing activities
Cash inflows provided by financing activities 2,885 2,943
Cash outflows used in financing activities (3,820) (3,363)
Net cash flows used in financing activities (935) (420)
Net increase in cash and cash equivalents 383 (419)
Cash and cash equivalents at beginning of the period 2,439 2,315
Cash and cash equivalents at end of the period 2,822 1,896
STATEMENT OF CHANGES IN EQUITY
Share capital and initial
head office account
Available- for-sale
revaluation reserve
Cash flow hedging
reserve Retained earnings
Total equity
NZ$m NZ$m NZ$m NZ$m NZ$m
As at 1 October 2016 8,055 - 62 3,050 11,167
Profit after income tax - - - 869 869
Unrealised gains / (losses) recognised directly in equity - 7 (22) - (15)
Realised losses transferred to the income statement - - 6 - 6
Actuarial gain on defined benefit schemes - - - 19 19
Income tax credit / (expense) on items recognised directly in equity - (2) 4 (5) (3)
Total comprehensive income for the period - 5 (12) 883 876
Ordinary dividend paid - - - (765) (765)
As at 31 March 2017 8,055 5 50 3,168 11,278
As at 1 October 2017 8,055 5 43 3,210 11,313
Profit after income tax - - - 964 964
Unrealised gains / (losses) recognised directly in equity - 9 (15) - (6)
Realised losses transferred to the income statement - - 3 - 3
Actuarial gain on defined benefit schemes - - - 2 2
Income tax credit / (expense) on items recognised directly in equity - (2) 3 (1) -
Total comprehensive income for the period - 7 (9) 965 963
Ordinary dividend paid - - - (800) (800)
As at 31 March 2018 8,055 12 34 3,375 11,476
The notes to the financial statements form part of and should be read in conjunction with these financial statements 4

Australia and New Zealand Banking Group Limited - ANZ New Zealand Unaudited NOTES TO THE FINANCIAL STATEMENTS 1. SIGNIFICANT ACCOUNTING POLICIES Statement of compliance
These interim financial statements for ANZ New Zealand have been prepared in accordance with the requirements of the Reserve Bank of New Zealand Act 1989, and should be read in conjunction with ANZ New Zealand’s financial statements for the year ended 30 September 2017.
These financial statements comply with: • New Zealand Generally Accepted Accounting Practice, as defined in the Financial Reporting Act 2013 • NZ IAS 34 Interim Financial Reporting and other applicable Financial Reporting Standards, as appropriate for publicly accountable for-
profit entities • IAS 34 Interim Financial Reporting.
Use of estimates, assumptions and judgements
The preparation of these interim financial statements requires the use of management judgement, estimates and assumptions that affect reported amounts and the application of accounting policies. Discussion of the critical accounting estimates and judgements, which include complex or subjective decisions or assessments are provided in the previous full year financial statements. Such estimates and judgements are reviewed on an ongoing basis.
Basis of measurement
These financial statements have been prepared on a going concern basis in accordance with historical cost concepts except that the following assets and liabilities are stated at their fair value:
• derivative financial instruments • available-for-sale financial assets • financial instruments held for trading • financial instruments designated at fair value through profit and loss.
Changes in accounting policies
The accounting policies adopted by ANZ New Zealand are consistent with those adopted and disclosed in the previous full year financial statements.
Presentation currency and rounding
The amounts contained in the financial statements are presented in millions of New Zealand dollars, unless otherwise stated.
Comparatives
Certain amounts in the comparative information have been reclassified to ensure consistency with the current period’s presentation.
Principles of consolidation
The consolidated financial statements of ANZ New Zealand comprise the financial statements of the NZ Branch and all the New Zealand businesses of all the subsidiaries of the Ultimate Parent Bank.
2. OTHER OPERATING INCOME 6 months to 31 Mar 18 31 Mar 17
Note NZ$m NZ$m
i) Net fee and commission income 198 190
ii) Other income
Net trading gains 96 109
Fair value gain / (loss) on hedging activities and financial liabilities designated at fair value 21 (33)
Net foreign exchange earnings and other financial instruments income 117 76
Derivative valuation adjustments 1 27
Gain on UDC terminated transaction 11 20 -
Insurance proceeds 20 -
Other 16 16
Other income 174 119
Total other operating income 372 309
5

Australia and New Zealand Banking Group Limited - ANZ New Zealand Unaudited NOTES TO THE FINANCIAL STATEMENTS 3. SEGMENT REPORTING ANZ New Zealand is organised into three major business segments for segment reporting purposes - Retail, Commercial and Institutional. Centralised back office and corporate functions support these segments. These segments are consistent with internal reporting provided to the chief operating decision maker, being the Bank’s Chief Executive Officer.
Segment reporting has been updated to reflect minor changes to ANZ New Zealand’s structure. Comparative data has been adjusted to be consistent with the current period’s segment definitions.
Retail
Retail provides a full range of banking and wealth management services to consumer, private banking and small business banking customers. We deliver our services via our internet and app-based digital solutions and network of branches, mortgage specialists, relationship managers and contact centres.
Commercial
Commercial provides a full range of banking services including traditional relationship banking and sophisticated financial solutions (including asset financing) through dedicated managers focusing on privately owned medium to large enterprises and the agriculture business segment.
Institutional
The Institutional division services global institutional and business customers across three product sets: Transaction Banking, Loans & Specialised Finance and Markets.
• Transaction Banking provides working capital and liquidity solutions including documentary trade, supply chain financing as well as cash management solutions, deposits, payments and clearing.
• Loans & Specialised Finance provides loan products, loan syndication, specialised loan structuring and execution, project and export finance, debt structuring and acquisition finance, structured trade and asset finance, and corporate advisory.
• Markets provide risk management services on foreign exchange, interest rates, credit, commodities, debt capital markets and wealth solutions in addition to managing ANZ New Zealand’s interest rate exposure and liquidity position.
Other
Other includes treasury and back office support functions, none of which constitutes a separately reportable segment.
Retail Commercial Institutional Other Total
For the six months ended 31 March 2018 NZ$m NZ$m NZ$m NZ$m NZ$m
External revenues 1,437 894 307 (489) 2,149
Intersegment revenues1 (187) (405) 1 591 -
Total revenues 1,250 489 308 102 2,149
Profit after income tax 510 267 122 65 964
For the six months ended 31 March 2017
External revenues 1,447 893 349 (712) 1,977
Intersegment revenues1 (241) (437) 17 661 -
Total revenues 1,206 456 366 (51) 1,977
Profit / (loss) after income tax 499 219 196 (45) 869
Other segment
Other segment profit / (loss) after income tax comprises: 31 Mar 18 31 Mar 17
For the six months ended NZ$m NZ$m
Central functions2 16 (1)
Technology and Group Centre 26 15
Economic hedges 13 (24)
Revaluation of insurance policies 10 (35)
Total 65 (45)
1 Intersegment transfers are accounted for and determined on an arm's length or cost recovery basis. 2 Central functions’ external revenues for the six months to 31 March 2018 includes the $20 million insurance proceeds (note 2) that were received from a member of the
Overseas Banking Group.
6

Australia and New Zealand Banking Group Limited - ANZ New Zealand Unaudited NOTES TO THE FINANCIAL STATEMENTS 4. NET LOANS AND ADVANCES 31 Mar 18 30 Sep 17
Note NZ$m NZ$m
Overdrafts 861 1,040
Credit cards 1,660 1,638
Term loans - housing 78,544 76,870
Term loans - non-housing 43,990 44,227
Finance lease and hire purchase receivables 1,696 1,577
Subtotal 126,751 125,352
Unearned income (236) (222)
Capitalised brokerage/mortgage origination fees 319 336
Gross loans and advances (including assets classified as held for sale) 126,834 125,466
Less: Provision for credit impairment 5 (595) (586)
Net loans and advances (including assets classified as held for sale) 126,239 124,880
Less: UDC net loans and advances held for sale 11 (3,070) (2,912)
Net loans and advances 123,169 121,968
5. PROVISION FOR CREDIT IMPAIRMENT Provision for credit impairment - balance sheet
31 Mar 18 30 Sep 17
NZ$m NZ$m
Individual provision 177 154
Collective provision 418 432
Total provision for credit impairment 595 586
Credit impairment charge - income statement 6 months to
31 Mar 18 31 Mar 17
NZ$m NZ$m
New and increased provisions 132 116
Write-backs (30) (35)
Recoveries of amounts previously written-off (18) (12)
Individual credit impairment charge 84 69
Collective credit impairment release (14) (29)
Total credit impairment charge 70 40
6. IMPAIRED AND PAST DUE LOANS 31 Mar 18 30 Sep 17
NZ$m NZ$m
Loans that are at least 90 days past due but not impaired 215 205
Impaired loans 347 361
7

Australia and New Zealand Banking Group Limited - ANZ New Zealand Unaudited NOTES TO THE FINANCIAL STATEMENTS 7. DEPOSITS AND OTHER BORROWINGS
31 Mar 18 30 Sep 17
Note NZ$m NZ$m
Term deposits 47,721 45,457
On demand and short term deposits 42,152 41,451
Deposits not bearing interest 9,940 8,882
UDC secured investments 958 1,039
Total customer deposits 100,771 96,829
Certificates of deposit 2,020 1,916
Deposits from banks and securities sold under repurchase agreements 1,643 157
Commercial paper 2,554 3,721
Deposits and other borrowings from Ultimate Parent Bank and Immediate Parent Company 5,480 6,429
Deposits and other borrowings (including liabilities classified as held for sale) 112,468 109,052
Less: UDC secured investments held for sale 11 (958) (1,039)
Deposits and other borrowings 111,510 108,013
8. DEBT ISSUANCES 31 Mar 18 30 Sep 17
NZ$m NZ$m
Senior debt 17,370 16,008 Covered bonds 3,802 5,315 Total unsubordinated debt 21,172 21,323
Subordinated debt
- Additional Tier 1 capital 1,519 1,541
- Other 1,127 1,133
Total subordinated debt 2,646 2,674
Total debt issued 23,818 23,997
Covered bonds are guaranteed by ANZNZ Covered Bond Trust Limited (the Covered Bond Guarantor), solely in its capacity as trustee of ANZNZ Covered Bond Trust (the Covered Bond Trust). The Covered Bond Trust is a member of the Banking Group, whereas the Covered Bond Guarantor is not a member of the Banking Group.
Substantially all of the assets of the Covered Bond Trust are made up of certain housing loans and related securities originated by the Bank which are security for the guarantee by the Covered Bond Guarantor as trustee of the Covered Bond Trust of issuances of covered bonds by the Bank, or its wholly owned subsidiary ANZ New Zealand (Int’l) Limited, from time to time. The assets of the Covered Bond Trust are not available to creditors of the Bank, although the Bank (or its liquidator or statutory manager) may have a claim against the residual assets of the Covered Bond Trust (if any) after all prior ranking creditors of the Covered Bond Trust have been satisfied.
8

Australia and New Zealand Banking Group Limited - ANZ New Zealand Unaudited NOTES TO THE FINANCIAL STATEMENTS 9. FAIR VALUE MEASUREMENTS Financial assets and financial liabilities measured at fair value in the balance sheet
ANZ New Zealand categorises financial assets and liabilities carried at fair value into a fair value hierarchy as required by NZ IFRS 13 Fair Value Measurement based on the observability of inputs used to measure fair value:
• Level 1 – valuations based on quoted prices (unadjusted) in active markets for identical assets or liabilities.
• Level 2 – valuations using inputs other than quoted prices included within Level 1 that are observable for a similar asset or liability, either directly or indirectly. Modelled valuation techniques are used that incorporate observable market inputs for securities with similar credit risk, maturity and yield characteristics; and or/current market yields for similar instruments.
• Level 3 – valuations using inputs for the asset or liability that are not based on observable market date (unobservable inputs).
We deem transfers into and out of Level 1 and Level 2 to have occurred as at the beginning of the reporting period in which the transfer occurred.
The table below summarises the attribution of financial instruments carried at fair value to the fair value hierarchy:
31 Mar 18 30 Sep 17 Level 1 Level 2 Level 3 Total Level 1 Level 2 Level 3 Total NZ$m NZ$m NZ$m NZ$m NZ$m NZ$m NZ$m NZ$m
Financial assets
Trading securities 6,959 1,457 - 8,416 7,276 387 - 7,663
Derivative financial instruments 4 7,983 3 7,990 5 9,741 3 9,749
Available-for-sale assets 6,018 590 1 6,609 5,336 1,023 1 6,360
Investments backing insurance contract liabilities - 152 - 152 - 123 - 123
Total financial assets held at fair value 12,981 10,182 4 23,167 12,617 11,274 4 23,895
Financial liabilities
Deposits and other borrowings - 2,554 - 2,554 - 3,721 - 3,721
Derivative financial instruments 13 7,879 1 7,893 24 9,869 1 9,894
Payables and other liabilities 179 - - 179 151 - - 151
Total financial liabilities held at fair value 192 10,433 1 10,626 175 13,590 1 13,766
Financial assets and financial liabilities not measured at fair value
Below is a comparison of the carrying amounts as reported on the balance sheet and fair values of financial asset and liability categories other than those categories where the carrying amount is at fair value or considered a reasonable approximation of fair value.
The fair values below have been calculated using discounted cash flow techniques where contractual future cash flows of the instrument are discounted using discount rates incorporating wholesale market rates or market borrowing rates of debt with similar maturities or a yield curve appropriate for the remaining term to maturity.
31 Mar 18 30 Sep 17
Carrying amount Fair value
Carrying amount Fair value
NZ$m NZ$m NZ$m NZ$m
Assets
Net loans and advances1, 2 126,239 126,423 124,880 124,930
Liabilities
Deposits and other borrowings2, 3 109,914 110,120 105,331 105,564
Debt issuances1 23,818 24,028 23,997 24,260
1 Fair value hedging is applied to certain financial instruments within these categories. The resulting fair value adjustments mean that the carrying value differs from the amortised cost.
2 Amounts include UDC items classified as held for sale. 3 Excludes commercial paper (note 7) designated at fair value through profit or loss.
9

Australia and New Zealand Banking Group Limited - ANZ New Zealand Unaudited NOTES TO THE FINANCIAL STATEMENTS 10. CREDIT RELATED COMMITMENTS, GUARANTEES AND CONTINGENT LIABILITIES 31 Mar 18 30 Sep 17
Credit related commitments and contingencies NZ$m NZ$m
Contract amount of:
Undrawn facilities 27,898 26,520
Guarantees and letters of credit 914 1,010
Performance related contingencies 1,669 1,598
Total 30,481 29,128
ANZ New Zealand guarantees the performance of customers by issuing standby letters of credit and guarantees to third parties, including its Ultimate Parent Bank. The risk involved is essentially the same as the credit risk involved in extending loan facilities to customers, therefore these transactions are subjected to the same credit origination, portfolio management and collateral requirements for customers applying for loans. As the facilities may expire without being drawn upon, the notional amounts do not necessarily reflect future cash requirements.
Other contingent liabilities
There are outstanding court proceedings, claims and possible claims for and against ANZ New Zealand. Where relevant, expert legal advice has been obtained and, in the light of such advice, provisions and/or disclosures as deemed appropriate have been made. In some instances we have not disclosed the estimated financial impact of the individual items either because it is not practicable to do so or because such disclosure may prejudice the interests of ANZ New Zealand.
In recent years there has been an increase in the number of matters on which ANZ New Zealand engages with its regulators. Globally there have been significant increases in the nature and scale of regulatory investigations and reviews, enforcement actions (whether by court action or otherwise) and the quantum of fines issued by regulators and customer claims. ANZ New Zealand also instigates engagement with its regulators. The nature of these investigations and reviews can be wide-ranging and, for example, may include a range of matters including responsible lending practices, product suitability, wealth advice and adequacy of product disclosure documentation. ANZ New Zealand has received various notices and requests for information from its regulators as part of both industry-wide (including a recent request from the Financial Markets Authority and RBNZ for all New Zealand banks to provide an overview of both work undertaken and ongoing work to identify and address conduct and culture risk) and ANZ New Zealand specific reviews, and has also made disclosures to its regulators at its own instigation. There may be exposures to customers which are additional to any regulatory exposures. These could include class actions, individual claims or customer remediation or compensation activities. The outcomes and total costs associated with such reviews and possible exposures remain uncertain.
11. ASSETS AND LIABILITIES HELD FOR SALE UDC
On 11 January 2017, the Bank announced that it had entered into a conditional agreement to sell UDC to HNA Group (HNA). On 21 December 2017, the Bank announced that it had been informed that New Zealand’s Overseas Investment Office had declined HNA’s application to acquire UDC and the agreement with HNA was terminated in January 2018.
On 20 March 2018, the Bank announced that it was continuing to examine a broad range of options for UDC’s future including an Initial Public Offering (IPO) and trade sale. As a result of the ongoing process, the assets and liabilities of UDC meet the criteria to be classified as held for sale as at 31 March 2018.
Paymark Limited (Paymark)
On 17 January 2018, the Bank entered into an agreement to sell its 25% shareholding in Paymark to Ingenico Group. The carrying amount of the Banking Group’s investment in Paymark at 31 March 2018 was NZ$7 million and the asset is classified as held for sale. The transaction is subject to regulatory consents.
12. SUBSEQUENT EVENTS On 13 April 2018, ANZ Holdings (New Zealand) Limited issued NZ$3,000 million of preference shares and paid an ordinary dividend of NZ$3,000 million to the Immediate Parent Company.
On 30 May 2018, the Bank announced that it had entered into an agreement to sell OnePath Life (NZ) Limited to Cigna Corporation. The sale is subject to certain conditions, including regulatory approvals.
10

Australia and New Zealand Banking Group Limited - ANZ New Zealand Unaudited REGISTERED BANK DISCLOSURES B1. GENERAL DISCLOSURES
Guarantors
No material obligations of the NZ Branch are guaranteed as at 30 May 2018.
Covered bonds issued by ANZ New Zealand (Int’l) Limited, a subsidiary of the Bank, are guaranteed. Refer to page 8 for further details. Changes in the Ultimate Parent Bank’s Board of Directors
As at 30 May 2018 there has been one change to the Directors of the Ultimate Parent Bank since 30 September 2017, the balance date of the last full year disclosure statement. The Rt Hon Sir John Philip Key, GNZM, AC was appointed as a Non-Executive Director on 28 February 2018.
Auditor
ANZ New Zealand’s auditor is KPMG, Chartered Accountants, Level 9, 10 Customhouse Quay, Wellington, New Zealand.
Credit Rating Information
The Ultimate Parent Bank has three credit ratings, which are applicable to its long-term senior unsecured obligations.
As at 30 May 2018, the Ultimate Parent Bank’s credit ratings are:
Rating agency Credit rating Qualification
Standard & Poor’s AA- Outlook Negative
Fitch Ratings AA- Outlook Stable
Moody’s Investors Service Aa3 Outlook Stable
Financial Support
APRA has reviewed the level of financial exposures that can be provided to the respective New Zealand banking subsidiaries and branches (New Zealand operations) of the four Australian parent banks, including the Ultimate Parent Bank.
APRA has confirmed that by 1 January 2021 no more than 5% of the Ultimate Parent Bank’s Level 1 Tier 1 capital base can comprise non-equity exposures to its New Zealand operations during ordinary times. Exposures in excess of this limit as at 1 January 2016 must be reduced in equal percentages over the five year transition period and may not increase above the exposures as at 30 June 2015. This limit does not include holdings of capital instruments or eligible secured contingent funding support provided to the Bank during times of financial stress.
The Ultimate Parent Bank established a New Zealand branch which was registered on 5 January 2009. The Bank sells, from time-to-time, residential mortgages into the NZ Branch to provide funding for the Bank’s business. As at 31 March 2018, the NZ Branch held approximately NZ$3.5 billion of residential mortgages. To satisfy APRA’s requirements described above, the Bank intends to repay this funding at approximately NZ$1.6 billion per annum over the transition period ending 31 December 2020.
APRA has also stated that contingent funding support by the Ultimate Parent Bank to the Bank during times of financial stress must be provided on terms that are acceptable to APRA and the Ultimate Parent Bank’s exposures to the Bank and its other New Zealand operations must not exceed 50% of the Ultimate Parent Bank’s Level 1 Tier 1 capital base. At present, only covered bonds meet APRA’s criteria for contingent funding. On this basis, the Ultimate Parent Bank believes it will be able to continue to provide financial support to the Bank.
Further, from 1 July 2017, APRA’s Level 3 Conglomerates regulations became effective which limit the financial and operational assistance the Ultimate Parent Bank can provide the Bank. These requirements are not expected to place additional restrictions on the Ultimate Parent Bank’s ability to provide financial or operational support to the Bank.
Financial Statements of the Ultimate Parent Bank and Overseas Banking Group
Copies of the most recent publicly available financial statements of the Ultimate Parent Bank and Overseas Banking Group will be provided immediately, free of charge, to any person requesting a copy where the request is made at the Registered Office. The most recent publicly available financial statements for the Ultimate Parent Bank and Overseas Banking Group can also be accessed at the website anz.com.
11

Australia and New Zealand Banking Group Limited - ANZ New Zealand Unaudited REGISTERED BANK DISCLOSURES B2. ADDITIONAL FINANCIAL DISCLOSURES Additional information on the balance sheet
As at 31 March 2018 NZ$m
Total interest earning and discount bearing assets 146,093
Total interest and discount bearing liabilities 127,939
Total amounts due from related entities 2,645
Total amounts due to related entities 8,656
Total liabilities of the NZ Branch less amounts due to related entities 1,057
Assets charged as security for liabilities
These amounts exclude the amounts disclosed as collateral paid on the balance sheet that relate to derivative liabilities. The terms and conditions of the collateral agreements are included in the standard Credit Support Annex that forms part of the International Swaps and Derivatives Association Master Agreement.
Assets charged as security for liabilities include the following types of instruments: • Securities provided as collateral for repurchase transactions. These transactions are governed by standard industry agreements. • UDC secured investments are secured by a security interest granted under the trust deed over all of UDC’s present and future assets
and undertakings, to Trustees Executors Limited, as supervisor. The assets subject to the security interest comprise mainly loans to UDC's customers and certain plant and equipment. The security interest secures all amounts payable by UDC on the UDC secured investments and all other moneys payable by UDC under the trust deed.
• Specified residential mortgages provided as security for notes and bonds issued to investors as part of the Bank’s covered bond programme.
The amortised cost of assets pledged as security are as follows:
As at 31 March 2018 Note NZ$m
Securities sold under agreements to repurchase 1,610
Residential mortgages pledged as security for covered bonds 8 10,865
Assets pledged as collateral for UDC secured investments 3,151
Additional information on the income statement
The amounts of net trading gains or losses and other fair value adjustments are included in note 2 to the financial statements. ANZ New Zealand does not have any loans and advances designated at fair value through profit or loss. Other operating income for the purposes of the Order comprises Net fee and commission income, Insurance proceeds and Other (all in note 2), Net funds management and insurance income and Share of associates’ profit (both shown on the income statement).
12

Australia and New Zealand Banking Group Limited - ANZ New Zealand Unaudited REGISTERED BANK DISCLOSURES Additional information on concentrations of credit risk
Concentrations of credit risk arise when a number of customers are engaged in similar business activities or activities within the same geographic region, or when they have similar risk characteristics that would cause their ability to meet contractual obligations to be similarly affected by changes in economic or other conditions.
Analysis of financial assets by industry sector is based on Australian and New Zealand Standard Industrial Classification (ANZSIC) codes. The significant categories shown are the level one New Zealand Standard Industry Output Categories (NZSIOC), except that Agriculture is shown separately as required by the Order.
Cash, settlements
receivable and collateral
paid
Trading securities and available-for-
sale assets
Derivative financial
instruments Net loans and
advances3
Other financial
assets Credit related
commitments4 Total
As at 31 March 2018 NZ$m NZ$m NZ$m NZ$m NZ$m NZ$m NZ$m
New Zealand residents
Agriculture - - 24 17,602 60 1,396 19,082
Forestry and fishing, agriculture services - - 2 1,549 5 215 1,771
Manufacturing - 29 136 2,764 9 1,737 4,675
Electricity, gas, water and waste services - 19 431 1,575 5 1,732 3,762
Construction - - 15 1,698 6 1,134 2,853
Wholesale trade - - 64 1,549 5 1,651 3,269
Retail trade and accommodation - - 20 3,091 10 877 3,998
Transport, postal and warehousing - 29 56 1,358 5 589 2,037
Finance and insurance services 2,788 2,237 814 908 373 1,038 8,158
Public administration and safety1 - 8,606 631 300 5 1,213 10,755
Rental, hiring & real estate services - 5 113 31,527 107 2,263 34,015 Professional, scientific, technical, administrative and support services - - 4 1,210 4 503 1,721
Households - - - 56,499 191 14,235 70,925
All other New Zealand residents2 - 31 224 2,505 9 1,750 4,519
2,788 10,956 2,534 124,135 794 30,333 171,540 Overseas Finance and insurance services 2,101 4,006 4,979 137 - 148 11,371
Households - - - 1,553 5 - 1,558
All other non-NZ residents 1 63 477 926 3 - 1,470
2,102 4,069 5,456 2,616 8 148 14,399 Less: Provision for credit impairment - - - (523) - (72) (595)
Less: Unearned income - - - (236) - - (236) Add: Capitalised brokerage / mortgage origination fees
- - - 319 - - 319
Total financial assets 4,890 15,025 7,990 126,311 802 30,409 185,427
1 Public administration and safety includes exposures to local government administration and central government administration, defence and public safety. 2 Other includes exposures to mining, information media and telecommunications, education and training, health care and social assistance and arts, recreation and other
services. 3 Excludes individual and collective provisions for credit impairment held in respect of credit related commitments. 4 Credit related commitments comprise undrawn facilities, customer contingent liabilities and letters of offer.
13

Australia and New Zealand Banking Group Limited - ANZ New Zealand Unaudited REGISTERED BANK DISCLOSURES Additional information on concentrations of funding
ANZ New Zealand actively uses balance sheet disciplines to prudently manage the funding mix. ANZ New Zealand employs funding metrics to ensure that an appropriate proportion of its assets are funded from stable sources, including customer liabilities, longer-dated wholesale debt (with remaining term exceeding one year) and equity.
Analysis of funding liabilities by industry is based on ANZSIC codes. The significant categories shown are the level one New Zealand Standard Industry Output Categories (NZSIOC). 31 Mar 18
Funding composition Note NZ$m
Customer deposits 7 100,771
Wholesale funding
Debt issuances 8 23,818
Certificates of deposit 7 2,020
Commercial paper 7 2,554
Other borrowings 7 7,123
Total wholesale funding 35,515
Total funding 136,286
Concentrations of funding by industry
Customer deposits - New Zealand residents
Agriculture, forestry and fishing 3,722
Manufacturing 2,152
Construction 1,913
Wholesale trade 1,548
Retail trade and accommodation 1,691
Financial and insurance services 9,798
Rental, hiring and real estate services 2,741
Professional, scientific, technical, administrative and support services 5,081
Public administration and safety 1,403
Arts, recreation and other services 1,914
Households 54,747
All other New Zealand residents1 3,926
90,636
Customer deposits - overseas
Households 9,570
All other non-NZ residents 565
10,135
Total customer deposits 100,771
Wholesale funding (financial and insurance services industry)
New Zealand 7,927
Overseas 27,588
Total wholesale funding 35,515
Total funding 136,286
Concentrations of funding by geography
New Zealand 98,563
Australia 6,980
United States 12,670
Europe 10,735
Other countries 7,338
Total funding 136,286 1 Other includes mining; electricity, gas, water and waste services; transport, postal and warehousing; information media and telecommunications; education and training;
health care and social assistance.
14

Australia and New Zealand Banking Group Limited - ANZ New Zealand Unaudited REGISTERED BANK DISCLOSURES Additional information on interest rate sensitivity
The following tables represent the interest rate sensitivity of ANZ New Zealand's assets, liabilities and off balance sheet instruments by showing the periods in which these instruments may reprice, that is, when interest rates applicable to each asset or liability can be changed.
Total
Up to 3 months
Over 3 to 6 months
Over 6 to 12 months
Over 1 to 2 years
Over 2 years
Not bearing interest
As at 31 March 2018 NZ$m NZ$m NZ$m NZ$m NZ$m NZ$m NZ$m
Assets
Cash 2,752 2,493 - - - - 259
Settlement balances receivable 763 132 - - - - 631
Collateral paid 1,634 1,634 - - - - -
Trading securities 8,416 1,140 380 1,567 597 4,732 -
Derivative financial instruments 7,990 - - - - - 7,990
Available-for-sale assets 6,609 665 260 1,243 283 4,157 1
Net loans and advances 126,239 63,118 10,127 21,074 21,363 10,976 (419)
Other financial assets 802 119 27 4 2 - 650
Total financial assets 155,205 69,301 10,794 23,888 22,245 19,865 9,112
Liabilities
Settlement balances payable 1,742 653 - - - - 1,089
Collateral received 760 760 - - - - -
Deposits and other borrowings 112,468 74,352 13,170 9,365 3,471 2,170 9,940
Derivative financial instruments 7,893 - - - - - 7,893
Debt issuances 23,818 2,990 1,439 2,770 1,126 15,493 -
Payables and other liabilities 756 180 - - - - 576
Total financial liabilities 147,437 78,935 14,609 12,135 4,597 17,663 19,498
Hedging instruments - 4,284 5,135 (6,211) (8,071) 4,863 -
Interest sensitivity gap 7,768 (5,350) 1,320 5,542 9,577 7,065 (10,386)
Additional information on liquidity risk
Maturity analysis of financial liabilities
The table below provides residual contractual maturity analysis of financial liabilities at 31 March 2018 within relevant maturity groupings. All outstanding debt issuances are profiled on the earliest date on which ANZ New Zealand may be required to pay. The amounts represent principal and interest cash flows – so they may differ from equivalent amounts reported on balance sheet.
Total On demand
Up to 3 months
Over 3 to 12 months
Over 1 to 5 years
Over 5 years
As at 31 March 2018 NZ$m NZ$m NZ$m NZ$m NZ$m NZ$m
Financial liabilities
Settlement balances payable 1,753 1,160 593 - - -
Collateral received 760 - 760 - - -
Deposits and other borrowings 122,083 59,784 27,422 26,994 6,789 1,094
Derivative financial liabilities (trading) 6,071 - 6,071 - - -
Debt issuances 26,099 - 919 3,949 15,712 5,519
Other financial liabilities 407 - 46 23 87 251
Derivative financial instruments (balance sheet management)
- gross inflows 17,311 - 1,146 4,195 8,771 3,199
- gross outflows (17,150) - (1,228) (4,442) (8,691) (2,789) Less than Beyond
Total 1 year 1 year
As at 31 March 2018 NZ$m NZ$m NZ$m
Off-balance sheet commitments and contingent liabilities
Non-credit related commitments 457 56 401
Credit related commitments and contingencies 30,481 30,481 -
15
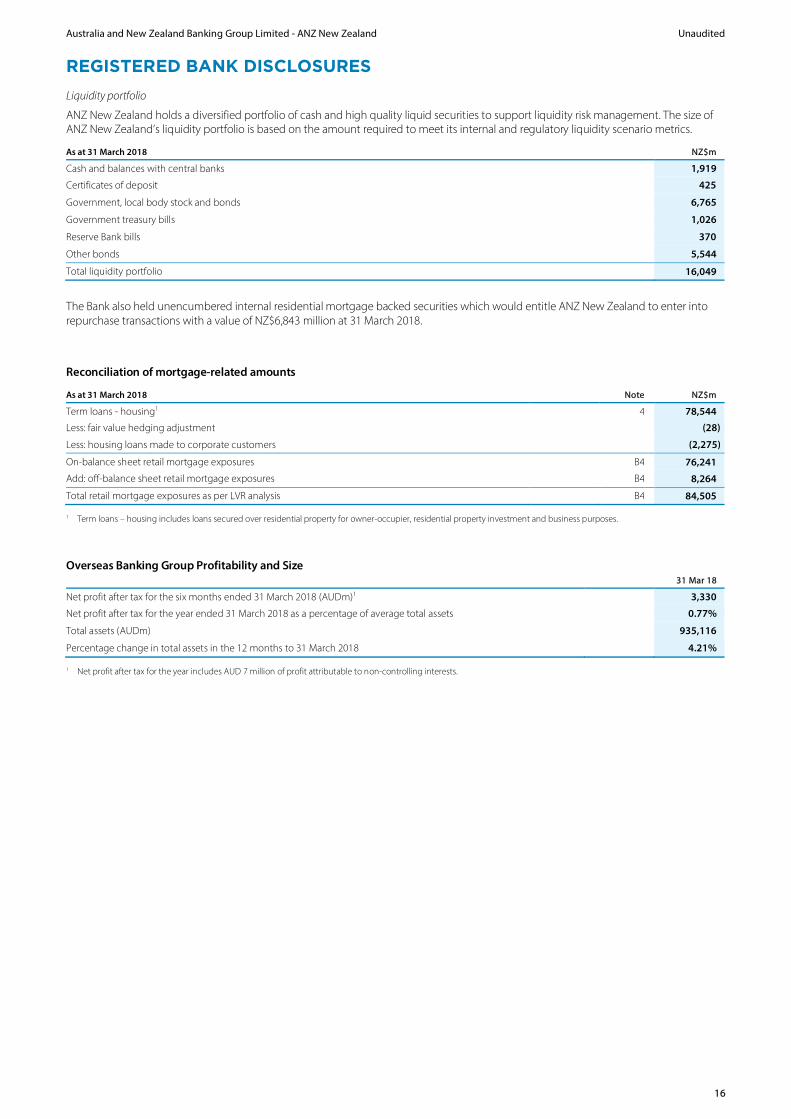
Australia and New Zealand Banking Group Limited - ANZ New Zealand Unaudited REGISTERED BANK DISCLOSURES Liquidity portfolio
ANZ New Zealand holds a diversified portfolio of cash and high quality liquid securities to support liquidity risk management. The size of ANZ New Zealand’s liquidity portfolio is based on the amount required to meet its internal and regulatory liquidity scenario metrics.
As at 31 March 2018 NZ$m
Cash and balances with central banks 1,919
Certificates of deposit 425
Government, local body stock and bonds 6,765
Government treasury bills 1,026
Reserve Bank bills 370
Other bonds 5,544
Total liquidity portfolio 16,049
The Bank also held unencumbered internal residential mortgage backed securities which would entitle ANZ New Zealand to enter into repurchase transactions with a value of NZ$6,843 million at 31 March 2018. Reconciliation of mortgage-related amounts As at 31 March 2018 Note NZ$m
Term loans - housing1 4 78,544
Less: fair value hedging adjustment (28)
Less: housing loans made to corporate customers (2,275)
On-balance sheet retail mortgage exposures B4 76,241
Add: off-balance sheet retail mortgage exposures B4 8,264
Total retail mortgage exposures as per LVR analysis B4 84,505
1 Term loans – housing includes loans secured over residential property for owner-occupier, residential property investment and business purposes.
Overseas Banking Group Profitability and Size
31 Mar 18
Net profit after tax for the six months ended 31 March 2018 (AUDm)1 3,330
Net profit after tax for the year ended 31 March 2018 as a percentage of average total assets 0.77%
Total assets (AUDm) 935,116
Percentage change in total assets in the 12 months to 31 March 2018 4.21%
1 Net profit after tax for the year includes AUD 7 million of profit attributable to non-controlling interests.
16

Australia and New Zealand Banking Group Limited - ANZ New Zealand Unaudited REGISTERED BANK DISCLOSURES B3. ASSET QUALITY Past due assets
Retail
mortgages Other retail
exposures Non-retail exposures Total
As at 31 March 2018 NZ$m NZ$m NZ$m NZ$m
Less than 30 days past due 633 177 607 1,417
At least 30 days but less than 60 days past due 147 42 96 285
At least 60 days but less than 90 days past due 126 19 10 155
At least 90 days past due 161 36 18 215
Total past due but not impaired 1,067 274 731 2,072
Movement in individually impaired assets
Retail
mortgages Other retail
exposures Non-retail exposures Total
For the six months ended 31 March 2018 NZ$m NZ$m NZ$m NZ$m
Balance at beginning of the period 35 20 306 361 Additions 12 53 116 181
Amounts written off (2) (38) (38) (78)
Deletions (22) (12) (83) (117)
Balance at end of the period 23 23 301 347
Individual provision 23 7 147 177
Movement in balances of individual credit impairment allowances
Retail
mortgages Other retail
exposures Non-retail exposures Total
For the six months ended 31 March 2018 NZ$m NZ$m NZ$m NZ$m
Balance at beginning of the period 27 6 121 154 Individual credit impairment charge / (release) New and increased provisions 3 45 84 132 Write-backs (5) (6) (19) (30) Recoveries of amounts previously written off - (11) (7) (18) Individual credit impairment charge / (release) (2) 28 58 84 Bad debts written off (2) (38) (38) (78)
Add back recoveries of amounts previously written off - 11 7 18
Discount unwind - - (1) (1)
Balance at end of the period 23 7 147 177
Movement in balances of collective credit impairment allowances
Retail
mortgages Other retail
exposures Non-retail exposures Total
For the six months ended 31 March 2018 NZ$m NZ$m NZ$m NZ$m
Balance at beginning of the period 80 121 231 432
Charge / (release) to income statement 4 5 (23) (14)
Balance at end of the period 84 126 208 418
Asset quality for assets designated at fair value
The Banking Group does not have any loans and advances designated at fair value through profit or loss.
17

Australia and New Zealand Banking Group Limited - ANZ New Zealand Unaudited REGISTERED BANK DISCLOSURES Other asset quality information
Retail
mortgages Other retail
exposures Non-retail exposures Total
As at 31 March 2018 NZ$m NZ$m NZ$m NZ$m
Undrawn facilities with impaired customers - - 12 12 Other assets under administration 9 3 - 12
Overseas Banking Group asset quality
As at 31 March 2018
Gross impaired assets (AUDm) 2,034
Gross impaired assets as a percentage of total assets 0.2%
Individual provision (AUDm) 1,016
Individual provision as a percentage of gross impaired assets 50.0%
Collective provision (AUDm) 2,579
B4. CREDIT AND MARKET RISK EXPOSURES AND CAPITAL ADEQUACY Additional mortgage information
As required by the RBNZ, loan-to-valuation ratios (LVR) are calculated as the current exposure secured by a residential mortgage divided by ANZ New Zealand's valuation of the security property at origination of the exposure. Off balance sheet exposures include undrawn and partially drawn residential mortgage loans as well as commitments to lend. Commitments to lend are formal offers for housing lending which have been accepted by the customer. On-balance
sheet Off-balance
sheet Total As at 31 March 2018 NZ$m NZ$m NZ$m
LVR range
Does not exceed 60% 37,264 5,445 42,709
Exceeds 60% and not 70% 17,266 1,379 18,645
Exceeds 70% and not 80% 17,571 1,110 18,681
Does not exceed 80% 72,101 7,934 80,035
Exceeds 80% and not 90% 2,690 150 2,840
Exceeds 90% 1,450 180 1,630
Total retail mortgage exposures 76,241 8,264 84,505
Market risk
ANZ New Zealand’s aggregate market risk exposures below have been calculated in accordance with the RBNZ Banking Supervision Handbook document Capital Adequacy Framework (Standardised Approach) (BS2A).
Implied risk weighted exposure Notional capital charge Peak
Period end Peak Period end Peak occurred on
As at 31 March 2018 NZ$m NZ$m NZ$m NZ$m
Interest rate risk 3,833 6,391 307 511 24/01/2018
Foreign currency risk 53 183 4 15 6/02/2018
Equity risk 1 1 - - 31/03/2018
3,887 311
18

Australia and New Zealand Banking Group Limited - ANZ New Zealand Unaudited REGISTERED BANK DISCLOSURES APRA Basel III capital ratios
Overseas Banking Group Ultimate Parent Bank
(Extended Licensed Entity)
As at 31 Mar 18 31 Mar 17 31 Mar 18 31 Mar 17
Common equity tier 1 capital 11.0% 10.1% 10.9% 10.2%
Tier 1 capital 12.9% 12.1% 12.9% 12.3%
Total capital 14.9% 14.5% 15.1% 14.8%
The Ultimate Parent Bank and the Overseas Banking Group are required to hold minimum capital as determined by APRA, which is at least equal to that specified under the Basel III capital framework.
APRA has authorised the Ultimate Parent Bank and the Overseas Banking Group to use: • the Advanced Internal Ratings Based (AIRB) methodology for calculation of credit risk weighted assets. There are however several small
portfolios (mainly retail and local corporates in Asia Pacific) where the Overseas Banking Group applies the standardised approach • the Advanced Measurement Approach (AMA) for the operational risk weighted asset equivalent.
The Overseas Banking Group exceeded the minimum capital requirement set by APRA as at 31 March 2018.
The Overseas Banking Group is required to publicly disclose Pillar 3 financial information as at 31 March 2018. The Overseas Banking Group’s Pillar 3 disclosure document for the quarter ended 31 March 2018, in accordance with APS 330: Public Disclosure of Prudential Information, discloses capital adequacy ratios and other prudential information. This document can be accessed at the website anz.com.
B5. INSURANCE BUSINESS ANZ New Zealand conducts insurance business through its subsidiary OnePath Life (NZ) Limited (OnePath Life). ANZ New Zealand’s aggregate amount of insurance business comprises the total assets of OnePath Life of NZ$984 million, which is 0.6% of the total consolidated assets of ANZ New Zealand.
19

Australia and New Zealand Banking Group Limited - ANZ New Zealand
DIRECTORS' AND NEW ZEALAND CHIEF EXECUTIVE OFFICER'S STATEMENT As at the date on which this Disclosure Statement is signed, after due enquiry, each Director of the Ultimate Parent Bank and the Chief Executive Officer – NZ Branch believes that:
(i) The Disclosure Statement contains all the information that is required by the Registered Bank Disclosure Statements (Overseas Incorporated Registered Banks) Order 2014
(ii) The Disclosure Statement is not false or misleading.
Over the six months ended 31 March 2018, after due enquiry, each Director of the Ultimate Parent Bank and the Chief Executive Officer – NZ Branch believes that:
(i) The Ultimate Parent Bank has complied with all Conditions of Registration that applied during that period
(ii) The NZ Branch and the Bank had systems in place to monitor and control adequately the material risks of Relevant Members of ANZ New Zealand including credit risk, concentration of credit risk, interest rate risk, currency risk, equity risk, liquidity risk and other business risks, and that those systems were being properly applied.
This Disclosure Statement is dated 30 May 2018, and has been signed by the Chairman of the Ultimate Parent Bank, on behalf of all Directors, and by the Chief Executive Officer – NZ Branch.
David Gonski, AC Penny Dell Chairman, Chief Executive Officer – NZ Branch on behalf of the Directors: Ilana Atlas Paula Dwyer Shayne Elliott David Gonski, AC Jane Halton, AO, PSM The Rt Hon Sir John Key, GNZM, AC Lee Hsien Yang Graeme Liebelt John Macfarlane
20
© 2018 KPMG, a New Zealand partnership and a member firm of the KPMG network of independent member firms affiliated with KPMG International Cooperative (“KPMG International”), a Swiss entity.
Independent Review Report To the directors of Australia and New Zealand Banking Group Limited – ANZ New Zealand
Report on the half year disclosure statement
Conclusion
Based on our review of the interim financial statements and the registered bank disclosures (together referred to as ‘the disclosure statement’), of the Australia and New Zealand Banking Group Limited – ANZ New Zealand (‘ANZ New Zealand’) on pages 2 to 20, nothing has come to our attention that causes us to believe that:
i. the interim financial statements on pages 2 to 10 do not present fairly in accordance with NZ IAS 34 Interim Financial Reporting and IAS 34 Interim Financial Reporting, in all material respects, ANZ New Zealand’s financial position as at 31 March 2018 and its financial performance and cash flows for the 6 month period ended on that date;
ii. the registered bank disclosures in sections B1, B2, B3, B5 and B6 disclosed in accordance with schedules 5, 7, 10, 12 and 14 of the Registered Bank Disclosure Statements (Overseas Incorporated Registered Banks) Order 2014 (as amended) (‘the Order’) respectively, do not fairly state, in all material respects, the matters to which they relate in accordance with those schedules
iii. the registered bank disclosures relating to credit and market risk exposures and capital adequacy in section B4 is not, in all material respects, disclosed in accordance with schedule 9 of the Order.
We have completed a review of the accompanying half year disclosure statement which comprises:
— the interim financial statements formed of:
- the consolidated balance sheet as at 31 March 2018;
- the consolidated income statement, statements of comprehensive income, changes in equity and cash flows for the 6 month period then ended; and
- notes, including a summary of significant accounting policies and other explanatory information.
— the supplementary information prescribed in Schedules 5, 7, 9, 10, 12 and 14 of the Order.
Basis for conclusion
A review of the half year disclosure statement in accordance with NZ SRE 2410 Review of Financial Statements Performed by the Independent Auditor of the Entity (“NZ SRE 2410”) is a limited assurance engagement. The auditor performs procedures, consisting of making enquiries, primarily of persons responsible for financial and accounting matters, and applying analytical and other review procedures.
As the auditor of Australia and New Zealand Banking Group Limited – ANZ New Zealand, NZ SRE 2410 requires that we comply with the ethical requirements relevant to the audit of the annual financial statements.
Our firm has also provided other services to ANZ New Zealand in relation to review and other assurance engagements. Subject to certain restrictions, partners and employees of our firm may also deal with ANZ New Zealand on normal terms within the ordinary course of trading activities of the business of ANZ New Zealand. These matters have not impaired our independence as reviewer of ANZ New Zealand. The firm has no other relationship with, or interest in, ANZ New Zealand.

22
Use of this independent review report
This independent review report is made solely to the directors as a body of ANZ New Zealand. Our review work has been undertaken so that we might state to the directors those matters we are required to state to them in the independent review report and for no other purpose. To the fullest extent permitted by law, we do not accept or assume responsibility to anyone other than the directors as a body for our review work, this independent review report, or any of the opinions we have formed.
Responsibilities of the Directors for the half year disclosure statement
The Directors, on behalf of ANZ New Zealand, are responsible for:
— the preparation and fair presentation of the half year disclosure statement in accordance with NZ IAS 34 and Schedules 2, 5, 7, 10, 12 and 14 of the Order;
— the preparation and fair presentation of ANZ New Zealand’s disclosures in regards to credit and market risk exposures and capital adequacy in accordance with Schedule 9 of the Order;
— implementing necessary internal control to enable the preparation of a half year disclosure statement that is fairly presented and free from material misstatement, whether due to fraud or error; and
— assessing the ability to continue as a going concern. This includes disclosing, as applicable, matters related to going concern and using the going concern basis of accounting unless they either intend to liquidate or to cease operations, or have no realistic alternative but to do so.
Auditor’s responsibilities for the review of the half year disclosure statement
Our responsibility is to express a conclusion on the half year disclosure statement based on our review. We conducted our review in accordance with NZ SRE 2410. NZ SRE 2410 requires us to conclude whether anything has come to our attention that causes us to believe that the:
— the interim financial statements do not present fairly in all material respects ANZ New Zealand’s financial position as at 31 March 2018 and its financial performance and cash flows for the 6 month period ended on that date;
— the interim financial statements do not, in all material respects, comply with NZ IAS 34;
— the registered bank disclosures in sections B1, B2, B3, B5 and B6 does not, fairly state, in all material respects, the matters to which it relates in accordance with Schedules 5, 7, 13, 16 and 18 of the Order; and
— the registered bank disclosures relating to credit and market risk exposures and capital adequacy in section B4 is not, in all material respects, disclosed in accordance with schedule 9 of the Order.
The procedures performed in a review are substantially less than those performed in an audit conducted in accordance with International Standards on Auditing (New Zealand). Accordingly we do not express an audit opinion on the half year disclosure statement. This description forms part of our independent review report.
KPMG
Auckland
30 May 2018

Australia and New Zealand Banking Group Limited - ANZ New Zealand Unaudited
BANK FINANCIAL STRENGTH DASHBOARD
Background
This section does not form part of the Disclosure Statement and contains the information in respect of the ANZ New Zealand included on the Bank Financial Strength Dashboard (Dashboard) published on the RBNZ’s website. Amounts below may differ slightly from those published by the RBNZ due to rounding differences. The tables below include reconciliations to amounts included in the Disclosure Statement where there are classification differences between the financial statements and the Dashboard. D1. ASSET QUALITY Housing Consumer Business Agriculture All other Total As at 31 March 2018 NZ$m NZ$m NZ$m NZ$m NZ$m NZ$m
Total loans 75,894 3,538 28,844 17,166 1,374 126,816
Impaired loans 48 8 130 75 87 348
Loans 90 days past due but not impaired 159 28 23 5 - 215
Total non-performing loans 207 36 153 80 87 563
Non-performing loans ratio (%) 0.27% 1.02% 0.53% 0.47% 6.33% 0.44%
Individual provisions 12 6 78 24 56 176
Collective provisions 71 66 91 42 148 418
On-balance sheet residential mortgage exposures with LVRs that:
Exceeds 80% and not 90% 3.5%
Exceeds 90% 1.9%
A reconciliation of the amounts in this table to the financial statements is included in the Other Information on page 24.
D2. PROFITABILITY / PERFORMANCE Classification differences
Financial statements
Funds management income and other
commissions Dashboard
3 months to 31 March 2018 NZ$m NZ$m NZ$m
Total interest income 1,609 - 1,609
Total interest expense 830 - 830
Net interest income 779 - 779
Gains/losses on trading and hedging 33 - 33
Fee and commission income 96 62 158
All other income 121 (62) 59
Operating expenses 361 - 361
Impaired asset expense 59 - 59
Profit before tax 609 - 609
Tax expense 165 - 165
Profit after tax 444 - 444
Return on assets (%) 1.1%
Return on equity (%) 15.2%
Net interest margin (%) 2.2%
The Supplementary Information does not form part of the Disclosure Statement 23

Australia and New Zealand Banking Group Limited - ANZ New Zealand Unaudited
BANK FINANCIAL STRENGTH DASHBOARD
D3. FINANCIAL POSITION Classification differences
Financial
statements
Nostros / vostros and other bank
deposits
Securities purchased under
agreements to re-sell
Subordinated debt issued to related parties Dashboard
As at 31 March 2018 NZ$m NZ$m NZ$m NZ$m NZ$m
Cash and bank deposits1 4,386 247 (862) - 3,771
Debt securities held2 15,177 (86) - - 15,091
Net loans and advances 126,239 - - - 126,239
Derivatives in an asset position 7,990 - - - 7,990
All other assets 5,927 (161) 862 - 6,628
Total assets 159,719 - - - 159,719 Deposits 100,771 - - - 100,771
Debt securities issued3 28,392 - - (292) 28,100
Other borrowings4 7,883 1,161 - 292 9,336
Derivatives in a liability position 7,893 - - - 7,893
All other liabilities 3,304 (1,161) - - 2,143 Total liabilities (excluding head office account) 148,243 - - - 148,243
Equity 11,476 - - - 11,476
1 Comprises cash and collateral paid
2 Comprises trading securities, investments backing insurance contract liabilities and available-for-sale assets 3 Comprises debt issuances plus certificates of deposit and commercial paper from deposits and other borrowings 4 Comprises collateral received and the remaining items of deposits and other borrowings
OTHER INFORMATION
Reconciliation of total loans by industry and sector
The financial statements and Dashboard include amounts for total loans which are based on different definitions. The table below reconciles the various amounts. This information does not form part of the Disclosure Statement. Housing Consumer Business Agriculture All other1 Total As at 31 March 2018 Note NZ$m NZ$m NZ$m NZ$m NZ$m NZ$m
Total loans per Balance Sheet 4 78,544 n/a n/a n/a 48,207 126,751
Fair value hedge adjustment (28) - - - 28 -
Business loans secured by residential property (2,622) - - 337 2,285 -
Residential investor property (21,380) - - 49 21,331 -
Other household and agriculture industry loans - 3,538 - 17,216 (20,754) -
Concentration of loans by industry2 B2 54,514 3,538 - 17,602 51,097 126,751
Fair value hedge adjustments - - - - (28) (28)
Unearned income on finance leases - - - - (197) (197)
Deposit components of overdraft product - - - - 290 290
Residential investor property 21,380 - - (49) (21,331) -
Business lending - - 28,470 (50) (28,420) -
Loans by purpose (RBNZ series S31) 75,894 3,538 28,470 17,503 1,411 126,816
Other business loans secured by residential property - - 374 (337) (37) -
Total loans per Dashboard D1 75,894 3,538 28,844 17,166 1,374 126,816
1 All other in RBNZ series S31 and the Dashboard comprises: Depository and other financial institutions, Central and Local Government, Non-profit institutions serving households.
2 Household exposures (resident and non-resident) in note B2 comprise Housing and Consumer.
The Supplementary Information does not form part of the Disclosure Statement 24