
Any Good News in Soft News? The Impact of Soft News ...
23
149 Political Communication, 20:149–171, 2003 Copyright 2003 Taylor & Francis 1058-4609/03 $12.00 + .00 DOI: 10.1080/10584600390211172 Any Good News in Soft News? The Impact of Soft News Preference on Political Knowledge MARKUS PRIOR Several scholars, most notably Matt Baum, have recently argued that soft news for- mats contribute to democratic discourse, because they attract viewers who would otherwise not be exposed to news at all. I extend Baum’s approach in two ways. First, Baum’s theory postulates that people’s appreciation of entertainment is one of the factors determining news exposure and, by extension, attention to politics, but he does not analyze the underlying utility calculation directly. I create a measure of entertainment preference and examine its impact on people’s preferred news for- mats. Second, while Baum’s analysis is restricted to attention paid to politics, I assess the effect of soft news preference on political knowledge. If soft news leads people to pay more attention to the “entertaining” aspect of politics, but does not actually produce any learning effects, the suggested positive consequences of soft news would have to be qualified. The main data source for this article is a survey of 2,358 randomly selected U.S. residents conducted by Knowledge Networks in Febru- ary and March 2002. Results show that people like soft news for its entertainment value but that soft news programs are still not very popular compared to hard news and pure entertainment. More critically, there is only very limited evidence that viewers actually learn from soft news. The positive consequences of soft news for the political process remain to be demonstrated. Keywords entertainment preference, hard news, news preference, political knowl- edge, soft news So-called “soft news” programs have proliferated in the last decade or so. According to a definition by Tom Patterson (2000, p. 4), soft news is “typically more sensational, more personality-centered, less time-bound, more practical, and more incident-based than other news.” 1 While critics have rushed to debate the normative implications of soft news, empirical assessments of the consequences of greater diversity of news formats are still rare. In the most important analysis to date, Matt Baum (2002b) shows that some people who would otherwise not watch any news at all pay attention to soft news I am grateful to David Brady, who made it possible for me to design the survey that pro- vides the data for this article. The writing of the article was supported in part by a Pew Summer Writing Fellowship from the Pew Internet & American Life Project. My thanks to Doug Arnold, Larry Bartels, Matt Baum, Michael Delli Carpini, and Jay Hamilton for many helpful comments. Markus Prior is a Ph.D. Candidate in the Department of Communication at Stanford Univer- sity and a Visiting Fellow at the Center for the Study of Democratic Politics, Woodrow Wilson School, Princeton University. Address correspondence to Markus Prior, Woodrow Wilson School, Princeton University, Princeton, NJ 08544-1013. E-mail: [email protected]
Transcript of Any Good News in Soft News? The Impact of Soft News ...
149
Political Communication, 20:149–171, 2003Copyright 2003 Taylor & Francis1058-4609/03 $12.00 + .00DOI: 10.1080/10584600390211172
Any Good News in Soft News? The Impact of SoftNews Preference on Political Knowledge
MARKUS PRIOR
Several scholars, most notably Matt Baum, have recently argued that soft news for-mats contribute to democratic discourse, because they attract viewers who wouldotherwise not be exposed to news at all. I extend Baum’s approach in two ways.First, Baum’s theory postulates that people’s appreciation of entertainment is one ofthe factors determining news exposure and, by extension, attention to politics, but hedoes not analyze the underlying utility calculation directly. I create a measure ofentertainment preference and examine its impact on people’s preferred news for-mats. Second, while Baum’s analysis is restricted to attention paid to politics, Iassess the effect of soft news preference on political knowledge. If soft news leadspeople to pay more attention to the “entertaining” aspect of politics, but does notactually produce any learning effects, the suggested positive consequences of softnews would have to be qualified. The main data source for this article is a survey of2,358 randomly selected U.S. residents conducted by Knowledge Networks in Febru-ary and March 2002. Results show that people like soft news for its entertainmentvalue but that soft news programs are still not very popular compared to hard newsand pure entertainment. More critically, there is only very limited evidence thatviewers actually learn from soft news. The positive consequences of soft news forthe political process remain to be demonstrated.
Keywords entertainment preference, hard news, news preference, political knowl-edge, soft news
So-called “soft news” programs have proliferated in the last decade or so. According toa definition by Tom Patterson (2000, p. 4), soft news is “typically more sensational,more personality-centered, less time-bound, more practical, and more incident-based thanother news.”1 While critics have rushed to debate the normative implications of softnews, empirical assessments of the consequences of greater diversity of news formatsare still rare. In the most important analysis to date, Matt Baum (2002b) shows thatsome people who would otherwise not watch any news at all pay attention to soft news
I am grateful to David Brady, who made it possible for me to design the survey that pro-vides the data for this article. The writing of the article was supported in part by a Pew SummerWriting Fellowship from the Pew Internet & American Life Project. My thanks to Doug Arnold,Larry Bartels, Matt Baum, Michael Delli Carpini, and Jay Hamilton for many helpful comments.
Markus Prior is a Ph.D. Candidate in the Department of Communication at Stanford Univer-sity and a Visiting Fellow at the Center for the Study of Democratic Politics, Woodrow WilsonSchool, Princeton University.
Address correspondence to Markus Prior, Woodrow Wilson School, Princeton University,Princeton, NJ 08544-1013. E-mail: [email protected]
150 Markus Prior
coverage of wars and foreign crises. Baum argues that some people do not watch hardnews programs because the opportunity costs from forfeiting payoffs from entertainmentare too high. By focusing on the more entertaining, shocking, or scandalous aspects ofpolitics, soft news offers these people an alternative that maximizes their utility becauseit combines entertainment and information.
In this article, I extend Baum’s approach in two ways. First, I measure people’spreferences for information and entertainment directly. Since Baum must rely on sec-ondary data analysis, he simply examines how people’s self-reported soft news exposureaffects their attention to various news topics. He cannot test his theoretical argumentabout the underlying utility calculation directly. The theory assumes, however, that people’sappreciation of entertainment is one of the factors determining news exposure and, byextension, attention to politics. My goal is to measure entertainment preference and gaugeits impact on people’s preferred news formats.
Second, Baum’s dependent variable is the amount of attention people pay to warsand foreign policy crises. While getting people’s attention is an important prerequisitefor creating an informed public, the crucial step is learning. If soft news does not onlyreach people who previously avoided the news, but also increases their knowledge ofsome political matters, it could arguably play an important role in a democratic system.If, on the other hand, soft news leads people to pay more attention to the “entertaining”aspect of politics but does not actually produce any learning effects, the suggested posi-tive consequences of soft news would have to be qualified. To address this question, Imeasure people’s knowledge of several “hard” and “soft” political topics.
Data for this article come from a Web-based survey of 2,358 randomly selectedU.S. residents. The survey was conducted by Knowledge Networks (KN) in Februaryand March 2002. Knowledge Networks interviews national probability samples of theU.S. population over the Internet by providing a large panel, selected through randomdigit dialing (RDD), with WebTV units and free Internet connections in exchange fortaking surveys. The participants for this study constitute a randomly selected subset ofthe KN panel, and hence a random sample of U.S. residents.2
How Popular Is Soft News?
Before delving into the analysis of why people watch soft news and how much theylearn from it, it is useful to assess the popularity of soft news programs compared tomore traditional formats. As the following analyses show, the audience for soft news,far from rising to ever greater majorities of news users, is relatively small and hasgrown slowly, if at all, in the past couple of years.
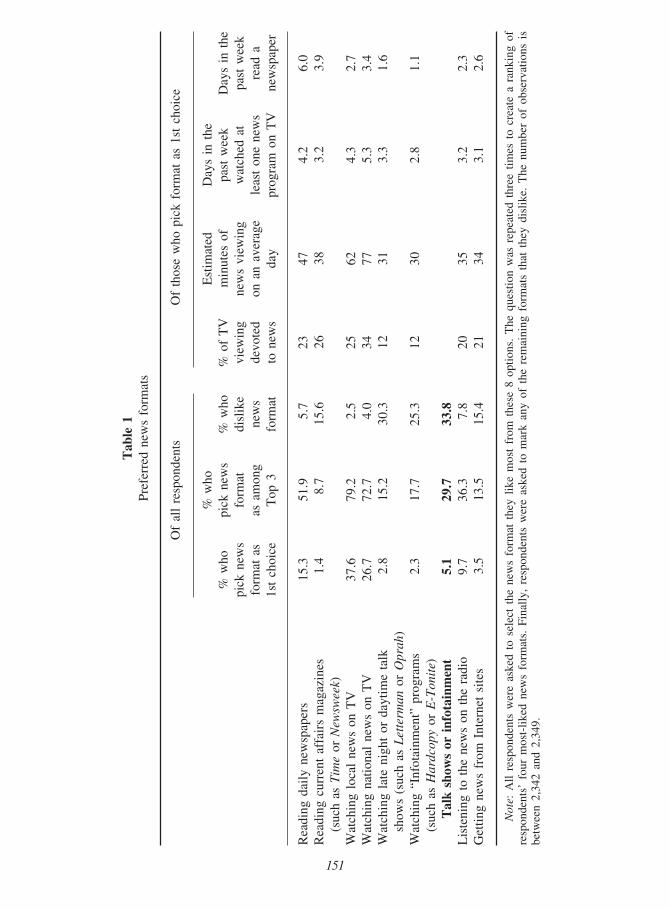
To measure the popularity of soft news, all respondents were asked to rank severaltypes of news. First, each respondent was presented with a list of eight different newsformats and asked to mark the format he or she liked most.3 Among the eight formats,two can be classified as soft news: talk shows and so-called “infotainment” programswhich primarily report on lifestyle, wardrobe, and scandals of Hollywood stars and themore glamorous politicians.4 The exact wording of the eight options is shown in Table1. The column labeled “first choice” presents the distribution of most-liked news for-mats. It confirms past findings that television is the most popular news medium and thatmore people prefer local news than network news. Very few people, no more than 5%of the sample, like soft news programs best.
On the next screen, respondents were shown all options, except the one they justselected, and asked to mark the format they liked second best. This was repeated twice
Any Good News in Soft News? 151
Tab
le 1
Pref
erre
d ne
ws
form
ats
Of
all
resp
onde
nts
Of
thos
e w
ho p
ick
form
at a
s 1s
t ch
oice
% w
hoE
stim
ated
Day
s in
the
% w
hopi
ck n
ews
% w
ho%
of
TV
min
utes
of
past
wee
kD
ays
in t
hepi
ck n
ews
form
atdi
slik
evi
ewin
gne
ws
view
ing
wat
ched
at
past
wee
kfo
rmat
as
as a
mon
gne
ws
devo
ted
on a
n av
erag
ele
ast
one
new
sre
ad a
1st
choi
ceT
op 3
form
atto
new
sda
ypr
ogra
m o
n T
Vne
wsp
aper
Rea
ding
dai
ly n
ewsp
aper
s15
.351
.95.
723
474.
26.
0R
eadi
ng c
urre
nt a
ffai
rs m
agaz
ines
1.4
8.7
15.6
2638
3.2
3.9
(suc
h as
Tim
e or
New
swee
k)W
atch
ing
loca
l ne
ws
on T
V37
.679
.22.
525
624.
32.
7W
atch
ing
natio
nal
new
s on
TV
26.7
72.7
4.0
3477
5.3
3.4
Wat
chin
g la
te n
ight
or
dayt
ime
talk
2.8
15.2
30.3
1231
3.3
1.6
show
s (s
uch
as L
ette
rman
or
Opr
ah)
Wat
chin
g “I
nfot
ainm
ent”
pro
gram
s2.
317
.725
.312
302.
81.
1(s
uch
as H
ardc
opy
or E
-Ton
ite)
Tal
k sh
ows
or i
nfot
ainm
ent
5.1
29.7
33.8
Lis
teni
ng t
o th
e ne
ws
on t
he r
adio
9.7
36.3
7.8
2035
3.2
2.3
Get
ting
new
s fr
om I
nter
net
site
s3.
513
.515
.421
343.
12.
6
Not
e: A
ll re
spon
dent
s w
ere
aske
d to
sel
ect
the
new
s fo
rmat
the
y lik
e m
ost
from
the
se 8
opt
ions
. T
he q
uest
ion
was
rep
eate
d th
ree
times
to
crea
te a
ran
king
of
resp
onde
nts’
fou
r m
ost-
liked
new
s fo
rmat
s. F
inal
ly,
resp
onde
nts
wer
e as
ked
to m
ark
any
of t
he r
emai
ning
for
mat
s th
at t
hey
disl
ike.
The
num
ber
of o
bser
vatio
ns i
sbe
twee
n 2,
342
and
2,34
9.
151
152 Markus Prior
more, so that each respondent effectively provided a top-four ranking of news formats.Column 2 of Table 1 shows the percentage of people who ranked a format among theirtop three. Thirty percent of the respondents listed at least one of the soft news options intheir top three. This part of the interview ended by giving respondents a chance to markany of the remaining formats they explicitly disliked. Column 3 shows that soft newsformats were mentioned most often as a particularly disliked news format. While peopleeither like traditional formats, notably local news, national news, and newspapers, orfeel indifferent toward them, soft news seems to be loved by some, hated by others.Traditional hard news formats remain far more popular than soft news.5
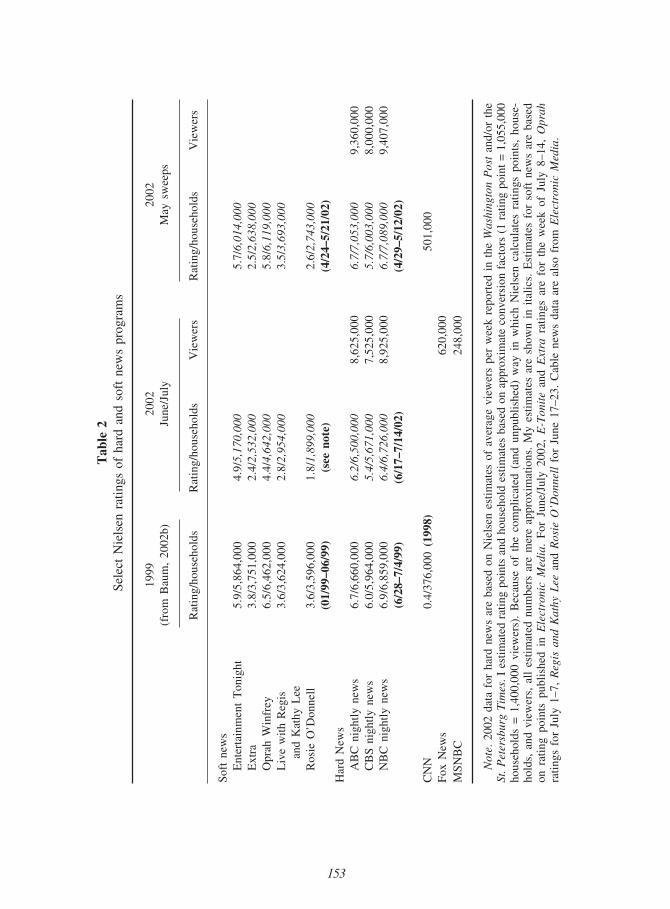
At first glance, Nielsen ratings, such as those in Table 2 adopted in part from Baum(2002b, p. 93), seem to contradict this conclusion. Soft news programs appear to bealmost as widely watched as news programs. Baum (2002b, p. 93), for example, writesthat “Entertainment Tonight and Oprah Winfrey are watched by about as many house-holds as the evening newscasts of the major networks.” It is less than obvious how tointerpret the ratings, however. Since all hard news programs air at the same time in mostmarkets, the ratings in Table 2 imply a hard news audience in 1998 of at least 19.5million households (not counting the Lehrer Newshour, CNN, Fox, and other cable channels).The soft news programs on the list, in contrast, do not air simultaneously. Regis & Kellyis on in the morning, Rosie O’Donnell (2 or 3 p.m., show ended in 2002) and Oprah inthe afternoon (4 p.m.), and Extra (7 p.m.) and Entertainment Tonight (7:30 p.m.) in theevening, but not in the same time slot in many markets.6 It is possible, therefore, thatsome of the same 6 million households that watch Oprah also tune in to Extra or Enter-tainment Tonight. Rather than parity between hard news and soft news, this scenariowould imply at least a 3-to-1 ratio of hard to soft news viewers.7
The soft news ratings in Baum’s (2002b) article are averages for the first six monthsof 1999. Ratings for the same period for 2002 are not publicly available. To provide arough overtime comparison nonetheless, Table 2 provides ratings for two shorter periodsin the first half of 2002: The sweeps period in May as an upper bound (because net-works make an extra effort during sweeps to attract viewers, as future advertising ratesare set) and a week in the summer as a lower bound (because vacationing and thenetworks’ airing of re-runs generally depress television viewing). Audiences for theseparticular soft news programs have declined somewhat between 1999 and 2002, but thedecline is modest when the first half of 1999 is compared to the sweeps period in May2002. While systematic comparison is seriously hampered by the unavailability of pub-lished Nielsen data, Table 2 suggests that soft news has lost more of its audience thanhard news.8
Audiences for cable news still appear to be tiny in comparison with the nightlyaudience for network news (Table 2). However, this is at least partly a function of themeasure. Comparing daily averages for cable news networks, such as those listed inTable 2, with averages for half-hour network newscasts is an extremely skewed com-parison. It is more meaningful to compare 9.4 million daily NBC Nightly News viewerswith 1.8 million who watched The O’Reilly Factor on an average night in May 2002,1.3 million Larry King Live viewers, or 1.1 million who watched The Fox Report withShepard Smith. On the harder side, NewsNight with Aaron Brown (713,000 viewers),The News With Brian Williams (combined 635,000 viewers on MSNBC and CNBC),and Crossfire (559,000 viewers) also attracted a combined 1.9 million viewers.9 Evenhourly averages underestimate the number of people who tune in to cable news channelsseveral times a day for shorter news updates. CNN, Fox News, MSNBC, CNBC, andCNN Headline News together had an estimated 11.9 million unique viewers during prime
Any Good News in Soft News? 153
Tab
le 2
Sele
ct N
iels
en r
atin
gs o
f ha
rd a
nd s
oft
new
s pr
ogra
ms
1999
2002
2002
(fro
m B
aum
, 20
02b)
June
/Jul
yM
ay s
wee
ps
Rat
ing/
hous
ehol
dsR
atin
g/ho
useh
olds
Vie
wer
sR
atin
g/ho
useh
olds
Vie
wer
s
Soft
new
sE
nter
tain
men
t T
onig
ht5.
9/5,
864,
000
4.9/
5,17
0,00
05.
7/6,
014,
000
Ext
ra3.
8/3,
751,
000
2.4/
2,53
2,00
02.
5/2,
638,
000
Opr
ah W
infr
ey6.
5/6,
462,
000
4.4/
4,64
2,00
05.
8/6,
119,
000
Liv
e w
ith R
egis
3.6/
3,62
4,00
02.
8/2,
954,
000
3.5/
3,69
3,00
0an
d K
athy
Lee
Ros
ie O
’Don
nell
3.6/
3,59
6,00
01.
8/1,
899,
000
2.6/
2,74
3,00
0(0
1/99
–06/
99)
(see
not
e)(4
/24–
5/21
/02)
Har
d N
ews
AB
C n
ight
ly n
ews
6.7/
6,66
0,00
06.
2/6,
500,
000
8,62
5,00
06.
7/7,
053,
000
9,36
0,00
0C
BS
nigh
tly n
ews
6.0/
5,96
4,00
05.
4/5,
671,
000
7,52
5,00
05.
7/6,
003,
000
8,00
0,00
0N
BC
nig
htly
new
s6.
9/6,
859,
000
6.4/
6,72
6,00
08,
925,
000
6.7/
7,08
9,00
09,
407,
000
(6/2
8–7/
4/99
)(6
/17–
7/14
/02)
(4/2
9–5/
12/0
2)
CN
N0.
4/37
6,00
0 (1
998)
501,
000
Fox
New
s62
0,00
0M
SNB
C24
8,00
0
Not
e. 2
002
data
for
har
d ne
ws
are
base
d on
Nie
lsen
est
imat
es o
f av
erag
e vi
ewer
s pe
r w
eek
repo
rted
in
the
Was
hing
ton
Pos
t an
d/or
the
St. P
eter
sbur
g T
imes
. I e
stim
ated
rat
ing
poin
ts a
nd h
ouse
hold
est
imat
es b
ased
on
appr
oxim
ate
conv
ersi
on f
acto
rs (
1 ra
ting
poin
t =
1,0
55,0
00ho
useh
olds
= 1
,400
,000
vie
wer
s).
Bec
ause
of
the
com
plic
ated
(an
d un
publ
ishe
d) w
ay i
n w
hich
Nie
lsen
cal
cula
tes
ratin
gs p
oint
s, h
ouse
-ho
lds,
and
vie
wer
s, a
ll es
timat
ed n
umbe
rs a
re m
ere
appr
oxim
atio
ns.
My
estim
ates
are
sho
wn
in i
talic
s. E
stim
ates
for
sof
t ne
ws
are
base
don
rat
ing
poin
ts p
ublis
hed
in E
lect
roni
c M
edia
. Fo
r Ju
ne/J
uly
2002
, E
-Ton
ite
and
Ext
ra r
atin
gs a
re f
or t
he w
eek
of J
uly
8–14
, O
prah
ratin
gs f
or J
uly
1–7,
Reg
is a
nd K
athy
Lee
and
Ros
ie O
’Don
nell
for
Jun
e 17
–23.
Cab
le n
ews
data
are
als
o fr
om E
lect
roni
c M
edia
.
153
154 Markus Prior
time (8–11 p.m.) and 31.2 million unique viewers per day in the 2002–2003 season.Even during the network news (half) hour between 6:30 and 7 p.m., 3.2 million differ-ent viewers watched at least six minutes of cable news (compared to an average 34.7million unique viewers for the three network newscasts.)10 According to these numbers,cable news—some of it pretty soft, some arguably as hard as network news ever was—is more popular than a 0.4 rating suggests, while the growth for soft news audiences hasslowed down, and in some instances even stopped.
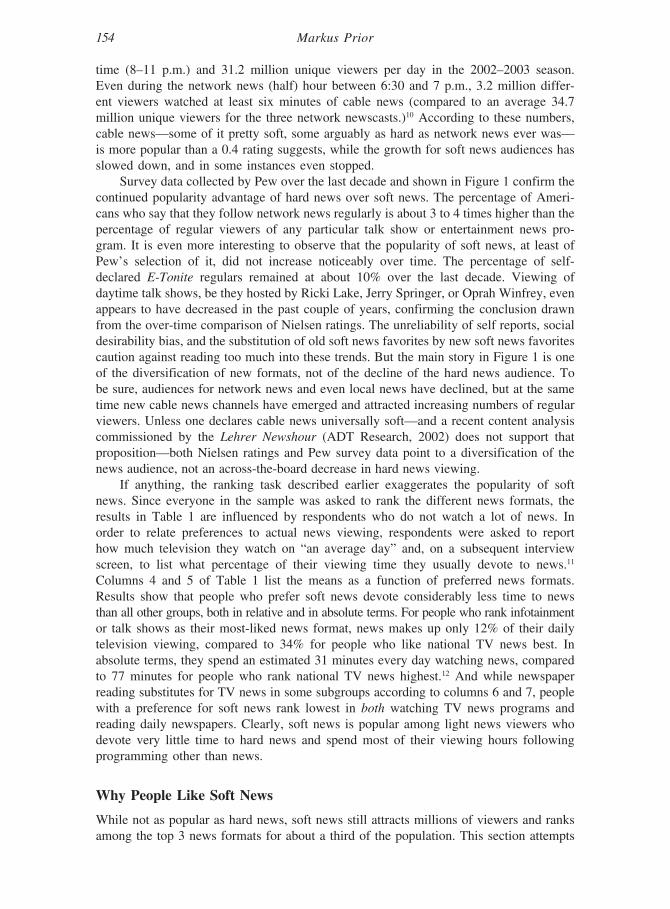
Survey data collected by Pew over the last decade and shown in Figure 1 confirm thecontinued popularity advantage of hard news over soft news. The percentage of Ameri-cans who say that they follow network news regularly is about 3 to 4 times higher than thepercentage of regular viewers of any particular talk show or entertainment news pro-gram. It is even more interesting to observe that the popularity of soft news, at least ofPew’s selection of it, did not increase noticeably over time. The percentage of self-declared E-Tonite regulars remained at about 10% over the last decade. Viewing ofdaytime talk shows, be they hosted by Ricki Lake, Jerry Springer, or Oprah Winfrey, evenappears to have decreased in the past couple of years, confirming the conclusion drawnfrom the over-time comparison of Nielsen ratings. The unreliability of self reports, socialdesirability bias, and the substitution of old soft news favorites by new soft news favoritescaution against reading too much into these trends. But the main story in Figure 1 is oneof the diversification of new formats, not of the decline of the hard news audience. Tobe sure, audiences for network news and even local news have declined, but at the sametime new cable news channels have emerged and attracted increasing numbers of regularviewers. Unless one declares cable news universally soft—and a recent content analysiscommissioned by the Lehrer Newshour (ADT Research, 2002) does not support thatproposition—both Nielsen ratings and Pew survey data point to a diversification of thenews audience, not an across-the-board decrease in hard news viewing.
If anything, the ranking task described earlier exaggerates the popularity of softnews. Since everyone in the sample was asked to rank the different news formats, theresults in Table 1 are influenced by respondents who do not watch a lot of news. Inorder to relate preferences to actual news viewing, respondents were asked to reporthow much television they watch on “an average day” and, on a subsequent interviewscreen, to list what percentage of their viewing time they usually devote to news.11
Columns 4 and 5 of Table 1 list the means as a function of preferred news formats.Results show that people who prefer soft news devote considerably less time to newsthan all other groups, both in relative and in absolute terms. For people who rank infotainmentor talk shows as their most-liked news format, news makes up only 12% of their dailytelevision viewing, compared to 34% for people who like national TV news best. Inabsolute terms, they spend an estimated 31 minutes every day watching news, comparedto 77 minutes for people who rank national TV news highest.12 And while newspaperreading substitutes for TV news in some subgroups according to columns 6 and 7, peoplewith a preference for soft news rank lowest in both watching TV news programs andreading daily newspapers. Clearly, soft news is popular among light news viewers whodevote very little time to hard news and spend most of their viewing hours followingprogramming other than news.
Why People Like Soft News
While not as popular as hard news, soft news still attracts millions of viewers and ranksamong the top 3 news formats for about a third of the population. This section attempts
Any Good News in Soft News? 155
to explain who these viewers are and why they like soft news. Many scholars and ob-servers see soft news as a way to reach audiences that would otherwise not watch, read,or hear news. Soft news informs and entertains at the same time and, according to thisargument, appeals to people unwilling to give up on entertainment, even while they arewatching news. Liking of news formats, then, is a function of two different individual
(a) Network and Cable News
0
10
20
30
40
50
60
70
80
90
100
200220001998199619941992
Year
Per
cent
of R
egul
ar V
iew
ers
Local New s
Netw ork
CNN
Fox New s
MSNBC
(b) Cable News and Soft News
0
5
10
15
20
25
30
35
200220001998199619941992
Year
Per
cent
of R
egul
ar V
iew
ers
CNN
Fox News
MSNBCRicki Lake or Jerry Springer
E-Tonite or Access
Rosie O'Donnell or Oprah Winfrey
Figure 1. Regular viewers of network news, cable news, and soft news. (Source: Various Pewsurveys. Cell entries are percentages of respondents who say they watch program “regularly.”)
(a) Network and Cable News
(b) Cable News and Soft News
Per
cent
age
of R
egul
ar V
iew
ers
Per
cent
age
of R
egul
ar V
iew
ers
156 Markus Prior
Table 3Entertainment preference and news preference
Entertainment preference (Cronbach’s α = .73)
It bothers me to miss my favorite TV prime time show.I watch television to be entertained.I enjoy spending an entire evening watching movies and TV shows.Watching movies or prime time shows on television is unsatisfying. (reversed)After watching my favorite TV show, I often can’t wait to see the next episode.
News preferences (Cronbach’s α = .72)
Following the news is not my idea of fun. (reversed)I like complex news stories even if they require my full attention.I prefer detailed news coverage to news headlines even if it requires more time.I hate to miss the news.
Correlation between the two indices r = .07
Note. The two indices are created by averaging agreement with the respective items on afour-point scale (disagree strongly to agree strongly).
traits: preference for news and preference for entertainment. People with a preferencefor news are unlikely to enjoy formats whose mission is to entertain, shock, and scare,as well as inform—unless they also happen to have a strong preference for entertain-ment. Conversely, people with a marked preference for entertainment will likely pickthe soft news options when asked to rank news formats—unless their news preferenceoutweighs the appeal of entertainment.
To test these hypotheses about the underlying preference structure of news con-sumption, I draw on two sets of items aimed at measuring respondents’ fondness ofnews and (television) entertainment. The items are listed in Table 3. Both scales havereliability levels of greater than .7, which is generally considered appropriate. Substan-tively more important is the fact that the two scales are not correlated at all (Pearson’sr = .07). It is clearly not the case, then, that the two scales are simply reversed measuresof the same dimension. High entertainment preference does not imply low news prefer-ence (or political interest, which correlates with entertainment preference at r = –.08).13
To the contrary, a person who likes news is empirically not more likely to dislike enter-tainment than to enjoy entertainment.
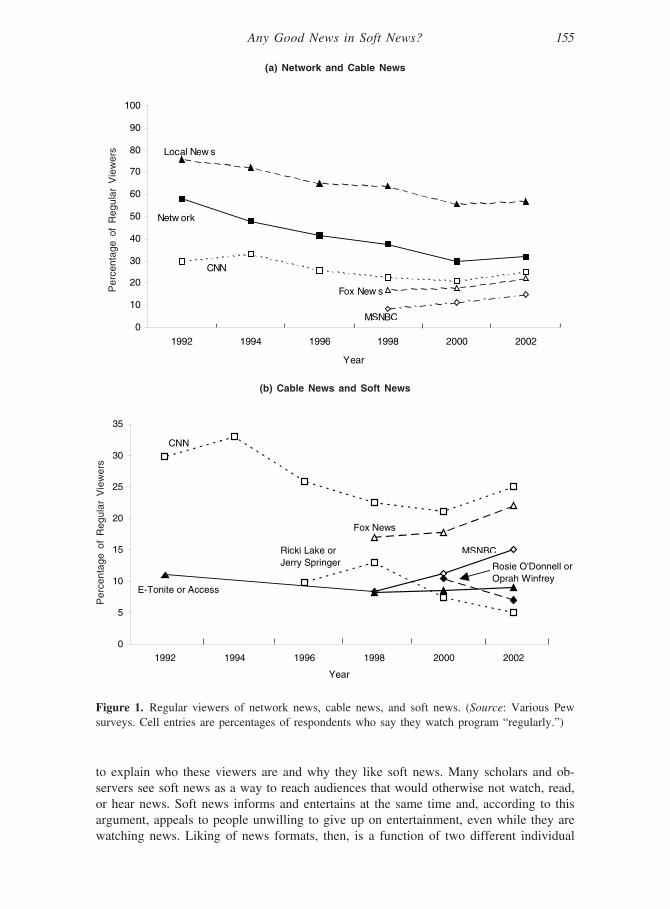
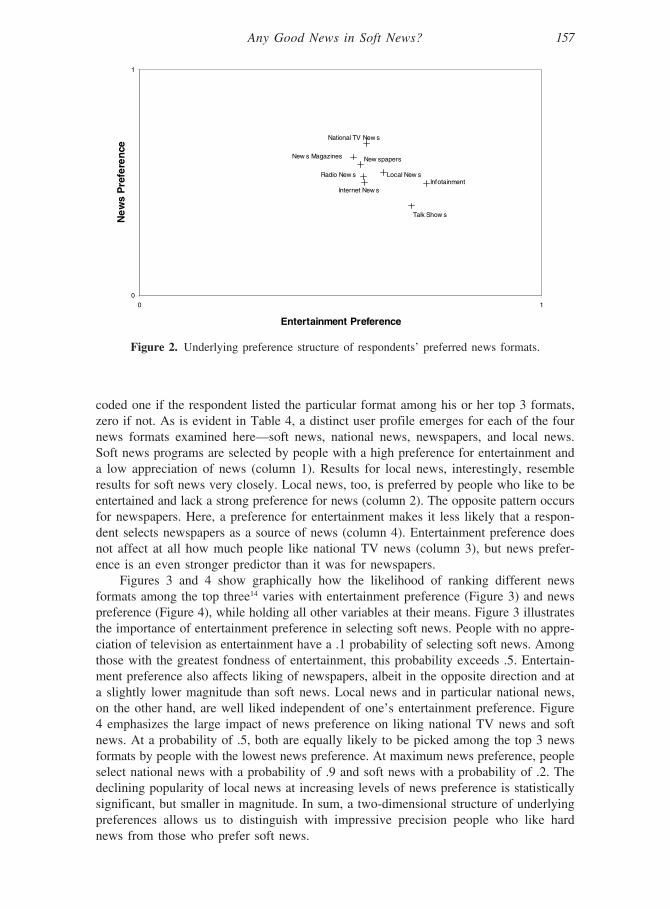
The measures of entertainment and news preference are reliable and almostorthogonal, but do they help us understand why people prefer one news format oranother? For each news format, Figure 2 graphs the mean values on both scales amongpeople who rank the format highest. Infotainment and talk shows are to the right of theother formats, indicating that people who favor them have a higher entertainment prefer-ence. Ranking talk shows highest is associated with the lowest news preference of allformats. Newspapers, news magazines, and national TV news are relatively close to-gether at higher levels of news preferences than the other formats.
In order to assess how the likelihood of picking a particular news format varieswith entertainment and news preference, several of people’s preferred news formats areregressed on the two scales and a variety of control variables. The dependent variable is
Any Good News in Soft News? 157
coded one if the respondent listed the particular format among his or her top 3 formats,zero if not. As is evident in Table 4, a distinct user profile emerges for each of the fournews formats examined here—soft news, national news, newspapers, and local news.Soft news programs are selected by people with a high preference for entertainment anda low appreciation of news (column 1). Results for local news, interestingly, resembleresults for soft news very closely. Local news, too, is preferred by people who like to beentertained and lack a strong preference for news (column 2). The opposite pattern occursfor newspapers. Here, a preference for entertainment makes it less likely that a respon-dent selects newspapers as a source of news (column 4). Entertainment preference doesnot affect at all how much people like national TV news (column 3), but news prefer-ence is an even stronger predictor than it was for newspapers.
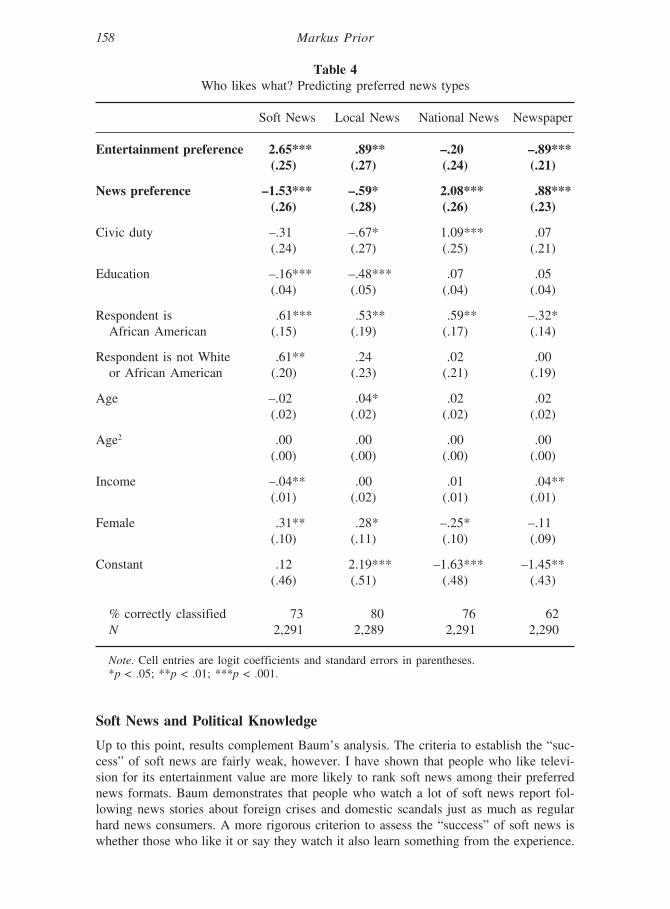
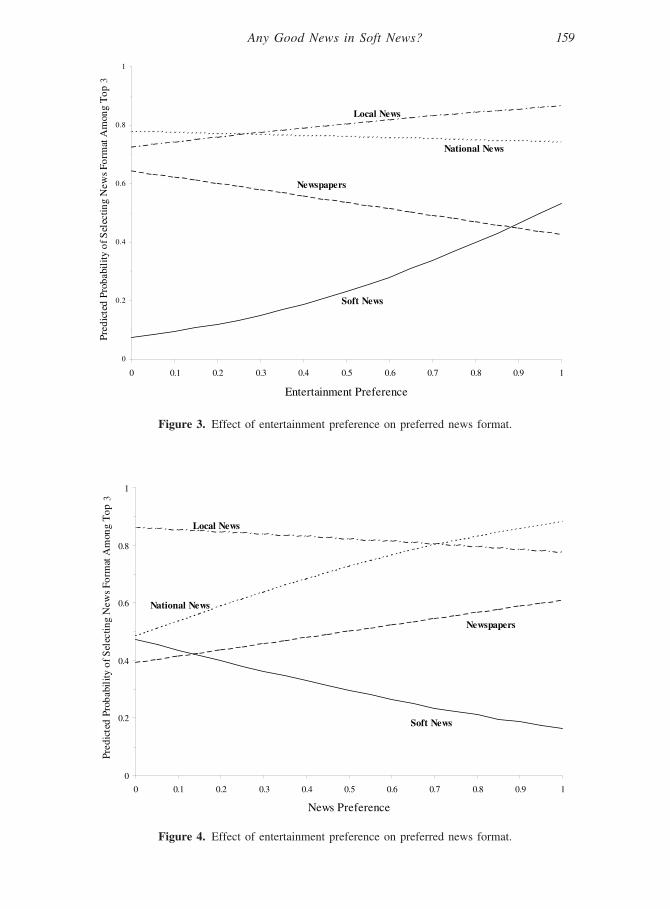
Figures 3 and 4 show graphically how the likelihood of ranking different newsformats among the top three14 varies with entertainment preference (Figure 3) and newspreference (Figure 4), while holding all other variables at their means. Figure 3 illustratesthe importance of entertainment preference in selecting soft news. People with no appre-ciation of television as entertainment have a .1 probability of selecting soft news. Amongthose with the greatest fondness of entertainment, this probability exceeds .5. Entertain-ment preference also affects liking of newspapers, albeit in the opposite direction and ata slightly lower magnitude than soft news. Local news and in particular national news,on the other hand, are well liked independent of one’s entertainment preference. Figure4 emphasizes the large impact of news preference on liking national TV news and softnews. At a probability of .5, both are equally likely to be picked among the top 3 newsformats by people with the lowest news preference. At maximum news preference, peopleselect national news with a probability of .9 and soft news with a probability of .2. Thedeclining popularity of local news at increasing levels of news preference is statisticallysignificant, but smaller in magnitude. In sum, a two-dimensional structure of underlyingpreferences allows us to distinguish with impressive precision people who like hardnews from those who prefer soft news.
0
1
0 1
Entertainment Preference
Ne
ws
Pre
fere
nce
Infotainment
Talk Show s
Local New s
Internet New s
Radio New s
National TV New s
New s Magazines New spapers
Figure 2. Underlying preference structure of respondents’ preferred news formats.
158 Markus Prior
Soft News and Political Knowledge
Up to this point, results complement Baum’s analysis. The criteria to establish the “suc-cess” of soft news are fairly weak, however. I have shown that people who like televi-sion for its entertainment value are more likely to rank soft news among their preferrednews formats. Baum demonstrates that people who watch a lot of soft news report fol-lowing news stories about foreign crises and domestic scandals just as much as regularhard news consumers. A more rigorous criterion to assess the “success” of soft news iswhether those who like it or say they watch it also learn something from the experience.
Table 4Who likes what? Predicting preferred news types
Soft News Local News National News Newspaper
Entertainment preference 2.65*** .89** –.20 –.89***(.25) (.27) (.24) (.21)
News preference –1.53*** –.59* 2.08*** .88***(.26) (.28) (.26) (.23)
Civic duty –.31 –.67* 1.09*** .07(.24) (.27) (.25) (.21)
Education –.16*** –.48*** .07 .05(.04) (.05) (.04) (.04)
Respondent is .61*** .53** .59** –.32*African American (.15) (.19) (.17) (.14)
Respondent is not White .61** .24 .02 .00or African American (.20) (.23) (.21) (.19)
Age –.02 .04* .02 .02(.02) (.02) (.02) (.02)
Age2 .00 .00 .00 .00(.00) (.00) (.00) (.00)
Income –.04** .00 .01 .04**(.01) (.02) (.01) (.01)
Female .31** .28* –.25* –.11(.10) (.11) (.10) (.09)
Constant .12 2.19*** –1.63*** –1.45**(.46) (.51) (.48) (.43)
% correctly classified 73 80 76 62N 2,291 2,289 2,291 2,290
Note. Cell entries are logit coefficients and standard errors in parentheses.*p < .05; **p < .01; ***p < .001.
Any Good News in Soft News? 159
0
0.2
0.4
0.6
0.8
1
0 0.1 0.2 0.3 0.4 0.5 0.6 0.7 0.8 0.9 1
Entertainment Preference
Pred
icte
d Pr
obab
ility
of S
elec
ting
New
s Fo
rmat
Am
ong
Top
Soft News
Newspapers
National News
Local News
Figure 3. Effect of entertainment preference on preferred news format.
0
0.2
0.4
0.6
0.8
1
0 0.1 0.2 0.3 0.4 0.5 0.6 0.7 0.8 0.9 1
News Preference
Pred
icte
d Pr
obab
ility
of S
elec
ting
New
s Fo
rmat
Am
ong
Top
Soft News
Newspapers
National News
Local News
Figure 4. Effect of entertainment preference on preferred news format.
33
160 Markus Prior
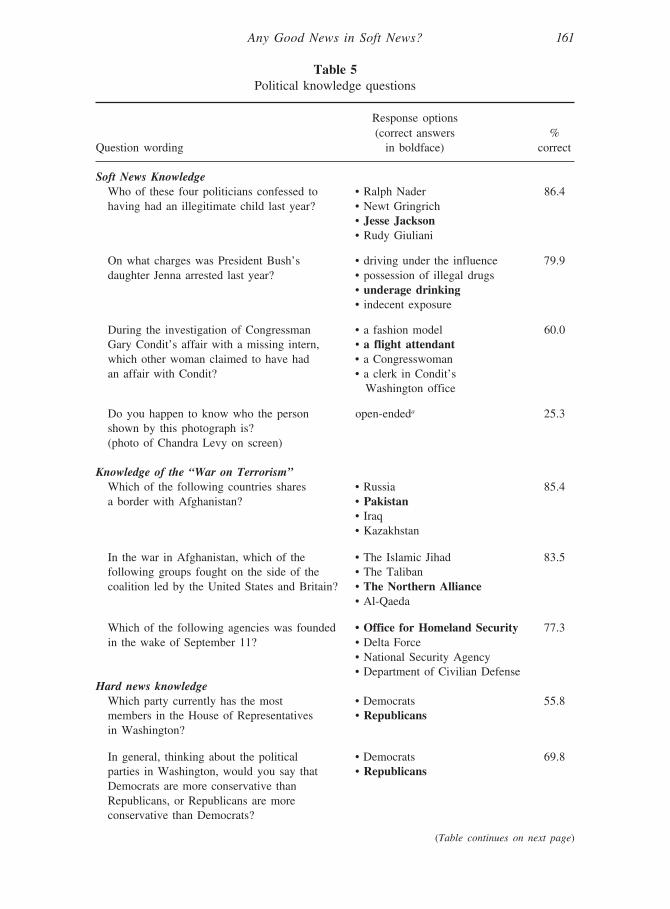
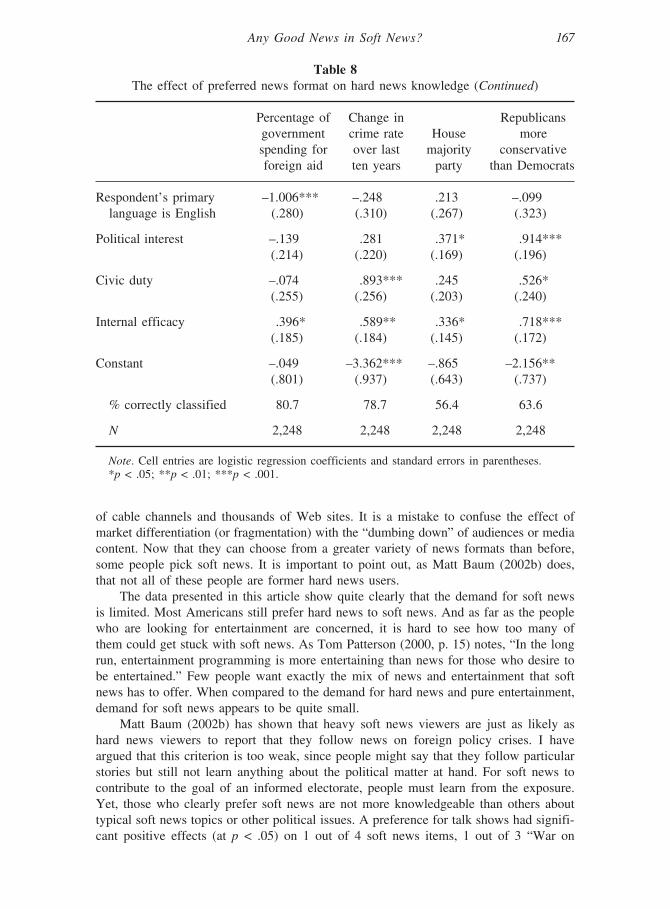
According to a weak learning criterion, soft news is a “success” if its viewers learnabout the types of issues prominent on soft news, roughly sex, drugs, and celebrities. Atougher learning criterion declares soft news a “success” only if it increases knowledgeof hard news topics as well.15 To assess soft news against these criteria, I draw on a setof knowledge questions summarized in Table 5.
Table 5 contains the question wording, response options, and marginals for fourknowledge questions about domestic political scandals, three questions about the “Waron Terrorism,”16 and four standard hard news questions. It is immediately evident thatthe American public is fairly well informed about the scandals of their politicians. Fourin five Americans know that Jesse Jackson confessed to having had an illegitimate childand that Jenna Bush was arrested for underage drinking. Still 60% know that a flightattendant claimed to have had an affair with Gary Condit. It is obviously difficult tocompare performance on soft and hard news questions, but it is telling that more Ameri-cans know about Condit’s (alleged) affairs, Jenna’s drinking, and Jackson’s child thanabout the current majority party in the U.S. House. That this is more than an artifact ofquestion selection is clear from a quick look at the news stories respondents recalledbest in the 1989 NES Pilot Study. The Jim Bakker trial, former President Reagan’ssurgery, and the trial of actress Zsa Zsa Gabor were recalled by more than 70% of therespondents, while less than 20% remembered any details from stories about a SupremeCourt decision on the death penalty or a congressional debate on health care (Price &Zaller, 1993). The amount of soft news clearly increased between 1989 and 2002; thepublic’s knowledge level of scandals and courtroom drama has apparently always beenhigh.
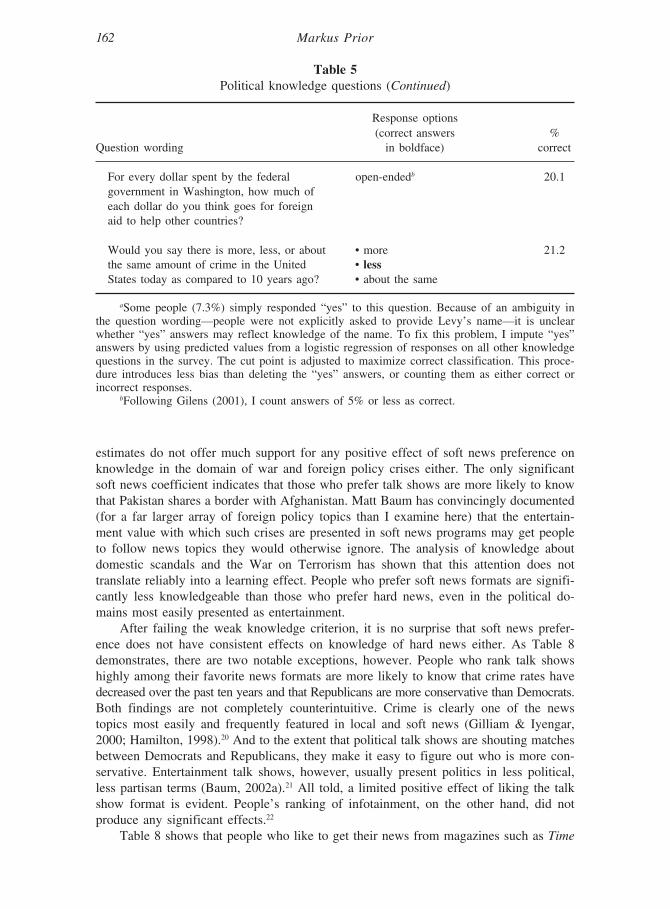
To examine the effect of people’s preferred news formats on their political knowl-edge, I regress each knowledge item on the rankings of the eight news formats17 as wellas various demographic and attitudinal control variables. It is of course true that peoplewho prefer hard news tend to be more knowledgeable in the first place. I control for thisselection effect by including education, political interest, sense of civic duty, and inter-nal efficacy in the models.18 Logit estimates are shown in Tables 6–8. Table 6 shows theresults for the four soft news questions. The weak knowledge criterion is clearly not metin any systematic way. People who like talk shows are more likely to know that JennaBush was arrested for underage drinking.19 The ranking of infotainment programs has apositive effect on knowing that a flight attendant claimed to have had an affair withGary Condit. The two results are the only indication that a preference for soft newsformats increases knowledge in the domain of domestic political scandals. Price andZaller (1993) also found that readers of People magazine were more likely to recalldetails about the Zsa Zsa Gabor story. The fact that the only significant effect of apreference for infotainment in the entire study occurs for the question about Condit’salleged affair with a flight attendant might suggest that the other soft news questionswere not soft enough. Yet, if the effect of soft news is restricted to the most scandalousof the soft news topics, it becomes hard to defend it on the grounds that it informspeople about politics.
While liking talk shows or infotainment programs affects soft news knowledge onlyweakly at best, people who prefer traditional hard news formats are consistently betterinformed about questions of sex, drugs, and missing interns. People’s rankings of news-papers and national TV news have positive and clearly significant effects for all foursoft news questions. This pattern continues in Table 7, which shows results for knowl-edge of the War on Terrorism. People who prefer to get their news from newspapersor national TV news are consistently more knowledgeable about the war. The logit
Any Good News in Soft News? 161
Table 5Political knowledge questions
Response options(correct answers %
Question wording in boldface) correct
Soft News KnowledgeWho of these four politicians confessed to • Ralph Nader 86.4having had an illegitimate child last year? • Newt Gringrich
• Jesse Jackson• Rudy Giuliani
On what charges was President Bush’s • driving under the influence 79.9daughter Jenna arrested last year? • possession of illegal drugs
• underage drinking• indecent exposure
During the investigation of Congressman • a fashion model 60.0Gary Condit’s affair with a missing intern, • a flight attendantwhich other woman claimed to have had • a Congresswomanan affair with Condit? • a clerk in Condit’s
Washington office
Do you happen to know who the person open-endeda 25.3shown by this photograph is?(photo of Chandra Levy on screen)
Knowledge of the “War on Terrorism”Which of the following countries shares • Russia 85.4a border with Afghanistan? • Pakistan
• Iraq• Kazakhstan
In the war in Afghanistan, which of the • The Islamic Jihad 83.5following groups fought on the side of the • The Talibancoalition led by the United States and Britain? • The Northern Alliance
• Al-Qaeda
Which of the following agencies was founded • Office for Homeland Security 77.3in the wake of September 11? • Delta Force
• National Security Agency• Department of Civilian Defense
Hard news knowledgeWhich party currently has the most • Democrats 55.8members in the House of Representatives • Republicansin Washington?
In general, thinking about the political • Democrats 69.8parties in Washington, would you say that • RepublicansDemocrats are more conservative thanRepublicans, or Republicans are moreconservative than Democrats?
(Table continues on next page)
162 Markus Prior
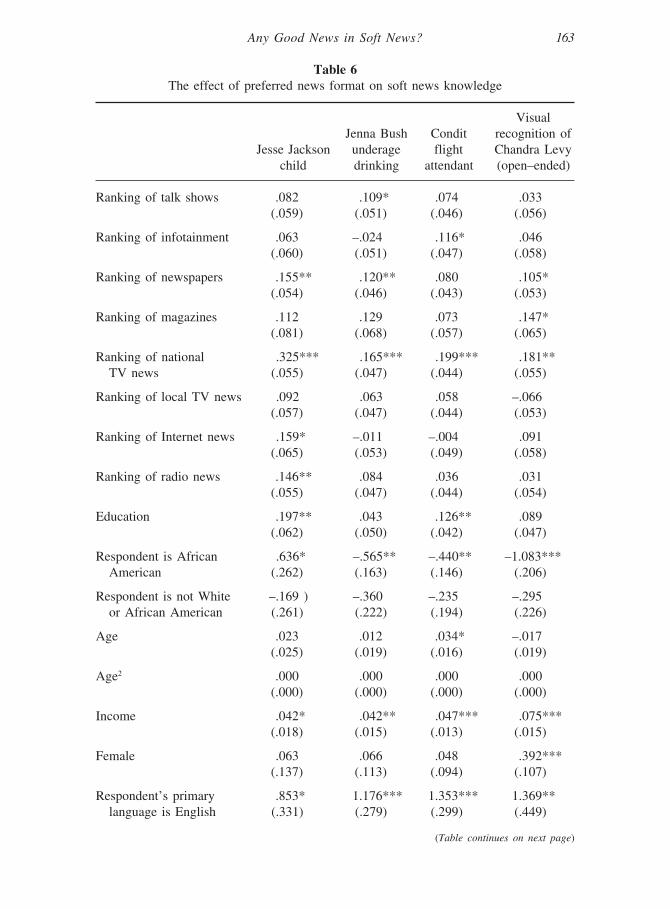
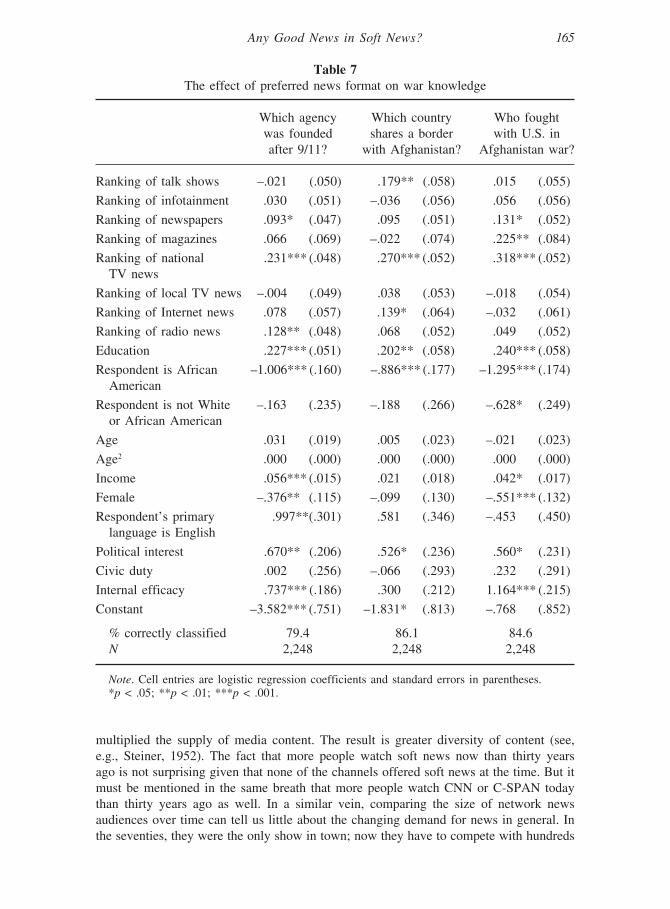
estimates do not offer much support for any positive effect of soft news preference onknowledge in the domain of war and foreign policy crises either. The only significantsoft news coefficient indicates that those who prefer talk shows are more likely to knowthat Pakistan shares a border with Afghanistan. Matt Baum has convincingly documented(for a far larger array of foreign policy topics than I examine here) that the entertain-ment value with which such crises are presented in soft news programs may get peopleto follow news topics they would otherwise ignore. The analysis of knowledge aboutdomestic scandals and the War on Terrorism has shown that this attention does nottranslate reliably into a learning effect. People who prefer soft news formats are signifi-cantly less knowledgeable than those who prefer hard news, even in the political do-mains most easily presented as entertainment.
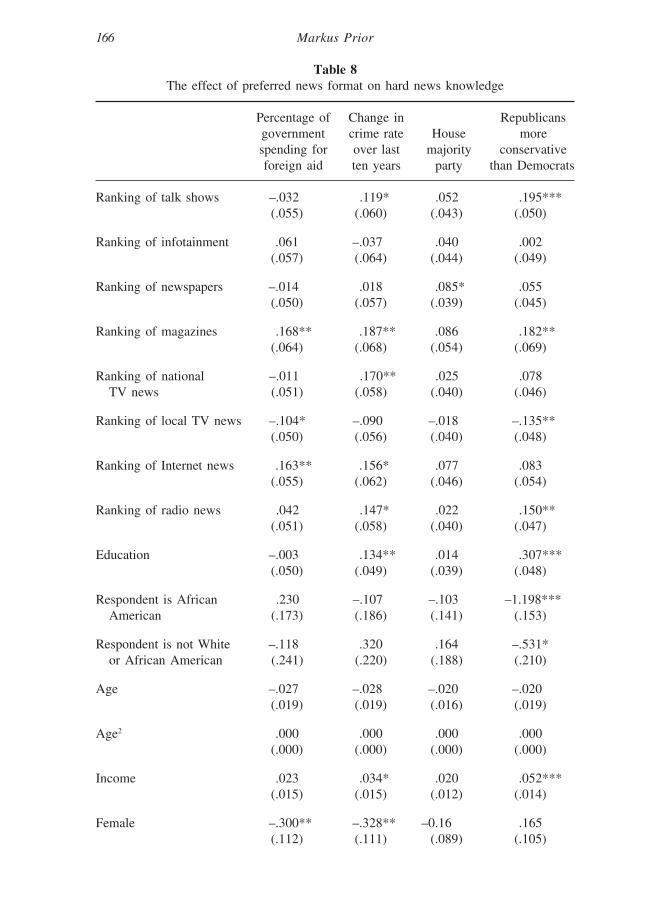
After failing the weak knowledge criterion, it is no surprise that soft news prefer-ence does not have consistent effects on knowledge of hard news either. As Table 8demonstrates, there are two notable exceptions, however. People who rank talk showshighly among their favorite news formats are more likely to know that crime rates havedecreased over the past ten years and that Republicans are more conservative than Democrats.Both findings are not completely counterintuitive. Crime is clearly one of the newstopics most easily and frequently featured in local and soft news (Gilliam & Iyengar,2000; Hamilton, 1998).20 And to the extent that political talk shows are shouting matchesbetween Democrats and Republicans, they make it easy to figure out who is more con-servative. Entertainment talk shows, however, usually present politics in less political,less partisan terms (Baum, 2002a).21 All told, a limited positive effect of liking the talkshow format is evident. People’s ranking of infotainment, on the other hand, did notproduce any significant effects.22
Table 8 shows that people who like to get their news from magazines such as Time
Table 5Political knowledge questions (Continued)
Response options(correct answers %
Question wording in boldface) correct
For every dollar spent by the federal open-endedb 20.1government in Washington, how much ofeach dollar do you think goes for foreignaid to help other countries?
Would you say there is more, less, or about • more 21.2the same amount of crime in the United • lessStates today as compared to 10 years ago? • about the same
aSome people (7.3%) simply responded “yes” to this question. Because of an ambiguity inthe question wording—people were not explicitly asked to provide Levy’s name—it is unclearwhether “yes” answers may reflect knowledge of the name. To fix this problem, I impute “yes”answers by using predicted values from a logistic regression of responses on all other knowledgequestions in the survey. The cut point is adjusted to maximize correct classification. This proce-dure introduces less bias than deleting the “yes” answers, or counting them as either correct orincorrect responses.
bFollowing Gilens (2001), I count answers of 5% or less as correct.
Any Good News in Soft News? 163
Table 6The effect of preferred news format on soft news knowledge
VisualJenna Bush Condit recognition of
Jesse Jackson underage flight Chandra Levychild drinking attendant (open–ended)
Ranking of talk shows .082 .109* .074 .033(.059) (.051) (.046) (.056)
Ranking of infotainment .063 –.024 .116* .046(.060) (.051) (.047) (.058)
Ranking of newspapers .155** .120** .080 .105*(.054) (.046) (.043) (.053)
Ranking of magazines .112 .129 .073 .147*(.081) (.068) (.057) (.065)
Ranking of national .325*** .165*** .199*** .181**TV news (.055) (.047) (.044) (.055)
Ranking of local TV news .092 .063 .058 –.066(.057) (.047) (.044) (.053)
Ranking of Internet news .159* –.011 –.004 .091(.065) (.053) (.049) (.058)
Ranking of radio news .146** .084 .036 .031(.055) (.047) (.044) (.054)
Education .197** .043 .126** .089(.062) (.050) (.042) (.047)
Respondent is African .636* –.565** –.440** –1.083***American (.262) (.163) (.146) (.206)
Respondent is not White –.169 ) –.360 –.235 –.295or African American (.261) (.222) (.194) (.226)
Age .023 .012 .034* –.017(.025) (.019) (.016) (.019)
Age2 .000 .000 .000 .000(.000) (.000) (.000) (.000)
Income .042* .042** .047*** .075***(.018) (.015) (.013) (.015)
Female .063 .066 .048 .392***(.137) (.113) (.094) (.107)
Respondent’s primary .853* 1.176*** 1.353*** 1.369**language is English (.331) (.279) (.299) (.449)
(Table continues on next page)
164 Markus Prior
or Newsweek are consistently more knowledgeable than the average respondent on thehard news questions. The effects of national TV news and newspapers are more mixedthan before, perhaps partly reflecting the difficulty of two of the hard news items (crimeand foreign aid; see Table 5). Interestingly, the effect of Internet news ranking is consis-tently positive and at least marginally significant for all items. The real significance ofthe new media environment, this finding suggests, may not lie in the opportunities fornews hybrids such as soft news, but in media that give users the greatest control overtiming, pace, and content of their news.23
Table 8 also makes it clear that local news, not soft news, is the real villain of ourstory. While a preference for soft news, and for infotainment programs in particular,failed to produce more than occasional learning effects, the effect of liking local news isactually negative for most of the hard news items. The first half of this article showedthat people turn to soft and local news because they watch television mostly for itsentertainment value. The major difference between the two formats is that local news ismuch more popular than soft news. Because of this great popularity, the negative effectof a preference for local news on hard news knowledge is a much more serious obstacleto creating an informed electorate than the various soft news formats.
Conclusion
If we accept the market logic—that media assess what people want and satisfy thoseneeds to maximize their profits—then the appearance of soft news programs is a pre-dictable consequence of the proliferation of media outlets. Cable TV and Internet have
Table 6The effect of preferred news format on soft news knowledge (Continued)
VisualJenna Bush Condit recognition of
Jesse Jackson underage flight Chandra Levychild drinking attendant (open–ended)
Political interest .833** .079 .383* .613**(.247) (.211) (.177) (.210)
Civic duty –.153 .674** .619** .927***(.306) (.258) (.214) (.244)
Internal efficacy .010 .318 .385* .488**(.224) (.184) (.153) (.175)
Constant –4.109*** –2.348** –5.082*** –5.006***(.876) (.725) (.728) (.938)
% correctly classified 87.6 80.9 65.7 76.4
N 2,248 2,248 2,248 2,246
Note. Cell entries are logistic regression coefficients and standard errors in parentheses.*p < .05; **p < .01; ***p < .001.
Any Good News in Soft News? 165
multiplied the supply of media content. The result is greater diversity of content (see,e.g., Steiner, 1952). The fact that more people watch soft news now than thirty yearsago is not surprising given that none of the channels offered soft news at the time. But itmust be mentioned in the same breath that more people watch CNN or C-SPAN todaythan thirty years ago as well. In a similar vein, comparing the size of network newsaudiences over time can tell us little about the changing demand for news in general. Inthe seventies, they were the only show in town; now they have to compete with hundreds
Table 7The effect of preferred news format on war knowledge
Which agency Which country Who foughtwas founded shares a border with U.S. inafter 9/11? with Afghanistan? Afghanistan war?
Ranking of talk shows –.021 (.050) .179** (.058) .015 (.055)
Ranking of infotainment .030 (.051) –.036 (.056) .056 (.056)
Ranking of newspapers .093* (.047) .095 (.051) .131* (.052)
Ranking of magazines .066 (.069) –.022 (.074) .225** (.084)
Ranking of national .231*** (.048) .270*** (.052) .318*** (.052)TV news
Ranking of local TV news –.004 (.049) .038 (.053) –.018 (.054)
Ranking of Internet news .078 (.057) .139* (.064) –.032 (.061)
Ranking of radio news .128** (.048) .068 (.052) .049 (.052)
Education .227*** (.051) .202** (.058) .240*** (.058)
Respondent is African –1.006*** (.160) –.886*** (.177) –1.295*** (.174)American
Respondent is not White –.163 (.235) –.188 (.266) –.628* (.249)or African American
Age .031 (.019) .005 (.023) –.021 (.023)
Age2 .000 (.000) .000 (.000) .000 (.000)
Income .056*** (.015) .021 (.018) .042* (.017)
Female –.376** (.115) –.099 (.130) –.551*** (.132)
Respondent’s primary .997**(.301) .581 (.346) –.453 (.450)language is English
Political interest .670** (.206) .526* (.236) .560* (.231)
Civic duty .002 (.256) –.066 (.293) .232 (.291)
Internal efficacy .737*** (.186) .300 (.212) 1.164*** (.215)
Constant –3.582*** (.751) –1.831* (.813) –.768 (.852)
% correctly classified 79.4 86.1 84.6N 2,248 2,248 2,248
Note. Cell entries are logistic regression coefficients and standard errors in parentheses.*p < .05; **p < .01; ***p < .001.
166 Markus Prior
Table 8The effect of preferred news format on hard news knowledge
Percentage of Change in Republicansgovernment crime rate House morespending for over last majority conservativeforeign aid ten years party than Democrats
Ranking of talk shows –.032 .119* .052 .195***(.055) (.060) (.043) (.050)
Ranking of infotainment .061 –.037 .040 .002(.057) (.064) (.044) (.049)
Ranking of newspapers –.014 .018 .085* .055(.050) (.057) (.039) (.045)
Ranking of magazines .168** .187** .086 .182**(.064) (.068) (.054) (.069)
Ranking of national –.011 .170** .025 .078TV news (.051) (.058) (.040) (.046)
Ranking of local TV news –.104* –.090 –.018 –.135**(.050) (.056) (.040) (.048)
Ranking of Internet news .163** .156* .077 .083(.055) (.062) (.046) (.054)
Ranking of radio news .042 .147* .022 .150**(.051) (.058) (.040) (.047)
Education –.003 .134** .014 .307***(.050) (.049) (.039) (.048)
Respondent is African .230 –.107 –.103 –1.198***American (.173) (.186) (.141) (.153)
Respondent is not White –.118 .320 .164 –.531*or African American (.241) (.220) (.188) (.210)
Age –.027 –.028 –.020 –.020(.019) (.019) (.016) (.019)
Age2 .000 .000 .000 .000(.000) (.000) (.000) (.000)
Income .023 .034* .020 .052***(.015) (.015) (.012) (.014)
Female –.300** –.328** –0.16 .165(.112) (.111) (.089) (.105)
Any Good News in Soft News? 167
of cable channels and thousands of Web sites. It is a mistake to confuse the effect ofmarket differentiation (or fragmentation) with the “dumbing down” of audiences or mediacontent. Now that they can choose from a greater variety of news formats than before,some people pick soft news. It is important to point out, as Matt Baum (2002b) does,that not all of these people are former hard news users.
The data presented in this article show quite clearly that the demand for soft newsis limited. Most Americans still prefer hard news to soft news. And as far as the peoplewho are looking for entertainment are concerned, it is hard to see how too many ofthem could get stuck with soft news. As Tom Patterson (2000, p. 15) notes, “In the longrun, entertainment programming is more entertaining than news for those who desire tobe entertained.” Few people want exactly the mix of news and entertainment that softnews has to offer. When compared to the demand for hard news and pure entertainment,demand for soft news appears to be quite small.
Matt Baum (2002b) has shown that heavy soft news viewers are just as likely ashard news viewers to report that they follow news on foreign policy crises. I haveargued that this criterion is too weak, since people might say that they follow particularstories but still not learn anything about the political matter at hand. For soft news tocontribute to the goal of an informed electorate, people must learn from the exposure.Yet, those who clearly prefer soft news are not more knowledgeable than others abouttypical soft news topics or other political issues. A preference for talk shows had signifi-cant positive effects (at p < .05) on 1 out of 4 soft news items, 1 out of 3 “War on
Table 8The effect of preferred news format on hard news knowledge (Continued)
Percentage of Change in Republicansgovernment crime rate House morespending for over last majority conservativeforeign aid ten years party than Democrats
Respondent’s primary –1.006*** –.248 .213 –.099language is English (.280) (.310) (.267) (.323)
Political interest –.139 .281 .371* .914***(.214) (.220) (.169) (.196)
Civic duty –.074 .893*** .245 .526*(.255) (.256) (.203) (.240)
Internal efficacy .396* .589** .336* .718***(.185) (.184) (.145) (.172)
Constant –.049 –3.362*** –.865 –2.156**(.801) (.937) (.643) (.737)
% correctly classified 80.7 78.7 56.4 63.6
N 2,248 2,248 2,248 2,248
Note. Cell entries are logistic regression coefficients and standard errors in parentheses.*p < .05; **p < .01; ***p < .001.
168 Markus Prior
Terrorism” items, and 2 out of 4 hard news items. People who like infotainment pro-grams are more knowledgeable than those who do not about only one item: Gary Condit’salleged affair with a flight attendant.24
This article has focused on the effects of soft news in one particular area, factualknowledge. In some theories, however, high knowledge scores are not a prerequisite forinformed judgments. According to the online model of political information processing(Lodge, Steenbergen, & Braun, 1995), people store periodically updated political evalu-ations in memory, but not the information used in making those evaluations. The notionof low-information rationality (Popkin, 1994) suggests that heuristics can compensatefor lack of knowledge. Hence, even in the absence of consistent learning effects, softnews may still affect other elements of political reasoning, most notably political atti-tudes and voting behavior (Baum, 2002a). While the positive consequences of soft newsfor the political process remain to be demonstrated, it would be premature to concludethat soft news is bad news. The benefits of a well-informed electorate, however, that somany recent studies have documented (e.g., Althaus, 1998, 2001; Bartels, 1996; DelliCarpini, 2000; Delli Carpini & Keeter, 1996; Gilens, 2001) are unlikely to emerge as aresult of greater soft news consumption. The diversification of news formats helps someviewers find news programs they like. The hope that a more efficient market for newsmight coincidentally promote democracy by simultaneously entertaining and informingpeople does not receive much empirical support in this study.
Notes
1. Soft news refers to both news stories and entire programs. Using Patterson’s definition,any given news story can be classified as hard or soft, regardless of the news program in which itappears. Alternatively, several new news formats, blends of information and entertainment, that haveemerged in the past two decades are labeled “soft news” and thereby contrasted to more traditionalhard news formats, most notably the national network news (e.g., Baum, 2002b). I use the seconddefi-nition, as my focus here is on the impact of soft news programs on political knowledge.
2. For details on the sampling mechanism used by Knowledge Networks, see Krotki andDennis (2001); for a comparison to other Web survey methods, see Couper (2000); for the valid-ity of Knowledge Networks data, see Krosnick and Chang (2001).
3. Question wording was as follows: “Which of the following types of news do you likemost?”
4. The choice of these two formats follows the two examples emphasized by Baum (2002b,p. 93). Shows like Entertainment Tonight, Hardcopy, and Extra are also referred to as “tabloidnews shows” (e.g., Baum, 2002b, p. 93; Delli Carpini & Williams 2000, p. 171), but this label islikely to worsen the problem of social desirability bias. “Infotainment shows” was selected as amore neutral genre description.
5. These results are similar to those obtained by Patterson (2000, pp. 6–7) in a phonesurvey that used different operationalizations of hard and soft news.
6. Ratings for network news magazines such as 60 Minutes or Dateline are higher thanratings for the talk shows and entertainment news programs. In Baum’s (2002b, p. 93) exampleweek in 1999, 60 Minutes was viewed by a little over half as many viewers as the three networknews programs combined. These programs have become softer over time and now focus pre-dominantly on soft news topics (Kalb, 1998; Zaller, 1999).
7. Limited by the Nielsen ratings data published at the time, Baum compares soft newsratings for the first half of the year with hard news ratings for a week in the summer. Since fewpeople watch TV in the summer, this comparison is probably biased against hard news.
8. Even if ratings were available for all programs that we consider soft news, it would stillbe impossible to determine the number of different soft news viewers per day.
Any Good News in Soft News? 169
9. Audience sizes for particular cable news shows are Nielsen estimates published in Elec-tronic Media, June 3, 2002, p. 30.
10. Numbers are from a CBS press release from August 1, 2002, based on Nielsen data.According to CBS Research, a viewer has to watch a minimum of 6 minutes to be counted as aunique viewer for a particular channel. The 2002–2003 season started in November 2002 andshould therefore be only mildly influenced by unusually high news viewing in the immediateaftermath of 9/11 (Althaus, 2002). The slight increase of news audiences that persists in thesummer of 2002 (compared to previous years), on the other hand, may well be due to 9/11.
11. Specifically, respondents were asked what percentage of their viewing time was madeup of news, entertainment, sports, and “other programs.” If the entries did not add up to 100%,respondents were asked to correct their answers. These questions were asked a few minutes afterrespondents had completed the ranking of news formats. This was done to give people an idea ofthe programs that could be defined as “news,” without constraining them by mentioning actualexemplars in the question.
12. The numbers are generated by multiplying respondents’ total viewing time by the per-centage of viewing devoted to news.
13. The correlation between political interest and news preference is r = .34. The advantageof news preference is that it is an approximately continuous (21-point) scale.
14. Results are highly similar if only the first choice is used instead.15. I am agnostic as to the process by which soft news could increase knowledge of hard
news. One possibility is that soft news programs do cover hard news, perhaps marginally or in a“soft” way. Another, more interesting explanation would be that soft news programs increaseinterest in “hard” politics and motivate viewers to watch hard news programs.
16. As Table 5 indicates, knowledge about the “War on Terrorism” was quite high, prob-ably as a consequence of unusually intense media coverage and very high attentiveness (Althaus,2002; Prior, 2002).
17. Rankings are scored 5 for first choice, 4 for second choice, 3 for third choice, 2 forfourth choice, 1 for indifference, and 0 if the format was marked as disliked. I use preferencemeasures instead of exposure measures because it has been shown repeatedly that people’s self-reports of media use are extremely unreliable (e.g., Ansolabehere & Iyengar, 1998; Price & Zaller,1993; Zaller, 1996) and biased (Ansolabehere, Iyengar, & Simon, 1999). These measurementproblems make is very difficult to estimate the effect of soft news exposure on political knowl-edge directly using survey data. While using preference measures as a proxy for exposure re-quires the assumption that people watch the types of news they like, it is an open empiricalquestion whether this assumption is more or less justified than the (false) assumption of accurateself-reports. In Baum’s (2002b) theoretical model, people’s media consumption is derived from acomparison of utilities, a process that assumes the existence of preferences as the basis for view-ing decisions. Empirically, Baum’s soft news index combines self-reported exposure items andmeasures of attention (to particular types of soft news topics). It is thus not clear whether thepositive effect of soft news on attention to foreign crises is conditional on a certain level ofattention to soft news in general.
18. Following Prince and Zaller’s (1993) approach, I also estimated the models with direct controlsfor political knowledge. The coefficients for the news rankings changed marginally at the most.
19. The term “talk show” may be open to different interpretations. Respondents were askedto rank “daytime and late-night talk shows (such as Letterman or Oprah).” Some respondentsmay have included more “highbrow” talk shows such as Charlie Rose or the Sunday morninginterview shows. It thus remains somewhat unclear if the occasional positive effect of talk showsis really an effect of soft news. (But recall from Figure 2 that people who prefer talk shows havethe lowest news preference of all groups.)
20. It is usually assumed, however, that the heavy focus on crime in local news leadsviewers to overestimate the amount of crime. The coefficient for local news reflects this expecta-tion, even though it only approaches significance. High rankings of talk shows, in contrast, areassociated with a greater likelihood to know that crime rates decreased.
170 Markus Prior
21. It is plausible that respondents who are familiar with ideological terms are more likelyto prefer talk shows in the first place. Controlling for strength of ideology and/or partisanship didnot change the results, however.
22. Since all respondents were asked to rank-order the different news formats, thosewho ranked soft news highly probably include people who would rather watch pure enter-tainment than soft news. One might therefore expect to find a stronger relationship betweenranking of soft news and knowledge for those respondents who report at least some news view-ing. If anything, however, the effect is larger among those who report spending no time watchingnews at all. Conditioning the effect of soft news ranking on news viewing, political interest, ornews preference did not yield statistically significant results for the majority of the knowledgeitems.
23. Statements about causality derived from cross-sectional analysis are often suspect. Plau-sibly, individuals who were more knowledgeable to begin with could have developed a prefer-ence for Internet news subsequently, indicating preference change rather than learning. This isunlikely, however, because the knowledge items in the study refer mostly to relatively recentevents, and the effect of news did not change significantly when a measure of civics knowledge(derived from questions about presidential veto, judicial review, and number of presidential terms)was included in the model to control for higher initial knowledge.
24. Many scholars (e.g., Kalb, 1998; Patterson, 2000; Zaller, 1999) have argued that hardnews programs themselves have become softer in recent years. The present article focuses onlyon the differences between hard news and soft news formats, and does not address the possibilitythat proliferation of soft news stories in hard news programs affects political knowledge as well.Moreover, hard news may enjoy the popularity advantage over soft news documented here in partbecause it has already become softer.
References
ADT Research. Cable news wars. Content analysis commissioned by the Newshour. (2002). Availableat http://www.pbs.org/newshour/media/cablenews/analysis_highlights.html.
Althaus, S. L. (1998). Information effects in collective preferences. American Political ScienceReview, 92, 545–558.
Althaus, S. L. (2001). Who’s voted in when the people tune out? Information effects in congres-sional elections. In R. P. Hart & D. Shaw (Ed.), Communication in U.S. Elections: NewAgendas (pp. 33–53). Lanham, MD: Rowman & Littlefield.
Althaus, S. L. (2002). American news consumption during times of national crisis. PS: PoliticalScience and Politics, 35, 517–521.
Ansolabehere, S, & Iyengar, S. (1998). Message forgotten: Misreporting in surveys and the biastoward minimal effects. Unpublished manuscript.
Ansolabehere, S., Iyengar, S., & Simon, A. (1999). Replicating experiments using aggregate andsurvey data: The case of negative advertising and yurnout. American Political Science Re-view, 93, 901–910.
Bartels, L. M. (1996). Uninformed votes: Information effects in presidential elections. AmericanJournal of Political Science, 40, 177–207.
Baum, M. A. (2002a). Making politics fun: What happens when presidential candidates hit thetalk show circuit? Paper presented at the 98th Annual Meeting of the American PoliticalScience Association, Boston, MA.
Baum, M. A. (2002b). Sex, lies, and war: How soft news brings foreign policy to the inattentivepublic. American Political Science Review, 96, 91–110.
Couper, M. P. (2000). Web surveys: A review of issues and approaches. Public Opinion Quar-terly, 64, 464–494.
Delli Carpini, M. X. (2000). In search of the informed citizen: What Americans know aboutpolitics and why it matters. Communication Review, 4, 129–164.
Any Good News in Soft News? 171
Delli Carpini, M. X., & Keeter, S. (1996). What Americans know about politics and why itmatters. New Haven, CT: Yale University Press.
Delli Carpini, M. X., & Williams, B. A. (2000). Let us infotain you: Politics in the new mediaenvironment. In W. L. Bennett & R. M. Entman (Eds.), Mediated politics: Communicationin the future of democracy (pp. 160–181). Cambridge, England: Cambridge University Press.
Gilens, M. (2001). Political ignorance and collective policy preferences. American Political Sci-ence Review, 95, 379–396.
Gilliam, F. D., & Iyengar, S. (2000). Prime suspects: The influence of local television news onthe viewing public. American Journal of Political Science, 44, 560–573.
Hamilton, J. T. (1998). Channeling violence: The economic market for violent television pro-gramming. Princeton, NJ: Princeton University Press.
Kalb, M. (1998). The rise of the ‘new news.’ A case study of two root causes of the modernscandal coverage (Discussion Paper D-34). Cambridge, MA: Joan Shorenstein Center, HarvardUniversity.
Krosnick, J. A., & Chang, L. C. (2001). A comparison of the random digit dialing telephonesurvey methodology with internet survey methodology as implemented by Knowledge Net-works and Harris Interactive. Unpublished manuscript. Ohio State University.
Krotki, K., & Dennis, J. M. (2001). Probability-based survey research on the Internet. Paperpresented at the 53rd Conference of the International Statistical Institute, Seoul, South Korea.
Lodge, M., Steenbergen, M., & Braun, S. (1995). The responsive voter: Campaign informationand the dynamics of candidate evaluation. American Political Science Review, 89, 309–326.
Patterson, T. E. (2000). Doing well and doing good: How soft news and critical journalism areshrinking the new audience and weakening democracy—And what news outlets can do aboutit (Faculty Research Working Paper Series, RWP01-001). Cambridge, MA: John F. KennedySchool of Government, Harvard University.
Popkin, S. L. (1994). The reasoning voter: Communication and persuasion in presidential cam-paigns (2nd ed.). Chicago: University of Chicago Press.
Price, V., & Zaller, J. (1993). Who gets the news? Alternative measures of news reception andtheir implications for research. Public Opinion Quarterly, 57, 133–164.
Prior, M. (2002). Political knowledge after September 11. PS: Political Science and Politics, 35,523–529.
Steiner, P. O. (1952). Program patterns and preferences and the workability of competition inradio broadcasting. Quarterly Journal of Economics, 66, 194–223.
Zaller, J. (1996). The myth of massive media impact revived. New support for a discredited idea.In D. C. Mutz, P. M. Sniderman, & R. A. Brody (Eds.), Political persuasion and attitudechange (pp. 17–78). Ann Arbor: University of Michigan Press.
Zaller, J. (1999). Market competition and news quality. Paper presented at the 95th Annual Meet-ing of the American Political Science Association, Atlanta, GA.


![[PPT]PowerPoint Presentation - Ave Maria Press · Web viewChapter 6 PowerPoint Good News Good News The Four Evangelists Good News The Good News: Jesus Christ The Synoptic Gospels:](https://static.fdocuments.net/doc/165x107/5b78bdcd7f8b9a331e8c3293/pptpowerpoint-presentation-ave-maria-press-web-viewchapter-6-powerpoint.jpg)

