LAN Airlines Memoria Anual | Annual Report 2009 - Corporate-ir
Upload
lfi-agencia-digitalCategory
view
214download
0description
09 Annual Repor t
www.methanex.com methanexA Responsible Care® Company
www.methanex.com
Printed in CanadaPlease recycle.
Methanex Corporation is:the world’s largest supplier of methanol to major international markets in North America, Asia Pacific, Europe and Latin America.
Methanol is:a versatile liquid chemical produced primarily from natural gas and used as a chemical feedstock in the manufacture of a wide range of consumer and industrial products such as building materials, foams, resins and plastics. The fastest growing markets for methanol are in the energy sector which today represents 30% of methanol demand. Methanol is used to produce methyl tertiary-butyl ether (MTBE), a gasoline component, and there are growing markets for using methanol in energy applications such as direct blending into transportation fuels, dimethyl ether (DME), and biodiesel.
2009 Financial Highlights 02
President’s Message to Shareholders 03
Chairman’s Message on Corporate Governance 08
Management’s Discussion and Analysis 10
Consolidated Financial Statements 49
Notes to Consolidated Financial Statements 57
Head OfficeMethanex Corporation1800 Waterfront Centre200 Burrard StreetVancouver, BC V6C 3M1Tel 604 661 2600Fax 604 661 2676
Toll Free1 800 661 8851Within North America
Web Sitewww.methanex.com
Sales inquiries:[email protected]
Transfer AgentCIBC Mellon Trust acts as transfer agent and registrar for Methanex stock and maintains all primary shareholder records. All inquiries regarding share transfer requirements, lost certificates, changes of address, or the elimination of duplicate mailings should be directed to CIBC Mellon Trust at:
1 800 387 0825Toll Free within North America
Investor Relations Inquiries Jason CheskoDirector, Investor RelationsTel 604 661 2600 [email protected]
Annual General MeetingThe Annual General Meeting will be held at the Vancouver Convention Centre in Vancouver, British Columbia on Thursday, April 29, 2010 at 10:00 a.m. (Pacific Time).
Shares ListedToronto Stock Exchange – MXNasdaq Global Market – MEOHSantiago Stock Exchange – Methanex
Annual Information Form (AIF)The corporation’s AIF can be found online at www.sedar.com.
A copy of the AIF can also be obtained by contacting our head office.
CORpORATe InFORMATIOn
This annual report is printed on Forest Stewardship Council (FSC) certified paper. By printing on FSC certified paper, Methanex is supporting
responsible forest management. Design: Signals Design Group Inc, Vancouver, BC Printing: Metropolitan Fine Printers, Vancouver, BC

Production Facilities
Head Office
Marketing and Commercial Offices
Distribution Terminalsand Storage Facilities
Shanghai
Hong Kong
CHILE
TRINIDADAND TOBAGO
EGYPT (2010)
Tokyo
SeoulBeijing
Billingham
Brussels
DubaiCairo
Dallas
Vancouver
Santiago
NEW ZEALAND
Global Production FacilitiesMethanex’s global production hubs are strategically
positioned to supply every major global market.
Methanex Chile
The Punta Arenas production complex in southern
Chile produces methanol for customers
in North America, Latin America, Europe and Asia.
Methanex New Zealand
Our production facilities in New Zealand supply
methanol primarily to customers in Japan, South
Korea and China.
Methanex Trinidad
Our two plants in Trinidad, Titan and Atlas (Methanex
interest 63.1%), primarily supply North American
and European methanol markets.
Methanex in Egypt (2010)
Our new facility in Egypt (joint venture with the
Egyptian government and a regional investor –
Methanex interest 60%) which is expected to start
up in mid-2010, is located on the Mediterranean Sea,
and will primarily supply European methanol markets.
Global Supply ChainMethanex has an extensive global supply chain
and distribution network of terminals and storage
facilities throughout Asia, North America, Latin
America and Europe.
Methanex’s wholly owned subsidiary, Waterfront
Shipping, operates the largest methanol ocean
tanker fleet in the world. The fleet forms a seamless
transportation network dedicated to keeping an
uninterrupted flow of methanol moving to storage
terminals and customers’ plant sites around the
world. For further information on Waterfront
Shipping, please visit www.wfs-cl.com.
Our Responsible Care® CommitmentMethanex is a Responsible Care® company.
Responsible Care is the umbrella under
which Methanex and other leading chemical
manufacturers manage issues relating to health,
safety, environment, community awareness and
involvement as well as emergency preparedness.
The total commitment to Responsible Care is an
integral part of Methanex’s global corporate culture.
Methanex also has a Social Responsibility policy
which is an enhancement and natural evolution of
our commitment to Responsible Care.
Production Facilities
Head Office
Marketing and Commercial Offices
Distribution Terminalsand Storage Facilities
Shanghai
Hong Kong
CHILE
TRINIDADAND TOBAGO
EGYPT (2010)
Tokyo
SeoulBeijing
Billingham
Brussels
DubaiCairo
Dallas
Vancouver
Santiago
NEW ZEALAND
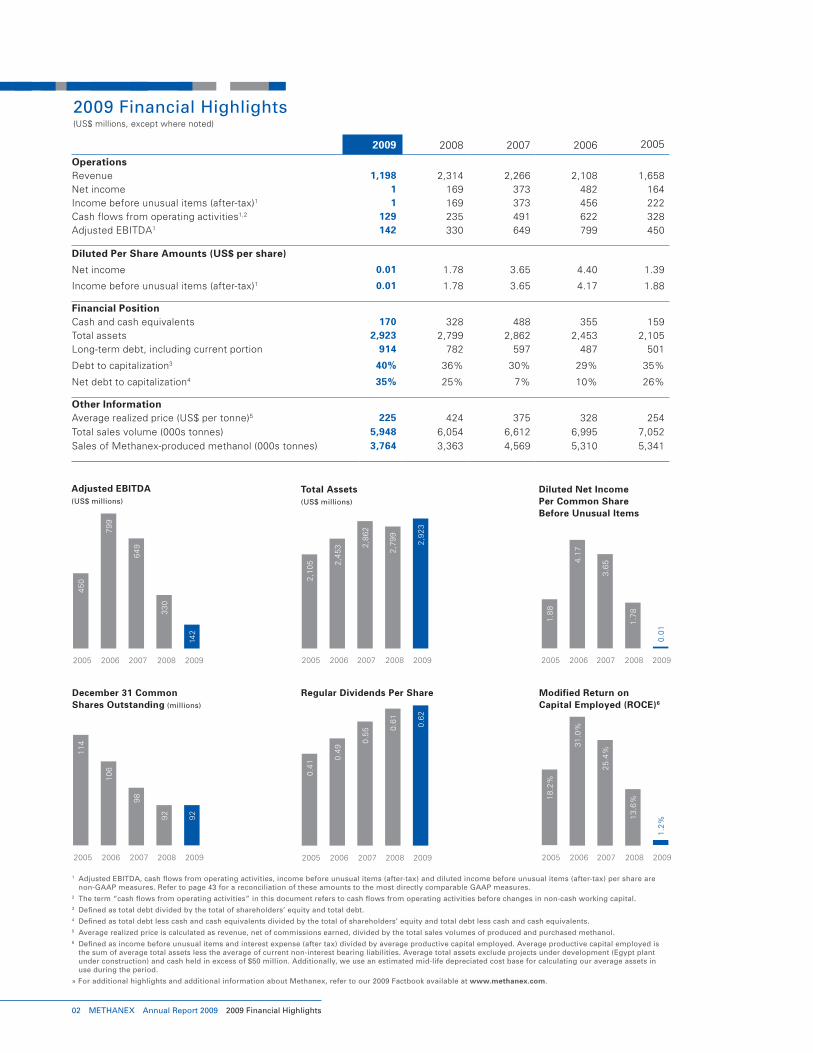
2009 Financial Highlights(US$ millions, except where noted)
1 Adjusted EBITDA, cash flows from operating activities, income before unusual items (after-tax) and diluted income before unusual items (after-tax) per share are non-GAAP measures. Refer to page 43 for a reconciliation of these amounts to the most directly comparable GAAP measures.
2 The term “cash flows from operating activities” in this document refers to cash flows from operating activities before changes in non-cash working capital.3 Defined as total debt divided by the total of shareholders’ equity and total debt.4 Defined as total debt less cash and cash equivalents divided by the total of shareholders’ equity and total debt less cash and cash equivalents.5 Average realized price is calculated as revenue, net of commissions earned, divided by the total sales volumes of produced and purchased methanol.6 Defined as income before unusual items and interest expense (after tax) divided by average productive capital employed. Average productive capital employed is
the sum of average total assets less the average of current non-interest bearing liabilities. Average total assets exclude projects under development (Egypt plant under construction) and cash held in excess of $50 million. Additionally, we use an estimated mid-life depreciated cost base for calculating our average assets in use during the period.
» For additional highlights and additional information about Methanex, refer to our 2009 Factbook available at www.methanex.com.
2009 2008 2007 2006 2005
OperationsRevenue 1,198 2,314 2,266 2,108 1,658Net income 1 169 373 482 164Income before unusual items (after-tax)1 1 169 373 456 222Cash flows from operating activities1,2 129 235 491 622 328Adjusted EBITDA1 142 330 649 799 450
Diluted Per Share Amounts (US$ per share)
Net income 0.01 1.78 3.65 4.40 1.39
Income before unusual items (after-tax)1 0.01 1.78 3.65 4.17 1.88
Financial PositionCash and cash equivalents 170 328 488 355 159Total assets 2,923 2,799 2,862 2,453 2,105Long-term debt, including current portion 914 782 597 487 501
Debt to capitalization3 40% 36% 30% 29% 35%
Net debt to capitalization4 35% 25% 7% 10% 26%
Other InformationAverage realized price (US$ per tonne)5 225 424 375 328 254Total sales volume (000s tonnes) 5,948 6,054 6,612 6,995 7,052Sales of Methanex-produced methanol (000s tonnes) 3,764 3,363 4,569 5,310 5,341
2005
18
.2%
2006
31
.0%
2005
0.4
1
2006
0.4
9
2007
0.5
5
2005
1.8
8
2006
4.1
7
Total Assets(US$ millions)
Diluted Net Income Per Common ShareBefore Unusual Items
Modified Return onCapital Employed (ROCE)6
December 31 Common Shares Outstanding (millions)
Regular Dividends Per Share
2005
11
4
2006
10
6
2008 2009
92
92
2007
98
2008 2009
0.6
1
0.6
2
2005
2,1
05
2006
2,4
53
2008 2009
2,7
99
2,9
23
2007
2,8
62
2008 2009
1.7
8
0.0
12007
3.6
5
2008 2009
13
.6%
1.2
%
2007
25
.4%
Adjusted EBITDA(US$ millions)
2005
45
0
2006
79
9
2008 2009
33
0
2007
64
9
02 METHANEX Annual Report 2009 2009 Financial Highlights
142
Dear Fellow Shareholders,
2009 was a challenge for Methanex, but we maintained
a focus on implementing our long-term strategy. At the
beginning of 2009, the economic and financial crisis severely
slowed global economic activity. Methanol demand and pricing
declined sharply, and our earnings for 2009 were significantly
lower than in prior years.
As the year progressed, world economies returned to some
degree of normality, and conditions in the methanol industry
steadily improved. By the end of the year, methanol demand
recovered to pre-recession levels and pricing also increased
substantially from the depressed levels seen earlier in the
year. The growing use of methanol in energy applications
continued to be a bright spot for the industry, as demand for
these applications grew at high rates again in 2009, despite
the global recession.
Our competitively positioned assets generated positive cash
flow from operations in every quarter, even with the global
economy going through one of the weakest periods in recent
memory. Our strong balance sheet also enabled us to continue
investing in key value-adding initiatives. With a new project
in Egypt scheduled to start up this year, and plans at all our
other sites to increase production, we have the potential
to double production over the next few years by spending
modest amounts of capital. Success in these initiatives will
add important new supply for our customers, while generating
significant cash flow for our shareholders.
2009 HIGHlIGHTS
� Strong performance managing through the global financial
and economic crisis:
– Generated positive cash flow from operations in every
quarter of the year
– Maintained a strong balance sheet while continuing to
invest in value-adding, strategic initiatives
– Maintained the regular dividend which resulted
in the highest annual per share dividend in the
Company’s history
– Successfully executed a broad corporate cost savings
plan which reduced our operating costs and discretionary
capital spending
– Renewed and extended our undrawn credit facility and
enhanced the Company’s liquidity position
� Continued to make good progress on the Egypt project –
this 1.3 million tonne methanol plant is on budget and on
track for start-up in mid-2010
� Benefitted from successful gas development in southern
Chile, which led to increased gas deliveries and
production from a second plant in Chile
� Continued progress on promoting methanol demand
growth in energy applications: methanol demand for
energy applications (fuel blending, dimethyl ether
(DME)) grew at double-digit rates again in 2009
� Welcomed China’s announcement of new national fuel
blending standards for methanol use in automobiles,
which are expected to act as a catalyst for further
growth of methanol fuel blending
President’s Message to Shareholders
“…we have the potential to double production over the next few years by spending modest amounts of capital.”
President’s Message to Shareholders Annual Report 2009 METHANEX 03
INDUSTRy REvIEw
As we entered 2009, the global recession was adversely
impacting the methanol industry. Just over two-thirds
of the world demand for methanol is used in traditional
chemical applications where demand is highly correlated
with industrial production. As a result, demand for these
applications at the beginning of the year was down around
20 percent from pre-recession levels. However, the
remaining one-third of global methanol demand, which is
used in energy applications, remained strong in 2009 despite
the global recession. Demand growth in gasoline blending
and DME in China was particularly strong, growing at double-
digit rates again in 2009.
Overall, at its low point early in the year, global methanol
demand was down by about 15 percent from its 2008 high.
Lower demand led to a significant amount of higher cost
capacity, particularly in China and Europe, being shut in or
operated at lower rates for a period of time to bring supply
and demand into balance. This resulted in a period of lower
methanol prices, with contract pricing across global markets
averaging $213 per tonne over the first half of the year.
As the year progressed, with increasing energy prices and a
strong recovery in Asia, methanol demand improved and by
the end of the year, it had slightly surpassed pre-recession
levels. In addition to the continued growth in energy
applications, demand into chemical derivatives in Asia also
recovered strongly. In Europe and North America, demand
into chemical derivatives began to recover but still lagged
pre-recession levels.
Industry supply also faced challenges in 2009. Many
methanol plants had operational issues or were shut in or
operated at lower rates due to economics. And, increasing
energy prices during the year placed further upward
pressure on feedstock costs for higher cost producers.
These factors, coupled with a strong recovery in demand,
led to higher prices in the second half of the year. In the
fourth quarter of 2009, average contract methanol prices had
recovered to about $330 per tonne, and at the beginning of
2010, pricing had increased further in most markets by up to
$20 per tonne.
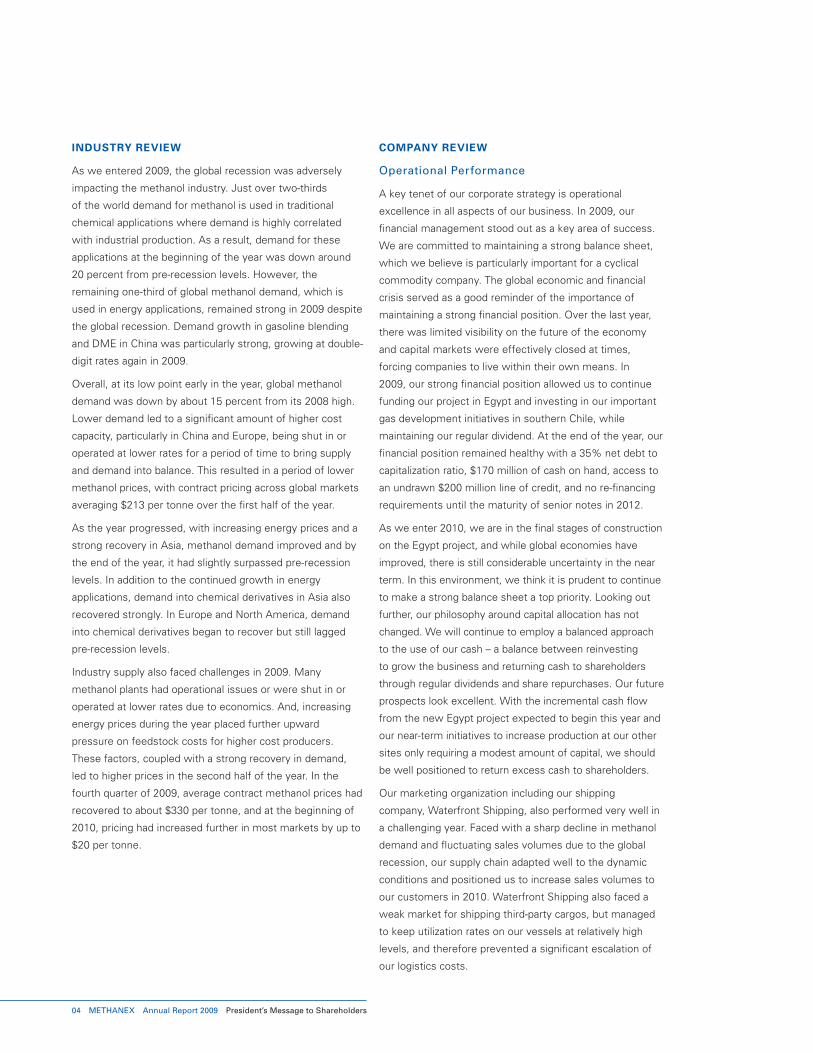
COMPANy REvIEw
Operational Performance
A key tenet of our corporate strategy is operational
excellence in all aspects of our business. In 2009, our
financial management stood out as a key area of success.
We are committed to maintaining a strong balance sheet,
which we believe is particularly important for a cyclical
commodity company. The global economic and financial
crisis served as a good reminder of the importance of
maintaining a strong financial position. Over the last year,
there was limited visibility on the future of the economy
and capital markets were effectively closed at times,
forcing companies to live within their own means. In
2009, our strong financial position allowed us to continue
funding our project in Egypt and investing in our important
gas development initiatives in southern Chile, while
maintaining our regular dividend. At the end of the year, our
financial position remained healthy with a 35% net debt to
capitalization ratio, $170 million of cash on hand, access to
an undrawn $200 million line of credit, and no re-financing
requirements until the maturity of senior notes in 2012.
As we enter 2010, we are in the final stages of construction
on the Egypt project, and while global economies have
improved, there is still considerable uncertainty in the near
term. In this environment, we think it is prudent to continue
to make a strong balance sheet a top priority. Looking out
further, our philosophy around capital allocation has not
changed. We will continue to employ a balanced approach
to the use of our cash – a balance between reinvesting
to grow the business and returning cash to shareholders
through regular dividends and share repurchases. Our future
prospects look excellent. With the incremental cash flow
from the new Egypt project expected to begin this year and
our near-term initiatives to increase production at our other
sites only requiring a modest amount of capital, we should
be well positioned to return excess cash to shareholders.
Our marketing organization including our shipping
company, Waterfront Shipping, also performed very well in
a challenging year. Faced with a sharp decline in methanol
demand and fluctuating sales volumes due to the global
recession, our supply chain adapted well to the dynamic
conditions and positioned us to increase sales volumes to
our customers in 2010. Waterfront Shipping also faced a
weak market for shipping third-party cargos, but managed
to keep utilization rates on our vessels at relatively high
levels, and therefore prevented a significant escalation of
our logistics costs.
04 METHANEX Annual Report 2009 President’s Message to Shareholders
To measure the performance of our manufacturing
operations, we track a reliability factor that measures a
plant’s on-stream time, excluding planned maintenance
and events beyond our control. We set a challenging target
of 97 percent, and came close to achieving that rate in
2009 with an overall company reliability rate of 96 percent.
Our sites in Trinidad and New Zealand operated with very
good reliability in 2009, with rates of 97 and 98 percent,
respectively. Due to some technical issues, our Chile site
operated at a 93 percent reliability rate. Despite slightly
missing our overall target, we believe our reliability rate
was still above the industry average.
Responsible Care is an integral part of everything we do
and it contributes significantly to our operational excellence.
Responsible Care is the chemical industry’s global voluntary
initiative under which companies work to continuously
improve their health, safety and environmental performance.
At Methanex, it is the umbrella under which we manage
issues related to health, safety, the environment,
emergency preparedness, security, product stewardship
and community outreach. As a natural extension of our
Responsible Care ethic, we have also adopted a Social
Responsibility policy that addresses issues related to
governance, employee engagement and social investment
that have long been part of our corporate culture. We have
embedded the Responsible Care ethic throughout the
Company and it is a significant contributor to our leadership
position in the methanol industry.
One important measurement of our Responsible Care
performance is to track site safety using a globally
accepted indicator for safety, known as the recordable
injury frequency rate (RIFR). In 2009, the Canadian industry
average RIFR for comparable companies was 0.60. We
experienced a number of injuries during the year that
resulted in an increase in our RIFR to 0.89, interrupting
an 8-year trend of continuous improvement. 2009 thus
proved to be a challenging year for Methanex in this regard.
Furthermore, we were particularly saddened that two
contractors were killed while working at the construction
site in Egypt in early 2010. I cannot stress enough our
commitment to providing a safe workplace and the
importance we place on having a culture of safety at all of
our sites. I am personally committed to seeing significant
improvement in this area.
An important part of our commitment to Responsible
Care is to minimize the impact of our operations on
the environment. Over the past five years we have
continually improved our environmental performance by
investing in environmental infrastructure and enhancing
our management systems, resulting in our last significant
incident occurring over three years ago. In 2009, our
environmental performance was on par with our best year
on record. We also recognize the importance of making
efficient use of resources and minimizing emissions. We
continually strive to increase the energy efficiency of our
plants, which not only reduces costs but also minimizes
CO2 emissions. We have reduced CO2 emission intensity
in our manufacturing operations by 35% between 1994
and 2010 through asset turnover, improved plant reliability
and energy efficiency and emissions management. We
also committed to a small investment in wind power
at our plants in Chile. There is an excellent business
case supporting this project and we will look for other
opportunities to develop renewable energy when these
make sense in the context of our energy consumption.
Financial Performance
While 2009 will not be remembered as a year of strong
financial results, our competitively positioned assets resulted
in positive cash flow from operations in every quarter. For
the year, we sold 5.9 million tonnes of methanol, generated
$1.2 billion in revenue, $142 million in EBITDA and $129 million
in cash flow from operations before changes in working
capital. Net income for the year was just over break-even.
We have disciplined targets around capital allocation, and we
measure this with a Modified Return on Capital Employed
(ROCE) target of 12 percent. Over the last five years, our
ROCE has averaged 18 percent, well in excess of our target.
And with the start-up of the Egypt project this year, we expect
this will add to our strong ROCE results for years to come.
In recent years, we have also reinvested a significant amount
of capital in our business and distributed excess cash to
shareholders through both dividends and share repurchases.
We have made these investments while maintaining a
strong balance sheet and without adding undue risk to the
Company’s liquidity. Since 2000, we have invested over
$1.5 billion in growing our core business and have reduced
our shares outstanding from about 173 million to 92 million.
Over this period, we repurchased these shares at an average
price of about US$12 per share, adding significant value for
long-term shareholders. We have also increased the regular
dividend six times since implementing it in 2002.
President’s Message to Shareholders Annual Report 2009 METHANEX 05

Finally, with equity markets and the methanol industry
recovering from the impacts of the global recession in 2009,
it was a very strong year for our share price. Our share price
closed the year at US$19.49, representing a 73% increase
over the year and comparing favourably to the S&P 500
Chemicals Index, which was up by 41% in 2009. Over the
last five years, an investment in Methanex achieved a total
return of 24%, in line with the S&P 500 Chemicals index
which achieved a total return of 28% over the same period.
Building on Strength – Positioning the Company
for Low Cost Growth
The recent global recession serves as a good reminder of the
importance of having low cost assets in a commodity industry.
At the peak of the global recession in 2009 – with considerably
reduced demand for methanol – about 20% of higher cost
industry capacity was forced to shut down. In contrast, our
competitively positioned assets continued to operate and
generate cash flow for our shareholders. A key part of our
strategy is to maintain our leadership position in the methanol
industry by increasing our production capacity while driving
down the cost structure of our assets. We are focusing on a
number of opportunities to realize this goal. And, while adding
low cost methanol capacity is typically a capital-intensive
proposition, we are in the advantageous position of having
opportunities to add capacity with minimal capital expenditures.
Firstly, we are pleased with the progress made on the Egypt
project in 2009. Large greenfield methanol projects like this
are challenging to execute, yet we have continued to advance
the project on budget and on track for start-up in the middle of
2010. We have a 60% interest in the 1.3 million tonne plant and
will market 100% of the output. The Egypt project will add an
important new supply source for our customers, and with a very
competitive cost position, it will also generate significant cash
flow for shareholders even in a low methanol price environment.
Capital spending is almost complete and we remain focused on
a successful start-up of this very important project.
Secondly, we have an excellent opportunity to increase our
low cost production base in Chile. In 2009, we continued to
operate our site in Chile at about 25 percent capacity using
gas supply from Chile only, as a result of the loss of natural
gas supply from Argentina that impacted us back in mid-2007.
Since that time, our goal has been to source more natural
gas from Chile. Momentum started to build on this front in
2009 and we reached a significant milestone at the end of
the year, when we received sufficient natural gas supply to
start up a second plant. This achievement was a direct result
of our natural gas exploration initiatives with GeoPark in the
Fell block and with ENAP in the Dorado Riquelme block. Gas
supply from these blocks increased throughout the year, and
by the end of 2009, these blocks were supplying us with
about half our total gas supply in Chile.
In addition, exploration and development activities are
ramping up in other exploration blocks near our plants that
the Chilean government awarded as part of its international
bidding round in late 2007. As well as our own involvement in
an exploration consortium, several other international oil and
gas companies have started exploration activities in these
blocks. We expect initial gas deliveries from some of these
blocks to start in 2010.
With a significant increase in natural gas exploration
activity anticipated in southern Chile over the next couple
of years, we expect the production ramp-up at our Chile
site to accelerate after this year. We estimate that about
$500 million is planned to be spent on the exploration and
development of oil and gas in southern Chile over the next
few years. Based on this, we are optimistic that we can
return to operating all four of our plants in Chile.
Finally, we have idle capacity in both New Zealand and
Canada, and we are working on initiatives to potentially
increase or resume production at these sites. The key issue
for these locations is being able to secure sufficient natural
gas supply on commercially acceptable terms.
“The recent global recession serves as a good reminder of the importance of having low cost assets in a commodity industry.”
06 METHANEX Annual Report 2009 President’s Message to Shareholders

Market Leadership in Methanol into Energy
Applications
Led by growth in China in recent years, methanol demand
growth into energy applications has been very strong,
particularly in fuel blending. Supported by provincial
programs, methanol fuel blending in China now represents
about 10 percent of global methanol demand. We believe
the potential is much greater. In 2009, China introduced
a new national methanol fuel blending standard for M-85
(85% methanol blend) and we expect that the Chinese
government will implement a national M-15 standard (15%
methanol blend) later in 2010. This is supported by the rapid
growth in automobiles in that country, with China recently
surpassing the United States as the largest automobile
market in the world.
Bolstered by strong crude oil prices, we once again saw high
rates of growth in demand for methanol for DME in China.
DME is primarily used as a cooking and heating fuel in China
and we believe there is significantly more demand potential
for DME as a diesel substitute in that country.
With our market leadership position in the methanol
industry, it is a key strategic initiative for us to promote the
use of methanol in energy applications in China and other
regions of the world. We are regularly in discussions with
many interested parties to advance this goal, and as China
continues to demonstrate the viability of gasoline blending
and DME, we believe it increases the likelihood that other
regions will also consider adopting these applications. Japan,
Korea, Indonesia, and Malaysia and others are considering
methanol fuel blending and/or DME, and in Egypt, we have
also entered into a joint venture agreement to develop a
DME project similar to our joint venture project in China.
Looking Ahead…
As we enter 2010, conditions in the global economy and
methanol industry have improved and the long-term
fundamentals for the industry and our Company look
excellent. In recent years, an environment of higher energy
prices has driven strong demand growth in methanol into
energy applications and supported a healthy methanol pricing
environment. If high energy prices continue into the future, we
expect that the methanol price environment will also remain
strong.
We are excited about the new project in Egypt starting up
this year and the many initiatives we have in place to increase
production at our other sites over the next few years. We
believe that each of these initiatives will build on our market
leadership position, increase supply to our customers,
improve our cost structure and further strengthen our
Company. This puts us in an excellent position to continue
generating strong returns for our shareholders.
Before I close I would like to take this opportunity to thank
our Chairman of the Board, Pierre Choquette. Pierre will be
standing for re-election as a director at this year’s AGM, but he
will be stepping down from his position as Chairman. Pierre
has provided outstanding leadership for the Company over the
last couple of decades as Chairman and formerly as the CEO of
Methanex and I would like to acknowledge the huge contribution
that he has made to the development of our Company.
In closing, I would like to thank all of our employees for their
impressive performance in a very challenging year. And, on
behalf of the Board and all of our employees, I thank you, our
shareholders, for your continued support.
Bruce Aitken
President & Chief Executive Officer
President’s Message to Shareholders Annual Report 2009 METHANEX 07
“…the long-term fundamentals for the industry and our Company look excellent.”
Chairman’s Message on Corporate Governance
Dear Fellow Shareholders,
At Methanex, we define corporate governance as having
the appropriate processes and structures in place to
ensure that our business is managed in the best interests
of our shareholders while keeping in mind the interests
of all stakeholders. Over the past several years, corporate
governance has been – and remains – a significant public
policy issue and Methanex’s management and Board have
made it a priority to strive for continuous improvement in
this important area.
A complete discussion of Methanex’s corporate governance
practices can be found in our Information Circular; here, I would
like to focus attention on a few aspects of our governance
practices that occupied our attention over the past year.
Executive Compensation Disclosure
Executive compensation is an area that is receiving intense
public scrutiny. Last year, regulators instituted sweeping
new disclosure rules designed to allow shareholders to
clearly understand how companies make decisions about
both executive and director compensation. Our disclosure
goes beyond the required rules and incorporates many
best practices used by prominent issuers in North America.
It includes a comprehensive Compensation Discussion
and Analysis section that describes both the process
for determining executive compensation as well as the
objectives and design of the compensation program and how
the compensation awarded relates to Methanex’s overall
performance. Simply stated, our disclosure explains ”how”
and “why” we make executive compensation decisions and
how we link compensation to corporate performance.
Our ultimate goal is to ensure that our shareholders
have sufficient information to determine for themselves
whether Methanex’s senior management is fairly paid and
whether their compensation is aligned with our corporate
performance and the interests of shareholders.
Say on Pay
The ability of shareholders of a public company to vote
on the executive compensation policies and practices of
the company is known as “Say on Pay”. In the U.S., the
call for instituting Say on Pay has grown louder as a result
of the recent global financial crisis and the increasing
intolerance for what many consider to be excessive pay
practices at some U.S. companies. Say on Pay is not law
in Canada and there are no Canadian legislative proposals
calling for it. The Canadian Coalition for Good Governance
(CCGG), representing a large group of Canadian institutional
investors, has recently adopted a policy calling for Say on
Pay at Canadian public companies within a broader process
of institutional shareholders having regular, constructive
engagement with boards and board compensation
committees. CCGG’s policy was developed in cooperation
with Canada’s largest banks and insurers who felt that it was
in the public interest to develop a common approach on Say
on Pay and many of these companies have agreed to institute
a Say on Pay vote at their annual general meetings in 2010.
In 2009, Methanex received a formal proposal from a
shareholder requesting that the Company institute a Say
on Pay vote and all shareholders will be asked at our 2010
AGM to vote on this proposal. If the vote passes, Methanex
will institute a Say on Pay vote at the 2011 AGM. The formal
resolution and statement from this shareholder can be found
in our Information Circular.
The Company recommends that shareholders vote “No”
to the proposal and the Company’s detailed reasons for
this “No” recommendation are set out in the Information
Circular. This is an important issue and I ask all shareholders
to read the statements closely and to exercise their right to
vote on this issue.
I do not intend to repeat Methanex’s reasons for
recommending against the shareholder proposal here,
but I do wish to make a few points. Most importantly, as I
mentioned at the outset, Methanex strives to continuously
improve its governance practices and we want to be seen
as a top quartile company in terms of corporate governance.
For several years, Methanex has ranked firmly within the first
08 METHANEX Annual Report 2009 Chairman’s Message on Corporate Governance
quartile of the Globe and Mail’s annual governance survey
rankings. This year was no different, with the Company
placing 20th among 157 companies in the S&P/TSX Index.
In 2009, prior to receiving this shareholder proposal, the
Methanex Board considered whether to voluntarily adopt Say
on Pay. The Board concluded then, and continues to believe,
that Say on Pay is a remarkably blunt instrument in that
it merely asks shareholders to vote “Yes” or “No” on the
Company’s approach to compensation as disclosed in our
Information Circular. While we make every effort to keep this
disclosure simple and clear, the reality is that the document
includes extensive detail on every aspect of executive
compensation. Given this level of detail and breadth, how
is the Board to interpret a ”No” vote received from a
shareholder? Does it apply to the disclosure as a whole, a
particular aspect of compensation, the level of compensation
provided or something altogether different?
For that reason, the Board decided that while obtaining
feedback on compensation is highly desirable, a simple Say
on Pay vote does not provide very meaningful feedback
and is not an ideal way to engage with shareholders on this
issue. The Board concluded that a better way to receive
feedback on this disclosure would be to invite shareholders
to comment on the disclosure through a web-based survey.
This survey is now available on the Investor Relations
section of our website (www.methanex.com) and will be
open until the end of June. All comments received will
be provided directly to the Chair of the Human Resources
Committee of the Board and discussed by the Board as a
whole. Shareholders who choose to provide their contact
details may be contacted to discuss this topic in more detail.
Full details on this initiative can be found in the Information
Circular. We believe that our web-based survey enables more
direct and detailed feedback, and as such, is a much more
effective way of ensuring that shareholders can express
their views regarding executive compensation than through
a simple “Yes/No” vote. We will provide a report on this
process in our annual disclosure documents next year.
We will address this issue at the AGM and I look forward
to learning whether Methanex shareholders wish to
implement Say on Pay or whether they prefer a different
means for providing feedback to the Company on the topic
of executive compensation.
Lastly, long-term shareholders will know that the Board has
been engaged in a process of renewal over the past several
years. This year is no different and I take this opportunity
to announce that after close to seven years as Chairman of
the Board of Methanex, I have decided to step down from
this position after the AGM. I remain fully committed to
Methanex and I look forward to standing for re-election for
another year as a director at this year’s AGM. As a result
of the succession process undertaken, Mr. Tom Hamilton
has been chosen to take over the chairmanship. The entire
Board looks forward to working with him as Chairman of the
Company in the years to come.
Pierre Choquette
Chairman of the Board
In 2009, Methanex ranked among the top 15 percent of S&P/TSX Composite Index companies in the Globe and Mail “Board Games” corporate governance survey...
Chairman’s Message on Corporate Governance Annual Report 2009 METHANEX 09

10 METHANEX Annual Report 2009 Management’s Discussion and Analysis
This Management’s Discussion and Analysis is dated March 5, 2010 and should be read in conjunction with our consolidated
financial statements and the accompanying notes for the year ended December 31, 2009. Our consolidated financial statements
are prepared in accordance with Canadian generally accepted accounting principles (Canadian GAAP). We use the United States
dollar as our reporting currency. Except where otherwise noted, all dollar amounts are stated in United States dollars.
Canadian GAAP differs in some respects from accounting principles generally accepted in the United States (US GAAP).
Significant differences between Canadian GAAP and US GAAP are described in note 19 to our consolidated financial statements.
At March 4, 2010 we had 92,127,192 common shares issued and outstanding and stock options exercisable for 3,334,037
additional common shares.
Additional information relating to Methanex, including our Annual Information Form, is available on the Canadian Securities
Administrators’ SEDAR website at www.sedar.com and on the United States Securities and Exchange Commission’s EDGAR
website at www.sec.gov.
OvERvIEw OF THE BUSINESS
Methanol is a commodity liquid chemical that is predominantly produced from natural gas and also from coal, particularly
in China. Approximately 70% of all methanol demand is used to produce formaldehyde, acetic acid and a variety of other
chemicals that form the basis of a large number of chemical derivatives for which demand is influenced by levels of global
economic activity. The remainder of methanol demand comes from the energy sector. There are growing markets for using
methanol in energy applications such as direct methanol blending into gasoline and dimethyl ether (DME) which can be
blended with liquefied petroleum gas for use in household cooking and heating, and also as a substitute for diesel. Methanol
is also used to produce biodiesel and methyl tertiary butyl ether (MTBE), a gasoline component.
We are the world’s largest supplier of methanol to the major international markets of North America, Asia Pacific, Europe and
Latin America. We currently have total annual production capacity of 6.8 million tonnes from our production hubs in Chile,
Trinidad and New Zealand. We also have a 60% interest in a 1.3 million tonne methanol project in Egypt, scheduled for start-up
in mid-2010. Our production hubs in Chile and Trinidad represent 5.9 million tonnes of our total annual production capacity. The
remainder of our total annual production capacity consists of our 0.9 million tonne per year Motunui plant in New Zealand. We
also have 1.4 million tonnes of idled annual capacity in New Zealand (a second 0.9 million tonne per year Motunui plant and a
0.5 million tonne per year plant in nearby Waitara Valley) and 0.5 million tonnes of idled capacity in Canada. These idled facilities
provide the potential to increase production in New Zealand and Canada depending primarily on the availability of economically
priced natural gas feedstock and methanol supply and demand dynamics. In addition to the methanol we produce, we purchase
methanol produced by others under methanol offtake contracts and on the spot market. This gives us flexibility and certainty in
managing our supply chain while continuing to meet customer needs and support our marketing efforts.
2009 Industry Overview
2009 was a challenging year for the methanol industry as a result of the global economic recession that began in late 2008. As we
entered 2009, we estimate global demand had declined by about 15% from pre-recession levels to an annualized level of about
36 million tonnes, with global demand for traditional methanol derivatives being most impacted and declining by approximately
20% from pre-recession levels. Global demand into energy-related derivatives remained relatively stable during this period, despite
the global recession, with particularly strong demand for both direct blending into gasoline and DME. In response to the decline in
overall global demand, higher cost capacity was shut in or was operated at lower rates as prices declined. This resulted in a period
of lower methanol pricing, and our average non-discounted posted price for the first half of 2009 was $213 per tonne.
Management’s Discussion and Analysis
Management’s Discussion and Analysis Annual Report 2009 METHANEX 11
Global methanol demand continued to recover throughout 2009 and by the end of year we estimate global demand had
recovered to above pre-recession levels, or to approximately 43 million tonnes measured on an annualized basis. Overall, global
demand for methanol in 2009 is estimated at 40 million tonnes (similar to 2008 demand). Demand recovery in the first half of
2009 was mainly focused in Asia, particularly in China, while during the second half of the year we also saw some recovery in
demand in other regions including Europe and North America. In addition to the improvement in demand in the latter half of 2009,
there were significant supplier operating issues across the industry and feedstock costs for higher-cost producers escalated as
a result of higher energy prices. These factors resulted in an increase in methanol prices through the latter half of 2009 and into
2010. At the beginning of 2010, our average non-discounted posted prices had recovered to approximately $350 per tonne.
2009 Company Focus
Given the challenging economic environment in 2009, our focus for the year was on sound financial management while
continuing to invest to strengthen our low cost asset position. Our priorities for allocating capital were to continue progress
towards completing the new methanol project in Egypt, providing continued support of natural gas development in Chile and
investing to maintain the strength of our existing plants.
Strengthening our Asset Position
During 2009, we made significant progress in the construction of a new 1.3 million tonne per year methanol facility in Egypt.
As we enter 2010, the project continues to be on-budget with capital spending almost complete, and we remain focused on a
successful start-up which we expect in mid-2010.
We also continued supporting natural gas development activities in southern Chile during 2009, investing in natural gas
development with our two natural gas suppliers in Chile – Empresa Nacional del Petroleo (ENAP) and GeoPark Chile Limited
(GeoPark). In 2009, continued success in natural gas development from these investments led to increased natural gas
supply and we were able to start a second plant, albeit at reduced rates, in late 2009. We remain committed to supporting
these investments and are actively pursuing other opportunities to invest in natural gas development in southern Chile.
In addition to our methanol project in Egypt and natural gas development in southern Chile, we also completed major
maintenance activities at both our Atlas and Titan facilities in Trinidad in 2009. We expect this will result in increased
production from these facilities over the next year.
Financial Management
Always a key area of focus for the Company, sound financial management was especially important given the economic
environment in 2009. At the beginning of the year, we embarked on a broad corporate cost savings plan that included
reducing our operating costs and cancelling or postponing almost all discretionary capital spending. We also improved our
liquidity position by renewing and extending our undrawn credit facility in August 2009.
We completed the year in a solid financial position with a strong balance sheet. At December 31, 2009, we had a cash balance of
$170 million, no re-financing requirements until 2012 and an undrawn $200 million credit facility that expires in mid-2012.
Our priority for allocating capital continues to be strengthening our asset position. Capital spending is almost complete on
the new methanol project in Egypt and we are committed to increasing production at our Chile facilities by supporting the
acceleration of natural gas development in that country. In addition, we believe there may be other opportunities to increase
production at our other sites at relatively low cost. We believe these initiatives and opportunities give us the ability to
significantly increase our production over the next few years with relatively modest capital requirements and provide a sound
basis for significantly improving our cash generation and earnings capability.
OUR STRATEGy
Our primary objective is to create value by maintaining and enhancing our leadership in the global production, marketing
and delivery of methanol to our customers. The key elements of our strategy are global leadership, low cost, and
operational excellence.

12 METHANEX Annual Report 2009 Management’s Discussion and Analysis
Global leadership
We are the leading supplier of methanol to the major international markets of North America, Asia Pacific, Europe and Latin
America. Our sales volumes in 2009 represented approximately 15% of total global methanol demand. Our leadership
position has enabled us to play an important role in the industry, which includes publishing Methanex reference prices that
are generally used in each major market as the basis of pricing for most of our customer contracts.
The strategic location of our Chile, Trinidad and New Zealand production sites – as well as the new methanol project in Egypt
– allows us to deliver methanol cost-effectively to our customers in all major global markets, while our investments in global
distribution and supply infrastructure enable us to enhance value to customers by providing reliable and secure supply.
Our current focus of making investments to increase production at our sites is an important element of our strategy of Global
Leadership. The new methanol project in Egypt, which is expected to startup in mid-2010, is well located and will provide additional
security of supply for our customers. We are also focused on increasing production at our Chile facilities by supporting the
acceleration of natural gas development in southern Chile. Into 2010 we have been operating two plants, each at approximately
60% of capacity, and our goal is to return to operating all four of our plants in Chile over the next few years. These initiatives could
enable us to increase our global production levels from 3.5 million tonnes in 2009 to over 7 million tonnes over the next few years.
We also continue to pursue opportunities to increase supply by restarting idled capacity at our sites in New Zealand and Canada,
with the decision to restart the sites depending primarily on our ability to source economically priced natural gas and methanol
supply and demand dynamics. We believe our initiatives to increase production will enable us to grow our sales levels while
continuing to provide reliable and secure supply to our customers and to further build on our leadership position in the industry.
Although we have experienced significantly reduced production from our assets in Chile since mid-2007 (refer to the
Production Summary – Chile section on page 15), we have continued to meet our commitments to customers. We have
achieved this by increasing the amount of methanol we purchase through a combination of methanol offtake contracts and
spot purchases. We manage the cost of purchased methanol by taking advantage of our global supply infrastructure which
allows us to purchase methanol in the most cost-effective region while still maintaining overall security of supply.
The Asia Pacific region continues to lead global methanol demand growth and over the past few years, we have continued to
invest in and develop our presence in this important region. We added additional storage capacity in Zhangjiagang, China and
expanded our offices in Shanghai and Hong Kong. In addition, we recently opened an office in Beijing to enhance our customer
service and industry positioning in this region. This enables us to participate in and improve our knowledge of the rapidly
evolving and high growth methanol market in China and other Asian countries. Our expanding presence in Asia has also helped
us identify several opportunities to support the development of applications for methanol in the energy sector. Finally, our
office in Dubai, UAE enables us to enhance our corporate presence and capitalize on future opportunities in the Middle East.
Over the past few years, the demand for methanol for energy applications has been strong, particularly in China, and the
country continues to demonstrate the viability of methanol into energy applications. For example, in December 2009, the
Chinese government implemented national standards for M-85 (85% methanol blend). One of our key strategic initiatives is
to continue supporting demand growth into energy applications globally. We have a 20% interest in a 200,000 tonne per year
DME facility in China with the ENN Group, and we are the exclusive methanol supplier to this facility. We have also entered
into a joint venture agreement to develop a similar DME facility in Egypt. The joint venture will include Methanex and the
ENN Group as minority interests, with the Egyptian Ministry of Petroloeum, including its subsidiary Egyptian Petrochemicals
Holding Company (EChem), holding the majority interest. EChem is also a partner in our new methanol project in Egypt.
low Cost
A low cost structure is an important element of competitive advantage in a commodity industry and is a key element of our
strategy. Our approach to all business decisions is guided by our drive to maintain and enhance our cost structure, expand
margins and return value to shareholders. The most significant components of our costs are natural gas for feedstock and
distribution costs associated with delivering methanol to customers.

Management’s Discussion and Analysis Annual Report 2009 METHANEX 13
Natural gas is the primary feedstock at our methanol production facilities and is the most significant component of our cost
structure. An essential element of our strategy is to ensure long-term security of natural gas supply. As described above, our
goal is to return to operating all four of our plants in Chile over the next few years with natural gas supply from Chile, and
we are actively pursuing investment opportunities to accelerate natural gas development in areas of southern Chile that are
relatively close to our plants (refer to the Production Summary – Chile section on page 15 for more information).
Our production facilities in Trinidad represent 2.1 million tonnes per year of competitive cost production capacity. These
facilities are underpinned by long-term take-or-pay natural gas purchase agreements where the gas price varies with methanol
prices. During 2009, we completed turnaround activities at both our Atlas and Titan facilities in Trinidad and we expect
increased production from these facilities over the next year.
We have positioned our facilities in New Zealand as flexible production assets. At the end of 2008, we added approximately
0.4 million tonnes of incremental annual capacity by restarting one of our 0.9 million tonne per year facilities at our Motunui
site and idling the smaller-scale 0.5 million tonne per year Waitara Valley facility in New Zealand. We also have additional
potential production capacity that is currently idled in New Zealand (refer to the Production Summary – New Zealand section
on page 17 for more information).
In 2009, we continued to advance our project to construct a 1.3 million tonne per year methanol facility in Egypt (located at
Damietta on the Mediterranean Sea). This project is on budget and we expect this methanol facility to startup in mid-2010.
We are developing the project with partners: we have a 60% interest in the project and hold 100% of the marketing rights for
the production. We believe this methanol facility will further enhance our positioning with its competitive cost structure and
excellent location to supply the European market.
The cost to distribute methanol from production facilities to customers is also a significant component of our operating costs.
These include costs for ocean shipping, in-market storage facilities and in-market distribution. We are focused on identifying
initiatives to reduce these costs, including maximizing the use of our shipping fleet to reduce costs and taking advantage
of prevailing conditions in the shipping market by varying the type and length of term of ocean vessel contracts. We are
continuously investigating opportunities to further improve the efficiency and cost-effectiveness of distributing methanol from
our production facilities to customers. We also look for opportunities to leverage our global asset position by entering into
product exchanges with other methanol producers to reduce distribution costs.
Operational Excellence
We maintain a focus on operational excellence in all aspects of our business. This includes excellence in our manufacturing and
supply chain processes, marketing and sales, human resources, corporate governance practices and financial management.
To differentiate ourselves from our competitors, we strive to be the best operator in all aspects of our business and to be
the preferred supplier to our customers. We believe that reliability of supply is critical to the success of our customers’
businesses and our goal is to deliver methanol reliably and cost-effectively. In part due to our commitment to Responsible
Care, a risk-minimization approach developed by the Chemistry Industry Association of Canada, we believe we have reduced
the likelihood of unplanned shutdowns and lost-time incidents and have achieved an excellent overall environmental record.
Product stewardship is a vital component of our Responsible Care culture and guides our actions through the complete life
cycle of our product. We aim for the highest safety standards to minimize risk to our employees, customers and suppliers
as well as to the environment and the communities in which we do business. We promote the proper use and safe handling
of methanol at all times through a variety of internal and external health, safety and environmental (HSE) initiatives, and
we work with industry colleagues to improve safety standards and regulatory compliance. We readily share our technical
and safety expertise with key stakeholders, including customers, end-users, suppliers, logistics providers and industry
associations in the methanol and methanol applications marketplace through active participation in local and international
industry seminars and conferences, and online education initiatives.
As a natural extension of our Responsible Care ethic, we have a Social Responsibility policy that aligns our corporate
governance, employee engagement and development, community involvement and social investment strategies with our
core values and corporate strategy.
14 METHANEX Annual Report 2009 Management’s Discussion and Analysis
Our strategy of operational excellence includes the financial management of the Company. We operate in a highly
competitive commodity industry. Accordingly, we believe it is important to maintain financial flexibility and we have adopted
a prudent approach to financial management. As a result of the global economic recession, we embarked on a broad
corporate cost savings plan that included reducing operating costs and cancelling or postponing almost all discretionary
capital spending. At December 31, 2009, we had a strong balance sheet with a cash balance of $170 million, no re-financing
requirements until 2012 and a $200 million undrawn credit facility that expires in mid-2012. We believe we are well positioned
to meet our financial commitments and continue investing to grow our business.
HOw wE ANAlyzE OUR BUSINESS
Our operations consist of a single operating segment – the production and sale of methanol. We review our results of
operations by analyzing changes in the components of our adjusted earnings before interest, taxes, depreciation and
amortization (Adjusted EBITDA) (refer to the Supplemental Non-GAAP Measures section on page 43 for a reconciliation to the
most comparable GAAP measure), depreciation and amortization, interest expense, interest and other income, and income
taxes. In addition to the methanol that we produce at our facilities (“Methanex-produced methanol”), we also purchase and
re-sell methanol produced by others (“purchased methanol”) and we sell methanol on a commission basis. We analyze the
results of all methanol sales together. The key drivers of change in our Adjusted EBITDA are average realized price, cash costs
and sales volume.
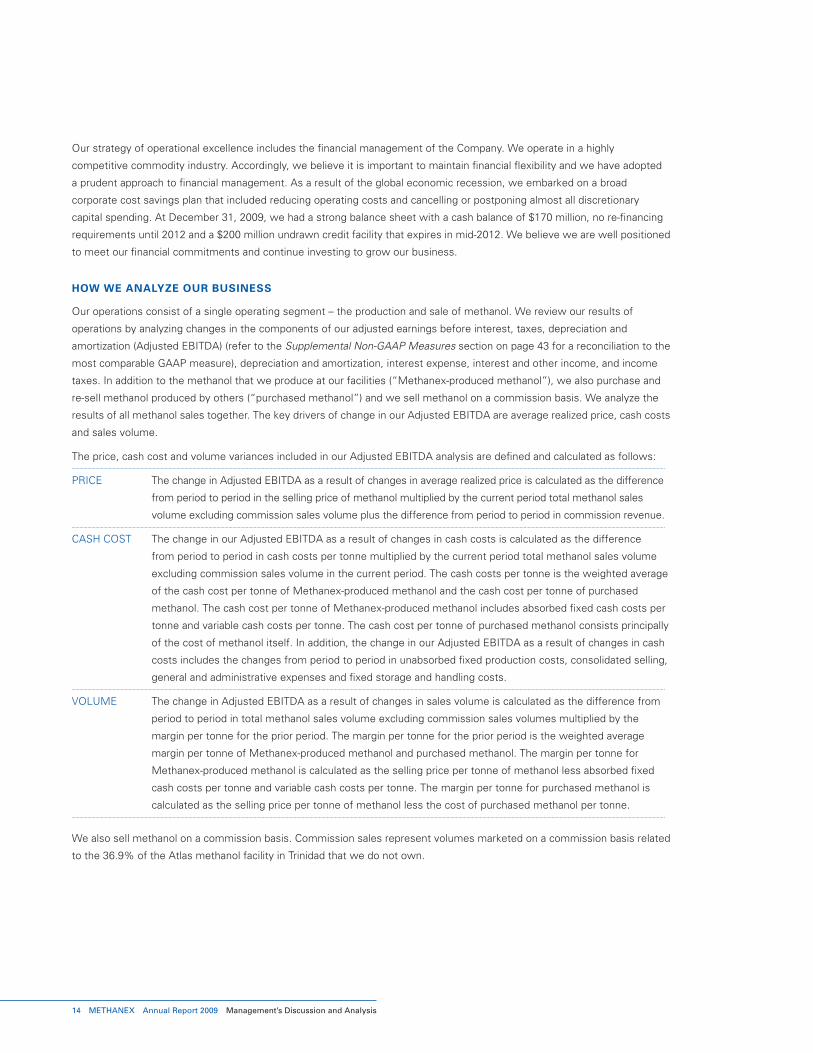
The price, cash cost and volume variances included in our Adjusted EBITDA analysis are defined and calculated as follows:
PRICE The change in Adjusted EBITDA as a result of changes in average realized price is calculated as the difference
from period to period in the selling price of methanol multiplied by the current period total methanol sales
volume excluding commission sales volume plus the difference from period to period in commission revenue.
CASH COST The change in our Adjusted EBITDA as a result of changes in cash costs is calculated as the difference
from period to period in cash costs per tonne multiplied by the current period total methanol sales volume
excluding commission sales volume in the current period. The cash costs per tonne is the weighted average
of the cash cost per tonne of Methanex-produced methanol and the cash cost per tonne of purchased
methanol. The cash cost per tonne of Methanex-produced methanol includes absorbed fixed cash costs per
tonne and variable cash costs per tonne. The cash cost per tonne of purchased methanol consists principally
of the cost of methanol itself. In addition, the change in our Adjusted EBITDA as a result of changes in cash
costs includes the changes from period to period in unabsorbed fixed production costs, consolidated selling,
general and administrative expenses and fixed storage and handling costs.
VOLUME The change in Adjusted EBITDA as a result of changes in sales volume is calculated as the difference from
period to period in total methanol sales volume excluding commission sales volumes multiplied by the
margin per tonne for the prior period. The margin per tonne for the prior period is the weighted average
margin per tonne of Methanex-produced methanol and purchased methanol. The margin per tonne for
Methanex-produced methanol is calculated as the selling price per tonne of methanol less absorbed fixed
cash costs per tonne and variable cash costs per tonne. The margin per tonne for purchased methanol is
calculated as the selling price per tonne of methanol less the cost of purchased methanol per tonne.
We also sell methanol on a commission basis. Commission sales represent volumes marketed on a commission basis related
to the 36.9% of the Atlas methanol facility in Trinidad that we do not own.
Management’s Discussion and Analysis Annual Report 2009 METHANEX 15
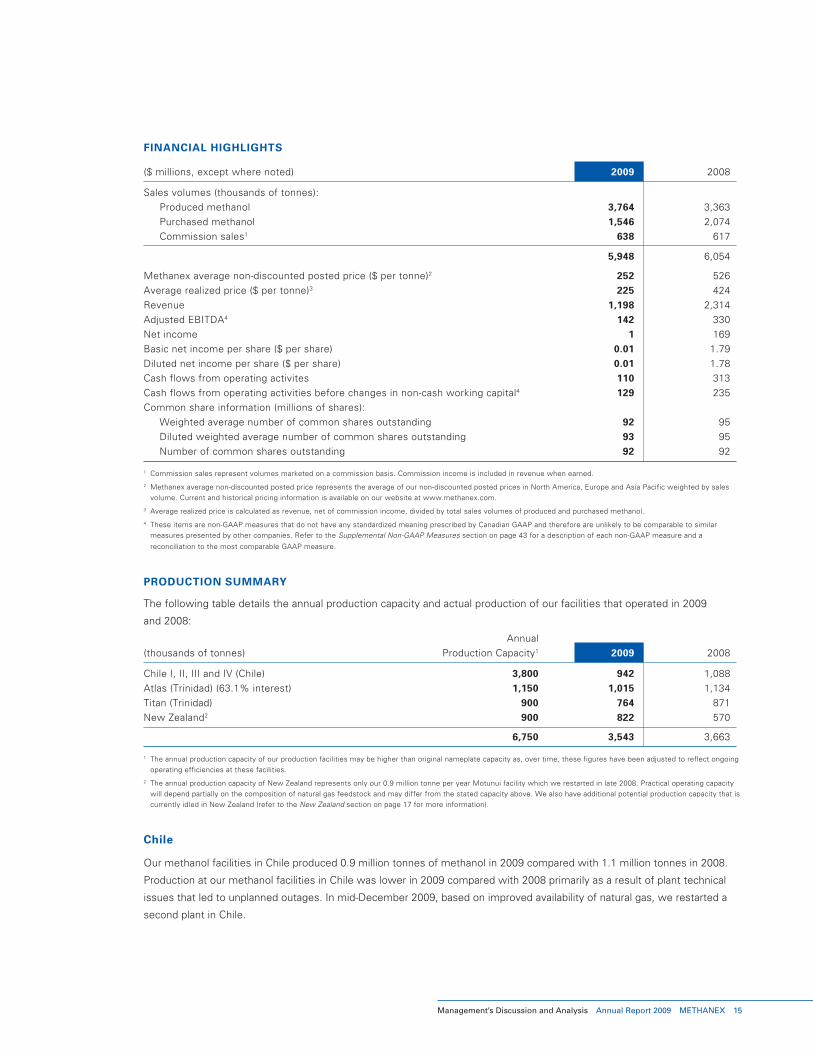
FINANCIAl HIGHlIGHTS
($ millions, except where noted) 2009 2008
Sales volumes (thousands of tonnes):
Produced methanol 3,764 3,363
Purchased methanol 1,546 2,074
Commission sales1 638 617
5,948 6,054
Methanex average non-discounted posted price ($ per tonne)2 252 526
Average realized price ($ per tonne)3 225 424
Revenue 1,198 2,314
Adjusted EBITDA4 142 330
Net income 1 169
Basic net income per share ($ per share) 0.01 1.79
Diluted net income per share ($ per share) 0.01 1.78
Cash flows from operating activites 110 313
Cash flows from operating activities before changes in non-cash working capital4 129 235
Common share information (millions of shares):
Weighted average number of common shares outstanding 92 95
Diluted weighted average number of common shares outstanding 93 95
Number of common shares outstanding 92 92
1 Commission sales represent volumes marketed on a commission basis. Commission income is included in revenue when earned.
2 Methanex average non-discounted posted price represents the average of our non-discounted posted prices in North America, Europe and Asia Pacific weighted by sales
volume. Current and historical pricing information is available on our website at www.methanex.com.
3 Average realized price is calculated as revenue, net of commission income, divided by total sales volumes of produced and purchased methanol.
4 These items are non-GAAP measures that do not have any standardized meaning prescribed by Canadian GAAP and therefore are unlikely to be comparable to similar
measures presented by other companies. Refer to the Supplemental Non-GAAP Measures section on page 43 for a description of each non-GAAP measure and a
reconciliation to the most comparable GAAP measure.
PRODUCTION SUMMARy
The following table details the annual production capacity and actual production of our facilities that operated in 2009
and 2008:
Annual
(thousands of tonnes) Production Capacity1 2009 2008
Chile I, II, III and IV (Chile) 3,800 942 1,088
Atlas (Trinidad) (63.1% interest) 1,150 1,015 1,134
Titan (Trinidad) 900 764 871
New Zealand2 900 822 570
6,750 3,543 3,663
1 The annual production capacity of our production facilities may be higher than original nameplate capacity as, over time, these figures have been adjusted to reflect ongoing
operating efficiencies at these facilities.
2 The annual production capacity of New Zealand represents only our 0.9 million tonne per year Motunui facility which we restarted in late 2008. Practical operating capacity
will depend partially on the composition of natural gas feedstock and may differ from the stated capacity above. We also have additional potential production capacity that is
currently idled in New Zealand (refer to the New Zealand section on page 17 for more information).
Chile
Our methanol facilities in Chile produced 0.9 million tonnes of methanol in 2009 compared with 1.1 million tonnes in 2008.
Production at our methanol facilities in Chile was lower in 2009 compared with 2008 primarily as a result of plant technical
issues that led to unplanned outages. In mid-December 2009, based on improved availability of natural gas, we restarted a
second plant in Chile.
16 METHANEX Annual Report 2009 Management’s Discussion and Analysis
Throughout 2008 and 2009, we operated our methanol facilities in Chile significantly below site capacity. This is primarily due
to curtailments of natural gas supply from Argentina. Since June 2007, our natural gas suppliers from Argentina have curtailed
all gas supply to our plants in Chile in response to various actions by the Argentinean government, including imposing a large
increase to the duty on natural gas exports. Under the current circumstances, we do not expect to receive any further natural
gas supply from Argentina. As a result of the Argentinean natural gas supply issues, all of the methanol production at our
Chile facilities since June 2007 has been produced with natural gas from Chile.
Our goal is to return to operating all four plants in Chile with natural gas from suppliers in Chile. We are pursuing investment
opportunities with the state-owned energy company Empresa Nacional del Petroleo (ENAP), GeoPark Chile Limited (GeoPark)
and others to help accelerate natural gas exploration and development in southern Chile. During 2007 and 2008, we provided
GeoPark with $40 million (of which $10 million had been repaid at December 31, 2009) to support and accelerate GeoPark’s
natural gas exploration and development activities in southern Chile. In October 2009 we signed an agreement to provide
a further $18 million in financing to support GeoPark’s natural gas exploration and development activities in southern Chile
of which $15 million had been provided to GeoPark at December 31, 2009. GeoPark has agreed to supply us with all natural
gas sourced from the Fell block under a ten-year exclusive supply arrangement. In May 2008, we signed an agreement with
ENAP to accelerate natural gas exploration and development in the Dorado Riquelme exploration block in southern Chile and
to supply natural gas to our production facilities in Chile. Final government approvals were received in the third quarter of
2009. Under the arrangement, we fund a 50% participation in the block and as at December 31, 2009, we had contributed
approximately $65 million. Approximately 55% of total production at our Chilean facilities is currently being produced with
natural gas supplied from the Fell and Dorado Riquelme blocks. In mid-December 2009, based on the success of the natural
gas development initiatives, we restarted a second plant in Chile and into 2010 we have been operating two plants, each at
approximately 60% capacity. For 2010, we are estimating production of about 1.2 million tonnes in Chile. This assumes that
we may return to operating only one plant at times during the year, such as during the southern hemisphere winter, when
there is incremental seasonal growth in demand for natural gas for residential purposes.
Other investment activities are also supporting the acceleration of natural gas exploration and development in areas of
southern Chile. In late 2007, the government of Chile completed an international bidding round to assign oil and natural gas
exploration areas that lie close to our production facilities and announced the participation of several international oil and
gas companies. The terms of the agreements from the bidding round require minimum investment commitments. In July
2008, we announced that under the international bidding round, the Otway exploration block in southern Chile was awarded
to a consortium that includes Wintershall Chile Limitada (Wintershall), GeoPark and Methanex. We have recently agreed
to participate in the Tranquilo exploration block, also located in southern Chile. The participation is part of a new ownership
structure that involves both the Tranquilo block and the Otway block. In the new ownership structure, Wintershall, GeoPark,
and Pluspetrol Chile S.A. (Pluspetrol) each have 25% participation and International Finance Corporation, member of the
World Bank Group (IFC) and Methanex each have 12.5% participation. GeoPark will be the operator of both blocks. The
arrangement is subject to approval by the government of Chile. In 2010, approved budgets by the consortium for the two
blocks total $37 million.
We cannot provide assurance that we, ENAP, GeoPark or others will be successful in the exploration and development of
natural gas or that we will obtain any additional natural gas from suppliers in Chile on commercially acceptable terms.
Refer to the Risk Factors and Risk Management – Chile section on page 28 for more information.
Trinidad
Our equity ownership of methanol facilities in Trinidad represent approximately 2.1 million tonnes of competitive-cost annual
capacity. In 2009, these facilities produced a total of 1.8 million tonnes compared with 2.0 million tonnes in 2008. Production was
lower in 2009 compared with 2008 as a result of planned and unplanned downtime. We completed planned major maintenance
activities at both the Atlas and Titan facilities in 2009 and we expect increased production from these facilities in 2010.
Management’s Discussion and Analysis Annual Report 2009 METHANEX 17
New zealand
We have positioned our facilities in New Zealand as flexible production assets. In October 2008, we restarted one of our idled
0.9 million tonne per year Motunui methanol plants and idled our 0.5 million tonne per year Waitara Valley plant. We produced
822,000 tonnes at our facilities in New Zealand in 2009 compared with 570,000 tonnes in 2008. The increase in production in
2009 is due to additional production from the Motunui facility. We currently have 1.4 million tonnes per year of idled capacity
in New Zealand, including a second 0.9 million tonne per year Motunui plant and the Waitara Valley plant. These facilities
provide the potential to increase production in New Zealand depending on methanol supply and demand dynamics and the
availability of economically priced natural gas feedstock.
RESUlTS OF OPERATIONS
($ millions) 2009 2008
Consolidated statements of income:
Revenue $ 1,198 $ 2,314
Cost of sales and operating expenses 1,056 1,951
Inventory writedown – 33
Adjusted EBITDA1 142 330
Depreciation and amortization 118 107
Operating income1 24 223
Interest expense (27) (38)
Interest and other income – 11
Income tax recovery (expense) 4 (27)
Net income $ 1 $ 169
1 These items are non-GAAP measures that do not have any standardized meaning prescribed by Canadian GAAP and therefore are unlikely to be comparable to similar
measures presented by other companies. Refer to the Supplemental Non-GAAP Measures section on page 43 for a description of each non-GAAP measure and a
reconciliation to the most comparable GAAP measure.
Revenue
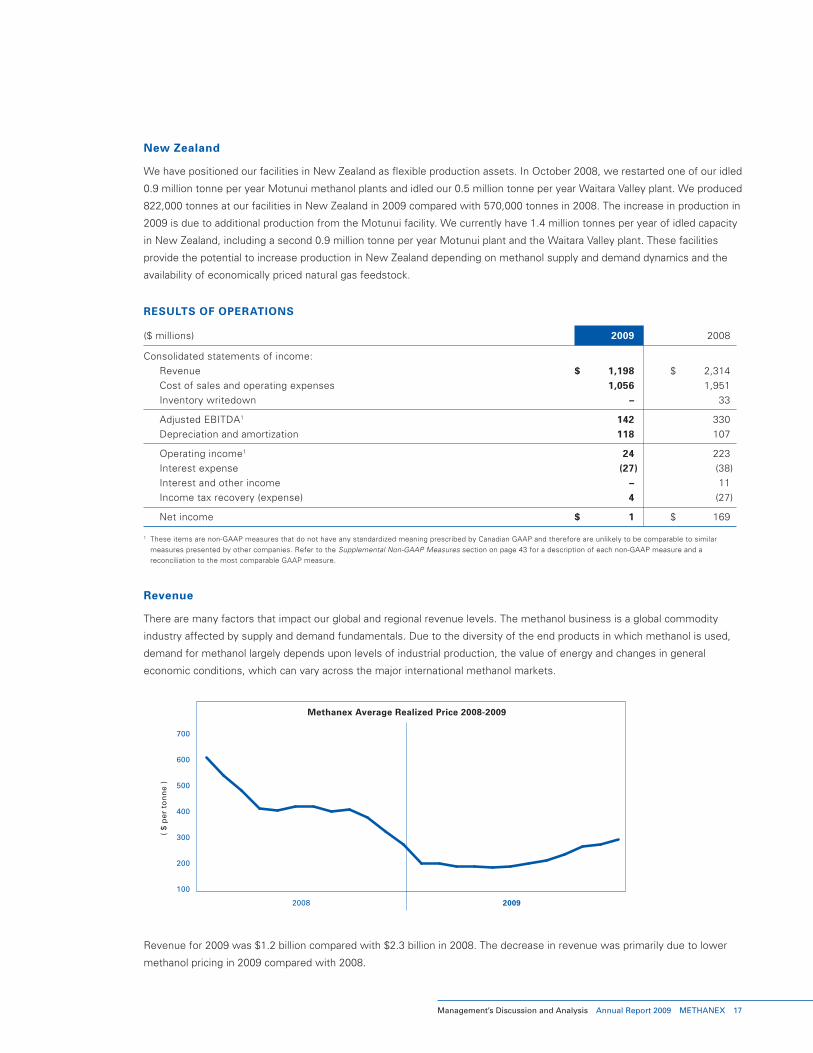
There are many factors that impact our global and regional revenue levels. The methanol business is a global commodity
industry affected by supply and demand fundamentals. Due to the diversity of the end products in which methanol is used,
demand for methanol largely depends upon levels of industrial production, the value of energy and changes in general
economic conditions, which can vary across the major international methanol markets.
Methanex Average Realized Price 2008-2009
20092008
( $
per
to
nn
e )
700
600
500
400
300
200
100
Revenue for 2009 was $1.2 billion compared with $2.3 billion in 2008. The decrease in revenue was primarily due to lower
methanol pricing in 2009 compared with 2008.

18 METHANEX Annual Report 2009 Management’s Discussion and Analysis
We entered 2008 in a tight methanol market condition due to industry supply constraints as a result of significant planned
and unplanned supplier outages in the latter half of 2007. This, combined with high global energy prices and healthy demand,
resulted in high methanol prices during the first quarter of 2008. As inventories recovered, methanol prices moderated into
the second quarter of 2008 and pricing remained relatively stable until the end of the third quarter of the year. The global
economic slowdown in the later part of 2008 led to a sudden and significant reduction in global methanol demand and an
increase in global inventories. This resulted in a decrease in methanol pricing during the fourth quarter of 2008 and into 2009.
During 2009, global methanol demand improved, and as a result of this improvement and some planned and unplanned plant
outages across the industry, methanol prices increased in the latter half of 2009 and into 2010 (refer to the Outlook section
on page 35 for more information). Our average realized price for the year ended December 31, 2009 was $225 per tonne
compared with $424 per tonne in 2008, and this decreased our revenues by $1.1 billion.
The methanol industry is highly competitive and prices are affected by supply and demand fundamentals. We publish non-
discounted reference prices for each major methanol market and offer discounts to customers based on various factors. Our
average non-discounted published reference price for 2009 was $252 per tonne compared with $526 per tonne in 2008. Our
average realized price was approximately 11% and 19% lower than our average non-discounted published reference price for
2009 and 2008, respectively.
We have entered into long-term contracts for a portion of our production volume with certain global customers where prices
are either fixed or linked to our costs plus a margin. Sales under these contracts represented approximately 19% of our total
sales volumes in 2009 compared with 23% of our total sales volumes in 2008. The difference between our average non-
discounted published reference price and our average realized price is expected to narrow during periods of lower pricing.
Distribution of Revenue
The distribution of revenue for 2009 and 2008 is as follows:
($ millions, except where noted) 2009 2008
Canada $ 106 9% $ 237 10%
United States 355 30% 737 32%
Europe 198 17% 494 21%
China 195 16% 135 6%
Korea 136 11% 263 11%
Other Asia 83 7% 209 9%
Latin America 125 10% 239 10%
$ 1,198 100% $ 2,314 100%
Our revenue distribution for 2009 is relatively comparable to 2008 except for changes in China. Revenue in China increased
as a proportion of our total revenue in 2009 compared with 2008 by 10%, primarily as a result of an increase in sales
volumes. China continues to play an important role in the methanol industry as a substantial producer and consumer. A key
part of our global leadership strategy is to increase our presence in China and the Asia Pacific region.
Adjusted EBITDA
We review our results of operations by analyzing changes in the components of Adjusted EBITDA. In addition to the methanol
that we produce at our facilities, we also purchase and re-sell methanol produced by others and we sell methanol on a
commission basis. We analyze the results of all methanol sales together. The key drivers of change in our Adjusted EBITDA
are average realized price, sales volume and cash costs.

Management’s Discussion and Analysis Annual Report 2009 METHANEX 19
2009 Adjusted EBITDA was $142 million compared with $330 million in 2008. The decrease in Adjusted EBITDA of
$188 million resulted from changes in the following:
($ millions) 2009 vs. 2008
Average realized price $ (1,063)Sales volume (11)Total cash costs1 886
Decrease in Adjusted EBITDA $ (188)
1 Includes cash costs related to both Methanex-produced methanol and purchased methanol, as well as consolidated selling, general and administrative expenses and fixed
storage and handling costs (refer to the How We Analyze Our Business section on page 14 for more information).
Average Realized Price
Our average realized price for the year ended December 31, 2009 was $225 per tonne compared with $424 per tonne for 2008,
and this decreased our revenues by $1,063 million (refer to the Revenue section on page 17 for more information).
Sales Volume
Total methanol sales volumes, excluding commission sales volumes, for the year ended December 31, 2009 were 127,000
tonnes lower than in 2008, which resulted in lower Adjusted EBITDA of $11 million.
Total Cash Costs
Cash costs for Methanex-produced methanol and purchased methanol were $886 million lower in 2009 than in 2008. The
primary changes in cash costs were as follows:
($ millions) 2009 vs. 2008
Lower natural gas and purchased methanol costs (impact of lower methanol prices) $ 846Inventory writedown recorded in 2008 33Lower selling, general & administrative and other expenses 7
Decrease in total cash costs $ 886
Lower Natural Gas and Purchased Methanol Costs (Impact of Lower Methanol Prices)
Natural gas is the primary feedstock at our methanol production facilities and is the most significant component of our cost
structure. The natural gas supply contracts for our assets in Chile, Trinidad and New Zealand include base and variable price
components to reduce our commodity price risk exposure. The variable price component of each gas contract is adjusted
by a formula related to methanol prices above a certain level. We believe this pricing relationship enables these facilities to
be competitive throughout the methanol price cycle. The lower average methanol prices in 2009 decreased our natural gas
costs per tonne for Methanex-produced methanol and this lowered cash costs by approximately $275 million compared with
2008. For additional information regarding our natural gas agreements refer to the Summary of Contractual Obligations and
Commercial Commitments section on page 24.
A key element of our corporate strategy is global leadership, and as such we have built a leading market position in each of
the major global markets where methanol is sold. We supplement our production with purchased methanol through methanol
offtake contracts and on the spot market to meet customer needs and support our marketing efforts within the major global
markets. In structuring offtake agreements we look for opportunities that provide synergies with our existing supply chain
and market position. Our strong global supply chain allows us to take advantage of unique opportunities to add value through
logistics cost savings and purchase methanol in the lowest-cost region. The cost of purchased methanol consists principally
of the cost of the methanol itself, which is directly related to the price of methanol at the time of purchase. The lower average
methanol prices in 2009 decreased the cost of purchased methanol per tonne and this lowered cash costs by approximately
$435 million compared with 2008.
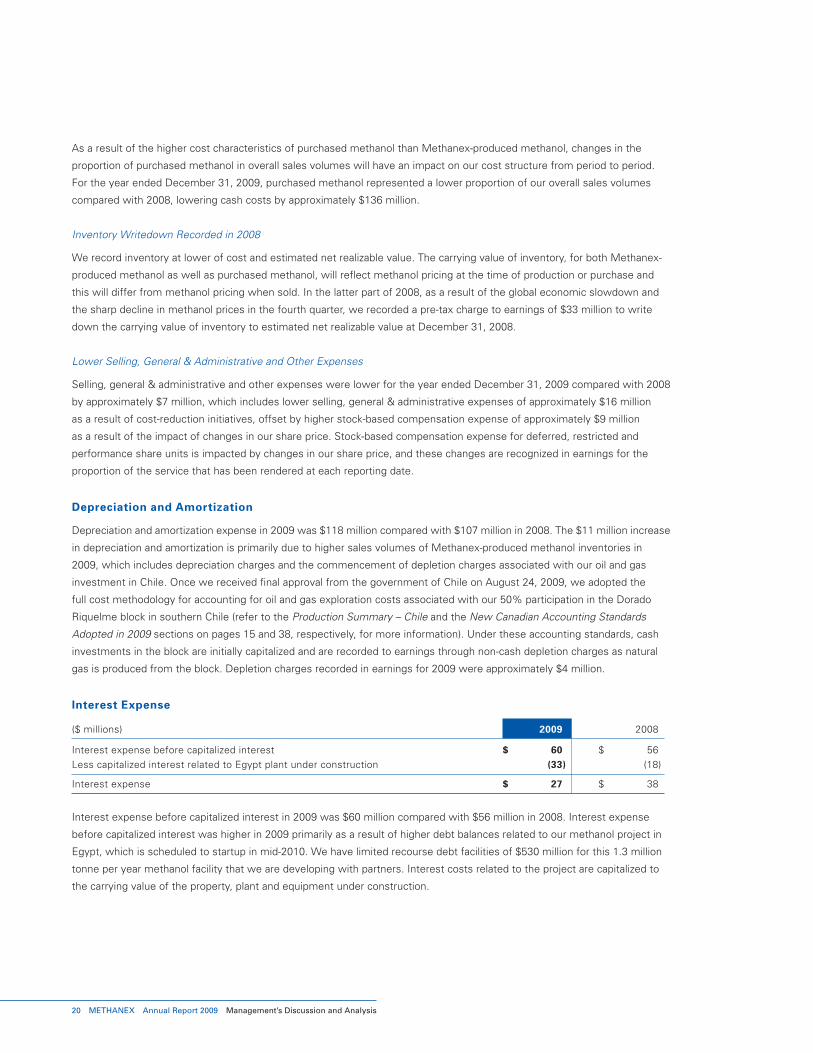
20 METHANEX Annual Report 2009 Management’s Discussion and Analysis
As a result of the higher cost characteristics of purchased methanol than Methanex-produced methanol, changes in the
proportion of purchased methanol in overall sales volumes will have an impact on our cost structure from period to period.
For the year ended December 31, 2009, purchased methanol represented a lower proportion of our overall sales volumes
compared with 2008, lowering cash costs by approximately $136 million.
Inventory Writedown Recorded in 2008
We record inventory at lower of cost and estimated net realizable value. The carrying value of inventory, for both Methanex-
produced methanol as well as purchased methanol, will reflect methanol pricing at the time of production or purchase and
this will differ from methanol pricing when sold. In the latter part of 2008, as a result of the global economic slowdown and
the sharp decline in methanol prices in the fourth quarter, we recorded a pre-tax charge to earnings of $33 million to write
down the carrying value of inventory to estimated net realizable value at December 31, 2008.
Lower Selling, General & Administrative and Other Expenses
Selling, general & administrative and other expenses were lower for the year ended December 31, 2009 compared with 2008
by approximately $7 million, which includes lower selling, general & administrative expenses of approximately $16 million
as a result of cost-reduction initiatives, offset by higher stock-based compensation expense of approximately $9 million
as a result of the impact of changes in our share price. Stock-based compensation expense for deferred, restricted and
performance share units is impacted by changes in our share price, and these changes are recognized in earnings for the
proportion of the service that has been rendered at each reporting date.
Depreciation and Amortization
Depreciation and amortization expense in 2009 was $118 million compared with $107 million in 2008. The $11 million increase
in depreciation and amortization is primarily due to higher sales volumes of Methanex-produced methanol inventories in
2009, which includes depreciation charges and the commencement of depletion charges associated with our oil and gas
investment in Chile. Once we received final approval from the government of Chile on August 24, 2009, we adopted the
full cost methodology for accounting for oil and gas exploration costs associated with our 50% participation in the Dorado
Riquelme block in southern Chile (refer to the Production Summary – Chile and the New Canadian Accounting Standards
Adopted in 2009 sections on pages 15 and 38, respectively, for more information). Under these accounting standards, cash
investments in the block are initially capitalized and are recorded to earnings through non-cash depletion charges as natural
gas is produced from the block. Depletion charges recorded in earnings for 2009 were approximately $4 million.
Interest Expense
($ millions) 2009 2008
Interest expense before capitalized interest $ 60 $ 56
Less capitalized interest related to Egypt plant under construction (33) (18)
Interest expense $ 27 $ 38
Interest expense before capitalized interest in 2009 was $60 million compared with $56 million in 2008. Interest expense
before capitalized interest was higher in 2009 primarily as a result of higher debt balances related to our methanol project in
Egypt, which is scheduled to startup in mid-2010. We have limited recourse debt facilities of $530 million for this 1.3 million
tonne per year methanol facility that we are developing with partners. Interest costs related to the project are capitalized to
the carrying value of the property, plant and equipment under construction.

Management’s Discussion and Analysis Annual Report 2009 METHANEX 21
Interest and Other Income
Interest and other income was nil in 2009 compared with $11 million in 2008. Interest and other income for 2009 compared
with 2008 was lower by $11 million primarily as a result of lower interest income earned on cash balances in 2009, a
$5 million gain on sale of ammonia production assets recorded in 2008 and the impact of changes in foreign exchange rates.
Income Taxes
We recorded an income tax recovery of $4.3 million with a loss before tax of $3.5 million for an effective tax rate of 121%
in 2009. In periods of low income levels, the distribution of income and loss between jurisdictions can result in income tax
rates that may not be indicative of the longer-term corporate tax rate. During 2008, we recorded income tax expense of
$26.7 million with income before tax of $195.5 million for an effective tax rate of 13%. The effective tax rate for 2008 was
impacted by the resolution of a tax position during the fourth quarter of 2008 that resulted in a reduction of $27 million to
future income tax liabilities.
The statutory tax rate in Chile and Trinidad, where we earn a substantial portion of pre-tax earnings, is 35%. Our Atlas
facility in Trinidad has partial relief from corporate income tax until 2014. In Chile, the tax rate consists of a first tier tax that
is payable when income is earned and a second tier tax that is due when earnings are distributed from Chile. The second
category tax is initially recorded as future income tax expense and is subsequently reclassified to current income tax expense
when earnings are distributed. Accordingly, the ratio of current income tax expense to total income tax expense is highly
dependent on the level of cash distributed from Chile.
For additional information regarding income taxes, refer to note 12 of our 2009 consolidated financial statements.
lIQUIDITy AND CAPITAl RESOURCES
($ millions) 2009 2008
Cash flows from operating activities:
Cash flows from operating activities1 $ 128 $ 235
Changes in non-cash working capital (18) 78
110 313
Cash flows from investing activities:
Property, plant and equipment (61) (97)
Egypt plant under construction (262) (382)
Oil and gas assets (23) (42)
GeoPark financing, net (9) (22)
Other, net 3 (2)
Changes in non-cash working capital related to investing activities (28) 27
(380) (518)
Cash flows from financing activities:
Dividend payments (57) (57)
Payments for shares repurchased – (150)
Proceeds on issue of long-term debt 151 204
Equity contribution by non-controlling interest 45 65
Repayment of long-term debt (15) (15)
Other, net (12) (2)
112 45
Decrease in cash and cash equivalents (158) (160)
Cash and cash equivalents, end of year $ 170 $ 328
1 Before changes in non-cash working capital.
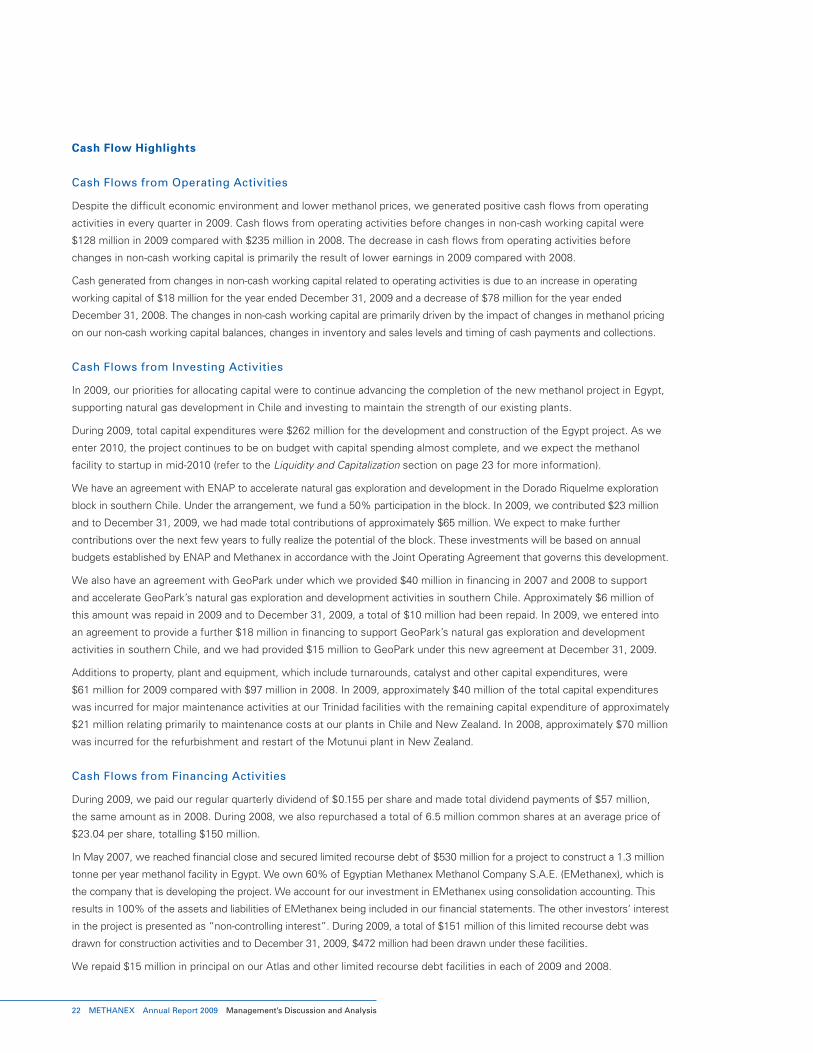
22 METHANEX Annual Report 2009 Management’s Discussion and Analysis
Cash Flow Highlights
Cash Flows from Operating Activities
Despite the difficult economic environment and lower methanol prices, we generated positive cash flows from operating
activities in every quarter in 2009. Cash flows from operating activities before changes in non-cash working capital were
$128 million in 2009 compared with $235 million in 2008. The decrease in cash flows from operating activities before
changes in non-cash working capital is primarily the result of lower earnings in 2009 compared with 2008.
Cash generated from changes in non-cash working capital related to operating activities is due to an increase in operating
working capital of $18 million for the year ended December 31, 2009 and a decrease of $78 million for the year ended
December 31, 2008. The changes in non-cash working capital are primarily driven by the impact of changes in methanol pricing
on our non-cash working capital balances, changes in inventory and sales levels and timing of cash payments and collections.
Cash Flows from Investing Activities
In 2009, our priorities for allocating capital were to continue advancing the completion of the new methanol project in Egypt,
supporting natural gas development in Chile and investing to maintain the strength of our existing plants.
During 2009, total capital expenditures were $262 million for the development and construction of the Egypt project. As we
enter 2010, the project continues to be on budget with capital spending almost complete, and we expect the methanol
facility to startup in mid-2010 (refer to the Liquidity and Capitalization section on page 23 for more information).
We have an agreement with ENAP to accelerate natural gas exploration and development in the Dorado Riquelme exploration
block in southern Chile. Under the arrangement, we fund a 50% participation in the block. In 2009, we contributed $23 million
and to December 31, 2009, we had made total contributions of approximately $65 million. We expect to make further
contributions over the next few years to fully realize the potential of the block. These investments will be based on annual
budgets established by ENAP and Methanex in accordance with the Joint Operating Agreement that governs this development.
We also have an agreement with GeoPark under which we provided $40 million in financing in 2007 and 2008 to support
and accelerate GeoPark’s natural gas exploration and development activities in southern Chile. Approximately $6 million of
this amount was repaid in 2009 and to December 31, 2009, a total of $10 million had been repaid. In 2009, we entered into
an agreement to provide a further $18 million in financing to support GeoPark’s natural gas exploration and development
activities in southern Chile, and we had provided $15 million to GeoPark under this new agreement at December 31, 2009.
Additions to property, plant and equipment, which include turnarounds, catalyst and other capital expenditures, were
$61 million for 2009 compared with $97 million in 2008. In 2009, approximately $40 million of the total capital expenditures
was incurred for major maintenance activities at our Trinidad facilities with the remaining capital expenditure of approximately
$21 million relating primarily to maintenance costs at our plants in Chile and New Zealand. In 2008, approximately $70 million
was incurred for the refurbishment and restart of the Motunui plant in New Zealand.
Cash Flows from Financing Activities
During 2009, we paid our regular quarterly dividend of $0.155 per share and made total dividend payments of $57 million,
the same amount as in 2008. During 2008, we also repurchased a total of 6.5 million common shares at an average price of
$23.04 per share, totalling $150 million.
In May 2007, we reached financial close and secured limited recourse debt of $530 million for a project to construct a 1.3 million
tonne per year methanol facility in Egypt. We own 60% of Egyptian Methanex Methanol Company S.A.E. (EMethanex), which is
the company that is developing the project. We account for our investment in EMethanex using consolidation accounting. This
results in 100% of the assets and liabilities of EMethanex being included in our financial statements. The other investors’ interest
in the project is presented as “non-controlling interest”. During 2009, a total of $151 million of this limited recourse debt was
drawn for construction activities and to December 31, 2009, $472 million had been drawn under these facilities.
We repaid $15 million in principal on our Atlas and other limited recourse debt facilities in each of 2009 and 2008.

Management’s Discussion and Analysis Annual Report 2009 METHANEX 23
liquidity and Capitalization
We maintain conservative financial policies and focus on maintaining our financial strength and flexibility through prudent
financial management. Our objectives in managing liquidity and capital are to provide financial capacity and flexibility to meet
our strategic objectives, to provide an adequate return to shareholders commensurate with the level of risk and to return
excess cash through a combination of dividends and share repurchases.
The following table provides information on our liquidity and capitalization position as at December 31, 2009 and December
31, 2008, respectively:
($ millions, except where noted) 2009 2008
Liquidity:
Cash and cash equivalents $ 170 $ 328
Undrawn Egypt limited recourse debt facilities 58 209
Undrawn credit facilities 200 250
Total liquidity $ 428 $ 788
Capitalization:
Unsecured notes $ 347 $ 347
Limited recourse debt facilities, including current portion 567 435
Total debt 914 782
Non-controlling interest 133 89
Shareholders’ equity 1,236 1,288
Total capitalization $ 2,283 $ 2,159
Total debt to capitalization1 40% 36%
Net debt to capitalization2 35% 25%
1 Defined as total debt divided by total capitalization.
2 Defined as total debt less cash and cash equivalents divided by total capitalization less cash and cash equivalents.
We manage our liquidity and capital structure and make adjustments to it in light of changes to economic conditions, the
underlying risks inherent in our operations and the capital requirements to maintain and grow our business. The strategies we
employ include the issue or repayment of general corporate debt, the issue of project debt, the payment of dividends and the
repurchase of shares.
We are not subject to any statutory capital requirements and have no commitments to sell or otherwise issue common
shares except pursuant to outstanding employee stock options.
We operate in a highly competitive commodity industry and believe that it is appropriate to maintain a conservative balance
sheet and retain financial flexibility. This is particularly important in the current uncertain economic environment. We have
excellent financial capacity and flexibility. Our cash balance at December 31, 2009 was $170 million and we have $58 million of
undrawn capacity on the $530 million Egypt limited recourse debt facilities. Additionally, we have an undrawn credit facility in
the amount of $200 million provided by highly rated financial institutions that expires in mid-2012. We invest cash only in highly
rated instruments that have maturities of three months or less to ensure preservation of capital and appropriate liquidity.
Planned capital maintenance expenditures directed towards major maintenance, turnarounds and catalyst changes for current
operations are estimated to be approximately $75 million for the period to the end of 2011.
We estimate total remaining capital expenditures of approximately $93 million to complete the construction of the Egypt
methanol facility, including capitalized interest related to the project financing and excluding working capital. This excludes
unpaid capital expenditures recorded in accounts payable at December 31, 2009 of approximately $28 million. These
expenditures will be funded from cash generated from operations and cash on hand, cash contributed by the non-controlling
shareholders and proceeds from the limited recourse debt facilities. At December 31, 2009, our 60% share of remaining cash
equity contributions, including capitalized interest related to the project financing and excluding working capital, is estimated
to be approximately $20 million.
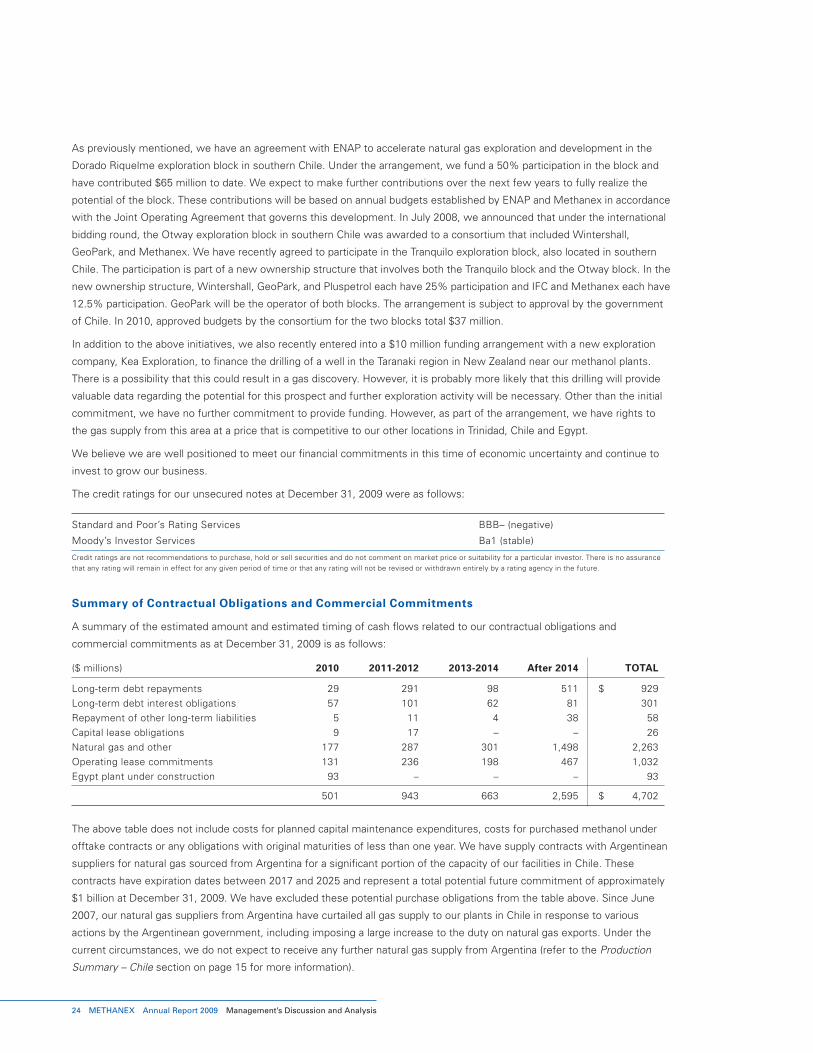
24 METHANEX Annual Report 2009 Management’s Discussion and Analysis
As previously mentioned, we have an agreement with ENAP to accelerate natural gas exploration and development in the
Dorado Riquelme exploration block in southern Chile. Under the arrangement, we fund a 50% participation in the block and
have contributed $65 million to date. We expect to make further contributions over the next few years to fully realize the
potential of the block. These contributions will be based on annual budgets established by ENAP and Methanex in accordance
with the Joint Operating Agreement that governs this development. In July 2008, we announced that under the international
bidding round, the Otway exploration block in southern Chile was awarded to a consortium that included Wintershall,
GeoPark, and Methanex. We have recently agreed to participate in the Tranquilo exploration block, also located in southern
Chile. The participation is part of a new ownership structure that involves both the Tranquilo block and the Otway block. In the
new ownership structure, Wintershall, GeoPark, and Pluspetrol each have 25% participation and IFC and Methanex each have
12.5% participation. GeoPark will be the operator of both blocks. The arrangement is subject to approval by the government
of Chile. In 2010, approved budgets by the consortium for the two blocks total $37 million.
In addition to the above initiatives, we also recently entered into a $10 million funding arrangement with a new exploration
company, Kea Exploration, to finance the drilling of a well in the Taranaki region in New Zealand near our methanol plants.
There is a possibility that this could result in a gas discovery. However, it is probably more likely that this drilling will provide
valuable data regarding the potential for this prospect and further exploration activity will be necessary. Other than the initial
commitment, we have no further commitment to provide funding. However, as part of the arrangement, we have rights to
the gas supply from this area at a price that is competitive to our other locations in Trinidad, Chile and Egypt.
We believe we are well positioned to meet our financial commitments in this time of economic uncertainty and continue to
invest to grow our business.
The credit ratings for our unsecured notes at December 31, 2009 were as follows:
Standard and Poor’s Rating Services BBB– (negative)
Moody’s Investor Services Ba1 (stable)
Credit ratings are not recommendations to purchase, hold or sell securities and do not comment on market price or suitability for a particular investor. There is no assurance
that any rating will remain in effect for any given period of time or that any rating will not be revised or withdrawn entirely by a rating agency in the future.
Summary of Contractual Obligations and Commercial Commitments
A summary of the estimated amount and estimated timing of cash flows related to our contractual obligations and
commercial commitments as at December 31, 2009 is as follows:
($ millions) 2010 2011-2012 2013-2014 After 2014 TOTAl
Long-term debt repayments 29 291 98 511 $ 929
Long-term debt interest obligations 57 101 62 81 301
Repayment of other long-term liabilities 5 11 4 38 58
Capital lease obligations 9 17 – – 26
Natural gas and other 177 287 301 1,498 2,263
Operating lease commitments 131 236 198 467 1,032
Egypt plant under construction 93 – – – 93
501 943 663 2,595 $ 4,702
The above table does not include costs for planned capital maintenance expenditures, costs for purchased methanol under
offtake contracts or any obligations with original maturities of less than one year. We have supply contracts with Argentinean
suppliers for natural gas sourced from Argentina for a significant portion of the capacity of our facilities in Chile. These
contracts have expiration dates between 2017 and 2025 and represent a total potential future commitment of approximately
$1 billion at December 31, 2009. We have excluded these potential purchase obligations from the table above. Since June
2007, our natural gas suppliers from Argentina have curtailed all gas supply to our plants in Chile in response to various
actions by the Argentinean government, including imposing a large increase to the duty on natural gas exports. Under the
current circumstances, we do not expect to receive any further natural gas supply from Argentina (refer to the Production
Summary – Chile section on page 15 for more information).
Management’s Discussion and Analysis Annual Report 2009 METHANEX 25
Long-Term Debt Repayments and Interest Obligations
We have $200 million of unsecured notes that mature in 2012 and $150 million of unsecured notes that mature in 2015.
The remaining debt repayments represent the total expected principal repayments relating to the Egypt project debt drawn
as of December 31, 2009 and other limited recourse debt facilities, as well as our proportionate share of total expected
principal repayments related to the Atlas limited recourse debt facilities. Interest obligations related to variable interest rate
long-term debt were estimated using current interest rates in effect at December 31, 2009. For additional information, refer
to note 7 of our 2009 consolidated financial statements.
Repayments of Other Long-Term Liabilities
Repayments of other long-term liabilities represent contractual payment dates or, if the timing is not known, we have
estimated the timing of repayment based on management’s expectations.
Capital Lease Obligations
We have entered into a capital lease agreement for an ocean-going vessel. The above table includes the future minimum lease
payments related to this capital lease. For additional information, refer to note 8(b) of our 2009 consolidated financial statements.
Natural Gas and Other
We have commitments under take-or-pay contracts to purchase annual quantities of natural gas and to pay for transportation
capacity related to this natural gas. We also have take-or-pay contracts to purchase oxygen and other feedstock requirements.
Take-or-pay means that we are obliged to pay for the supplies regardless of whether we take delivery. Such commitments are
typical in the methanol industry. These contracts generally provide a quantity that is subject to take-or-pay terms that is lower
than the maximum quantity that we are entitled to purchase. The amounts disclosed in the table represent only the take-or-
pay quantity.
Most of the natural gas supply contracts for our facilities in Chile, Trinidad and New Zealand and the natural gas supply
contract for the methanol project under construction in Egypt are take-or-pay contracts denominated in United States dollars
and include base and variable price components to reduce our commodity price risk exposure. The variable price component
of each natural gas contract is adjusted by a formula related to methanol prices above a certain level. We believe this pricing
relationship enables these facilities to be competitive at all points in the methanol price cycle and provides gas suppliers with
attractive returns. The amounts disclosed in the table for these contracts represent only the base price component.
The natural gas commitments for our Chile facilities included in the above table relate to our natural gas contracts with ENAP,
the Chilean state-owned energy company. These contracts represent approximately 20% of the natural gas requirements for
our Chile facilities operating at capacity. These contracts have a base component and variable price component determined
with reference to 12-month trailing average published industry methanol prices and have expiration dates that range from
2017 to 2025. Under these contracts with ENAP, we have the right to receive quantities of “make-up gas” if ENAP fails to
deliver quantities of gas that it is obligated to deliver to us. Over the past few years, ENAP has delivered less than the full
amount of natural gas that it was required to deliver under these contracts.
During 2008, we signed an agreement with ENAP to accelerate natural gas exploration and development in the Dorado
Riquelme exploration block in southern Chile and to supply natural gas to our Chile production facilities. Final government
approvals were received in the third quarter of 2009. Under the arrangement, we fund a 50% participation in the block and we
have agreed to take all natural gas produced from the Dorado Riquelme block. We cannot determine the amount of natural gas
that will be purchased under this arrangement, and accordingly, no amounts have been included in the above table.
During 2007, we reached an arrangement with GeoPark to purchase all natural gas produced by GeoPark from the Fell block
in southern Chile for a 10-year period. The pricing under this arrangement has a base component and a variable component
determined with reference to a 3-month trailing average of industry methanol prices. We cannot determine the amount of
natural gas that will be purchased under this arrangement in the future, and accordingly, no amounts have been included in
the above table.
26 METHANEX Annual Report 2009 Management’s Discussion and Analysis
In Trinidad, we also have take-or-pay supply contracts for natural gas, oxygen and other feedstock requirements and these are
included in the above table. The variable component of our natural gas contracts in Trinidad is determined with reference to
average published industry methanol prices each quarter and the base prices increase over time. The natural gas and oxygen
supply contracts for Titan and Atlas expire in 2014 and 2024, respectively.
In New Zealand, we have take-or-pay supply contracts that have a variable pricing component and these are included in the
above table. These contracts are with a number of suppliers, which, together with some spot purchases of natural gas, will
enable us to continue operating our 900,000 tonne per year Motunui plant until near the end of 2010.
Our long-term take-or-pay natural gas supply contract for the methanol project under construction in Egypt is included in the
above table. We expect this facility to startup in mid-2010. The pricing for natural gas under this contract includes base and
variable price components. The variable component of the natural gas contract in Egypt begins in mid-2012 and is determined
with reference to our average realized price of methanol each quarter. This contract expires 25 years from the start of the
commercial operation of the facility.
At December 31, 2009, we have annual methanol purchase commitments under offtake contracts for approximately
450,000 tonnes for 2010, approximately 380,000 tonnes for each of 2011 and 2012, and approximately 200,000 tonnes for
2013. The pricing under these contracts is referenced to industry pricing at the time of purchase, and accordingly, no amounts
have been included in the above table.
Operating Lease Commitments
The majority of these commitments relate to time charter vessel agreements with terms of up to 15 years. Time charter
vessels typically meet most of our ocean shipping requirements.
Egypt Plant under Construction
Project under construction includes the estimated total remaining capital expenditures to complete the construction of
the 1.3 million tonne methanol facility in Egypt, including capitalized interest related to the project financing and excluding
working capital.
Off-Balance Sheet Arrangements
At December 31, 2009, we did not have any off-balance sheet arrangements, as defined by applicable securities regulators in
Canada and the United States that have, or are reasonably likely to have, a current or future material effect on our results of
operations or financial condition.
Financial Instruments
A financial instrument is any contract that gives rise to a financial asset of one party and a financial liability or equity instrument
of another party. Financial instruments are either measured at amortized cost or fair value. Held-to-maturity investments, loans
and receivables and other financial liabilities are measured at amortized cost. Held for trading financial assets and liabilities and
available-for-sale financial assets are measured on the balance sheet at fair value. From time to time we enter into derivative
financial instruments to limit our exposure to foreign exchange volatility and to variable interest rate volatility and to contribute
towards achieving cost structure and revenue targets. Until settled, the fair value of derivative financial instruments will fluctuate
based on changes in foreign exchange rates and variable interest rates. Derivative financial instruments are classified as held
for trading and are recorded on the balance sheet at fair value unless exempted. Changes in fair value of derivative financial
instruments are recorded in earnings unless the instruments are designated as cash flow hedges.
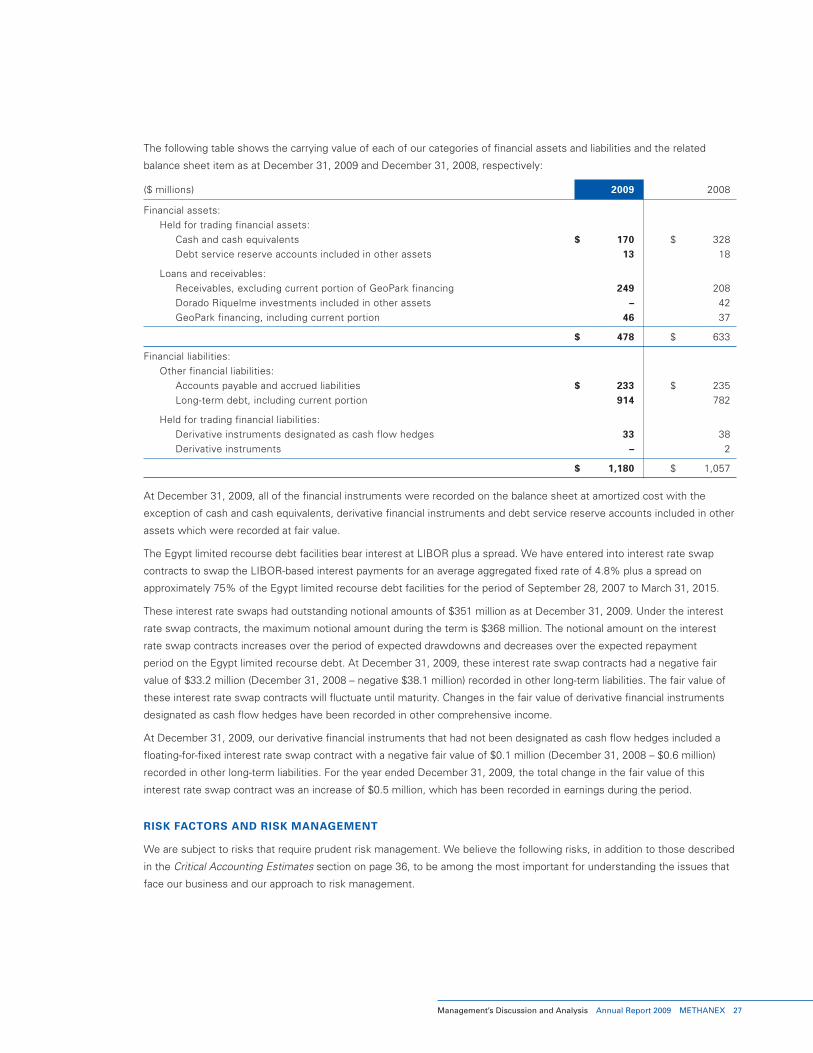
Management’s Discussion and Analysis Annual Report 2009 METHANEX 27
The following table shows the carrying value of each of our categories of financial assets and liabilities and the related
balance sheet item as at December 31, 2009 and December 31, 2008, respectively:
($ millions) 2009 2008
Financial assets:
Held for trading financial assets:
Cash and cash equivalents $ 170 $ 328
Debt service reserve accounts included in other assets 13 18
Loans and receivables:
Receivables, excluding current portion of GeoPark financing 249 208
Dorado Riquelme investments included in other assets – 42
GeoPark financing, including current portion 46 37
$ 478 $ 633
Financial liabilities:
Other financial liabilities:
Accounts payable and accrued liabilities $ 233 $ 235
Long-term debt, including current portion 914 782
Held for trading financial liabilities:
Derivative instruments designated as cash flow hedges 33 38
Derivative instruments – 2
$ 1,180 $ 1,057
At December 31, 2009, all of the financial instruments were recorded on the balance sheet at amortized cost with the
exception of cash and cash equivalents, derivative financial instruments and debt service reserve accounts included in other
assets which were recorded at fair value.
The Egypt limited recourse debt facilities bear interest at LIBOR plus a spread. We have entered into interest rate swap
contracts to swap the LIBOR-based interest payments for an average aggregated fixed rate of 4.8% plus a spread on
approximately 75% of the Egypt limited recourse debt facilities for the period of September 28, 2007 to March 31, 2015.
These interest rate swaps had outstanding notional amounts of $351 million as at December 31, 2009. Under the interest
rate swap contracts, the maximum notional amount during the term is $368 million. The notional amount on the interest
rate swap contracts increases over the period of expected drawdowns and decreases over the expected repayment
period on the Egypt limited recourse debt. At December 31, 2009, these interest rate swap contracts had a negative fair
value of $33.2 million (December 31, 2008 – negative $38.1 million) recorded in other long-term liabilities. The fair value of
these interest rate swap contracts will fluctuate until maturity. Changes in the fair value of derivative financial instruments
designated as cash flow hedges have been recorded in other comprehensive income.
At December 31, 2009, our derivative financial instruments that had not been designated as cash flow hedges included a
floating-for-fixed interest rate swap contract with a negative fair value of $0.1 million (December 31, 2008 – $0.6 million)
recorded in other long-term liabilities. For the year ended December 31, 2009, the total change in the fair value of this
interest rate swap contract was an increase of $0.5 million, which has been recorded in earnings during the period.
RISK FACTORS AND RISK MANAGEMENT
We are subject to risks that require prudent risk management. We believe the following risks, in addition to those described
in the Critical Accounting Estimates section on page 36, to be among the most important for understanding the issues that
face our business and our approach to risk management.
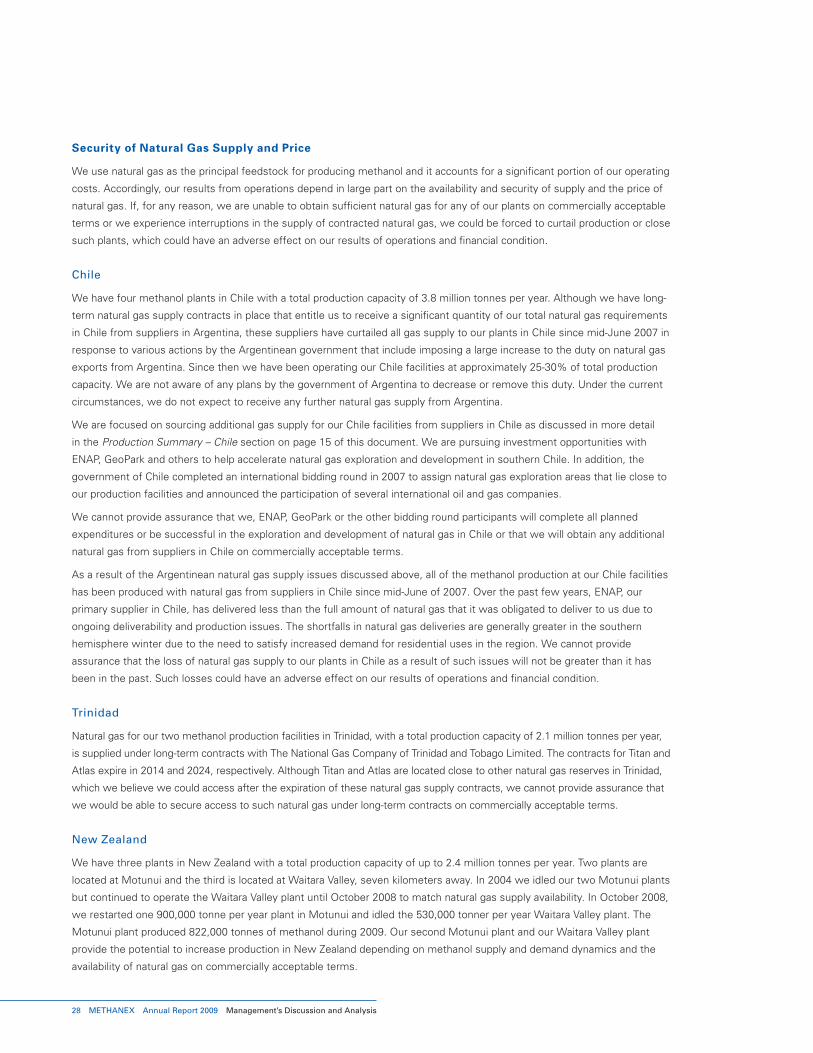
28 METHANEX Annual Report 2009 Management’s Discussion and Analysis
Security of Natural Gas Supply and Price
We use natural gas as the principal feedstock for producing methanol and it accounts for a significant portion of our operating
costs. Accordingly, our results from operations depend in large part on the availability and security of supply and the price of
natural gas. If, for any reason, we are unable to obtain sufficient natural gas for any of our plants on commercially acceptable
terms or we experience interruptions in the supply of contracted natural gas, we could be forced to curtail production or close
such plants, which could have an adverse effect on our results of operations and financial condition.
Chile
We have four methanol plants in Chile with a total production capacity of 3.8 million tonnes per year. Although we have long-
term natural gas supply contracts in place that entitle us to receive a significant quantity of our total natural gas requirements
in Chile from suppliers in Argentina, these suppliers have curtailed all gas supply to our plants in Chile since mid-June 2007 in
response to various actions by the Argentinean government that include imposing a large increase to the duty on natural gas
exports from Argentina. Since then we have been operating our Chile facilities at approximately 25-30% of total production
capacity. We are not aware of any plans by the government of Argentina to decrease or remove this duty. Under the current
circumstances, we do not expect to receive any further natural gas supply from Argentina.
We are focused on sourcing additional gas supply for our Chile facilities from suppliers in Chile as discussed in more detail
in the Production Summary – Chile section on page 15 of this document. We are pursuing investment opportunities with
ENAP, GeoPark and others to help accelerate natural gas exploration and development in southern Chile. In addition, the
government of Chile completed an international bidding round in 2007 to assign natural gas exploration areas that lie close to
our production facilities and announced the participation of several international oil and gas companies.
We cannot provide assurance that we, ENAP, GeoPark or the other bidding round participants will complete all planned
expenditures or be successful in the exploration and development of natural gas in Chile or that we will obtain any additional
natural gas from suppliers in Chile on commercially acceptable terms.
As a result of the Argentinean natural gas supply issues discussed above, all of the methanol production at our Chile facilities
has been produced with natural gas from suppliers in Chile since mid-June of 2007. Over the past few years, ENAP, our
primary supplier in Chile, has delivered less than the full amount of natural gas that it was obligated to deliver to us due to
ongoing deliverability and production issues. The shortfalls in natural gas deliveries are generally greater in the southern
hemisphere winter due to the need to satisfy increased demand for residential uses in the region. We cannot provide
assurance that the loss of natural gas supply to our plants in Chile as a result of such issues will not be greater than it has
been in the past. Such losses could have an adverse effect on our results of operations and financial condition.
Trinidad
Natural gas for our two methanol production facilities in Trinidad, with a total production capacity of 2.1 million tonnes per year,
is supplied under long-term contracts with The National Gas Company of Trinidad and Tobago Limited. The contracts for Titan and
Atlas expire in 2014 and 2024, respectively. Although Titan and Atlas are located close to other natural gas reserves in Trinidad,
which we believe we could access after the expiration of these natural gas supply contracts, we cannot provide assurance that
we would be able to secure access to such natural gas under long-term contracts on commercially acceptable terms.
New Zealand
We have three plants in New Zealand with a total production capacity of up to 2.4 million tonnes per year. Two plants are
located at Motunui and the third is located at Waitara Valley, seven kilometers away. In 2004 we idled our two Motunui plants
but continued to operate the Waitara Valley plant until October 2008 to match natural gas supply availability. In October 2008,
we restarted one 900,000 tonne per year plant in Motunui and idled the 530,000 tonner per year Waitara Valley plant. The
Motunui plant produced 822,000 tonnes of methanol during 2009. Our second Motunui plant and our Waitara Valley plant
provide the potential to increase production in New Zealand depending on methanol supply and demand dynamics and the
availability of natural gas on commercially acceptable terms.

Management’s Discussion and Analysis Annual Report 2009 METHANEX 29
During the past few years, increased natural gas exploration and development activity in New Zealand has resulted in
improved gas availability and deliverability. We have a range of gas suppliers with existing contracts expiring at various times
during 2010. We currently have sufficient quantities of natural gas to operate the one Motunui plant until near the end of
2010. Our main priority is to secure more gas to extend the operation of this plant, and we are in the process of finalizing
contracts with a number of suppliers. Based on the improved outlook for natural gas in New Zealand, we are optimistic that
we can secure additional gas supply in New Zealand and potentially restart more capacity there in the future.
The future operation of each of our New Zealand facilities depends on methanol industry supply and demand and the
availability of natural gas on commercially acceptable terms. There can be no assurance that the ongoing exploration and
development activity in New Zealand will be successful or that we will be able to secure additional gas for our facilities on
commercially acceptable terms.
Egypt
Natural gas for the 1.3 million tonne per year production facility that we are currently constructing in Egypt is supplied under a
single long-term contract with the government-owned Egyptian Natural Gas Holding Company. The contract expires 25 years
after the start of the commercial operation of the facility. We expect this facility to startup in mid-2010. Gas will be supplied to this
facility from the same gas delivery grid infrastructure that supplies other industrial users in Egypt, as well as the general Egyptian
population. Egypt manages its gas reserves to ensure that demand growth related to new industrial projects is compatible
with Egyptian residential demand growth. Demand growth could be significant given Egypt’s demographics. As well, Egypt
has a stated goal of increasing economic development. As a result, we cannot provide assurance that we will not experience
curtailments of natural gas supply which could have an adverse impact on our results of operations and financial condition.
Canada
We have a 470,000 tonne plant at Medicine Hat, Alberta that was idled in 2001 due to high natural gas feedstock prices
in North America. The plant remains in good mechanical condition and is capable of being restarted. During the past few
years there have been natural gas supply improvements in North America from shale and conventional sources that could
provide the opportunity to secure sufficient natural gas on commercially acceptable terms to enable a restart of our facility
in Medicine Hat. However, we are in the very early stages of discussions with potential gas suppliers and it is too soon to
determine whether or not it will be possible to restart this facility in the future.
The future operation of our Medicine Hat facility depends on industry supply and demand and our ability to secure sufficient
natural gas on commercially acceptable terms. There can be no assurance that we will be able to secure sufficient natural gas
for our Medicine Hat facilities on commercially acceptable terms.
Methanol Price Cyclicality and Methanol Supply and Demand
The methanol business is a highly competitive commodity industry and prices are affected by supply and demand
fundamentals and global energy prices. Methanol prices have historically been, and are expected to continue to be,
characterized by significant cyclicality. New methanol plants are expected to be built and this will increase overall production
capacity. Additional methanol supply can also become available in the future by restarting idle methanol plants, carrying
out major expansions of existing plants or debottlenecking existing plants to increase their production capacity. Historically,
higher-cost plants have been shut down or idled when methanol prices are low but there can be no assurance that this
practice will occur in the future. Demand for methanol largely depends upon levels of global industrial production, changes in
general economic conditions and energy prices.
We are not able to predict future methanol supply and demand balances, market conditions, global economic activity,
methanol prices or energy prices, all of which are affected by numerous factors beyond our control. Since methanol is the
only product we produce and market, a decline in the price of methanol would have an adverse effect on our results of
operations and financial condition.
30 METHANEX Annual Report 2009 Management’s Discussion and Analysis
Global Financial Crisis and Related Economic Slowdown
The recent global financial crisis and related economic slowdown added significant risks and uncertainties for our business,
including risks and uncertainties related to the impact on global supply and demand for methanol, its impact on methanol
prices, changes in capital markets and corresponding effects on our investments, our ability to access existing or future credit
and increased risk of defaults by customers, suppliers and insurers. While the global economy has improved and demand for
methanol and methanol prices have recovered somewhat, there can be no assurance that any such recovery will be sustained.
liquidity Risk
We have an undrawn $200 million credit facility that expires in mid-2012. This facility is provided by highly rated financial
institutions and our ability to access the facility is subject to certain financial covenants including an EBITDA to interest
coverage ratio and a debt to capitalization ratio, as defined. We cannot provide assurance that all of these financial institutions
will have the financial ability to honour a draw under the credit facility or that we will be able to meet these financial
covenants in the future.
In addition, as at December 31, 2009, we had $58 million of undrawn capacity on the $530 million limited recourse debt
facilities for the new Egypt facility that we are constructing with partners. We cannot provide assurance that the lenders
under this facility will have the financial ability to honour future draws.
If we are unable to draw on the existing facilities described above or if we are unable to access new financing in the future,
this could have a material adverse effect on our results of operations, our ability to pursue and complete strategic initiatives
or on our financial condition.
Customer and Supplier Risk
In recessionary periods, such as the recent global recession, the risk of trade credit losses increases. Most of our customers
are large global or regional petrochemical manufacturers or distributors and a number are highly leveraged. Two of our
customers filed for bankruptcy protection in 2008 and 2009. While the outstanding receivables from these customers
were not material at the time of these filings, it is possible, particularly if global economic activity slows again, that other
customers may seek protection from creditors in the future and our exposure to such customers’ receivables could be
greater. Although we monitor our customers’ financial status closely, some customers may not have the financial ability
to pay for methanol in the future and this could have an adverse effect on our results of operations and financial condition.
Although credit losses have not been historically significant, this risk still exists, particularly if global economic activity slows
significantly again.
The recent recession also increased the risk that some of our suppliers would not be able to meet future supply
commitments, which could have an adverse effect on our results of operations and financial condition.
Methanol Demand
Demand for Methanol – General
Methanol is a global commodity and customers base their purchasing decisions principally on the delivered price of methanol
and reliability of supply. Some of our competitors are not dependent for revenues on a single product and some have greater
financial resources than we do. Our competitors also include state-owned enterprises. These competitors may be better able
than we are to withstand price competition and volatile market conditions.
Management’s Discussion and Analysis Annual Report 2009 METHANEX 31
Changes in environmental, health and safety laws, regulations or requirements could impact methanol demand. The United
States Environmental Protection Agency (EPA) is currently evaluating the carcinogenicity classification for methanol as part of
a standard review of chemicals under its Integrated Risk Information System (IRIS). Methanol is currently unclassified under
IRIS. A draft assessment for methanol that was released by the EPA in January 2010 classified methanol as “Likely to Be
Carcinogenic to Humans”. The EPA is conducting its public comment and review process related to this draft assessment and a
final report relating to the human health effects of methanol, including its potential carcinogenicity, is expected to be released
in the second quarter of 2011. We are unable to determine at this time whether this draft classification will be maintained in the
final assessment or if this will lead other government agencies to reclassify methanol. Any reclassification could reduce future
methanol demand, which could have an adverse effect on our results of operations, financial condition or our stock price.
Demand for Methanol in the Production of Formaldehyde
In 2009, methanol demand for the production of formaldehyde represented approximately 34% of global demand. The
largest use for formaldehyde is as a component of urea-formaldehyde and phenol-formaldehyde resins, which are used
as wood adhesives for plywood, particleboard, oriented strand board, medium-density fibreboard and other reconstituted
or engineered wood products. There is also demand for formaldehyde as a raw material for engineering plastics and in
the manufacture of a variety of other products, including elastomers, paints, building products, foams, polyurethane and
automotive products.
The current EPA IRIS carcinogenicity classification for formaldehyde is “Likely to Be Carcinogenic to Humans.” However,
the EPA is reviewing this classification for formaldehyde as part of a standard review of chemicals. The estimated date of
completion for the formaldehyde review is unknown at this time.
In May 2009, the National Cancer Institute (NCI) published a report on the health effects of occupational exposure to
formaldehyde and a possible link to leukemia, multiple myeloma and Hodgkin’s disease. The NCI report concluded that there
may be an increased risk of cancers of the blood and bone marrow related to a measure of peak formaldehyde exposure. The
International Agency for Research on Cancer also recently concluded that there is sufficient evidence in humans of a causal
association of formaldehyde with leukemia.
The U.S. Department of Health and Human Services’ (HHS) National Toxicology Program (NTP) Report on Carcinogens
currently lists formaldehyde as “reasonably anticipated to be a human carcinogen.” This classification is currently under
review. The NTP is expected to issue a report in December 2010 which could raise the formaldehyde classification to “human
carcinogen”. In addition, there are legislative initiatives underway in the United States related to new national emissions
standards for formaldehyde.
We are unable to determine at this time if the EPA, the HHS or other governments or government agencies will reclassify
formaldehyde or what limits could be imposed related to formaldehyde emissions in the United States or elsewhere. Any
such actions could reduce future methanol demand for use in producing formaldehyde, which could have an adverse effect
on our results of operations and financial condition.
Demand for Methanol in the Production of MTBE
In 2009, methanol for the production of MTBE represented approximately 13% of global methanol demand. MTBE is used primarily
as a source of octane and as an oxygenate for gasoline to reduce the amount of harmful exhaust emissions from motor vehicles.
Several years ago, environmental concerns and legislative action related to gasoline leaking into water supplies from underground
gasoline storage tanks in the United States have led to the phase-out of MTBE as a gasoline additive in the United States. We
believe that methanol has not been used in the United States since 2007 to make MTBE for use in domestic fuel blending.
However, approximately 750,000 tonnes of methanol was used in the United States in 2009 (the same amount as in 2008) to
produce MTBE for export markets where demand for MTBE has continued at strong levels. While we currently expect demand
for methanol for MTBE production in the United States for 2010 to remain steady or to decline slightly, it could decline materially
as this demand is uncertain and will be determined by various factors, including export economics and changes to legislation or
policies related to MTBE use in countries that import MTBE from the United States.
32 METHANEX Annual Report 2009 Management’s Discussion and Analysis
Additionally, the EPA in the United States is preparing an IRIS review of the human health effects of MTBE, including its
potential carcinogenicity, and its final report is expected to be released in the third quarter of 2011.
The European Union issued a final risk assessment report on MTBE in 2002 that permitted the continued use of MTBE,
although several risk reduction measures relating to the storage and handling of fuels were recommended. Governmental
efforts in recent years in some countries, primarily in the European Union and Latin America, to promote biofuels and
alternative fuels through legislation or tax policy are putting competitive pressures on the use of MTBE in gasoline in these
countries and this has resulted in some MTBE producers switching production to ethyl tert-butyl ether (ETBE) to access
biofuels incentives. However, due to strong MTBE demand in other countries, we have observed the opposite in 2009, with
some ETBE producers switching back to MTBE production. We cannot provide assurance that this will continue.
Although MTBE demand has remained strong outside of the United States, we cannot provide assurance that further
legislation banning or restricting the use of MTBE or promoting alternatives to MTBE will not be passed or that negative
public perceptions will not develop outside of the United States, either of which would lead to a further decrease in the
global demand for methanol for use in MTBE. Declines in demand for methanol for use in MTBE could have an adverse effect
on our results of operations and financial condition.
Foreign Operations
The majority of our operations and investments are located outside of North America, including Chile, Trinidad, New
Zealand, Egypt, Europe and Asia. We are subject to risks inherent in foreign operations such as; loss of revenue, property
and equipment as a result of expropriation, import or export restrictions, anti-dumping measures; nationalization, war,
insurrection, terrorism and other political risks; increases in duties, taxes and governmental royalties; renegotiation of
contracts with governmental entities; as well as changes in laws or policies or other actions by governments that may
adversely affect our operations. Many of the foregoing risks related to foreign operations may also exist for our domestic
operations in North America.
In addition, because we derive substantially all of our revenues from production and sales by subsidiaries outside of Canada,
the payment of dividends or the making of other cash payments or advances by these subsidiaries may be subject to
restrictions or exchange controls on the transfer of funds in or out of the respective countries or result in the imposition of
taxes on such payments or advances.
We have organized our foreign operations in part based on certain assumptions about various tax laws (including capital gains
and withholding taxes), foreign currency exchange and capital repatriation laws and other relevant laws of a variety of foreign
jurisdictions. While we believe that such assumptions are reasonable, we cannot provide assurance that foreign taxation or
other authorities will reach the same conclusion. Further, if such foreign jurisdictions were to change or modify such laws, we
could suffer adverse tax and financial consequences.
The dominant currency in which we conduct business is the United States dollar, which is also our reporting currency. The
most significant components of our costs are natural gas feedstock and ocean shipping costs and substantially all of these
costs are incurred in United States dollars. Some of our underlying operating costs and capital expenditures, however, are
incurred in currencies other than the United States dollar, principally the Canadian dollar, the Chilean peso, the Trinidad and
Tobago dollar, the New Zealand dollar, the euro and the Egyptian pound. We are exposed to increases in the value of these
currencies that could have the effect of increasing the United States dollar equivalent of cost of sales and operating expenses
and capital expenditures. A portion of our revenue is earned in euros and British pounds. We are exposed to declines in the
value of these currencies compared to the United States dollar, which could have the effect of decreasing the United States
dollar equivalent of our revenue.
Management’s Discussion and Analysis Annual Report 2009 METHANEX 33
In June 2009, the Chinese government began an anti-dumping investigation against imports of methanol from New
Zealand, Saudi Arabia, Indonesia and Malaysia. A preliminary determination is expected in the first half of 2010 and a final
determination is expected later in 2010. No new duties or other measures have been imposed to date. As an importer of
methanol from New Zealand into China, we have fully co-operated with this investigation. We have submitted documents and
data supporting our argument that there is no correlation between the alleged injury suffered by the local industry and the
imports from the targeted countries. However, we cannot predict the outcome of this investigation and it is possible that the
Chinese government could impose duties or other measures that could have an adverse effect on our results of operations
and financial condition.
Methanol is a globally traded commodity that is produced by many producers at facilities located in many countries around the
world. Some producers and marketers may have direct or indirect contacts with countries that may, from time to time, be subject
to international trade sanctions or other similar prohibitions (“Sanctioned Countries”). In addition to the methanol we produce,
we purchase methanol from third parties under purchase contracts or on the spot market in order to meet our commitments to
customers and we also engage in product exchanges with other producers and marketers. We believe that we are in compliance
with all applicable laws with respect to sales and purchases of methanol and product exchanges. However, as a result of the
participation of Sanctioned Countries in our industry, we cannot provide assurance that we will not be exposed to reputational or
other risks that could have an adverse impact on our results of operations, our financial condition or our stock price.
Operational Risks
Production Risks
Most of our earnings are derived from the sale of methanol produced at our plants. Our business is subject to the risks of
operating methanol production facilities, such as unforeseen equipment breakdowns, interruptions in the supply of natural
gas and other feedstocks, power failures, longer-than-anticipated planned maintenance activities, loss of port facilities, natural
disasters or any other event, including unanticipated events beyond our control that could result in a prolonged shutdown of
any of our plants or impede our ability to deliver methanol to our customers. A prolonged plant shutdown at any of our major
facilities could have an adverse effect on our results of operations and financial condition.
Purchased Product Price Risk
In addition to the sale of methanol produced at our plants, we also purchase methanol produced by others on the spot
market and through purchase contracts to meet our customer commitments and support our marketing efforts. We have
adopted the first-in, first-out method of accounting for inventories and it generally takes between 30 and 60 days to sell the
methanol we purchase. Consequently, we have the risk of holding losses on the resale of this product to the extent that
methanol prices decrease from the date of purchase to the date of sale. In mid-2007, we experienced a significant reduction
in our production levels at our plants in Chile as a result of the natural gas curtailments from Argentina. Accordingly, we have
increased our purchasing levels of methanol since that time to continue to meet our customer commitments, which has
increased our exposure to holding losses on the sale of purchased methanol. Holding losses could have an adverse effect on
our results of operations and financial condition.
Distribution Risks
Excess capacity within our fleet of ocean vessels resulting from a prolonged plant shutdown or other event could also have
an adverse effect on our results of operations and financial condition. Due to the significant reduction of production levels
at our Chilean facilities since mid-2007, we have had excess shipping capacity that is subject to fixed time charter costs. We
have been successful in mitigating some of these costs by entering into sub-charters and third-party backhaul arrangements,
although the recent recession made it more difficult to mitigate these costs due to significant excess shipping capacity. As
we enter 2010, the shipping market has not yet fully recovered from the recession. If we are unable to mitigate these costs
in the future, or if we suffer any other disruptions in our distribution system, this could have an adverse effect on our results
of operations and financial condition.
34 METHANEX Annual Report 2009 Management’s Discussion and Analysis
Insurance Risks
Although we maintain operational and construction insurances, including business interruption insurance and delayed start-up
insurance, we cannot provide assurance that we will not incur losses beyond the limits of, or outside the coverage of, such
insurance or that insurers will be financially capable of honouring future claims. From time to time, various types of insurance
for companies in the chemical and petrochemical industries have not been available on commercially acceptable terms or,
in some cases, have been unavailable. We cannot provide assurance that in the future we will be able to maintain existing
coverage or that premiums will not increase substantially.
Egypt Plant under Construction
We are currently constructing a 1.3 million tonne per year methanol facility with partners in Egypt. While we believe that
our estimates of project costs and anticipated completion for the Egyptian project are reasonable, we cannot provide any
assurance that the cost estimates will not be exceeded or that the facility will begin commercial production within the
anticipated schedule, if at all.
New Capital Projects
As part of our strategy to strengthen our position as the global leader in the production and marketing of methanol, we intend
to continue pursuing new opportunities to enhance our strategic position in the methanol industry. Our ability to successfully
identify, develop and complete new capital projects is subject to a number of risks, including finding and selecting favourable
locations for new facilities where sufficient natural gas and other feedstock is available through long-term contracts with
acceptable commercial terms, obtaining project or other financing on satisfactory terms, developing and not exceeding
acceptable project cost estimates, constructing and completing the projects within the contemplated schedules and other
risks commonly associated with the design, construction and start-up of large complex industrial projects. We cannot provide
assurance that we will be able to identify or develop new methanol projects.
Environmental Regulation
The countries in which we operate have laws and regulations to which we are subject governing the environment and
the management of natural resources as well as the handling, storage, transportation and disposal of hazardous or waste
materials. We are also subject to laws and regulations governing emissions and the import, export, use, discharge, storage,
disposal and transportation of toxic substances. The products we use and produce are subject to regulation under various
health, safety and environmental laws. Non-compliance with any of these laws and regulations may give rise to work orders,
fines, injunctions, civil liability and criminal sanctions.
As a result of periodic external and internal audits, we currently believe that we materially comply with all existing
environmental, health and safety laws and regulations to which our operations are subject. Laws and regulations protecting
the environment have become more stringent in recent years and may, in certain circumstances, impose absolute liability
that renders a person liable for environmental damage without regard to negligence or fault on the part of such person. Such
laws and regulations may also expose us to liability for the conduct of, or conditions caused by, others, or for our own acts
even if we complied with applicable laws at the time such acts were performed. To date, environmental laws and regulations
have not had a material adverse effect on our capital expenditures, earnings or competitive position. However, operating
petrochemical manufacturing plants and distributing methanol exposes us to risks in connection with compliance with such
laws and we cannot provide assurance that we will not incur material costs or liabilities.
Carbon dioxide is a significant by-product of the methanol production process. We manufacture methanol in Chile, Trinidad
and New Zealand and we are constructing a new facility in Egypt with partners. All of these countries have signed and ratified
the Kyoto Protocol. Under the Kyoto Protocol, we are not currently required to reduce greenhouse gases (GHGs) in the
developing nations of Chile, Trinidad and Egypt. However, as a developed nation, New Zealand does have obligations related
to GHG emissions reduction under the Kyoto Protocol.
Management’s Discussion and Analysis Annual Report 2009 METHANEX 35
To meet its commitments under the Kyoto Protocol, New Zealand passed legislation to establish an Emission Trading Scheme
(ETS) that will take effect from July 1, 2010. The ETS will impose a carbon price on producers of fossil fuels, including natural
gas, which is expected in turn to increase the costs of natural gas that Methanex purchases in New Zealand. However, as a
trade-exposed company, Methanex will be entitled to a free allocation of emissions units to partially offset those increased
costs and the legislation provides further moderation of any residual cost exposure until the end of 2012. After this date, the
moderating features are expected to be removed, our eligibility for free allocation of emissions units will be progressively
reduced and we will likely have to pay the increased costs. We currently believe that the ETS will not have a material adverse
impact on our results of operations and financial condition to the end of 2012. However, at this time it is difficult to accurately
quantify the impact on our business after 2012 and therefore we cannot provide assurance that the ETS will not have a
material adverse impact on our results of operations and financial condition after 2012.
legal Proceedings
In 2009, the Board of Inland Revenue of Trinidad and Tobago issued an assessment against our wholly owned subsidiary,
Methanex Trinidad (Titan) Unlimited, in respect of the 2003 financial year. The assessment related to the deferral of tax
depreciation deductions during a five-year tax holiday that ended in 2005. The amount in dispute as at December 31, 2009
is approximately $23 million in current taxes and $26 million in future taxes, exclusive of any interest charges. The Company
has lodged an objection to the assessment. Based on the merits of the case and legal interpretation, management believes
its position should be sustainable. However, we cannot provide assurance that the final assessment will not have an adverse
effect on our results of operations and financial condition.
OUTlOOK
Methanol is a global chemical commodity and our earnings are significantly affected by fluctuations in the price of methanol,
which is directly impacted by the balance of methanol supply and demand. Demand for methanol is driven primarily by levels
of industrial production, energy prices and the strength of the global economy.
As we entered 2009, the global financial crisis and weak economic environment caused a sharp reduction in global demand
for most traditional methanol derivatives (which represent approximately 70% of global methanol demand), while demand for
methanol in energy-related applications (30% of global methanol demand) remained healthy. Overall, we estimate that global
demand had declined by about 15% from 2008 pre-recession levels to an annualized level of about 36 million tonnes. As a
result, a significant amount of high cost capacity shut in or operated at lower rates for a period of time to bring supply and
demand into balance. This resulted in a period of lower methanol prices, with contract pricing across global markets averaging
about $213 per tonne over the first half of the year.
During 2009, global methanol demand recovered and by the end of the year it reached a level of approximately 43 million tonnes
measured on an annualized basis. Demand recovery was mainly focused in Asia, particularly in China. In Europe and North
America, demand into chemical derivatives began to recover in the second half of 2009, but still lagged pre-recession levels.
Methanol blending into gasoline in China has been particularly strong and we believe that future growth in this application is
supported by recent regulatory changes in that country. For example, an M85 (or 85% methanol blend) national standard took
effect on December 1, 2009, and we expect an M15 (or 15% methanol blend) national standard to be released later in 2010.
Supported by an environment of strong energy prices, methanol demand into DME in China also increased in 2009.
In addition to the improvement in demand, we have seen an escalation in feedstock costs for producers and significant
supply challenges. There have been a number of planned and unplanned plant outages across the industry and we
understand that two new-world scale methanol plants that began operations in the last 12 months have been operating at
reduced rates. As a result of the improvement in demand, industry supply challenges and the increase in costs for many
producers, methanol prices increased through the latter half of 2009 and into 2010. Our average non-discounted posted price
in January was approximately $350 per tonne.

36 METHANEX Annual Report 2009 Management’s Discussion and Analysis
Over the two-year period to the end of 2011, it is expected that new capacity and expansions will add approximately
four million tonnes of capacity to the global industry outside of China, including the 1.3 million tonne plant we are
constructing in Egypt with partners. We believe that this new capacity could be offset by demand growth outside of China,
import growth into China and further closures of high cost capacity in the industry.
There are significant capacity additions planned in China over the next few years. However, the Chinese methanol industry
has historically operated at low rates and there has been increasing pressure on its cost structure as a result of escalating
feedstock costs for both coal and natural gas based producers. At the beginning of 2009, as a result of the lower methanol
price environment, we estimate about 6 million tonnes of annualized higher-cost or less-efficient methanol production in
China was shut down and net imports into China increased by approximately 5 million tonnes on an annualized basis. During
the second half of 2009, increasing methanol prices resulted in some higher-cost capacity restarting in China and, given the
strong demand for methanol, import levels also remained high. In addition, the majority of the methanol produced in China is
made from coal and is typically lower quality and not suitable for all customers. In a high global energy price environment, we
believe that methanol demand in China should continue to grow at high rates and that this will more than offset increases of
domestic production in China and imports of methanol into China will increase over time.
The methanol price will ultimately depend on the strength of the economic recovery, industry operating rates, global
energy prices, the rate of industry restructuring and the strength of global demand. We believe that our financial position
and financial flexibility, outstanding global supply network and low cost position will provide a sound basis for Methanex to
continue to be the leader in the methanol industry and to invest to grow the Company.
CRITICAl ACCOUNTING ESTIMATES
We believe the following selected accounting policies and issues are critical to understanding the estimates, assumptions
and uncertainties that affect the amounts reported and disclosed in our consolidated financial statements and related notes.
See note 1 to our 2009 consolidated financial statements for our significant accounting policies.
Property, Plant and Equipment
Our business is capital intensive and has required, and will continue to require, significant investments in property, plant
and equipment. At December 31, 2009, the net book value of our property, plant and equipment was $2,184 million. We
estimate the useful lives of property, plant and equipment and this is used as the basis for recording depreciation and
amortization. Recoverability of property, plant and equipment is measured by comparing the net book value of an asset to the
undiscounted future net cash flows expected to be generated from the asset over its estimated useful life. An impairment
charge is recognized in cases where the undiscounted expected future cash flows from an asset are less than the net book
value of the asset. The impairment charge is equal to the amount by which the net book value of the asset exceeds its fair
value. Fair value is based on quoted market values, if available, or alternatively using discounted expected future cash flows.
We test our long-lived assets for recoverability whenever events or changes in circumstances indicate that the carrying
amount may not be recoverable. Examples of such events or changes in circumstances related to our long-lived assets
include, but are not restricted to: a significant adverse change in the extent or manner in which the asset is being used
or in its physical condition; a significant change in the price or availability of natural gas feedstock required to manufacture
methanol; a significant adverse change in legal factors or in the business climate that could affect the asset’s value, including
an adverse action or assessment by a foreign government that impacts the use of the asset; or a current-period operating
or cash flow loss combined with a history of operating or cash flow losses, or a projection or forecast that demonstrates
continuing losses associated with the asset’s use. For purposes of recognition and measurement of an impairment loss, we
group our long-lived assets with other assets and liabilities to form an “asset group,” at the lowest level for which identifiable
cash flows are largely independent of the cash flows of other assets and liabilities. To the extent that our methanol facilities in
a particular location are interdependent as a result of common infrastructure and/or feedstock from shared sources that can
be moved within a facility location, we group our assets based on site locations for the purpose of determining impairment.
Management’s Discussion and Analysis Annual Report 2009 METHANEX 37
There are two key variables that impact our estimate of future cash flows: (1) the methanol price and (2) the price and
availability of natural gas feedstock. Short-term methanol price estimates are based on current supply and demand
fundamentals and current methanol prices. Long-term methanol price estimates are based on our view of long-term supply
and demand and consideration is given to many factors, including, but not limited to, estimates of global industrial production
rates, energy prices, changes in general economic conditions, future global methanol production capacity, industry operating
rates and the global industry cost structure. Our estimate of the price and availability of natural gas takes into consideration
the current contracted terms, as well as factors that we believe are relevant to supply under these contracts and
supplemental natural gas sources. Other assumptions included in our estimate of future cash flows include the estimated
cost incurred to maintain the facilities, estimates of transportation costs and other variable costs incurred in producing
methanol in each period. Changes in these assumptions will impact our estimates of future cash flows and could impact our
estimates of the useful lives of property, plant and equipment. Consequently, it is possible that our future operating results
could be adversely affected by asset impairment charges or by changes in depreciation and amortization rates related to
property, plant and equipment.
Asset Retirement Obligations
We record asset retirement obligations at fair value when incurred for those sites where a reasonable estimate of the fair value
can be determined. At December 31, 2009, we have accrued $16 million for asset retirement obligations. Inherent uncertainties
exist because the restoration activities will take place in the future and there may be changes in governmental and environmental
regulations and changes in removal technology and costs. It is difficult to estimate the future costs of these activities as our
estimate of fair value is based on today’s regulations and technology. Because of uncertainties related to estimating the cost and
timing of future site restoration activities, future costs could differ materially from the amounts estimated.
Income Taxes
Future income tax assets and liabilities are determined using enacted tax rates for the effects of net operating losses and
temporary differences between the book and tax bases of assets and liabilities. We record a valuation allowance on future
tax assets, when appropriate, to reflect the uncertainty of realizing future tax benefits. In determining the appropriate
valuation allowance, certain judgments are made relating to the level of expected future taxable income and to available tax
planning strategies and their impact on the use of existing loss carryforwards and other income tax deductions. In making
this analysis, we consider historical profitability and volatility to assess whether we believe it to be more likely than not that
the existing loss carryforwards and other income tax deductions will be used to offset future taxable income otherwise
calculated. Our management routinely reviews these judgments. At December 31, 2009, we had future income tax assets of
$218 million that are substantially offset by a valuation allowance of $163 million. The determination of income taxes requires
the use of judgment and estimates. If certain judgments or estimates prove to be inaccurate, or if certain tax rates or laws
change, our results of operations and financial position could be materially impacted.
Inventories
Inventories are valued at the lower of cost, determined on a first-in first-out basis, and estimated net realizable value. The
cost of our inventory, for both produced methanol as well as methanol we purchase from others, is impacted by methanol
prices at the time of production or purchase. The net realizable value of inventories will depend on methanol prices when
sold. Inherent uncertainties exist in estimating future methanol prices and therefore the net realizable value of our inventory.
Methanol prices are influenced by supply and demand fundamentals, industrial production, energy prices and the strength of
the global economy. At December 31, 2009, inventory is appropriately valued at cost.

38 METHANEX Annual Report 2009 Management’s Discussion and Analysis
Accounts Receivable and Allowance for Doubtful Accounts
We provide credit to our customers in the normal course of business. We perform ongoing credit evaluations of our
customers and maintain reserves for potential credit losses. We record an allowance for doubtful accounts or write down
the receivable to estimated net realizable value if not collectible in full. As at December 31, 2009, we had approximately
$191 million in trade accounts receivable, and we believe that we have adequately provided for any credit losses. Historically,
credit losses have been within the range of management’s expectations. However, in the current economic environment,
there continues to be an increased risk of trade credit losses and because of uncertainties in estimated future credit losses,
credit losses on trade receivables could be materially different from amounts estimated.
Oil and Gas Accounting
On August 24, 2009, the Company received final government approval of the agreement signed on May 5, 2008 with ENAP,
the Chilean state-owned oil and gas company. The agreement with ENAP is to accelerate gas exploration and development
in the Dorado Riquelme exploration block in southern Chile and supply new Chilean-sourced natural gas to the Company’s
production facilities in Chile. Under the arrangement we fund a 50% participation in the block.
Upon receiving final government approval of the agreement, the Company adopted the CICA guideline on full cost accounting in
the oil and gas industry to account for our investment in the Dorado Riquelme block. Under this method, all costs, including internal
costs and asset retirement costs, directly associated with the acquisition of, the exploration for, and the development of natural gas
reserves are capitalized. Costs are then depleted and amortized using the unit-of-production method based on estimated proved
reserves. Capitalized costs subject to depletion include estimated future costs to be incurred in developing proved reserves. Costs
of major development projects and costs of acquiring and evaluating significant unproved properties are excluded from the costs
subject to depletion until it is determined whether or not proved reserves are attributable to the properties or impairment has
occurred. Costs that have been impaired are included in the costs subject to depletion and amortization.
Under the CICA guideline on full cost accounting, an impairment assessment (“ceiling test”) is performed on an annual basis
for all oil and gas assets. An impairment loss is recognized in earnings when the carrying amount is not recoverable and
the carrying amount exceeds its fair value. The carrying amount is not recoverable if the carrying amount exceeds the sum
of the undiscounted cash flows from proved reserves. If the sum of the cash flows is less than the carrying amount, the
impairment loss is measured as the amount by which the carrying amount exceeds the sum of the discounted cash flows of
proved and probable reserves.
As a result of the adoption of the full cost accounting methodology, the Company reclassified the cumulative oil and gas
expenditures of $58.7 million from other assets to property, plant and equipment in the third quarter of 2009. The Company
performed the annual ceiling test for its investment in the Dorado Riquelme block and concluded no impairment existed as at
December 31, 2009. For the year ended December 31, 2009, the Company contributed $22.8 million (2008 – $41.8 million) to
the Dorado Riquelme investment.
Derivative Financial Instruments
From time to time we enter into derivative financial instruments to limit our exposure to foreign exchange volatility and
to variable interest rate volatility and to contribute towards achieving cost structure and revenue targets. The valuation of
derivative financial instruments is a critical accounting estimate due to the complex nature of these products, the degree
of judgment required to appropriately value these products and the potential impact of such valuation on our financial
statements. Derivative financial instruments are classified as held for trading and are recorded on the balance sheet at
fair value. Changes in the fair value of derivative financial instruments are recorded in earnings unless the instruments
are designated as cash flow hedges, in which case the effective portion of any changes in fair value are recorded in other
comprehensive income. At December 31, 2009, the fair value of our derivative financial instruments used to limit our
exposure to foreign exchange volatility and to variable interest rate volatility approximated their carrying value of negative
$33.2 million. Until settled, the fair value of the derivative financial instruments will fluctuate based on changes in foreign
exchange rates and variable interest rates, which have been volatile in the current economic environment.

Management’s Discussion and Analysis Annual Report 2009 METHANEX 39
NEw CANADIAN ACCOUNTING STANDARDS ADOPTED IN 2009
Goodwill and Intangible Assets
On January 1, 2009, the Company adopted CICA Handbook Section 3064, Goodwill and Intangible Assets. This new
accounting standard replaces Section 3062, Goodwill and Other Intangible Assets. Section 3064 expands on the standards
for the recognition, measurement and disclosure of intangible assets. The impact of the retroactive adoption of this standard
on the Company’s consolidated balance sheet at January 1, 2009 is approximately $13 million recorded as a reduction to
opening retained earnings and property, plant and equipment. The amount relates to certain pre-operating expenditures
that have been capitalized to property, plant and equipment at December 31, 2008 that would have been required to be
expensed under this new standard. The impact for the year ended December 31, 2009 was an increase to selling, general
and administrative expenses of approximately $3.8 million (2008 – $3.5 million).
As a portion of these pre-operating expenditures were incurred in a non-wholly owned subsidiary, the Company has also
adjusted the opening non-controlling interest (NCI) and retained earnings balances at December 31, 2008 for the NCI’s
proportionate share of approximately $4 million.
Oil and Gas Accounting
On August 24, 2009, the Company received final government approval of the agreement signed on May 5, 2008 with
Empresa Nacional del petroleo (ENAP), the Chilean state-owned oil and gas company. The agreement with ENAP is
to accelerate gas exploration and development in the Dorado Riquelme exploration block in southern Chile and supply
new Chilean-sourced natural gas to the Company’s production facilities in Chile. Under the arrangement we fund a 50%
participation in the block. Upon receiving final government approval of the agreement, the Company adopted the CICA
guideline on full cost accounting in the oil and gas industry to account for our investment in the Dorado Riquelme block (refer
to the Critical Accounting Estimates – Oil and Gas Accounting section on page 38 for more information).
ANTICIPATED CHANGES TO CANADIAN GENERAlly ACCEPTED ACCOUNTING PRINCIPlES
International Financial Reporting Standards
The Canadian Accounting Standards Board confirmed January 1, 2011 as the changeover date for Canadian publicly
accountable enterprises to start using International Financial Reporting Standards (IFRS) as issued by the International
Accounting Standards Board (IASB). IFRS uses a conceptual framework similar to Canadian GAAP, but there are significant
differences in recognition, measurement and disclosures.
As a result of the IFRS transition, changes in accounting policies are likely and may materially impact our consolidated
financial statements. The IASB will also continue to issue new accounting standards during the conversion period, and as a
result, the final impact of IFRS on our consolidated financial statements will only be measured once all the IFRS applicable at
the conversion date are known.
We have established a working team to manage the transition to IFRS. Additionally, we have established a formal project
governance structure that includes the Audit, Finance and Risk Committee, senior management, and an IFRS steering committee
to monitor progress and review and approve recommendations from the working team for the transition to IFRS. The working
team provides regular updates to the IFRS steering committee and to the Audit, Finance and Risk Committee of the Board.
We have developed a plan to convert our consolidated financial statements to IFRS at the changeover date of January 1, 2011
with comparative financial results for 2010. The IFRS transition plan addresses the impact of IFRS on accounting policies and
implementation decisions, infrastructure, business activities and control activities. We are progressing according to schedule
and continue to be on track toward the transition to IFRS in 2011. We will continue to provide updates on the status of the
project and its impact on financial reporting in our quarterly and annual Management’s Discussion and Analysis throughout
the convergence period to January 1, 2011. A summary status of the key elements of the changeover plan is as follows:
40 METHANEX Annual Report 2009 Management’s Discussion and Analysis
Accounting policies and implementation decisions
� Key activities:
– Identification of differences in Canadian GAAP and IFRS accounting policies
– Selection of ongoing IFRS policies
– Selection of IFRS 1, First-time Adoption of International Financial Reporting Standards (“IFRS 1”) choices
– Development of financial statement format
– Quantification of effects of change in initial IFRS 1 disclosures and 2010 financial statements
� Status:
– We have identified differences between accounting policies under Canadian GAAP and accounting policy choices under
IFRS, both on an ongoing basis and with respect to certain choices available on conversion, in accordance with IFRS 1
– We have addressed, on a priority basis, those areas that we believe may cause the most significant impact to our
consolidated financial statements
– We have engaged the Company’s external auditors, KPMG LLP, to discuss our proposed IFRS accounting policies to
ensure consistent interpretation of IFRS guidance in key areas as they are arrived at and agreed by the working team
– We continue to monitor changes in accounting policies issued by the IASB and the impact of those changes on our
accounting policies under IFRS
– We continue to progress our selection of IFRS accounting policies and the quantification of identified differences which
we anticipate to finalize in 2010
Infrastructure: Financial reporting expertise
� Key activities:
– Development of IFRS expertise
� Status:
– We have provided training for key employees and senior management
– We have held an IFRS information session with the Audit, Risk and Finance Committee that included an in-depth review
of differences between Canadian GAAP and IFRS, a review of the implementation timeline, an overview of the project
activities to date and a preliminary discussion of the significant impact areas of IFRS
– We will provide additional training and updates for key employees, senior management, the Audit, Risk and Finance
Committee, the Board and other stakeholders throughout the convergence period
– In 2010, all accounting policy changes arising from the transition to IFRS will be subject to review by senior
management, the IFRS Steering Committee and ultimately final review and approval by the Audit, Finance and Risk
Committee of the Board
Infrastructure: Information technology and data systems
� Key activities:
– Identification of system requirements for the convergence and post-convergence periods
� Status:
– We have assessed the impact on system requirements for the convergence and post-convergence periods. These
requirements are limited to the core general ledger system to facilitate the compilation of IFRS comparative results
throughout 2010. We do not anticipate significant impact to other applications arising from the transition to IFRS
Management’s Discussion and Analysis Annual Report 2009 METHANEX 41
Business activities: Financial covenants
� Key activities:
– Identification of impact on financial covenants and financing relationships
– Completion of any required renegotiations/changes
� Status:
– The financial covenant requirements in our financing relationships are measured on the basis of Canadian GAAP in
effect at the commencement of the various relationships, and the transition to IFRS will therefore have no impact on our
current financial covenant requirements
– We are developing a process to compile our financial results on a historical Canadian GAAP basis and to monitor
financial covenant requirements through to the conclusion of our current financing relationships
Business activities: Compensation arrangements
� Key activities:
– Identification of impact on compensation arrangements
– Assessment and implementation of required changes
� Status:
– We have identified compensation policies that rely on indicators derived from the financial statements
– In 2010, we will work with the Company’s human resources department and the Human Resources Committee of the
Board to ensure that compensation arrangements incorporate IFRS results in accordance with the Company’s overall
compensation principles
Control activities: Internal control over financial reporting
� Key activities:
– For all accounting policy changes identified, assessing the design and effectiveness of respective changes to Internal
Controls over Financial Reporting (“ICFR”)
– Implementation of appropriate changes
� Status:
– We have identified the required accounting process changes that result from the application of IFRS accounting policies;
these changes are not anticipated to be significant
– In 2010 we will complete the design, implementation and documentation of the accounting process changes that result
from the application of IFRS accounting policies
Control activities: Disclosure controls and procedures
� Key activities:
– For all accounting policy changes identified, assessing the design and effectiveness of respective changes to Disclosure
Controls and Procedures (“DC&P”)
– Implementation of appropriate changes
� Status:
– We continue to provide IFRS project updates in quarterly and annual disclosure documents
– In 2010, all accounting policy changes arising from the transition to IFRS will be subject to review by senior
management, the IFRS Steering Committee and ultimately final review and approval by the Audit, Finance & Risk
Committee of the Board
42 METHANEX Annual Report 2009 Management’s Discussion and Analysis
Potential Significant Impacts on Transition to IFRS
The Company has completed its initial assessment of the impacts of the transition to IFRS. Based on an analysis of Canadian
GAAP and IFRS in effect at December 31, 2009, we have identified several differences between the Company’s current
accounting policies and those expected to apply in preparing IFRS consolidated financial statements. Information on those
changes that management considers most significant to the Company are presented below.
Interest in Joint Ventures
Under Canadian GAAP, our 63.1% interest in Atlas Methanol Company (Atlas) is accounted for using proportionate
consolidation in the accounting for joint ventures. Current IFRS allows a choice between proportionate consolidation and
equity accounting in the accounting for joint ventures.
Future changes to IFRS in the accounting for joint ventures are expected and these changes may remove the option for
proportionate consolidation and allow only the equity method of accounting for such interests. The impact of applying
the equity method of accounting does not result in any change to net earnings or shareholders’ equity. There would be a
significant presentation impact, however, in that Atlas’ net results and financial position would be presented on a single line
of the Company’s income statement and statement of financial position, respectively.
The IASB is currently proceeding on projects related to consolidation and joint venture accounting. The impact these projects
may have on the conclusions related to the accounting treatment of Atlas is currently unknown.
We continue to monitor changes in accounting policies issued by the IASB in this area. We have not yet selected our
accounting policy under current IFRS between proportionate consolidation and equity accounting for Atlas.
Leases
Canadian GAAP requires an arrangement that at its inception can be fulfilled only through the use of a specific asset or
assets, and which conveys a right to use that asset, may be a lease or contain a lease, and therefore should be accounted for
as a lease, regardless of whether it takes the legal form of a lease. However, Canadian GAAP has grandfathering provisions
that exempts contracts entered into before 2004 from these requirements.
IFRS has similar accounting requirements as Canadian GAAP for lease-like arrangements, with IFRS requiring full retrospective
application. We have long-term oxygen supply contracts for our Atlas and Titan methanol plants in Trinidad, executed prior
to 2004, which we believe would be regarded as capital leases under these standards. Accordingly, we believe our Trinidad
oxygen supply contracts will be required to be accounted for as finance leases and therefore be recognized on the statement
of financial position as an asset with a corresponding long-term liability obligation. Our analysis is ongoing and includes
quantifying the impact of this accounting conclusion on transition to IFRS.
Impairment of Assets
If there is an indication that an asset may be impaired, an impairment test must be performed. Under Canadian GAAP, this is
a two-step impairment test in which (1) undiscounted future cash flows are compared to the carrying value; and (2) if those
undiscounted cash flows are less than the carrying value, the asset is written down to the fair value. Under IFRS, an entity is
required to assess, at the end of each reporting period, whether there is any indication that an asset may be impaired. If such
an indication exists, the entity shall estimate the recoverable amount of the asset by performing a one-step impairment test,
which requires a comparison of the carrying value of the asset to the higher of value in use and fair value less costs to sell.
Value in use is defined as the present value of future cash flows expected to be derived from the asset in its current state.
As a result of this difference, in principle, impairment writedowns may be more likely under IFRS than are currently identified
and recorded under Canadian GAAP. The extent of any new write downs, however, may be partially offset by the requirement
under IAS 36, Impairment of Assets, to reverse any previous impairment losses where circumstances have changed such
that the impairments have been reduced. Canadian GAAP prohibits reversal of impairment losses. We do not anticipate that
the adoption of these standards will result in an impairment of our assets on transition to IFRS.
Management’s Discussion and Analysis Annual Report 2009 METHANEX 43
Provisions
Under Canadian GAAP, a provision is required to be recorded in the financial statements when required payment is considered
“likely” and can be reasonably estimated. The threshold for recognition of provisions under IFRS is lower than that under Canadian
GAAP as provisions must be recognized if required payment is “probable.” Therefore, in principle, it is possible that there may be
some provisions which would meet the recognition criteria under IFRS that were not recognized under Canadian GAAP.
Other differences between IFRS and Canadian GAAP exist in relation to the measurement of provisions, such as the
methodology for determining the best estimate where there is a range of equally possible outcomes (IFRS uses the mid-
point of the range, whereas Canadian GAAP uses the low end of the range), and the requirement under IFRS for provisions to
be discounted where material.
IFRS 1 First-Time Adoption of International Financial Reporting Standards
Adoption of IFRS requires the application of IFRS 1, First-time Adoption of International Financial Reporting Standards, which
provides guidance for an entity’s initial adoption of IFRS. IFRS 1 gives entities adopting IFRS for the first time a number of
optional exemptions and mandatory exceptions, in certain areas, to the general requirement for full retrospective application
of IFRS. The following are the optional exemptions available under IFRS 1 that the Company currently intends to elect on
transition to IFRS. The Company continues to review all IFRS 1 exemptions and will implement those determined to be most
appropriate in our circumstances on transition to IFRS. The list below and comments should not be regarded as a complete
list of IFRS 1 that are available to the Company as a result from the transition to IFRS.
Business Combinations
Under IFRS 1 an entity has the option to retroactively apply IFRS 3, Business Combinations to all business combinations or
may elect to apply the standard prospectively only to those business combinations that occur after the date of transition. The
Company currently intends to elect this exemption under IFRS 1, which removes the requirement to retrospectively restate
all business combinations prior to the date of transition to IFRS.
Employee Benefits
IFRS 1 provides an option to recognize all cumulative actuarial gains and losses existing at the date of transition immediately in
retained earnings, rather than continuing to defer and amortize into the results of operations. The Company currently intends to
elect this exemption under IFRS 1. Our analysis is ongoing to quantify the impact of this election on transition to IFRS.
The discussion above on potential significant impacts on transition to IFRS is provided to allow readers to obtain a better
understanding of our IFRS changeover plan and the resulting potential effects on our consolidated financial statements. Readers are
cautioned, however, that it may not be appropriate to use such information for any other purpose. This discussion reflects our most
recent assumptions and expectations; circumstances may arise, such as changes in IFRS, regulations or economic conditions, which
could change these assumptions or expectations. We are still in the process of completing the selection of IFRS accounting policies
and the quantification of identified differences. Once completed, this information will be subject to approval by the Audit, Finance
and Risk Committee and audit by KPMG LLP, prior to being finalized. Accordingly, the discussion above is subject to change.
SUPPlEMENTAl NON-GAAP MEASURES
In addition to providing measures prepared in accordance with Canadian GAAP, we present certain supplemental non-GAAP
measures. These are Adjusted EBITDA, operating income and cash flows from operating activities before changes in non-
cash working capital. These measures do not have any standardized meaning prescribed by Canadian GAAP and therefore
are unlikely to be comparable to similar measures presented by other companies. We believe these measures are useful in
evaluating the operating performance and liquidity of our ongoing business. These measures should be considered in addition
to, and not as a substitute for, net income, cash flows and other measures of financial performance and liquidity reported in
accordance with Canadian GAAP.
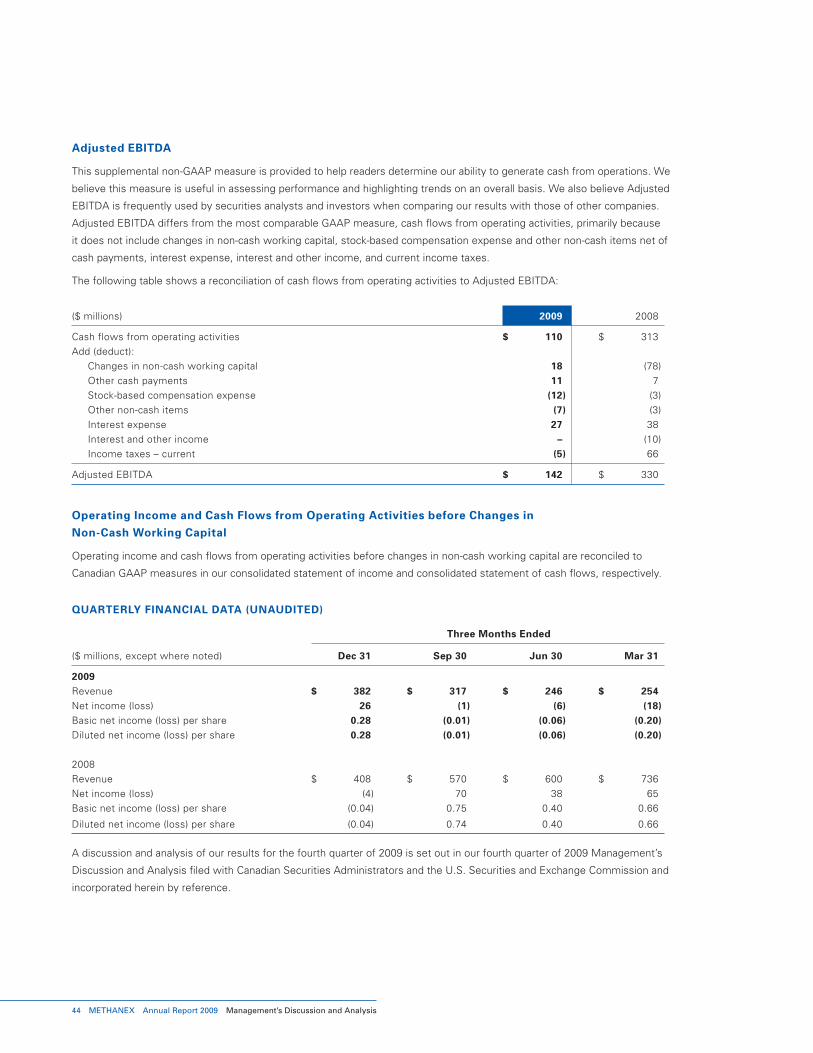
44 METHANEX Annual Report 2009 Management’s Discussion and Analysis
Adjusted EBITDA
This supplemental non-GAAP measure is provided to help readers determine our ability to generate cash from operations. We
believe this measure is useful in assessing performance and highlighting trends on an overall basis. We also believe Adjusted
EBITDA is frequently used by securities analysts and investors when comparing our results with those of other companies.
Adjusted EBITDA differs from the most comparable GAAP measure, cash flows from operating activities, primarily because
it does not include changes in non-cash working capital, stock-based compensation expense and other non-cash items net of
cash payments, interest expense, interest and other income, and current income taxes.
The following table shows a reconciliation of cash flows from operating activities to Adjusted EBITDA:
($ millions) 2009 2008
Cash flows from operating activities $ 110 $ 313
Add (deduct):
Changes in non-cash working capital 18 (78)
Other cash payments 11 7
Stock-based compensation expense (12) (3)
Other non-cash items (7) (3)
Interest expense 27 38
Interest and other income – (10)
Income taxes – current (5) 66
Adjusted EBITDA $ 142 $ 330
Operating Income and Cash Flows from Operating Activities before Changes in
Non-Cash working Capital
Operating income and cash flows from operating activities before changes in non-cash working capital are reconciled to
Canadian GAAP measures in our consolidated statement of income and consolidated statement of cash flows, respectively.
QUARTERly FINANCIAl DATA (UNAUDITED)
Three Months Ended
($ millions, except where noted) Dec 31 Sep 30 Jun 30 Mar 31
2009
Revenue $ 382 $ 317 $ 246 $ 254Net income (loss) 26 (1) (6) (18)Basic net income (loss) per share 0.28 (0.01) (0.06) (0.20)Diluted net income (loss) per share 0.28 (0.01) (0.06) (0.20)
2008
Revenue $ 408 $ 570 $ 600 $ 736
Net income (loss) (4) 70 38 65
Basic net income (loss) per share (0.04) 0.75 0.40 0.66
Diluted net income (loss) per share (0.04) 0.74 0.40 0.66
A discussion and analysis of our results for the fourth quarter of 2009 is set out in our fourth quarter of 2009 Management’s
Discussion and Analysis filed with Canadian Securities Administrators and the U.S. Securities and Exchange Commission and
incorporated herein by reference.
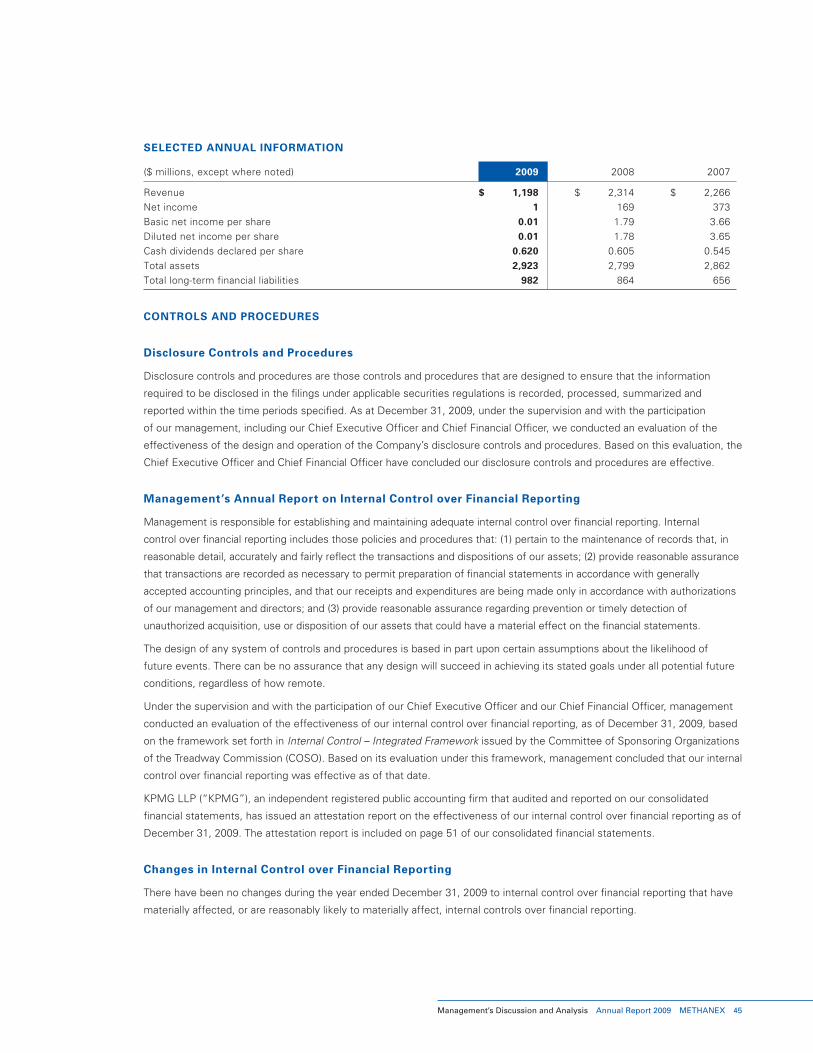
Management’s Discussion and Analysis Annual Report 2009 METHANEX 45
SElECTED ANNUAl INFORMATION
($ millions, except where noted) 2009 2008 2007
Revenue $ 1,198 $ 2,314 $ 2,266
Net income 1 169 373
Basic net income per share 0.01 1.79 3.66
Diluted net income per share 0.01 1.78 3.65
Cash dividends declared per share 0.620 0.605 0.545
Total assets 2,923 2,799 2,862
Total long-term financial liabilities 982 864 656
CONTROlS AND PROCEDURES
Disclosure Controls and Procedures
Disclosure controls and procedures are those controls and procedures that are designed to ensure that the information
required to be disclosed in the filings under applicable securities regulations is recorded, processed, summarized and
reported within the time periods specified. As at December 31, 2009, under the supervision and with the participation
of our management, including our Chief Executive Officer and Chief Financial Officer, we conducted an evaluation of the
effectiveness of the design and operation of the Company’s disclosure controls and procedures. Based on this evaluation, the
Chief Executive Officer and Chief Financial Officer have concluded our disclosure controls and procedures are effective.
Management’s Annual Report on Internal Control over Financial Reporting
Management is responsible for establishing and maintaining adequate internal control over financial reporting. Internal
control over financial reporting includes those policies and procedures that: (1) pertain to the maintenance of records that, in
reasonable detail, accurately and fairly reflect the transactions and dispositions of our assets; (2) provide reasonable assurance
that transactions are recorded as necessary to permit preparation of financial statements in accordance with generally
accepted accounting principles, and that our receipts and expenditures are being made only in accordance with authorizations
of our management and directors; and (3) provide reasonable assurance regarding prevention or timely detection of
unauthorized acquisition, use or disposition of our assets that could have a material effect on the financial statements.
The design of any system of controls and procedures is based in part upon certain assumptions about the likelihood of
future events. There can be no assurance that any design will succeed in achieving its stated goals under all potential future
conditions, regardless of how remote.
Under the supervision and with the participation of our Chief Executive Officer and our Chief Financial Officer, management
conducted an evaluation of the effectiveness of our internal control over financial reporting, as of December 31, 2009, based
on the framework set forth in Internal Control – Integrated Framework issued by the Committee of Sponsoring Organizations
of the Treadway Commission (COSO). Based on its evaluation under this framework, management concluded that our internal
control over financial reporting was effective as of that date.
KPMG LLP (“KPMG”), an independent registered public accounting firm that audited and reported on our consolidated
financial statements, has issued an attestation report on the effectiveness of our internal control over financial reporting as of
December 31, 2009. The attestation report is included on page 51 of our consolidated financial statements.
Changes in Internal Control over Financial Reporting
There have been no changes during the year ended December 31, 2009 to internal control over financial reporting that have
materially affected, or are reasonably likely to materially affect, internal controls over financial reporting.

46 METHANEX Annual Report 2009 Management’s Discussion and Analysis
FORwARD-lOOKING STATEMENTS
This 2009 Annual Report contains forward-looking statements with respect to us and the chemical industry. Statements that
include the words “believes,” “expects,” “may,” “will,” “should,” “seeks,” “intends,” “plans,” “estimates,” “anticipates,” or
the negative version of these words or other comparable terminology and similar statements of a future or forward-looking
nature identify forward-looking statements.
More particularly and without limitation, any statements regarding the following are forward-looking statements: demand for
methanol and its derivatives,
� expected new methanol supply and timing for start-up of same,
� expected shutdowns (either temporary or permanent) or restarts of existing methanol supply (including our own facilities),
including, without limitation, timing of planned maintenance outages,
� expected prices of methanol and methanol derivatives,
� expected energy prices (including prices for natural gas and coal feedstocks),
� anticipated production from, and production rates of, our plants,
� expected levels of natural gas supply to our plants,
� capital committed by third parties towards future natural gas exploration in southern Chile,
� anticipated results of natural gas exploration in southern Chile and New Zealand and timing of same,
� receipt of third-party consents or approvals,
� expected operating costs, including natural gas feedstock costs and logistics costs,
� expected tax rates,
� expected cash flows or earnings capability,
� ability to enter into new, or renew existing, gas contracts on commercially acceptable terms,
� expected expenditures and future sources of funding for such expenditures, including expenditures to support natural gas
exploration and development in southern Chile and New Zealand,
� capital expenditures to support natural gas exploration and development in southern Chile and New Zealand,
� anticipated start-up date of, and cost to complete, our methanol project in Egypt,
� availability of committed credit facilities and other financing,
� shareholder distribution strategy and anticipated distributions to shareholders,
� commercial viability of, success of, or ability to execute future projects, including capacity expansions,
� financial strength and ability to meet future financial commitments,
� expected impact of regulatory actions, including assessments of the carcinogenicity of methanol, formaldehyde and
MTBE, the imposition of formaldehyde emission limits and legislation related to CO2 emissions in New Zealand,
� expected global or regional economic activity (including industrial production levels) and expectations regarding recovery
from the current uncertain economic environment,
� expected financial statement and other impacts related to the Company’s transition to IFRS,
� expected outcome of legal proceedings, including the tax assessment recently issued by the Board of Inland Revenue of
Trinidad and Tobago and
� expected actions of governments, gas suppliers, courts, tribunals and other third parties, including the establishment by
the Chinese government of new fuel-blending standards and the outcome of the Chinese government’s anti-dumping
investigation related to methanol imports from a number of countries including New Zealand.
� expected demand for methanol and its derivatives,
� expected new methanol supply and timing for start-up
of same,
� expected shutdowns (either temporary or permanent) or
restarts of existing methanol supply (including our own
facilities), including, without limitation, timing of planned
maintenance outages,
� expected prices of methanol and methanol derivatives,
� expected energy prices (including prices for natural gas
and coal feedstocks),
� anticipated production from, and production rates of, our
plants,
� expected levels of natural gas supply to our plants,
� capital committed by third parties towards future natural
gas exploration in southern Chile,
� anticipated results of natural gas exploration in southern
Chile and New Zealand and timing of same,
� receipt of third-party consents or approvals,
� expected operating costs, including natural gas
feedstock costs and logistics costs,
� expected tax rates,
� expected cash flows or earnings capability,
� ability to enter into new, or renew existing, gas contracts
on commercially acceptable terms,
� expected expenditures and future sources of funding
for such expenditures, including expenditures to support
natural gas exploration and development in southern
Chile and New Zealand,
� capital expenditures to support natural gas exploration
and development in southern Chile and New Zealand,
� anticipated start-up date of, and cost to complete, our
methanol project in Egypt,
� availability of committed credit facilities and other
financing,
� shareholder distribution strategy and anticipated
distributions to shareholders,
� commercial viability of, success of, or ability to execute
future projects, including capacity expansions,
� financial strength and ability to meet future financial
commitments,
� expected impact of regulatory actions, including
assessments of the carcinogenicity of methanol,
formaldehyde and MTBE, the imposition of
formaldehyde emission limits and legislation related to
CO2 emissions in New Zealand,
� expected global or regional economic activity (including
industrial production levels) and expectations regarding
recovery from the current uncertain economic
environment,
� expected financial statement and other impacts related
to the Company’s transition to IFRS,
� expected outcome of legal proceedings, including the
tax assessment recently issued by the Board of Inland
Revenue of Trinidad and Tobago and
� expected actions of governments, gas suppliers,
courts, tribunals and other third parties, including the
establishment by the Chinese government of new fuel-
blending standards and the outcome of the Chinese
government’s anti-dumping investigation related to
methanol imports from a number of countries including
New Zealand.

Management’s Discussion and Analysis Annual Report 2009 METHANEX 47
We believe that we have a reasonable basis for making such forward-looking statements. The forward-looking statements in
this document are based on our experience, our perception of trends, current conditions and expected future developments
as well as other factors. Certain material factors or assumptions were applied in drawing the conclusions or making
the forecasts or projections that are included in these forward-looking statements, including, without limitation, future
expectations and assumptions concerning the following:
� supply of, demand for, and price of methanol, methanol derivatives, natural gas, oil and oil derivatives,
� success of natural gas exploration in southern Chile and New Zealand leading to increased natural gas supply available for
our plants in Chile and New Zealand on commercially acceptable terms,
� receipt or issuance of third-party consents or approvals, including, without limitation, governmental approvals related to
natural gas exploration rights or the establishment of new fuel standards,
� operating costs, including natural gas feedstock and logistics costs, capital costs, tax rates, cash flows, foreign exchange
rates and interest rates,
� completion date and cost of our methanol project in Egypt,
� availability of committed credit facilities and other financing,
� availability of future natural gas supply on commercially acceptable terms in Chile, Trinidad, New Zealand, Canada and Egypt,
� global and regional economic activity (including industrial production levels),
� absence of a material negative impact from major natural disasters or global pandemics,
� absence of a material negative impact from changes in laws, regulations or standards,
� the renewal of committed credit facilities and other financing upon the expiry thereof,
� the legal opinions received in connection with ongoing legal proceedings and
However, forward-looking statements, by their nature, involve risks and uncertainties that could cause actual results to differ
materially from those contemplated by the forward-looking statements. The risks and uncertainties primarily include those
attendant with producing and marketing methanol and successfully carrying out major capital expenditure projects in various
jurisdictions, including without limitation:
� conditions in the methanol and other industries, including fluctuations in the supply of, demand for and price of methanol
and its derivatives, including demand for methanol for energy uses,
� significant decrease in energy prices (including prices for natural gas and coal feedstocks),
� the success of natural gas exploration and development activities in southern Chile, New Zealand and Canada,
� availability of future natural gas supply on commercially acceptable terms in Chile, Trinidad, New Zealand and Egypt,
� the timing of the start-up and the cost to complete our new methanol joint venture project in Egypt,
� the ability to successfully carry out corporate initiatives and strategies,
� unexpected technical issues with our production facilities,
� actions of competitors and suppliers,
� actions of governments and governmental authorities, including implementation of policies or other measures by the
Chinese government, the United States government or other governments that could impact the demand for methanol or
its derivatives, or the failure to obtain governmental approvals related to natural gas exploration rights in southern Chile,
� changes in laws or regulations,
� import or export restrictions, anti-dumping measures, increases in duties, taxes and government royalties and other actions
by governments that may adversely affect our operations,
� worldwide economic conditions and conditions in the global financial markets and
� supply of, demand for, and price of methanol, methanol
derivatives, natural gas, oil and oil derivatives,
� production rates of our facilities in accordance with plan,
� success of natural gas exploration in southern Chile and
New Zealand leading to increased natural gas supply
available for our plants in Chile and New Zealand on
commercially acceptable terms,
� receipt or issuance of third-party consents or approvals,
including, without limitation, governmental approvals
related to natural gas exploration rights or the
establishment of new fuel blending standards,
� operating costs, including natural gas feedstock and
logistics costs, capital costs, tax rates, cash flows,
foreign exchange rates and interest rates, in accordance
with plan,
� completion date and cost of our methanol project in Egypt,
� availability of committed credit facilities and other financing,
� availability of future natural gas supply on commercially
acceptable terms in Chile, Trinidad, New Zealand, Canada
and Egypt,
� global and regional economic activity (including industrial
production levels),
� absence of a material negative impact from major natural
disasters or global pandemics,
� absence of a material negative impact from changes in
laws, regulations or standards,
� the renewal of committed credit facilities and other
financing upon the expiry thereof,
� the legal opinions received in connection with ongoing
legal proceedings and
� performance of contractual obligations by customers,
suppliers and other third parties.
� conditions in the methanol and other industries,
including fluctuations in the supply of, demand for and
price of methanol and its derivatives, including demand
for methanol for energy uses,
� significant decrease in energy prices (including prices for
natural gas and coal feedstocks),
� the success of natural gas exploration and development
activities in southern Chile, New Zealand and Canada,
� availability of future natural gas supply on commercially
acceptable terms in Chile, Trinidad, New Zealand and
Egypt,
� the timing of the start-up and the cost to complete our
new methanol project in Egypt,
� the ability to successfully carry out corporate initiatives
and strategies,
� unexpected technical issues with our production facilities,
� actions of competitors and suppliers,
� actions of governments and governmental authorities,
including implementation of policies or other measures
by the Chinese government, the United States
government or other governments that could impact the
demand for methanol or its derivatives, or the failure
to obtain governmental approvals related to natural gas
exploration rights in southern Chile,
� changes in laws or regulations,
� import or export restrictions, anti-dumping measures,
increases in duties, taxes and government royalties and
other actions by governments that may adversely affect
our operations,
� worldwide economic conditions and conditions in the
global financial markets and
� other risks described in our 2009 MD&A.
48 METHANEX Annual Report 2009 Management’s Discussion and Analysis
In addition to the foregoing risk factors, the current uncertain economic environment has added additional risks and
uncertainties, including changes in capital markets and corresponding effects on the Company’s investments, our ability to
access existing or future credit and defaults by customers, suppliers or insurers.
Having in mind these and other factors, investors and other readers are cautioned not to place undue reliance on forward-
looking statements. They are not a substitute for the exercise of one’s own due diligence and judgment. The outcomes
anticipated in forward-looking statements may not occur and we do not undertake to update forward-looking statements
except as required by applicable securities laws.
Consolidated Financial Statements Annual Report 2009 METHANEX 49
The consolidated financial statements and all financial information contained in the annual report are the responsibility of
management. The consolidated financial statements have been prepared in accordance with Canadian generally accepted
accounting principles and, where appropriate, have incorporated estimates based on the best judgment of management.
Management is responsible for establishing and maintaining adequate internal control over financial reporting. Under the
supervision and with the participation of our management, including our Chief Executive Officer and Chief Financial Officer,
we conducted an evaluation of the effectiveness of our internal control over financial reporting based on the internal control
framework set out in Internal Control—Integrated Framework issued by the Committee of Sponsoring Organizations of the
Treadway Commission. Based on our evaluation, our management concluded that our internal control over financial reporting
was effective as of December 31, 2009.
The Board of Directors is responsible for ensuring that management fulfills its responsibilities for financial reporting and
internal control, and is responsible for reviewing and approving the consolidated financial statements. The Board carries out
this responsibility principally through the Audit, Finance and Risk Committee (the Committee).
The Committee consists of five non-management directors, all of whom are independent as defined by the applicable rules
in Canada and the United States. The Committee is appointed by the Board to assist the Board in fulfilling its oversight
responsibility relating to: the integrity of the Company’s financial statements, news releases and securities filings; the
financial reporting process; the systems of internal accounting and financial controls; the professional qualifications and
independence of the external auditor; the performance of the external auditors; risk management processes; financing plans;
pension plans; and the Company’s compliance with ethics policies and legal and regulatory requirements.
The Committee meets regularly with management and the Company’s auditors, KPMG LLP, Chartered Accountants, to
discuss internal controls and significant accounting and financial reporting issues. KPMG has full and unrestricted access to
the Committee. KPMG audited the consolidated financial statements and the effectiveness of internal controls over financial
reporting. Their opinions are included in the annual report.
A. Terence Poole Bruce Aitken Ian Cameron
Chairman of the Audit, Finance and President and Senior Vice President, Finance and
Risk Committee Chief Executive Officer Chief Financial Officer
March 5, 2010
Responsibility for Financial Reporting

50 METHANEX Annual Report 2009 Consolidated Financial Statements
To the Shareholders and Board of Directors of Methanex Corporation
We have audited the accompanying consolidated balance sheets of Methanex Corporation (“the Company”) as at December
31, 2009 and 2008 and the related consolidated statements of income, shareholders’ equity, comprehensive income (loss)
and cash flows for the years then ended. These financial statements are the responsibility of the Company’s management.
Our responsibility is to express an opinion on these financial statements based on our audits.
We conducted our audits in accordance with Canadian generally accepted auditing standards and the standards of the Public
Company Accounting Oversight Board (United States). Those standards require that we plan and perform an audit to obtain
reasonable assurance whether the financial statements are free of material misstatement. An audit includes examining, on
a test basis, evidence supporting the amounts and disclosures in the financial statements. An audit also includes assessing
the accounting principles used and significant estimates made by management, as well as evaluating the overall financial
statement presentation.
In our opinion, the consolidated financial statements referred to above present fairly, in all material respects, the financial
position of the Company as at December 31, 2009 and 2008 and the results of its operations and its cash flows of the years
then ended, in accordance with Canadian generally accepted accounting principles.
We also have audited, in accordance with the standards of the Public Company Accounting Oversight Board (United States),
the Company’s internal control over financial reporting as of December 31, 2009, based on the criteria established in Internal
Control—Integrated Framework issued by the Committee of Sponsoring Organizations of the Treadway Commission (COSO),
and our report dated March 5, 2010, expressed an unqualified opinion on the effectiveness of the Company’s internal control
over financial reporting.
Chartered Accountants
Vancouver, Canada
March 5, 2010
Report of Independent Registered Public Accounting Firm

Consolidated Financial Statements Annual Report 2009 METHANEX 51
To the Shareholders and Board of Directors of Methanex Corporation
We have audited Methanex Corporation’s (“the Company”) internal control over financial reporting as of December 31,
2009, based on the criteria established in Internal Control—Integrated Framework issued by the Committee of Sponsoring
Organizations of the Treadway Commission (COSO). The Company’s management is responsible for maintaining effective
internal control over financial reporting and for its assessment of the effectiveness of internal control over financial reporting,
included in the section entitled “Management’s Annual Report on Internal Controls over Financial Reporting” included in the
accompanying Management’s Discussion and Analysis. Our responsibility is to express an opinion on the Company’s internal
control over financial reporting based on our audit.
We conducted our audit in accordance with the standards of the Public Company Accounting Oversight Board (United
States). Those standards require that we plan and perform the audit to obtain reasonable assurance about whether effective
internal control over financial reporting was maintained in all material respects. Our audit included obtaining an understanding
of internal control over financial reporting, assessing the risk that a material weakness exists, and testing and evaluating the
design and operating effectiveness of internal control based on the assessed risk. Our audit also included performing such
other procedures as we considered necessary in the circumstances. We believe that our audit provides a reasonable basis for
our opinion.
A company’s internal control over financial reporting is a process designed to provide reasonable assurance regarding the
reliability of financial reporting and the preparation of financial statements for external purposes in accordance with generally
accepted accounting principles. A company’s internal control over financial reporting includes those policies and procedures
that (1) pertain to the maintenance of records that, in reasonable detail, accurately and fairly reflect the transactions and
dispositions of the assets of the company; (2) provide reasonable assurance that transactions are recorded as necessary to
permit preparation of financial statements in accordance with generally accepted accounting principles, and that receipts and
expenditures of the company are being made only in accordance with authorizations of management and directors of the
company; and (3) provide reasonable assurance regarding prevention or timely detection of unauthorized acquisition, use, or
disposition of the company’s assets that could have a material effect on the financial statements.
Because of its inherent limitations, internal control over financial reporting may not prevent or detect misstatements. Also,
projections of any evaluation of effectiveness to future periods are subject to the risk that controls may become inadequate
because of changes in conditions, or that the degree of compliance with the policies or procedures may deteriorate.
In our opinion, the Company maintained, in all material respects, effective internal control over financial reporting as of
December 31, 2009 based on the criteria established in Internal Control—Integrated Framework issued by the Committee of
Sponsoring Organizations of the Treadway Commission (COSO).
We also have audited, in accordance with Canadian generally accepted auditing standards and the standards of the Public
Company Accounting Oversight Board (United States), the consolidated balance sheets of the Company as at December
31, 2009 and 2008, and the related consolidated statements of income, shareholders’ equity, comprehensive income (loss)
and cash flows for the years then ended, and our report dated March 5, 2010, expressed an unqualified opinion on those
consolidated financial statements.
Chartered Accountants
Vancouver, Canada
March 5, 2010
Report of Independent Registered Public Accounting Firm

52 METHANEX Annual Report 2009 Consolidated Financial Statements
Consolidated Balance Sheets(thousands of US dollars, except number of common shares)
As at December 31 2009 2008
ASSETS (As adjusted –
Current assets: note 1(o))
Cash and cash equivalents $ 169,788 $ 328,430
Receivables (note 2) 257,418 213,419
Inventories 171,554 177,637
Prepaid expenses 23,893 16,840
622,653 736,326
Property, plant and equipment (note 4) 2,183,787 1,899,059
Other assets (note 6) 116,977 163,642
$ 2,923,417 $ 2,799,027
lIABIlITIES AND SHAREHOlDERS’ EQUITy
Current liabilities:
Accounts payable and accrued liabilities $ 232,924 $ 235,369
Current maturities on long-term debt (note 7) 29,330 15,282
Current maturities on other long-term liabilities (note 8) 9,350 8,048
271,604 258,699
Long-term debt (note 7) 884,914 766,675
Other long-term liabilities (note 8) 97,185 97,441
Future income tax liabilities (note 12) 300,510 299,192
Non-controlling interest 133,118 88,604
Shareholders’ equity:
Capital stock
25,000,000 authorized preferred shares without nominal or par value
Unlimited authorization of common shares without nominal or par value
Issued and outstanding common shares at December 31, 2009
were 92,108,242 (2008 – 92,031,392) 427,792 427,265
Contributed surplus 27,007 22,669
Retained earnings 806,158 862,507
Accumulated other comprehensive loss (24,871) (24,025)
1,236,086 1,288,416
$ 2,923,417 $ 2,799,027
Commitments and contingencies (notes 12 and 18)See accompanying notes to consolidated financial statements.
Approved by the Board:
A. Terence Poole Bruce AitkenDirector Director
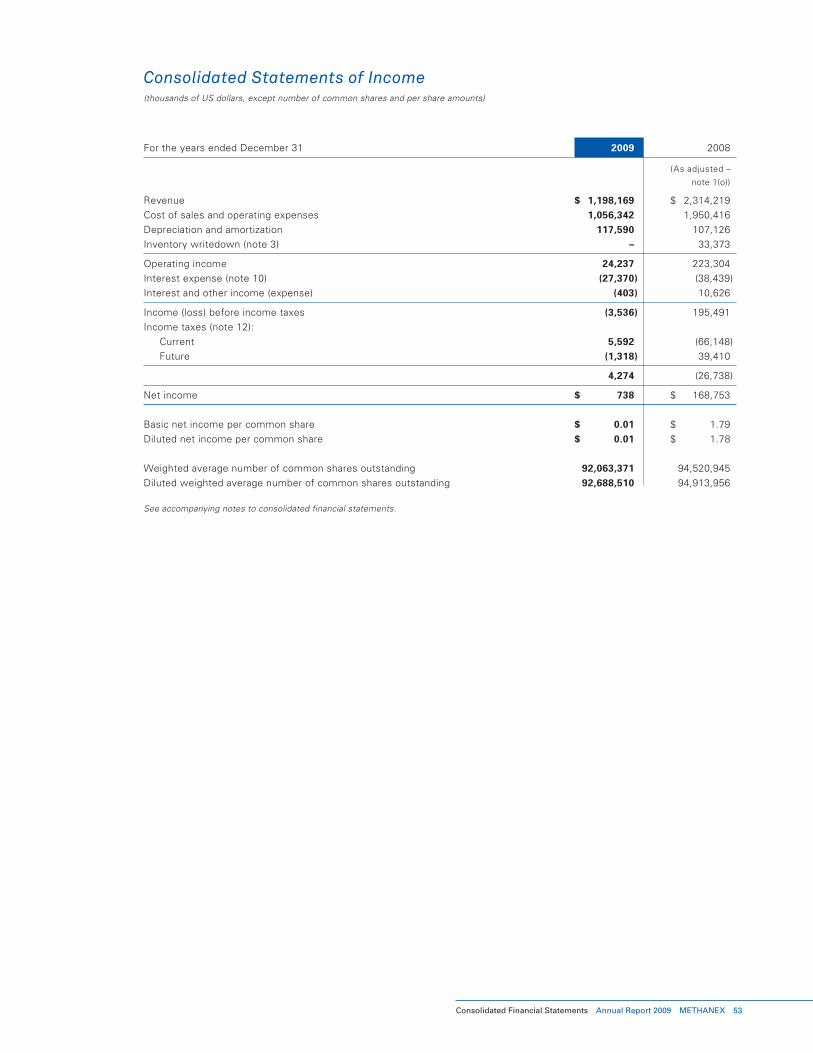
Consolidated Financial Statements Annual Report 2009 METHANEX 53
Consolidated Statements of Income(thousands of US dollars, except number of common shares and per share amounts)
For the years ended December 31 2009 2008
(As adjusted –
note 1(o))
Revenue $ 1,198,169 $ 2,314,219
Cost of sales and operating expenses 1,056,342 1,950,416
Depreciation and amortization 117,590 107,126
Inventory writedown (note 3) – 33,373
Operating income 24,237 223,304
Interest expense (note 10) (27,370) (38,439)
Interest and other income (expense) (403) 10,626
Income (loss) before income taxes (3,536) 195,491
Income taxes (note 12):
Current 5,592 (66,148)
Future (1,318) 39,410
4,274 (26,738)
Net income $ 738 $ 168,753
Basic net income per common share $ 0.01 $ 1.79
Diluted net income per common share $ 0.01 $ 1.78
Weighted average number of common shares outstanding 92,063,371 94,520,945
Diluted weighted average number of common shares outstanding 92,688,510 94,913,956
See accompanying notes to consolidated financial statements.

54 METHANEX Annual Report 2009 Consolidated Financial Statements
Consolidated Statements of Shareholders’ Equity(thousands of US dollars, except number of common shares)
Accumulated
Number of Other Total
Common Capital Contributed Retained Comprehensive Shareholders’
Shares Stock Surplus Earnings Loss Equity
Balance, December 31, 2007
as previously reported 98,310,254 $ 451,640 $ 16,021 $ 876,348 $ (8,655) $ 1,335,354
Adjustments for retroactive
adoption of new
accounting policies:
Goodwill and intangibles
(note 1(o)) – – – (7,790) – (7,790)
Non-controlling interest
proportionate share (note 1(o)) – – – 1,858 3,462 5,320
Balance, December 31, 2007
as adjusted 98,310,254 451,640 16,021 870,416 (5,193) 1,332,884
Net income and other
comprehensive loss,
as previously reported – – – 172,298 (31,363) 140,935
Adjustments for retroactive
adoption of new
accounting policies:
Goodwill and intangibles
(note 1(o)) – – – (5,818) – (5,818)
Non-controlling interest
proportionate share (note 1(o)) – – – 2,273 12,531 14,804
Net income and other
comprehensive loss, as adjusted – – – 168,753 (18,832) 149,921
Compensation expense recorded
for stock options – – 8,225 – – 8,225
Issue of shares on exercise of
stock options 224,016 4,075 – – – 4,075
Reclassification of grant date fair
value on exercise of stock options – 1,577 (1,577) – – –
Payment for shares repurchased (6,502,878) (30,027) – (119,829) – (149,856)
Dividend payments – – – (56,833) – (56,833)
Balance, December 31, 2008 92,031,392 427,265 22,669 862,507 (24,025) 1,288,416
Net income – – – 738 – 738 Compensation expense
recorded for stock options – – 4,440 – – 4,440 Issue of shares on exercise
of stock options 76,850 425 – – – 425 Reclassification of grant date fair
value on exercise of stock options – 102 (102) – – – Dividend payments – – – (57,087) – (57,087)
Other comprehensive loss – – – – (846) (846)
Balance, December 31, 2009 92,108,242 $ 427,792 $ 27,007 $ 806,158 $ (24,871) $ 1,236,086
See accompanying notes to consolidated financial statements.
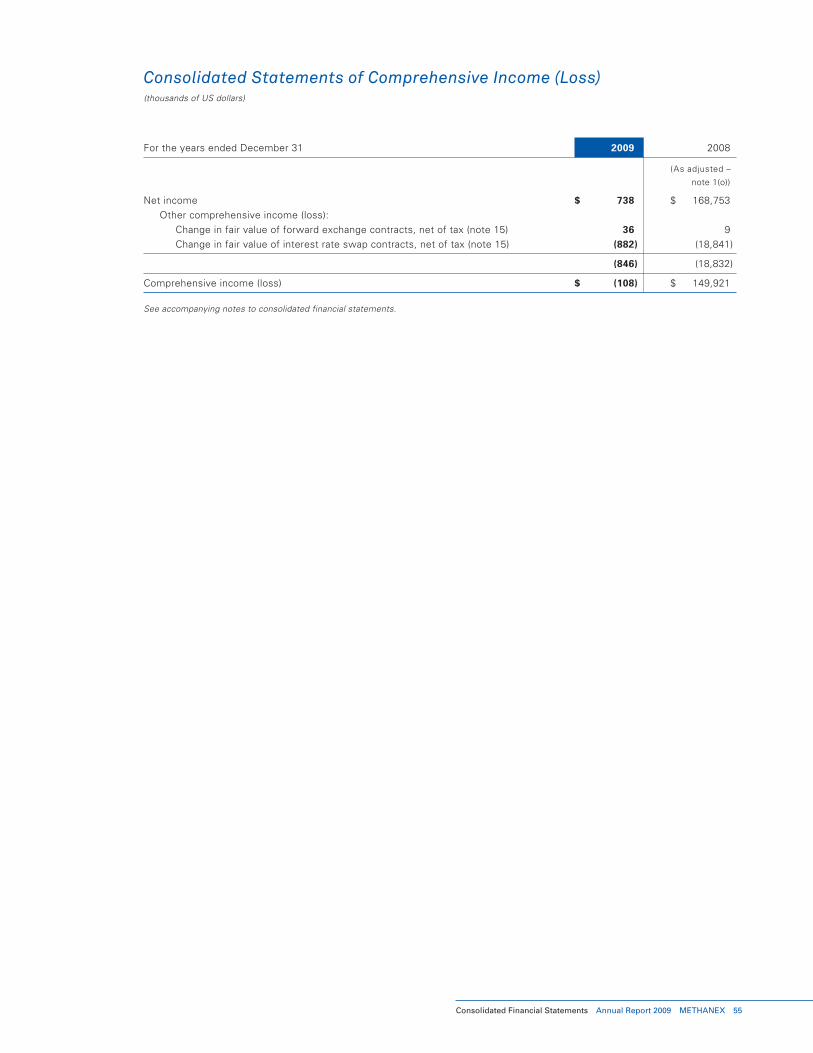
Consolidated Financial Statements Annual Report 2009 METHANEX 55
Consolidated Statements of Comprehensive Income (Loss)(thousands of US dollars)
For the years ended December 31 2009 2008
(As adjusted –
note 1(o))
Net income $ 738 $ 168,753
Other comprehensive income (loss):
Change in fair value of forward exchange contracts, net of tax (note 15) 36 9
Change in fair value of interest rate swap contracts, net of tax (note 15) (882) (18,841)
(846) (18,832)
Comprehensive income (loss) $ (108) $ 149,921
See accompanying notes to consolidated financial statements.

Consolidated Statements of Cash Flows(thousands of US dollars)
For the years ended December 31 2009 2008
(As adjusted –
CASH FlOwS FROM OPERATING ACTIvITIES note 1(o))
Net income $ 738 $ 168,753
Add (deduct) non-cash items:
Depreciation and amortization 117,590 107,126
Future income taxes 1,318 (39,410)
Stock-based compensation 12,527 2,811
Other 7,639 2,797
Other cash payments, including stock-based compensation (11,302) (7,565)
Cash flows from operating activities before undernoted 128,510 234,512
Changes in non-cash working capital (note 13) (18,253) 78,383
110,257 312,895
CASH FlOwS FROM FINANCING ACTIvITIES
Dividend payments (57,087) (56,833)
Payments for shares repurchased – (149,856)
Proceeds from limited recourse debt (note 7) 151,378 204,000
Equity contributions by non-controlling interest 45,103 65,198
Repayment of limited recourse debt (15,282) (15,282)
Proceeds on issue of shares on exercise of stock options 425 4,075
Financing fees (1,949) –
Repayment of other long-term liabilities (11,157) (5,990)
111,431 45,312
CASH FlOwS FROM INvESTING ACTIvITIES
Property, plant and equipment (60,906) (96,956)
Egypt plant under construction (261,646) (382,184)
Oil and gas assets (note 1(p)) (22,840) (41,781)
GeoPark financing, net of repayments (note 6) (9,285) (22,319)
Change in project debt reserve accounts 5,229 (1,820)
Other assets (2,454) 161
Changes in non-cash working capital related to investing activities (note 13) (28,428) 26,898
(380,330) (518,001)
Decrease in cash and cash equivalents (158,642) (159,794)
Cash and cash equivalents, beginning of year 328,430 488,224
Cash and cash equivalents, end of year $ 169,788 $ 328,430
SUPPlEMENTARy CASH FlOw INFORMATION
Interest paid $ 52,767 $ 47,284
Income taxes paid, net of amounts refunded $ 6,363 $ 78,591
See accompanying notes to consolidated financial statements.
56 METHANEX Annual Report 2009 Consolidated Financial Statements
Notes to Consolidated Financial Statements Annual Report 2009 METHANEX 57
Notes to Consolidated Financial Statements(Tabular dollar amounts are shown in thousands of US dollars, except where noted) Years ended December 31, 2009 and 2008
1. Significant accounting policies:
(a) Basis of presentation:
These consolidated financial statements are prepared in accordance with generally accepted accounting principles (GAAP) in
Canada. These accounting principles are different in some respects from those generally accepted in the United States and
the significant differences are described and reconciled in note 19.
These consolidated financial statements include the accounts of Methanex Corporation, its wholly owned subsidiaries,
less than wholly owned entities for which it has a controlling interest and its proportionate share of the accounts of jointly
controlled entities (collectively, the Company). For less than wholly owned entities for which the Company has a controlling
interest, a non-controlling interest is included in the Company’s financial statements and represents the non-controlling
shareholders’ interest in the net assets of the entity. In accordance with the Accounting Guideline No. 15, Consolidation of
Variable Interest Entities, the Company also consolidates any variable interest entities of which it is the primary beneficiary,
as defined. When the Company does not have a controlling interest in an entity, but exerts a significant influence over the
entity, the Company applies the equity method of accounting. All significant intercompany transactions and balances have
been eliminated. Preparation of these consolidated financial statements requires estimates and assumptions that affect
amounts reported and disclosed in the financial statements and related notes. Policies requiring significant estimates are
described below. Actual results could differ from those estimates.
(b) Reporting currency and foreign currency translation:
The majority of the Company’s business is transacted in US dollars and, accordingly, these consolidated financial statements
have been measured and expressed in that currency. The Company translates foreign currency denominated monetary items
at the rates of exchange prevailing at the balance sheet dates and revenues and expenditures at average rates of exchange
during the year. Foreign exchange gains and losses are included in earnings.
(c) Cash equivalents:
Cash equivalents include securities with maturities of three months or less when purchased.
(d) Receivables:
The Company provides credit to its customers in the normal course of business. The Company performs ongoing credit
evaluations of its customers and maintains reserves for potential credit losses. The Company records an allowance for
doubtful accounts or writes down the receivable to estimated net realizable value if not collectible in full. Credit losses have
historically been within the range of management’s expectations.
(e) Inventories:
Inventories are valued at the lower of cost and estimated net realizable value. Cost is determined by the first-in first-out basis
and includes direct purchase costs, cost of production and transportation.
(f) Property, plant and equipment:
Property, plant and equipment are recorded at cost. Interest incurred during construction is capitalized to the cost of the
asset. Incentive tax credits related to property, plant and equipment are recorded as a reduction in the cost of property, plant
and equipment. The benefit of incentive tax credits is recognized in earnings through lower depreciation in future periods.
Depreciation and amortization is generally provided on a straight-line basis, or in the case of the New Zealand operations, on
a unit-of-natural gas consumption basis, at rates calculated to amortize the cost of property, plant and equipment from the
commencement of commercial operations over their estimated useful lives to estimated residual value.
Routine repairs and maintenance costs are expensed as incurred. At regular intervals, the Company conducts a planned
shutdown and inspection (turnaround) at its plants to perform major maintenance and replacements of catalyst. Costs
associated with these shutdowns are capitalized and amortized over the period until the next planned turnaround.
The Company periodically reviews the carrying value of property, plant and equipment for impairment when circumstances
indicate an asset’s value may not be recoverable. If it is determined that an asset’s undiscounted cash flows are less than its
carrying value, the asset is written down to its fair value.
58 METHANEX Annual Report 2009 Notes to Consolidated Financial Statements
1. Significant accounting policies: (continued)
(g) Other assets:
Marketing and production rights are capitalized to other assets and amortized to depreciation and amortization expense on an
appropriate basis to charge the cost of the assets against earnings.
Financing fees related to undrawn credit facilities are capitalized to other assets and amortized to interest expense over
the term of the credit facility. Financing fees related to project debt facilities are capitalized to other assets until the project
debt is fully drawn. Once the project debt is fully drawn, these fees are reclassified to long-term debt net of financing fees
and amortized to interest expense over the repayment term. Other long-term debt is presented net of financing fees and
amortized to interest expense over the repayment term on an effective interest basis.
(h) Asset retirement obligations:
The Company recognizes asset retirement obligations for those sites where a reasonably definitive estimate of the fair value
of the obligation can be determined. The Company estimates fair value by determining the current market cost required
to settle the asset retirement obligation and adjusts for inflation through to the expected date of the expenditures and
discounts this amount back to the date when the obligation was originally incurred. As the liability is initially recorded on a
discounted basis, it is increased each period until the estimated date of settlement. The resulting expense is referred to as
accretion expense and is included in cost of sales and operating expenses. Asset retirement obligations are not recognized
with respect to assets with indefinite or indeterminate lives as the fair value of the asset retirement obligations cannot be
reasonably estimated due to uncertainties regarding the timing of expenditures. The Company reviews asset retirement
obligations and adjusts the liability as necessary to reflect changes in the estimated future cash flows and timing underlying
the fair value measurement.
(i) Employee future benefits:
Accrued pension benefit obligations and related expenses for defined benefit pension plans are determined using current
market bond yields to measure the accrued pension benefit obligation. Adjustments to the accrued benefit obligation and
the fair value of the plan assets that arise from changes in actuarial assumptions, experience gains and losses and plan
amendments that exceed 10% of the greater of the accrued benefit obligation and the fair value of the plan assets are
amortized to earnings on a straight-line basis over the estimated average remaining service lifetime of the employee group.
The cost for defined contribution benefit plans is expensed as earned by the employees.
(j) Net income per common share:
The Company calculates basic net income per common share by dividing net income by the weighted average number of
common shares outstanding and calculates diluted net income per common share under the treasury stock method. Under
the treasury stock method, the weighted average number of common shares outstanding for the calculation of diluted net
income per share assumes that the total of the proceeds to be received on the exercise of dilutive stock options and the
unrecognized portion of the grant-date fair value of stock options is applied to repurchase common shares at the average
market price for the period. A stock option is dilutive only when the average market price of common shares during the
period exceeds the exercise price of the stock option.
A reconciliation of the weighted average number of common shares outstanding is as follows:
For the years ended December 31 2009 2008
Denominator for basic net income per common share 92,063,371 94,520,945
Effect of dilutive stock options 625,139 393,011
Denominator for diluted net income per common share 92,688,510 94,913,956
Notes to Consolidated Financial Statements Annual Report 2009 METHANEX 59
1. Significant accounting policies: (continued)
(k) Stock-based compensation:
The Company grants stock-based awards as an element of compensation. Stock-based awards granted by the Company can
include stock options, deferred share units, restricted share units or performance share units.
For stock options granted by the Company, the cost of the service received as consideration is measured based on an
estimate of the fair value at the date of grant. The grant-date fair value is recognized as compensation expense over the
related service period with a corresponding increase in contributed surplus. On the exercise of stock options, consideration
received, together with the compensation expense previously recorded to contributed surplus, is credited to share capital.
The Company uses the Black-Scholes option pricing model to estimate the fair value of each stock option at the date of grant.
Deferred, restricted and performance share units are grants of notional common shares that are redeemable for cash based
on the market value of the Company’s common shares and are non-dilutive to shareholders. Performance share units have
an additional feature where the ultimate number of units that vest will be determined by the Company’s total shareholder
return in relation to a predetermined target over the period to vesting. The number of units that will ultimately vest will be in
the range of 50% to 120% of the original grant. The fair value of deferred, restricted and performance share units is initially
measured at the grant date based on the market value of the Company’s common shares and is recognized in earnings over
the related service period. Changes in fair value are recognized in earnings for the proportion of the service that has been
rendered at each reporting date.
Additional information related to the stock option plan, the assumptions used in the Black-Scholes option pricing model and
the deferred, restricted and performance share units of the Company are described in note 9.
(l) Revenue recognition:
Revenue is recognized based on individual contract terms when the title and risk of loss to the product transfers to
the customer, which usually occurs at the time shipment is made. Revenue is recognized at the time of delivery to the
customer’s location if the Company retains title and risk of loss during shipment. For methanol shipped on a consignment
basis, revenue is recognized when the customer consumes the methanol. For methanol sold on a commission basis, the
commission income is included in revenue when earned.
(m) Financial instruments:
Financial instruments under Canadian GAAP must be classified into one of five categories and, depending on the category,
will either be measured at amortized cost or fair value. Held-to-maturity investments, loans and receivables and other
financial liabilities are measured at amortized cost. Held for trading financial assets and liabilities and available-for-sale
financial assets are measured on the balance sheet at fair value. Changes in the fair value of held-for-trading financial assets
and liabilities are recognized in earnings and changes in the fair value of available-for-sale financial assets are recorded in
other comprehensive income until the investment is derecognized or impaired at which time the amounts would be recorded
in earnings. The Company classifies its cash and cash equivalents as held-for-trading. Accounts receivable are classified as
loans and receivables. Accounts payable and accrued liabilities, long-term debt, net of financing costs, and other long-term
liabilities are classified as other financial liabilities.
Under these standards, derivative financial instruments, including embedded derivatives, are classified as held for trading and
are recorded on the balance sheet at fair value unless exempted. The Company records all changes in fair value of derivative
financial instruments in earnings unless the instruments are designated as cash flow hedges. The Company enters into and
designates as cash flow hedges certain forward exchange sales contracts to hedge foreign exchange exposure on anticipated
sales. The Company also enters into and designates as cash flow hedges certain interest rate swap contracts to hedge
variable interest rate exposure on its limited recourse debt. The Company assesses at inception and on an ongoing basis
whether the hedges are and continue to be effective in offsetting changes in the cash flows of the hedged transactions. The
effective portion of changes in the fair value of these hedging instruments is recognized in other comprehensive income. Any
gain or loss in fair value relating to the ineffective portion is recognized immediately in earnings.
60 METHANEX Annual Report 2009 Notes to Consolidated Financial Statements
1. Significant accounting policies: (continued)
(n) Income taxes:
Future income taxes are accounted for using the asset and liability method. The asset and liability method requires that
income taxes reflect the expected future tax consequences of temporary differences between the carrying amounts of
assets and liabilities and their tax bases. Future income tax assets and liabilities are determined for each temporary difference
based on currently enacted or substantially enacted tax rates that are expected to be in effect when the underlying items
of income or expense are expected to be realized. The effect of a change in tax rates or tax legislation is recognized in the
period of substantive enactment. Future tax benefits, such as non-capital loss carryforwards, are recognized to the extent
that realization of such benefits is considered to be more likely than not.
The Company accrues for taxes that will be incurred upon distributions from its subsidiaries when it is probable that the
earnings will be repatriated.
The determination of income taxes requires the use of judgment and estimates. If certain judgments or estimates prove
to be inaccurate, or if certain tax rates or laws change, the Company’s results of operations and financial position could be
materially impacted.
(o) Intangible assets:
On January 1, 2009, the Company adopted CICA Handbook Section 3064, Goodwill and Intangible Assets. This new
accounting standard replaces Section 3062, Goodwill and Other Intangible Assets. Section 3064 expands on the standards
for recognition, measurement and disclosure of intangible assets. The impact of the retroactive adoption of this standard
on the Company’s consolidated balance sheet at January 1, 2009 is approximately $13 million recorded as a reduction to
opening retained earnings and property, plant and equipment. The amount relates to certain pre-operating expenditures
that have been capitalized to property, plant and equipment at December 31, 2008 that would have been required to be
expensed under this new standard. The impact for the year ended December 31, 2009 was an increase to selling, general
and administrative expenses of approximately $3.8 million (2008 – $3.5 million).
As a portion of these pre-operating expenditures were incurred in a non-wholly owned subsidiary, the Company has also
adjusted the opening non-controlling interest (NCI) and retained earnings balances at December 31, 2008 for the NCI’s
proportionate share of approximately $4 million. In addition, the Company has retrospectively reclassified approximately
$16 million from accumulated other comprehensive loss to NCI, representing the NCI’s share of accumulated other
comprehensive loss to December 31, 2008.
(p) Oil and natural gas exploration and development expenditure:
On August 24, 2009, the Company received final government approval of the agreement signed on May 5, 2008 with Empresa
Nacional del Petroleo (ENAP), the Chilean state-owned oil and gas company. The agreement with ENAP is to accelerate gas
exploration and development in the Dorado Riquelme exploration block in southern Chile and supply new Chilean-sourced natural
gas to the Company’s production facilities in Chile. Under the arrangement the Company funds a 50% participation in the block.
Upon receiving final government approval of the agreement, the Company adopted the CICA guideline on full cost accounting in
the oil and gas industry to account for the investment in the Dorado Riquelme block. Under this method, all costs, including internal
costs and asset retirement costs, directly associated with the acquisition of, the exploration for, and the development of natural gas
reserves are capitalized. Costs are then depleted and amortized using the unit-of-production method based on estimated proved
reserves. Capitalized costs subject to depletion include estimated future costs to be incurred in developing proved reserves. Costs
of major development projects and costs of acquiring and evaluating significant unproved properties are excluded from the costs
subject to depletion until it is determined whether or not proved reserves are attributable to the properties or impairment has
occurred. Costs that have been impaired are included in the costs subject to depletion and amortization.
Under the CICA guideline on full cost accounting, an impairment assessment (“ceiling test”) is performed on an annual basis
for all oil and gas assets. An impairment loss is recognized in earnings when the carrying amount is not recoverable and the
carrying amount exceeds its fair value. The carrying amount is not recoverable if the carrying amount exceeds the sum of the
undiscounted cash flows from proved reserves. If the sum of the cash flows is less than the carrying amount, the
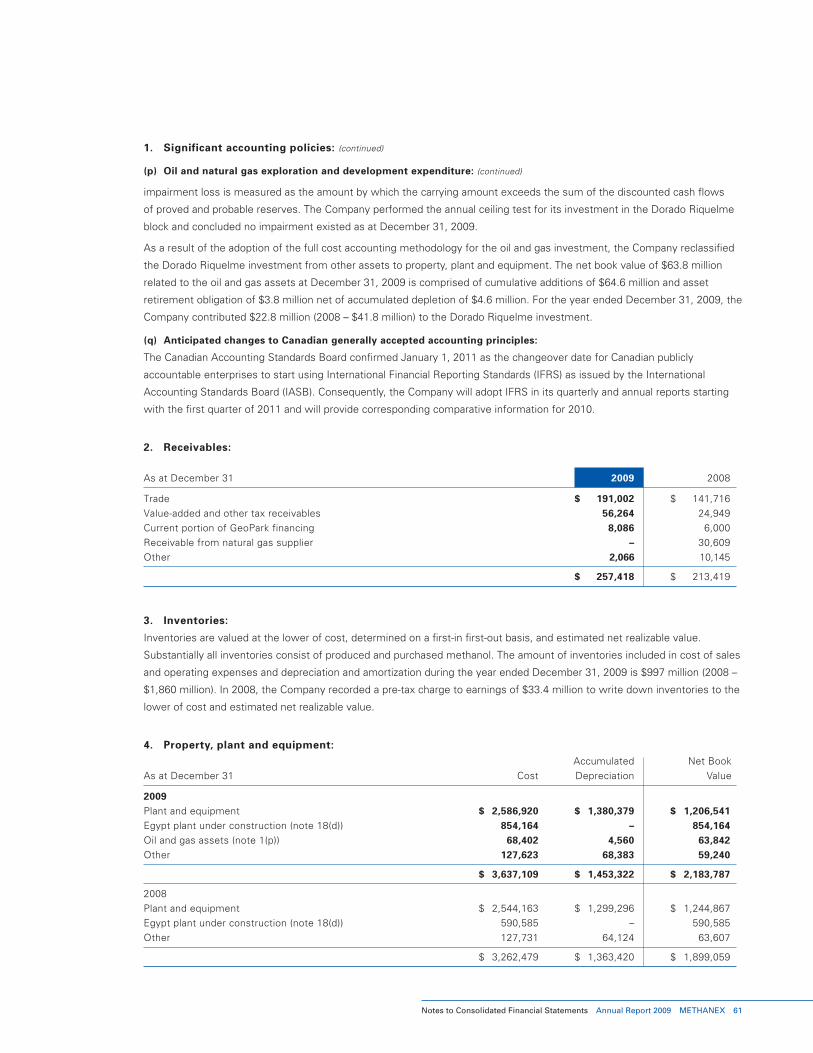
Notes to Consolidated Financial Statements Annual Report 2009 METHANEX 61
1. Significant accounting policies: (continued)
(p) Oil and natural gas exploration and development expenditure: (continued)
impairment loss is measured as the amount by which the carrying amount exceeds the sum of the discounted cash flows
of proved and probable reserves. The Company performed the annual ceiling test for its investment in the Dorado Riquelme
block and concluded no impairment existed as at December 31, 2009.
As a result of the adoption of the full cost accounting methodology for the oil and gas investment, the Company reclassified
the Dorado Riquelme investment from other assets to property, plant and equipment. The net book value of $63.8 million
related to the oil and gas assets at December 31, 2009 is comprised of cumulative additions of $64.6 million and asset
retirement obligation of $3.8 million net of accumulated depletion of $4.6 million. For the year ended December 31, 2009, the
Company contributed $22.8 million (2008 – $41.8 million) to the Dorado Riquelme investment.
(q) Anticipated changes to Canadian generally accepted accounting principles:
The Canadian Accounting Standards Board confirmed January 1, 2011 as the changeover date for Canadian publicly
accountable enterprises to start using International Financial Reporting Standards (IFRS) as issued by the International
Accounting Standards Board (IASB). Consequently, the Company will adopt IFRS in its quarterly and annual reports starting
with the first quarter of 2011 and will provide corresponding comparative information for 2010.
2. Receivables:
As at December 31 2009 2008
Trade $ 191,002 $ 141,716
Value-added and other tax receivables 56,264 24,949
Current portion of GeoPark financing 8,086 6,000
Receivable from natural gas supplier – 30,609
Other 2,066 10,145
$ 257,418 $ 213,419
3. Inventories:
Inventories are valued at the lower of cost, determined on a first-in first-out basis, and estimated net realizable value.
Substantially all inventories consist of produced and purchased methanol. The amount of inventories included in cost of sales
and operating expenses and depreciation and amortization during the year ended December 31, 2009 is $997 million (2008 –
$1,860 million). In 2008, the Company recorded a pre-tax charge to earnings of $33.4 million to write down inventories to the
lower of cost and estimated net realizable value.
4. Property, plant and equipment: Accumulated Net Book
As at December 31 Cost Depreciation Value
2009
Plant and equipment $ 2,586,920 $ 1,380,379 $ 1,206,541Egypt plant under construction (note 18(d)) 854,164 – 854,164Oil and gas assets (note 1(p)) 68,402 4,560 63,842Other 127,623 68,383 59,240
$ 3,637,109 $ 1,453,322 $ 2,183,787
2008
Plant and equipment $ 2,544,163 $ 1,299,296 $ 1,244,867
Egypt plant under construction (note 18(d)) 590,585 – 590,585
Other 127,731 64,124 63,607
$ 3,262,479 $ 1,363,420 $ 1,899,059

62 METHANEX Annual Report 2009 Notes to Consolidated Financial Statements
5. Interest in Atlas joint venture:
The Company has a 63.1% joint venture interest in Atlas Methanol Company (Atlas). Atlas owns a 1.7 million tonne per
year methanol production facility in Trinidad. Included in the consolidated financial statements are the following amounts
representing the Company’s proportionate interest in Atlas:
Consolidated Balance Sheets as at December 31 2009 2008
Cash and cash equivalents $ 8,252 $ 35,749
Other current assets 72,667 57,374
Property, plant and equipment 240,290 249,609
Other assets 12,920 18,149
Accounts payable and accrued liabilities 22,380 19,927
Long-term debt, including current maturities (note 7) 93,155 106,592
Future income tax liabilities (note 12) 18,660 17,942
Consolidated Statements of Income for the years ended December 31 2009 2008
Revenue $ 194,314 $ 286,906
Expenses 158,611 271,493
Income before income taxes 35,703 15,413
Income tax expense (6,127) (4,488)
Net income $ 29,576 $ 10,925
Consolidated Statements of Cash Flows for the years ended December 31 2009 2008
Cash inflows from operating activities $ 36,166 $ 44,861
Cash outflows from financing activities (14,032) (15,852)
Cash outflows from investing activities (3,568) (2,977)
6. Other assets:
As at December 31 2009 2008
Marketing and production rights, net of accumulated amortization $ 19,099 $ 27,080
Restricted cash for debt service reserve account 12,920 18,149
Deferred financing costs, net of accumulated amortization 9,725 15,281
Defined benefit pension plans (note 17) 16,003 16,456
GeoPark financing 37,969 30,616
Dorado Riquelme investment – 42,123
Other 21,261 13,937
$ 116,977 $ 163,642
For the year ended December 31, 2009, amortization of marketing and production rights included in depreciation and
amortization was $8.0 million (2008 – $7.6 million) and amortization of deferred financing fees included in interest expense
was $0.6 million (2008 – $1.1 million).
During 2007, the Company entered into a financing agreement with GeoPark Chile Limited (GeoPark) under which the Company
provided $40 million (of which $10 million has been repaid at December 31, 2009) in financing to support and accelerate GeoPark’s
natural gas exploration and development activities in the Fell block in southern Chile. GeoPark agreed to supply the Company with
all natural gas sourced from the Fell block under a ten-year exclusive supply arrangement. In October 2009 the Company signed
an agreement to provide a further $18 million in financing to support GeoPark’s natural gas exploration and development activities
in southern Chile of which $15.0 million was provided to GeoPark in 2009. As at December 31, 2009, the outstanding balance is
$46.1 million of which $8.1 million, representing the current portion, has been recorded in accounts receivable.
As a result of the adoption of the full cost accounting methodology in 2009 for the oil and gas investment, the Company
reclassified the Dorado Riquelme investment from other assets to property, plant and equipment – refer to note 1 (p).
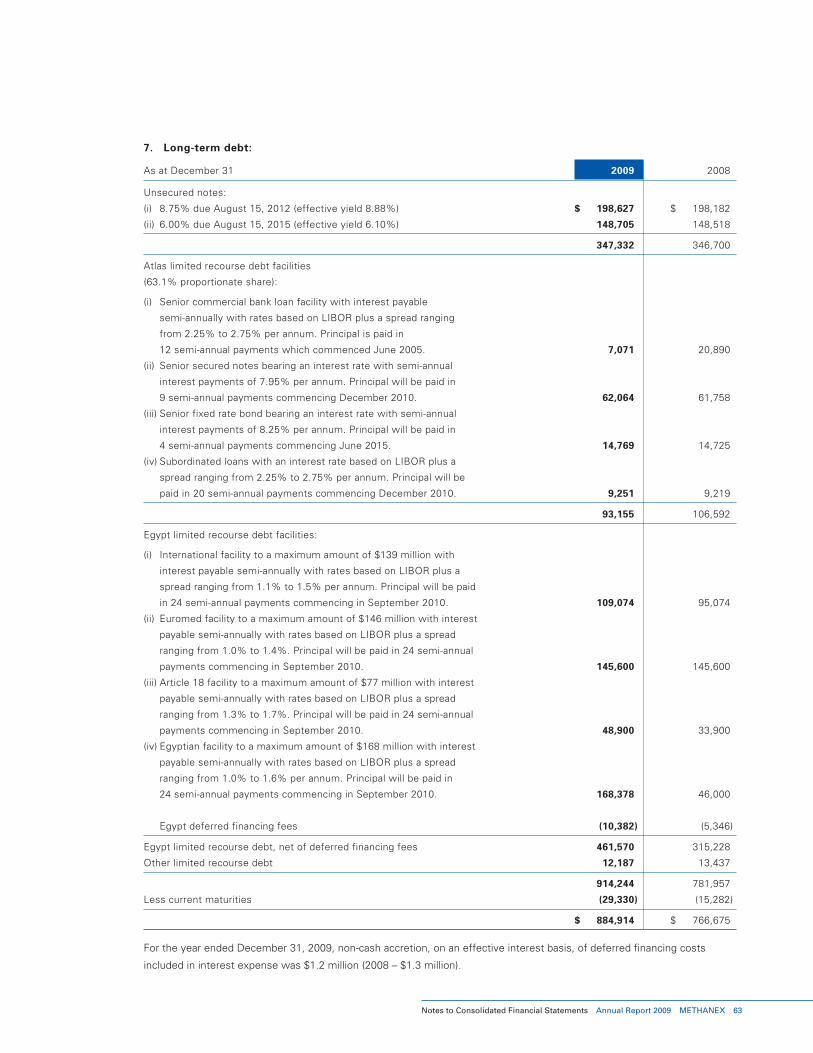
Notes to Consolidated Financial Statements Annual Report 2009 METHANEX 63
7. long-term debt:
As at December 31 2009 2008
Unsecured notes:
(i) 8.75% due August 15, 2012 (effective yield 8.88%) $ 198,627 $ 198,182
(ii) 6.00% due August 15, 2015 (effective yield 6.10%) 148,705 148,518
347,332 346,700
Atlas limited recourse debt facilities
(63.1% proportionate share):
(i) Senior commercial bank loan facility with interest payable
semi-annually with rates based on LIBOR plus a spread ranging
from 2.25% to 2.75% per annum. Principal is paid in
12 semi-annual payments which commenced June 2005. 7,071 20,890
(ii) Senior secured notes bearing an interest rate with semi-annual
interest payments of 7.95% per annum. Principal will be paid in
9 semi-annual payments commencing December 2010. 62,064 61,758
(iii) Senior fixed rate bond bearing an interest rate with semi-annual
interest payments of 8.25% per annum. Principal will be paid in
4 semi-annual payments commencing June 2015. 14,769 14,725
(iv) Subordinated loans with an interest rate based on LIBOR plus a
spread ranging from 2.25% to 2.75% per annum. Principal will be
paid in 20 semi-annual payments commencing December 2010. 9,251 9,219
93,155 106,592
Egypt limited recourse debt facilities:
(i) International facility to a maximum amount of $139 million with
interest payable semi-annually with rates based on LIBOR plus a
spread ranging from 1.1% to 1.5% per annum. Principal will be paid
in 24 semi-annual payments commencing in September 2010. 109,074 95,074
(ii) Euromed facility to a maximum amount of $146 million with interest
payable semi-annually with rates based on LIBOR plus a spread
ranging from 1.0% to 1.4%. Principal will be paid in 24 semi-annual
payments commencing in September 2010. 145,600 145,600
(iii) Article 18 facility to a maximum amount of $77 million with interest
payable semi-annually with rates based on LIBOR plus a spread
ranging from 1.3% to 1.7%. Principal will be paid in 24 semi-annual
payments commencing in September 2010. 48,900 33,900
(iv) Egyptian facility to a maximum amount of $168 million with interest
payable semi-annually with rates based on LIBOR plus a spread
ranging from 1.0% to 1.6% per annum. Principal will be paid in
24 semi-annual payments commencing in September 2010. 168,378 46,000
Egypt deferred financing fees (10,382) (5,346)
Egypt limited recourse debt, net of deferred financing fees 461,570 315,228
Other limited recourse debt 12,187 13,437
914,244 781,957
Less current maturities (29,330) (15,282)
$ 884,914 $ 766,675
For the year ended December 31, 2009, non-cash accretion, on an effective interest basis, of deferred financing costs
included in interest expense was $1.2 million (2008 – $1.3 million).
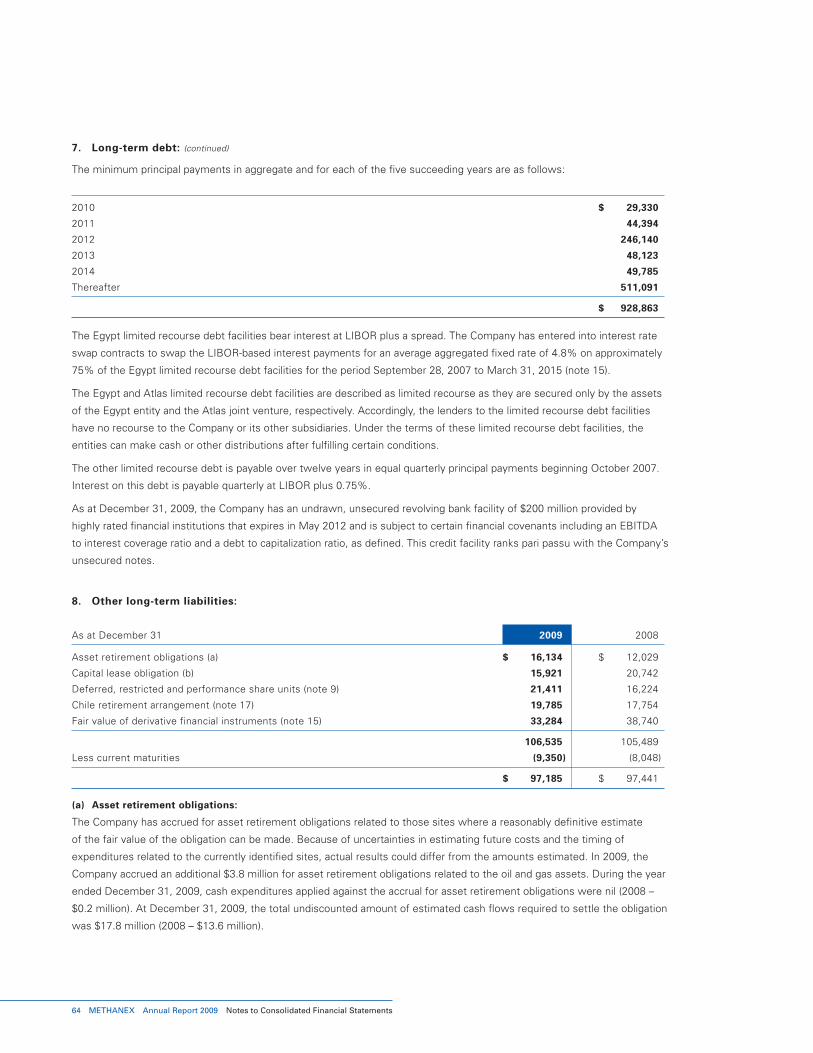
64 METHANEX Annual Report 2009 Notes to Consolidated Financial Statements
7. long-term debt: (continued)
The minimum principal payments in aggregate and for each of the five succeeding years are as follows:
2010 $ 29,330
2011 44,394
2012 246,140
2013 48,123
2014 49,785
Thereafter 511,091
$ 928,863
The Egypt limited recourse debt facilities bear interest at LIBOR plus a spread. The Company has entered into interest rate
swap contracts to swap the LIBOR-based interest payments for an average aggregated fixed rate of 4.8% on approximately
75% of the Egypt limited recourse debt facilities for the period September 28, 2007 to March 31, 2015 (note 15).
The Egypt and Atlas limited recourse debt facilities are described as limited recourse as they are secured only by the assets
of the Egypt entity and the Atlas joint venture, respectively. Accordingly, the lenders to the limited recourse debt facilities
have no recourse to the Company or its other subsidiaries. Under the terms of these limited recourse debt facilities, the
entities can make cash or other distributions after fulfilling certain conditions.
The other limited recourse debt is payable over twelve years in equal quarterly principal payments beginning October 2007.
Interest on this debt is payable quarterly at LIBOR plus 0.75%.
As at December 31, 2009, the Company has an undrawn, unsecured revolving bank facility of $200 million provided by
highly rated financial institutions that expires in May 2012 and is subject to certain financial covenants including an EBITDA
to interest coverage ratio and a debt to capitalization ratio, as defined. This credit facility ranks pari passu with the Company’s
unsecured notes.
8. Other long-term liabilities:
As at December 31 2009 2008
Asset retirement obligations (a) $ 16,134 $ 12,029
Capital lease obligation (b) 15,921 20,742
Deferred, restricted and performance share units (note 9) 21,411 16,224
Chile retirement arrangement (note 17) 19,785 17,754
Fair value of derivative financial instruments (note 15) 33,284 38,740
106,535 105,489
Less current maturities (9,350) (8,048)
$ 97,185 $ 97,441
(a) Asset retirement obligations:
The Company has accrued for asset retirement obligations related to those sites where a reasonably definitive estimate
of the fair value of the obligation can be made. Because of uncertainties in estimating future costs and the timing of
expenditures related to the currently identified sites, actual results could differ from the amounts estimated. In 2009, the
Company accrued an additional $3.8 million for asset retirement obligations related to the oil and gas assets. During the year
ended December 31, 2009, cash expenditures applied against the accrual for asset retirement obligations were nil (2008 –
$0.2 million). At December 31, 2009, the total undiscounted amount of estimated cash flows required to settle the obligation
was $17.8 million (2008 – $13.6 million).
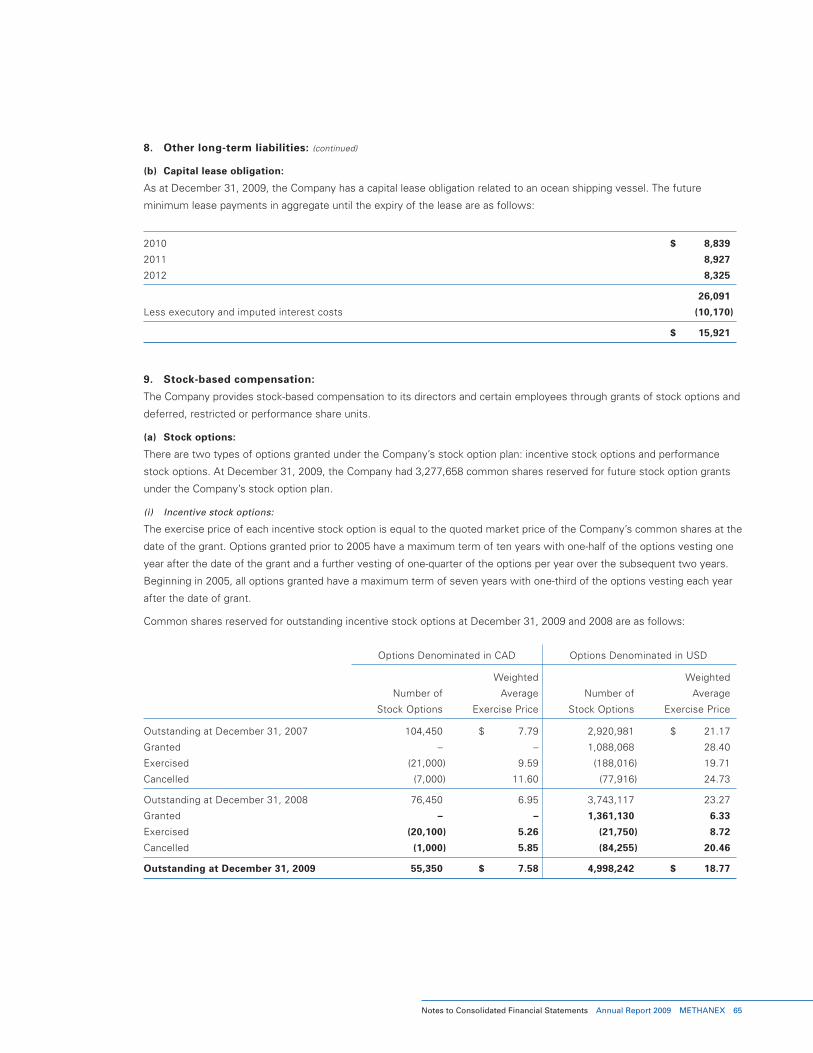
Notes to Consolidated Financial Statements Annual Report 2009 METHANEX 65
8. Other long-term liabilities: (continued)
(b) Capital lease obligation:
As at December 31, 2009, the Company has a capital lease obligation related to an ocean shipping vessel. The future
minimum lease payments in aggregate until the expiry of the lease are as follows:
2010 $ 8,839
2011 8,927
2012 8,325
26,091
Less executory and imputed interest costs (10,170)
$ 15,921
9. Stock-based compensation:
The Company provides stock-based compensation to its directors and certain employees through grants of stock options and
deferred, restricted or performance share units.
(a) Stock options:
There are two types of options granted under the Company’s stock option plan: incentive stock options and performance
stock options. At December 31, 2009, the Company had 3,277,658 common shares reserved for future stock option grants
under the Company’s stock option plan.
(i) Incentivestockoptions:
The exercise price of each incentive stock option is equal to the quoted market price of the Company’s common shares at the
date of the grant. Options granted prior to 2005 have a maximum term of ten years with one-half of the options vesting one
year after the date of the grant and a further vesting of one-quarter of the options per year over the subsequent two years.
Beginning in 2005, all options granted have a maximum term of seven years with one-third of the options vesting each year
after the date of grant.
Common shares reserved for outstanding incentive stock options at December 31, 2009 and 2008 are as follows:
Options Denominated in CAD Options Denominated in USD
Weighted Weighted
Number of Average Number of Average
Stock Options Exercise Price Stock Options Exercise Price
Outstanding at December 31, 2007 104,450 $ 7.79 2,920,981 $ 21.17
Granted – – 1,088,068 28.40
Exercised (21,000) 9.59 (188,016) 19.71
Cancelled (7,000) 11.60 (77,916) 24.73
Outstanding at December 31, 2008 76,450 6.95 3,743,117 23.27
Granted – – 1,361,130 6.33
Exercised (20,100) 5.26 (21,750) 8.72
Cancelled (1,000) 5.85 (84,255) 20.46
Outstanding at December 31, 2009 55,350 $ 7.58 4,998,242 $ 18.77
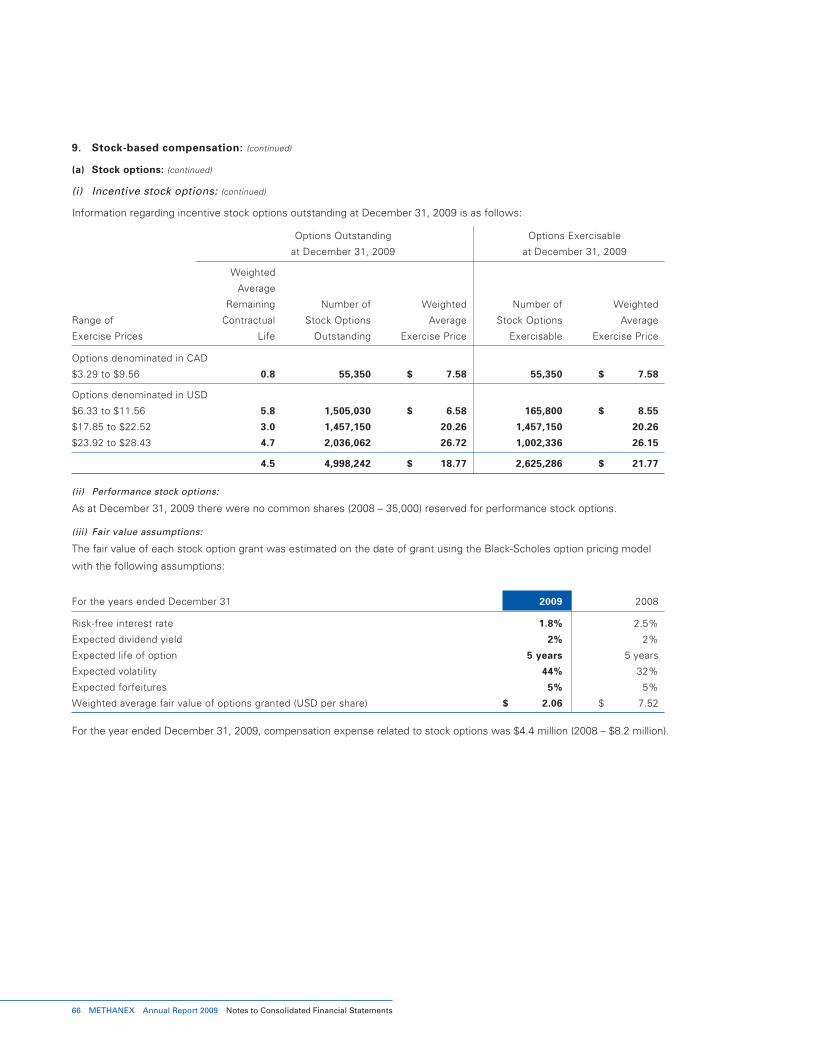
66 METHANEX Annual Report 2009 Notes to Consolidated Financial Statements
9. Stock-based compensation: (continued)
(a) Stock options: (continued)
(i) Incentivestockoptions:(continued)
Information regarding incentive stock options outstanding at December 31, 2009 is as follows:
Options Outstanding Options Exercisable
at December 31, 2009 at December 31, 2009
Weighted
Average
Remaining Number of Weighted Number of Weighted
Range of Contractual Stock Options Average Stock Options Average
Exercise Prices Life Outstanding Exercise Price Exercisable Exercise Price
Options denominated in CAD
$3.29 to $9.56 0.8 55,350 $ 7.58 55,350 $ 7.58
Options denominated in USD
$6.33 to $11.56 5.8 1,505,030 $ 6.58 165,800 $ 8.55
$17.85 to $22.52 3.0 1,457,150 20.26 1,457,150 20.26
$23.92 to $28.43 4.7 2,036,062 26.72 1,002,336 26.15
4.5 4,998,242 $ 18.77 2,625,286 $ 21.77
(ii) Performancestockoptions:
As at December 31, 2009 there were no common shares (2008 – 35,000) reserved for performance stock options.
(iii) Fairvalueassumptions:
The fair value of each stock option grant was estimated on the date of grant using the Black-Scholes option pricing model
with the following assumptions:
For the years ended December 31 2009 2008
Risk-free interest rate 1.8% 2.5%
Expected dividend yield 2% 2%
Expected life of option 5 years 5 years
Expected volatility 44% 32%
Expected forfeitures 5% 5%
Weighted average fair value of options granted (USD per share) $ 2.06 $ 7.52
For the year ended December 31, 2009, compensation expense related to stock options was $4.4 million (2008 – $8.2 million).
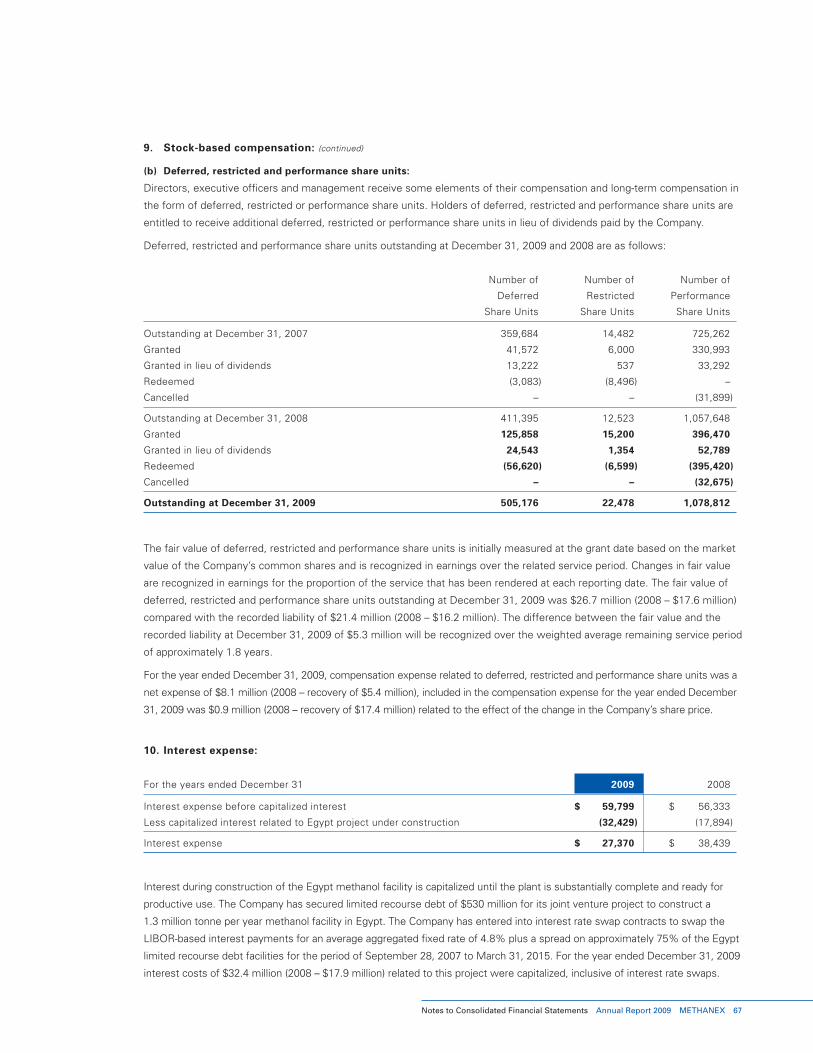
Notes to Consolidated Financial Statements Annual Report 2009 METHANEX 67
9. Stock-based compensation: (continued)
(b) Deferred, restricted and performance share units:
Directors, executive officers and management receive some elements of their compensation and long-term compensation in
the form of deferred, restricted or performance share units. Holders of deferred, restricted and performance share units are
entitled to receive additional deferred, restricted or performance share units in lieu of dividends paid by the Company.
Deferred, restricted and performance share units outstanding at December 31, 2009 and 2008 are as follows:
Number of Number of Number of
Deferred Restricted Performance
Share Units Share Units Share Units
Outstanding at December 31, 2007 359,684 14,482 725,262
Granted 41,572 6,000 330,993
Granted in lieu of dividends 13,222 537 33,292
Redeemed (3,083) (8,496) –
Cancelled – – (31,899)
Outstanding at December 31, 2008 411,395 12,523 1,057,648
Granted 125,858 15,200 396,470
Granted in lieu of dividends 24,543 1,354 52,789
Redeemed (56,620) (6,599) (395,420)
Cancelled – – (32,675)
Outstanding at December 31, 2009 505,176 22,478 1,078,812
The fair value of deferred, restricted and performance share units is initially measured at the grant date based on the market
value of the Company’s common shares and is recognized in earnings over the related service period. Changes in fair value
are recognized in earnings for the proportion of the service that has been rendered at each reporting date. The fair value of
deferred, restricted and performance share units outstanding at December 31, 2009 was $26.7 million (2008 – $17.6 million)
compared with the recorded liability of $21.4 million (2008 – $16.2 million). The difference between the fair value and the
recorded liability at December 31, 2009 of $5.3 million will be recognized over the weighted average remaining service period
of approximately 1.8 years.
For the year ended December 31, 2009, compensation expense related to deferred, restricted and performance share units was a
net expense of $8.1 million (2008 – recovery of $5.4 million), included in the compensation expense for the year ended December
31, 2009 was $0.9 million (2008 – recovery of $17.4 million) related to the effect of the change in the Company’s share price.
10. Interest expense:
For the years ended December 31 2009 2008
Interest expense before capitalized interest $ 59,799 $ 56,333
Less capitalized interest related to Egypt project under construction (32,429) (17,894)
Interest expense $ 27,370 $ 38,439
Interest during construction of the Egypt methanol facility is capitalized until the plant is substantially complete and ready for
productive use. The Company has secured limited recourse debt of $530 million for its joint venture project to construct a
1.3 million tonne per year methanol facility in Egypt. The Company has entered into interest rate swap contracts to swap the
LIBOR-based interest payments for an average aggregated fixed rate of 4.8% plus a spread on approximately 75% of the Egypt
limited recourse debt facilities for the period of September 28, 2007 to March 31, 2015. For the year ended December 31, 2009
interest costs of $32.4 million (2008 – $17.9 million) related to this project were capitalized, inclusive of interest rate swaps.

68 METHANEX Annual Report 2009 Notes to Consolidated Financial Statements
11. Segmented information:
The Company’s operations consist of the production and sale of methanol, which constitutes a single operating segment.
During the years ended December 31, 2009 and 2008, revenues attributed to geographic regions, based on the location of
customers were as follows:
United Other Latin States Canada Europe China Korea Asia America Total
Revenue
2009 $ 354,605 $ 106,437 $ 198,205 $ 195,315 $ 135,479 $ 883,039 $ 125,089 $ 1,198,169
2008 $ 736,730 $ 236,531 $ 494,339 $ 135,083 $ 263,568 $ 209,106 $ 238,862 $ 2,314,219
As at December 31, 2009 and 2008, the net book value of property, plant and equipment by country was as follows:
New Chile Trinidad Egypt Zealand Canada Korea Other Total
Property, plant and equipment
2009 $ 687,313 $ 488,655 $ 854,164 $ 186,730 $ 117,101 $ 114,840 $ 134,984 $ 2,183,787
2008 $ 663,411 $ 482,329 $ 590,585 $ 191,442 $ 117,818 $ 115,645 $ 137,829 $ 1,899,059
12. Income and other taxes:
(a) Income tax expense:
The Company operates in several tax jurisdictions and therefore its income is subject to various rates of taxation. Income
tax expense differs from the amounts that would be obtained by applying the Canadian statutory income tax rate to income
before income taxes. These differences are as follows:
For the years ended December 31 2009 2008
Canadian statutory tax rate 30.0% 31.0%
Income tax expense (recovery) calculated at Canadian statutory tax rate $ (1,060) $ 61,701
Increase (decrease) in income tax expense resulting from:
Impact of income and losses taxed in foreign jurisdictions (5,499) 7,183
Previously unrecognized loss carryforwards and temporary differences – (25,602)
Reduction of future income tax liabilities – (27,342)
Other 2,285 10,798
Total income tax expense (recovery) $ (4,274) $ 26,738
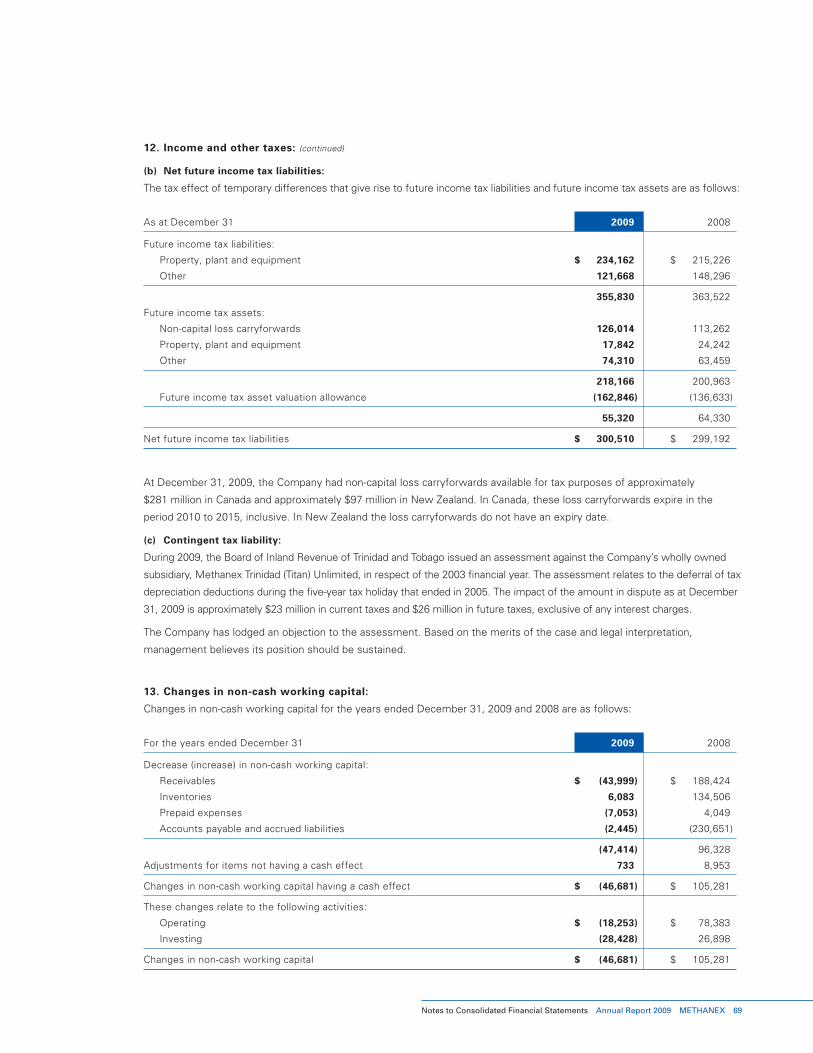
Notes to Consolidated Financial Statements Annual Report 2009 METHANEX 69
12. Income and other taxes: (continued)
(b) Net future income tax liabilities:
The tax effect of temporary differences that give rise to future income tax liabilities and future income tax assets are as follows:
As at December 31 2009 2008
Future income tax liabilities:
Property, plant and equipment $ 234,162 $ 215,226
Other 121,668 148,296
355,830 363,522
Future income tax assets:
Non-capital loss carryforwards 126,014 113,262
Property, plant and equipment 17,842 24,242
Other 74,310 63,459
218,166 200,963
Future income tax asset valuation allowance (162,846) (136,633)
55,320 64,330
Net future income tax liabilities $ 300,510 $ 299,192
At December 31, 2009, the Company had non-capital loss carryforwards available for tax purposes of approximately
$281 million in Canada and approximately $97 million in New Zealand. In Canada, these loss carryforwards expire in the
period 2010 to 2015, inclusive. In New Zealand the loss carryforwards do not have an expiry date.
(c) Contingent tax liability:
During 2009, the Board of Inland Revenue of Trinidad and Tobago issued an assessment against the Company’s wholly owned
subsidiary, Methanex Trinidad (Titan) Unlimited, in respect of the 2003 financial year. The assessment relates to the deferral of tax
depreciation deductions during the five-year tax holiday that ended in 2005. The impact of the amount in dispute as at December
31, 2009 is approximately $23 million in current taxes and $26 million in future taxes, exclusive of any interest charges.
The Company has lodged an objection to the assessment. Based on the merits of the case and legal interpretation,
management believes its position should be sustained.
13. Changes in non-cash working capital:
Changes in non-cash working capital for the years ended December 31, 2009 and 2008 are as follows:
For the years ended December 31 2009 2008
Decrease (increase) in non-cash working capital:
Receivables $ (43,999) $ 188,424
Inventories 6,083 134,506
Prepaid expenses (7,053) 4,049
Accounts payable and accrued liabilities (2,445) (230,651)
(47,414) 96,328
Adjustments for items not having a cash effect 733 8,953
Changes in non-cash working capital having a cash effect $ (46,681) $ 105,281
These changes relate to the following activities:
Operating $ (18,253) $ 78,383
Investing (28,428) 26,898
Changes in non-cash working capital $ (46,681) $ 105,281
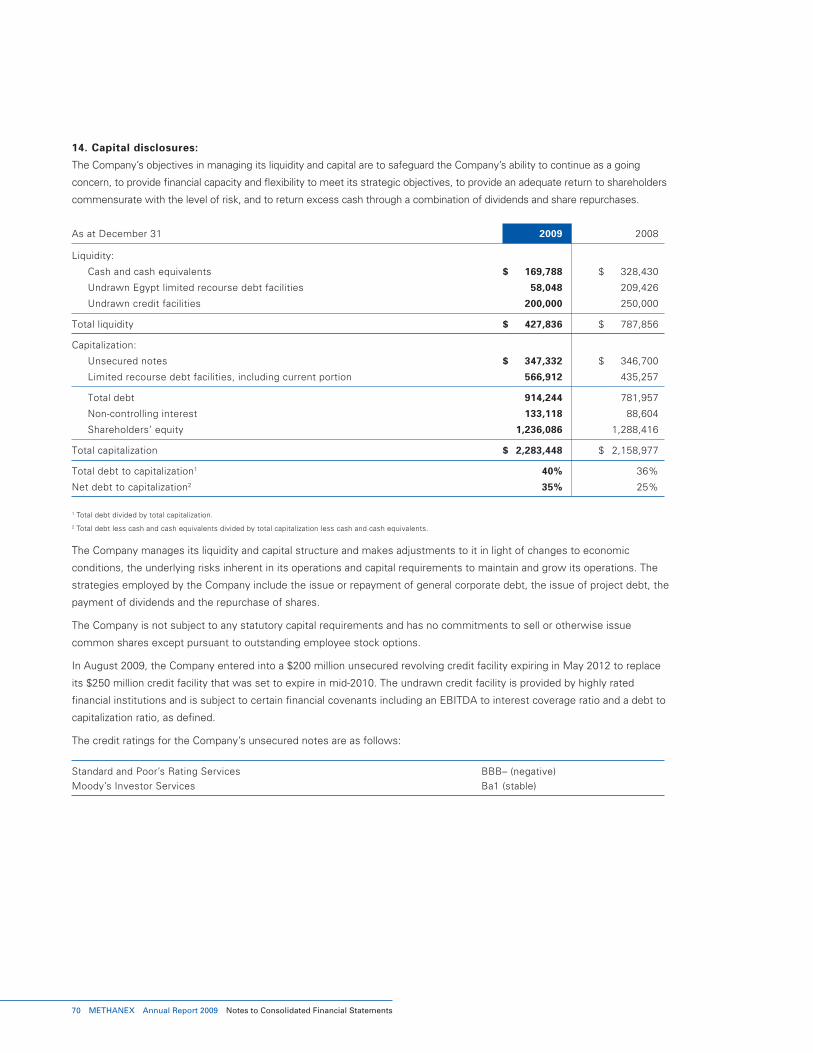
70 METHANEX Annual Report 2009 Notes to Consolidated Financial Statements
14. Capital disclosures:
The Company’s objectives in managing its liquidity and capital are to safeguard the Company’s ability to continue as a going
concern, to provide financial capacity and flexibility to meet its strategic objectives, to provide an adequate return to shareholders
commensurate with the level of risk, and to return excess cash through a combination of dividends and share repurchases.
As at December 31 2009 2008
Liquidity:
Cash and cash equivalents $ 169,788 $ 328,430
Undrawn Egypt limited recourse debt facilities 58,048 209,426
Undrawn credit facilities 200,000 250,000
Total liquidity $ 427,836 $ 787,856
Capitalization:
Unsecured notes $ 347,332 $ 346,700
Limited recourse debt facilities, including current portion 566,912 435,257
Total debt 914,244 781,957
Non-controlling interest 133,118 88,604
Shareholders’ equity 1,236,086 1,288,416
Total capitalization $ 2,283,448 $ 2,158,977
Total debt to capitalization1 40% 36%
Net debt to capitalization2 35% 25%
1 Total debt divided by total capitalization.
2 Total debt less cash and cash equivalents divided by total capitalization less cash and cash equivalents.
The Company manages its liquidity and capital structure and makes adjustments to it in light of changes to economic
conditions, the underlying risks inherent in its operations and capital requirements to maintain and grow its operations. The
strategies employed by the Company include the issue or repayment of general corporate debt, the issue of project debt, the
payment of dividends and the repurchase of shares.
The Company is not subject to any statutory capital requirements and has no commitments to sell or otherwise issue
common shares except pursuant to outstanding employee stock options.
In August 2009, the Company entered into a $200 million unsecured revolving credit facility expiring in May 2012 to replace
its $250 million credit facility that was set to expire in mid-2010. The undrawn credit facility is provided by highly rated
financial institutions and is subject to certain financial covenants including an EBITDA to interest coverage ratio and a debt to
capitalization ratio, as defined.
The credit ratings for the Company’s unsecured notes are as follows:
Standard and Poor’s Rating Services BBB– (negative)
Moody’s Investor Services Ba1 (stable)

Notes to Consolidated Financial Statements Annual Report 2009 METHANEX 71
15. Financial instruments:
Financial instruments are either measured at amortized cost or fair value. Held-to-maturity investments, loans and receivables
and other financial liabilities are measured at amortized cost. Held for trading financial assets and liabilities and available-for-
sale financial assets are measured on the balance sheet at fair value. Derivative financial instruments are classified as held
for trading and are recorded on the balance sheet at fair value unless exempted. Changes in fair value of derivative financial
instruments are recorded in earnings unless the instruments are designated as cash flow hedges.
The following table provides the carrying value of each category of financial assets and liabilities and the related balance
sheet item:
As at December 31 2009 2008
Financial assets:
Held for trading financial assets:
Cash and cash equivalents $ 169,788 $ 328,430
Debt service reserve accounts included in other assets 12,920 18,149
Loans and receivables:
Receivables, excluding current portion of GeoPark financing 249,332 207,419
Dorado Riquelme investment included in other assets (note 6) – 42,123
GeoPark financing, including current portion (note 6) 46,055 36,616
$ 478,095 $ 632,737
Financial liabilities:
Other financial liabilities:
Accounts payable and accrued liabilities $ 232,924 $ 235,369
Long-term debt, including current portion 914,244 781,957
Held for trading financial liabilities:
Derivative instruments designated as cash flow hedges 33,185 38,100
Derivative instruments 99 1,771
$ 1,180,452 $ 1,057,197
The Egypt limited recourse debt facilities bear interest at LIBOR plus a spread. The Company has entered into interest rate
swap contracts to swap the LIBOR-based interest payments for an average aggregated fixed rate of 4.8% plus a spread on
approximately 75% of the Egypt limited recourse debt facilities for the period of September 28, 2007 to March 31, 2015.
These interest rate swaps had outstanding notional amounts of $351 million as at December 31, 2009. Under the interest rate
swap contracts the maximum notional amount during the term is $368 million. The notional amount increases over the period
of expected drawdowns on the Egypt limited recourse debt and decreases over the expected repayment period. At December
31, 2009, these interest rate swap contracts had a negative fair value of $33.2 million (2008 – $38.1 million) recorded in other
long-term liabilities. The fair value of these interest rate swap contracts will fluctuate until maturity. Changes in the fair value of
derivative financial instruments designated as cash flow hedges have been recorded in other comprehensive income.
At December 31, 2009, the Company’s derivative financial instruments that have not been designated as cash flow hedges
include a floating-for-fixed interest rate swap contract with a negative fair value of $0.1 million (2008 – $0.6 million) recorded
in other long-term liabilities.
The fair values of the Company’s derivative financial instruments as disclosed above are determined based on quoted market
prices received from counterparties and adjusted for credit risk.
The Company is exposed to credit-related losses in the event of non-performance by counterparties to derivative financial instruments
but does not expect any counterparties to fail to meet their obligations. The Company deals with only highly rated counterparties,
normally major financial institutions. The Company is exposed to credit risk when there is a positive fair value of derivative financial
instruments at a reporting date. The maximum amount that would be at risk if the counterparties to derivative financial instruments
with positive fair values failed completely to perform under the contracts was nil at December 31, 2009 (2008 – nil).
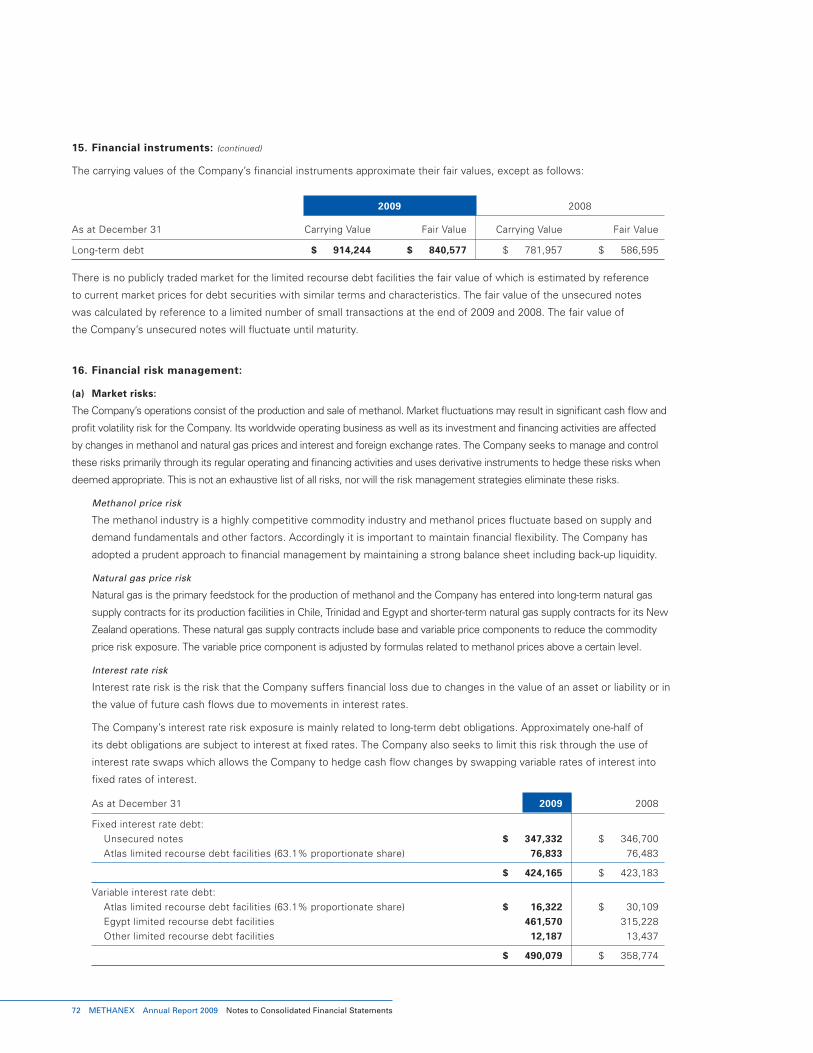
72 METHANEX Annual Report 2009 Notes to Consolidated Financial Statements
15. Financial instruments: (continued)
The carrying values of the Company’s financial instruments approximate their fair values, except as follows:
2009 2008
As at December 31 Carrying Value Fair Value Carrying Value Fair Value
Long-term debt $ 914,244 $ 840,577 $ 781,957 $ 586,595
There is no publicly traded market for the limited recourse debt facilities the fair value of which is estimated by reference
to current market prices for debt securities with similar terms and characteristics. The fair value of the unsecured notes
was calculated by reference to a limited number of small transactions at the end of 2009 and 2008. The fair value of
the Company’s unsecured notes will fluctuate until maturity.
16. Financial risk management:
(a) Market risks:
The Company’s operations consist of the production and sale of methanol. Market fluctuations may result in significant cash flow and
profit volatility risk for the Company. Its worldwide operating business as well as its investment and financing activities are affected
by changes in methanol and natural gas prices and interest and foreign exchange rates. The Company seeks to manage and control
these risks primarily through its regular operating and financing activities and uses derivative instruments to hedge these risks when
deemed appropriate. This is not an exhaustive list of all risks, nor will the risk management strategies eliminate these risks.
Methanolpricerisk
The methanol industry is a highly competitive commodity industry and methanol prices fluctuate based on supply and
demand fundamentals and other factors. Accordingly it is important to maintain financial flexibility. The Company has
adopted a prudent approach to financial management by maintaining a strong balance sheet including back-up liquidity.
Naturalgaspricerisk
Natural gas is the primary feedstock for the production of methanol and the Company has entered into long-term natural gas
supply contracts for its production facilities in Chile, Trinidad and Egypt and shorter-term natural gas supply contracts for its New
Zealand operations. These natural gas supply contracts include base and variable price components to reduce the commodity
price risk exposure. The variable price component is adjusted by formulas related to methanol prices above a certain level.
Interestraterisk
Interest rate risk is the risk that the Company suffers financial loss due to changes in the value of an asset or liability or in
the value of future cash flows due to movements in interest rates.
The Company’s interest rate risk exposure is mainly related to long-term debt obligations. Approximately one-half of
its debt obligations are subject to interest at fixed rates. The Company also seeks to limit this risk through the use of
interest rate swaps which allows the Company to hedge cash flow changes by swapping variable rates of interest into
fixed rates of interest.
As at December 31 As at December 31) 2009 2008
Fixed interest rate debt:
Unsecured notes $ 347,332 $ 346,700
Atlas limited recourse debt facilities (63.1% proportionate share) 76,833 76,483
$ 424,165 $ 423,183
Variable interest rate debt:
Atlas limited recourse debt facilities (63.1% proportionate share) $ 16,322 $ 30,109
Egypt limited recourse debt facilities 461,570 315,228
Other limited recourse debt facilities 12,187 13,437
$ 490,079 $ 358,774
Notes to Consolidated Financial Statements Annual Report 2009 METHANEX 73
16. Financial risk management: (continued)
The Company has entered into interest rate swap contracts to hedge the variability in LIBOR-based interest payments on
its Egypt limited recourse debt facilities described in note 15. The notional amount increases over the period of expected
drawdowns on the Egypt limited recourse debt and decreases over the expected repayment period. The aggregate impact
of these contracts is to swap the LIBOR-based interest payments for an average fixed rate of 4.8% plus a spread on
approximately 75% of the Egypt limited recourse debt facilities for the period September 28, 2007 to March 31, 2015.
The net fair value of cash flow interest rate swaps was negative $33.2 million as at December 31, 2009. The change in fair
value of the interest rate swaps assuming a 1% change in the interest rates along the yield curve would result in a change
of approximately $16.1 million as of December 31, 2009. These interest rate swaps are designated as cash flow hedges
which results in the effective portion of changes in their fair value being recorded in other comprehensive income.
For fixed interest rate debt, a 1% change in interest rates would result in a change in fair value of the debt (disclosed in
note 15) of approximately $13.9 million.
For the variable interest rate debt that is unhedged, a 1% change in LIBOR would result in a change in annual interest
payments of $1.4 million.
Foreigncurrencyrisk
The Company’s international operations expose the Company to foreign currency exchange risks in the ordinary course of
business. Accordingly, the Company has established a policy that provides a framework for foreign currency management
and hedging strategies and defines the approved hedging instruments. The Company reviews all significant exposures to
foreign currencies arising from operating and investing activities and hedges exposures if deemed appropriate.
The dominant currency in which the Company conducts business is the United States dollar, which is also the reporting currency.
Methanol is a global commodity chemical that is priced in United States dollars. In certain jurisdictions, however,
the transaction price is set either quarterly or monthly in the local currency. Accordingly, a portion of the Company’s
revenue is transacted in Canadian dollars, euros and to a lesser extent other currencies. For the period from when the
price is set in local currency to when the amount due is collected, the Company is exposed to declines in the value of
these currencies compared to the United States dollar. The Company also purchases varying quantities of methanol for
which the transaction currency is the euro and to a lesser extent other currencies. In addition, some of the Company’s
underlying operating costs and capital expenditures are incurred in other currencies. The Company is exposed to
increases in the value of these currencies that could have the effect of increasing the United States dollar equivalent
of cost of sales and operating expenses and capital expenditures. The Company has elected not to actively manage
these exposures at this time except for the net exposure to euro revenues which is hedged through forward exchange
contracts each quarter when the euro price for methanol is established.
As of December 31, 2009, the Company had a net working capital asset of $25.5 million in non-US dollar currencies.
Each 10% strengthening (weakening) of the US dollar against these currencies would decrease (increase) the value of
net working capital and pre-tax cash flows and earnings by approximately $3 million.
(b) liquidity risks:
Liquidity risk is the risk that the Company will not have sufficient funds to meet its liabilities, such as the settlement of
financial debt and lease obligations and payment to its suppliers. The Company maintains liquidity and makes adjustments to
it in light of changes to economic conditions, underlying risks inherent in its operations and capital requirements to maintain
and grow its operations. At December 31, 2009, the Company had $170 million of cash and cash equivalents. In addition, the
Company has an undrawn, unsecured revolving bank facility of $200 million provided by highly rated financial institutions that
expires in May 2012.
In addition to the above-mentioned sources of liquidity, the Company constantly monitors funding options available in the
capital markets, as well as trends in the availability and costs of such funding, with a view to maintaining financial flexibility
and limiting refinancing risks.

74 METHANEX Annual Report 2009 Notes to Consolidated Financial Statements
16. Financial risk management: (continued)
(c) Credit risk:
Counterparty credit risk is the risk that the financial benefits of contracts with a specific counterparty will be lost if a
counterparty defaults on its obligations under the contract. This includes any cash amounts owed to the Company by those
counterparties, less any amounts owed to the counterparty by the Company where a legal right of offset exists and also
includes the fair values of contracts with individual counterparties that are recorded in the financial statements.
Tradecreditrisk
Trade credit risk is defined as an unexpected loss in cash and earnings if the customer is unable to pay its obligations in due
time or if the value of the security provided declines. The Company has implemented a credit policy that includes approvals
for new customers, annual credit evaluations of all customers and specific approval for any exposures beyond approved limits.
The Company employs a variety of risk-mitigation alternatives including certain contractual rights in the event of deterioration
in customer credit quality and various forms of bank and parent company guarantees and letters of credit to upgrade the credit
risk to a credit rating equivalent or better than the stand-alone rating of the counterparty. Trade credit losses have historically
been minimal. However, in the current economic environment the risk of trade credit losses has increased.
Cashandcashequivalents
To manage credit and liquidity risk, the Company invests only in highly rated investment grade instruments that have
maturities of three months or less. Limits are also established based on the type of investment, the counterparty and the
credit rating.
Derivativefinancialinstruments
To manage credit risk, the Company only enters into derivative financial instruments with highly rated investment grade
counterparties.
17. Retirement plans:
(a) Defined benefit pension plans:
The Company has non-contributory defined benefit pension plans covering certain employees. The Company does not provide
any significant post-retirement benefits other than pension plan benefits. Information concerning the Company’s defined
benefit pension plans, in aggregate, is as follows:
As at December 31 2009 2008
Accrued benefit obligations: Balance, beginning of year $ 50,020 $ 66,751 Current service cost 2,271 2,295 Interest cost on accrued benefit obligations 3,088 3,272 Benefit payments (7,602) (5,809) Gain on curtailment (709) (844) Actuarial loss (gain) 4,266 (1,537) Foreign exchange loss (gain) 10,309 (14,108)
Balance, end of year 61,643 50,020Fair values of plan assets: Balance, beginning of year 31,864 44,097 Actual returns on plan assets 4,271 (5,086) Contributions 8,555 7,201 Benefit payments (7,602) (5,809) Foreign exchange gain (loss) 5,015 (8,539)
Balance, end of year 42,103 31,864
Unfunded status 19,540 18,156Unamortized actuarial loss (15,758) (16,899)
Accrued benefit liabilities, net $ 3,782 $ 1,257
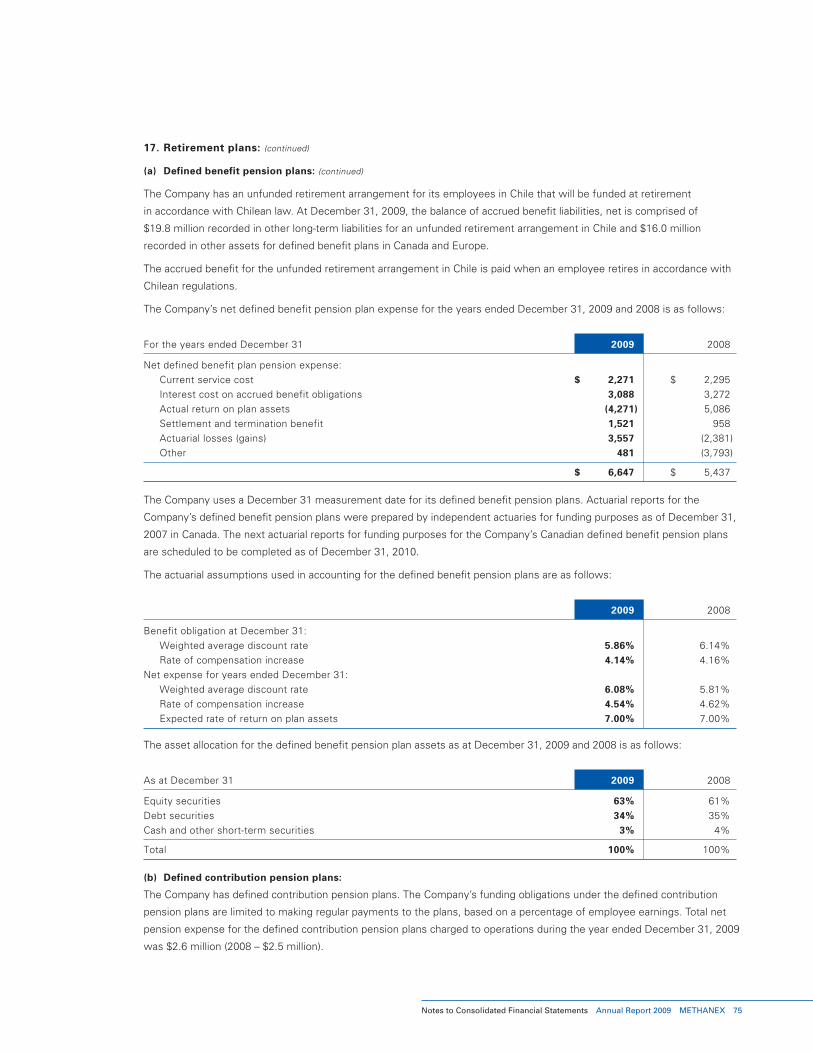
Notes to Consolidated Financial Statements Annual Report 2009 METHANEX 75
17. Retirement plans: (continued)
(a) Defined benefit pension plans: (continued)
The Company has an unfunded retirement arrangement for its employees in Chile that will be funded at retirement
in accordance with Chilean law. At December 31, 2009, the balance of accrued benefit liabilities, net is comprised of
$19.8 million recorded in other long-term liabilities for an unfunded retirement arrangement in Chile and $16.0 million
recorded in other assets for defined benefit plans in Canada and Europe.
The accrued benefit for the unfunded retirement arrangement in Chile is paid when an employee retires in accordance with
Chilean regulations.
The Company’s net defined benefit pension plan expense for the years ended December 31, 2009 and 2008 is as follows:
For the years ended December 31 2009 2008
Net defined benefit plan pension expense:
Current service cost $ 2,271 $ 2,295
Interest cost on accrued benefit obligations 3,088 3,272
Actual return on plan assets (4,271) 5,086
Settlement and termination benefit 1,521 958
Actuarial losses (gains) 3,557 (2,381)
Other 481 (3,793)
$ 6,647 $ 5,437
The Company uses a December 31 measurement date for its defined benefit pension plans. Actuarial reports for the
Company’s defined benefit pension plans were prepared by independent actuaries for funding purposes as of December 31,
2007 in Canada. The next actuarial reports for funding purposes for the Company’s Canadian defined benefit pension plans
are scheduled to be completed as of December 31, 2010.
The actuarial assumptions used in accounting for the defined benefit pension plans are as follows:
(As at December 31) 2009 2008
Benefit obligation at December 31:
Weighted average discount rate 5.86% 6.14%
Rate of compensation increase 4.14% 4.16%
Net expense for years ended December 31:
Weighted average discount rate 6.08% 5.81%
Rate of compensation increase 4.54% 4.62%
Expected rate of return on plan assets 7.00% 7.00%
The asset allocation for the defined benefit pension plan assets as at December 31, 2009 and 2008 is as follows:
As at December 31 2009 2008
Equity securities 63% 61%
Debt securities 34% 35%
Cash and other short-term securities 3% 4%
Total 100% 100%
(b) Defined contribution pension plans:
The Company has defined contribution pension plans. The Company’s funding obligations under the defined contribution
pension plans are limited to making regular payments to the plans, based on a percentage of employee earnings. Total net
pension expense for the defined contribution pension plans charged to operations during the year ended December 31, 2009
was $2.6 million (2008 – $2.5 million).
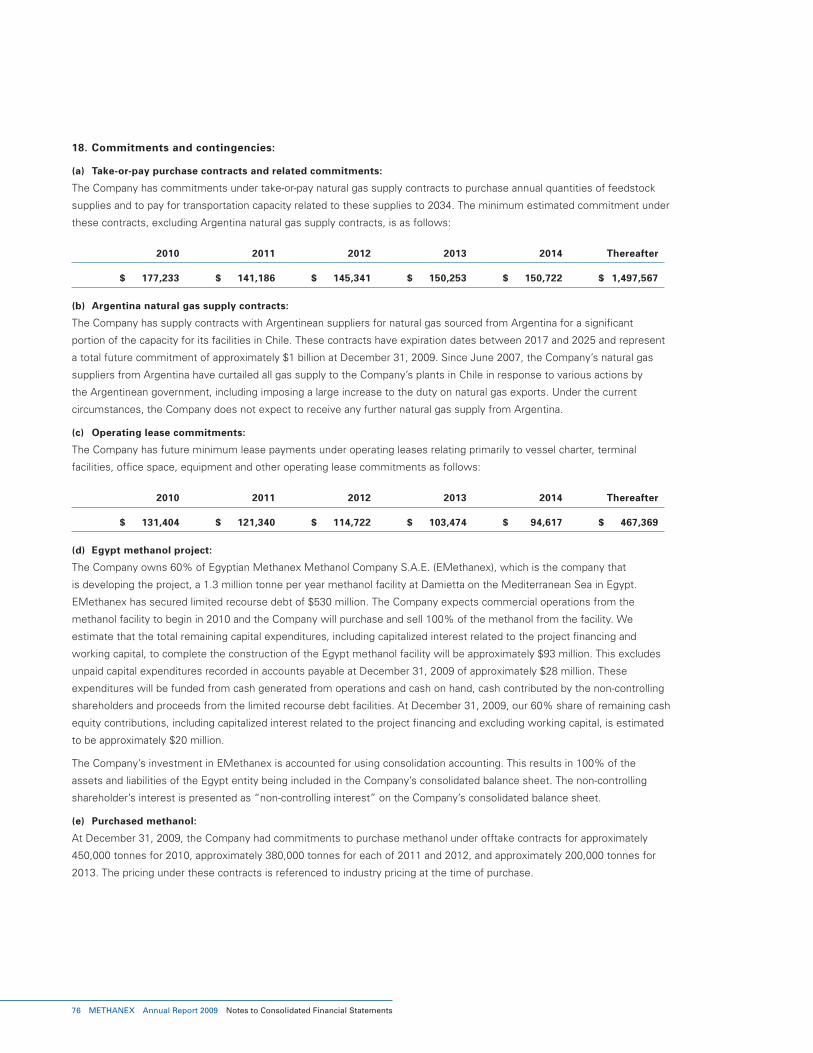
76 METHANEX Annual Report 2009 Notes to Consolidated Financial Statements
18. Commitments and contingencies:
(a) Take-or-pay purchase contracts and related commitments:
The Company has commitments under take-or-pay natural gas supply contracts to purchase annual quantities of feedstock
supplies and to pay for transportation capacity related to these supplies to 2034. The minimum estimated commitment under
these contracts, excluding Argentina natural gas supply contracts, is as follows:
2010 2011 2012 2013 2014 Thereafter
$ 177,233 $ 141,186 $ 145,341 $ 150,253 $ 150,722 $ 1,497,567
(b) Argentina natural gas supply contracts:
The Company has supply contracts with Argentinean suppliers for natural gas sourced from Argentina for a significant
portion of the capacity for its facilities in Chile. These contracts have expiration dates between 2017 and 2025 and represent
a total future commitment of approximately $1 billion at December 31, 2009. Since June 2007, the Company’s natural gas
suppliers from Argentina have curtailed all gas supply to the Company’s plants in Chile in response to various actions by
the Argentinean government, including imposing a large increase to the duty on natural gas exports. Under the current
circumstances, the Company does not expect to receive any further natural gas supply from Argentina.
(c) Operating lease commitments:
The Company has future minimum lease payments under operating leases relating primarily to vessel charter, terminal
facilities, office space, equipment and other operating lease commitments as follows:
2010 2011 2012 2013 2014 Thereafter
$ 131,404 $ 121,340 $ 114,722 $ 103,474 $ 94,617 $ 467,369
(d) Egypt methanol project:
The Company owns 60% of Egyptian Methanex Methanol Company S.A.E. (EMethanex), which is the company that
is developing the project, a 1.3 million tonne per year methanol facility at Damietta on the Mediterranean Sea in Egypt.
EMethanex has secured limited recourse debt of $530 million. The Company expects commercial operations from the
methanol facility to begin in 2010 and the Company will purchase and sell 100% of the methanol from the facility. We
estimate that the total remaining capital expenditures, including capitalized interest related to the project financing and
working capital, to complete the construction of the Egypt methanol facility will be approximately $93 million. This excludes
unpaid capital expenditures recorded in accounts payable at December 31, 2009 of approximately $28 million. These
expenditures will be funded from cash generated from operations and cash on hand, cash contributed by the non-controlling
shareholders and proceeds from the limited recourse debt facilities. At December 31, 2009, our 60% share of remaining cash
equity contributions, including capitalized interest related to the project financing and excluding working capital, is estimated
to be approximately $20 million.
The Company’s investment in EMethanex is accounted for using consolidation accounting. This results in 100% of the
assets and liabilities of the Egypt entity being included in the Company’s consolidated balance sheet. The non-controlling
shareholder’s interest is presented as “non-controlling interest” on the Company’s consolidated balance sheet.
(e) Purchased methanol:
At December 31, 2009, the Company had commitments to purchase methanol under offtake contracts for approximately
450,000 tonnes for 2010, approximately 380,000 tonnes for each of 2011 and 2012, and approximately 200,000 tonnes for
2013. The pricing under these contracts is referenced to industry pricing at the time of purchase.
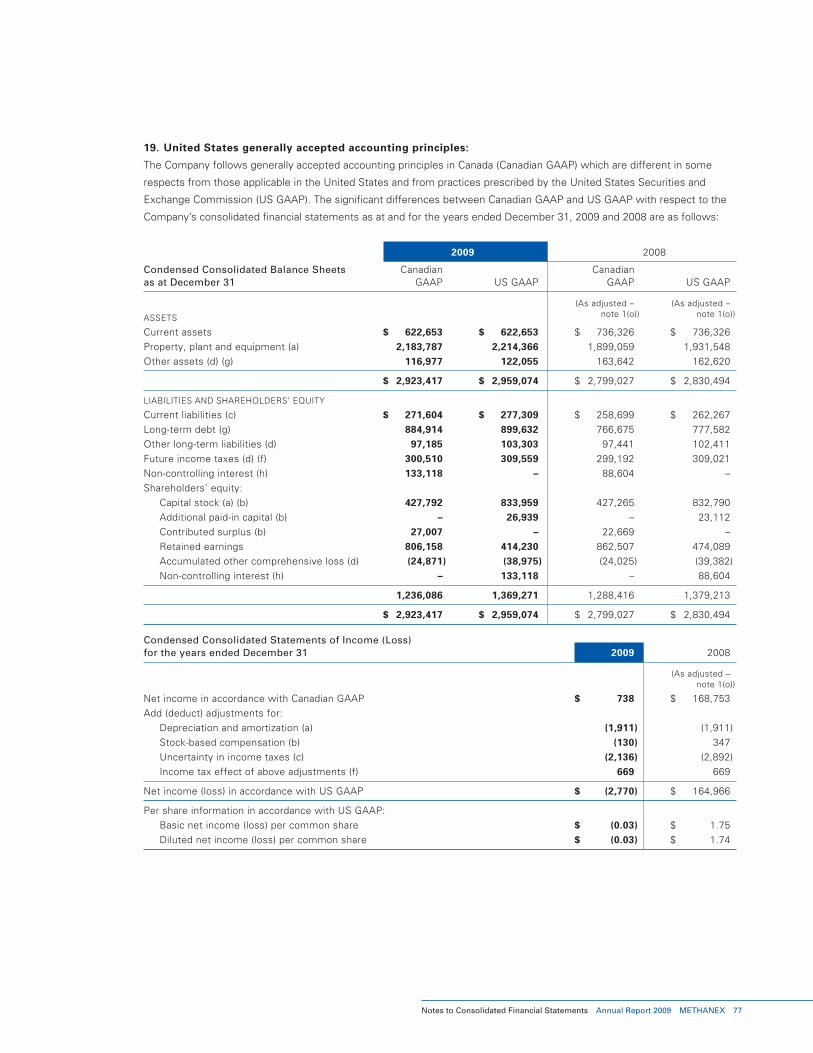
Notes to Consolidated Financial Statements Annual Report 2009 METHANEX 77
19. United States generally accepted accounting principles:
The Company follows generally accepted accounting principles in Canada (Canadian GAAP) which are different in some
respects from those applicable in the United States and from practices prescribed by the United States Securities and
Exchange Commission (US GAAP). The significant differences between Canadian GAAP and US GAAP with respect to the
Company’s consolidated financial statements as at and for the years ended December 31, 2009 and 2008 are as follows:
2009 2008
Condensed Consolidated Balance Sheets Canadian Canadianas at December 31 GAAP US GAAP GAAP US GAAP
(As adjusted – (As adjusted –
ASSETS note 1(o)) note 1(o))
Current assets $ 622,653 $ 622,653 $ 736,326 $ 736,326
Property, plant and equipment (a) 2,183,787 2,214,366 1,899,059 1,931,548
Other assets (d) (g) 116,977 122,055 163,642 162,620
$ 2,923,417 $ 2,959,074 $ 2,799,027 $ 2,830,494
LIABILITIES AND SHAREHOLDERS’ EQUITY
Current liabilities (c) $ 271,604 $ 277,309 $ 258,699 $ 262,267
Long-term debt (g) 884,914 899,632 766,675 777,582
Other long-term liabilities (d) 97,185 103,303 97,441 102,411
Future income taxes (d) (f) 300,510 309,559 299,192 309,021
Non-controlling interest (h) 133,118 – 88,604 –
Shareholders’ equity:
Capital stock (a) (b) 427,792 833,959 427,265 832,790
Additional paid-in capital (b) – 26,939 – 23,112
Contributed surplus (b) 27,007 – 22,669 –
Retained earnings 806,158 414,230 862,507 474,089
Accumulated other comprehensive loss (d) (24,871) (38,975) (24,025) (39,382)
Non-controlling interest (h) – 133,118 – 88,604
1,236,086 1,369,271 1,288,416 1,379,213
$ 2,923,417 $ 2,959,074 $ 2,799,027 $ 2,830,494
Condensed Consolidated Statements of Income (Loss)for the years ended December 31 2009 2008
(As adjusted – note 1(o))
Net income in accordance with Canadian GAAP $ 738 $ 168,753
Add (deduct) adjustments for:
Depreciation and amortization (a) (1,911) (1,911)
Stock-based compensation (b) (130) 347
Uncertainty in income taxes (c) (2,136) (2,892)
Income tax effect of above adjustments (f) 669 669
Net income (loss) in accordance with US GAAP $ (2,770) $ 164,966
Per share information in accordance with US GAAP:
Basic net income (loss) per common share $ (0.03) $ 1.75
Diluted net income (loss) per common share $ (0.03) $ 1.74
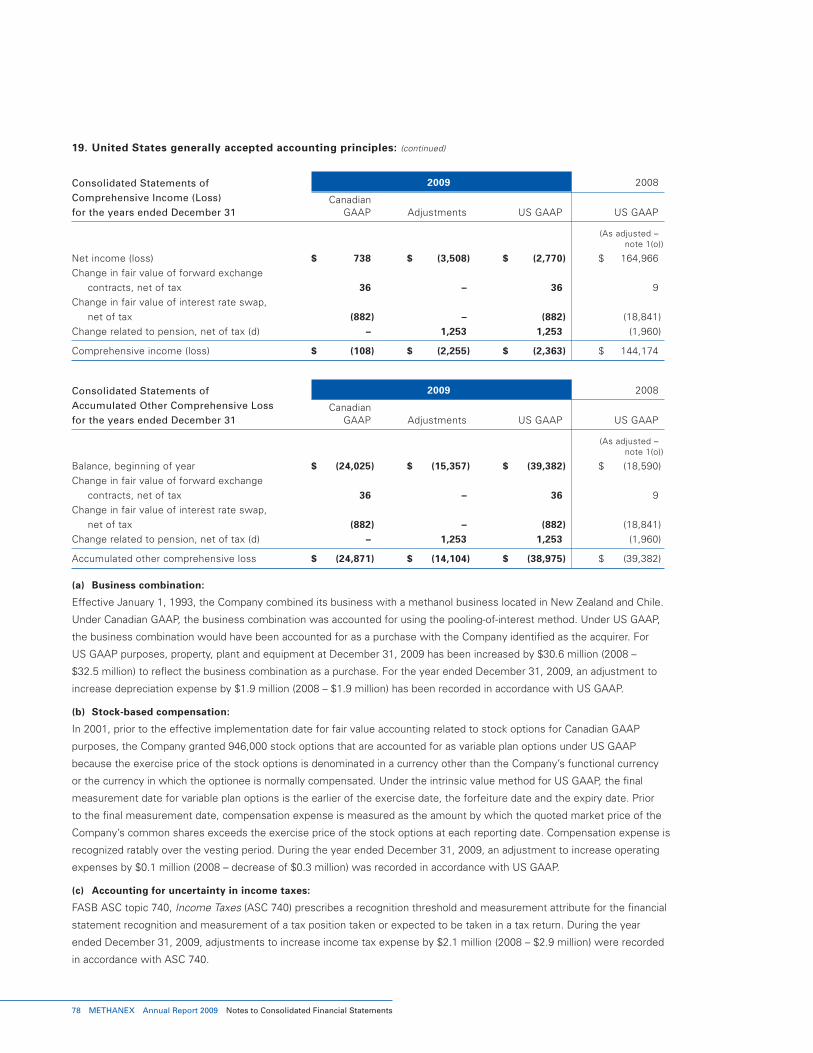
78 METHANEX Annual Report 2009 Notes to Consolidated Financial Statements
19. United States generally accepted accounting principles: (continued)
Consolidated Statements of 2009 2008
Comprehensive Income (Loss) Canadianfor the years ended December 31 GAAP Adjustments US GAAP US GAAP
(As adjusted – note 1(o))
Net income (loss) $ 738 $ (3,508) $ (2,770) $ 164,966
Change in fair value of forward exchange
contracts, net of tax 36 – 36 9
Change in fair value of interest rate swap,
net of tax (882) – (882) (18,841)
Change related to pension, net of tax (d) – 1,253 1,253 (1,960)
Comprehensive income (loss) $ (108) $ (2,255) $ (2,363) $ 144,174
Consolidated Statements of 2009 2008
Accumulated Other Comprehensive Loss Canadianfor the years ended December 31 GAAP Adjustments US GAAP US GAAP
(As adjusted – note 1(o))
Balance, beginning of year $ (24,025) $ (15,357) $ (39,382) $ (18,590)
Change in fair value of forward exchange
contracts, net of tax 36 – 36 9
Change in fair value of interest rate swap,
net of tax (882) – (882) (18,841)
Change related to pension, net of tax (d) – 1,253 1,253 (1,960)
Accumulated other comprehensive loss $ (24,871) $ (14,104) $ (38,975) $ (39,382)
(a) Business combination:
Effective January 1, 1993, the Company combined its business with a methanol business located in New Zealand and Chile.
Under Canadian GAAP, the business combination was accounted for using the pooling-of-interest method. Under US GAAP,
the business combination would have been accounted for as a purchase with the Company identified as the acquirer. For
US GAAP purposes, property, plant and equipment at December 31, 2009 has been increased by $30.6 million (2008 –
$32.5 million) to reflect the business combination as a purchase. For the year ended December 31, 2009, an adjustment to
increase depreciation expense by $1.9 million (2008 – $1.9 million) has been recorded in accordance with US GAAP.
(b) Stock-based compensation:
In 2001, prior to the effective implementation date for fair value accounting related to stock options for Canadian GAAP
purposes, the Company granted 946,000 stock options that are accounted for as variable plan options under US GAAP
because the exercise price of the stock options is denominated in a currency other than the Company’s functional currency
or the currency in which the optionee is normally compensated. Under the intrinsic value method for US GAAP, the final
measurement date for variable plan options is the earlier of the exercise date, the forfeiture date and the expiry date. Prior
to the final measurement date, compensation expense is measured as the amount by which the quoted market price of the
Company’s common shares exceeds the exercise price of the stock options at each reporting date. Compensation expense is
recognized ratably over the vesting period. During the year ended December 31, 2009, an adjustment to increase operating
expenses by $0.1 million (2008 – decrease of $0.3 million) was recorded in accordance with US GAAP.
(c) Accounting for uncertainty in income taxes:
FASB ASC topic 740, Income Taxes (ASC 740) prescribes a recognition threshold and measurement attribute for the financial
statement recognition and measurement of a tax position taken or expected to be taken in a tax return. During the year
ended December 31, 2009, adjustments to increase income tax expense by $2.1 million (2008 – $2.9 million) were recorded
in accordance with ASC 740.

Notes to Consolidated Financial Statements Annual Report 2009 METHANEX 79
19. United States generally accepted accounting principles: (continued)
(d) Defined benefit pension plans:
US GAAP requires the Company to measure the funded status of a defined benefit pension plan at its balance sheet
reporting date and recognize the unrecorded overfunded or underfunded status as an asset or liability with the change in that
unrecorded funded status recorded to other comprehensive income. Under US GAAP, deferred pension amounts are included
in accumulated other comprehensive income. As at December 31, 2009, the impact of this standard on the Company is the
reclassification of unrecognized actuarial losses for Canadian GAAP of $15.7 million (2008 – $16.9 million), net of a future
income tax recovery of $1.6 million (2008 – $1.5 million) to accumulated other comprehensive loss.
(e) Interest in Atlas joint venture:
US GAAP requires interests in joint ventures to be accounted for using the equity method. Canadian GAAP requires
proportionate consolidation of interests in joint ventures. The Company has not made an adjustment in this reconciliation
for this difference in accounting principles because the impact of applying the equity method of accounting does not result
in any change to net income or shareholders’ equity. This departure from US GAAP is acceptable for foreign private issuers
under the practices prescribed by the United States Securities and Exchange Commission. Details of the Company’s interest
in the Atlas joint venture are provided in note 5.
(f) Income tax accounting:
The income tax differences include the income tax effect of the adjustments related to accounting differences between
Canadian and US GAAP. During the year ended December 31, 2009, this resulted in an adjustment to increase net income by
$0.7 million (2008 – $0.7 million).
(g) Deferred financing fees:
Under Canadian GAAP, the Company is required to present long-term debt net of deferred financing fees. Under US GAAP,
the Company is required to present the long-term debt and related finance fees on a gross basis. As at December 31,
2009 and 2008, the Company recorded an adjustment to increase other assets and long-term debt by $14.7 million and
$10.9 million, respectively, in accordance with US GAAP.
(h) Non-controlling interests:
Effective January 1, 2009, US GAAP requires that the ownership interests in subsidiaries held by parties other than the
parent be clearly identified, labelled and presented in the consolidated statement of financial position within equity, but
separate from the parent’s equity. Under this standard, the Company is required to reclassify non-controlling interest on the
consolidated balance sheet into shareholders’ equity. This adjustment has also been recorded for the comparative balances.

80 METHANEX Annual Report 2009 Notes to Consolidated Financial Statements
Pierre ChoquetteChairman of the BoardBoard member since October 1994
Bruce AitkenPresident and CEO of Methanex Corporation Board member since July 2004
Howard BallochChair of the Public Policy Committee and member of Corporate Governance and Human Resources CommitteesBoard member since December 2004
Phillip CookChair of the Responsible Care Committee and member of Audit, Finance & Risk and Public Policy CommitteesBoard member since May 2006
Tom HamiltonChair of the Corporate Governance Committee and member of Audit, Finance & Risk and Responsible Care CommitteesBoard member since May 2007
Robert KostelnikMember of the Public Policy and Responsible Care CommitteesBoard member since September 2008
Douglas MahaffyMember of the Corporate Governance, Human Resources and Public Policy CommitteesBoard member since May 2006
A. Terence PooleChair of the Audit, Finance & Risk Committee and member of the Corporate Governance and Public Policy CommitteesBoard member since September 2003 and from February 1994 to June 2003
John ReidChair of the Human Resources Committee and member of the Audit, Finance & Risk and Responsible Care CommitteesBoard member since September 2003
Janice RennieMember of the Audit, Finance & Risk and Human Resources CommitteesBoard member since May 2006
Monica SloanMember of the Corporate Governance, Human Resources and Responsible Care CommitteesBoard member since September 2003
Bruce AitkenPresident and Chief Executive Officer
Ian CameronSenior Vice President, Finance and Chief Financial Officer
John FlorenSenior Vice President, Global Marketing and Logistics
John GordonSenior Vice President, Corporate Resources
Michael MacdonaldSenior Vice President, Corporate Development
Randy MilnerSenior Vice President, General Counsel and Corporate Secretary
Paul SchiodtzSenior Vice President, Latin America
Harvey weakeSenior Vice President, Asia Pacific
Jorge yanezSenior Vice President, Caribbean and Global Manufacturing
BOARD OF DIRECTORS
ExECUTIvE lEADERSHIP TEAM
Methanex Corporation is:the world’s largest supplier of methanol to major international markets in North America, Asia Pacific, Europe and Latin America.
Methanol is:a versatile liquid chemical produced primarily from natural gas and used as a chemical feedstock in the manufacture of a wide range of consumer and industrial products such as building materials, foams, resins and plastics. The fastest growing markets for methanol are in the energy sector which today represents 30% of methanol demand. Methanol is used to produce methyl tertiary-butyl ether (MTBE), a gasoline component, and there are growing markets for using methanol in energy applications such as direct blending into transportation fuels, dimethyl ether (DME), and biodiesel.
2009 Financial Highlights 02
President’s Message to Shareholders 03
Chairman’s Message on Corporate Governance 08
Management’s Discussion and Analysis 10
Consolidated Financial Statements 49
Notes to Consolidated Financial Statements 57
Head OfficeMethanex Corporation1800 Waterfront Centre200 Burrard StreetVancouver, BC V6C 3M1Tel 604 661 2600Fax 604 661 2676
Toll Free1 800 661 8851Within North America
Web Sitewww.methanex.com
Sales inquiries:[email protected]
Transfer AgentCIBC Mellon Trust acts as transfer agent and registrar for Methanex stock and maintains all primary shareholder records. All inquiries regarding share transfer requirements, lost certificates, changes of address, or the elimination of duplicate mailings should be directed to CIBC Mellon Trust at:
1 800 387 0825Toll Free within North America
Investor Relations Inquiries Jason CheskoDirector, Investor RelationsTel 604 661 2600 [email protected]
Annual General MeetingThe Annual General Meeting will be held at the Vancouver Convention Centre in Vancouver, British Columbia on Thursday, April 29, 2010 at 10:00 a.m. (Pacific Time).
Shares ListedToronto Stock Exchange – MXNasdaq Global Market – MEOHSantiago Stock Exchange – Methanex
Annual Information Form (AIF)The corporation’s AIF can be found online at www.sedar.com.
A copy of the AIF can also be obtained by contacting our head office.
CORpORATe InFORMATIOn
This annual report is printed on Forest Stewardship Council (FSC) certified paper. By printing on FSC certified paper, Methanex is supporting
responsible forest management. Design: Signals Design Group Inc, Vancouver, BC Printing: Metropolitan Fine Printers, Vancouver, BC
09 Annual Repor t
www.methanex.com methanexA Responsible Care® Company
www.methanex.com
Printed in CanadaPlease recycle.


![INFORME ANUAL 2009 CARVAJAL INTERNACIONAL S.A. · informe anual 2009 carvajal internacional s.a. [ 1 ] informe anual 2009 carvajal internacional s.a.](https://static.fdocuments.net/doc/165x107/5c299b8d09d3f2476c8d0a52/informe-anual-2009-carvajal-internacional-sa-informe-anual-2009-carvajal-internacional.jpg)