
ANU Seminar Impacts of Pacific Migration to ANZ · The Development Impacts of Pacific Migration to...
39
Crawford School, ANU, April 3, 2012 The Development Impacts of Pacific Migration to Australia and New Zealand John Gibson f k University of Waik ato
Transcript of ANU Seminar Impacts of Pacific Migration to ANZ · The Development Impacts of Pacific Migration to...
Crawford School, ANU, April 3, 2012
The Development Impacts of Pacific Migration to
Australia and New Zealand
John Gibsonf kUniversity of Waikato

Measuring Impacts is DifficultMeasuring Impacts is Difficult
i i i• Migration is a rare event– Only 3 percent of world population are migrants
• Migrants differ from the general population in age, gender, education etc
• Even matching on these observable traits, most people who “look” similar to migrants don’t p p gmigrate
• Unobservable differences create a selectivity biasy– Have to pay careful attention to the no‐migration counterfactual
– Literature generally done a poor job of this
Migrant selectivity problemMigrant selectivity problem• Migrants are self‐selected notMigrants are self selected not straightforward to evaluate the impact of migrationmigration – Comparisons of outcomes for movers and stayers
fl diff i b d bilimay reflect differences in unobserved ability, skills, motivation, etc rather than the result of
imoving per se• Outcomes for existing migrants may be wrong counterfactual for policy reform calculations modelling outcomes for additional migrants from the Pacific to Australia/New Zealand

Four Levels of the Selectivity problemFour Levels of the Selectivity problem
Typical approach to studying the impacts ofTypical approach to studying the impacts of migration is to compare households with migrants to those withoutmigrants to those withoutSubject to up to 4 selectivity biases
• Selection 1: Household’s decision of whether or not to• Selection 1: Household s decision of whether or not to have members migrate
• Selection 2: Among households engaging in migrationSelection 2: Among households engaging in migration, decision of whether or not to have whole household move
• Selection 3: Decision of whether to return migrate• (Selection 4): Decision of households on the timing of
h iwhen to migrate

I t M V O TiImpacts May Vary Over TimeTh i t f i ti di h h ld i• The impact of migration on sending households is likely to vary with the duration of migration– In the short‐term:– In the short‐term:
• Households lose domestic income that the migrating members normally generated and perhaps have less
d h f fassets due to the costs of financing migration • Migrants may take some time to start paying off their moving costs and to earn enough to start sendingmoving costs and to earn enough to start sending remittances
– In the medium‐term• Left behind household members adapt to their new circumstance and household composition may change
• Remittances may either increase as migrants earn moreRemittances may either increase as migrants earn more or decay as migrant attachment declines with time away
Going from impacts on individual migrants and their households to broader growthand their households to broader growth
and development impacts
Need to consider:
• Productivity (in host country)
• Selectivity• Selectivity
• Opportunity costs
• Transactions costs
• Absorptive capacity (in home country)• Absorptive capacity (in home country)
Same migration flow (e.g. RSE) may bring very different results to different Pacific countries
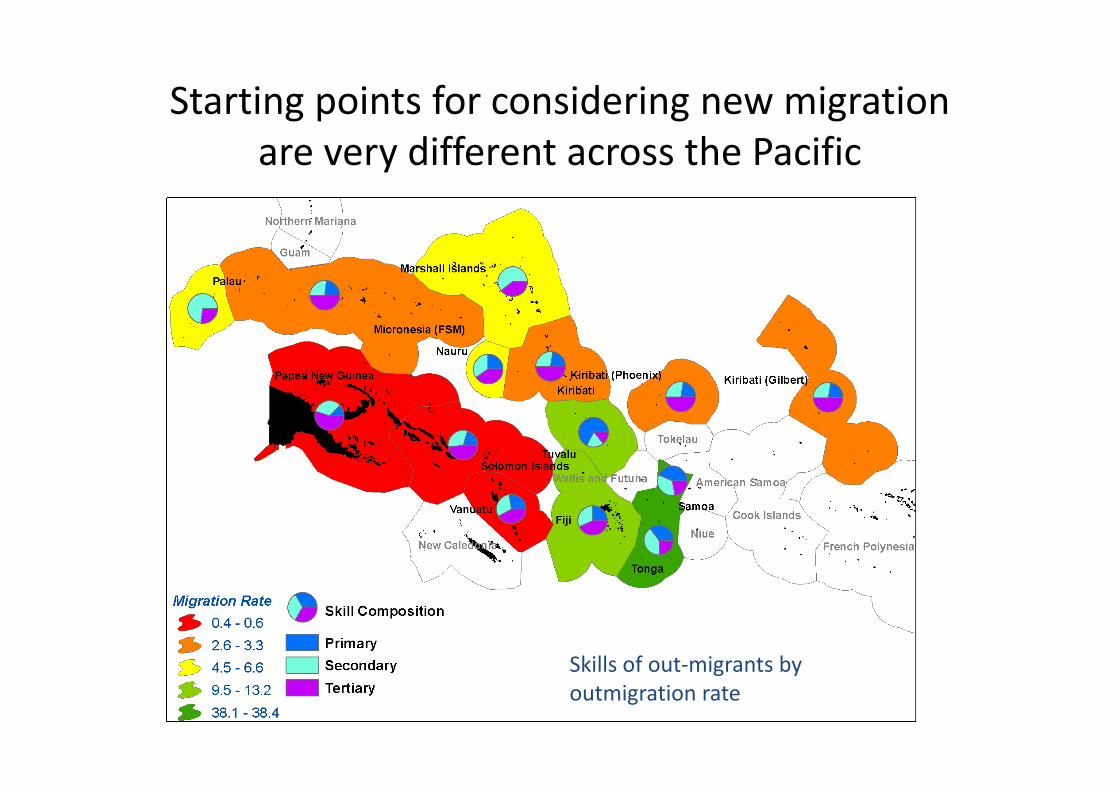
Starting points for considering new migration are very different across the Pacific
Skills of out migrants bySkills of out‐migrants by outmigration rate

Data sources for the results belowData sources for the results belowOn‐going surveys in the Pacific, Australia and NZ since 2005On going surveys in the Pacific, Australia and NZ since 2005• 4 waves of RSE surveys in Tonga and Vanuatu from 2007‐2010
– Baseline interviews and three follow‐ups with householdsBaseline interviews and three follow ups with households with RSE workers and comparison households
• Two waves of PSW surveys in Tonga and Kiribati in 2010 and y g2011
• Samoa Labour Mobility Survey (2008)• Surveys of 30 years of top students from PNG, Tonga, FSM, NZ
who migrated or returned or never left home• Two waves of surveys of Tongan settlement migrants under
New Zealand’s ballot schemes
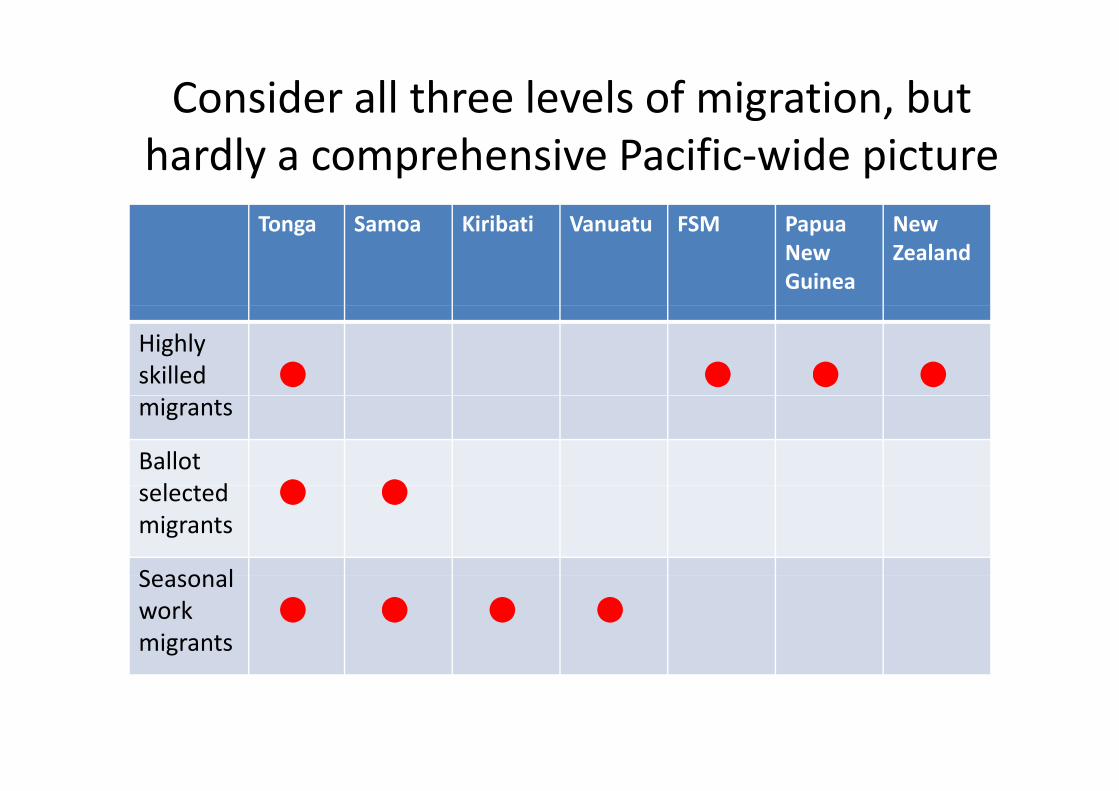
Consider all three levels of migration, but hardly a comprehensive Pacific‐wide picture
S i ib i STonga Samoa Kiribati Vanuatu FSM PapuaNew Guinea
New Zealand
Highly skilled migrants
Ballot l d selected
migrants
SeasonalSeasonal work migrants

Highly Skilled MigrantsHighly Skilled MigrantsT t l f i t t “Th b t d th b i ht t”• Target sample of interest: “The best and the brightest”– individuals who were the best students in their countries at the end of high school from 1976‐2004 in Tonga, FSM, g g , ,PNG and NZ
• Natural counterfactual for measuring impacts– Outcomes for the high skilled who did not migrate
• Comparison of returnees and migrants sifts between p gtwo theories of migration – local attributes of the country of work make individuals
d i h h b dmore productive when they are abroad– workers learn how to be more productive when working abroad and can bring that knowledge back with themabroad and can bring that knowledge back with them
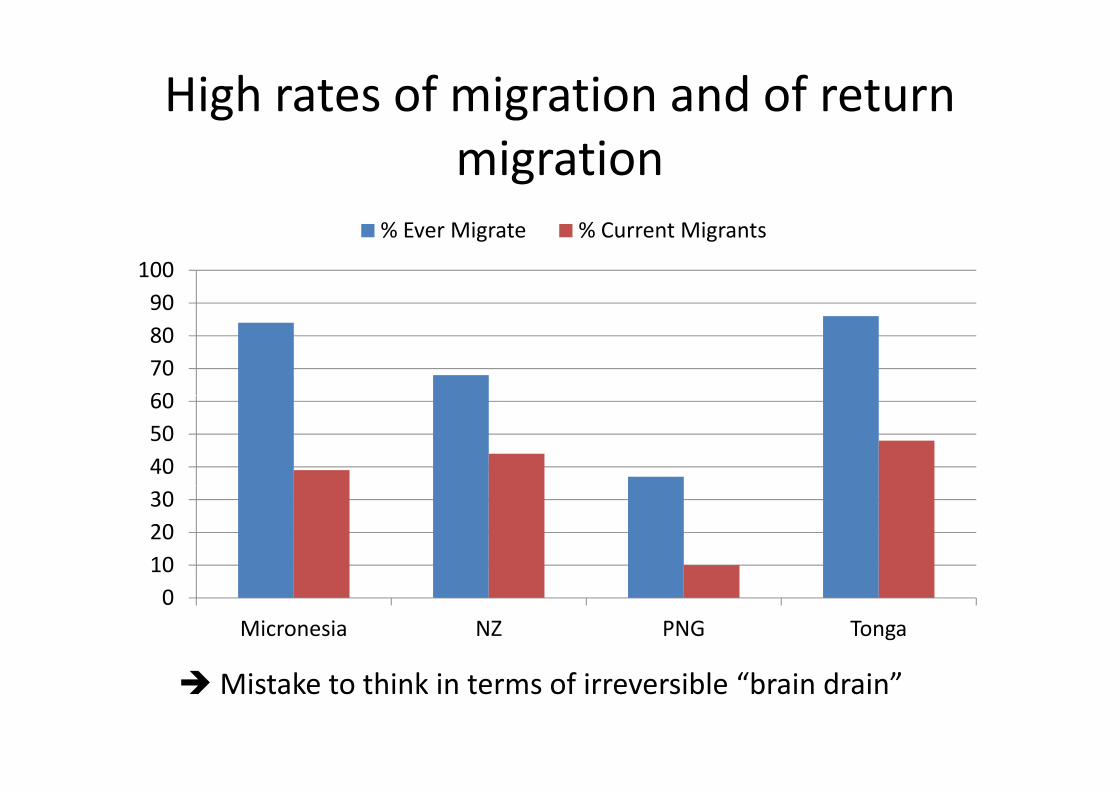
High rates of migration and of return migration
90100
% Ever Migrate % Current Migrants
60708090
405060
102030
0Micronesia NZ PNG Tonga
Mistake to think in terms of irreversible “brain drain”
Understanding the determinantsg(J. Development Economics, 2011)
• Returnees leave behind much higher incomes and return for mainly non‐economic reasonsy– Family commitmentsScholarship/bonding commitments– Scholarship/bonding commitments
• Returnees do not have significant income premium (or productivity premium) over the similarly skilled never‐migrantsy g– supports view that local (non‐portable) attributes of the country of work make individuals morethe country of work make individuals more productive when they are abroad

Measuring the consequencesg q(Economic Journal, 2012)
l t i t th i t th l US$20 000 $40 000• largest gains to the migrants themselves, US$20,000‐$40,000 per year but often ignored in the migration literature– Labour/immigration literature looks at impact on natives in g p
destination (or compare with natives)– Development literature looks at impact on those left behind– Need to consider the “Income per Natural” concept in PacificNeed to consider the Income per Natural concept in Pacific
• Also significant human capital gains• Annual remittances exceed fiscal costs for Tonga and FSM
– Lean public sector, flat income tax and comprehensive consumption tax are good settings for high emigration countries
– While there are high remittances from skilled PNG migrants, fiscalWhile there are high remittances from skilled PNG migrants, fiscal costs are higher because of progressive income tax
• Very little business investment or trade facilitationR t d l i d it th t k i ti– Remoteness and low economic density that make emigration attractive, also limit scope for business development

Gains and losses (annual) from high skilled migration
Net Income Gain Net Remittances Net Fiscal Cost
50
40
30
S$ (0
00)
10
20US
0
10
0Micronesia NZ PNG Tonga
Ballot selected migrantsBallot‐selected migrants
• Random ballot used by NZ immigration authorities to deal with over‐subscription to pSamoa Quota and Pacific Access Category
• Natural counterfactual from the outcomes for• Natural counterfactual from the outcomes for the ballot losers who stay in the Pacific– Still complicated by selective compliance because not all ballot winners end up migrating

Impact on the Tongan migrantsImpact on the Tongan migrants• Labour incomes go up by 263% within the first year of g p y ymigrating (J. Eur Econ Assoc, 2010)– non‐experimental estimators would overstate this by 20‐80% due to positive selection of migrants on unobservables
• Mental health improves, especially for women and those i h l i i i l l h l hwith low initial mental health (J Health Econ, 2009)
• Migrant children have higher weight‐for‐age and height‐f d i h di t hil l ft b hi d hild i thfor‐age and a richer diet, while left behind children in the migrant’s former household have a poorer diet and some decline in anthropometrics (Food Policy 2011)decline in anthropometrics (Food Policy, 2011)
• Blood pressure and hypertension increases, with dietary change (more sodium) and more stress as likely culpritschange (more sodium) and more stress as likely culprits

Would‐be emigrants underestimate earnings in N Z l dNew Zealand
(J. Development Economics, 2012)
600
700 Actual Wages Expected Wages
400
500
wee
k
300
400
NZ$
per w
100
200N
0Actual Lowest Median Mean Highest
Better information on possible outcomes from migration may increase migration pressure in the Pacific

Impacts on the left behind familyImpacts on the left behind family(Rev Economics & Statistics, 2011)
i i d d i i d• Emigration reduced per capita income and wealth, reduced access to financial services and caused switch to a more basic diet
• increased poverty among remaining members p y g gof households with PAC migrants– Impact only measured in short‐term (1 year afterImpact only measured in short term (1 year after migration)
– Impact may turn positive in medium termImpact may turn positive in medium term• Non‐experimental estimators would wrongly imply wealth had increasedimply wealth had increased

Medium term impacts – SamoaMedium term impacts Samoa(Economic Dev & Cultural Change, 2012)
i i d d i i• emigration reduced poverty among remaining members of households with Samoa Quota migrants– Leavers were earning less than the average of the stayers within the household, so absence is less damaging to household income than in Tonga
• suggestive evidence that the impact varies with duration since migration – Remittances and agricultural income decline with the duration since emigration

Why did impacts in Tonga and Samoa differ?
iff i hi h h ld l i i• Different within‐household selectivity– Tongan PAC migrants earned much larger share of income of the household they left behind than did the Samoan Quota migrants
– May reflect different vintages of the two migration streams, with the most positively selected Samoan i t h l d l ft i li hilmigrants perhaps already left in earlier years, while
PAC was much newer policyD ti• Duration– Impact on Tongan households may change in medium
f h f lterm if the migrants remit more after settling in costs
Seasonal migrantsSeasonal migrants
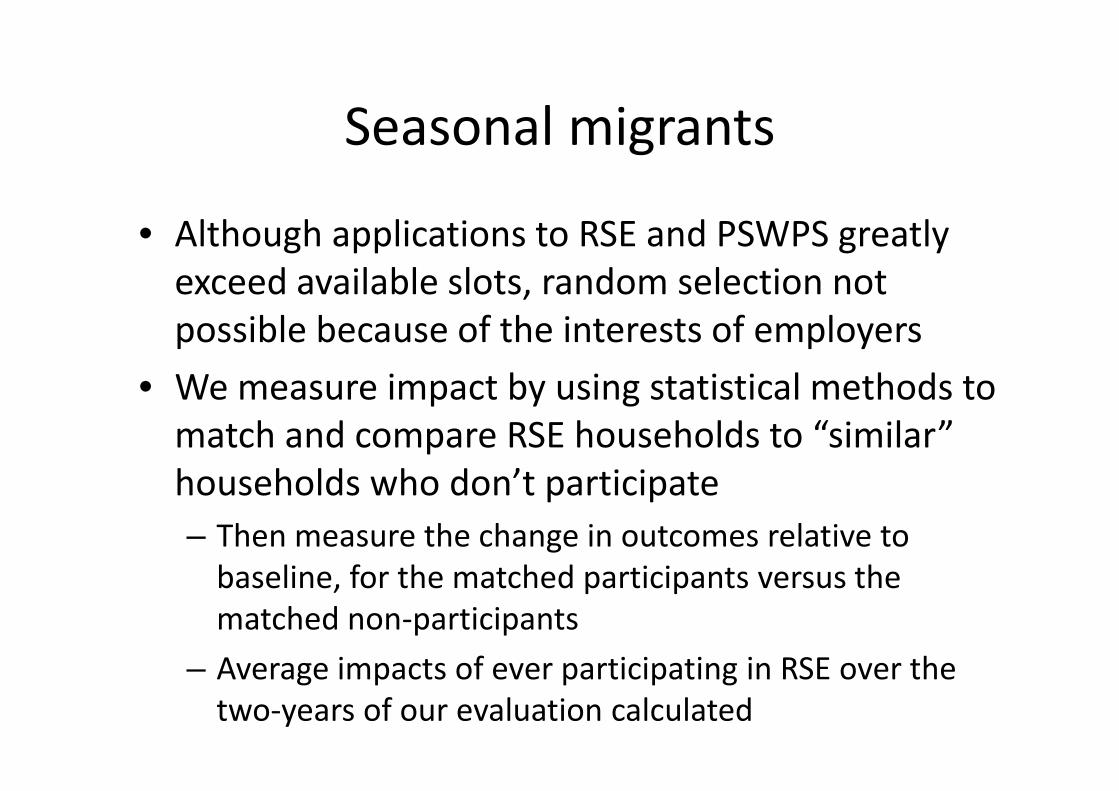
• Although applications to RSE and PSWPS greatly exceed available slots, random selection not possible because of the interests of employers
• Wemeasure impact by using statistical methods toWe measure impact by using statistical methods to match and compare RSE households to “similar” households who don’t participatehouseholds who don t participate– Then measure the change in outcomes relative to baseline for the matched participants versus thebaseline, for the matched participants versus the matched non‐participantsAverage impacts of ever participating in RSE over the– Average impacts of ever participating in RSE over the two‐years of our evaluation calculated

Main results: per capita income and expenditure
45
E
35
40ating in RSE
25
30
m partic
ipa
15
20
crease from
5
10
15
centage Inc
0
5
Income Expenditure
Perc
Tonga Vanuatu

Is this a large or small effect?
$
Some migration accounting• Migrants earned NZ$12,000 in NZ, compared to baseline
household incomes of $NZ1400 per capita in Tonga and NZ$2500 per capita in VanuatuNZ$2500 per capita in Vanuatu
• So if you can earn 5‐7 times per capita income, why is increase “only” 30 40%?increase only 30‐40%?1) Migrants have costs in NZ and of airfare, so amount remitted +
repatriated = NZ$5,5002) This increase is only for one individual per household. Since average
household is 5‐6 members, this makes PER CAPITA increase around NZ$1 100NZ$1,100
3) Only half the households went for 2 years, so average per capita increase over 2 years requires dividing by 1.5
4) Then households face opportunity cost in terms of what migrant would have done at home

Other Economic Welfare Impacts
• Subjective welfare“Imagine a 10‐step ladder, where on the bottom step were the poorest people
and the top step the richest people, state which step of the ladder they thought their household was on today, and on which step their household was on two years ago.”
– We find 0.43 step increase in Tonga and 0.65‐0.77 increase in Vanuatu – approximately 0 5 standard deviation increase in both countriesapproximately 0.5 standard deviation increase in both countries.
• Households with Bank account: – 10‐14 percentage point increase in Tonga from RSE10 14 percentage point increase in Tonga from RSE, – 17‐19 percentage point increase in Vanuatu
• Durables ownership rises for participants in bothDurables ownership rises for participants in both countries
cellphones television DVD players computers– cellphones, television, DVD players, computers, stoves, boats and bicycles

Dwelling improvementsg pFind Tongan households 10‐11 percentage points more likely to have improved dwelling over 2 years if in RSE.Vanuatu households are 7‐8 percentage points more likely (much higher baseline rate due to less permanent housing materials)
Our survey didn’t capture transitions between dwelling typesOur survey didn t capture transitions between dwelling types
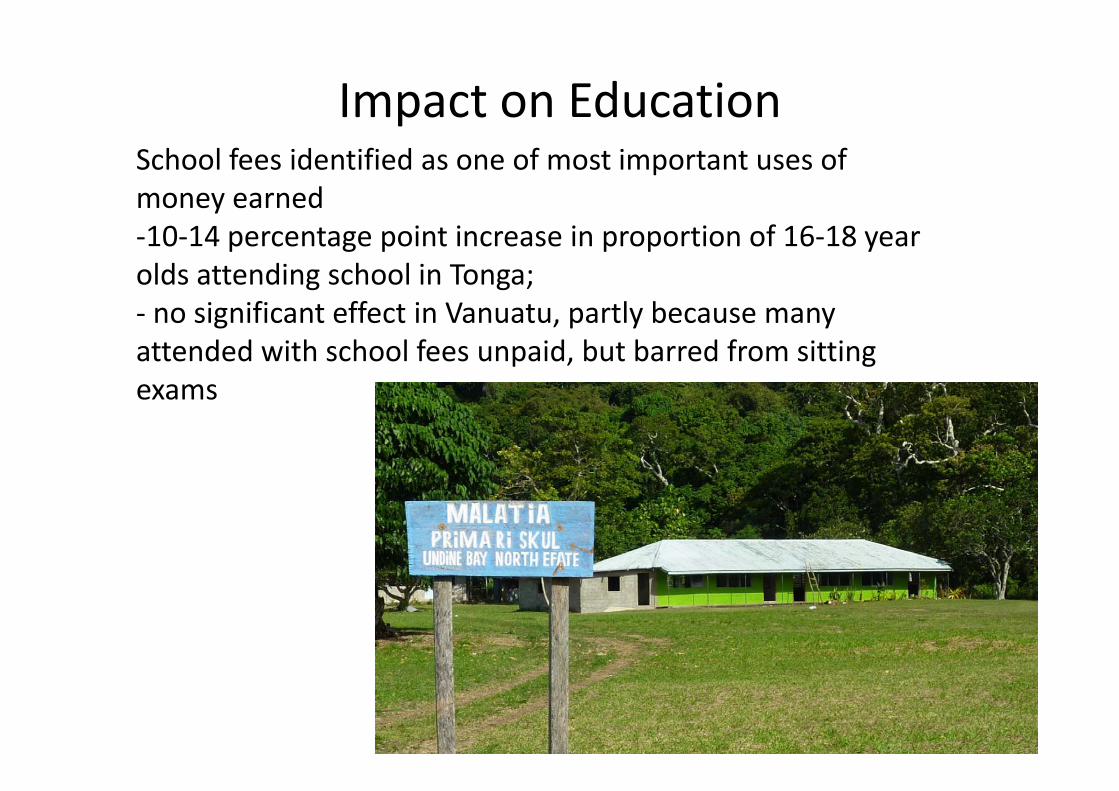
Impact on EducationpSchool fees identified as one of most important uses of money earned‐10‐14 percentage point increase in proportion of 16‐18 year olds attending school in Tonga;
i ifi t ff t i V t tl b‐ no significant effect in Vanuatu, partly because many attended with school fees unpaid, but barred from sitting examsexams

Evaluating the impacts of the PSWPSg p(Asia‐Pacific Viewpoint, 2011)
More difficult than for the RSEMore difficult than for the RSE• Small numbers in PSWPS to date have made a
comprehensive statistical evaluation difficultp• Have data from surveys in Australia, Tonga and Kiribati of
PSW workers, applicants and non‐applicants from the same villages, of similar age and gender, in 2009/10/11
• Focus on the results from Tonga here, to get some i ith RSE ltcomparison with our RSE results
• PSW earnings higher than for RSE but also taxed more, and living costs higher than for RSEand living costs higher than for RSE
Best estimate of earnings less expenses over six months: A$6,000
• Increase in capita income of $A450 or 39 percent forIncrease in capita income of $A450 or 39 percent for members of participating households
Economy wide impactsEconomy‐wide impacts
RSE i ffi i tl l t id id• RSE is sufficiently large to consider economy‐wide impacts rather than just household‐level and migrant‐level impacts described abovemigrant level impacts described above
• Pro‐poor in Tonga but not in Vanuatu (PEB, 2008)– Partly due to different recruitment systems and partly– Partly due to different recruitment systems, and partly the differences in average human capital
• Workers who are equivalent to a NZ employer drawn from l il i T d il i Vlower tail in Tonga and upper tail in Vanuatu
• Opportunity costs and transactions costs also higher for Vanuatuhigher for Vanuatu
• No evidence on difference in productivity or absorptive capacity but only limited increases inabsorptive capacity but only limited increases in domestic businesses from our survey data

SelectivitySelectivity• Tonga ‐‐ “negative selection” (on income)
– RSE workers drawn from households in the poorer parts of the income distribution A iti h h ld l l i t lik l t b Any positive household‐level impacts likely to be pro‐poor
• Samoa “neutral selectivity”• Samoa – “neutral selectivity”– RSE workers drawn from households whose income appears indistinguishable from average householdsappears indistinguishable from average households
• Claim relies on assumed lack of change in consumption since we do not have a baseline for Samoa
• Vanuatu – “positive selection”– RSE workers are from better‐off householdsRSE workers are from better off households
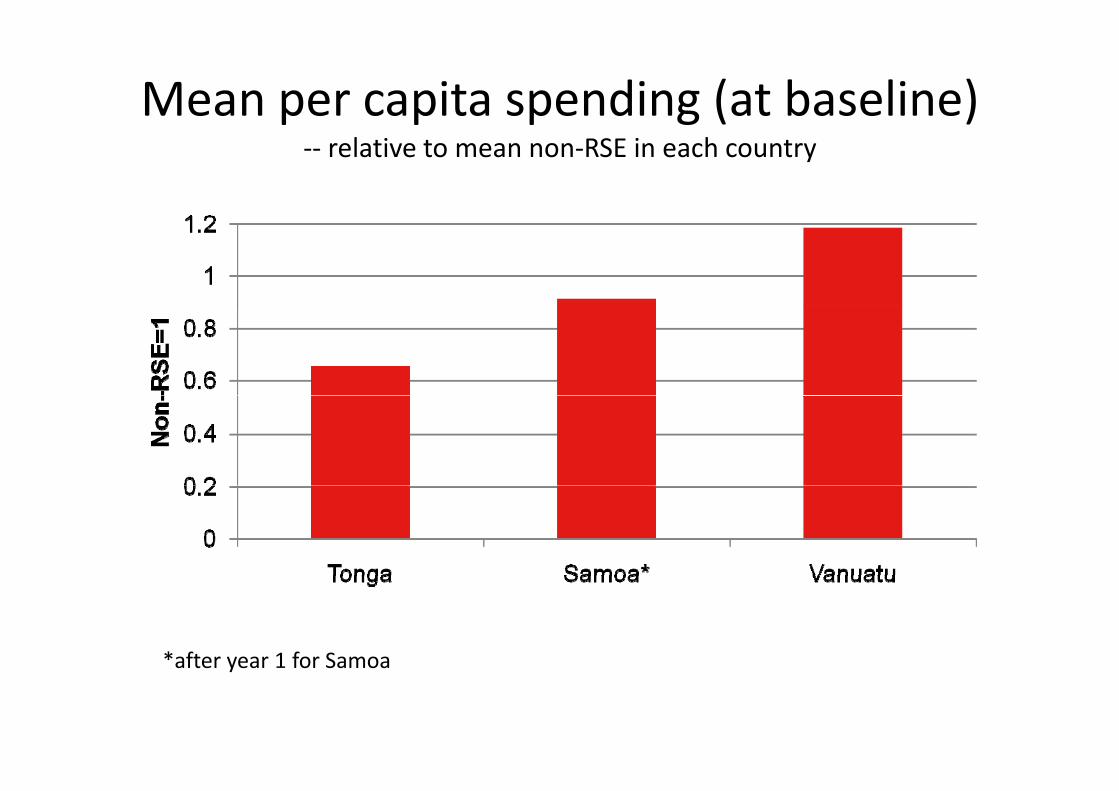
Mean per capita spending (at baseline)‐‐ relative to mean non‐RSE in each country
*after year 1 for Samoaafter year 1 for Samoa
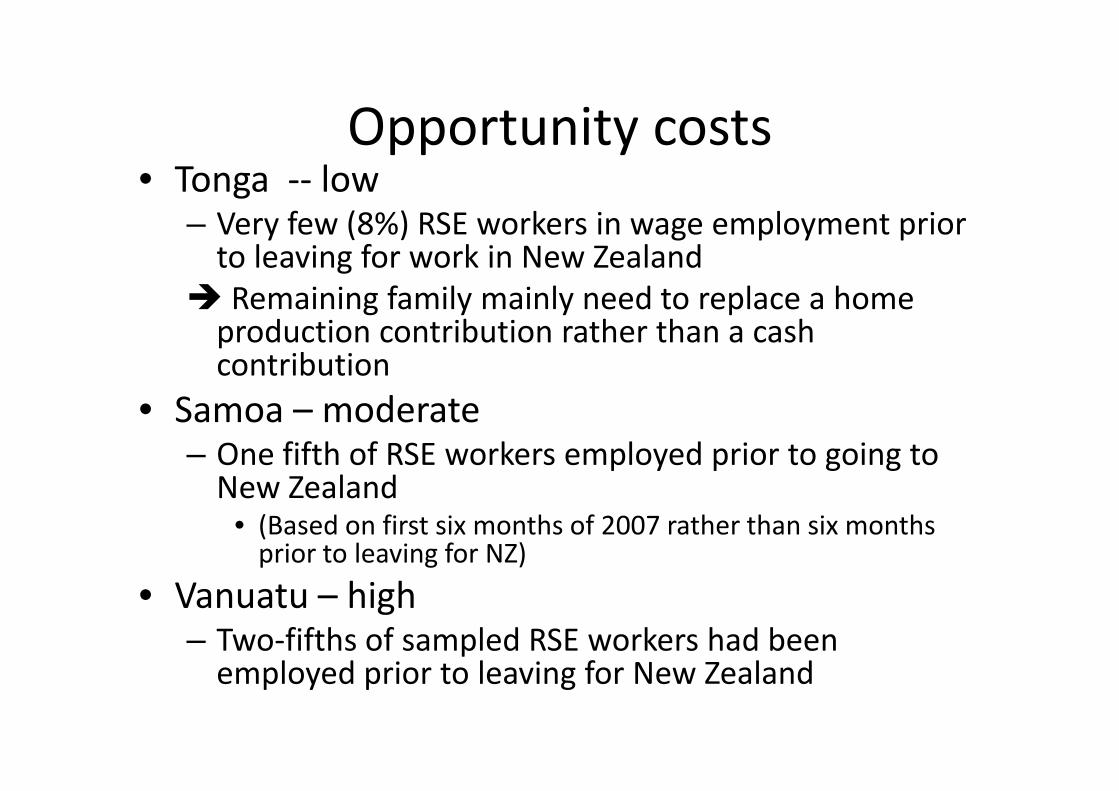
Opportunity costsOpportunity costs• Tonga ‐‐ low
V f (8%) RSE k i l t i– Very few (8%) RSE workers in wage employment prior to leaving for work in New Zealand Remaining family mainly need to replace a home Remaining family mainly need to replace a home production contribution rather than a cash contribution
d• Samoa – moderate– One fifth of RSE workers employed prior to going to New ZealandNew Zealand
• (Based on first six months of 2007 rather than six months prior to leaving for NZ)
• Vanuatu – high– Two‐fifths of sampled RSE workers had been
l d i t l i f N Z l demployed prior to leaving for New Zealand
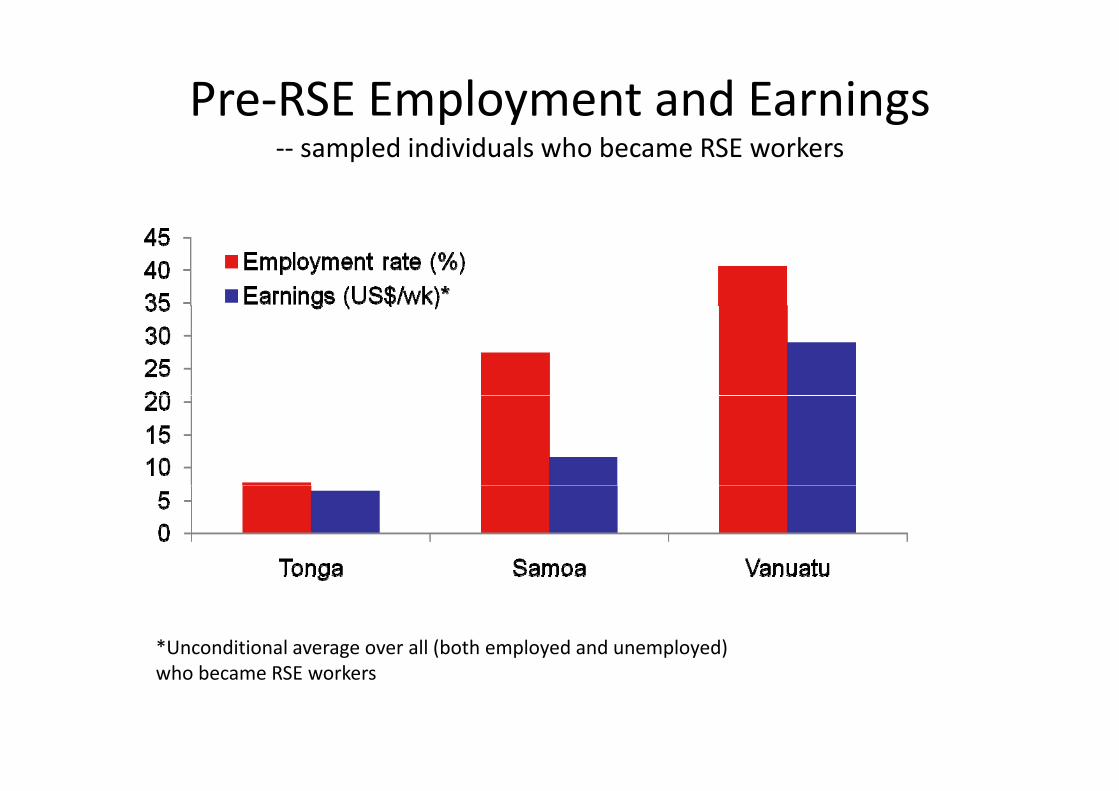
Pre‐RSE Employment and Earnings‐‐ sampled individuals who became RSE workers
*Unconditional average over all (both employed and unemployed) who became RSE workers

Transactions costsTransactions costsHow easy is it for the absent seasonal worker to still be
active in the life of their home household?active in the life of their home household?• Ease of sending money
H l i h i hi f h l f b hi d– Helps with consumption smoothing for the left behind familyRegular smaller remittances may avoid temptation– Regular, smaller, remittances may avoid temptation for waste that often accompanies occasional large cash inflows
• Frequency and duration of communication with homehome– Technology can allow the absent worker a virtual presence in the life of their householdp
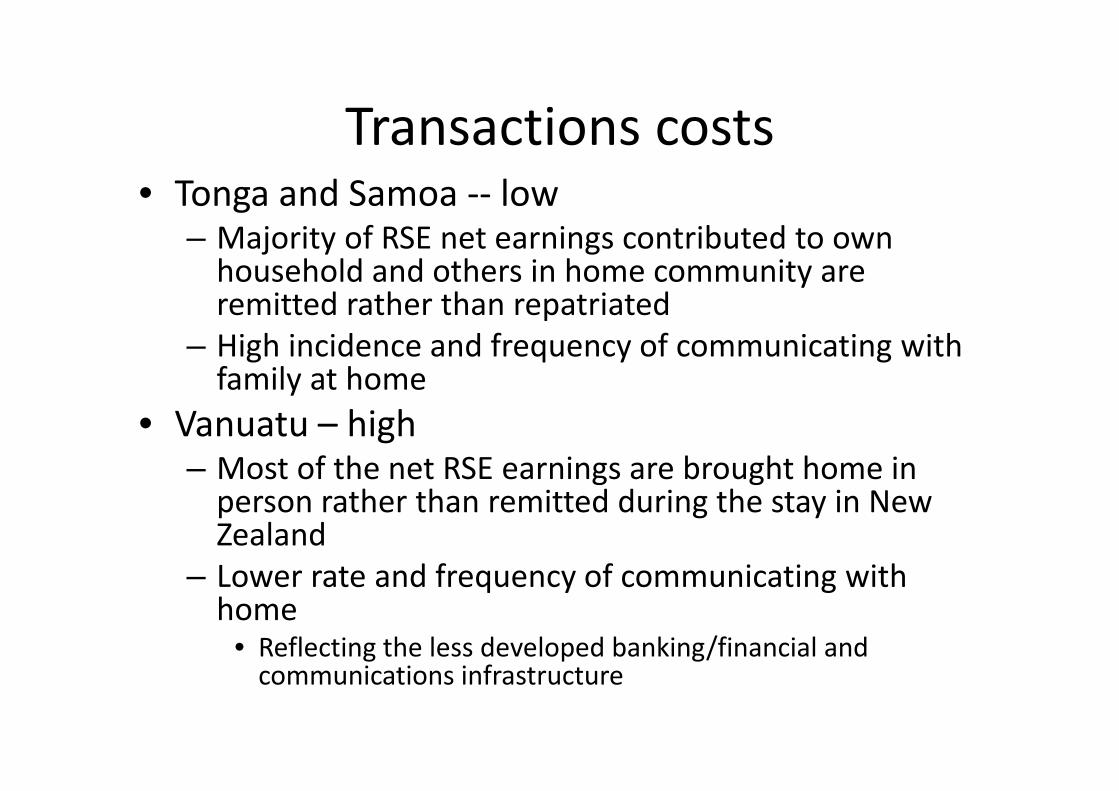
Transactions costsTransactions costs• Tonga and Samoa ‐‐ low
– Majority of RSE net earnings contributed to own household and others in home community are remitted rather than repatriatedremitted rather than repatriated
– High incidence and frequency of communicating with family at homey
• Vanuatu – high– Most of the net RSE earnings are brought home in person rather than remitted during the stay in New ZealandLower rate and frequency of communicating with– Lower rate and frequency of communicating with home
• Reflecting the less developed banking/financial and fcommunications infrastructure

Transactions Costs‐‐ remittances versus repatriated net earnings
0.7
Remitted earnings as share of (remitted + repatriated)
0.5
0.6
e of to
tal
0.3
0.4
d as sh
are
0.1
0.2
Remitted
0
Tonga Samoa Vanuatu

Overall macro impacts of RSEOverall macro impacts of RSETonga Vanuatu
b f k l d / d /Number of RSE workers in New Zealand 2007/8 and 2008/9 1971 3590
Net income gain to country from first two years of program ($NZ) Recognised Seasonal Employer program 5.3 million 9.7 million
New Zealand bilateral aid received in 2009/10 12.7 million 20.7 millionAustralian bilateral aid received in 2009/10 20.7 million 56.1 millionTotal export earnings 2008 11.3 million 43.3 million
Use our per‐worker estimates of average impacts on household income and scale up by total number of workers hired from each country• equivalent to almost half of NZ aid to these countries• equivalent to almost one‐half of value of Tonga’s exports and one‐quarter for V tVanuatu

Conclusions (1)Conclusions (1)
ll h f h i b i f• Well short of having robust estimates of development impact of Pacific migration
• Selectivity and impacts differ between apparently similar sets of migrantspp y g– Quota settlement migrants from Samoa vs Tonga– Seasonal migrants from Tonga vs VanuatuSeasonal migrants from Tonga vs Vanuatu
• Given unmet demand for migration opportunities scope for policy makers andopportunities, scope for policy makers and researchers to work together
d i i b b h f i d i f i– randomization can be both fair and informative
Conclusions (2)Conclusions (2)
Bi i h i di id l i• Biggest gains are to the individual migrant– They don’t stop being part of the Pacific when they move to Australia/New Zealand so these benefits should be countedAustralia/New Zealand so these benefits should be counted
• ‘Brain drain’ fears are overstated• Seasonal migration provides large benefits relative to• Seasonal migration provides large benefits relative to other popular development interventions– But small relative to the impact of settlement migrationBut small relative to the impact of settlement migration
• Hoped for impacts of skilled returnees and cashed‐up seasonal workers kick starting domestic entrepreneurialseasonal workers kick starting domestic entrepreneurial activity are probably unrealistic– Remoteness and low economic density that make emigration attractive, also limit scope for local business development
Acknowledgementsg• Collaborators
– David McKenzie ‐World Bank– Steven Stillman – Otago– Halahingano Rohorua – Waikato
• Funders and supporters– World Bank– Department of Labour, New Zealand – Ministry of Labour, Commerce and Industries, Tonga– Department of Labour, Vanuatu– Samoa Bureau of Statistics– Waikato Management School– Royal Society of New Zealand Marsden Fund
• For more information visit:www.pacificmigration.ac.nz