
Antioxidant nutrition in Atlantic salmon Salmo salar) parr ... · Antioxidant nutrition in Atlantic...
26
Antioxidant nutrition in Atlantic salmon (Salmo salar) parr and post-smolt, fed diets with high inclusion of plant ingredients and graded levels of micronutrients and selected amino acids Kristin Hamre 1,2 , Nini H. Sissener 1 , Erik-Jan Lock 1 , Pa ˚l A. Olsvik 1 , Marit Espe 1 , Bente E. Torstensen 1 , Joana Silva 3 , Johan Johansen 4 , Rune Waagbø 1,2 and Gro-Ingunn Hemre 1 1 National Institute of Nutrition and Seafood Research (NIFES), Bergen, Norway 2 Department of Biology, University of Bergen, Bergen, Norway 3 Biomar AS, Trondheim, Norway 4 GIFAS, Inndyr, Norway ABSTRACT The shift from marine to plant-based ingredients in fish feeds affects the dietary concentrations and bioavailability of micronutrients, amino acids and lipids and consequently warrants a re-evaluation of dietary nutrient recommendations. In the present study, an Atlantic salmon diet high in plant ingredients was supplemented with graded levels of nutrient premix (NP), containing selected amino acids, taurine, cholesterol, vitamins and minerals. This article presents the results on the antioxidant nutrients vitamin C, E and selenium (Se), and effects on tissue redox status. The feed ingredients appeared to contain sufficient levels of vitamin E and Se to cover the requirements to prevent clinical deficiency symptoms. The body levels of a-tocopherol (TOH) in parr and that of Se in parr and post-smolt showed a linear relationship with dietary concentration, while a-TOH in post-smolt seemed to be saturable with a breakpoint near 140 mg kg -1 . Ascorbic acid (Asc) concentration in the basal feed was below the expected minimum requirement, but the experimental period was probably too short for the fish to develop visible deficiency symptoms. Asc was saturable in both parr and post-smolt whole body at dietary concentrations of 190 and 63–89 mg kg -1 , respectively. Maximum whole body Asc concentration was approximately 40 mg kg -1 in parr and 14 mg kg -1 in post-smolt. Retention ranged from 41 to 10% in parr and from -206 to 12% in post-smolt with increasing NP supplementation. This indicates that the post-smolts had an extraordinarily high consumption of Asc. Analyses of glutathione (GSH) and glutathione disulphide (GSSG) concentrations and the calculated GSH based redox potentials in liver and muscle tissue, indicated only minor effects of diets on redox regulation. However, the post-smolt were more oxidized than the parr. This was supported by the high consumption of Asc and high expression of gpx1 and gpx3 in liver. Based on the present trials, the recommendations for supplementation of vitamin C and E in diets for Atlantic salmon are similar to current practices, e.g. 150 mg kg -1 of a-TOH and 190 mg kg -1 Asc which was the saturating concentration in parr. Higher concentrations than what would prevent clinical deficiency symptoms are necessary How to cite this article Hamre et al. (2016), Antioxidant nutrition in Atlantic salmon (Salmo salar) parr and post-smolt, fed diets with high inclusion of plant ingredients and graded levels of micronutrients and selected amino acids. PeerJ 4:e2688; DOI 10.7717/peerj.2688 Submitted 17 May 2016 Accepted 14 October 2016 Published 8 November 2016 Corresponding author Kristin Hamre, [email protected] Academic editor Barbara Nowak Additional Information and Declarations can be found on page 20 DOI 10.7717/peerj.2688 Copyright 2016 Hamre et al. Distributed under Creative Commons CC-BY 4.0
Transcript of Antioxidant nutrition in Atlantic salmon Salmo salar) parr ... · Antioxidant nutrition in Atlantic...

Antioxidant nutrition in Atlantic salmon(Salmo salar) parr and post-smolt,fed diets with high inclusion of plantingredients and graded levels ofmicronutrients and selected amino acids
Kristin Hamre1,2, Nini H. Sissener1, Erik-Jan Lock1, Pal A. Olsvik1,Marit Espe1, Bente E. Torstensen1, Joana Silva3, Johan Johansen4,Rune Waagbø1,2 and Gro-Ingunn Hemre1
1 National Institute of Nutrition and Seafood Research (NIFES), Bergen, Norway2 Department of Biology, University of Bergen, Bergen, Norway3 Biomar AS, Trondheim, Norway4 GIFAS, Inndyr, Norway
ABSTRACTThe shift from marine to plant-based ingredients in fish feeds affects the dietary
concentrations and bioavailability of micronutrients, amino acids and lipids and
consequently warrants a re-evaluation of dietary nutrient recommendations. In the
present study, an Atlantic salmon diet high in plant ingredients was supplemented
with graded levels of nutrient premix (NP), containing selected amino acids, taurine,
cholesterol, vitamins and minerals. This article presents the results on the
antioxidant nutrients vitamin C, E and selenium (Se), and effects on tissue redox
status. The feed ingredients appeared to contain sufficient levels of vitamin E and Se
to cover the requirements to prevent clinical deficiency symptoms. The body levels
of a-tocopherol (TOH) in parr and that of Se in parr and post-smolt showed a linear
relationship with dietary concentration, while a-TOH in post-smolt seemed to be
saturable with a breakpoint near 140 mg kg-1. Ascorbic acid (Asc) concentration in
the basal feed was below the expected minimum requirement, but the experimental
period was probably too short for the fish to develop visible deficiency symptoms.
Asc was saturable in both parr and post-smolt whole body at dietary concentrations
of 190 and 63–89 mg kg-1, respectively. Maximum whole body Asc concentration
was approximately 40 mg kg-1 in parr and 14 mg kg-1 in post-smolt. Retention
ranged from 41 to 10% in parr and from -206 to 12% in post-smolt with increasing
NP supplementation. This indicates that the post-smolts had an extraordinarily high
consumption of Asc. Analyses of glutathione (GSH) and glutathione disulphide
(GSSG) concentrations and the calculated GSH based redox potentials in liver and
muscle tissue, indicated only minor effects of diets on redox regulation. However,
the post-smolt were more oxidized than the parr. This was supported by the high
consumption of Asc and high expression of gpx1 and gpx3 in liver. Based on the
present trials, the recommendations for supplementation of vitamin C and E in diets
for Atlantic salmon are similar to current practices, e.g. 150 mg kg-1 of a-TOH
and 190 mg kg-1 Asc which was the saturating concentration in parr. Higher
concentrations than what would prevent clinical deficiency symptoms are necessary
How to cite this article Hamre et al. (2016), Antioxidant nutrition in Atlantic salmon (Salmo salar) parr and post-smolt, fed diets with
high inclusion of plant ingredients and graded levels of micronutrients and selected amino acids. PeerJ 4:e2688; DOI 10.7717/peerj.2688
Submitted 17 May 2016Accepted 14 October 2016Published 8 November 2016
Corresponding authorKristin Hamre, [email protected]
Academic editorBarbara Nowak
Additional Information andDeclarations can be found onpage 20
DOI 10.7717/peerj.2688
Copyright2016 Hamre et al.
Distributed underCreative Commons CC-BY 4.0
to protect fish against incidents of oxidative stress and to improve immune and
stress responses. There were no indications that the Se requirement exceeded the
current recommendation of 0.3 mg kg-1.
Subjects Agricultural Science, Aquaculture, Fisheries and Fish Science, Veterinary Medicine
Keywords Antioxidant nutrients, Vitamin C, Vitamin E, Selenium, Atlantic salmon,
Redox regulation, Nutrient requirement
INTRODUCTIONThe shift from marine to plant-based ingredients in fish feeds leads to changes in dietary
concentrations and bioavailability of several nutrients. So far, research on plant-based
diets for Atlantic salmon has mainly focused on balancing the amino acid profile and
reducing the amounts of antinutrients (Espe et al., 2006; Espe et al., 2007; Krogdahl, Hemre
& Mommsen, 2005), while micronutrients have received far less attention. In the present
study, two feeding experiments were conducted on salmon, one with parr in freshwater
and one with post-smolt in seawater, using a basic diet containing 10% fishmeal and 3.5%
fish oil of the total recipe, in addition to plant-based protein and lipid sources. A nutrient
premix (NP), containing potentially critical micronutrients, amino acids, taurine and
cholesterol, was added at graded levels to this diet and health indicators and biomarkers
were used to estimate optimal supplementation of the different nutrients. Hemre et al.
(2016) presents data on general fish performance, retention of macronutrients, B-vitamins
and amino acid metabolism. Data on selected minerals and vitamin A, D and K are
presented by E.-J. Lock, 2016, unpublished data. The present publication is related to
antioxidant nutrients and redox regulation.
Vitamin E is the general term for a group of lipid soluble antioxidants, tocopherols and
tocotrienols, where a-tocopherol (a-TOH) has the highest biological activity (United
States Pharmacopeia 1993). a-TOH is selectively retained in the body of mammals
(Kayden & Traber, 1993; Rigotti, 2007) and Atlantic salmon (Hamre, 2011;Hamre, Berge &
Lie, 1998), possibly due to a liver TOH binding protein, with high affinity for this isomer
(Kayden & Traber, 1993; Yoshida et al., 1992). Vitamin E breaks the chain of lipid
peroxidation by reducing fatty acid peroxide radicals, preventing oxidation of new
fatty acids (Buettner, 1993). It takes approximately three months for Atlantic salmon parr
to adjust their body concentration of a-TOH to the dietary concentration and there
is a linear relation between dietary and whole body concentrations when dietary
a-TOH ranges between 0 and 300 mg kg-1. The slope is quite reproducible between
experiments, at approximately 0.25 between fish concentration on wet weight and feed
concentration on dry weight (Hamre et al., 1997; Hamre & Lie, 1995). Vitamin E is
added as a-tocopheryl acetate (a-TOAc) in fish feed, thereby protected against
oxidation. The requirement is highly variable, in rainbow trout (Oncorhynchus mykiss)
dietary requirements between 5 and 100 mg kg-1 have been reported, dependent on
dietary composition and experimental conditions. Factors that affect the vitamin E
requirement are dietary polyunsaturated fatty acid (PUFA), vitamin C and Se
concentrations and oxidized feed (Hamre, 2011). Furthermore, the estimated requirement
Hamre et al. (2016), PeerJ, DOI 10.7717/peerj.2688 2/26

varies with the response variable used. Hemoglobin (Hb) concentration is a sensitive
indicator of overall health and growth performance while indicators of immune function
respond at higher dietary levels of vitamin E and will often give very high requirement
assessments (Hamre, 2011). In the present study, �-TOH is used as a representative of the
non-a-TOHs, since it is often present in plant oils at high concentrations.
In classical nutrition, vitamin C (ascorbic acid (Asc)) has a well defined role as a
cofactor for the enzymes catalyzing the hydroxylation of proline and lysine, necessary for
formation of collagen and bone matrix (Barnes & Kodicek, 1972; Gould et al., 1960; Terova
et al., 1998). The function of Asc is to keep the iron present at the enzymes’ active site
in the reduced state (Meister, 1994). More generally, Asc is a water-soluble antioxidant,
it scavenges free radicals and probably participates in recycling oxidized vitamin E
(Hamre et al., 1997; Tappel, 1962). The resulting Asc radical or dehydroascorbic acid can in
turn be reduced by glutathione (GSH) and ultimately by NADPH produced in energy
metabolism (Martensson & Meister, 1991). It was not until stable and fully bioavailable
forms of vitamin C were developed that meaningful requirement studies in fish could be
designed (Woodward, 1994). Sandnes, Torrissen & Waagbø (1992) performed one of the
first of such studies in Atlantic salmon using Ca ascorbate-monophosphate (AP). They
found a minimum dietary requirement, based on growth, mortality and skin and
backbone hydroxyproline concentration, of 10–20 mg kg-1. Severe deficiency symptoms
appeared first after 18 weeks of feeding the non-supplemented diet. Concentration of Asc
in the liver was linearly related to dietary AP up to 160 mg kg-1 Asc equivalents. The
appearance of vitamin C deficiency symptoms depends on the dietary concentration of
vitamin E and is probably affected by other variations in the experimental conditions as
well (Dabrowski et al., 2004; Gabaudan & Verlhac, 2001; Sandnes, Torrissen & Waagbø,
1992). It is common for several fish species that dietary Asc required for maximum body
or tissue storage surpasses the requirement levels for growth, survival and hydroxyproline
concentrations (NRC, 2011). Furthermore, immune response indicators are stimulated by
Asc levels far above conventional requirements, which also protect against stress (Trichet,
2010; Waagbø, 1994; Waagbø, 2006).
Selenium (Se) is an essential trace element inserted in selenocysteine (Sec), situated at
the active site of Se dependent proteins, termed selenoproteins (Brigelius-Flohe, 1999).
The selenoproteins can be grouped in stress-related and housekeeping proteins, the
first group responds readily to dietary Se and includes GSH peroxidase (GPX) 1 and 3
(Penglase et al., 2014). In mammals, the dietary Se level at which GPX1 activity and gene
expression level off, is used as an indicator of the Se requirement (Sunde et al., 2009;Weiss
et al., 1996; Weiss et al., 1997). GPX1 activity in rainbow trout plasma followed a similar
trajectory to that in mammalian tissues and leveled off at dietary Se levels (given as
Na2SeO3) between 0.15 and 0.38 mg kg-1 (Hilton, Hodson & Slinger, 1980). However, in
zebrafish, maximum growth correlated with minimum whole body GPX1 activity and
mRNA expression at 0.3 mg kg-1 dietary Se. Dietary Se above this level reduced growth
and increased GPX1 activity and expression (Penglase et al., 2014). This may indicate
that the relation between GPX1 and Se requirement is different in fish and mammals.
Hamre et al. (2016), PeerJ, DOI 10.7717/peerj.2688 3/26

There was a linear relationship between dietary Se in the range 0.1–1.0 mg kg-1 and whole
body Se concentrations in the zebrafish study (Penglase et al., 2014).
The cellular redox environment affects the cell’s fate because gene expression, protein
function and molecular pathways are often redox sensitive (Go & Jones, 2013; Jones & Sies,
2015; Kirlin et al., 1999). The key mechanism is that protein cysteine residues switch
between oxidized and reduced states corresponding to active and inactive states of
the involved proteins (redox switches). An example is that a more oxidized cellular
environment induces a redox switch that releases the nuclear factor-erythroid 2-related
factor 2 (NFE2L2) transcription factor from a complex with another protein, Kelch Like
ECH Associated Protein 1 (KEAP1). Once released, NFE2L2 induces the transcription of
at least 50 mammalian genes; many of which code for antioxidants, thiol oxidoreductases
and GSH synthesis/recycling genes; that are involved in maintaining the redox balance
and/or are involved in redox signaling (reviewed byMa, 2013). Cellular redox homeostasis
is thought to be maintained by redox couples that act as electron buffers due to their
ability to readily cycle between oxidized and reduced forms (Jones & Sies, 2015). The
major redox couples are reduced/oxidized glutathione (2GSH/GSSG), cysteine (2Cys/
CySS) and thioredoxin (Trx(SH)2/TrxSS) (Huseby, Sundkvist & Svineng, 2009) and the
related redox potential (E) is proportional to the ratio between the (reduced)2 and
oxidized forms of the redox couples, according to the Nernst Equation. GSH/GSSG is
present in cells in high concentrations. It may therefore be the most important cellular
redox couple and is used as an indicator of tissue redox state in the present study. The
GSH based redox potential seems to be strictly regulated in Atlantic salmon (Hamre et al.,
2010). A hypothesis of the present study is therefore that GSH/GSSG concentrations and
EGSH are stable in healthy fish and can be used as indicators of fish welfare during the
growth phase in salmon. On the other hand, the 2GSH/GSSG redox couple and many
genes coding for proteins that maintain the cellular redox system are dynamically
regulated during fish embryonic and larval development (Hamre et al., 2014; Penglase
et al., 2015; Skjærven et al., 2013; Timme-Laragy et al., 2013).
Here we present data on antioxidant nutrients and redox regulation of two feeding
trials (freshwater and seawater) with graded NP levels. Tissue concentrations and
retention of vitamin C, E and Se, traditionally viewed as the main antioxidant nutrients, as
well as effects of a graded NP on tissue GSH/GSSG concentrations and the related redox
potentials, were analyzed. We have also measured the expression of some central genes for
regulation of redox homeostasis in the liver; the transcription factor nfe2l2, cuznsod,
mnsod, cat, gpx1 and gpx3 which metabolize superoxide anions and H2O2, gclc which
translates into the rate limiting protein in GSH synthesis, and g6pd and gr involved in
keeping GSH in the reduced state.
MATERIALS AND METHODSExperimental dietsThe seven experimental diets were produced at Biomar Technology Centre (Denmark),
as described in Hemre et al. (2016). All diets contained the same basal mixture of
ingredients (10.4% marine protein ingredients and 3.5% fish oil of the whole receipt, the
Hamre et al. (2016), PeerJ, DOI 10.7717/peerj.2688 4/26

rest plant ingredients, Table 1). A NP was added in graded amounts, replacing some of
the field peas in the formulation. Phosphate, lysine, threonine and choline were added to
all diets in equal amounts. An antioxidant mixture to protect the feed during
production, and yttrium for later digestibility measurements were also added to all diets.
Diet acronyms were as follows: 0NP had no addition of the micronutrient premix, then
the NP was added in graded amounts to the six diets called 25, 50, 100, 150, 200
and 400NP. The general idea was that the 100NP diets should contain 100% of the
assumed requirement, achieved by addition of the NP to the basal diet (based on
available data, primarily for rainbow trout (NRC, 2011) for each nutrient). However,
some nutrients such as a-tocopherol and Se were already present at or above expected
minimum requirements in the basal diet, but these were added in the NP to achieve
increasing levels in the seven diets and to examine if higher requirements could be
assessed. The 25NP diet contained 0.25 times the NP from the 100NP diet, while the
400NP contained four times the NP from the 100NP diet. As all nutrients were also
present in the diet ingredients to some extent (not only contributed by the NP), the
400NP diet would never have four times higher content than the 100NP diet, and the
fold difference would vary depending on the contribution from the NP versus the diet
ingredients for each nutrient. The NP contained vitamin D3, a-tocopheryl acetate,
vitamin K3, vitamin A1, ascorbyl monophosphate, vitamin B6, biotin, cobalamin, folate,
pantothenic acid, riboflavin, thiamine, niacin, Se (as inorganic sodium selenite), iodine,
copper, cobalt, manganese, zinc, crystalline DL-methionine, and taurine. Crystalline
L-histidine and cholesterol were also added in graded amounts. The analyzed
Table 1 Feed formulation Trial 1, and with slight difference given for Trial 2 in parenthesis (Trial 2). Nutrient premix, methionine, taurine and
cholesterol were added to the diets in graded amounts, and balanced by reducing the content of field peas in the diets, all other ingredients were
used in equal amounts in all diets. Numbers are in g kg-1.
Composition 0NP 25NP 50NP 100NP 150NP 200NP 400NP
Fish meal SA 68 superprime 80 80 80 80 80 80 80
Krill meal 24.2 24.2 24.2 24.2 24.2 24.2 24.2
Soy Prot. Conc. 60% 180 180 180 180 180 180 180
Corn gluten 60 40 40 40 40 40 40 40
Pea protein 75 124 (130) 124 (130) 124 (130) 124 (130) 124 (130) 124 (130) 124 (130)
Wheat gluten 180 (150) 180 (150) 180 (150) 180 (150) 180 (150) 180 (150) 180 (150)
Wheat 61 (60) 61 (60) 61 (60) 61 (60) 61 (60) 61 (60) 61 (60)
Field peas 100 98 95 90 85 80 60
Fish oil, capelin 35 (44) 35 (44) 35 (44) 35 (44) 35 (44) 35 (44) 35 (44)
Rapeseed oil 79 (88) 79 (88) 79 (88) 79 (88) 79 (88) 79 (88) 79 (88)
Linseed oil 22 22 22 22 22 22 22
Palm kernel oil 44 (48) 44 (48) 44 (48) 44 (48) 44 (48) 44 (48) 44 (48)
Nutrient premix* 0 0.25 0.5 1.0 1.5 2.0 4.0
Histidine 0.00 0.34 0.68 1.36 2.04 2.72 5.44
Cholesterol 0.00 0.28 0.56 1.13 1.69 2.25 4.50
Note:* Times requirement. All diets were added 38 g kg-1 monosodium phosphate, mineral additions were adjusted to each micronutrient premix (E.-J. Lock, 2016,unpublished data). All diets were added 9.3 g kg-1 lysine, 1.8 g kg-1 threonine, 8 g kg-1 choline (50%), 0.25 g kg-1 barox becp dry, 0.5 g kg-1 yttrium oxide.
Hamre et al. (2016), PeerJ, DOI 10.7717/peerj.2688 5/26

composition of the diets can be found in Table 2, including proximate composition and
contents of the micronutrients focused in this presentation.
Feeding trialsBoth feeding trials were conducted in accordance with Norwegian laws and regulations
concerning experiments with live animals, which are overseen by the Norwegian Food
Safety Authority.
Trial 1: The trial with parr in freshwater took place at the Institute of Marine Research
(Matredal, 61�N, Western Norway). The salmon were hatched in February, and in June
the salmon parr were randomly distributed in fifteen 400 litre (1 � 1 � 0.4 m3)
experimental tanks and acclimated for 1 week while being fed a commercial feed (Ewos).
The trial commenced on July 3rd, with duplicate tanks for each diet with the exception of
NP100 that was run in triplicates. Each tank contained 100 fish with mean initial body
weight of 18.3 ± 2.2 g. The fish were fed ad libitum with continuous feeding from
automated feeders during night and day. However, care was taken to limit overfeeding,
due to uncertainties in the collection of uneaten feed at such a small pellet size. Collection
and weighing of uneaten feed was conducted daily at 13:00, with the exception of
weekends. The fish were exposed to continuous light, and oxygen saturation was
Table 2 Analyzed feed composition. All results are the mean of two analytical parallels. Protein, lipid,
starch ash and dry matter are given in g kg-1 dry weight, energy as MJ kg-1, while all other diet com-
ponents are given as mg kg-1. Slight difference in macronutrient composition; Trial 2 is given in
parenthesis.
0NP 25NP 50NP 100NP 150NP 200NP 400NP
Proximate composition, g kg-1 dw
Protein 453 (480) 469 (472) 449 (440) 456 (480) 462 (480) 470 (480) 461 (480)
Lipid 213 (220) 203 (220) 219 (210) 211 (230) 208 (220) 197 (240) 195 (220)
Starch 112 112 109 104 106 107 94
Ash 66 68 66 67 69 60 75
Dry matter 910 (950) 930 (940) 920 (930) 920 (930) 930 920 (930) 920
Energy, MJ kg-1 22.8 22.7 22.6 22.7 22.4 22.5 22.0
Micronutrients involved in redox regulation mg kg-1 dw
Trial1:
a-TOH 48 72 84 118 153 193 339
�-TOH 49 54 60 61 51 52 51
Ascorbic acid 4.71 21 43 86 143 192 351
Selenium 0.42 0.45 0.52 0.62 0.80 1.04 1.39
Trial2:
a-TOH 76 91 109 141 178 230 239
�-TOH 54 51 51 52 54 61 55
Ascorbic acid < 5.5 14 28 63 89 140 170
Selenium 0.47 0.48 0.56 0.79 0.91 1.0 1.1
Note:1 Below the limit of quantification, uncertain value.
Hamre et al. (2016), PeerJ, DOI 10.7717/peerj.2688 6/26

monitored on a regular basis and was never below 75%. The fish were reared in
freshwater, but with seawater added as a buffer, creating a salinity of 1.1–1.3 g L-1.
The temperature was kept constant throughout the experiment, at 12.4 �C (SD ± 0.7).
The total duration of the feeding trial was 12 weeks, e.g. 84 days.
Trial 2: Post-smolt Atlantic salmon were randomly distributed among fifteen sea cages
(5 � 5 � 5 m; 125 m3; 150 fish per cage) at Gildeskal Research Station, GIFAS, Gildeskal
kommune, Norway (67�N, Northern Norway). Prior to the start of the trial, fish were
acclimated to the environmental conditions for two weeks, the feeding trial started in
January 2013. At start, the average fish weight was 228 ± 5 g and during the 157 day
feeding period the fish more than doubled in weight. As in standard aquaculture
practice, fish were reared under 24 h light regime before the start of the trial and during
the first 3 months of the experiment. Cages were illuminated by four 400 W IDEMA
underwater lights that were positioned at the center of each block of four cages at a
depth of three meters. Fish were hand-fed to satiation two times daily and feed
intake was recorded for each sea cage. Total feed intake and mortality were recorded
daily. Water temperature, salinity and oxygen saturation over the course of the trial
varied from 4.1 (January) to 10 �C (June), 30–34.2 g L-1, and 8.7–12.2 mg/L,
respectively.
SamplingFish were anesthetized (Benzoak� VET, 0.2 ml/L, ACD Pharmaceuticals, Leknes, Norway)
and killed by a blow to the head. In Trial 1, the fish in each tank were bulk weighed
for total biomass at each sampling point and body weight and forklength were
measured on individual fish, 5–44 fish depending on sampling point (sexually maturing
males were excluded). In Trial 2, individual fish were weighed at each sampling (mid
sampling 42 fish per cage, end sampling 34 fish per cage). In both trials, blood was drawn
from the caudal vein (Vena caudalis) by means of a heparinized medical syringe from
eight fish per tank or cage, before organs were dissected and kept as individual samples.
Pooled organ samples based on 10 fish for each tank or cage (liver, gills, muscle) were
frozen on dry ice and later homogenized, while individual organ samples were flash frozen
in liquid nitrogen.
Chemical analysis of diets, whole fish and organsMulti-element determination in the feed and tissue samples was done by ICP-MS
(inductively coupled plasma mass spectrometry) (Julshamn et al., 1999). High
performance liquid chromatography (HPLC) was used for determination of Asc (Mæland
&Waagbø, 1998) and tocopherols analysed according to (CEN, 1999). Thiobarbituric acid
reactive substances (TBARS) was analyzed according to Hamre et al. (2001). For the
analysis of total (tGSH) and oxidised (GSSG) glutathione, supernatants were prepared
from samples using a commercial kit (Prod. No. GT40, Oxford Biomedical Research,
Oxford, UK) before analysed at 405 nm in a microplate reader (iEMS Reader Ms,
Labsystems, Finland) as described by Hamre et al. (2014).
Hamre et al. (2016), PeerJ, DOI 10.7717/peerj.2688 7/26

Gene expression analysisTotal RNA was purified from frozen liver using the EZ1 RNA Universal Tissue Kit on
the BioRobot� EZ1 (Qiagen, Hilden, Germany), including the optional DNase treatment
step in the protocol. Homogenisation in QIAzol lysis reagent from the kit was performed
on the bead grinder homogeniser Precellys 24 (Bertin Technologies, Montigny-le-
Bretonneux, France) for 3� 10 s at 6,000 rpm. Quantity and quality of RNAwere assessed
with the NanoDrop� ND-1000 UV-Vis Spectrophotometer (NanoDrop Technologies,
Wilmington, DE, USA) and a selection of samples were evaluated on the Agilent 2100
Bioanalyzer (Agilent Technologies, Palo Alto, CA, USA), with the 6,000 Nano LabChip�
kit (Agilent Technologies, Palo Alto, CA, USA). Average RNA integrity number (RIN)
for the samples in Trial 1 (39 samples) was 9.4 ± 0.1 (mean ± SEM, n = 24), in Trial 2,
(90 samples): 9.5 ± 01 (mean ± SEM, n = 11).
Reverse transcription (RT) was performed on a GeneAmp Polymerase chain
reaction (PCR) 9700 (Applied Biosystems (AB)) using the TaqMan� reverse transcriptase
kit with oligo(dT) primers (AB). Primer sequences are given in Table 3. Samples were run
in duplicate (500 ng, ± 5%), in addition to a six point dilution curve in triplicate (1,000–
31.25 ng), non-template and non-amplification controls. Real-time PCR amplification
and analysis were performed on a LightCycler 480 Real-time PCR system (Roche Applied
Science, Basel, Switzerland) with SYBR� Green I Mastermix (Roche Applied Science).
Pipetting of plates was done using a Biomek� 3000 Laboratory automation workstation
(Beckman Coulter, Fullerton, USA). Thermal cycling was done for 45 cycles of 10 s at each
of 95, 60 and 72 �C (basic programme from Roche), followed by melting analysis to
confirm that only one product is present.
Cycle threshold (Ct)-values were calculated using the second maximum derivative
method in the Lightcycler� software. Amplification efficiency was determined using the
dilution curves with the formula E = 10 ^ (-1/slope), with the slope of the linear curve of
Ct-values plotted against the log-dilution (Higuchi et al., 1993). Normalization to the
reference genes and data analysis was conducted with GenEx 4.3.5 (MultiD Analyses AB,
Gothenburg, Sweden) or with the geNorm applet (Vandesompele et al., 2002).
CalculationsNutrient retention = ((final biomass � final nutrient concentration) - (initial biomass �initial nutrient concentration)) � 100/(Total feed intake � nutrient concentration in
feed).
The two-electron half-cell reduction potential of the 2GSH/GSSG redox-couple was
calculated according to the Nernst equation:
Eh¼E00 � RT=nF ln ½GSH �2=½GSSG�� �
where the GSH and GSSG concentrations are in M and Eh is given in volts. E0′ is the
standard reduction potential at pH7 and 25 �C and was assumed to be -0.240 V
(Kemp, Go & Jones, 2008; Schafer & Buettner, 2001). The measurements are the average of
whole organs and do not take into account that the reduction potential varies between cell
Hamre et al. (2016), PeerJ, DOI 10.7717/peerj.2688 8/26

Table
3PCRassays.
Gene
Fullgenenam
eAccessionno.
Forw
ardprimer
Reverse
primer
Amplicon
size
(bp)
PCR
efficiency
a/b*
cuznsod
CuZnsuperoxidedismutase
BG936553
CCACGTCCATGCCTTTGG
TCAGCTGCTGCAGTCACGTT
141
1.94/1.95
mnsod
Mnsuperoxidedismutase
DY718412
GTTTCTCTCCAGCCTGCTCTAAG
CCGCTCTCCTTGTCGAAGC
227
1.96/2.06
cat
Catalase
BG935638
CCCAAGTCTTCATCCAGAAACG
CGTGGGCTCAGTGTTGTTGA
101
1.90/1.97
gpx1
Glutathioneperoxidase1
DW566563
GCCCACCCCTTGTTTGTGTA
AGACAGGGCTCCACATGATGA
103
1.85/2.05
gpx3
Glutathioneperoxidase3
DW561212
TTCCCCTCCAATCAGTTTGG
ATCCCCCCTCTGGAATAGCA
123
1.97/2.05
grGlutathionereductase
BG934480
CCAGTGATGGCTTTTTTGAACTT
CCGGCCCCCACTATGAC
61
2.03/1.97
g6pd
Glucose-6-Phosphate
dehydrogenase
>Contig7869_
Atlantic_salm
on
CTTTGGGCCAATCTGGAACA
TCCCGGATGATTCCAAAGTC
114
2.08/2.00
nfe2l2
Nuclearfactor
(erythroid-derived
2)-
like2
BT044699
TCGCTGAAGGAGGAGAAGGA
GTCCCTCAGCAGACGGAAAA
120
1.83/2.05
gclc
Glutamate-Cysteineligase,
catalyticsubunit
>Contig16361_
Atlantic_salm
on
CGTCCTGCTCACCAGGGTTA
GCCCTCTTGGACTGCATTTC
112
1.93/2.00
actb
Beta-actin
BG933897
CCAAAGCCAACAGGGAGAA
AGGGACAACACTGCCTGGAT
92
1.93/20.00
ee1ab
Eukaryotictranslation
elongationfactor1alphaB
BG933853
TGCCCCTCCAGGATGTCTAC
CACGGCCCACAGGTACTG
57
2.04/2.03
uba52
Ubiquitin
A-52Residue
ribosomalprotein
fusionproduct
1
NM_001141291
CCAATGTACAGCGCCTGAAA
CGTGGCCATCTTGAGTTCCT
110
2.04/-
Note:
*a=Trial1,b=Trial2.
Hamre et al. (2016), PeerJ, DOI 10.7717/peerj.2688 9/26
types, and between organelles within the cells (Kemp, Go & Jones, 2008; Morgan et al.,
2013; Schafer & Buettner, 2001).
Statistical analysesGraphPad Prism (ver. 6.05) was used for the regression analyses. For the individual
nutrients, the x-axis represented analyzed dietary concentrations, while for GSH and gene
expression data the x-axis represented added NP. Since the nutrient concentrations in
the 400% NP diet were outliers in Trial 2, the value of this diet was recalculated to 239%
NP, the mean of the concentrations of a-TOH, Asc and Se. The best fit of the data after
comparing different functions moving from simple to more complex relationships, was
used. In figures with first order polynomials, p indicates the probability that the slope
is equal to zero. In figures with second order fits, p gives the probability that the first
order equation fits the data better than the second order equation. The logarithmic
equation was applied for vitamin C retention in Trial 2 and p indicates the probability
that a second order polynomial has a better fit than the logarithmic function. A function
for overall comparison of slopes and intercepts of datasets fitted to linear equations, was
used for comparison of data between Trials 1 and 2. The software also has a function
for detecting outliers which was used for the data on muscle GSH/GSSG in post-smolts
and on the gene expression data.
Correlation analyses of gene expression was performed using the software Statistica
(ver. 11, Statsoft Inc., Tulsa, OK, USA) and Principle component analyses (PCA) plots
were produced in Sirius (ver. 8.1, Pattern Recognition Systems AS, Bergen, Norway).
RESULTSFish performance is reported in detail by Hemre et al. (2016). Briefly, fish in Trial 1 grew
from an initial weight of 18.3 g (± 2.2) to a range of 78.6 g (± 1.9) to 87.3 g (± 4.5).
Both fish growth and protein retention increased with increasing dietary NP, while
lipid retention decreased, together with liver index and viscera-somatic index. In Trial 2,
initial fish size was 228 g (± 4.2) and average final weight was 482 g (± 17). There was no
effect of the NP on growth or protein and lipid retention in this trial. Survival was high
in both trials, close to 100%, and with no difference between diet groups.
The dietary concentrations of a-TOH, Asc and Se (Fig. S1) were well fitted to first order
polynomials in Trial 1 (R2 > 0.98). In Trial 2, the diet designated 400% was an outlier,
while the other diets showed a good fit to a linear equation (R2 > 0.97). The diet planned
to contain 400% NP in Trial 2 was recalculated to contain 239% NP, based on the nutrient
analyses of the diets. �-TOH level was similar in all diets, as it was only derived from
the feed ingredients (Fig. S1). The dietary concentrations at 100% NP were 118 and
141 mg kg-1 for a-TOH, 67 and 63 mg kg-1 for Asc and 0.62 and 0.79 mg kg-1 for Se, in
Trials 1 and 2, respectively. At 0% NP the dietary concentrations were 48 and 76 mg kg-1
for a-TOH, 4.7 and < 5.5 mg kg-1 for Asc and 0.42 and 0.47 mg kg-1 for Se (Table 2).
There was a linear relationship between dietary and whole body concentrations of
a-TOH in Trial 1 (R2 = 0.94; p (slope = 0) < 10-4; Fig. 1). In Trial 2, a second order
polynomial fitted the data better than a first order polynomial (p = 0.03). The range of
Hamre et al. (2016), PeerJ, DOI 10.7717/peerj.2688 10/26

whole body concentrations was between 20 and 60 mg kg-1 in Trial 1 and between 30 and
50 mg kg-1 in Trial 2. Whole body �-TOH concentration varied between 5 and 10 mg kg-1,
with a significant positive slope in Trial 1 (p = 0.02) and no effect of diet in Trial 2 (Fig. 1).
Whole body Asc concentration followed a second order polynomial in both trials (Trial 1,
R2 = 0.92, p < 0.0001; Trial 2, R2 = 0.88, p = 0.016). Whole body concentration plateaued
at a dietary concentration of Asc of 190 mg kg-1 DM and a whole body concentration of
39.5 mg kg-1 in Trial 1. In Trial 2, the plateau was reached at dietary and whole body
concentrations of 100 and 14 mg kg-1, respectively. Whole body Se showed a linear
relationship with the dietary concentration in both trials (R2 > 0.93, p (slope = 0) < 10-4).
The diet dependent whole body concentration was significantly higher in Trial 1 than
in Trial 2 (p < 10-4).
The retention of a-TOH was not affected by diet in Trial 1 and followed a second order
polynomial in Trial 2 (p = 0.02) with the highest retentions at intermediate dietary
a-TOH concentrations (Fig. 2). Diet did not affect the retention of �-TOH in Trial 1,
while increasing the NP in Trial 2 had a negative effect on �-TOH retention (p < 0.004).
The range of retention of both a- and �-TOH was 20–30%. In Trial 1, retention of
Asc ranged from 11–42% and was negatively linearly related to dietary Asc (R2 = 0.34,
p (slope = 0) = 0.02). In Trial 2, vitamin C retention was negative at dietary levels
Figure 1 Whole body concentrations (mg kg-1 wet weight) of redox dependent micronutrients in Atlantic salmon parr (Trial 1) and post-
smolt (Trial 2) in response to dietary supplementation of micronutrients and selected amino acids at supplementation of 0–400% NP.
Data were first fitted to second order polynomials and the fit was then compared to a first order polynomial fit, which was chosen when p >
0.05 for the second order equation. The p given in figures with first order and second order fits indicate that the slope is significantly different from 0
or that second order fits are significantly better than first order fits, respectively. n.s., not significant.
Hamre et al. (2016), PeerJ, DOI 10.7717/peerj.2688 11/26

below 63 mg kg-1 and max retention was 16% at 89 mg kg-1. A logarithmic function was
found to have the best fit to the data (R2 = 0.92). Diet did not affect retention of Se, which
ranged from 20 to 30%. The retention of Se was higher in Trial 2 than in Trial 1 (p < 10-4).
GSH and GSSG concentrations were measured in muscle (Fig. 3) and liver (Fig. 4).
In muscle in Trial 1, GSH concentrations ranged from 100 to 200 mmol kg-1, GSSG ranged
from 0 to 0.4 mmol kg-1 with no effect of diet. There was a tendency that the resulting
GSH based redox potential followed a second order polynomial at dietary NP below
150%, so that the tissue became transiently more reduced at supplementation of 25–100%
NP than at 150–400% NP (p = 0.058). The redox potential of muscle in Trial 1 ranged
from -240 to -190 mV. In Trial 2, muscle GSH and GSSG concentrations ranged from
43 to 80 and 0 to 0.4 mmol kg-1, respectively, and the redox potential from -170 to
-220 mV, with no effect of diet. The muscle GSH/GSSG concentrations in these fish were
close to quantification limits and some of the data points were removed as outliers.
Muscle GSH concentration was higher (p < 0.0001), the redox potential lower (p = 0.002)
and GSSG concentration similar in Trial 1 compared to Trial 2. In the liver, GSH, GSSG
and the GSH based redox potential were not affected by the diet, however there was a
tendency towards a significant second order fit to the data on liver redox potential in Trial 1
(p = 0.066), implicating a higher redox potential in fish fed diets with intermediate NP
Figure 2 Retention (% of eaten) of redox dependent micronutrients in Atlantic salmon parr (Trial 1) and smolt (Trial 2) in response to dietary
supplementation of micronutrients and selected amino acids at 0–400% NP. Data were first fitted to second order polynomials and the fit was
then compared to a first order polynomial equation fit. a-Tocopherol in Trial 2 had significantly best fit to the second order equation (p < 0.05).
Vitamin C retention fitted a logarithmic equation better than a second order polynomial (p < 0.001). The p given in figures with first order fits
indicates that the slope is significantly different from 0. n.s., not significant.
Hamre et al. (2016), PeerJ, DOI 10.7717/peerj.2688 12/26

additions. Liver GSH concentration was higher (p < 0.0001), while GSSG concentration
(p = 0.01) and the redox potential (p < 0.0001) were lower in Trial 1 than in Trial 2.
Muscle TBARS (Fig. 5) was negatively correlated to NP addition in both trials
(p = 0.004 in Trial 1, p = 0.03 in Trial 2) and the absolute level was similar in the two trials
(p = 0.09).
Expression of redox dependent genes was measured in the liver of individual salmon
in both trials. PCA plots showed that the dietary groups were not well separated
according to expression of the redox related genes (Fig. 6). However, in Trial 1 there
was a tendency to grouping of samples related to dietary supplementation of NP, with
NP supplementation correlating negatively to g6pd, gclc, gpx1 and gr (-0.38 < R2
< -0.43) and positively to gpx3 (R2 = 0.39). Gr showed the most covariation with other
genes and correlated to g6pd, gpx1 and gclc at 0.79 > R2 > 0.49 and to mnsod and
cuznsod at R2 = 0.39 and 0.34, respectively. Gr was also correlated to nfe2l2 (R2 = 0.52),
cat was not correlated to the other genes while gpx3 was negatively correlated to
the other genes, significant for g6pd (R2 = -0.33). In Trial 2, diet was correlated to
Figure 3 Muscle reduced and oxidized glutathione (GSH and GSSG, mmoles kg-1 wet weight) and the GSH based redox potential (mV) in
Atlantic salmon parr (Trial 1) and post-smolt (Trial 2). The dietary supplementation of micronutrients and selected amino acids was graded
from 0–400% NP, where 100NP is the assumed requirement.
Hamre et al. (2016), PeerJ, DOI 10.7717/peerj.2688 13/26

cuznsod, mnsod and cat (0.39 < R2 < 0.24). The expression of gr, g6pd, gpx1 and
gclc comprised one distinct group and mnsod, cat and cuznsod another. Gr correlated
with g6pd, gpx1 and gclc at 0.67 > R2 > 0.37, while gr correlation to mnsod, cat
Figure 4 Liver reduced and oxidized glutathione (GSHandGSSG,mmoles kg-1 wet weight) and theGSHbased redox potential (mV) in Atlantic
salmon parr (Trial 1) and post-smolt (Trial 2). The dietary supplementation of micronutrients and selected amino acids was graded from 0–400%
NP, where 100NP is the assumed requirement.
Figure 5 Muscle TBARS (nmoles g-1 ww) in Atlantic salmon parr (Trial 1) and post-smolt (Trial 2).
The dietary supplementation of micronutrients and selected amino acids was graded from 0–400% NP,
where 100NP is the assumed requirement.
Hamre et al. (2016), PeerJ, DOI 10.7717/peerj.2688 14/26
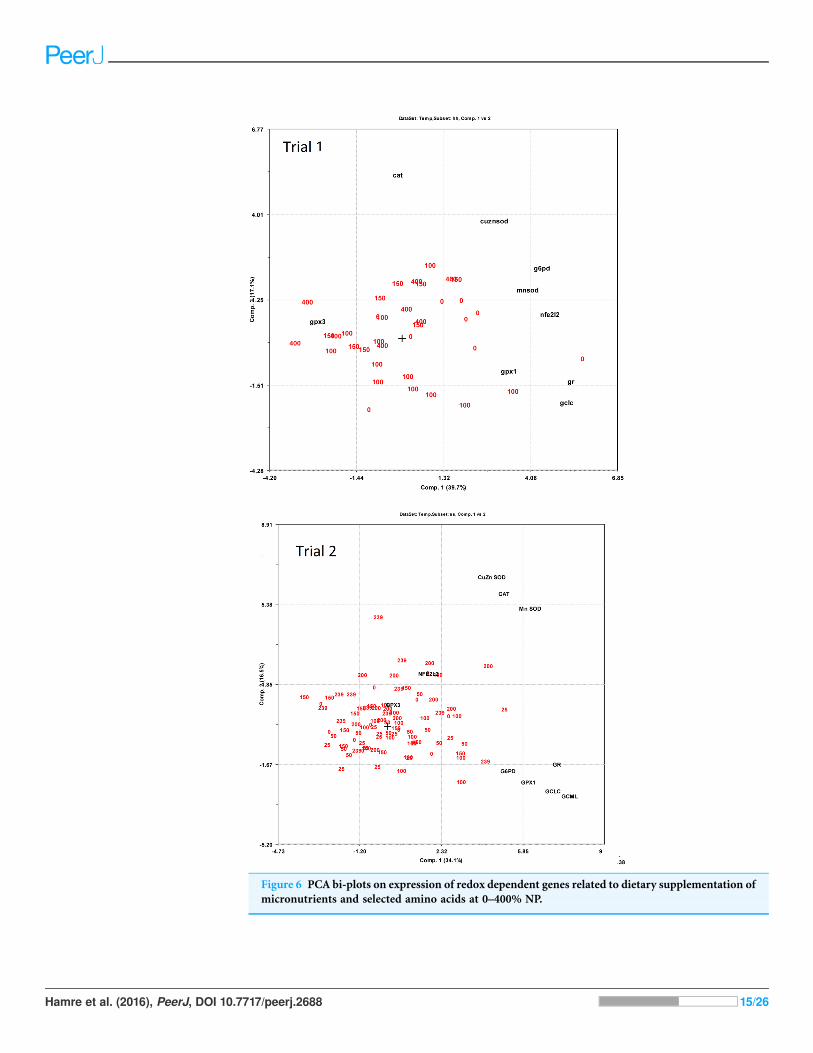
Figure 6 PCA bi-plots on expression of redox dependent genes related to dietary supplementation of
micronutrients and selected amino acids at 0–400% NP.
Hamre et al. (2016), PeerJ, DOI 10.7717/peerj.2688 15/26

and cuznsod was 0.32 > R2 > 0.25. Gpx3 and nfe2l2 were not significantly correlated to
the other genes.
Relations between diet and gene expression are given in Fig. S1. In Trial 1, increasing
supplementation of NP gave a reduction in gclc, g6pd, gpx1, gr and mnsod expression,
while nfe2l2, cat and cuznsod expression were unaffected by diet. In Trial 2, data on
nfe2l2 and gclc were fitted to second order polynomials and had higher expression at
intermediate NP supplementation. Gpx1 showed the best fit when using a third order
polynomial with peak expression at 50 and 100% NP inclusion. Gpx3 had higher
expression at low NP inclusion, while mnsod expression increased with increasing NP.
Cuznsod expression was slightly lower at intermediate NP inclusion than at high and
low inclusion, while G6pd and gr expression were unaffected by the diet. Average
expression of gpx1, gpx3 and mnsod was higher in Trial 2 than in Trial 1 (p < 0.0002).
Increasing NP inclusion had opposite effects onmnsod expression in the two trials, which
decreased in Trial 1 (p = 0.04) and increased in Trial 2 (p = 0.002).
DISCUSSIONThe present study showed differences in redox status between parr and post-smolts
and effects of supplementation of the NP on redox regulation. However, there were no
clear deficiencies of the antioxidant nutrients, vitamin C, vitamin E and Se, even in fish fed
the unsupplemented diet. The reason may be that the plant-based feed ingredients
contained relatively high levels of vitamin E and Se and that the experimental periods were
too short for fish of these body sizes to develop vitamin C deficiency symptoms. The basal
feed contained less than 5.5 mg kg-1 Asc, which is below the minimum requirement in
Atlantic salmon of 10–20 mg kg-1; however, it took 18 weeks to deplete first-feeding
Atlantic salmon for Asc (Sandnes, Torrissen & Waagbø, 1992) and a longer period of time
may be needed to deplete larger fish sizes as the post-smolts. The final concentrations
of a-TOH and Se in the basal feed were at or above minimum requirements at
approximately 50 and 0.3 mg kg-1 diet, respectively (NRC, 2011). Plant oils often have
high concentration of tocopherols, however tocopherols are unstable during feed
processing and storage and concentrations could vary considerably in the finished feeds
(Hamre, Kolas & Sandnes, 2010; Olsvik et al., 2011). Se concentrations in plant ingredients
vary according to Se concentration in soil (Alfthan et al., 2015). Therefore, even if a-TOH
and Se may be sufficient in some plant ingredients, they should be added to fish feeds to
ensure safe supplementation. Commercial fish feeds are commonly supplemented with
higher levels of antioxidant nutrients than the minimum requirements given by NRC
(2011), which will protect the fish in periods with oxidative stress, such as high water
temperatures (Martınez-Alvarez, Morales & Sanz, 2005) elevated water oxygen levels
(Lygren, Hamre & Waagbø, 2000), vaccination (Lygren, Hjeltnes & Waagbø, 2001) and
disease (Trichet, 2010; Waagbø, 2006). Accordingly, the diets with 100% NP used in this
study, contained 118–141 mg kg-1 a-TOH, 63–67 mg kg-1 Asc and 0.62–0.79 mg kg-1
Se, respectively.
The most sensitive biomarker of vitamin E deficiency in salmonids is lowered
hemoglobin (Hb) concentration (Hamre, 2011). There was a slight positive correlation
Hamre et al. (2016), PeerJ, DOI 10.7717/peerj.2688 16/26

between NP addition and Hb concentration in fish from Trial 1 (p (slope = 0) = 0.03)
(Hemre et al., 2016), however, the slope was not significantly different from 0
after omitting the 400% NP group (p = 0.44), so fish fed the diets with low NP
supplementation were clearly not vitamin E deficient. In Trial 2, there was no effect of diet
on Hb (Hemre et al., 2016). Hamre & Lie (1995) found that mortality due to vitamin
E deficiency commenced at whole body levels of a-TOH of 5 mg kg-1 wet weight, while
the whole body concentration in fish fed the basal diet in this study were 18 and 32mg kg-1
in Trials 1 and 2, respectively. Accordingly, none of the fish groups in this study
experienced vitamin E deficiency, even though the low level of vitamin C in the diet
without NP would make the fish more susceptible to low dietary vitamin E (Hamre
et al., 1997).
The diets were fed for 12 and 22 weeks in Trials 1 and 2, respectively. The twelve weeks
feeding period in Trial 1 should just be enough for the fish to adjust to the a-TOH
concentrations of the diet according to previous reports (Hamre, 2011; Hamre & Lie,
1995). However, the slope of whole body concentration to dietary concentration was lower
(0.13 vs 0.25) and the intercept with the y-axis was higher (15.6 vs 0) than previously
reported, indicating that the steady state whole body a-TOH concentration had not yet
been obtained (Hamre, 1995). A relation of body to dietary concentrations of a-TOH has
until now only been measured in very young fish and these relationships were always
linear (Hamre et al., 1997; Hamre & Lie, 1995). In post-smolts in the present study, the
relationship followed a second order polynomial. It is possible that uptake of a-TOH is
changing over development, moving from a strict linear relationship just after first-
feeding to a saturable mechanism at later stages. If this is the case, the diet 100% NP with
141 mg kg-1 a-TOH would be sufficient to saturate the system, while supplementation
above this gave a decreased retention. In summary, supplementing commercial diets with
above 150 mg kg-1 a-TOH is recommended to promote fish health and welfare. A fish
feed surveillance program run by NIFES in 2015 reported 185–320 mg kg-1 a-TOH in
18 commercial salmon feeds, while two feeds contained as high as 570 mg kg-1
(M. Sanden, 2016, unpublished data) A variable part of this a-TOH would have been
derived from the feed ingredients. One have to take into account that a-TOH in the feed
ingredients is in the free form, which is easily broken down in salmon intestine and
therefore has quite low retention (Meland, 1995). It is therefore a risk involved in
including ingredient contribution when deciding dietary a-TOH supplementation.
The non-a-TOHs cannot substitute for a-TOH, because of their lower biological
activity (Hamre, 2011; Kayden & Traber, 1993), however they may have specific biological
functions in cell signaling (Golli & Azzi, 2010; Wallert et al., 2014). In both trials of
this study, the retentions of a- and �-TOH were similar at 20–30%. Due to lower
biological activity, retention of �-TOH should be lower than a-TOH, but the result can
be explained by similar retention of a- and �-TOH in muscle and adipose tissue, which
are the main constituents of the whole body sample. Retention of �-TOH in other vital
organs of salmon, such as gonads, intestine, and gills, is less than 30% compared to
a-TOH (Hamre & Lie, 1997).
Hamre et al. (2016), PeerJ, DOI 10.7717/peerj.2688 17/26
The whole body concentration of Asc followed a second order equation with respect
to Asc supplementation in both trials. It is well known that tissue levels of Asc level
off at dietary supplementation that is much higher than the levels where traditional
deficiency symptoms are displayed (Gabaudan & Verlhac, 2001;Waagbø & Sandnes, 1996).
Since Asc above this minimum requirement has positive effects on immune function,
stress resistance and reproduction (Gabaudan & Verlhac, 2001; Waagbø, 1994; Waagbø,
2006), it may be fruitful to supplement more of the vitamin. The whole body
concentration levelled off at a dietary Asc concentration of 190 mg kg-1 in Trial 1 and at
63–89 mg kg-1 in Trial 2. The maximum body concentration of Asc in fish from Trial 2
was approximately 30% of that in fish from Trial 1. While the data from Trial 1 follow the
expected trajectory based on the literature, the fish in Trial 2 seems to have had an
extraordinary high consumption of Asc, with negative retention for fish supplemented
below 63 mg kg-1 and maximum retention of 16% at higher supplementation, compared
to max 42% retention in Trial 1.
There is probably an optimal ratio between supplementation of a-TOH and Asc, based
on the hypothesis that vitamin E is recycled by vitamin C. A buildup of tocopheroxyl
radicals would occur if too little vitamin C is present to recycle it, which would have a pro-
oxidant effect on the tissues (Hamre et al., 1997). An indication of this principle is the
higher mortality due to vitamin C deficiency in fish fed 300 compared to 150 mg kg-1
vitamin E (Hamre et al., 1997). Another indication is that vitamin E and C in tissues from
copepods and wild Ballan wrasse are 100 and 500mg kg-1 dry matter and 9 and 18mg kg-1
wet weight, respectively (Hamre et al., 2013; Hamre et al., 2008). Theoretically, one
should supplement more Asc than vitamin E, although the exact optimal ratio has not yet
been identified. Seventeen commercial salmon feeds analyzed in a fish feed surveillance
program performed at NIFES in 2015, contained between 118 and 418 mg kg-1 Asc,
one feed contained 800 and two feeds contained more than 1,300 mg kg-1 Asc. The
concentration of Asc in the feeds was frequently below the concentration of a-TOH
(M. Sanden, 2016, unpublished data).
Whole body Se concentration followed a first order relationship with the dietary
concentration both in parr and post-smolt, and the retention was not affected by NP
supplementation. A similar relationship was found in zebrafish, but this species had
higher whole body Se concentration at similar supplementation levels. The difference may
be species dependent or perhaps due to the use of Se enriched yeast containing mainly
selenomethionine as the Se source in the zebrafish (Penglase et al., 2014) and selenite
(Na2SeO3) here (Lorentzen, Maage & Julshamn, 1994). The basal diet contained
0.4–0.5 mg kg-1 Se, while the requirement in rainbow trout is estimated at 0.15–0.38 mg
kg-1 (Hilton, Hodson & Slinger, 1980). It is therefore unlikely that fish fed the diets used in
this study would become Se deficient. Judged by retention efficiency, the Se present in
the feed ingredients had similar bioavailability to the added selenite. If gpx1 expression
had been affected by low Se in this study, increased NP would probably have increased
this response (Hilton, Hodson & Slinger, 1980; Penglase et al., 2014). However, gpx1
was not expressed according to this hypothesis in either trial. Retention and body
concentrations of Se were higher in seawater than in fresh water, possibly caused by
Hamre et al. (2016), PeerJ, DOI 10.7717/peerj.2688 18/26
differences in waterborne Se concentrations. Se toxicity was probably not encountered in
the present study, since the diet with the highest NP inclusion contained 1.1 and 1.4 mg
kg-1 Se, which is below levels reported to be toxic in fish (Penglase et al., 2014).
To examine whether the graded dietary NP affected redox regulation in the salmon, we
measured GSH/GSSG concentrations in liver and muscle and calculated the resulting
EGSH. In Trial 1, there was a tendency (p = 0.06–0.07) that NP supplementation below
150% gave more reduced fish, resulting from higher concentrations of GSH. Considering
the above discussion, it is unlikely that this effect would have been caused by low levels of
vitamin C, E or Se. The diets also had graded levels of taurine and methionine (Hemre
et al., 2016) and at low levels of these nutrients, GSH synthesis or recycling and a resulting
lowered EGSH could have been stimulated to protect against oxidation induced by low
taurine (Jong, Azuma & Schaffer, 2012; Penglase et al., 2015), consistent with the relatively
higher liver gclc, g6pd and gr expressions at low NP inclusion. In Trial 2, there were no
effects of diet on GSH/GSSG concentrations and no correlation between diet and
expression of the genes coding for GSHmetabolizing enzymes. The higher muscle TBARS
at low NP inclusion in both trials confirm that fish fed low levels of micronutrients and
selected amino acids may have become oxidized. Overall, the results confirm that the
tissue GSH/GSSG concentrations are relatively stable within experiments with salmon,
even with large variations in dietary composition, as found by Hamre et al. (2010).
However, the GSH/GSSG concentrations and EGSH were different in Trials 1 and 2,
the fish in Trial 2 being more oxidized, with less GSH both in liver and muscle and
more GSSG in the liver, than the fish in Trial 1. Expression of liver gpx1 (cytosol and
mitochondria) and gpx3 (extracellular) was also higher in Trial 2, indicating excess activity
in removal of H2O2 at the expense of GSH. This corresponds with an increased
consumption of Asc in Trial 2. These results indicate that the fish in Trial 2 experienced
some sort of oxidative stress. The fish did not seem to be diseased, since the growth and
feed intake were good and mortalities were negligible (Hemre et al., 2016). The feed
was not analyzed for oxidation, however, oxidized feed most often leads to reduced
vitamin E retention (Baker & Davies, 1997; Hung, Cho & Slinger, 1981), which was not
encountered in the present study. The samples in Trial 2 were taken in June, with rapidly
increasing water temperatures and longer day light, resulting in strong growth stimulation
in salmon. In cod larvae fed copepods, a similar growth stimulation correlated with
more oxidized fish having a higher whole body EGSH (Karlsen et al., 2015; Penglase et al.,
2015). Based on these observations, we hypothesize that redox regulation is involved in
surges in growth.
CONCLUSIONSThis study gives no indications that diets rich in plant ingredients increase the vitamin
C, E or Se requirements in Atlantic salmon. Feeds produced using the current feed
ingredients, seem to have sufficient amounts of a-TOH and Se from the feed ingredients
alone. However, due to possible variations in ingredient quality, feed processing and
farming conditions, feeds should be supplemented with above 150 mg kg-1 a-TOH
equivalents. The Se in plant-based feed ingredients may vary and Se supplementation may
Hamre et al. (2016), PeerJ, DOI 10.7717/peerj.2688 19/26
be warranted in some cases. However, the legal upper limit of Se in fish feeds in the
European Union is 0.5 mg kg-1 (Regulation (EC) No 1831/2003) and the law comes into
force if the feeds are supplemented. Fish fed the highest concentration of Se (1.4 mg kg-1)
did not show any signs of toxicity. Based on body concentrations, Asc supplementation
should be above 190 mg kg-1, where the whole body Asc concentration leveled off in
Trial 1. At this supplementation level, Asc deficiency can be avoided in periods with
oxidative stress and optimal immune function and stress resistance can be obtained.
Redox regulation, which includes differential consumption of antioxidant nutrients,
seems to change during the production cycle of Atlantic salmon.
ACKNOWLEDGEMENTSWe want to thank the technical staff at NIFES, IMR and GIFAS for great work with
the practical aspects of this study.
ADDITIONAL INFORMATION AND DECLARATIONS
FundingThis study was part of the project “Advanced Research Initiatives for Nutrition &
Aquaculture” (ARRAINA). Funded by EU, FP7 under the subprogramme “Food,
Agriculture and Fisheries, Biotechnology” (FP7-288925). Additional funding was
obtained from NIFES. The funders had no role in study design, data collection and
analysis, decision to publish, or preparation of the manuscript.
Grant DisclosuresThe following grant information was disclosed by the authors:
Advanced Research Initiatives for Nutrition & Aquaculture” (ARRAINA).
EU, FP7 under the subprogramme “Food, Agriculture and Fisheries, Biotechnology”:
FP7-288925.
NIFES.
Competing InterestsKristin Hamre is an Academic Editor for PeerJ. Joana Silva is employed by Biomar AS,
Trondheim, Norway. Bente Torstensen is employed by Marine Harvest ASA, Bergen
Norway. Johan Johansen is employed by GIFAS AS, Indyr, Norway. Otherwise there are no
competing interests.
Author Contributions� Kristin Hamre conceived and designed the experiments, analyzed the data, wrote the
paper, prepared figures and/or tables, reviewed drafts of the paper.
� Nini H. Sissener conceived and designed the experiments, performed the experiments,
wrote the paper, prepared figures and/or tables, reviewed drafts of the paper.
� Erik-Jan Lock conceived and designed the experiments, performed the experiments,
wrote the paper, reviewed drafts of the paper.
Hamre et al. (2016), PeerJ, DOI 10.7717/peerj.2688 20/26
� Pal A. Olsvik analyzed the data, contributed reagents/materials/analysis tools, wrote
the paper, prepared figures and/or tables, reviewed drafts of the paper.
� Marit Espe conceived and designed the experiments, performed the experiments,
wrote the paper, reviewed drafts of the paper.
� Bente E. Torstensen conceived and designed the experiments, wrote the paper, reviewed
drafts of the paper.
� Joana Silva conceived and designed the experiments, performed the experiments,
contributed reagents/materials/analysis tools, wrote the paper, reviewed drafts of the paper.
� Johan Johansen performed the experiments, contributed reagents/materials/analysis
tools, wrote the paper, reviewed drafts of the paper.
� Rune Waagbø conceived and designed the experiments, performed the experiments,
wrote the paper, reviewed drafts of the paper.
� Gro-Ingunn Hemre conceived and designed the experiments, performed the
experiments, wrote the paper, reviewed drafts of the paper.
Animal EthicsThe following information was supplied relating to ethical approvals (i.e., approving body
and any reference numbers):
Both feeding trials were conducted in accordance with Norwegian laws and regulations
concerning experiments with live animals, which are overseen by the Norwegian
Food Safety Authority. Permission for these specific experiments were given by the
Directorate of Fisheries, and accepted for feeding trials at GIFAS, §13 (Akvakulturloven)
and §28a (Lakseforskriften) (ref 13/11363), and acknowledged by the advisory board
27.11.12 (ref: ARRAINA regression trial permission).
Data DepositionThe following information was supplied regarding data availability:
All raw data appear as points in the graphs.
Supplemental InformationSupplemental information for this article can be found online at http://dx.doi.org/
10.7717/peerj.2688#supplemental-information.
REFERENCESAlfthan G, Eurola M, Ekholm P, Venalainen E-R, Root T, Korkalainen K, Hartikainen H,
Salminen P, Hietaniemi V, Aspila P, Aro A, Selenium Working Group. 2015. Effects of
nationwide addition of selenium to fertilizers on foods, and animal and human health in
Finland: from deficiency to optimal selenium status of the population. Journal of Trace Elements
in Medicine and Biology 31:142–147 DOI 10.1016/j.jtemb.2014.04.009.
Baker RTM, Davies SJ. 1997. Modulation of tissue alpha-tocopherol in African catfish, Clarias
gariepinus (Burchell), fed oxidized oils, and the compensatory effect of supplemental dietary
vitamin E. Aquaculture Nutrition 3(2):91–97 DOI 10.1046/j.1365-2095.1997.00078.x.
Barnes MJ, Kodicek E. 1972. Biological hydroxylations and ascorbic acid with special regard to
collagen metabolism. Vitamins & Hormones 30:1–43 DOI 10.1016/S0083-6729(08)60793-1.
Hamre et al. (2016), PeerJ, DOI 10.7717/peerj.2688 21/26

Brigelius-Flohe R. 1999. Tissue-specific functions of individual glutathione peroxidases. Free
Radical Biology and Medicine 27(9–10):951–965 DOI 10.1016/S0891-5849(99)00173-2.
Buettner GR. 1993. The pecking order of free radicals and antioxidants: lipid peroxidation,
a-tocopherol, and ascorbate. Archives of Biochemistry and Biophysics 300(2):535–543
DOI 10.1006/abbi.1993.1074.
CEN. 1999. Foodstuffs–determination of vitamin E by high performance liquid
chromatography–Measurement of a-, b-, �- and d-tocopherols. Comite Europeen de
Normalisation prEN 12822.
Dabrowski K, Lee K-J, Guz L, Verlhac V, Gabaudan J. 2004. Effects of dietary ascorbic
acid on oxygen stress (hypoxia or hyperoxia), growth and tissue vitamin concentrations in
juvenile rainbow trout (Oncorhynchus mykiss). Aquaculture 233(1–4):383–392
DOI 10.1016/j.aquaculture.2003.09.047.
Espe M, Lemme A, Petri A, El-Mowafi A. 2006. Can Atlantic salmon (Salmo salar)
grow on diets devoid of fish meal? Aquaculture 255(1–4):255–262
DOI 10.1016/j.aquaculture.2005.12.030.
Espe M, Lemme A, Petri A, El-Mowafi A. 2007. Assessment of lysine requirement for
maximal protein accretion in Atlantic salmon using plant protein diets. Aquaculture
263(1–4):168–178 DOI 10.1016/j.aquaculture.2006.10.018.
Gabaudan J, Verlhac V. 2001. Critical review of the requirements of ascorbic acid in cold and
cool water fishes (salmonids, percids, plecoglossids and flatfishes). In: Dabrowski K, ed.
Ascorbic Acid in Aquatic Organisms Status and Perspectives. London: CRC Press, 33–48.
Go Y-M, Jones DP. 2013. The redox proteome. Journal of Biological Chemistry
288(37):26512–26520 DOI 10.1074/jbc.R113.464131.
Golli F, Azzi A. 2010. Present trends in vitamin E research. BioFactors 36(1):33–42
DOI 10.1002/biof.75.
Gould BS, Manner G, GoldmanHM, Stolman JM. 1960. Some aspects of collagen formation. Annals
of the New York Academy of Sciences 85(1):385–398 DOI 10.1111/j.1749-6632.1960.tb49969.x.
Hamre K. 1995. Metabolism, interactions and requirement of vitamin E in Atlantic salmon
(Salmo salar, L.). Dr. scientarium thesis, University of Bergen.
Hamre K. 2011. Metabolism, interactions, requirements and functions of vitamin E in fish.
Aquaculture Nutrition 17(1):98–115 DOI 10.1111/j.1365-2095.2010.00806.x.
Hamre K, Berge RK, Lie Ø. 1998. Turnover of a-, �, and d-tocopherol and distribution
insubcellular and lipoprotein fractions indicate presence of an hepatic tocopherolbinding
protein in Atlantic salmon (Salmo salar, L.). Fish Physiology and Biochemistry 18(1):71–83
DOI 10.1023/A:1007798102002.
Hamre K, Kolas K, Sandnes K. 2010. Protection of fish feed, made directly from marine
raw materials, with natural antioxidants. Food Chemistry 119(1):270–278
DOI 10.1016/j.foodchem.2009.06.024.
Hamre K, Lie Ø. 1995.Minimum requirement of vitamin E for Atlantic salmon, Salmo salar, L., at
first feeding. Aquaculture Research 26(3):175–184 DOI 10.1111/j.1365-2109.1995.tb00900.x.
Hamre K, Lie Ø. 1997. Retained levels of dietary a-, �- and d-tocopherol in tissues and body
fluids of Atlantic salmon, Salmo salar, L. Aquaculture Nutrition 3(2):99–107
DOI 10.1046/j.1365-2095.1997.00077.x.
Hamre K, Næss T, Espe M, Holm JC, Lie Ø. 2001. A formulated diet for Atlantic halibut
(Hippoglossus hippoglossus, L.) larvae. Aquaculture Nutrition 7(2):123–132
DOI 10.1046/j.1365-2095.2001.00162.x.
Hamre et al. (2016), PeerJ, DOI 10.7717/peerj.2688 22/26

Hamre K, Nordgreen A, Grøtan E, Breck O. 2013. A holistic approach to development of diets
for Ballan wrasse (Labrus berggylta)–a new species in aquaculture. PeerJ 1:e99
DOI 10.7717/peerj.99.
Hamre K, Penglase SJ, Rasinger JD, Skjaerven KH, Olsvik PA. 2014. Ontogeny of
redox regulation in Atlantic cod (Gadus morhua) larvae. Free Radical Biology and Medicine
73:337–348 DOI 10.1016/j.freeradbiomed.2014.05.017.
Hamre K, Srivastava A, Rønnestad I, Mangor-Jensen A, Stoss J. 2008. Several micronutrients in
the rotifer Brachionus sp. may not fulfil the nutritional requirements of marine fish larvae.
Aquaculture Nutrition 14(1):51–60 DOI 10.1111/j.1365-2095.2007.00504.x.
Hamre K, Torstensen BE, Maage A, Waagbø R, Berge RK, Albrektsen S. 2010. Effects of
dietary lipid, vitamins and minerals on total amounts and redox status of glutathione and
ubiquinone in tissues of Atlantic salmon (Salmo salar): a multivariate approach. British Journal
of Nutrition 104(7):980–988 DOI 10.1017/S0007114510001583.
Hamre K, Waagbø R, Berge RK, Lie Ø. 1997. Vitamins C and E interact in juvenile Atlantic
salmon (Salmo salar, L.). Free Radical Biology and Medicine 22(1–2):137–149
DOI 10.1016/S0891-5849(96)00281-X.
Hemre G-I, Lock E-J, Olsvik PA, Hamre K, Espe M, Torstensen BE, Silva J, Hansen A-C,
Waagbø R, Johansen JS, Sanden M, Sissener NH. 2016. Atlantic salmon (Salmo salar) require
increased dietary levels of B-vitamins when fed diets with high inclusion of plant based
ingredients. PeerJ 4(11):e2493 DOI 10.7717/peerj.2493.
Higuchi R, Fockler C, Dollinger G, Watson R. 1993. Kinetic PCR analysis: real-time monitoring
of DNA amplification reactions. Nature Biotechnology 11(9):1026–1030
DOI 10.1038/nbt0993-1026.
Hilton JW, Hodson PV, Slinger SJ. 1980. The requirement and toxicity of selenium in
rainbow trout (Salmo Gairdneri). Journal of Nutrition 110(12):2527–2535.
Hung SSO, Cho CY, Slinger SJ. 1981. Effect of oxidized fish oil, DL-a-tocopheryl acetate and
ethoxyquin supplementation on the vitamin-E nutrition of rainbow-trout (Salmo-Gairdneri)
fed practical diets. Journal of Nutrition 111(4):648–657.
Huseby NE, Sundkvist E, Svineng G. 2009. Glutathione and sulfur containing amino acids:
antioxidant and conjugation activities. In: Masella R, Mazza G, eds. Glutathione and Sulfur
Containing Amino Acids in Human Health and Disease. Hoboken: Wiley.
Jones DP, Sies H. 2015. The redox code. Antioxidants & Redox Signaling 23(9):734–746
DOI 10.1089/ars.2015.6247.
Jong CJ, Azuma J, Schaffer S. 2012. Mechanism underlying the antioxidant activity of taurine:
prevention of mitochondrial oxidant production. Amino Acids 42(6):2223–2232
DOI 10.1007/s00726-011-0962-7.
Julshamn K, Brenna J, Holland R, Tanner S. 1999. Plasma source mass spectrometry–new
developments and applications. Royal Society of Chemistry 241:167–172.
Karlsen Ø, van der Meeren T, Rønnestad I, Mangor-Jensen A, Galloway TF, Kjørsvik E,
Hamre K. 2015. Copepods enhance nutritional status, growth, and development in Atlantic
cod (Gadus morhua L.) larvae–can we identify the underlying factors? PeerJ 3:e902
DOI 10.7717/peerj.902.
Kayden HJ, Traber MG. 1993. Absorption, lipoprotein transport, and regulation of plasma
concentrations of vitamin E in humans. Journal of Lipid Research 34:343–358.
Kemp M, Go Y-M, Jones DP. 2008. Nonequilibrium thermodynamics of thiol/disulfide
redox systems: a perspective on redox systems biology. Free Radical Biology and Medicine
44(6):921–937 DOI 10.1016/j.freeradbiomed.2007.11.008.
Hamre et al. (2016), PeerJ, DOI 10.7717/peerj.2688 23/26

Kirlin WG, Cai J, Thompson SA, Diaz D, Kavanagh TJ, Jones DP. 1999. Glutathione redox
potential in response to differentiation and enzyme inducers. Free Radical Biology and Medicine
27(11–12):1208–1218 DOI 10.1016/S0891-5849(99)00145-8.
Krogdahl A, Hemre G-I, Mommsen TP. 2005. Carbohydrates in fish nutrition: digestion and
absorption in postlarval stages. Aquaculture Nutrition 11(2):103–122
DOI 10.1111/j.1365-2095.2004.00327.x.
Lorentzen M, Maage A, Julshamn K. 1994. Effects of dietary selenite or selenomethionine on
tissue selenium levels of Atlantic salmon (Salmo-Salar). Aquaculture 121(4):359–367
DOI 10.1016/0044-8486(94)90270-4.
Lygren B, Hamre K, Waagbø R. 2000. Effect of induced hyperoxia on the antioxidant
status of Atlantic salmon, Salmo salar, L. fed three different levels of dietary vitamin E.
Aquaculture Research 31(4):401–407 DOI 10.1046/j.1365-2109.2000.00459.x.
Lygren B, Hjeltnes B, Waagbø R. 2001. Immune response and disease resistance in Atlantic
salmon (Salmo salar, L.) fed three levels of dietary vitamin E and the effect of vaccination on
the liver status of antioxidant vitamins. Aquaculture International 9(5):401–411
DOI 10.1023/A:1020509308400.
Ma Q. 2013. Role of Nrf2 in oxidative stress and toxicity. Annual Review of Pharmacology and
Toxicology 53(1):401–426 DOI 10.1146/annurev-pharmtox-011112-140320.
Mæland A, Waagbø R. 1998. Examination of the qualitative ability of some cold water marine
teleosts to synthesise ascorbic acid. Comparative Biochemistry and Physiology Part A: Molecular
& Integrative Physiology 121(3):249–255 DOI 10.1016/S1095-6433(98)10125-3.
Martensson J, Meister A. 1991. Glutathione deficiency decreases tissue ascorbate levels in
newborn rats: ascorbate spares glutathione and protects. Proceedings of the National Academy of
Sciences of the United States of America 88(11):4656–4660.
Martınez-Alvarez RM, Morales AE, Sanz A. 2005. Antioxidant defenses in fish: biotic
and abiotic factors. Reviews in Fish Biology and Fisheries 15(1):75–88
DOI 10.1007/s11160-005-7846-4.
Meister A. 1994. Glutathione ascorbic acid antioxidant system in animals. Journal of Biological
Chemistry 269(13):9397–9400.
Meland SJ. 1995. Biologisk aktivitet av ulike vitamin E forbindelser hos yngel av atlantisk laks
(Salmo salar, L). Cand. Scient. thesis, University of Bergen, Norway.
Morgan B, Ezerina D, Amoako TNE, Riemer J, Seedorf M, Dick TP. 2013. Multiple glutathione
disulfide removal pathways mediate cytosolic redox homeostasis. Nature Chemical Biology
9(2):119–125 DOI 10.1038/nchembio.1142.
NRC. 2011. Nutrient Requirements of Fish and Shrimp. Washington, D.C.: The Natioanal
Academic Press.
Olsvik PA, Torstensen BE, Hemre G-I, Sanden M, Waagbø R. 2011. Hepatic oxidative stress
in Atlantic salmon (Salmo salar, L.) transferred from a diet based on marine feed ingredients
to a diet based on plant ingredients. Aquaculture Nutrition 17(2):e424–e436
DOI 10.1111/j.1365-2095.2010.00778.x.
Penglase S, Edvardsen RB, Furmanek T, Rønnestad I, Karlsen Ø, van der Meeren T, Hamre K.
2015. Diet affects the redox system in developing Atlantic cod (Gadus morhua) larvae.
Redox Biology 5:308–318 DOI 10.1016/j.redox.2015.06.003.
Penglase S, Hamre K, Rasinger JD, Ellingsen S. 2014. Selenium status affects selenoprotein
expression, reproduction, and F-1 generation locomotor activity in zebrafish (Danio rerio).
British Journal of Nutrition 111(11):1918–1931 DOI 10.1017/S000711451300439X.
Hamre et al. (2016), PeerJ, DOI 10.7717/peerj.2688 24/26

Rigotti A. 2007. Absorption, transport, and tissue delivery of vitamin E. Molecular Aspects of
Medicine 28(5–6):423–436 DOI 10.1016/j.mam.2007.01.002.
Sandnes K, Torrissen O, Waagbø R. 1992. The minimum dietary requirement of vitamin C in
Atlantic salmon (Salmo salar) fry using Ca-ascorbate-2-monophosphate as dietary source.
Fish Physiology and Biochemistry 10(4):315–319 DOI 10.1007/BF00004480.
Schafer FQ, Buettner GR. 2001. Redox environment of the cell as viewed through the redox
state of the glutathione disulfide/glutathione couple. Free Radical Biology and Medicine
30(11):1191–1212 DOI 10.1016/S0891-5849(01)00480-4.
Skjærven KH, Penglase S, Olsvik PA, Hamre K. 2013. Redox regulation in Atlantic cod
(Gadus morhua) embryos developing under normal and heat-stressed conditions.
Free Radical Biology and Medicine 57:29–38 DOI 10.1016/j.freeradbiomed.2012.11.022.
Sunde RA, Raines AM, Barnes KM, Evenson JK. 2009. Selenium status highly regulates
selenoprotein mRNA levels for only a subset of the selenoproteins in the selenoproteome.
Bioscience Reports 29(5):329–338 DOI 10.1042/BSR20080146.
Tappel AL. 1962. Vitamin E as the biological lipid antioxidant. Vitamins & Hormones
20:493–510 DOI 10.1016/S0083-6729(08)60732-3.
Terova G, Saroglia M, Papp ZG, Cecchini S. 1998. Dynamics of collagen indicating amino acids,
in embryos and larvae of sea bass (Dicentrarchus labrax) and gilthead sea bream (Sparus aurata),
originated from broodstocks fed with different vitamin C content in the diet. Comparative
Biochemistry and Physiology Part A: Molecular & Integrative Physiology 121(2):111–118
DOI 10.1016/S1095-6433(98)10110-1.
Timme-Laragy AR, Goldstone JV, Imhoff BR, Stegeman JJ, Hahn ME, Hansen JM. 2013.
Glutathione redox dynamics and expression of glutathione-related genes in the
developing embryo. Free Radical Biology & Medicine 65:89–101
DOI 10.1016/j.freeradbiomed.2013.06.011.
Trichet VV. 2010. Nutrition and immunity: an update. Aquaculture Research 41(3):356–372
DOI 10.1111/j.1365-2109.2009.02374.x.
Vandesompele J, De Preter K, Pattyn F, Poppe B, Van Roy N, De Paepe A, Speleman F. 2002.
Accurate normalization of real-time quantitative RT-PCR data by geometric averaging of
multiple internal control genes. Genome Biology 3(7):RESEARCH0034.
Waagbø R. 1994. The impact of nutritional factors on the immune system in Atlantic salmon,
Salmo salar, L.: a review. Aquaculture and Fisheries Management 25(2):175–197
DOI 10.1111/j.1365-2109.1994.tb00573.x.
Waagbø R. 2006. Feeding and disease resistence in fish. In: Mosenthin R, Zentek J, Zebrowska T,
eds. Biology of Growing Animals. London: Elsevier Ltd., 387–415.
Waagbø R, Sandnes K. 1996. Effects of dietary vitamin C on growth and parr-smolt
transformation in Atlantic salmon, Salmo salar, L. Aquaculture Nutrition 2(2):65–69
DOI 10.1111/j.1365-2095.1996.tb00010.x.
Wallert M, Schmolz L, Galli F, Birringer M, Lorkowski S. 2014. Regulatory metabolites of
vitamin E and their putative relevance for atherogenesis. Redox Biology 2:495–503
DOI 10.1016/j.redox.2014.02.002.
Weiss SL, Evenson JK, Thompson KM, Sunde RA. 1996. The selenium requirement for
glutathione peroxidase mRNA level is half of the selenium requirement for glutathione
peroxidase activity in female rats. Journal of Nutrition 126(9):2260–2267.
Weiss SL, Evenson JK, Thompson KM, Sunde RA. 1997. Dietary selenium regulation of
glutathione peroxidase mRNA and other selenium-dependent parameters in male rats.
Journal of Nutritional Biochemistry 8(2):85–91 DOI 10.1016/S0955-2863(96)00178-7.
Hamre et al. (2016), PeerJ, DOI 10.7717/peerj.2688 25/26

Woodward B. 1994. Dietary vitamin requirements of cultured young fish, with emphasis
on quantitative estimates for salmonids. Aquaculture 124(1–4):133–168
DOI 10.1016/0044-8486(94)90375-1.
Yoshida H, Yusin M, Ren I, Kuhlenkamp J, Hirano T, Stolz A, Kaplowitz N. 1992. Identification,
purification, and immunochemical characterization of a tocopherol-binding protein in rat-
liver cytosol. Journal of Lipid Research 33:343–350.
Hamre et al. (2016), PeerJ, DOI 10.7717/peerj.2688 26/26


