ANTIGUA AND BARBUDA S NATIONAL GREENHOUSE AS …
55
ANTIGUA AND BARBUDA’S NATIONAL GREENHOUSE GAS REDUCTION REPORT Produced by Climate Analytics for Antigua and Barbuda’s Department of Environment, through the NDC Partnership’s Climate Action Enhancement Package (CAEP) Initiative
Transcript of ANTIGUA AND BARBUDA S NATIONAL GREENHOUSE AS …
ANTIGUA AND BARBUDA’S NATIONAL GREENHOUSE GAS
REDUCTION REPORT
Produced by Climate Analytics for Antigua and Barbuda’s Department of Environment, through the NDC Partnership’s Climate Action Enhancement Package (CAEP) Initiative
2
Produced by Climate Analytics
Climate Analytics is an international non-profit climate science and policy institute headquartered in Berlin, Germany with regional offices in Lomé, Togo, Perth, Australia and New York, USA and with associates across Europe, South America, Asia, Africa, the Pacific and the Caribbean. The technical assistance provided for this Report has been through Climate Analytics’ IMPACT project. IMPACT is a cross-cutting, multi-faceted project that is implemented by a wide range of institutions in three regions – the Pacific, West Africa and the Caribbean. It aims to strengthen capacities in Small Island Developing States (SIDS) and Least Developed Countries (LDCs) to co-develop scientific outputs and knowledge products and to support relevant actors to make use of them in the development and implementation of transformational climate adaptation and mitigation strategies.
Partner Organisations
The Department of Environment (DOE) is a government agency within the Ministry of Health, Wellness and the Environment in the Government of Antigua and Barbuda (GoAB). Its overall mission is to provide technical advice on the environment and to design and implement projects on behalf of the Government and the people of Antigua and Barbuda. The DOE is the national focal point for the multilateral environmental agreements (MEAs) to which the country is Party. It accomplishes its mission inter alia through an integrated environmental planning and management system, efficient implementation of programmes, projects and technical services, provision of accurate council on environmental management as well as effective and consistent enforcement of environmental laws and regulations, and provision of easily accessible information and technical assistance to the public.
The NDC Partnership’s Climate Action Enhancement Package (CAEP) Initiative, through which this technical assistance has been channelled, is a new offering of the NDC Partnership designed to deliver targeted, fast-track support to countries to enhance the quality, increase the ambition, and implement nationally determined contributions.
Antigua and Barbuda’s National Greenhouse Gas Reduction Report With support from: Climate Analytics and the IMPACT Project, the German Federal Ministry for the Environment, Nature Conservation Building and Nuclear Safety, and the EU Marie-Curie Fellowship 838667 – INTERACTION Authors: Dr Robert Brecha, Shweta Movalia, Frances Fuller, and Dr Jan Sindt
Prepared under the guidance of: Antigua and Barbuda’s Department of Environment, Ministry of Health, Wellness and the Environment, Government of Antigua and Barbuda Reviewers: Melissa LeBlanc, Jason Williams, Aaliyah Tuitt, Dudley Williams, Vekash Khan, Santana Lewis, Ezra Christopher, Bryan Payne, Arry Simon, and Michai Robertson
Support provided through: the NDC-Partnership’s Climate Action Enhancement Package
Finalised on: 22 July 2020
Citation: Climate Analytics. (2020). Antigua and Barbuda’s National Greenhouse Gas Reduction Report.
3
TABLE OF CONTENTS
LIST OF BOXES ................................................................................................................................. 4 LIST OF FIGURES .............................................................................................................................. 4 LIST OF TABLES ................................................................................................................................ 4 LIST OF ACRONYMS ......................................................................................................................... 5 1. Summary for Policymakers ...................................................................................................... 6 2. Introduction ............................................................................................................................. 9 3. Background and Summary of Emissions in Antigua and Barbuda ............................................ 10
3.1. Historical Trends in GHG Emissions ..................................................................................................... 10 4. Targets of Antigua and Barbuda’s First NDC ........................................................................... 13 5. Revised NDC Targets for 2030 ................................................................................................ 15
5.1. Background for informing the revised mitigation targets for 2030 ..................................................... 15 5.2. Four interlocking stages of the fossil-fuel phase-out ........................................................................... 16
5.2.1. Stage One: Fossil Fuel Phase-out by 2030 ..................................................................................... 17 5.2.1.1. Replacement of Black Pine Power Plant ..................................................................................................... 18 5.2.1.2. Replacement of Wadadli Power Plant ........................................................................................................ 18 5.2.1.3. Land Requirements of Solar Arrays ............................................................................................................ 18 5.2.1.4. Investment Required and Savings Made During Stage One ...................................................................... 19 5.2.1.5. Potential Role of Storage ............................................................................................................................ 19
5.2.2. Stage Two: Transportation sector transformation and coupling to power sector ...................... 20 5.2.3. Stage Three: Completing the power sector fossil-fuel phase-out ................................................ 22
5.2.3.1. Replacement of APUA Power Plant ............................................................................................................ 23 5.2.4. Stage Four: Technical and Economic Analysis using the LEAP Energy Model .............................. 23
5.2.4.1. Power Sector ................................................................................................................................................ 25 5.2.4.2. Transport Sector .......................................................................................................................................... 30
5.2.5. Impact of Scenarios on Emission Profile ........................................................................................ 33 5.2.5.1. Carbon Dioxide Emissions ........................................................................................................................... 33 5.2.5.2. Air Transport emissions ............................................................................................................................... 34
6. Summary ............................................................................................................................... 36 7. Bibliography .......................................................................................................................... 38 8. Appendices ............................................................................................................................ 39
8.1. Appendix 1: LEAP Energy Modelling .................................................................................................... 39 8.1.1. Modes of LEAP model and supplementary model use ................................................................. 40 8.1.2. Technological assumptions and scenarios ..................................................................................... 41 8.1.3. Economic assumptions ................................................................................................................... 43 8.1.4. Illustration of challenges ................................................................................................................ 43
8.2. Appendix 2: Energy Modelling for 2015 NDC ...................................................................................... 45 8.2.1. Projects Supporting the Implementation of the 2015 NDC .......................................................... 46
8.3. Appendix 3: Energy modelling conducted by the Energy Division, Ministry of Public Utilities, Civil Aviation and Energy .......................................................................................................................................... 50
8.3.1. Energy Demand Analysis ................................................................................................................ 50 8.3.2. Electricity Supply Analysis .............................................................................................................. 52

4
LIST OF BOXES
BOX 1: LEAP ENERGY MODELLING ................................................................................................................................ 23 BOX 2: ASSUMPTIONS USED IN LEAP MODELLING ............................................................................................................ 41 BOX 3: ENERGY DEMAND ANALYSIS (MAED) .................................................................................................................. 50 BOX 4: ELECTRICITY SUPPLY ANALYSIS (ESST) ................................................................................................................. 53
LIST OF FIGURES
FIGURE 1: FUEL IMPORTS AS A SHARE OF GDP ................................................................................................................ 12 FIGURE 2: EXAMPLE OF AREA NEEDED FOR A SOLAR ARRAY. THE AIRPORT SOLAR ARRAY REQUIRES 3 HECTARES ............................ 19 FIGURE 3: DISTRIBUTION OF VINTAGES FOR DIFFERENT TYPES OF VEHICLES ............................................................................. 21 FIGURE 4: YEARLY SALES OF DIFFERENT TYPES OF VEHICLES DURING THE TRANSITION AWAY FROM ICEVS .................................... 22 FIGURE 5: POWER SECTOR ELECTRICITY GENERATION ........................................................................................................ 26 FIGURE 6: CAPACITY OVER TIME OF DIFFERENT TECHNOLOGIES ............................................................................................ 27 FIGURE 7: SNAPSHOT OF CAPACITIES FOR DIFFERENT TECHNOLOGIES UNDER DIFFERENT PATHWAYS TO (NEARLY) ALL RENEWABLE
POWER SECTOR IN 2030. I) NO DISPATCHABLE RENEWABLE POWER, LOW WIND AVAILABILITY; II) NO DISPATCHABLE RENEWABLE, HIGH WIND AVAILABILITY; III) SOME DISPATCHABLE RENEWABLE, LOW WIND AVAILABILITY; IV) SOME DISPATCHABLE RENEWABLE, MEDIUM WIND ................................................................................................................................ 28
FIGURE 8: SNAPSHOT OF ENERGY GENERATION FOR DIFFERENT TECHNOLOGIES UNDER DIFFERENT PATHWAYS TO (NEARLY) ALL RENEWABLE POWER SECTOR IN 2030. I) NO DISPATCHABLE RENEWABLE POWER, LOW WIND AVAILABILITY; II) NO DISPATCHABLE RENEWABLE, HIGH WIND AVAILABILITY; III) SOME DISPATCHABLE RENEWABLE, LOW WIND AVAILABILITY; IV) SOME DISPATCHABLE RENEWABLE, MEDIUM WIND. ........................................................................................................... 29
FIGURE 9: STOCKS OF VEHICLES, BOTH ICEV AND EV THROUGH THE PHASE-OUT OF FOSSIL-FUEL VEHICLES .................................. 31 FIGURE 10: CO2 EMISSIONS ......................................................................................................................................... 33 FIGURE 11: EMISSIONS FROM AN ESTIMATED ANTIGUA AND BARBUDA’S SHARE OF AVIATION FUEL SOLD IN THE COUNTRY .............. 35 FIGURE 12: ENERGY SYSTEM SCHEMATIC FOR ANTIGUA AND BARBUDA ................................................................................. 40 FIGURE 13: CAPITAL COSTS FOR TECHNOLOGIES OVER TIME ................................................................................................ 43 FIGURE 14: SUPPLY AND DEMAND OF RENEWABLE ENERGY SOURCES ................................................................................... 44 FIGURE 15: GREENHOUSE GAS EMISSIONS FOR DIFFERENT SCENARIOS (FIRST NDC) ................................................................ 46 FIGURE 16: FINAL ENERGY DEMAND, MAED .................................................................................................................. 51 FIGURE 17: FINAL ELECTRICITY DEMAND, MAED ............................................................................................................ 52 FIGURE 18: INSTALLED CAPACITY, ESST ......................................................................................................................... 53 FIGURE 19: TOTAL COST (MILLION USD) ....................................................................................................................... 53 FIGURE 20: TOTAL CO2 EMISSIONS IN ENERGY SECTOR (MTCO2) ..................................................................................... 54
LIST OF TABLES
TABLE 1: SUMMARY OF GREENHOUSE GAS EMISSIONS, 2015 ............................................................................................ 10 TABLE 2: NATIONAL GREENHOUSE GAS EMISSIONS (GG CO2 E) .......................................................................................... 11 TABLE 3: SUMMARY OF REPRESENTATIVE COSTS FOR THE TRANSITION TO (NEAR) 100% RENEWABLE ENERGY IN THE POWER SECTOR 30 TABLE 4: STORAGE NEEDS (GRID WITH HIGH RENEWABLE ENERGY PENETRATION) AND DISTRIBUTED SUPPLY, REPRESENTED HERE BY EV
BATTERY CAPACITY. TOTAL EV BATTERY CAPACITY IS GIVEN IN THE TABLE; FOR THE LEAP MODELLING IT WAS ASSUMED THAT ONE-HALF THIS CAPACITY IS AVAILABLE. .................................................................................................................. 32
TABLE 5: TRANSPORTATION DATA, ANTIGUA AND BARBUDA ............................................................................................... 42 TABLE 6: MITIGATION SCENARIOS FOR THE FIRST NDC ...................................................................................................... 45 TABLE 7: CLIMATE PROJECTS FOR ANTIGUA AND BARBUDA’S NDC TARGETS ......................................................................... 47
5
LIST OF ACRONYMS
AFOLU Agriculture, Forestry and other Land uses ASHRAE American Society of Heating, Refrigerating and Air-Conditioning Engineers BAU Business as Usual CARICOM The Caribbean Community CDB Caribbean Development Bank CDF CARICOM Development Fund CO2 Carbon Dioxide CREEBC CARICOM Regional Energy Efficiency Building Code CROSQ CARICOM Regional Organisation for Standards and Quality DOE Department of the Environment ESST Energy Scenario Simulation Tool EV Electric Vehicle GCF Green Climate Fund GDP Gross Domestic Product GEF Global Environment Facility GHG GWh
Greenhouse Gas Gigawatt hours
HDV Heavy-duty Vehicle HFC HFO
Hydrofluorocarbon Heavy Fuel Oil
IAEA International Atomic Energy Agency ICC International Code Council ICEV Internal Combustion Engine Vehicle INDC Intended Nationally Determined Contribution IRENA Ktoe
International Renewable Energy Agency Kilotonne of Oil Equivalent
LEAP Long-range Energy Alternatives Planning MAED MtCO2 MW MWP
Model for Analysis of Energy Demand Metric tons of Carbon Dioxide Megawatts Megawatt Peak
NDC Nationally Determined Contribution OTEC Ocean Thermal Energy Conversion RE Renewable Energy RES Renewable Energy Scenario SIDS Solar pv
Small Island Developing State Solar photovoltaics
SUV Sport Utility Vehicle SWAC Sea Water Air Conditioning UNEP United Nations Environment Programme UNFCCC USD
United Nations Framework Convention on Climate Change U.S. Dollars
WIOC West Indies Oil Company
6
1. Summary for Policymakers
On February 20, 2019 the Cabinet of Antigua and Barbuda agreed that the “Ministry with responsibility for the Environment and the Ministry responsible for Energy should collaborate to fast track the implementation of the government’s policy to transition from fossil fuel energy to renewable energy.”1 In addition, Antigua and Barbuda, as a Party to the Paris Agreement on climate change, is required to communicate a nationally determined contribution (NDC) to the United Nations Framework Convention on Climate Change (UNFCCC) in 2020. In line with this UNFCCC requirement, and the directive provided by Cabinet, the Department of Environment (DOE), as Focal Point to the UNFCCC, is leading the process to set targets for their 2020 NDC submission. To inform the setting of these new targets, the DOE requested technical support through the NDC Partnership’s Climate Action Enhancement Package (CAEP). One of the core deliverables of this assistance is this report – Antigua and Barbuda’s National Greenhouse Gas Reduction Report. The DOE requested technical assistance to inform their deliberations around the two main areas of focus for mitigation action for the revised NDC to be submitted in 2020:
- to phase-out the use of fossil fuels in the power sector by 2030; and
- to phase-out the use of internal combustion vehicles by 2040.
These targets are based on a Cabinet Decision of February 20, 2019 and also summarized in the box to the right; if adopted, these new NDC targets will represent a progressive increase in ambition as per Article 4.3 of the Paris Agreement and solidify Antigua and Barbuda’s contribution toward achieving the long-term temperature goal of the Paris Agreement. Climate Analytics has undertaken a technical analysis of renewable energy needs under different pathways to reach these mitigation targets for possible inclusion in the NDC for 2020. This initial analysis, including through the use of the Low Emissions Analysis Platform (LEAP) modelling framework, is based on existing data provided through DOE and laid out in this report in four overlapping and interlinked stages:
- 2020-2025 – replacement of two power plants; ramp up of renewables;
- 2020-2030 – increase in electrification of transport; phase-out of ICE Vehicle sales;
- 2025-2030 – completion of power sector fossil fuel phase-out and implementation of grid + transport integration; and
- Beyond 2030 – fossil phase-out in power sector, continued increase in storage capacity, possible need for dispatchable renewable electricity generation, integration of transport in power sector as ICEVs are phased out.
1 (Antigua and Barbuda Cabinet Secretariat, 2019)
“Antigua and Barbuda is ideally positioned to be at the forefront of a global movement pushing
towards a cleaner, more resilient future. It is the goal of the country to have 100% of its energy
generation come from renewable energy sources by 2030. As the energy sector is currently de-
pendent on the import and combustion of fossil fuels for energy generation and is responsible for most of Antigua and Barbuda’s greenhouse gas
emissions, a transition to 100% renewable energy generation will reduce emissions by upwards of 90%. Transitioning to renewable energy genera-
tion will create the necessary environment for 100% adoption of electric vehicles in the
transport sector and increase the country’s resili-ence to intensifying extreme weather events.”
Minister with responsibility for the Environment, Honourable Mr. Molwyn Joseph, in a letter to
IRENA Director General, Mr. Francesco La Cam-era, (August 2019)
7
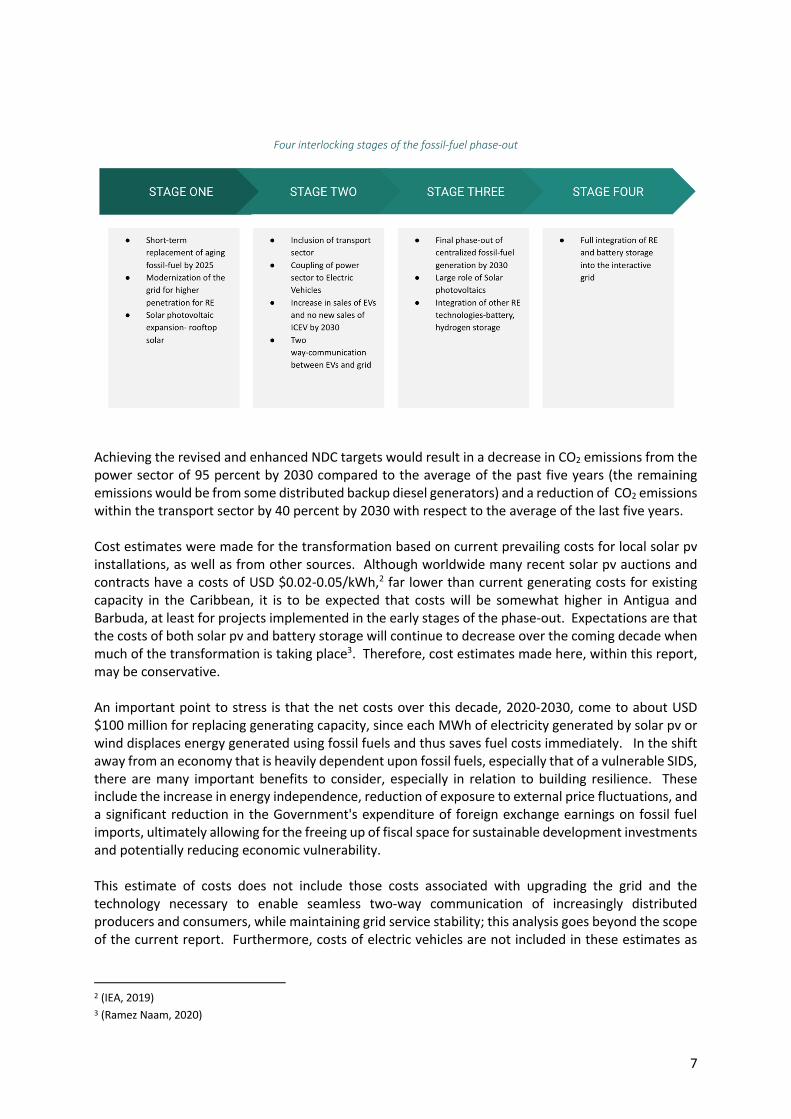
Four interlocking stages of the fossil-fuel phase-out
Achieving the revised and enhanced NDC targets would result in a decrease in CO2 emissions from the power sector of 95 percent by 2030 compared to the average of the past five years (the remaining emissions would be from some distributed backup diesel generators) and a reduction of CO2 emissions within the transport sector by 40 percent by 2030 with respect to the average of the last five years. Cost estimates were made for the transformation based on current prevailing costs for local solar pv installations, as well as from other sources. Although worldwide many recent solar pv auctions and contracts have a costs of USD $0.02-0.05/kWh,2 far lower than current generating costs for existing capacity in the Caribbean, it is to be expected that costs will be somewhat higher in Antigua and Barbuda, at least for projects implemented in the early stages of the phase-out. Expectations are that the costs of both solar pv and battery storage will continue to decrease over the coming decade when much of the transformation is taking place3. Therefore, cost estimates made here, within this report, may be conservative. An important point to stress is that the net costs over this decade, 2020-2030, come to about USD $100 million for replacing generating capacity, since each MWh of electricity generated by solar pv or wind displaces energy generated using fossil fuels and thus saves fuel costs immediately. In the shift away from an economy that is heavily dependent upon fossil fuels, especially that of a vulnerable SIDS, there are many important benefits to consider, especially in relation to building resilience. These include the increase in energy independence, reduction of exposure to external price fluctuations, and a significant reduction in the Government's expenditure of foreign exchange earnings on fossil fuel imports, ultimately allowing for the freeing up of fiscal space for sustainable development investments and potentially reducing economic vulnerability. This estimate of costs does not include those costs associated with upgrading the grid and the technology necessary to enable seamless two-way communication of increasingly distributed producers and consumers, while maintaining grid service stability; this analysis goes beyond the scope of the current report. Furthermore, costs of electric vehicles are not included in these estimates as
2 (IEA, 2019) 3 (Ramez Naam, 2020)
8
those will be mostly private purchases, although subsidies and incentives will be needed to achieve the goal of ICEV phase-out by 2040. Resilience is an important part of the transformation of the energy system and the phase-out of fossil fuels. The increase in renewables and battery storage means that the production of electricity will become increasingly decentralised. With this decentralisation, there is a need to balance the requirement to maintain stability and reliability of the grid for all users, and the opportunity presented with this phase-out to increase resilience in the face of hurricanes or other disruptions. Vehicles with batteries or external battery storage in homes and at commercial locations can become supplemental sources of power when needed. These sources of power and energy storage can be crucial for grid stability and other grid services, and would therefore be most beneficial when fully integrated in the system. To facilitate the uptake, it would be beneficial to discuss options for incentives for customers to invest in them. As alluded to, some key issues will require further studies and detailed policy discussions will be needed to determine the exact pathway or scenario through which Antigua and Barbuda can achieve these mitigation goals. These include the potential and options for dispatchable renewable energy sources as well as national, sub-regional and regional level discussions to incentivize the uptake of EVs and the disposal of retired ICEVs. The analysis presented here will need to be complemented in the future with more detailed studies on the details of integrating high levels of variable renewable energy sources along with feasibility studies for the potential introduction of new renewable energy technology. No attempt has been made to model grid stability or detailed transmission and distribution system characteristics, nor have the specific technologies necessary for interactive grid implementation been modelled. Currently, the International Renewable Energy Agency (IRENA) is conducting a more in-depth study to address some of these issues that arise in moving towards these mitigation goals. The proposed mitigation targets for possible inclusion in the revised 2020 NDC for Antigua and Barbuda are ambitious and will be seen as leading the way in making the energy system transformation necessary for meeting Paris Agreement long-term goals. In addition to the in-depth studies mentioned above, many policy discussions will be necessary to set the framework for the transition to a fossil-fuel-free energy system. The transition will be feasible with process and policies needed to provide flexibility in implementation while at the same time providing clear ground rules for actors at all levels – commercial, households, utility and other owners of generating assets, as well as to send signals to the private sector, external investors and funders. The transformation will be an iterative process; thus far no country has yet transformed both the power and transport sectors so aggressively, especially under conditions of a vulnerable Small Island Developing State. Success in Antigua and Barbuda will result in a model that can be followed by many other countries.
9
2. Introduction
Article 4 of the Paris Agreement outlined that “each Party shall communicate a nationally determined contribution (NDC) every five years” to the United Nations Framework Convention on Climate Change (UNFCCC). As per the mandate in 1/CP.21 (paragraphs 23-25), Parties are to submit new and updated NDCs at least 9-12 months in advance of COP 26 in November 2020. Parties to the Paris Agreement have an obligation for each successive NDC to represent a “progression” and “reflect its highest possible ambition” (Article 4.3). Antigua and Barbuda submitted its first NDC to the UNFCCC in 2015 and the country is set to submit a revised and more ambitious NDC in 2020 to support the long-term temperature goal of the Paris Agreement of “holding the increase in the global average temperature to well below 2˚C above pre-industrial levels and pursing efforts to limit the temperature increase to 1.5˚C”. To support these efforts, Antigua and Barbuda, as a Member of the NDC Partnership, submitted a request for support to the NDC Partnership’s Climate Action Enhancement Package (CAEP) Initiative in 2019. This report is being delivered through the CAEP with support from Climate Analytics. Antigua and Barbuda does not possess any indigenous sources of fossil fuel resources and is therefore heavily dependent on fossil fuel imports. According to the 2015 National greenhouse gas inventory4, about 76 percent of total GHG emissions were produced from fuel combustion in the energy sector. On February 20, 2019 “the Cabinet agreed that the Ministry with responsibility for the Environment and the Ministry responsible for Energy should collaborate to fast-track the implementation of the government’s policy to transition from fossil fuel energy to renewable energy” (Antigua and Barbuda Cabinet Secretariat, 2019). As a result, the Department of Environment intends to set an ambitious target of phasing out 100 percent of fossil fuels in the electricity sector by 2030 and by 2040 for transport sector and for these targets to form the basis of mitigation ambition within the NDC in 2020. The objective of this National Greenhouse Gas (GHG) Reduction Report is to assess greenhouse gas emissions in the energy and transport sector and undertake energy modelling to lay out possible pathways for a future based on the 100 percent phase out target. The National GHG Reduction Report, along with the Energy Roadmap, that will be supported by IRENA, will feed into a masterplan for the phase out of fossil fuels in Antigua and Barbuda. These efforts aim to establish possible scenarios, priority projects and institutional changes needed by sector, the emissions impacts of these changes and the expected investment costs, with the ultimate goal of supporting the achievement of the long-term temperature goal of the Paris Agreement. The report begins in Section 3 with a detailed greenhouse gas emissions profile of the country and the associated historical trends. Section 4 outlines the first NDC targets set in 2015 by the Government of Antigua and Barbuda and what has been achieved to date in support of these sectoral NDC targets. Section 5 summarises the energy modelling undertaken by the Climate Analytics team and discusses the fossil fuel phase-out in the power and transport sectors.
4 (Government of Antigua and Barbuda, 2020)
10
3. Background and Summary of Emissions in Antigua and Barbuda
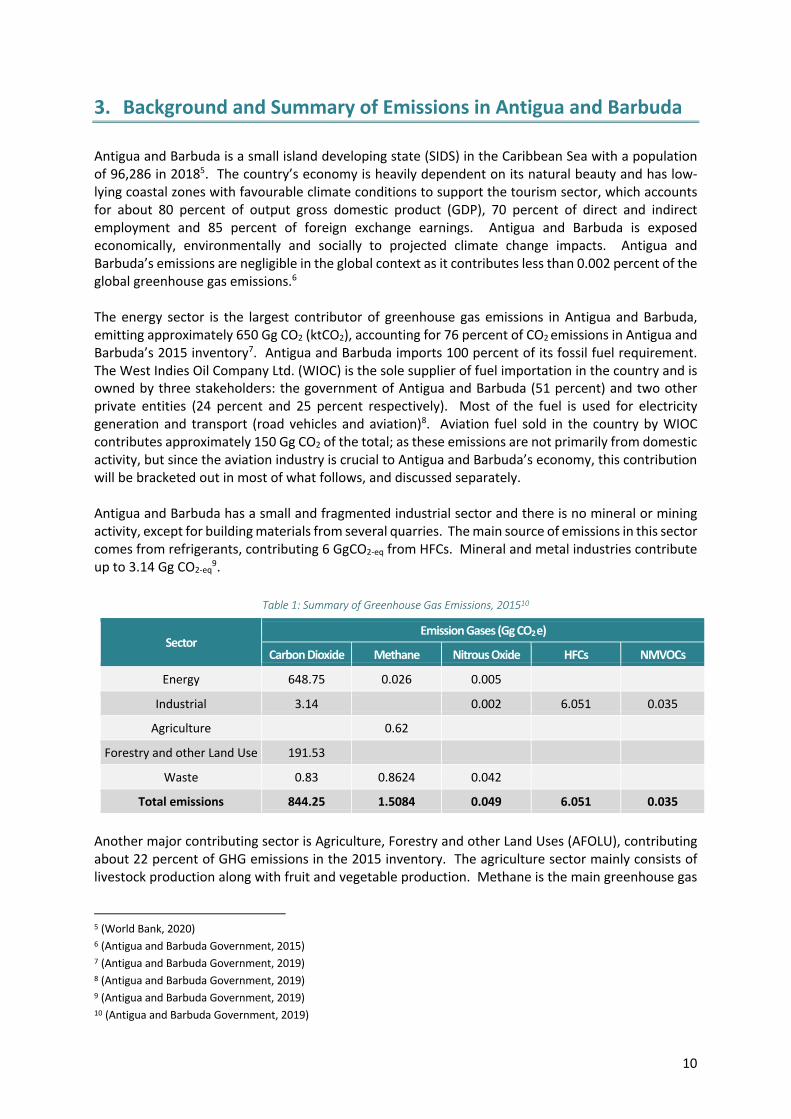
Antigua and Barbuda is a small island developing state (SIDS) in the Caribbean Sea with a population of 96,286 in 20185. The country’s economy is heavily dependent on its natural beauty and has low-lying coastal zones with favourable climate conditions to support the tourism sector, which accounts for about 80 percent of output gross domestic product (GDP), 70 percent of direct and indirect employment and 85 percent of foreign exchange earnings. Antigua and Barbuda is exposed economically, environmentally and socially to projected climate change impacts. Antigua and Barbuda’s emissions are negligible in the global context as it contributes less than 0.002 percent of the global greenhouse gas emissions.6 The energy sector is the largest contributor of greenhouse gas emissions in Antigua and Barbuda, emitting approximately 650 Gg CO2 (ktCO2), accounting for 76 percent of CO2 emissions in Antigua and Barbuda’s 2015 inventory7. Antigua and Barbuda imports 100 percent of its fossil fuel requirement. The West Indies Oil Company Ltd. (WIOC) is the sole supplier of fuel importation in the country and is owned by three stakeholders: the government of Antigua and Barbuda (51 percent) and two other private entities (24 percent and 25 percent respectively). Most of the fuel is used for electricity generation and transport (road vehicles and aviation)8. Aviation fuel sold in the country by WIOC contributes approximately 150 Gg CO2 of the total; as these emissions are not primarily from domestic activity, but since the aviation industry is crucial to Antigua and Barbuda’s economy, this contribution will be bracketed out in most of what follows, and discussed separately. Antigua and Barbuda has a small and fragmented industrial sector and there is no mineral or mining activity, except for building materials from several quarries. The main source of emissions in this sector comes from refrigerants, contributing 6 GgCO2-eq from HFCs. Mineral and metal industries contribute up to 3.14 Gg CO2-eq
9.
Table 1: Summary of Greenhouse Gas Emissions, 201510
Sector Emission Gases (Gg CO2 e)
Carbon Dioxide Methane Nitrous Oxide HFCs NMVOCs
Energy 648.75 0.026 0.005
Industrial 3.14 0.002 6.051 0.035
Agriculture 0.62
Forestry and other Land Use 191.53
Waste 0.83 0.8624 0.042
Total emissions 844.25 1.5084 0.049 6.051 0.035
Another major contributing sector is Agriculture, Forestry and other Land Uses (AFOLU), contributing about 22 percent of GHG emissions in the 2015 inventory. The agriculture sector mainly consists of livestock production along with fruit and vegetable production. Methane is the main greenhouse gas
5 (World Bank, 2020) 6 (Antigua and Barbuda Government, 2015) 7 (Antigua and Barbuda Government, 2019) 8 (Antigua and Barbuda Government, 2019) 9 (Antigua and Barbuda Government, 2019) 10 (Antigua and Barbuda Government, 2019)

11
emitted from the agriculture sector. The major sources of methane emissions are enteric fermentation and manure management. Forest cover of the country is limited as most of the forest were cleared during the colonial rule to establish sugar plantations. Forestry and other Land Use sectors emit 191.53 Gg of CO2-eq.
3.1. Historical Trends in GHG Emissions
In 2012, the Caribbean region, including Antigua and Barbuda, was responsible for less than 0.35 percent of global GHG emissions in 2012 with the small island developing state (SIDS) contributing less than 0.002 percent11. Antigua and Barbuda is a non-Annex 1 party to UNFCCC and has submitted three previous GHG inventories for the year 1990, 2000 and 2006. Antigua and Barbuda’s first Biennial Update Report (BUR), submitted in March 2020, presents the GHG inventory for the year 2015. The methodology used for this inventory was according to the 2006 IPCC Guidelines12.
Table 2: National Greenhouse Gas Emissions (Gg CO2 e)13
Year 1990 1994 2000 2006 2015
Carbon Dioxide 288.22 334.13 383 945.544 844.25
Methane 4.67 - 6.6 0.639 1.5084
Nitrous Oxide - - 2.3 - 0.049
HFCs - - 0.0037 114.034 6.051
NMVOCs 0.65 - 2.7 0.035 0.035
Source: Antigua and Barbuda Third National Communication and BUR (2020)
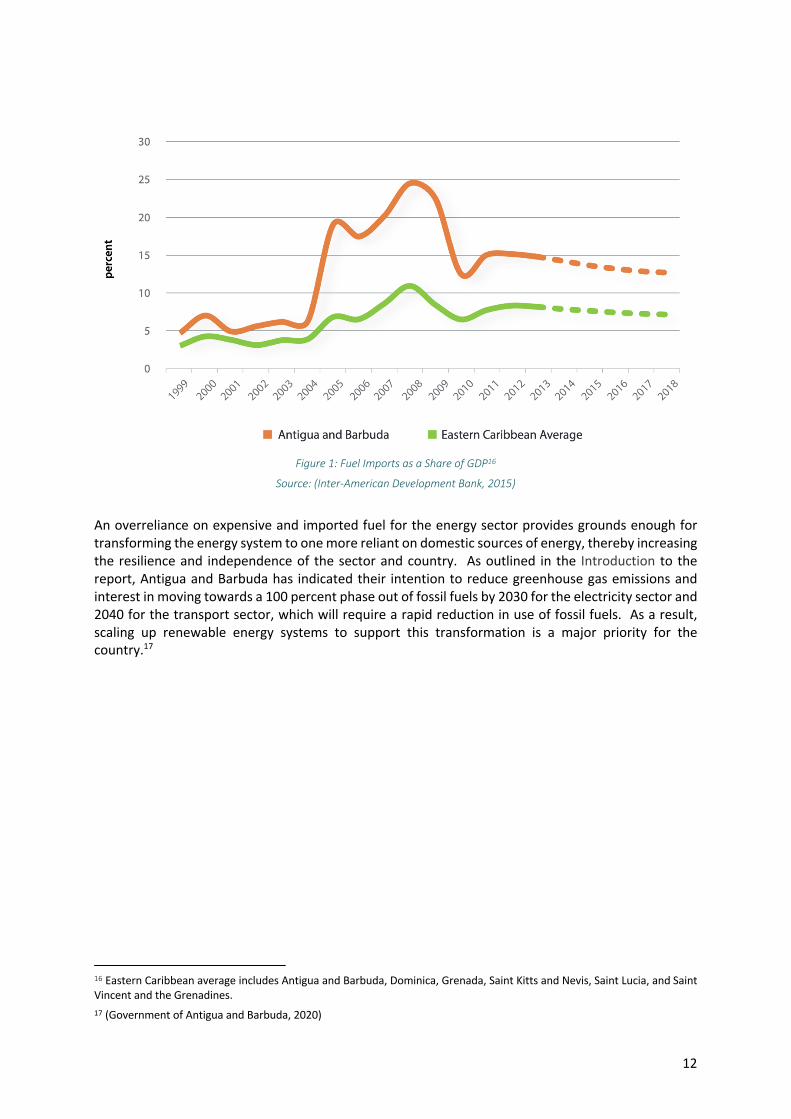
Antigua and Barbuda’s net emissions were estimated to be 844.25 Gg of CO2 in the 2015 GHG inventory. Based on the data collected through the GHG inventories, it shows that there was an apparent annual reduction of 10 percent in CO2 emissions (approximately 101 Gg of CO2) between 2006 and 2015. HFCs gas emissions appear to have reduced drastically between 2006 and 2015, however this is due to a change in HFC emission estimation methodology between the two inventories. Estimations for the 2006 inventory relied on refrigerant data from the Statistics Division, whereas 2015 relied on data provided by the Ozone Office Focal point in the Ministry of Trade.14 Over the years, the methods utilised for compiling the GHG inventory for all sectors has differed across the historical years, thus making a trend difficult to quantify. There is currently no independent means of verifying the above-mentioned emissions. This issue is recognised in the BUR (2020) and Department of Environment has proposed to address this in their fourth National Communication to UNFCCC. Table 1 shows how the energy sector (transport included) is the largest contributor of greenhouse gas emissions in the country. Furthermore, as a SIDS, electricity costs on the island remain high at approximately USD $0.35/kWh as 100 percent of the fuel is imported. In 2013, fuel imports amounted to USD 165.4 million, equivalent to 13.7 percent of its GDP. The fuel import cost for Antigua and Barbuda was above the Eastern Caribbean average of 8.6 percent. This can be observed in Figure 1. 15
11 (Antigua and Barbuda Government, 2015) (Antigua and Barbuda Government, 2019) 12 (Government of Antigua and Barbuda, 2020) 13 (Antigua and Barbuda Government, 2015) 14 (Government of Antigua and Barbuda, 2020) 15 (Inter-American Development Bank, 2015)
12
Figure 1: Fuel Imports as a Share of GDP16
Source: (Inter-American Development Bank, 2015)
An overreliance on expensive and imported fuel for the energy sector provides grounds enough for transforming the energy system to one more reliant on domestic sources of energy, thereby increasing the resilience and independence of the sector and country. As outlined in the Introduction to the report, Antigua and Barbuda has indicated their intention to reduce greenhouse gas emissions and interest in moving towards a 100 percent phase out of fossil fuels by 2030 for the electricity sector and 2040 for the transport sector, which will require a rapid reduction in use of fossil fuels. As a result, scaling up renewable energy systems to support this transformation is a major priority for the country.17
16 Eastern Caribbean average includes Antigua and Barbuda, Dominica, Grenada, Saint Kitts and Nevis, Saint Lucia, and Saint Vincent and the Grenadines. 17 (Government of Antigua and Barbuda, 2020)

13
4. Targets of Antigua and Barbuda’s First NDC
Before presenting an analysis to support the revision of Antigua and Barbuda’s NDC (Nationally Determined Contribution) we briefly summarize the country’s previous commitment. Antigua and Barbuda submitted its INDC (Intended NDC) to the UNFCCC in 2015. The INDC was converted to an NDC after the country formally joined the Paris Agreement through its signature and subsequent ratification in September 2016. Antigua and Barbuda’s 2015 NDC focuses on both climate change adaptation and mitigation, and features both unconditional and conditional targets that are dependent upon support from the international community18. Antigua and Barbuda’s first NDC Targets19 were: UNCONDITIONAL TARGETS 1. Enhance the established enabling legal, policy and institutional environment for a low carbon
emission development pathway to achieve poverty reduction and sustainable development. 2. By 2020, update the Building Code to meet projected impacts of climate change.
CONDITIONAL MITIGATION TARGETS 1. By 2020, establish efficiency standards for the importation of all vehicles and appliances. 2. By 2020, finalize the technical studies with the intention to construct and operationalize a waste
to energy (WTE) plant by 2025.
3. By 2030, achieve an energy matrix with 50 MW of electricity from renewable sources both on and off-grid in the public and private sectors.
4. By 2030, all remaining wetlands and watershed areas with carbon sequestration potential are protected as carbon sinks.
CONDITIONAL ADAPTATION TARGETS 1. By 2025, increase seawater desalination capacity by 50% above 2015 levels.
2. By 2030, all buildings are improved and prepared for extreme climate events, including drought, flooding and hurricanes.
3. By 2030, 100% of electricity demand in the water sector and other essential services (including health, food storage and emergency services) will be met through off-grid renewable sources.
4. By 2030, all waterways are protected to reduce the risks of flooding and health impacts. 5. By 2030, an affordable insurance scheme is available for farmers, fishers, and residential and
business owners to cope with losses resulting from climate variability. The conditional adaptation and mitigation targets present in the NDC were contingent upon Antigua and Barbuda receiving international support for capacity building, technology transfer and financial resources, including through the Green Climate Fund (GCF), the Global Environment Facility (GEF), the Adaptation Fund and multilateral agencies and bilateral agreements. The cost of implementing the adaptation targets was estimated to be approximately $20M USD per year for the next ten years, and the cost of implementing the mitigation targets was estimated at approximately $220M USD.20 The energy modelling to inform the first NDC in 2015 was completed by the Department of Environment (DOE) in partnership with the Clean Energy Solutions Centre using the Low Emissions
18 (Government of Antigua and Barbuda, 2015) 19 (Government of Antigua and Barbuda, 2015)
20 (Antigua and Barbuda Government, 2015)
14
Analysis Platform (LEAP). It provided the GHG analysis of the energy related mitigation targets for the country21.
21 (Clean Energy Solutions Center, 2015)

15
5. Revised NDC Targets for 2030
The DOE has outlined the intention to include two main areas of focus for mitigation action for the revised NDC to be submitted in 2020:
- to phase-out the use of fossil fuels in the power sector by 2030; and - to phase-out the use of internal combustion vehicles by 2040.
In the following sections the background to this choice of targets will be presented, followed by an outline of four stages that would be needed to achieve the targets, as well as a more detailed discussion of the energy system modelling used to quantitatively support these targets. It should be noted that this report and the following sections, provide technical analysis and support to the DOE in these two mitigation focus areas. Antigua and Barbuda intends to include other areas of focus within their 2020 NDC, however these will not be included in the analysis of this report.
5.1. Background for informing the revised mitigation targets for 2030
The focus areas for mitigation action correspond to the Antigua and Barbuda Prime Minister’s and the Cabinet’s commitment to fast-track the implementation of the government’s policy to transition from fossil-fuel energy to renewable energy, which includes a 100 percent reduction in emissions in the power sector by 203022. As already described in previous sections, the energy sector is the biggest contributor of GHG emissions in Antigua and Barbuda, and will be the main focus of the mitigation targets of the revised NDC. A further relevant point for enhancing NDC targets is that Antigua and Barbuda imports all of its fossil fuels and, as a result, remains susceptible to supply and market (cost) shocks; moving away from fossil fuels would increase the country’s resilience. Whereas the 2015 NDC conditionally committed to 50 MW of renewable electricity capacity by 2030, this revised NDC enhances that mitigation target by moving to a complete phase-out of fossil-fuel usage by 2030 in the electricity sector and by 2040 in the transport sector. A key enabling factor for the enhanced targets is that since the submission of the first round of NDCs in 2015, there has been a marked decrease in renewable energy and battery costs for electricity generation and storage, as well as an increase in availability and decrease in costs for electric vehicles. Furthermore, countries around the globe are gaining significant experience with the integration of high shares of variable renewable sources such as wind and solar photovoltaics. The adoption of renewable energy has previously been limited in Antigua and Barbuda due to high capital costs and potential and perceived grid stability issues, as well as uncertainty and limitations placed on expansion by feed-in policies23. Antigua and Barbuda has the potential for scaling up renewable energy systems with significant solar and wind resource potentials, which have become competitive on a levelized cost basis with fossil generation. The transport sector contributes a significant fraction of Antigua and Barbuda’s GHG emissions. Although not included in Antigua and Barbuda’s first NDC, the Third National Communication on Climate Change to the UNFCCC, does include emissions from the transport sector in the total energy sector emissions. Globally, the transport sector is witnessing dramatic developments with electrification, shared mobility and vehicle automation. Adoption of electric vehicles in Antigua and Barbuda is the most promising route to bring about significant GHG reductions as well as bringing other
22 (Ministry of Health, Wellness & The Environment, 2019) (Antigua and Barbuda Cabinet Secretariat, 2019) 23 (Japan International Cooperation Agency, 2015)
16
co-benefits24. Globally, the transport sector is responsible for high levels of non-GHG pollutants; in Antigua and Barbuda, the high emissions of pollutants other than GHG can be attributed to a lack of vehicle efficiency standards, and the dominant use of imported used vehicles. Reducing these pollutants would be a major co-benefit of a transition to electric vehicles. In summary, Antigua and Barbuda has the potential to use renewables to increase the ambition of its NDC mitigation target and reduce GHG emissions in the power sector. Parallel to this transformation, increased electrification of the transport sector will lead to both a decrease in emissions as well as a decrease in overall primary energy consumption (away from gasoline and diesel fuel) due to the much higher efficiency of electric motors compared to internal combustion engines. Simultaneously, a number of air pollution and other sustainable development co-benefits can be realized by making these transformations in the energy sector.
5.2. Four interlocking stages of the fossil-fuel phase-out
Electricity transmission and services in Antigua and Barbuda are supplied by Antigua Public Utilities Authority (APUA), a government-owned and vertically integrated corporation also responsible for public supply of water and telecommunications. Most of the electricity supply on Antigua is generated by the Antigua Power Company, a locally owned IPP with a Power Purchase Agreement (PPA) to provide APUA with electricity. Nearly all the generation on Antigua is fuelled by HFO with three main power plants: APC/APUA, Black Pine and Wadadli. In 2019, they generated 263 GWh, 88 GWh and 24 GWh respectively. Electricity generated on Barbuda will be produced by APUA using diesel-power-backed solar pv mini-grid plant servicing a peak demand of 0.5 MW.25 Based on the current set-up of the power sector, the phase-out of fossil fuels in Antigua and Barbuda is recommended to be undertaken in four distinct but interlinked and somewhat overlapping STAGES. Given that the country is currently 98 percent reliant on fossil fuels in both the power and transport sectors, the challenges for phase-out are significant and will require both careful planning and a pathway forward that can provide clarity, but also flexibility, to all actors. It should be noted that many of the features of the transition are ones many countries around the world are also facing for the first time. The FIRST STAGE of the transformation is the short-term replacement of aging fossil-fuel generating capacity by renewable energy sources by 2025. As that replacement is being carried out, there should be a parallel upgrading and modernization of the grid to prepare for higher penetrations of renewable sources, electric vehicles, and grid interactivity among centralized and decentralized production and consumption of power. Solar photovoltaic expansion will play a key role in this first stage, both utility-scale arrays and a large number of rooftop solar installations of different capacities, ranging from a few kilowatts of peak capacity to hundreds of kilowatts. Some wind power installations will also be part of this initial stage, but planning for more wind power will likely be necessary. The SECOND STAGE of the fossil-fuel phase-out strategy will be the inclusion of the transport sector and the coupling of the power sector to electric vehicles. Transformation of the transport sector will not start after that of the power sector, but rather in parallel, providing the linkage between sectoral transformations. The transport sector will involve the slow turnover of vehicle stock over the course of at least two decades. Accomplishing a complete transformation to electric vehicles trucks at this rate will imply a very rapid near-term increase in sales of EVs and no new sales of ICEVs by around 2030. Policies and incentives will have to be implemented so that over time there will be an increasing
24 (LOGIOS, 2018) 25 (International Renewable Energy Agency, 2016)
17
penetration of EVs into the stock of vehicles. The coupling of sectors is important to consider here from the start. Since EVs will need electricity, they will increase electricity demand at the same time the power sector is undergoing transformation. However, in a mode of integrated planning, the potential for two-way communication between EVs and the grid or households should not be overlooked and may be crucial, taking advantage of distributed storage and generation to reduce the need for centralized capacity. The THIRD STAGE of the phase-out will build on the successful execution of the first stage, including the required modernization of grid infrastructure. The key feature of this stage is the final phase-out of centralized fossil-fuel generation by 2030. Solar photovoltaics will continue to play a large role here, but decisions will have to be made with stakeholders about the balance between wind and solar power, as well as about other renewable energy technologies and the integration of battery or hydrogen storage to satisfy the demand required. The FOURTH STAGE, after decommissioning of fossil-fuel power plants by 2030, will be the full integration of renewable energy and battery storage into the interactive grid so as to reliably satisfying increasing demands for electricity due to the addition of electric vehicles. Continued increase in renewable energy capacity, interactive grid capabilities and policies and incentives for electric vehicles will be necessary. This final stage should be completed by 2040 to meet the proposed NDC targets. Implementation of the interactive and modernized grid mentioned in Stage One to Three is a prerequisite for the execution of Stage 4 as outlined in this report. Significant policy discussions and further analysis of this stage are however required, including, inter alia, an in-depth study of the grid, to inform the execution of Stage 4. This work is beyond the timeframe and scope of the CAEP project. We anticipate further work on this as Antigua and Barbuda moves to develop an implementation plan for their 2020 NDC and also works on the Masterplan for the fossil-fuel phase-out. The question of resilience is an important part of the transformation of the energy system and the phase-out of fossil fuels. The increase in solar installations and battery storage in households and commercial enterprises, and APUA potentially acquiring assets at different locations, means that the production of electricity will become increasingly decentralised. With this decentralisation, there is a need to balance the requirement to maintain stability and reliability of the grid for all users, and the opportunity presented with this phase-out to increase resilience in the face of hurricanes or other disruptions. Vehicles with batteries or external battery storage in homes and at commercial locations can become supplemental sources of power when needed. These sources of power and energy storage can also be, in a system that is fully integrated and that has provided the right incentives to customers, a resource for overall grid stability and for other grid services. It should be stressed that this model of decentralized coordination under conditions of very high renewable energy penetration is still a work in progress, and not only in Antigua and Barbuda, but in many other developing countries. However, a completely decentralized power system, one in which all customers are autonomous in energy production and consumption, would likely be less resilient (if solar panels are damaged in a storm, then no power is available for some time), less socially just (unless it there are guarantees in place that ensure the least well-off have access to the new sources of power, and that those remaining on the grid as time goes on will not suffer the full costs of operation) and more costly.
5.2.1. Stage One: Fossil Fuel Phase-out by 2030 In the following sub-sections, rough capacity and cost estimates are provided for the first stage of the transformation, with more detailed modelling presented later in the report, including estimates for storage capacity.
18
5.2.1.1. Replacement of Black Pine Power Plant The Black Pine power plant is currently planned to be retired slowly over the next four years; it generated 88 GWh of electricity in 2019. Solar pv in Antigua and Barbuda optimistically yields about 1.7 GWh/MWp of installed capacity. Therefore, approximately 52 MW of solar pv capacity is required, without considering storage or how the energy demand is bridged in times without sun, to replace the energy currently produced by Black Pine. At today's costs 52 MW would represent an up-front capital investment of about USD $75-100 million, but should decrease over time or with increasing experience of installations. To set the scale of needs, the DOE is already implementing a programme to ramp up installation of rooftop solar pv systems; placing 3.5 kW solar pv systems on 25 percent of homes (~9000 buildings) would provide 30 MW of capacity. To replace Black Pine, one could also choose wind power, with large turbines; the needed capacity would be about 30 MW at a cost of USD $45-75 million to generate 90 GWh of energy.
5.2.1.2. Replacement of Wadadli Power Plant Wadadli power plant is currently planned to continue running at one-third capacity for another few years, after not running at all for two years since its commissioning in 2011 due to technical problems. Wadadli generated 24 GWh of electricity in 2019. Therefore, one needs about 14 MW of solar pv capacity to replace the energy produced by Wadadli. At today's costs that would represent an up-front capital investment of about USD $20-25 million. Wind power would be another choice; the DOE currently has a project in the implementation phase to install 4 MW of wind power, which would generate about 9 GWh of energy with a 25 percent capacity factor, reducing the solar capacity need by 5 MW to 9 MW installed in this first phase, and thus reducing additional investment by USD $7-9 million.
5.2.1.3. Land Requirements of Solar Arrays An important consideration for solar arrays at the utility scale anticipated with the phase-out of fossil fuels is the amount of land needed. An international standard basic rule of thumb is to allow approximately one hectare of space for each MW of installed capacity. As an example, the solar array near the V.C. Bird International Airport is shown in Figure 2 below, with the yellow outline enclosing an area of slightly more than three hectares for the 3.5 MW array. The 4 MW Bethesda array solar panels are spread out somewhat more in sub-arrays and that array occupies approximately 5.3 hectares for the same solar capacity. For rooftop solar arrays with panels that can be installed more closely together, a 3-kW system would require approximately 20 m2 (210 sq. ft.) of roof. For the roughly 66 MW of solar pv capacity as replacement for both Black Pine and Wadadli, as described above and needed for Stage One approximately 60-75 hectares of space, either in fields or on rooftops, must be available. If 30 MW of capacity can be installed on rooftops by 2025, the free-land area necessary for the remainder, 36 MW, would be about 35-40 ha.

19
iou
Figure 2: Example of area needed for a Solar array. The Airport Solar array requires 3 hectares
5.2.1.4. Investment Required and Savings Made During Stage One To summarize this section, an investment of approximately USD $80-100 million over the next 4-5 years may be necessary for Antigua and Barbuda to get one third of the way to the 100 percent renewable target by 2030. However, in 2014 APUA spent USD $56,000,000 on fuel to produce 323,000 MWh of electricity, or USD $170/MWh. Substituting the 112,000 MWh of electricity mentioned above would bring a savings of USD $19,000,000/year or USD $75-95 million over four to five years in fuel costs alone, which puts the capital investment costs in perspective. The fuel savings then continue to accrue over the lifetime of the solar arrays, 25-30 years. If Stage One is followed as outlined above, it would leave the largest power plant, the APUA/APC plant which generated 263 GWh of energy in 2019, or two-thirds of the total. Therefore, a USD $100 million investment in solar photovoltaics and some wind power capacity achieves approximately one third of the electrical energy needed, without factoring in the potential for storage to compensate for variable power generation from wind and solar.
5.2.1.5. Potential Role of Storage One example of household-level energy storage that could be used within the case of Antigua and Barbuda’s fossil fuel phase-out, is that of Powerwall batteries. Home batteries have a storage capacity of 5 to 20 kWh and cost around USD750-1000/kWh.26 This represents about two days of storage for an average household. Utility-scale batteries27 should cost half that amount or less per unit of storage. Phasing out the use of internal combustion vehicles by 2040 in Antigua and Barbuda will increase the uptake of electric vehicles over time. The potential role EVs can play in storage capacity through the possibility for two-way communication between EVs and the grid or household should be considered, especially given each vehicle has 20 – 100 kWh of battery capacity, enough for as much as several days
26 (Business Insider, 2017) 27 A single Powerwall unit stores 14 kWh of energy, 10 batteries can be linked side-by-side to increase storage. Home-scale
systems would require battery storage of few kWh to few tens of kWh. Utility scale capacities would be tens of MWh or more.
20
of average household consumption. It is not clear at this point how to count the costs of storage in the form of EVs. It will be necessary to put in place legislation and agreements to govern the transfer of energy between prosumers and the grid; in addition a significant upgrade in technology will be necessary to enable both seamless transfers and the use of distributed EVs and home batteries as a grid resource not only for energy storage but also for ancillary grid services such as frequency control and inertia. As a first step, however, incorporating home, commercial and government solar arrays with storage capability should be part of the strategy to make the power system more resilient and to prepare the way for higher levels of variable renewable energy penetration. Countries and localities around the world are currently learning how best to incorporate increasing numbers of EVs into the integrated energy system. A fine balance must be achieved between providing policy certainty for consumers at all scales of size and maintaining sufficient flexibility to “learn by doing.” In the early stages of EV integration into the grid the purpose is to set the stage for larger-scale storage, control and stability needs as variable renewables such as wind and solar power increase in scope, at the same time EV penetration of the vehicle market is increasing.
5.2.2. Stage Two: Transportation sector transformation and coupling to power sector
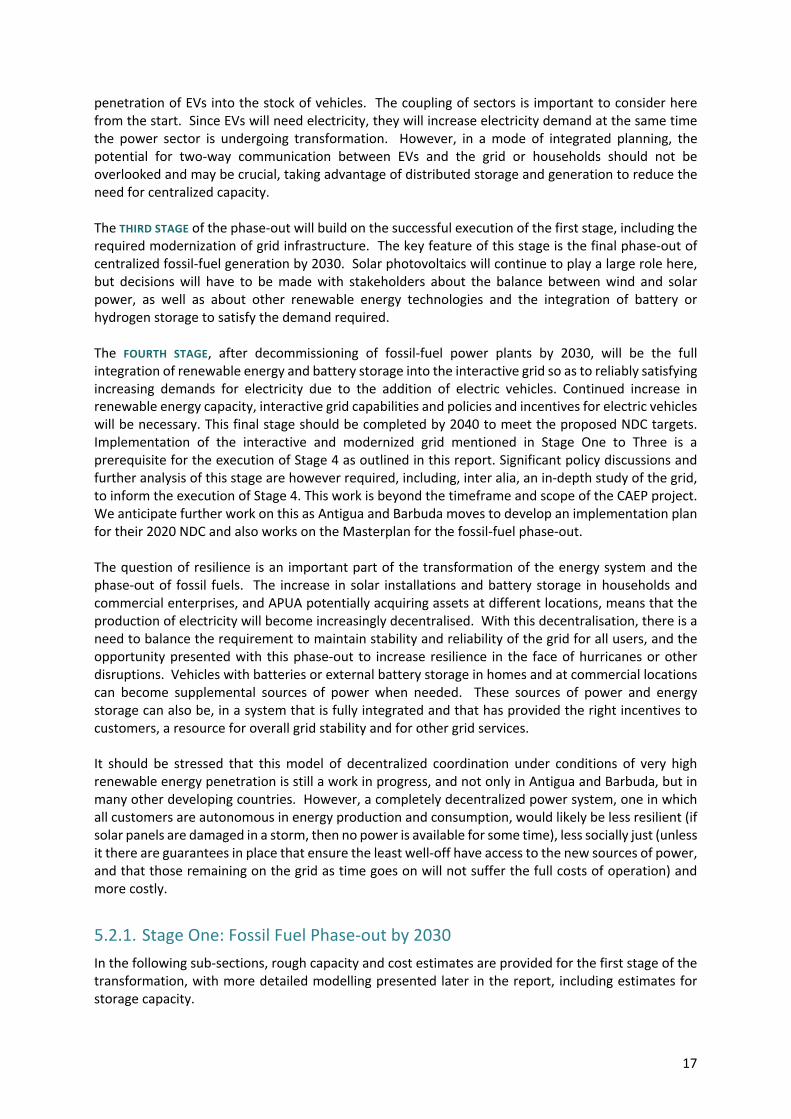
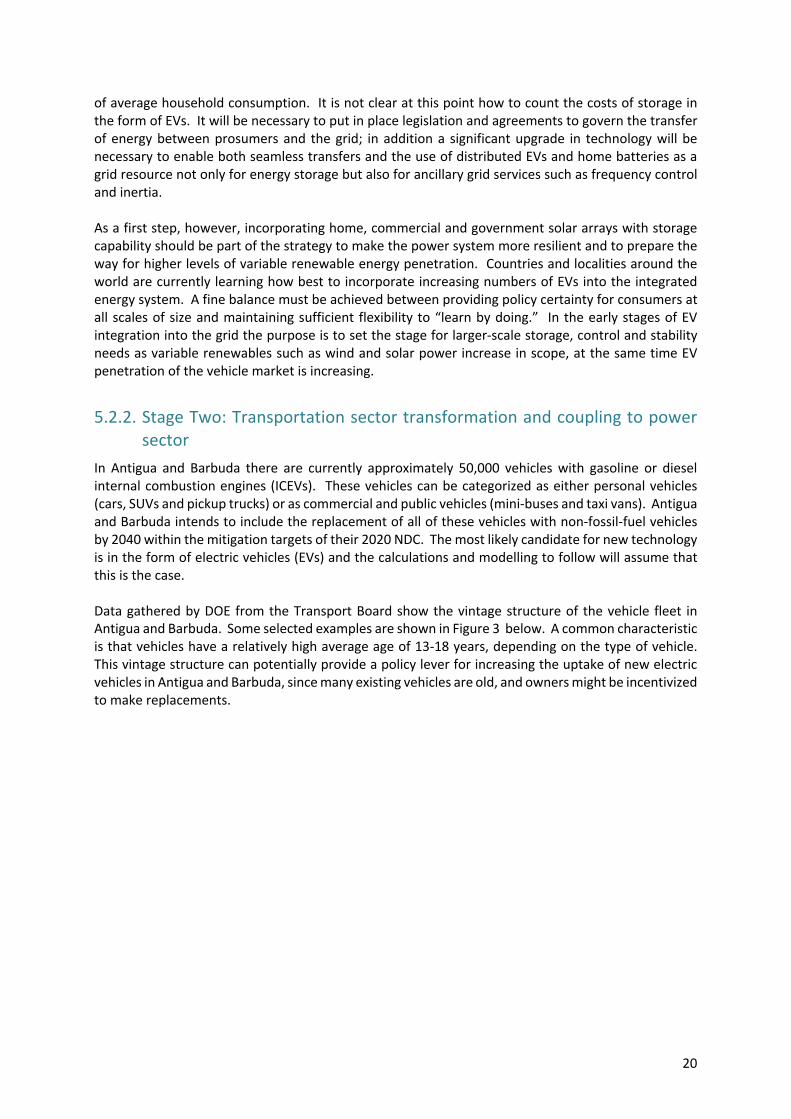
In Antigua and Barbuda there are currently approximately 50,000 vehicles with gasoline or diesel internal combustion engines (ICEVs). These vehicles can be categorized as either personal vehicles (cars, SUVs and pickup trucks) or as commercial and public vehicles (mini-buses and taxi vans). Antigua and Barbuda intends to include the replacement of all of these vehicles with non-fossil-fuel vehicles by 2040 within the mitigation targets of their 2020 NDC. The most likely candidate for new technology is in the form of electric vehicles (EVs) and the calculations and modelling to follow will assume that this is the case. Data gathered by DOE from the Transport Board show the vintage structure of the vehicle fleet in Antigua and Barbuda. Some selected examples are shown in Figure 3 below. A common characteristic is that vehicles have a relatively high average age of 13-18 years, depending on the type of vehicle. This vintage structure can potentially provide a policy lever for increasing the uptake of new electric vehicles in Antigua and Barbuda, since many existing vehicles are old, and owners might be incentivized to make replacements.

21
Figure 3: Distribution of vintages for different types of vehicles
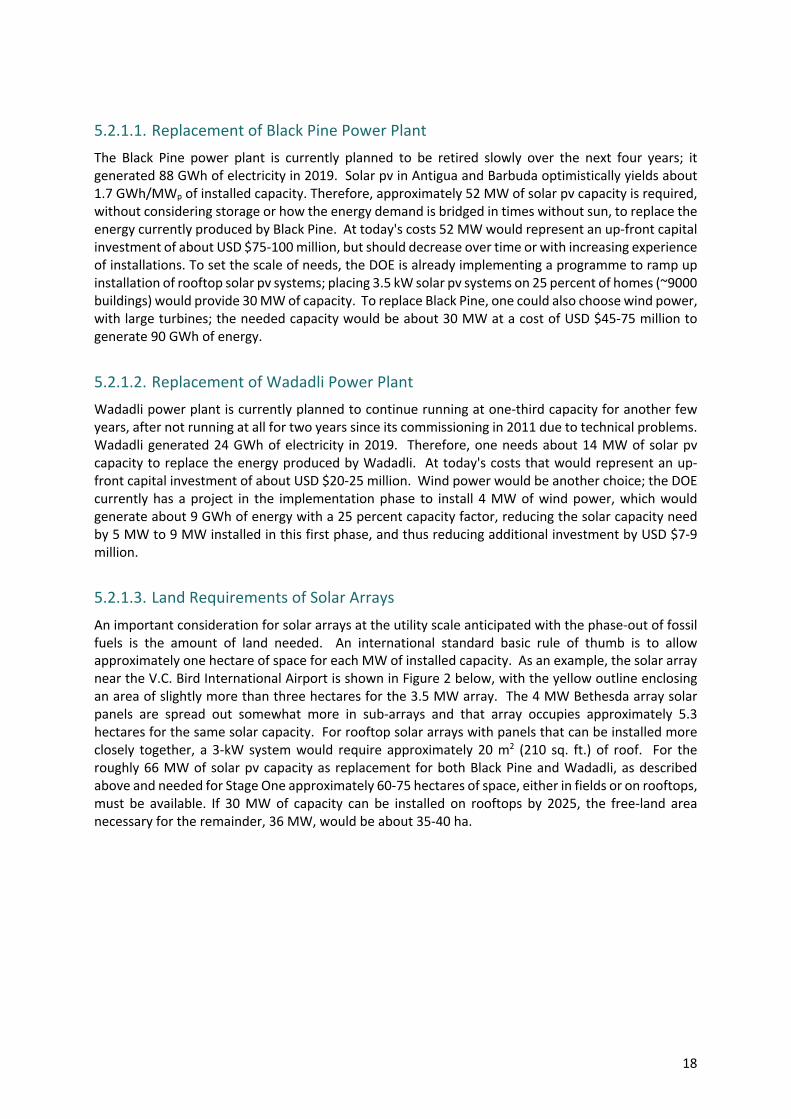
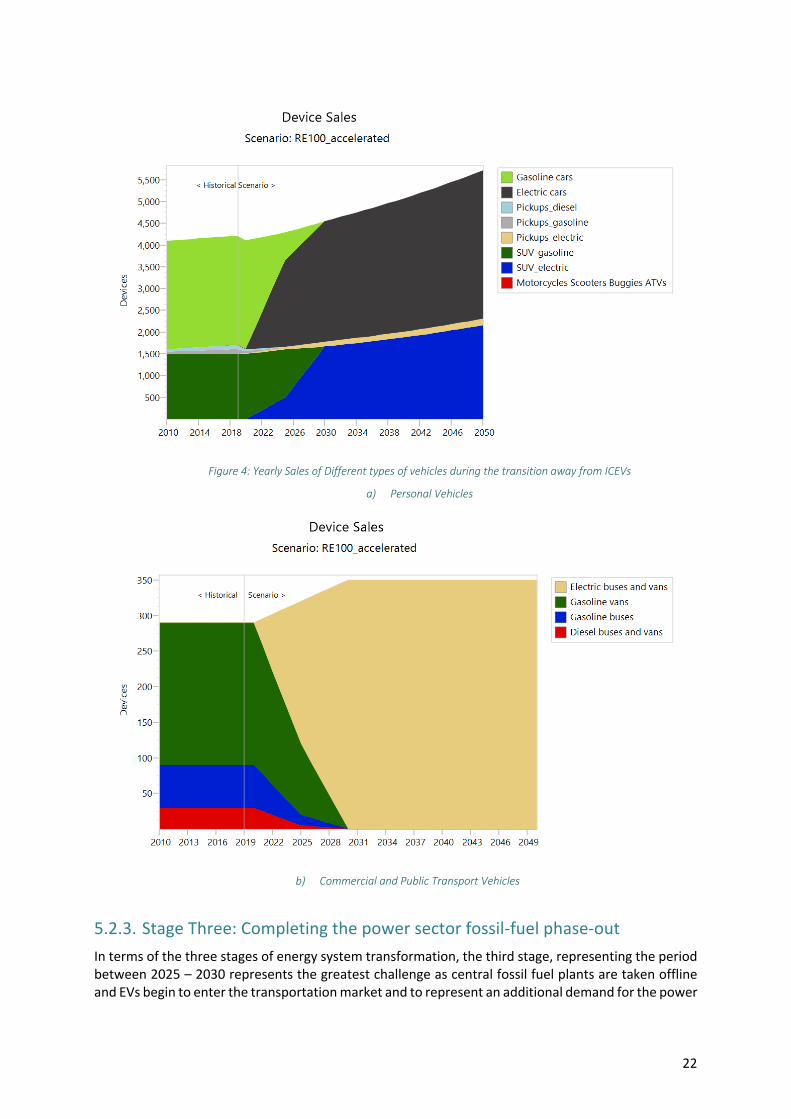
To achieve the target of phasing out ICEVs by 2040 a concerted effort will be necessary to increase the sales of EVs and to limit sales of ICEVs by 2030 at the latest. Results from modelling of the sales of vehicles to achieve the NDC target is shown in Figure 4 and the overall stock turnover will be discussed in more detail in Sec. 5.2.4.2. In each case the total number of vehicles is expected to increase, following historical trends, although at a slower rate of increase. To reach the required levels of electric vehicle stocks, the sales of EVs must increase rapidly in the near future. In 2025, sales of EVs would need to increase to approximately 2000-3000 per year, equalling sales of ICEVs. The new sales of ICEVs would need to decrease to zero by 2030. The crossover for commercial vans and taxi buses will also be around 2025. These trends are shown in Figure 4a and Figure 4b. As electrification of transport proceeds, there will also be an additional demand on the grid. Estimates of this amount of additional generation will be shown below in Section 5.2.4. A first estimate can be given that a fleet of roughly 50 percent EVs will require an additional 70 GWh of electricity production per year. To arrive at this estimate assumptions were made (described below) on the number of vehicles, efficiency of each, and number of km driven per year – all fairly uncertain, but consistent with a calibration based on current number of vehicles and fuel consumption.
22
Figure 4: Yearly Sales of Different types of vehicles during the transition away from ICEVs
a) Personal Vehicles
b) Commercial and Public Transport Vehicles
5.2.3. Stage Three: Completing the power sector fossil-fuel phase-out In terms of the three stages of energy system transformation, the third stage, representing the period between 2025 – 2030 represents the greatest challenge as central fossil fuel plants are taken offline and EVs begin to enter the transportation market and to represent an additional demand for the power

23
sector. A rough estimate of requirements is given in this section; to analyse this dynamic situation the LEAP energy model is used, with more detail outlined in Section 5.2.4.
5.2.3.1. Replacement of APUA Power Plant Before presenting detailed modelling results of the energy system transformation, an outline of power needs is presented as represented by Stage Three. After Stage One results in the retirement of the Black Pine and Wadadli power plants, the key remaining requirement is to replace the largest power plant, the APUA/APC plant, which generated 263 GWh of energy in 2019. All else being equal, replacing this third power plant requires the same amount of energy generation from additional renewable sources. From the solar conversion factor of 1.7 GWh/MW of capacity, and if solar pv were to be the only resource used, this would require 150 MW of additional solar capacity, without considering variability of solar, storage needs and efficiencies. In the scenario modelling, it is assumed that a further 12 MW of wind capacity can be built by 2030, in addition to the 4 MW being installed currently by DOE, thus reducing the amount of solar pv necessary. It is also assumed that another 30 MW of the solar capacity could be provided by installing 3.5 kW pv systems on an additional 25 percent of homes by 2030, continuing the implementation from Stage One. The details of how these systems are integrated will be presented in the modelling results for Stage Four below. More generally, it is during this stage that grid integration of prosumers, battery or other storage, and electric vehicle charging demand as well as use of distributed EV storage as a grid stabilization resource will become increasingly important. By 2030 when all fossil-fuel power plants are phased out, with the possible exception of some small number of distributed commercial diesel generators, the transition of the power sector and its modernization to interactivity must be completed. The numbers cited for generation and capacity requirements for Stages 1 – 3 can be given a more concrete basis through the use of energy system modelling as presented in the following section.
5.2.4. Stage Four: Technical and Economic Analysis using the LEAP Energy Model This section of the report analyses the pathways to achieving Antigua and Barbuda’s ambitious target of a fossil-fuel phase-out in the power and transport sectors by 2030 and 2040 respectively by using the Low Emissions Analysis Platform (LEAP)model. This methodology was outlined in Antigua and Barbuda’s request to the NDC Partnership’s CAEP Initiative. The LEAP model was used for Antigua and Barbuda’s 2015 NDC and has been used to analyse future energy demand and emissions in a number of countries. In a parallel effort, IRENA, who prepared an earlier report on renewable energy readiness for the country, will be undertaking a detailed study of pathways toward deep CO2 reductions in the energy sector and the combination of these efforts will result in Antigua and Barbuda’s Energy Roadmap. A number of the key assumptions used for the LEAP model in developing the NDC scenario for 2020 are shown in Box 1 below.
Box 1: LEAP Energy Modelling
LEAP Energy Modelling
Population: 90,000 GDP: USD $1.31 Billion, GDP per capita: USD $14,485 GDP Growth Rate: 2.6%
Assumptions
1. Status of existing power plants
24
• Wadadli: Close down in 2026
• Black Pine: Gradual decommissioning by 2024
2. APC: Gradual decommissioning by 2030
3. Household cooking efficiency improves by 1% annually
4. Commercial and industrial sector’s electricity consumption grows at 1.1% and 0.1% annually, respectively
5. Power consumption by government and statutory agencies decreases by 1% annually
6. 100% RE in electricity sector by 2030
7. 100% non-fossil-fuel transportation by 2040, declining sales of ICEVs to zero by 2030 8. A dispatchable renewable energy source is available as of 2030; the exact technology is not
specified
9. LEAP has enabled storage capacity in a beta version which is used for part of the analysis. A separate simplified model looking at hourly demand and supply (solar, wind and dispatchable) was also used to account for storage, dispatchable resource and variable renewable energy trade-off effects
With solar photovoltaics and wind expected to fulfil the largest part of energy needs, the issue of unserved demand and renewable system variability and potential curtailment will become important, and there will be an increasing need for battery storage and perhaps dispatchable units starting in the 2025-2030 time period. The focus of the modelling of Stage Four of the transition outline is on the coupling of the power and transport sectors, as well as on the need for storage. It is expected that EVs will become price-competitive at purchase with internal combustion engine vehicles (ICEVs) by the middle of this decade, with the growth in the EV stock also providing an opportunity to actively link the storage capacity offered by vehicles to an interactive power grid model. In the next three sections four different variants of pathways to reach the fossil-fuel phase-out targets will be presented. In each, the goal of replacing the fuel-oil generating capacity by 2030 is met, as is a (near) total phase-out of ICEVs by 2040. First the assumptions are given that led to the pathways. The outputs of the scenario are described in more detail, starting with the technology mix in the power sector, then presenting the mix between EVs and ICEVs, and finally showing the anticipated CO2 emissions reductions from these efforts. It should be cautioned that such scenarios and their outputs are intended for guidance in broad strokes and the outputs depend very strongly on the assumption made for inputs. Some further trade-offs and implied policy levers will be discussed at the end of this report. It is important to note some technicalities of the use of LEAP. The procedure used to arrive at the pathways takes advantage of different modes of usage of LEAP. The first mode has higher temporal resolution and the possibility of including a significant amount of technical detail, including the coupling of the transport and power sectors, but without the ability to incorporate storage technologies. The second mode of using LEAP does enable storage technologies and optimizes the balance of other sources of energy based on costs over the total time period of interest. The downside to this approach is that computation requirements are much more demanding, so lower time resolution (monthly, either day and night for one representative day, or 24 hours in one representative day each month). In any of the calculations by LEAP, the level of detail is not high enough to look at the more extreme fluctuations in demand and supply on an hourly or sub-hourly basis, so detailed grid-level dispatch modelling would also be necessary in the future.
25
The approach utilised for the purpose of this report is to use the simulation mode with 730-time steps28 to examine the coupled power and transport sectors and to produce the outline of the scenario for phase-out of fossil-fuel power plants and the phase-in of electric vehicles. In particular, this allows the estimation of the increased demand for electricity that comes from the transport sector electrification. In addition, as EVs increasingly penetrate the vehicle stock, there will implicitly be larger amounts of energy storage available in the form of vehicle batteries. This storage option is utilised to complement the presence of grid-based storage that will be necessary over time. The electricity demand output from the simulation is then used, along with the battery capacity (the assumption is made that 50 per cent of the total EV battery capacity could, in principle, be used as a resource) as input to the optimization version of LEAP which then calculates the details of the energy system composition over time.
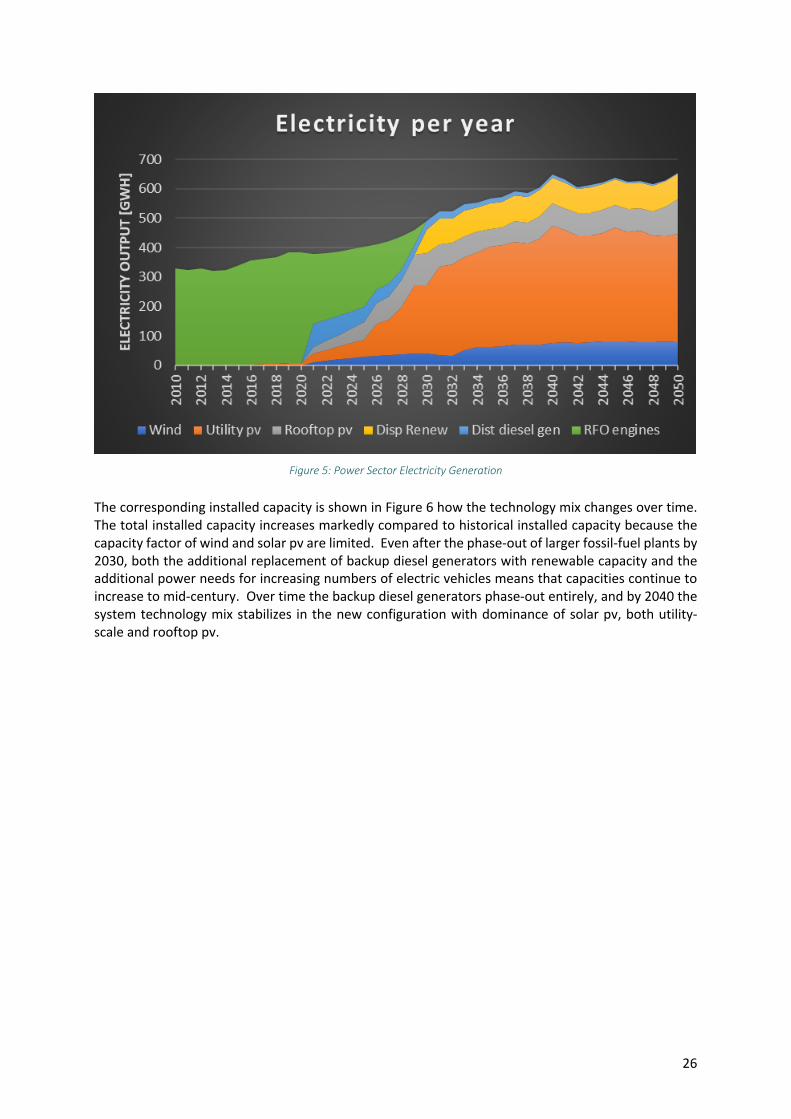
5.2.4.1. Power Sector Figure 5 shows the electricity demand and mix of technologies needed as the fossil-fuel power plants are phased out, the result of LEAP modeling. The exact mix of technologies is meant to be representative of options and will depend on decisions made during planning and implementation as to the balance between rooftop solar pv, utility-scale solar pv and wind power; four options will be presented in the following sections of the report. Two points are important to note. First, as the fossil fuel power plants are phased out, distributed diesel generators, already in existence, may still play a transitional role in provided power as needed to complement variable wind and solar energy production. Part of Stage One will be investments in the preparation of the power grid for more interactivity with a variety of distributed generators. The second point is that in some scenarios the modeling assumes a dispatchable (controllable) source of renewable energy generation that will be available by 2030. The availability of a dispatchable power source makes integration of high percentages of variable renewable energy less challenging; without this option enough battery (or other) storage must be available to bridge with high reliability the relative rare periods of low wind and solar energy. This could be waste-to-energy as proposed in the first NDC, or an ocean energy technology, or could include the production of hydrogen through electrolysis using excess renewable energy generation, with the hydrogen then being used to generate power with fuel cells.
28 The time slices represent daytime and night-time demand for each day of a representative year; LEAP aggregates the 8760
data points for wind and solar and for demand into the appropriate “bins” to arrive at 730 time slices. For more details please refer section
26
Figure 5: Power Sector Electricity Generation
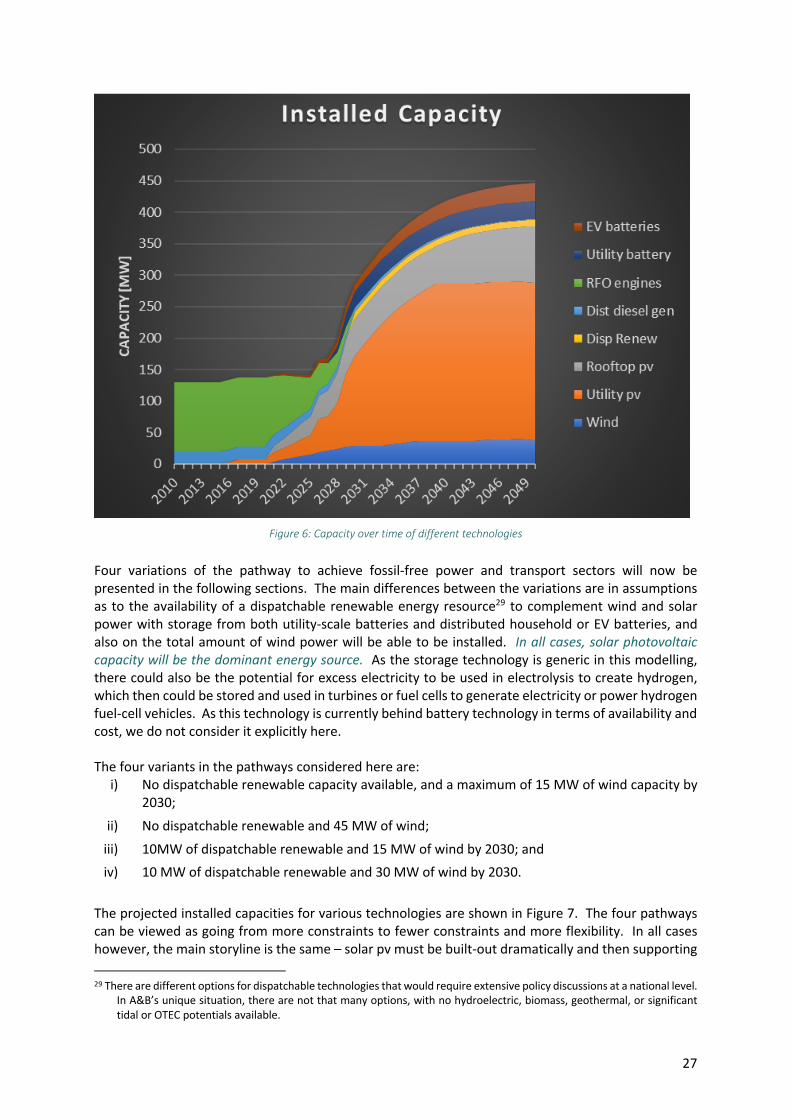
The corresponding installed capacity is shown in Figure 6 how the technology mix changes over time. The total installed capacity increases markedly compared to historical installed capacity because the capacity factor of wind and solar pv are limited. Even after the phase-out of larger fossil-fuel plants by 2030, both the additional replacement of backup diesel generators with renewable capacity and the additional power needs for increasing numbers of electric vehicles means that capacities continue to increase to mid-century. Over time the backup diesel generators phase-out entirely, and by 2040 the system technology mix stabilizes in the new configuration with dominance of solar pv, both utility-scale and rooftop pv.
27
Figure 6: Capacity over time of different technologies
Four variations of the pathway to achieve fossil-free power and transport sectors will now be presented in the following sections. The main differences between the variations are in assumptions as to the availability of a dispatchable renewable energy resource29 to complement wind and solar power with storage from both utility-scale batteries and distributed household or EV batteries, and also on the total amount of wind power will be able to be installed. In all cases, solar photovoltaic capacity will be the dominant energy source. As the storage technology is generic in this modelling, there could also be the potential for excess electricity to be used in electrolysis to create hydrogen, which then could be stored and used in turbines or fuel cells to generate electricity or power hydrogen fuel-cell vehicles. As this technology is currently behind battery technology in terms of availability and cost, we do not consider it explicitly here. The four variants in the pathways considered here are:
i) No dispatchable renewable capacity available, and a maximum of 15 MW of wind capacity by 2030;
ii) No dispatchable renewable and 45 MW of wind;
iii) 10MW of dispatchable renewable and 15 MW of wind by 2030; and iv) 10 MW of dispatchable renewable and 30 MW of wind by 2030.
The projected installed capacities for various technologies are shown in Figure 7. The four pathways can be viewed as going from more constraints to fewer constraints and more flexibility. In all cases however, the main storyline is the same – solar pv must be built-out dramatically and then supporting
29 There are different options for dispatchable technologies that would require extensive policy discussions at a national level.
In A&B’s unique situation, there are not that many options, with no hydroelectric, biomass, geothermal, or significant tidal or OTEC potentials available.

28
technologies (wind, dispatchable renewables, batteries and storage of different types) will be integrated in a complementary way. In all four variants, EV batteries contribute about 7 MW of capacity, utility batteries provide storage-based power of between 26-33 MW and rooftop pv a capacity of 60 MW. The third and fourth variants have dispatchable renewables with a capacity of 10 MW. As mentioned above, the wind capacity varies from 15 MW in first and third variant to 40 and 28 MW in second and fourth cases.
Figure 7: Snapshot of capacities for different technologies under different pathways to (nearly) all renewable power sector in
2030. i) No dispatchable renewable power, low wind availability; ii) No dispatchable renewable, high wind availability; iii) Some dispatchable renewable, low wind availability; iv) Some dispatchable renewable, medium wind
In Figure 8 the corresponding energy generation for each of the four cases is shown. Again, the main expectation is that solar pv generation will dominate. Battery storage is not shown here because there is a trade between charging and discharging of energy and the net over the course of any one year would be zero.

29
Figure 8: Snapshot of energy generation for different technologies under different pathways to (nearly) all renewable power
sector in 2030. i) No dispatchable renewable power, low wind availability; ii) No dispatchable renewable, high wind availability; iii) Some dispatchable renewable, low wind availability; iv) Some dispatchable renewable, medium wind.
One of the key parameters in evaluating the transition from fossil-fuel generation to renewable energy is the cost. In Table 5 indicative investment costs are shown for different time periods corresponding to the four phases of transformation as well as the time after full transition to renewables and EVs after 2040. There are four key points to note about these cost estimates. Overall, each of the investments represents a replacement of costs in energy generation that would otherwise be spent on a one-time basis for fuel oil, as opposed to the long-term twenty-year investment in generation capacity that then has very low operating costs after the up-front capital investment. As for the details of the investments in different time periods, those needed in the first immediate time period are relatively similar between pathways (and differences can partly be due to whether an investment is made in 2025 or 2026 and therefore fall into different blocks as shown in Table 5. Also, these model-generated costs are roughly the same as the estimates provided in the overview given in Sections 5.2.1.1 and 5.2.1.2. A third point is that the major investments will be in completing the transition in the second half of this decade, and here the differences become noticeable between pathways with or without the availability of a dispatchable renewable energy source. Finally, there is also a clear difference during the decade of the 2030s between these two different sets of pathways, with significantly higher investment costs necessary in Scenario (i) and (ii), where there is an absence of a dispatchable source of energy. Lifetime costs of solar pv, wind and battery storage are all declining rapidly. While the up-front investment costs described here are significant, it should be noted that typical “levelized cost of electricity,” that is, the lifetime cost, are around US$100/MWh (US$0.10/kWh) for pv and less than
30
this for larger wind turbines, both of which being much less than the cost of currently used generation technologies.30
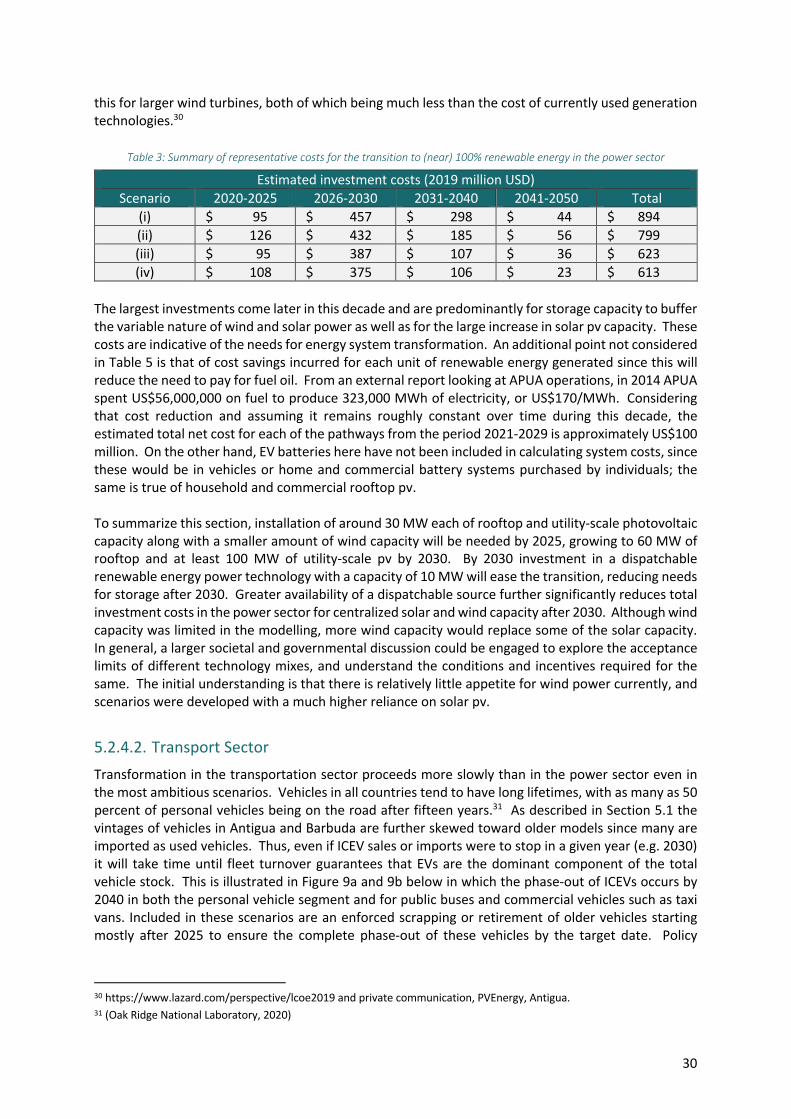
Table 3: Summary of representative costs for the transition to (near) 100% renewable energy in the power sector
Estimated investment costs (2019 million USD) Scenario 2020-2025 2026-2030 2031-2040 2041-2050 Total
(i) $ 95 $ 457 $ 298 $ 44 $ 894 (ii) $ 126 $ 432 $ 185 $ 56 $ 799 (iii) $ 95 $ 387 $ 107 $ 36 $ 623 (iv) $ 108 $ 375 $ 106 $ 23 $ 613
The largest investments come later in this decade and are predominantly for storage capacity to buffer the variable nature of wind and solar power as well as for the large increase in solar pv capacity. These costs are indicative of the needs for energy system transformation. An additional point not considered in Table 5 is that of cost savings incurred for each unit of renewable energy generated since this will reduce the need to pay for fuel oil. From an external report looking at APUA operations, in 2014 APUA spent US$56,000,000 on fuel to produce 323,000 MWh of electricity, or US$170/MWh. Considering that cost reduction and assuming it remains roughly constant over time during this decade, the estimated total net cost for each of the pathways from the period 2021-2029 is approximately US$100 million. On the other hand, EV batteries here have not been included in calculating system costs, since these would be in vehicles or home and commercial battery systems purchased by individuals; the same is true of household and commercial rooftop pv. To summarize this section, installation of around 30 MW each of rooftop and utility-scale photovoltaic capacity along with a smaller amount of wind capacity will be needed by 2025, growing to 60 MW of rooftop and at least 100 MW of utility-scale pv by 2030. By 2030 investment in a dispatchable renewable energy power technology with a capacity of 10 MW will ease the transition, reducing needs for storage after 2030. Greater availability of a dispatchable source further significantly reduces total investment costs in the power sector for centralized solar and wind capacity after 2030. Although wind capacity was limited in the modelling, more wind capacity would replace some of the solar capacity. In general, a larger societal and governmental discussion could be engaged to explore the acceptance limits of different technology mixes, and understand the conditions and incentives required for the same. The initial understanding is that there is relatively little appetite for wind power currently, and scenarios were developed with a much higher reliance on solar pv.
5.2.4.2. Transport Sector Transformation in the transportation sector proceeds more slowly than in the power sector even in the most ambitious scenarios. Vehicles in all countries tend to have long lifetimes, with as many as 50 percent of personal vehicles being on the road after fifteen years.31 As described in Section 5.1 the vintages of vehicles in Antigua and Barbuda are further skewed toward older models since many are imported as used vehicles. Thus, even if ICEV sales or imports were to stop in a given year (e.g. 2030) it will take time until fleet turnover guarantees that EVs are the dominant component of the total vehicle stock. This is illustrated in Figure 9a and 9b below in which the phase-out of ICEVs occurs by 2040 in both the personal vehicle segment and for public buses and commercial vehicles such as taxi vans. Included in these scenarios are an enforced scrapping or retirement of older vehicles starting mostly after 2025 to ensure the complete phase-out of these vehicles by the target date. Policy
30 https://www.lazard.com/perspective/lcoe2019 and private communication, PVEnergy, Antigua. 31 (Oak Ridge National Laboratory, 2020)
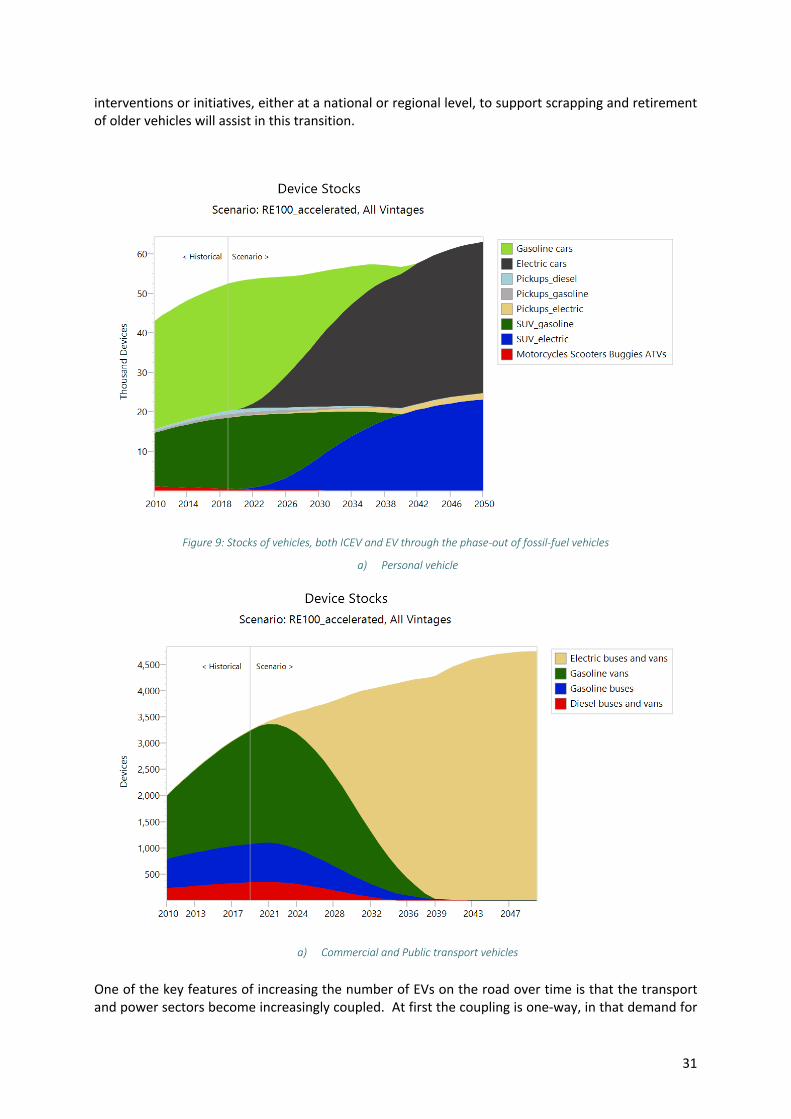
31
interventions or initiatives, either at a national or regional level, to support scrapping and retirement of older vehicles will assist in this transition.
Figure 9: Stocks of vehicles, both ICEV and EV through the phase-out of fossil-fuel vehicles
a) Personal vehicle
a) Commercial and Public transport vehicles
One of the key features of increasing the number of EVs on the road over time is that the transport and power sectors become increasingly coupled. At first the coupling is one-way, in that demand for
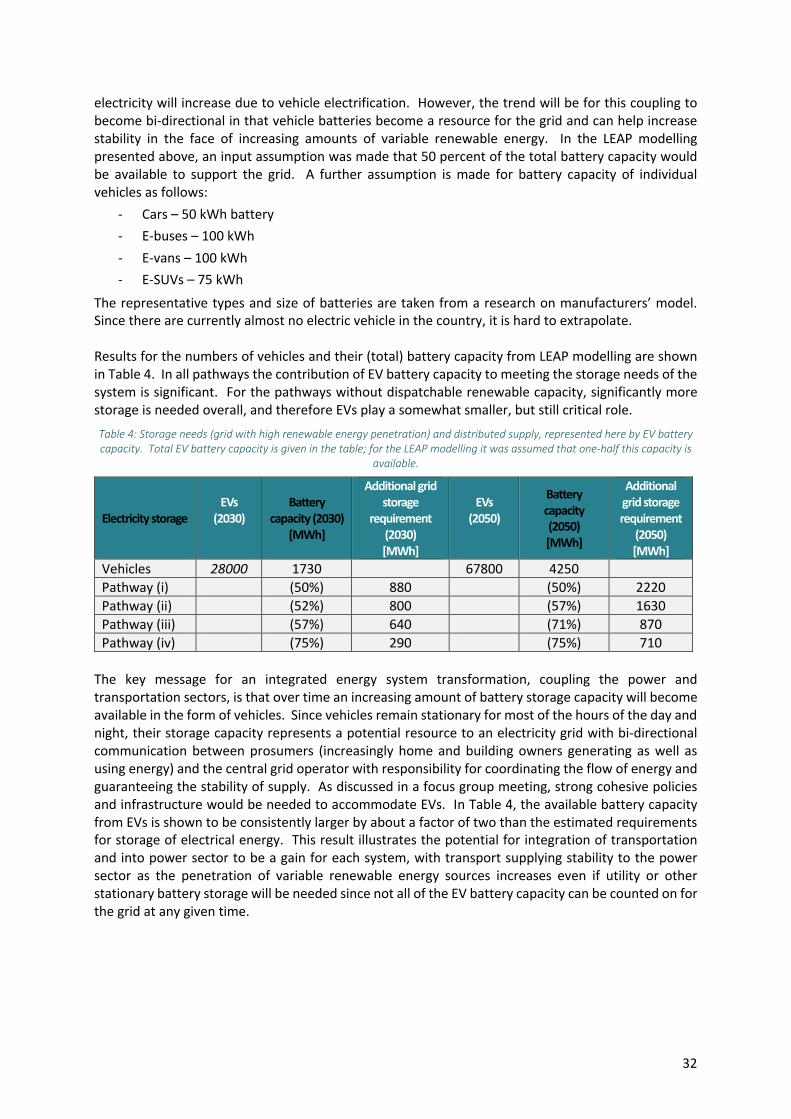
32
electricity will increase due to vehicle electrification. However, the trend will be for this coupling to become bi-directional in that vehicle batteries become a resource for the grid and can help increase stability in the face of increasing amounts of variable renewable energy. In the LEAP modelling presented above, an input assumption was made that 50 percent of the total battery capacity would be available to support the grid. A further assumption is made for battery capacity of individual vehicles as follows:
- Cars – 50 kWh battery - E-buses – 100 kWh - E-vans – 100 kWh - E-SUVs – 75 kWh
The representative types and size of batteries are taken from a research on manufacturers’ model. Since there are currently almost no electric vehicle in the country, it is hard to extrapolate. Results for the numbers of vehicles and their (total) battery capacity from LEAP modelling are shown in Table 4. In all pathways the contribution of EV battery capacity to meeting the storage needs of the system is significant. For the pathways without dispatchable renewable capacity, significantly more storage is needed overall, and therefore EVs play a somewhat smaller, but still critical role.
Table 4: Storage needs (grid with high renewable energy penetration) and distributed supply, represented here by EV battery capacity. Total EV battery capacity is given in the table; for the LEAP modelling it was assumed that one-half this capacity is
available.
The key message for an integrated energy system transformation, coupling the power and transportation sectors, is that over time an increasing amount of battery storage capacity will become available in the form of vehicles. Since vehicles remain stationary for most of the hours of the day and night, their storage capacity represents a potential resource to an electricity grid with bi-directional communication between prosumers (increasingly home and building owners generating as well as using energy) and the central grid operator with responsibility for coordinating the flow of energy and guaranteeing the stability of supply. As discussed in a focus group meeting, strong cohesive policies and infrastructure would be needed to accommodate EVs. In Table 4, the available battery capacity from EVs is shown to be consistently larger by about a factor of two than the estimated requirements for storage of electrical energy. This result illustrates the potential for integration of transportation and into power sector to be a gain for each system, with transport supplying stability to the power sector as the penetration of variable renewable energy sources increases even if utility or other stationary battery storage will be needed since not all of the EV battery capacity can be counted on for the grid at any given time.
Electricity storage EVs
(2030)
Battery capacity (2030)
[MWh]
Additional grid storage
requirement (2030) [MWh]
EVs (2050)
Battery capacity (2050) [MWh]
Additional grid storage requirement
(2050) [MWh]
Vehicles 28000 1730 67800 4250 Pathway (i) (50%) 880 (50%) 2220 Pathway (ii) (52%) 800 (57%) 1630 Pathway (iii) (57%) 640 (71%) 870 Pathway (iv) (75%) 290 (75%) 710
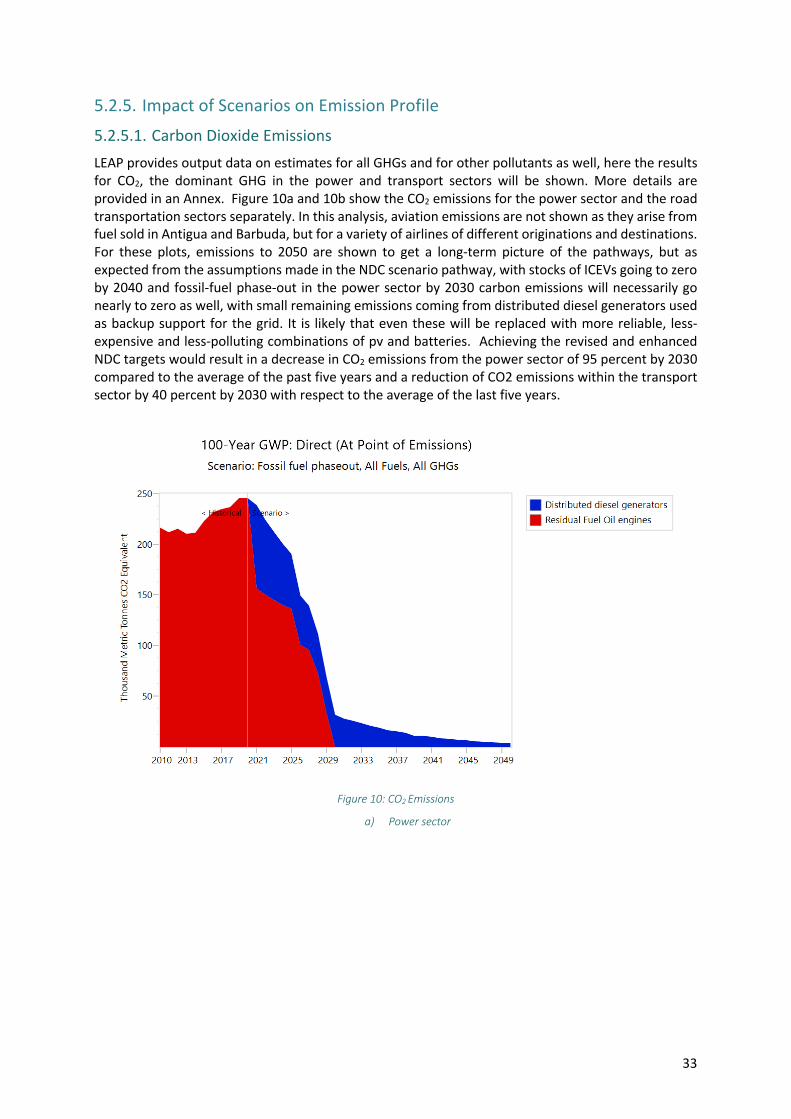
33
5.2.5. Impact of Scenarios on Emission Profile
5.2.5.1. Carbon Dioxide Emissions LEAP provides output data on estimates for all GHGs and for other pollutants as well, here the results for CO2, the dominant GHG in the power and transport sectors will be shown. More details are provided in an Annex. Figure 10a and 10b show the CO2 emissions for the power sector and the road transportation sectors separately. In this analysis, aviation emissions are not shown as they arise from fuel sold in Antigua and Barbuda, but for a variety of airlines of different originations and destinations. For these plots, emissions to 2050 are shown to get a long-term picture of the pathways, but as expected from the assumptions made in the NDC scenario pathway, with stocks of ICEVs going to zero by 2040 and fossil-fuel phase-out in the power sector by 2030 carbon emissions will necessarily go nearly to zero as well, with small remaining emissions coming from distributed diesel generators used as backup support for the grid. It is likely that even these will be replaced with more reliable, less-expensive and less-polluting combinations of pv and batteries. Achieving the revised and enhanced NDC targets would result in a decrease in CO2 emissions from the power sector of 95 percent by 2030 compared to the average of the past five years and a reduction of CO2 emissions within the transport sector by 40 percent by 2030 with respect to the average of the last five years.
Figure 10: CO2 Emissions
a) Power sector
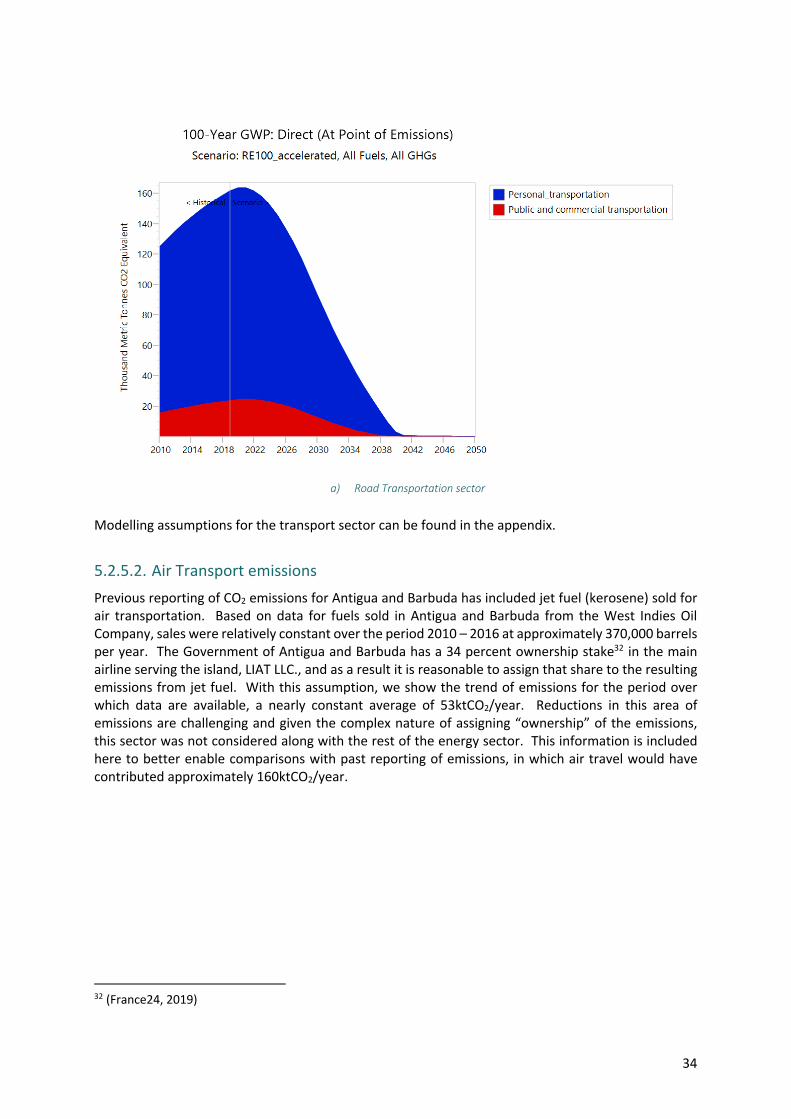
34
a) Road Transportation sector
Modelling assumptions for the transport sector can be found in the appendix.
5.2.5.2. Air Transport emissions Previous reporting of CO2 emissions for Antigua and Barbuda has included jet fuel (kerosene) sold for air transportation. Based on data for fuels sold in Antigua and Barbuda from the West Indies Oil Company, sales were relatively constant over the period 2010 – 2016 at approximately 370,000 barrels per year. The Government of Antigua and Barbuda has a 34 percent ownership stake32 in the main airline serving the island, LIAT LLC., and as a result it is reasonable to assign that share to the resulting emissions from jet fuel. With this assumption, we show the trend of emissions for the period over which data are available, a nearly constant average of 53ktCO2/year. Reductions in this area of emissions are challenging and given the complex nature of assigning “ownership” of the emissions, this sector was not considered along with the rest of the energy sector. This information is included here to better enable comparisons with past reporting of emissions, in which air travel would have contributed approximately 160ktCO2/year.
32 (France24, 2019)
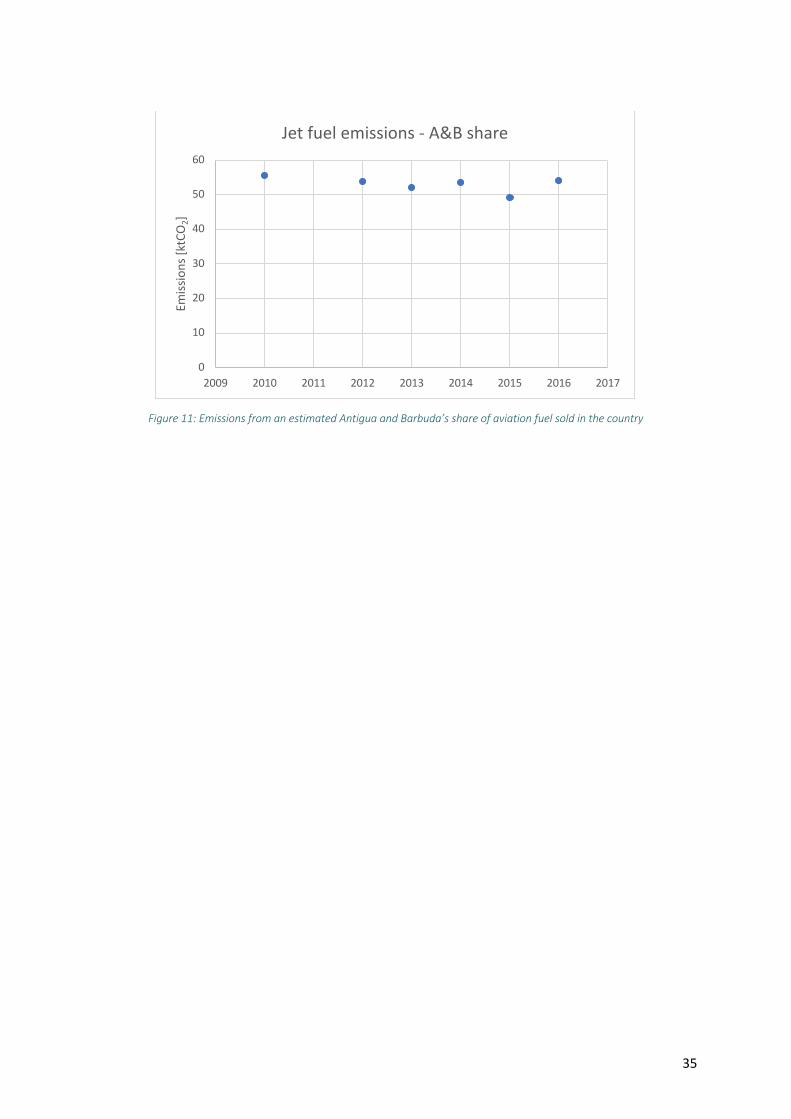
35
Figure 11: Emissions from an estimated Antigua and Barbuda’s share of aviation fuel sold in the country
0
10
20
30
40
50
60
2009 2010 2011 2012 2013 2014 2015 2016 2017
Emiss
ions
[ktC
O2]
Jet fuel emissions - A&B share
36
6. Summary
Given the government’s policy to transition from fossil fuel energy to renewable energy, the Department of Environment requested technical assistance through the CAEP, to inform their deliberations on how to include and achieve a phase out of fossil fuel use in the electricity sector by 2030 and in the transport sector by 2040 in Antigua and Barbuda’s revised NDC for 2020. In this report both historical trends in GHG emissions and previous progress toward reducing those emissions have been summarized. The report then presents the energy modelling undertaken to lay out possible pathways for a future based on this phase out. One of the features of the scenario presented in this report is that the transport and electricity sectors are explicitly coupled and modelled together using the Low Emissions Analysis Platform (LEAP). As discussed in the body of the report, coupling of the power and transport sectors is an issue with which countries around the world are engaging, and not only island states. While the addition of electric vehicles could initially be seen as simply an extra demand for electricity, there is a strong argument, especially in the context of long-term energy planning, in examining the coupled system for potential synergies. One example is the two-way delivery of electricity to and from the grid and households, vehicles and commercial enterprises. These developments will require foresight and careful crafting of policies to implement over time while avoiding dead-ends and false starts. In general terms, modelling results show that it is possible to cover all of the projected load for Antigua and Barbuda at all hours even with increasing amounts of variable renewable energy penetration. However, one of the challenges in the case of Antigua is that there is no option for hydropower or biomass for power generation, however having a source of dispatchable renewable energy would greatly simplify the transition as well as decreasing costs. Potential sources of dispatchable renewable power beyond those just mentioned include wave or tidal energy and Ocean Thermal Energy Conversion (OTEC). While technologies such as OTEC may have significant added co-benefits such as a freshwater resource and provide drought resilience, OTEC nor wave or tidal energy have significant potential for Antigua and Barbuda and have thus not been explicitly addressed in this report. Various stakeholders have identified the potential for waste-to-power generation as an option, and this could also be a dispatchable power source. There are two additional features that make this interesting, although reducing the production of waste should certainly be the first course of action. One, there is currently an issue with landfill space, so disposal is a problem in any case. Second, the landfill is in the southwest of the island, and adding a power generating capacity there would possibly help in stabilizing the grid, given all generation assets are currently at the extreme north-eastern part of the island. To make progress on this transformation, there are some key issues that will require further pre-feasibility and feasibility studies and detailed policy discussions to determine the exact pathway or scenario through which Antigua and Barbuda can achieve the phase out of fossil fuel use in the electricity sector by 2030 and in the transport sector by 2040. Some of the key issues for further policy discussions are:
- Conducting feasibility studies for potential of dispatchable renewable energy sources to support the phase-out;
- Initiate discussions at a national, sub-regional and regional level regarding the uptake of EVs and the issue faced of disposing of ICEVs to support scrapping and retirement of older vehicles will assist in this transition;
- Initiate discussions with Ministry of Finance, Ministry of Works, Transport Board and the Department for Economic Development to undertake macroeconomic analysis to inform fiscal
37
policies that would support the transformation of the transport sector and encourage the uptake of EVs. This may include: tax incentives or disincentives, tax reductions/VAT exemptions, import duty reduction or elimination, subsidies and other related policies, emission standards;
- Initiate discussions with the Utility on the grid requirements of the phase out of fossil fuel use in the electricity sector by 2030 and in the transport sector by 2040; and
- Create clear, but also flexible (i.e. periodically reviewed) policies for distributed integration of storage and power generation, including ancillary grid services.
There are many opportunities to be found within this target that go beyond looking at the emissions reductions in isolation. This transition will change Antigua and Barbuda from an energy-importing country to one reliant on domestic resources, and mainly on resources that do not have costs that fluctuate due to factors beyond the country’s control. All indications are that transformation to an energy system will reduce the costs of energy for consumers as well. This was shown previously in modelling results from the Energy Division33, in which the fossil-fuel-dominated scenario was the most expensive one for the country. That modelling, however, did not take into account that electric vehicles are expected to achieve cost-parity with internal combustion engine vehicles this decade and are already significantly cheaper to operate for consumers. Although there are challenges to be overcome in integrating abundant solar and wind energy resources into the current system, there are many opportunities for learning and leading as Antigua and Barbuda undergoes the same kind of transition as many other countries around the world will be making in the next few decades.
33 Please see AppendicesAppendix for the previous modelling result from the Energy Division.

38
7. Bibliography
Antigua and Barbuda Cabinet Secretariat. (2019, March 9). Cabinet Decision. Antigua and Barbuda Cabinet.
Antigua and Barbuda Government. (2015). Intended Nationally Determined Contribution . Antigua and Barbuda Government. (2015). Intended Nationally Determined Contributions . Antigua and Barbuda Government. (2019). Mitigation Actions Chapter (BUR). Antigua and Barbuda Government. (2019). National Inventory of Greenhouse Gases, Inventory year
2015. Business Insider. (2017, May 18). 10 home batteries that rival Tesla's Powerwall 2. Retrieved from
https://www.businessinsider.com/rechargeable-battery-options-compete-tesla-2017-5 Clean Energy Solutions Center. (2015). Antigua and Barbuda, Initial assumptions and BAU for INDC
Mitigation Target Analysis. Energy Division, Ministry of Public Utilities, Civil Aviation and Energy. (2019). Electricity Supply Analysis
[PowerPoint Slide]. Energy Division, Ministry of Public Utilities, Civil Aviation and Transportation. (2019). Long Term Energy
Demand Analysisntil 2050 [PowerPoint Slides]. France24. (2019, June 14). Antigua takes control of troubled Caribbean airline LIAT. Retrieved from
https://www.france24.com/en/20190614-antigua-takes-control-troubled-caribbean-airline-liat
Government of Antigua and Barbuda. (2015). Third National Communication on Climate Change. Government of Antigua and Barbuda. (2020). Antigua and Barbuda's First Biennial Update Report. IEA. (2019, December 18). Announced wind and solar PV average auction prices by commissioning date,
2012-2020. Retrieved from https://www.iea.org/data-and-statistics/charts/announced-wind-and-solar-pv-average-auction-prices-by-commissioning-date-2012-2020
Inter-American Development Bank. (2015). Challenges and Opportunities for the Energy Sector in the Eastern Caribbean: Antigua and Barbuda Energy Dossier.
International Atomic Energy Agency . (2006). Model for Analysis of Energy Demand (MAED-2). International Atomic Energy Agency . (2018). IAEA Methodologies and Models for Sustainable Energy
Planning. International Atomic Energy Agency. (2019, December). IAEA support for Capacity Building in Energy
Planning: Antigua & Barbuda national TC project [PowerPoint Slides]. International Renewable Energy Agency. (2016). Antigua and Barbuda: Renewable Readiness
Assessment. International Renewable Energy Agency. (2019). Future of Solar Photovoltaic. IPCC. (2018). Global warming of 1.5°C. Japan International Cooperation Agency. (2015). CARICOM CountriesRenewable Energy/Energy
Efficiency Data Collection Survey. LOGIOS. (2018). Electric Mobility Transition Assessment for Antigua and Barbuda. Ministry of Health, Wellness & The Environment. (2019, August). Ministry of Health, Wellness & The
Environment. Oak Ridge National Laboratory. (2020). Transportation Energy Data Book (Edition 38). Ramez Naam. (2020, May 14). Solar’s Future is Insanely Cheap (2020). Retrieved from
https://rameznaam.com/2020/05/14/solars-future-is-insanely-cheap-2020/ World Bank. (2020). Antigua and Barbuda Country Profile. Retrieved from
https://databank.worldbank.org/views/reports/reportwidget.aspx?Report_Name=CountryProfile&Id=b450fd57&tbar=y&dd=y&inf=n&zm=n&country=ATG
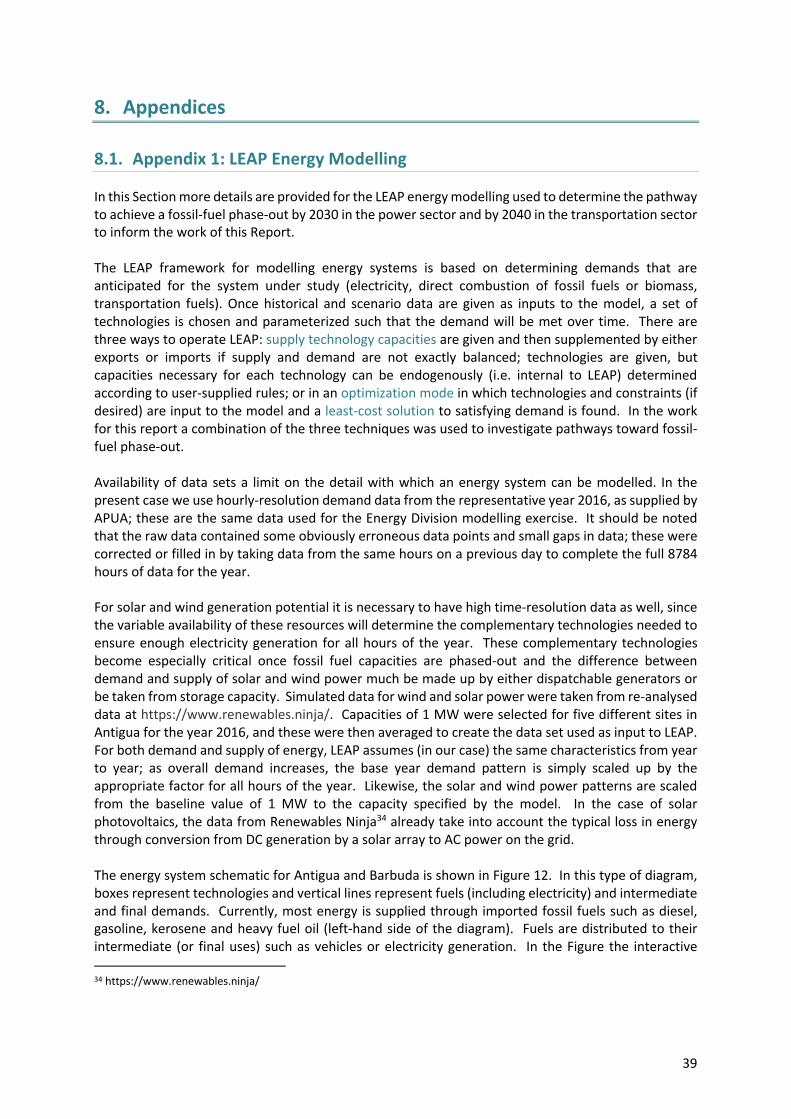
39
8. Appendices
8.1. Appendix 1: LEAP Energy Modelling
In this Section more details are provided for the LEAP energy modelling used to determine the pathway to achieve a fossil-fuel phase-out by 2030 in the power sector and by 2040 in the transportation sector to inform the work of this Report. The LEAP framework for modelling energy systems is based on determining demands that are anticipated for the system under study (electricity, direct combustion of fossil fuels or biomass, transportation fuels). Once historical and scenario data are given as inputs to the model, a set of technologies is chosen and parameterized such that the demand will be met over time. There are three ways to operate LEAP: supply technology capacities are given and then supplemented by either exports or imports if supply and demand are not exactly balanced; technologies are given, but capacities necessary for each technology can be endogenously (i.e. internal to LEAP) determined according to user-supplied rules; or in an optimization mode in which technologies and constraints (if desired) are input to the model and a least-cost solution to satisfying demand is found. In the work for this report a combination of the three techniques was used to investigate pathways toward fossil-fuel phase-out. Availability of data sets a limit on the detail with which an energy system can be modelled. In the present case we use hourly-resolution demand data from the representative year 2016, as supplied by APUA; these are the same data used for the Energy Division modelling exercise. It should be noted that the raw data contained some obviously erroneous data points and small gaps in data; these were corrected or filled in by taking data from the same hours on a previous day to complete the full 8784 hours of data for the year. For solar and wind generation potential it is necessary to have high time-resolution data as well, since the variable availability of these resources will determine the complementary technologies needed to ensure enough electricity generation for all hours of the year. These complementary technologies become especially critical once fossil fuel capacities are phased-out and the difference between demand and supply of solar and wind power much be made up by either dispatchable generators or be taken from storage capacity. Simulated data for wind and solar power were taken from re-analysed data at https://www.renewables.ninja/. Capacities of 1 MW were selected for five different sites in Antigua for the year 2016, and these were then averaged to create the data set used as input to LEAP. For both demand and supply of energy, LEAP assumes (in our case) the same characteristics from year to year; as overall demand increases, the base year demand pattern is simply scaled up by the appropriate factor for all hours of the year. Likewise, the solar and wind power patterns are scaled from the baseline value of 1 MW to the capacity specified by the model. In the case of solar photovoltaics, the data from Renewables Ninja34 already take into account the typical loss in energy through conversion from DC generation by a solar array to AC power on the grid. The energy system schematic for Antigua and Barbuda is shown in Figure 12. In this type of diagram, boxes represent technologies and vertical lines represent fuels (including electricity) and intermediate and final demands. Currently, most energy is supplied through imported fossil fuels such as diesel, gasoline, kerosene and heavy fuel oil (left-hand side of the diagram). Fuels are distributed to their intermediate (or final uses) such as vehicles or electricity generation. In the Figure the interactive
34 https://www.renewables.ninja/
40
nature of storage technologies is shown, both stationary and vehicle storage. The exact storage technology has not been specified, but will most likely be batteries, although hydrogen generated by electrolysis using excess renewable electricity generation during some hours of the year is another possible storage method. The hydrogen can then be used in fuel cells to generate electricity on demand, either for stationary applications or in vehicles.
Figure 12: Energy system schematic for Antigua and Barbuda
8.1.1. Modes of LEAP model and supplementary model use The general procedure used to generate the fossil-fuel phase-out scenario was to treat electricity demand from non-transportation sectors as a fixed given quantity (although changing through time as described in the Box). A version of the model with 730 time slices was used for the bulk of the work, and this model version was run in simulation mode, with allowance for the model to endogenously add wind and solar capacity to satisfy demand. The time slices represent daytime and night-time demand for each day of a representative year; LEAP aggregates the 8760 data points for wind and solar and for demand into the appropriate “bins” to arrive at 730 time slices. This mode of using LEAP has the drawback that no storage technologies are available in LEAP with simulation, and in LEAP2020 storage is only available in the optimization mode. The advantage of this mode of LEAP is that the model simulations are very fast, running in just a few seconds, as well as the ability to include many more technologies without compromising computation time. In addition, the simulation mode with 730 time slices was used to investigate the coupling of the power and transport sectors. As a general feature, the simulation mode finds the need for a significantly higher amount of capacity in wind and solar pv as well as a greater reliance on dispatchable sources than one might expect due to the need to satisfy demand at every hour without being able to store energy for later times. We show results from the simulation-mode models to gain insight into the phase-out of individual fossil-fuel technologies and the increase in EVs and renewable energy generation.
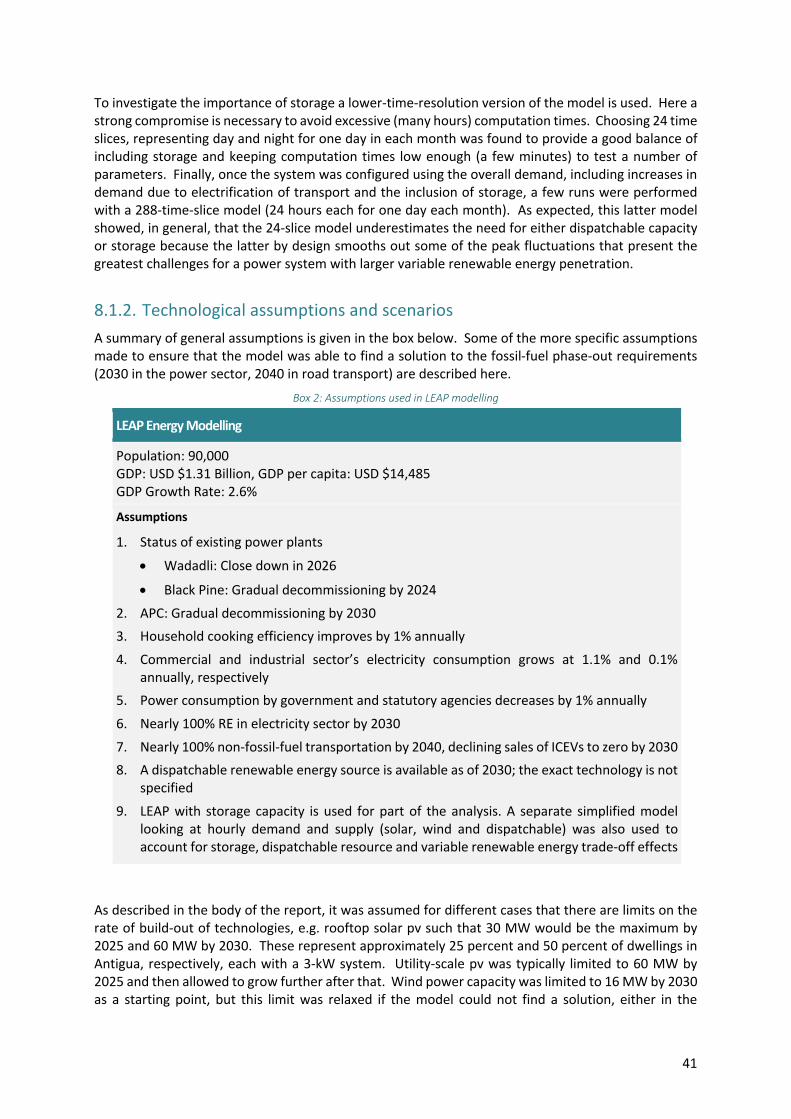
41
To investigate the importance of storage a lower-time-resolution version of the model is used. Here a strong compromise is necessary to avoid excessive (many hours) computation times. Choosing 24 time slices, representing day and night for one day in each month was found to provide a good balance of including storage and keeping computation times low enough (a few minutes) to test a number of parameters. Finally, once the system was configured using the overall demand, including increases in demand due to electrification of transport and the inclusion of storage, a few runs were performed with a 288-time-slice model (24 hours each for one day each month). As expected, this latter model showed, in general, that the 24-slice model underestimates the need for either dispatchable capacity or storage because the latter by design smooths out some of the peak fluctuations that present the greatest challenges for a power system with larger variable renewable energy penetration.
8.1.2. Technological assumptions and scenarios A summary of general assumptions is given in the box below. Some of the more specific assumptions made to ensure that the model was able to find a solution to the fossil-fuel phase-out requirements (2030 in the power sector, 2040 in road transport) are described here.
Box 2: Assumptions used in LEAP modelling
LEAP Energy Modelling
Population: 90,000 GDP: USD $1.31 Billion, GDP per capita: USD $14,485 GDP Growth Rate: 2.6%
Assumptions
1. Status of existing power plants
• Wadadli: Close down in 2026
• Black Pine: Gradual decommissioning by 2024
2. APC: Gradual decommissioning by 2030 3. Household cooking efficiency improves by 1% annually
4. Commercial and industrial sector’s electricity consumption grows at 1.1% and 0.1% annually, respectively
5. Power consumption by government and statutory agencies decreases by 1% annually
6. Nearly 100% RE in electricity sector by 2030
7. Nearly 100% non-fossil-fuel transportation by 2040, declining sales of ICEVs to zero by 2030 8. A dispatchable renewable energy source is available as of 2030; the exact technology is not
specified
9. LEAP with storage capacity is used for part of the analysis. A separate simplified model looking at hourly demand and supply (solar, wind and dispatchable) was also used to account for storage, dispatchable resource and variable renewable energy trade-off effects
As described in the body of the report, it was assumed for different cases that there are limits on the rate of build-out of technologies, e.g. rooftop solar pv such that 30 MW would be the maximum by 2025 and 60 MW by 2030. These represent approximately 25 percent and 50 percent of dwellings in Antigua, respectively, each with a 3-kW system. Utility-scale pv was typically limited to 60 MW by 2025 and then allowed to grow further after that. Wind power capacity was limited to 16 MW by 2030 as a starting point, but this limit was relaxed if the model could not find a solution, either in the

42
simulation mode to phase out fossil fuels or in the optimization mode to satisfy demand at peak times. Battery storage in the simulation mode (either 24 or 288-slice versions) has a chosen default of 24 hours; the capacity “chosen” by the model then determines the total storage capacity [MWh] = [MW capacity] x [24 hours]. Some sensitivity checks with 12 hours and 48 hours were run as well. In the transport sector a stock turnover model was used that started with a base-year stock of vehicles and then through an assumed lifetime profile for vehicles and yearly sales volumes, a running total of retired vehicles as well as current stocks is calculated. Since only some of these data are known very well, sales volumes were treated as scenario inputs over time such that the total volume of vehicles grows at a reasonable rate based on historical precedence and limited by anticipated population growth. Vehicles tend to have long lifetimes of at least 15-20 years; on the other hand, the vehicle fleet in Antigua and Barbuda is already relatively old. In spite of that, it was found necessary to include in the transportation modelling two additional features to force the transition away from internal combustion engine vehicles by 2040. First, sales of these vehicles were phased out by 2030, and even strongly reduced by 2025, being replaced by EVs of the same class of vehicle. Second, EV sales were increased even further and a forced retirement of ICEVs was imposed as well to ensure that the long tail of vehicle lifetimes did not result in remaining ICEVs after 2040. To illustrate qualitatively, even of ICEVs sold in the last year of 2029, if new, over half would normally be expected to remain on the road after 2040. Both of these last two points can be related to policies that will be needed to spur the transition away from ICEVs to EVs – limiting sales of ICEVs (or imports of used vehicles) by 2030 at the latest, and enforced retirement of vehicles (with incentives to switch to EVs) by 2040. Data from the Transportation Board were used as well as data from an EV Assessment report conducted in 2018. Vehicles were categorized, with total numbers scaled when necessary to agree between reported values. Estimates of vehicle efficiencies and numbers of miles driven were also made. The LOGIOS report35 did this as well, with some differences to the current results. Here, a calibration was used to the import of gasoline and diesel fuel based on WIOC data. A check of the assumptions on total kilometres driven and of gasoline consumption in the calibration year in the LOGIOS report results in an inconsistency in that far more gasoline would have been required to power the fleet in their model than was imported or sold in the country. The following data outlined in Table 8 are inferences using the data received for making assumptions for the transport split.
Table 5: Transportation data, Antigua and Barbuda
Type Number (2018) Km/year (miles/year) Litres/100km (mpg)
Car 32000 10000 (6200) 8 (23.5mpg) 16 kWh/100km
SUV 17000 10000 (6200) 15 (15.7mpg) 25 kWh/100km
Taxi vans 1400 25,000 (15,600) 15 (15.7 mpg) 40 kWh/100 km
Pickup 770 10000 15 (15.7 mpg) 25 kWh/100km
Bus 1100 25,000 (Diesel) 12 (20 mpg) (Gasoline) 13 (18 mpg) 75 kWh/100 km
Aviation Not included The check on this breakdown of vehicle usage is roughly based on the total imports of gasoline for one year, 2016. The same is true for diesel fuel, although that is more difficult due to multiple uses for the
35 (LOGIOS, 2018)
43
fuel, as a small amount was still for power generation, sold to individuals and commercial operations for diesel generators, and sold to marinas.
8.1.3. Economic assumptions Economic assumptions are most important for determining power sector costs in the transition. The assumptions made for wind, solar and battery storage are shown in Figure 13. These costs are somewhat higher than world average costs for wind and solar pv, but are an attempt to reflect honestly the costs seen in the recent past in the Caribbean and in Antigua and Barbuda (solar pv) and reflecting the relatively smaller size of projects compared to those in other parts of the world at present. These assumptions may lead to overestimates of the cost of transition.
Figure 13: Capital costs for technologies over time
8.1.4. Illustration of challenges The main results were shown in the body of this report and can be summarized as reflecting the input assumptions and the NDC target of fossil-fuel power phase-out by 2030 and phase-out of internal combustion engine vehicles by 2040. In addition, in Sec. 5.2.4 we summarized tests of sensitivity to various assumptions, including limits on wind capacity expansion, storage time of batteries and the amount of available dispatchable renewable energy. As the power sector develops further, a combination of variable renewables (likely the cheapest source of electricity generation), dispatchable power (renewable, if ambitious decarbonisation targets are to be realized), and battery storage will be needed. Below shows the interaction of supply, demand and storage for a typical week. In this particular week wind power is in relatively short supply (gray) and solar PV output is below normal a few days at the beginning of the week. As a result, the dispatchable source is consistently running at full output (yellow) yet needs to be supplemented by battery storage (the blue curve, decreasing over the period as the battery discharges). Of course, during other periods the battery can recharge, and at many times (and even during peak solar pv periods later in the illustrative week shown in Figure 14, the dispatchable source will not be called up as heavily. The key to a stable mix of sources is that the battery not be fully depleted at any point in time, meaning that the sum of energy available from variable renewables, dispatchable power and battery storage must always be greater than (or at a very minimum, equal to) demand.
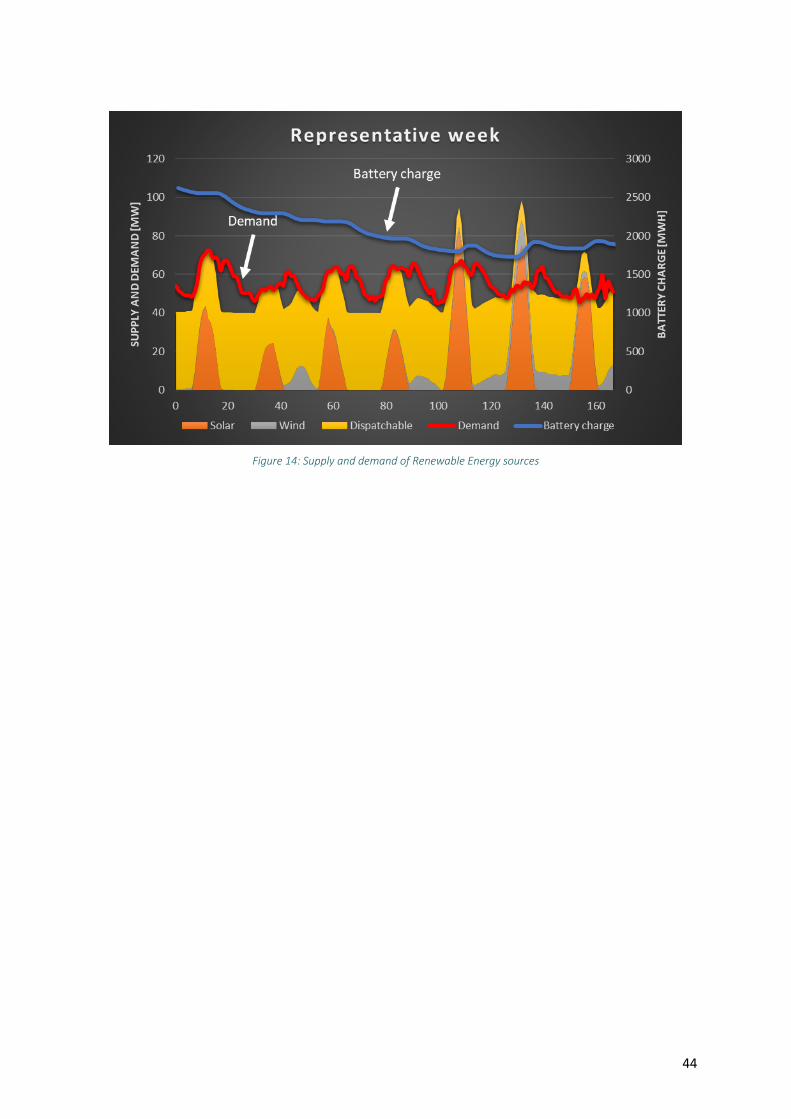
44
Figure 14: Supply and demand of Renewable Energy sources
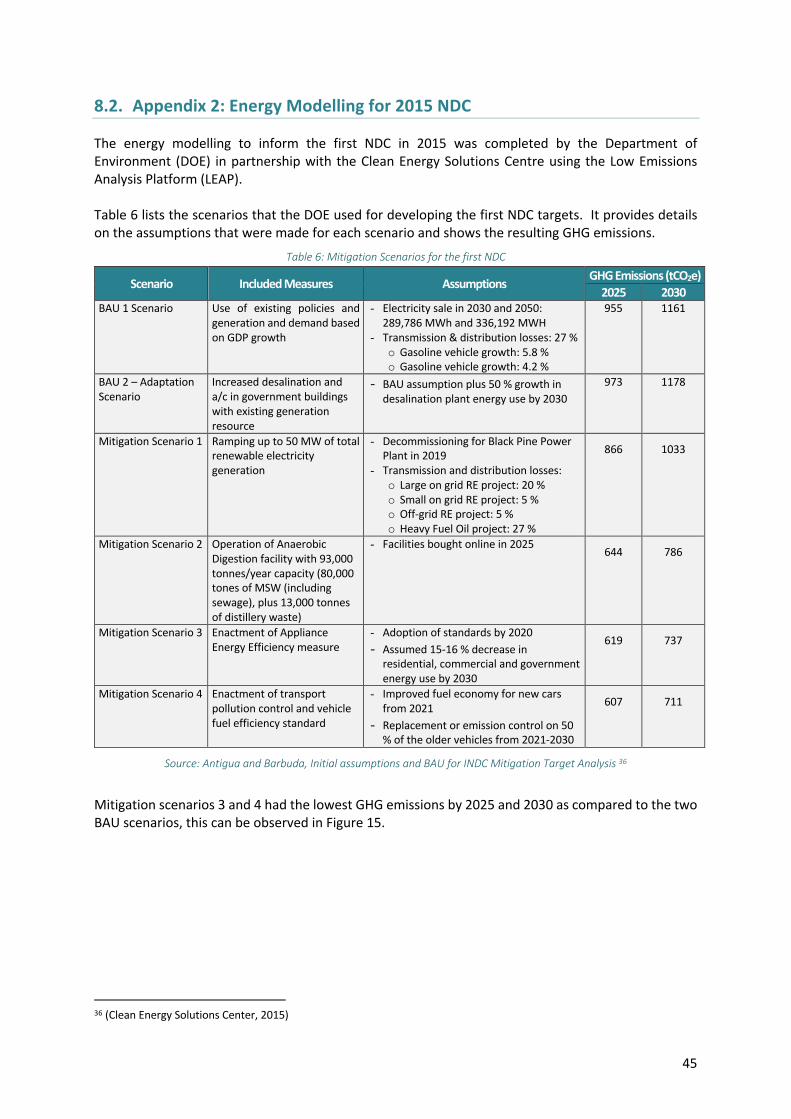
45
8.2. Appendix 2: Energy Modelling for 2015 NDC
The energy modelling to inform the first NDC in 2015 was completed by the Department of Environment (DOE) in partnership with the Clean Energy Solutions Centre using the Low Emissions Analysis Platform (LEAP). Table 6 lists the scenarios that the DOE used for developing the first NDC targets. It provides details on the assumptions that were made for each scenario and shows the resulting GHG emissions.
Table 6: Mitigation Scenarios for the first NDC
Scenario Included Measures Assumptions GHG Emissions (tCO2e) 2025 2030
BAU 1 Scenario Use of existing policies and generation and demand based on GDP growth
- Electricity sale in 2030 and 2050: 289,786 MWh and 336,192 MWH
- Transmission & distribution losses: 27 % o Gasoline vehicle growth: 5.8 % o Gasoline vehicle growth: 4.2 %
955 1161
BAU 2 – Adaptation Scenario
Increased desalination and a/c in government buildings with existing generation resource
- BAU assumption plus 50 % growth in desalination plant energy use by 2030
973 1178
Mitigation Scenario 1 Ramping up to 50 MW of total renewable electricity generation
- Decommissioning for Black Pine Power Plant in 2019
- Transmission and distribution losses: o Large on grid RE project: 20 % o Small on grid RE project: 5 % o Off-grid RE project: 5 % o Heavy Fuel Oil project: 27 %
866 1033
Mitigation Scenario 2 Operation of Anaerobic Digestion facility with 93,000 tonnes/year capacity (80,000 tones of MSW (including sewage), plus 13,000 tonnes of distillery waste)
- Facilities bought online in 2025 644 786
Mitigation Scenario 3 Enactment of Appliance Energy Efficiency measure
- Adoption of standards by 2020 - Assumed 15-16 % decrease in
residential, commercial and government energy use by 2030
619 737
Mitigation Scenario 4 Enactment of transport pollution control and vehicle fuel efficiency standard
- Improved fuel economy for new cars from 2021
- Replacement or emission control on 50 % of the older vehicles from 2021-2030
607 711
Source: Antigua and Barbuda, Initial assumptions and BAU for INDC Mitigation Target Analysis 36
Mitigation scenarios 3 and 4 had the lowest GHG emissions by 2025 and 2030 as compared to the two BAU scenarios, this can be observed in Figure 15.
36 (Clean Energy Solutions Center, 2015)
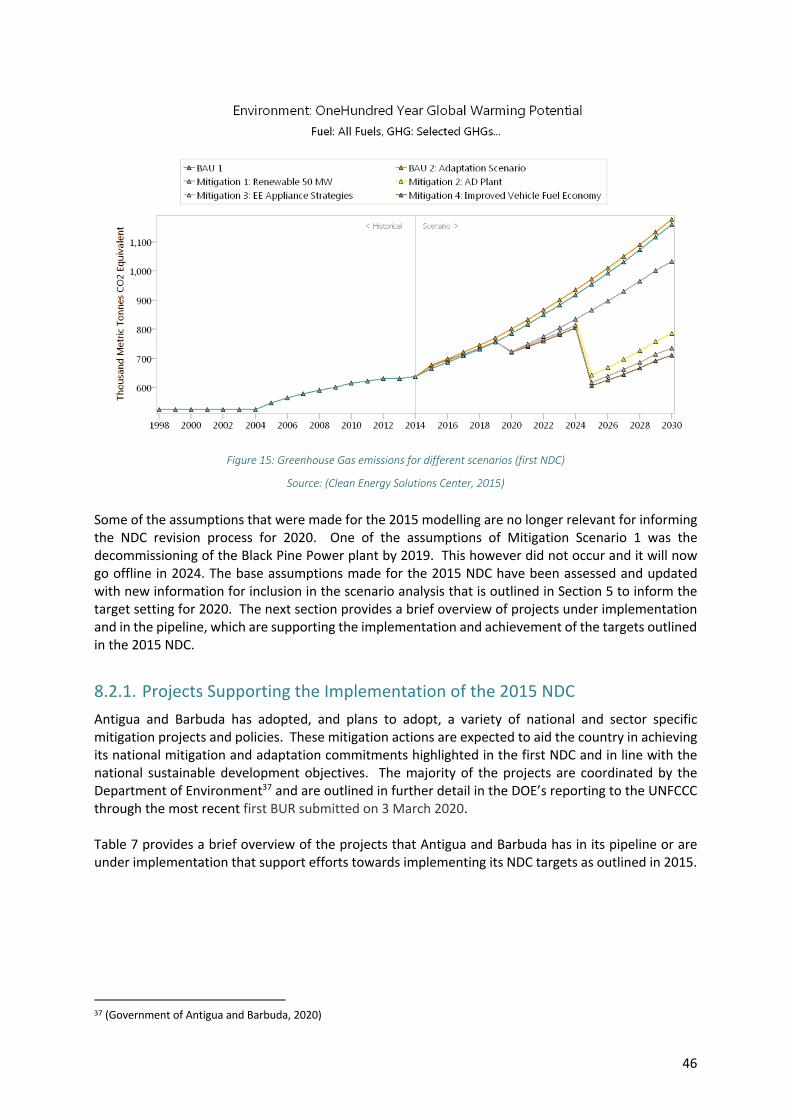
46
Figure 15: Greenhouse Gas emissions for different scenarios (first NDC)
Source: (Clean Energy Solutions Center, 2015)
Some of the assumptions that were made for the 2015 modelling are no longer relevant for informing the NDC revision process for 2020. One of the assumptions of Mitigation Scenario 1 was the decommissioning of the Black Pine Power plant by 2019. This however did not occur and it will now go offline in 2024. The base assumptions made for the 2015 NDC have been assessed and updated with new information for inclusion in the scenario analysis that is outlined in Section 5 to inform the target setting for 2020. The next section provides a brief overview of projects under implementation and in the pipeline, which are supporting the implementation and achievement of the targets outlined in the 2015 NDC.
8.2.1. Projects Supporting the Implementation of the 2015 NDC Antigua and Barbuda has adopted, and plans to adopt, a variety of national and sector specific mitigation projects and policies. These mitigation actions are expected to aid the country in achieving its national mitigation and adaptation commitments highlighted in the first NDC and in line with the national sustainable development objectives. The majority of the projects are coordinated by the Department of Environment37 and are outlined in further detail in the DOE’s reporting to the UNFCCC through the most recent first BUR submitted on 3 March 2020. Table 7 provides a brief overview of the projects that Antigua and Barbuda has in its pipeline or are under implementation that support efforts towards implementing its NDC targets as outlined in 2015.
37 (Government of Antigua and Barbuda, 2020)

47
Table 7: Climate projects for Antigua and Barbuda’s NDC targets
Targets Projects Status Timeline Department Partners
Unconditional Targets
Enhancing the enabling legal, policy, and institutional environment, for a low carbon emission development pathway to achieve poverty reduction and sustainable development
By 2020, updating the building code to meet projected impacts of climate change
1. Energy for Sustainable Development in the Caribbean
Under Implementation
02/2013-2017 Caribbean Community Climate Change
UNEP, GEF
2. Building climate resilience through innovative financing mechanisms for climate change adaptation (SCCF) Project
Under Implementation
03/11/2016- 2021
Dept. of Environment GEF, UNEP
3. Resilience to hurricanes in the building sector in Antigua and Barbuda (GCF Build) Project
Planning TBD Antigua and Barbuda’s Ministry of Finance
4. An integrated approach to physical adaptation and community resilience in Antigua and Barbuda’s northwest McKinnon’s watershed (AF Project)
Under Implementation
30/05/2017-2021
Dept. of Environment Adaptation Fund
Conditional Mitigation Targets
By 2020, establishing efficiency standards for the importation of all vehicles and appliances
1. Antigua and Barbuda Sustainable Low-emission Island Mobility (SLIM) Project
Planning TBD Dept. of Environment GEF, UNEP
By 2020, finalizing the technical studies with the intention to construct and operationalize a waste-to-energy (WTE) plant by 2025
1. Circular Economy approach to reducing emission in the waste sector
Planning TBD National Solid Waste Management Authority
Dept. of Environment
By 2030, achieving an energy matrix with 50 megawatts (MW) of electricity from renewable sources, both on and off grid and in the public and private sectors
1. GISS: Grid-Interactive Solar PV Systems for Schools and Clinics
Under Implementation
09/2017-2020 Dept. of Environment Italian Government & DOE’s Sustainable Island Resource Framework Fund
2. Energy for Sustainable Development in the Caribbean
Under Implementation
02/2013-2017 Caribbean Community Climate Change
UNEP, GEF
3. Sustainable Energy Facility/ Caribbean Development Bank
Under Implementation
2017-TBD Dept. of Environment Caribbean Development Bank
4. SPPARE Component 3: Renewable Energy in Support of Protected Areas system
Under Implementation
2015-2020 Dept. of Environment Abu Dhabi Fund for Development
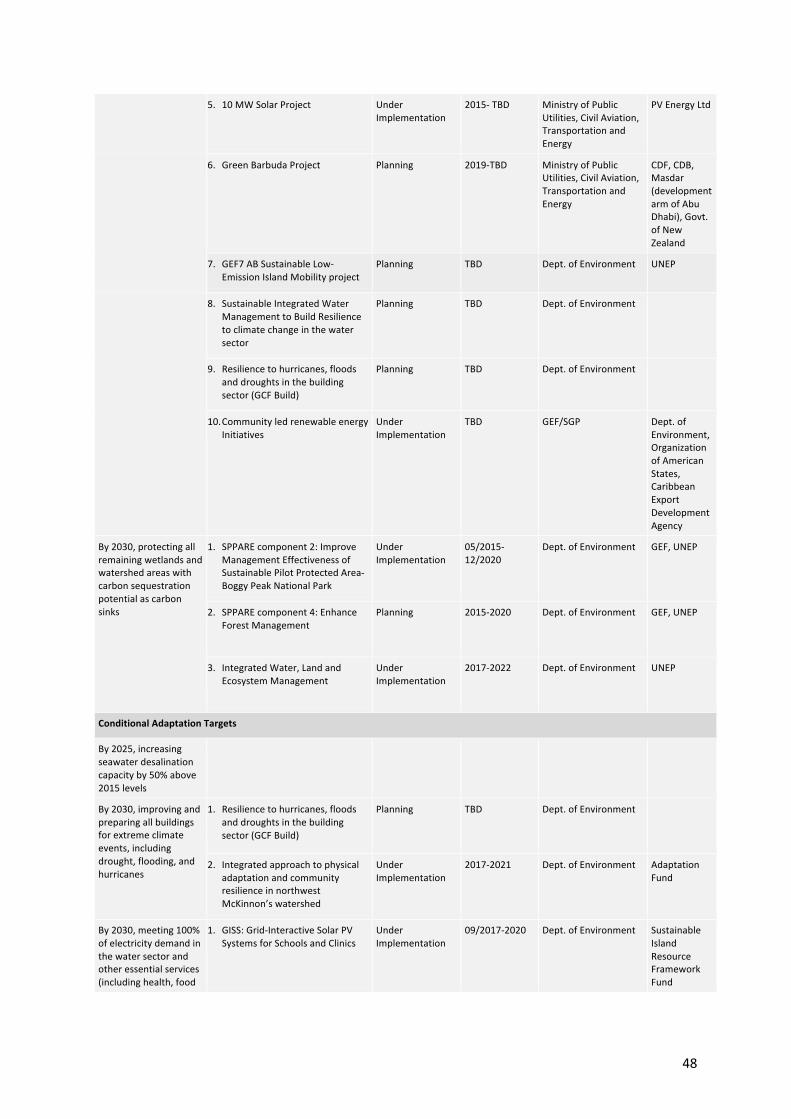
48
5. 10 MW Solar Project Under Implementation
2015- TBD Ministry of Public Utilities, Civil Aviation, Transportation and Energy
PV Energy Ltd
6. Green Barbuda Project Planning 2019-TBD Ministry of Public Utilities, Civil Aviation, Transportation and Energy
CDF, CDB, Masdar (development arm of Abu Dhabi), Govt. of New Zealand
7. GEF7 AB Sustainable Low-Emission Island Mobility project
Planning TBD Dept. of Environment UNEP
8. Sustainable Integrated Water Management to Build Resilience to climate change in the water sector
Planning TBD Dept. of Environment
9. Resilience to hurricanes, floods and droughts in the building sector (GCF Build)
Planning TBD Dept. of Environment
10. Community led renewable energy Initiatives
Under Implementation
TBD GEF/SGP Dept. of Environment, Organization of American States, Caribbean Export Development Agency
By 2030, protecting all remaining wetlands and watershed areas with carbon sequestration potential as carbon sinks
1. SPPARE component 2: Improve Management Effectiveness of Sustainable Pilot Protected Area- Boggy Peak National Park
Under Implementation
05/2015-12/2020
Dept. of Environment GEF, UNEP
2. SPPARE component 4: Enhance Forest Management
Planning 2015-2020 Dept. of Environment GEF, UNEP
3. Integrated Water, Land and Ecosystem Management
Under Implementation
2017-2022 Dept. of Environment UNEP
Conditional Adaptation Targets
By 2025, increasing seawater desalination capacity by 50% above 2015 levels
By 2030, improving and preparing all buildings for extreme climate events, including drought, flooding, and hurricanes
1. Resilience to hurricanes, floods and droughts in the building sector (GCF Build)
Planning TBD Dept. of Environment
2. Integrated approach to physical adaptation and community resilience in northwest McKinnon’s watershed
Under Implementation
2017-2021 Dept. of Environment Adaptation Fund
By 2030, meeting 100% of electricity demand in the water sector and other essential services (including health, food
1. GISS: Grid-Interactive Solar PV Systems for Schools and Clinics
Under Implementation
09/2017-2020 Dept. of Environment Sustainable Island Resource Framework Fund
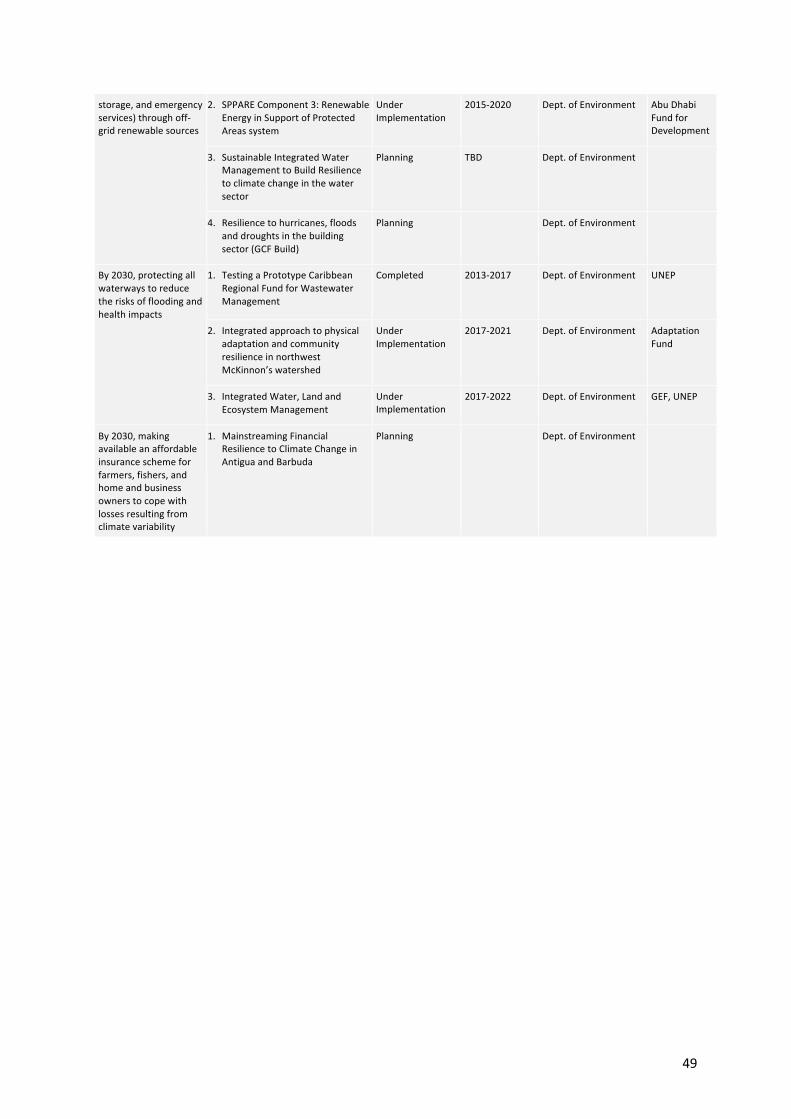
49
storage, and emergency services) through off-grid renewable sources
2. SPPARE Component 3: Renewable Energy in Support of Protected Areas system
Under Implementation
2015-2020 Dept. of Environment Abu Dhabi Fund for Development
3. Sustainable Integrated Water Management to Build Resilience to climate change in the water sector
Planning TBD Dept. of Environment
4. Resilience to hurricanes, floods and droughts in the building sector (GCF Build)
Planning Dept. of Environment
By 2030, protecting all waterways to reduce the risks of flooding and health impacts
1. Testing a Prototype Caribbean Regional Fund for Wastewater Management
Completed 2013-2017
Dept. of Environment UNEP
2. Integrated approach to physical adaptation and community resilience in northwest McKinnon’s watershed
Under Implementation
2017-2021 Dept. of Environment Adaptation Fund
3. Integrated Water, Land and Ecosystem Management
Under Implementation
2017-2022 Dept. of Environment GEF, UNEP
By 2030, making available an affordable insurance scheme for farmers, fishers, and home and business owners to cope with losses resulting from climate variability
1. Mainstreaming Financial Resilience to Climate Change in Antigua and Barbuda
Planning Dept. of Environment
50
8.3. Appendix 3: Energy modelling conducted by the Energy Division, Ministry of Public Utilities, Civil Aviation and Energy
The Energy Division of the Ministry of Public Utilities, Civil Aviation and Energy, supported by International Atomic Energy Agency (IAEA) undertook an energy system analysis to develop its sustainable energy strategies38. Two different energy system assessment tools, the Model for Analysis of Energy Demand (MAED) and the Energy Scenario Simulation Tool (ESST) were used to model energy demand and electricity supply. Staff in the Energy Division were given training in using these models over the course of one year, including trips to IAEA offices in Vienna, Austria. This represents a significant level of capacity-building that has already taken place in the country, knowledge and skills that can and should be maintained and used for future energy modelling and GHG-reduction pathway needs in collaboration with the requirements under the UNFCCC through the Department of the Environment as UNFCCC Focal Point. 39 The following sections provide an overview of the resulting analysis for electricity supply and demand from the Energy Division’s modelling using MAED and ESST. It must, however, be noted that these scenarios were not conducted with a view to achieving the fossil-fuel phase-out target of the government and part of the Government’s NDC ambition.
8.3.1. Energy Demand Analysis In 2018-2019 the Energy Division modelled energy demand for Antigua and Barbuda using the Model for Analysis of Energy Demand (MAED). The tool evaluates future electricity demand based on medium- to long-term scenarios of socioeconomic, technological and demographic development. The starting point for energy demand analysis is always based on historical trends supplemented by government policies and technological developments that are clearly visible on the horizon. In the case of Energy Division modelling, the focus was on the power sector, with some initial thought given to the future coupling of transportation through electrification. Electricity consumption is closely linked to economic activity and growth; at the same time, it was explicitly considered in the modelling exercise that there are two main areas for improvement in the efficiency with which electricity is used. On the one hand measures can be taken to improve existing building systems, especially in terms of optimizing the operation of space-conditioning systems and in increasing the efficiency of appliances and lighting. The second area of particular note in Antigua is that of transmission and distribution loss of electricity, which is currently relatively high. To set the stage for further modelling exercises some of the key results of the Energy Division modelling are briefly presented in the following section, with key assumptions summarized in Box 3.
Box 3: Energy Demand Analysis (MAED)
Energy Demand Analysis
Socio Economic data Population: 90,000 GDP: USD $1.31 Billion, GDP per capita: USD $14,485 GDP Growth Rate: 2.6 %
Assumptions 1. Reference year: 2016
2. Sustained population growth with an annual growth rate of 0.7 %
38 (International Atomic Energy Agency, 2019) (Energy Division, Ministry of Public Utilities, Civil Aviation and Energy, 2019) 39 (International Atomic Energy Agency , 2006)
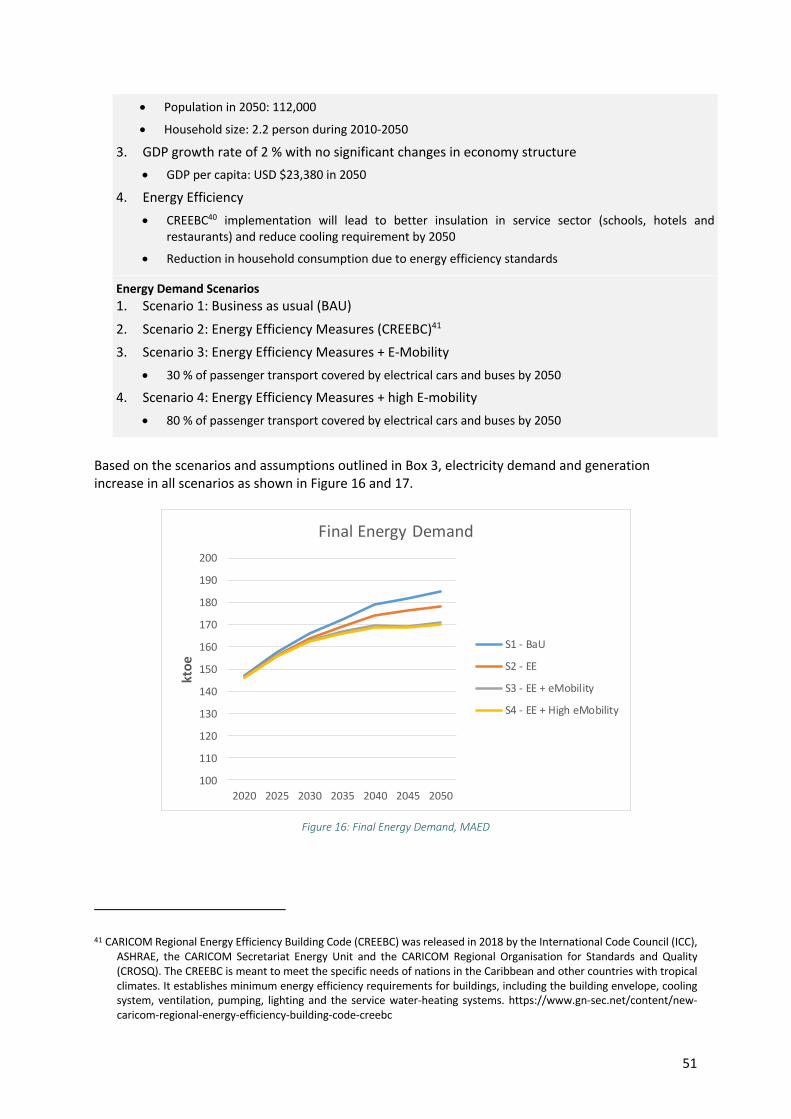
51
• Population in 2050: 112,000 • Household size: 2.2 person during 2010-2050
3. GDP growth rate of 2 % with no significant changes in economy structure • GDP per capita: USD $23,380 in 2050
4. Energy Efficiency • CREEBC40 implementation will lead to better insulation in service sector (schools, hotels and
restaurants) and reduce cooling requirement by 2050
• Reduction in household consumption due to energy efficiency standards
Energy Demand Scenarios 1. Scenario 1: Business as usual (BAU)
2. Scenario 2: Energy Efficiency Measures (CREEBC)41 3. Scenario 3: Energy Efficiency Measures + E-Mobility
• 30 % of passenger transport covered by electrical cars and buses by 2050
4. Scenario 4: Energy Efficiency Measures + high E-mobility • 80 % of passenger transport covered by electrical cars and buses by 2050
Based on the scenarios and assumptions outlined in Box 3, electricity demand and generation increase in all scenarios as shown in Figure 16 and 17.
Figure 16: Final Energy Demand, MAED
41 CARICOM Regional Energy Efficiency Building Code (CREEBC) was released in 2018 by the International Code Council (ICC),
ASHRAE, the CARICOM Secretariat Energy Unit and the CARICOM Regional Organisation for Standards and Quality (CROSQ). The CREEBC is meant to meet the specific needs of nations in the Caribbean and other countries with tropical climates. It establishes minimum energy efficiency requirements for buildings, including the building envelope, cooling system, ventilation, pumping, lighting and the service water-heating systems. https://www.gn-sec.net/content/new-caricom-regional-energy-efficiency-building-code-creebc
100
110
120
130
140
150
160
170
180
190
200
2020 2025 2030 2035 2040 2045 2050
ktoe
Final Energy Demand
S1 - BaU
S2 - EE
S3 - EE + eMobility
S4 - EE + High eMobility
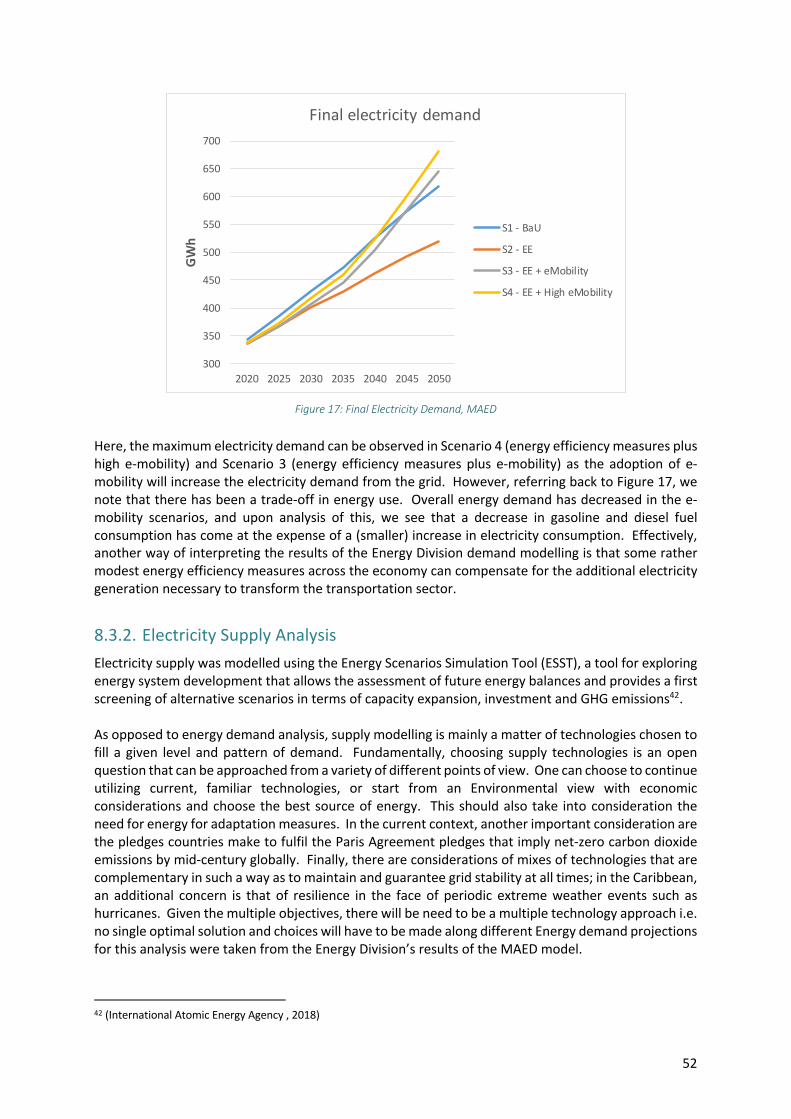
52
Figure 17: Final Electricity Demand, MAED
Here, the maximum electricity demand can be observed in Scenario 4 (energy efficiency measures plus high e-mobility) and Scenario 3 (energy efficiency measures plus e-mobility) as the adoption of e-mobility will increase the electricity demand from the grid. However, referring back to Figure 17, we note that there has been a trade-off in energy use. Overall energy demand has decreased in the e-mobility scenarios, and upon analysis of this, we see that a decrease in gasoline and diesel fuel consumption has come at the expense of a (smaller) increase in electricity consumption. Effectively, another way of interpreting the results of the Energy Division demand modelling is that some rather modest energy efficiency measures across the economy can compensate for the additional electricity generation necessary to transform the transportation sector.
8.3.2. Electricity Supply Analysis Electricity supply was modelled using the Energy Scenarios Simulation Tool (ESST), a tool for exploring energy system development that allows the assessment of future energy balances and provides a first screening of alternative scenarios in terms of capacity expansion, investment and GHG emissions42. As opposed to energy demand analysis, supply modelling is mainly a matter of technologies chosen to fill a given level and pattern of demand. Fundamentally, choosing supply technologies is an open question that can be approached from a variety of different points of view. One can choose to continue utilizing current, familiar technologies, or start from an Environmental view with economic considerations and choose the best source of energy. This should also take into consideration the need for energy for adaptation measures. In the current context, another important consideration are the pledges countries make to fulfil the Paris Agreement pledges that imply net-zero carbon dioxide emissions by mid-century globally. Finally, there are considerations of mixes of technologies that are complementary in such a way as to maintain and guarantee grid stability at all times; in the Caribbean, an additional concern is that of resilience in the face of periodic extreme weather events such as hurricanes. Given the multiple objectives, there will be need to be a multiple technology approach i.e. no single optimal solution and choices will have to be made along different Energy demand projections for this analysis were taken from the Energy Division’s results of the MAED model.
42 (International Atomic Energy Agency , 2018)
300
350
400
450
500
550
600
650
700
2020 2025 2030 2035 2040 2045 2050
GWh
Final electricity demand
S1 - BaU
S2 - EE
S3 - EE + eMobility
S4 - EE + High eMobility

53
Box 4: Electricity Supply Analysis (ESST)
Electricity Supply Analysis
Total Installed Capacity: 88 MW Peak Demand: 54 MW Transmission and Distribution losses: 13-14 % Average Electricity Tariffs (USD/kWh): $0.38
Assumptions Energy demand projections for this analysis is taken from the Energy Demand Analysis
Electricity Supply Scenarios 1. Reference: 25 % renewables by 2050 2. Scenario 1: 50 % Renewable Energy System (RES) by 2050
3. Scenario 2: 80 % Renewable Energy System (RES) by 2050
Each scenario analysed with and without system reserve and storage
ESST model produced results for installed capacity which would be needed for each scenario and the associated investment cost. This can be observed in Figure 18 and 19. Installed capacity increases in scenario 80 RES where the share of fossil fuel decreases and electricity generation is met by solar, wind and waste to energy systems.
Figure 18: Installed Capacity, ESST
Figure 19: Total Cost (Million USD)
In terms of total cost, reference scenario RES 25 has higher cost compared to scenario RES 80. Majority of this cost is due to fuel imports as it is an integral part of the electricity mix. In the RES 80 scenario, the total cost is less than the reference scenario by approximately $25 million USD. The fuel cost
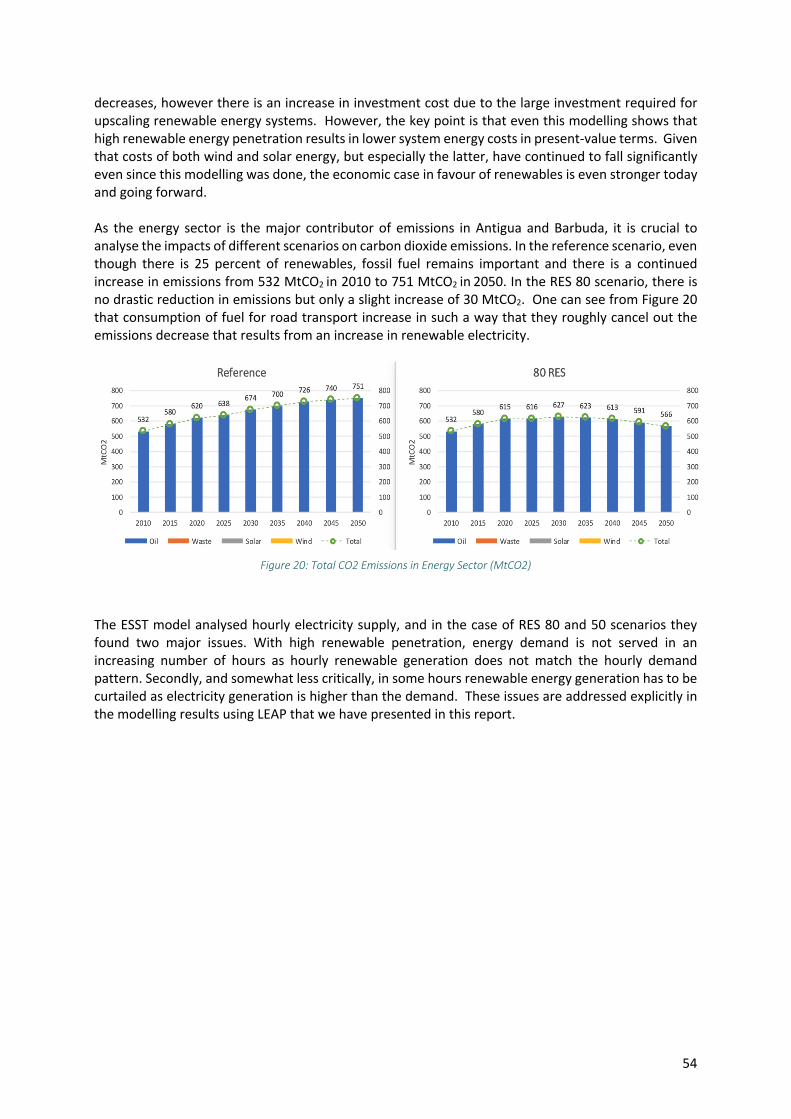
54
decreases, however there is an increase in investment cost due to the large investment required for upscaling renewable energy systems. However, the key point is that even this modelling shows that high renewable energy penetration results in lower system energy costs in present-value terms. Given that costs of both wind and solar energy, but especially the latter, have continued to fall significantly even since this modelling was done, the economic case in favour of renewables is even stronger today and going forward. As the energy sector is the major contributor of emissions in Antigua and Barbuda, it is crucial to analyse the impacts of different scenarios on carbon dioxide emissions. In the reference scenario, even though there is 25 percent of renewables, fossil fuel remains important and there is a continued increase in emissions from 532 MtCO2 in 2010 to 751 MtCO2 in 2050. In the RES 80 scenario, there is no drastic reduction in emissions but only a slight increase of 30 MtCO2. One can see from Figure 20 that consumption of fuel for road transport increase in such a way that they roughly cancel out the emissions decrease that results from an increase in renewable electricity.
Figure 20: Total CO2 Emissions in Energy Sector (MtCO2)
The ESST model analysed hourly electricity supply, and in the case of RES 80 and 50 scenarios they found two major issues. With high renewable penetration, energy demand is not served in an increasing number of hours as hourly renewable generation does not match the hourly demand pattern. Secondly, and somewhat less critically, in some hours renewable energy generation has to be curtailed as electricity generation is higher than the demand. These issues are addressed explicitly in the modelling results using LEAP that we have presented in this report.

Produced by Climate Analytics for Antigua and Barbuda’s Department of Environment, through the NDC Partnership’s Climate Action Enhancement Package (CAEP) Initiative