Antibiotic-Induced Changes in Microbiome-Related ...
20
metabolites H OH OH Article Antibiotic-Induced Changes in Microbiome-Related Metabolites and Bile Acids in Rat Plasma Véronique de Bruijn 1,2 , Christina Behr 1 , Saskia Sperber 1 , Tilmann Walk 3 , Philipp Ternes 3 , Markus Slopianka 3 , Volker Haake 3 , Karsten Beekmann 2 and Bennard van Ravenzwaay 1, * 1 BASF SE, Experimental Toxicology and Ecology, 67056 Ludwigshafen, Germany; [email protected] (V.d.B.); [email protected] (C.B.); [email protected] (S.S.) 2 Division of Toxicology, Wageningen University and Research, 6708 WE Wageningen, The Netherlands; [email protected] 3 BASF Metabolome Solutions, Tegeler Weg 33, 10589 Berlin, Germany; [email protected] (T.W.); [email protected] (P.T.); [email protected] (M.S.); [email protected] (V.H.) * Correspondence: [email protected] Received: 16 April 2020; Accepted: 4 June 2020; Published: 11 June 2020 Abstract: Various environmental factors can alter the gut microbiome’s composition and functionality, and modulate host health. In this study, the effects of oral and parenteral administration of two poorly bioavailable antibiotics (i.e., vancomycin and streptomycin) on male Wistar Crl/Wi(Han) rats for 28 days were compared to distinguish between microbiome-derived or -associated and systemic changes in the plasma metabolome. The resulting changes in the plasma metabolome were compared to the effects of a third reference compound, roxithromycin, which is readily bioavailable. A community analysis revealed that the oral administration of vancomycin and roxithromycin in particular leads to an altered microbial population. Antibiotic-induced changes depending on the administration routes were observed in plasma metabolite levels. Indole-3-acetic acid (IAA) and hippuric acid (HA) were identified as key metabolites of microbiome modulation, with HA being the most sensitive. Even though large variations in the plasma bile acid pool between and within rats were observed, the change in microbiome community was observed to alter the composition of the bile acid pool, especially by an accumulation of taurine-conjugated primary bile acids. In-depth investigation of the relationship between microbiome variability and their functionality, with emphasis on the bile acid pool, will be necessary to better assess the potential adverseness of environmentally induced microbiome changes. Keywords: microbiome; bile acids; metabolomics; antibiotics 1. Introduction The gut microbiome consists of around 1000 species of bacteria, fungi, archaea and viruses [1] and is increasingly recognized to play a central role in host health. Co-evolution of the host with the gut microbiome has resulted in a close host-microbiome interplay and mutual co-dependency. The host body is crucial for the survival of the gut microbiome, whereas the microbiome plays a role in many metabolic processes required for host health and well-being [2]. Environmental factors can affect the composition and functionality of the microbiome. The gut microbiome is comprised of bacterial, archaeal, viral and fungal species. Alterations in the microbial composition can alter the microbiome’s functionality, i.e., the metabolites produced by the microbiome which are subsequently absorbed by the host, and metabolomics can be used to assess these changes [3]. Within the scope of metabolomics, metabolites are defined as small (<1500 Dalton) endogenous Metabolites 2020, 10, 242; doi:10.3390/metabo10060242 www.mdpi.com/journal/metabolites
Transcript of Antibiotic-Induced Changes in Microbiome-Related ...
metabolites
H
OH
OH
Article
Antibiotic-Induced Changes in Microbiome-RelatedMetabolites and Bile Acids in Rat Plasma
Véronique de Bruijn 1,2 , Christina Behr 1, Saskia Sperber 1, Tilmann Walk 3 ,Philipp Ternes 3 , Markus Slopianka 3, Volker Haake 3, Karsten Beekmann 2
and Bennard van Ravenzwaay 1,*1 BASF SE, Experimental Toxicology and Ecology, 67056 Ludwigshafen, Germany;
[email protected] (V.d.B.); [email protected] (C.B.); [email protected] (S.S.)2 Division of Toxicology, Wageningen University and Research, 6708 WE Wageningen, The Netherlands;
[email protected] BASF Metabolome Solutions, Tegeler Weg 33, 10589 Berlin, Germany; [email protected] (T.W.);
[email protected] (P.T.); [email protected] (M.S.); [email protected] (V.H.)* Correspondence: [email protected]
Received: 16 April 2020; Accepted: 4 June 2020; Published: 11 June 2020�����������������
Abstract: Various environmental factors can alter the gut microbiome’s composition and functionality,and modulate host health. In this study, the effects of oral and parenteral administration of twopoorly bioavailable antibiotics (i.e., vancomycin and streptomycin) on male Wistar Crl/Wi(Han)rats for 28 days were compared to distinguish between microbiome-derived or -associated andsystemic changes in the plasma metabolome. The resulting changes in the plasma metabolome werecompared to the effects of a third reference compound, roxithromycin, which is readily bioavailable.A community analysis revealed that the oral administration of vancomycin and roxithromycin inparticular leads to an altered microbial population. Antibiotic-induced changes depending on theadministration routes were observed in plasma metabolite levels. Indole-3-acetic acid (IAA) andhippuric acid (HA) were identified as key metabolites of microbiome modulation, with HA being themost sensitive. Even though large variations in the plasma bile acid pool between and within rats wereobserved, the change in microbiome community was observed to alter the composition of the bile acidpool, especially by an accumulation of taurine-conjugated primary bile acids. In-depth investigationof the relationship between microbiome variability and their functionality, with emphasis on the bileacid pool, will be necessary to better assess the potential adverseness of environmentally inducedmicrobiome changes.
Keywords: microbiome; bile acids; metabolomics; antibiotics
1. Introduction
The gut microbiome consists of around 1000 species of bacteria, fungi, archaea and viruses [1] andis increasingly recognized to play a central role in host health. Co-evolution of the host with the gutmicrobiome has resulted in a close host-microbiome interplay and mutual co-dependency. The hostbody is crucial for the survival of the gut microbiome, whereas the microbiome plays a role in manymetabolic processes required for host health and well-being [2].
Environmental factors can affect the composition and functionality of the microbiome. The gutmicrobiome is comprised of bacterial, archaeal, viral and fungal species. Alterations in the microbialcomposition can alter the microbiome’s functionality, i.e., the metabolites produced by the microbiomewhich are subsequently absorbed by the host, and metabolomics can be used to assess these changes [3].Within the scope of metabolomics, metabolites are defined as small (<1500 Dalton) endogenous
Metabolites 2020, 10, 242; doi:10.3390/metabo10060242 www.mdpi.com/journal/metabolites
Metabolites 2020, 10, 242 2 of 20
compounds such as carbohydrates, amino acids, nucleic acids or fatty acids and their derivativesresulting from biochemical pathways [4]. Sensitive mass spectrometry (MS) techniques allow for thedetection of a broad range of metabolites, which is important for increasing the probability of detectingrelevant biomarkers. Metabolomics can be used in the field of toxicology and pharmacology, as itallows for the rapid identification of alterations in biochemical pathways after the administrationof xenobiotics. Thereby, metabolomics can provide information on likely target organs and themode-of-action of a compound [5].
One of the key functions of the microbiome is the regulation of the bile acid pool. Bile acids aidthe absorption of fats and fat-soluble vitamins from food. In the host, bile acids also regulate genesinvolved in lipid and glucose metabolism, and energy homeostasis via binding to numerous nuclearreceptors, e.g., the trans-membrane-bound G-protein-coupled receptor (TGR5), the vitamin D receptor(VDR) and the farnesoid X receptor (FXR) [6]. Primary bile acids are predominantly synthesized in theliver from cholesterol via the classical pathway. The first and rate-limiting step in the classical pathwayis the conversion of cholesterol into 7α-HO-cholesterol by the enzyme cholesterol-7α hydroxylase(CYP7A1); it is next converted into 7α-HO-4-cholesten-3-one (C4). Sterol 12-hydroxylase (CYP8B1)is required to synthesize cholic acid (CA) from C4; when 12α-hydroxylation by CYP8B1 does nottake place chenodeoxycholic acid (CDCA) is synthesized. Mitochondrial steroid 27-hydroxylase(CYP27A1) catalyzes the oxidation of the steroid side-chain, followed by oxidative cleavage of athree-carbon side-chain to form C24 cholestonic acid, the backbone of most bile acids. In the alternativepathway, CYP27A1 initiates the formation of bile acids and different intermediates are formed, i.e.,3β-HO-5-cholestenoic acid and 3β,7α-(HO)2-5-cholestenoic acid. As well as in the liver, the alternativepathway is expressed in macrophages and steroidogenic tissues, such as the adrenal gland, ovary andtestis, and contributes up to 10% to the total bile acid synthesis. More minor pathways contribute to theformation of bile acids. In the rodent liver, CDCA can be converted into α-muricholic acid (α-MCA)which is then epimerized to β-muricholic acid (β-MCA) [7–9]. Prior to their secretion into the smallintestine, primary bile acids in rodents (i.e., CA, CDCA, α- and β-MCA) are conjugated with eithertaurine or glycine to give them their amphiphilic character. After secretion into the small intestine, bileacids are deconjugated by several Gram-positive bacterial species. Approximately 95% of the bile acidsare actively reabsorbed in the ileum and are transported to the liver via the portal vein. In the liver,bile acids are reconjugated and subsequently secreted into the bile canaliculus and intestine again viaenterohepatic circulation. The remaining bile acids that escape reabsorption enter the colon, are furthermetabolized by gut microbial species and are eventually partly excreted via the feces and urine [10,11].After deconjugation, additional microbial modifications, including oxidation and dehydroxylation,occur in the colon. These enzymatic reactions give rise to unconjugated bile acids as well as secondarybile acids, such as (iso-)deoxycholic acid (DCA), tauro- and glycodeoxycholic acid (TDCA, GDCA),ω-muricholic acid (ω-MCA), hyodeoxycholic acid (HDCA), ursodeoxycholic acid (UDCA), tauro-and glycoursodeoxycholic acid (TUDCA, GUDCA), (iso-)lithocholic acid (LCA), taurolitocholic acid(TLCA) and glycolithocholic acid (GLCA) [7,10]. Perturbations of the bile acid pool are associated withseveral disease states, such as metabolic syndrome, non-alcoholic fatty liver disease, inflammatorybowel disease and even colorectal cancers [12,13]. Hence, it is very relevant to elucidate the impactof xenobiotic-induced modulations of the gut microbial community on the bile acid pool for a betterunderstanding of the onset and progression of disease as well as the development of new therapeutics.
The interplay between microbial and mammalian metabolism is reflected in the plasmametabolome [3,14–16]. Previously, glycerol, indole-derivatives, hippuric acid and bile acids wereidentified as key metabolites altered by the microbiome [3,14]. The current project uses a novelapproach to identify microbiome-derived metabolites and to distinguish these from those that arisefrom systemic toxicity. To this end, male rats were administered antibiotics orally or parenterally for28 days and the antibiotic-induced effects of both administration routes on the plasma metabolomewere compared. The rats were administered the orally non-bioavailable glycopeptide antibioticvancomycin and the poorly bioavailable aminoglycoside antibiotic streptomycin to exclude or

Metabolites 2020, 10, 242 3 of 20
minimize systemic toxicity as a source for plasma metabolome changes [17–19]. Oral antibioticswere administered via gavage (p.o.); parenteral administration was conducted via subcutaneous (s.c.)or intraperitoneal (i.p.) injection. The resulting metabolite profiles were compared to the profilesof the orally bioavailable antibiotic (roxithromycin), administered orally and parenterally [18–20].Roxithromycin was shown to be absorbed from the blood into the intestinal lumen after parenteraladministration [20]. Therefore, intestinal roxithromycin concentrations were assumed to be similar afteroral and parenteral administration. All three antibiotics are broad-spectrum antibiotics with differentactivity spectra. The effects of oral antibiotic administration on the gut microbiome’s compositionwere characterized with a 16s rRNA community analysis. Comparing the plasma metabolite profilesof orally and parenterally antibiotic-treated rats provides a novel opportunity to identify systemicantibiotic-induced effects and distinguish these from microbiome-derived effects.
2. Results
2.1. Clinical Signs
Animals orally treated with roxithromycin showed slight salivation immediately afteradministration. Nothing abnormal was detected in the other treatment and control groups. As theseclinical signs were not accompanied by a significant decrease in body weight relative to the feedingcontrol, these clinical signs were interpreted as borderline effects and not indicative of systemic organtoxicity. Food consumption was measured for the entire cage (5 animals) and not for individual rats;hence, no statistical methods could be applied to evaluate statistical differences in food consumption.Relative changes in body weight and food consumption noted upon administration of the testcompounds are shown in Table 1.
Table 1. Fold changes in body weight and food consumption of Crl/Wi(Han) rats (n = 5) dosed for28 days compared to the corresponding feeding controls (n = 10 per group). None of the relativedecreases in body weight compared to corresponding feeding controls were statistically significant(p < 0.05).
Antibiotic Route of Administration Day Body Weight Food Consumption
Vancomycin
Gavage6 0.99 0.88
13 0.97 0.9327 0.95 0.93
Intraperitoneal6 0.98 0.91
13 0.99 1.0827 0.99 1.20
Streptomycin
Gavage6 0.97 0.92
13 0.96 0.9227 0.95 0.97
Subcutaneous6 1.00 0.97
13 0.99 1.0227 1.00 1.13
Roxithromycin
Gavage6 0.98 0.85
13 0.96 0.8627 0.96 1.04
Intraperitoneal6 0.97 0.92
13 0.96 0.9927 0.97 1.05
2.2. 16S rRNA Community Analysis
To characterize the changes in the gut microbiome’s composition upon oral antibioticadministration, 16S rRNA gene sequencing was performed from the isolated bacterial DNA in

Metabolites 2020, 10, 242 4 of 20
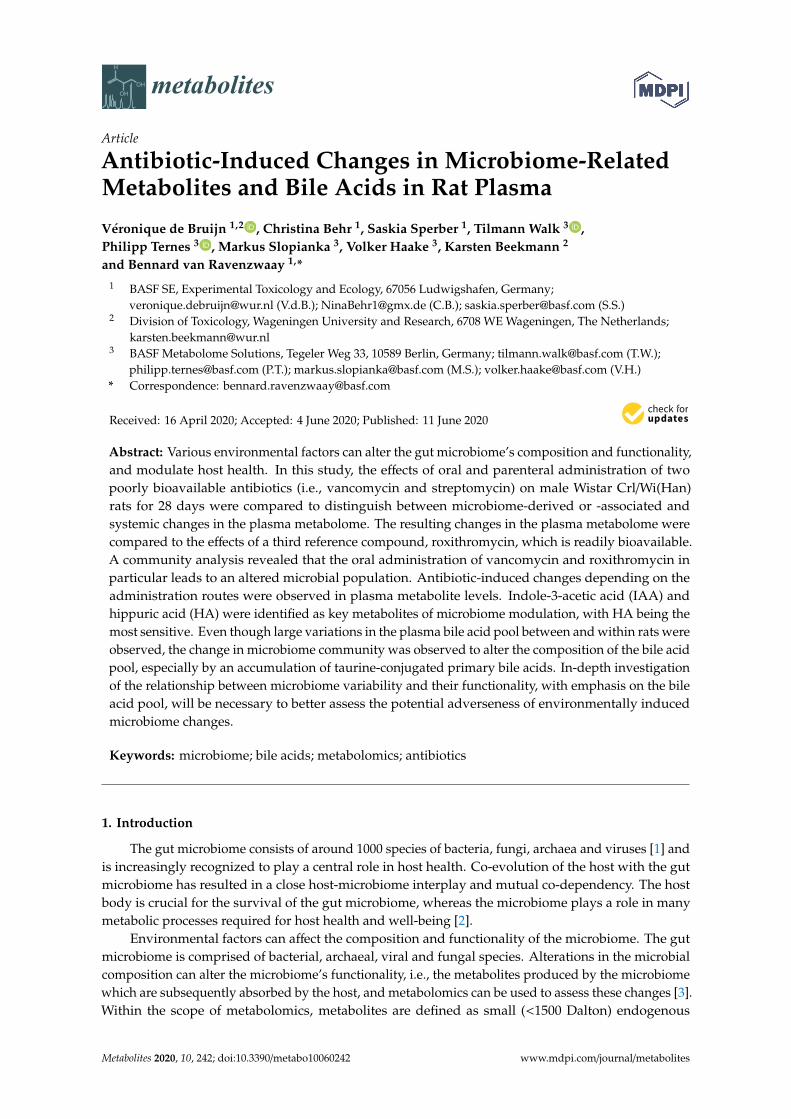
the feces after 28 days of daily antibiotic administration. Figure 1 shows a principal coordinate analysis(PCoA) of gut microbial composition in orally antibiotic-treated and control rats. Roxithromycin andvancomycin show a clear and different treatment-related effect on the gut microbiome’s composition.Streptomycin shows only a weak separation from the controls.
Metabolites 2020, 10, x FOR PEER REVIEW 4 of 22
feces after 28 days of daily antibiotic administration. Figure 1 shows a principal coordinate analysis (PCoA) of gut microbial composition in orally antibiotic-treated and control rats. Roxithromycin and vancomycin show a clear and different treatment-related effect on the gut microbiome’s composition. Streptomycin shows only a weak separation from the controls.
Figure 1. Principal coordinate analysis (PCoA) of the gut microbial community showing the treatment-related effect of oral administration of roxithromycin, streptomycin and vancomycin versus the feeding control and the vehicle control (0.5% carboxymethylcellulose (CMC) in drinking water).
2.3. Comparison of Plasma Metabolite Patterns after Oral and Parenteral Antibiotic-Administration
A principal component analysis (PCA) was conducted to visualize treatment effects on the plasma metabolome. No clear clusters were observed (see Supplementary Figure S1). To check whether the samples of a given treatment share a common metabolic difference from all the controls, a supervised orthogonal projection to latent structures discriminant analysis (O-PLS-DA) was performed. To characterize metabolic variation in the plasma metabolome, individual O-PLS-DA models were calculated to compare each antibiotic and administration route to all controls. Data from all time points were used to increase model power as there was no obvious clustering by time (see Supplementary Figure S1). For all six models, a good discrimination was observed between the antibiotic treatments and controls based on the first predictive and first orthogonal component; see Figure 2. The top analytes (here defined by having an absolute loading value of >0.125) from each model are highlighted in the corresponding loading plots (See Supplementary Figure S2). The focus is on these 55 top metabolites in further data analysis. A list with the ANOVA contrast t-values of all measured metabolites can be found in Supplementary Table S1.
Figure 1. Principal coordinate analysis (PCoA) of the gut microbial community showing thetreatment-related effect of oral administration of roxithromycin, streptomycin and vancomycin versusthe feeding control and the vehicle control (0.5% carboxymethylcellulose (CMC) in drinking water).
2.3. Comparison of Plasma Metabolite Patterns after Oral and Parenteral Antibiotic-Administration
A principal component analysis (PCA) was conducted to visualize treatment effects on theplasma metabolome. No clear clusters were observed (see Supplementary Figure S1). To checkwhether the samples of a given treatment share a common metabolic difference from all the controls,a supervised orthogonal projection to latent structures discriminant analysis (O-PLS-DA) was performed.To characterize metabolic variation in the plasma metabolome, individual O-PLS-DA models werecalculated to compare each antibiotic and administration route to all controls. Data from all time pointswere used to increase model power as there was no obvious clustering by time (see SupplementaryFigure S1). For all six models, a good discrimination was observed between the antibiotic treatmentsand controls based on the first predictive and first orthogonal component; see Figure 2. The top analytes(here defined by having an absolute loading value of >0.125) from each model are highlighted in thecorresponding loading plots (See Supplementary Figure S2). The focus is on these 55 top metabolitesin further data analysis. A list with the ANOVA contrast t-values of all measured metabolites can befound in Supplementary Table S1.
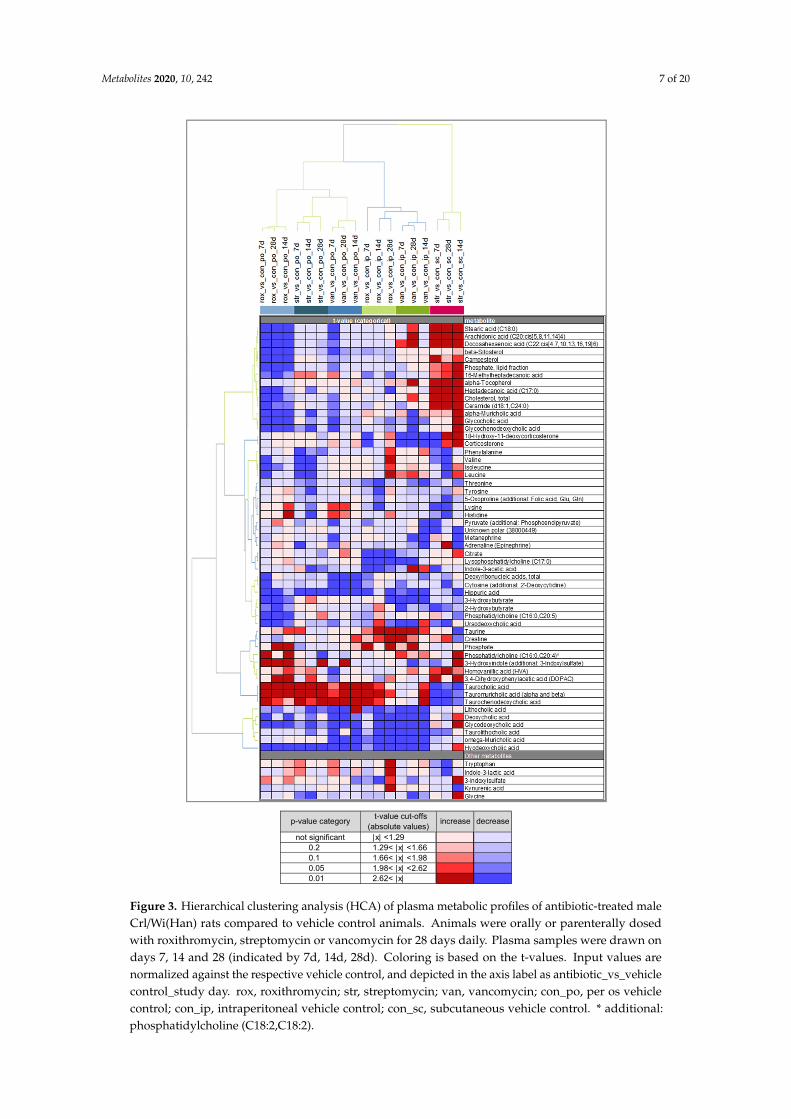
Subsequently, a hierarchical clustering analysis (HCA) was performed to check for similaritybetween groups. The HCA (Figure 3) was based on ANOVA contrast t-values from the comparison ofthe individual antibiotic treatments versus the corresponding application control using the compiled listof 55 metabolites identified in the O-PLS-DA approach. The oral antibiotic treatments cluster together asexpected. The s.c. streptomycin treatment is separated from the other parenteral antibiotic treatments.The difference in this treatment is most obvious for several lipid-related metabolites (increased) andthe primary bile acids taurocholic acid, α- and β-tauromuricholic acid and taurochenodeoxycholic acid(all decreased). Interestingly, the i.p. roxithromycin and i.p. vancomycin treatments cluster more closelywith the orally applied antibiotics than with s.c. streptomycin. This is most evident in the secondary
Metabolites 2020, 10, 242 5 of 20
bile acids (tauro)lithocholic acid, (glyco)deoxycholic acid, ω-muricholic acid and hyodeoxycholic acid(all decreased), and may indicate an effect of i.p. roxithromycin and i.p. vancomycin on the microbiomedespite their parenteral administration.
All the treatments showed lower plasma hippuric acid (HA) concentrations in the antibiotic-treatedanimals relative to the respective vehicle control at multiple time points. A consistent yet weakereffect was the lower levels of threonine found for all antibiotic treatments. The indole-derivativesindole-3-acetic acid (IAA) and 3-hydroxyindole (with additional 3-indoxylsulfate—“additional”indicates that an analyte signal may be impacted by a different metabolite than the target metabolite)were identified as strong drivers of the separation, especially in the parenteral and oral roxithromycintreatment groups, respectively. Parenteral roxithromycin administration led to a downregulationof IAA, whereas oral roxithromycin induced an upregulation of 3-hydroxyindole (with additional3-indoxylsulfate). Moreover, the list of prioritized metabolites contains phenylalanine, tyrosine and 2-and 3-hydroxybutyrate, all of them being predominantly downregulated after the antibiotic-treatments.The other measured indole-derivatives (indole-3-lactic acid, 3-indoxylsulfate and kynurenic acid)as well as glycine did not induce a strong separation between the antibiotic treatments and thecontrols and are shown under “Other metabolites”. Glycine is displayed because it is necessary forthe formation of HA and is identified as a biomarker for nephrotoxicity. In the majority of groupsglycine levels were slightly reduced. The list of prioritized metabolites contains one unconjugatedprimary bile acid, alpha-muricholic acid (α-MCA). The plasma concentrations of α-MCA were typicallydownregulated after antibiotic treatment, but s.c. streptomycin treatment induced an increase inα-MCA plasma levels. A similar pattern was observed for the glycine-conjugated primary bile acidsglycocholic acid and glycochenodeoxycholic acid. The prioritized primary taurine-conjugated bileacids, taurocholic acid, α+β-tauromuricholic acid and taurochenodeoxycholic acid, were significantlyupregulated after the oral administration of all three antibiotics and parenteral roxithromycin treatment.The secondary bile acids ursodeoxycholic acid, lithocholic acid, deoxycholic acid, glycodeoxycholic acid,taurolithocholic acid,ω-muricholic acid and hyodeoxycholic acid were predominantly downregulatedafter antibiotic treatment. Oral and parenteral vancomycin administration and parenteral roxithromycinadministration induced the highest number of significant downregulations of secondary bile acids.
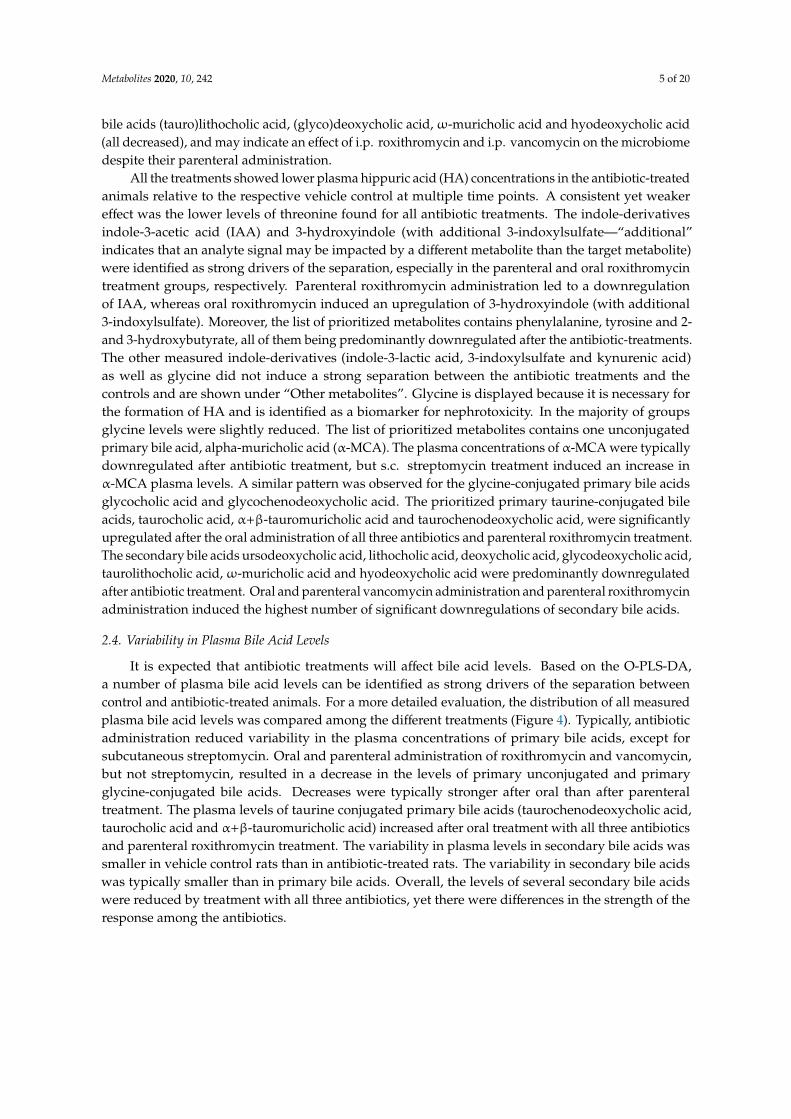
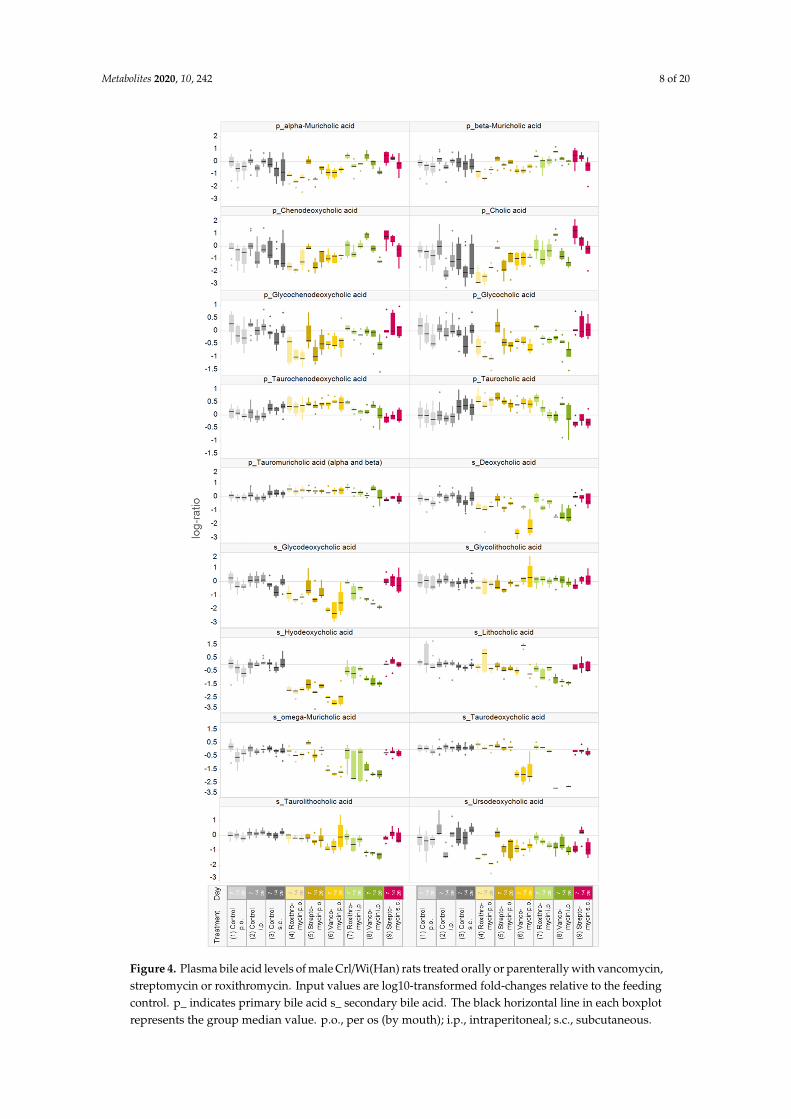
2.4. Variability in Plasma Bile Acid Levels
It is expected that antibiotic treatments will affect bile acid levels. Based on the O-PLS-DA,a number of plasma bile acid levels can be identified as strong drivers of the separation betweencontrol and antibiotic-treated animals. For a more detailed evaluation, the distribution of all measuredplasma bile acid levels was compared among the different treatments (Figure 4). Typically, antibioticadministration reduced variability in the plasma concentrations of primary bile acids, except forsubcutaneous streptomycin. Oral and parenteral administration of roxithromycin and vancomycin,but not streptomycin, resulted in a decrease in the levels of primary unconjugated and primaryglycine-conjugated bile acids. Decreases were typically stronger after oral than after parenteraltreatment. The plasma levels of taurine conjugated primary bile acids (taurochenodeoxycholic acid,taurocholic acid and α+β-tauromuricholic acid) increased after oral treatment with all three antibioticsand parenteral roxithromycin treatment. The variability in plasma levels in secondary bile acids wassmaller in vehicle control rats than in antibiotic-treated rats. The variability in secondary bile acidswas typically smaller than in primary bile acids. Overall, the levels of several secondary bile acidswere reduced by treatment with all three antibiotics, yet there were differences in the strength of theresponse among the antibiotics.

Metabolites 2020, 10, 242 6 of 20Metabolites 2020, 10, x FOR PEER REVIEW 5 of 22
(a) (b)
tp1 tp1
(c)
(d)
tp1 tp1
(e)
(f)
tp1 tp1
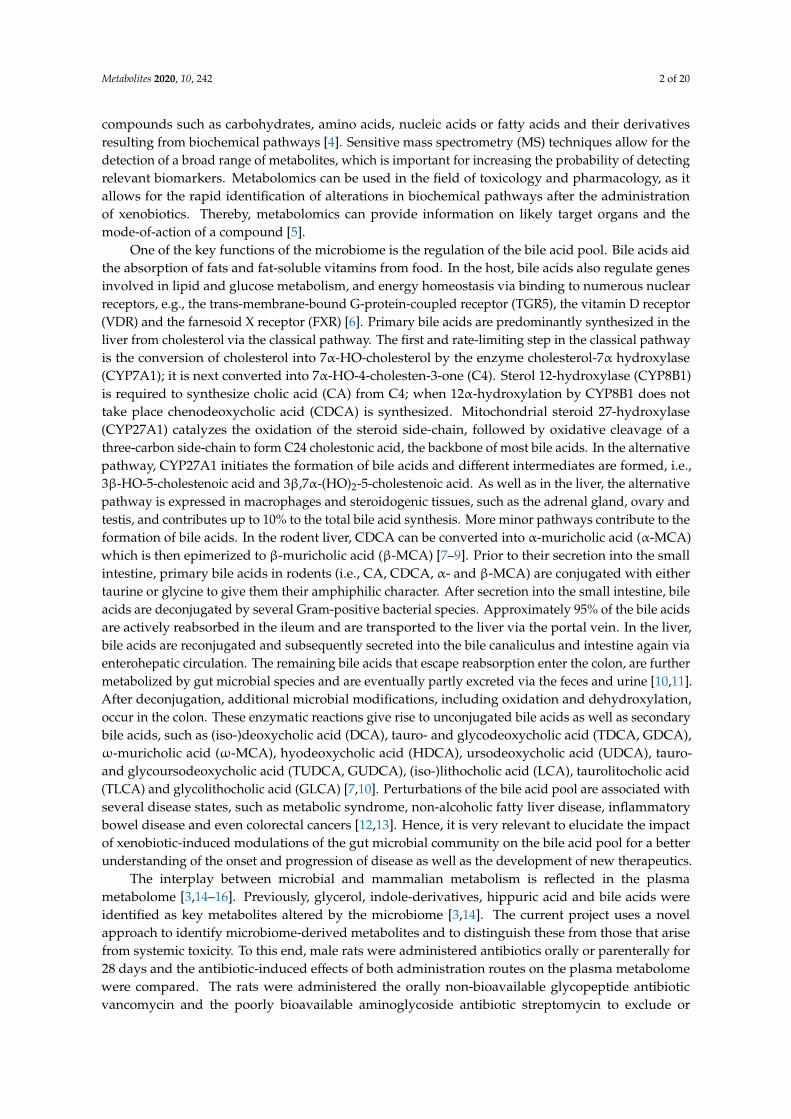
Figure 2. O-PLS-DA score plots. Individual models were generated by comparing samples from each antibiotic treatment and application route to all controls. (a) roxithromycin p.o. (b) roxithromycin i.p. (c) streptomycin p.o. (d) vancomycin i.p. (e) vancomycin p.o. (f) streptomycin i.p. Rats were either orally or parenterally dosed with vancomycin, streptomycin and roxithromycin (n = 5 per group). The control group received no treatment, the gavage control group received 0.5% CMC in drinking water and the intraperitoneal and subcutaneous control group were injected with a saline solution (n = 10 per group). Each dot represents a single plasma sample. The different days are represented by
to1
to1
to1
to1
to1
to1
Figure 2. O-PLS-DA score plots. Individual models were generated by comparing samples from eachantibiotic treatment and application route to all controls. (a) roxithromycin p.o. (b) roxithromycin i.p.(c) streptomycin p.o. (d) vancomycin i.p. (e) vancomycin p.o. (f) streptomycin i.p. Rats were eitherorally or parenterally dosed with vancomycin, streptomycin and roxithromycin (n = 5 per group).The control group received no treatment, the gavage control group received 0.5% CMC in drinkingwater and the intraperitoneal and subcutaneous control group were injected with a saline solution(n = 10 per group). Each dot represents a single plasma sample. The different days are representedby different point shapes. tp1, scores for first predictive component; to1, scores for first orthogonalcomponent; p.o., per os (by mouth); i.p., intraperitoneal; s.c., subcutaneous.
Metabolites 2020, 10, 242 7 of 20
Metabolites 2020, 10, x FOR PEER REVIEW 7 of 22
Figure 3. Hierarchical clustering analysis (HCA) of plasma metabolic profiles of antibiotic-treated male Crl/Wi(Han) rats compared to vehicle control animals. Animals were orally or parenterally dosed with roxithromycin, streptomycin or vancomycin for 28 days daily. Plasma samples were drawn on days 7, 14 and 28 (indicated by 7d, 14d, 28d). Coloring is based on the t-values. Input values are normalized against the respective vehicle control, and depicted in the axis label as antibiotic_vs_vehicle control_study day. rox, roxithromycin; str, streptomycin; van, vancomycin; con_po, per os vehicle control; con_ip, intraperitoneal vehicle control; con_sc, subcutaneous vehicle control. * additional: phosphatidylcholine (C18:2,C18:2).
not significant |x| <1.29 0.9 -0.90.2 1.29< |x| <1.66 0.2 -0.20.1 1.66< |x| <1.98 0.1 -0.10.05 1.98< |x| <2.62 0.05 -0.050.01 2.62< |x| 0.01 -0.01
p-value category t-value cut-offs(absolute values) increase decrease
Figure 3. Hierarchical clustering analysis (HCA) of plasma metabolic profiles of antibiotic-treated maleCrl/Wi(Han) rats compared to vehicle control animals. Animals were orally or parenterally dosedwith roxithromycin, streptomycin or vancomycin for 28 days daily. Plasma samples were drawn ondays 7, 14 and 28 (indicated by 7d, 14d, 28d). Coloring is based on the t-values. Input values arenormalized against the respective vehicle control, and depicted in the axis label as antibiotic_vs_vehiclecontrol_study day. rox, roxithromycin; str, streptomycin; van, vancomycin; con_po, per os vehiclecontrol; con_ip, intraperitoneal vehicle control; con_sc, subcutaneous vehicle control. * additional:phosphatidylcholine (C18:2,C18:2).
Metabolites 2020, 10, 242 8 of 20
Metabolites 2020, 10, x FOR PEER REVIEW 9 of 22
Figure 4. Plasma bile acid levels of male Crl/Wi(Han) rats treated orally or parenterally with vancomycin, streptomycin or roxithromycin. Input values are log10-transformed fold-changes relative to the feeding control. p_ indicates primary bile acid s_ secondary bile acid. The black horizontal line in each boxplot represents the group median value. p.o., per os (by mouth); i.p., intraperitoneal; s.c., subcutaneous.
Figure 4. Plasma bile acid levels of male Crl/Wi(Han) rats treated orally or parenterally with vancomycin,streptomycin or roxithromycin. Input values are log10-transformed fold-changes relative to the feedingcontrol. p_ indicates primary bile acid s_ secondary bile acid. The black horizontal line in each boxplotrepresents the group median value. p.o., per os (by mouth); i.p., intraperitoneal; s.c., subcutaneous.
Metabolites 2020, 10, 242 9 of 20
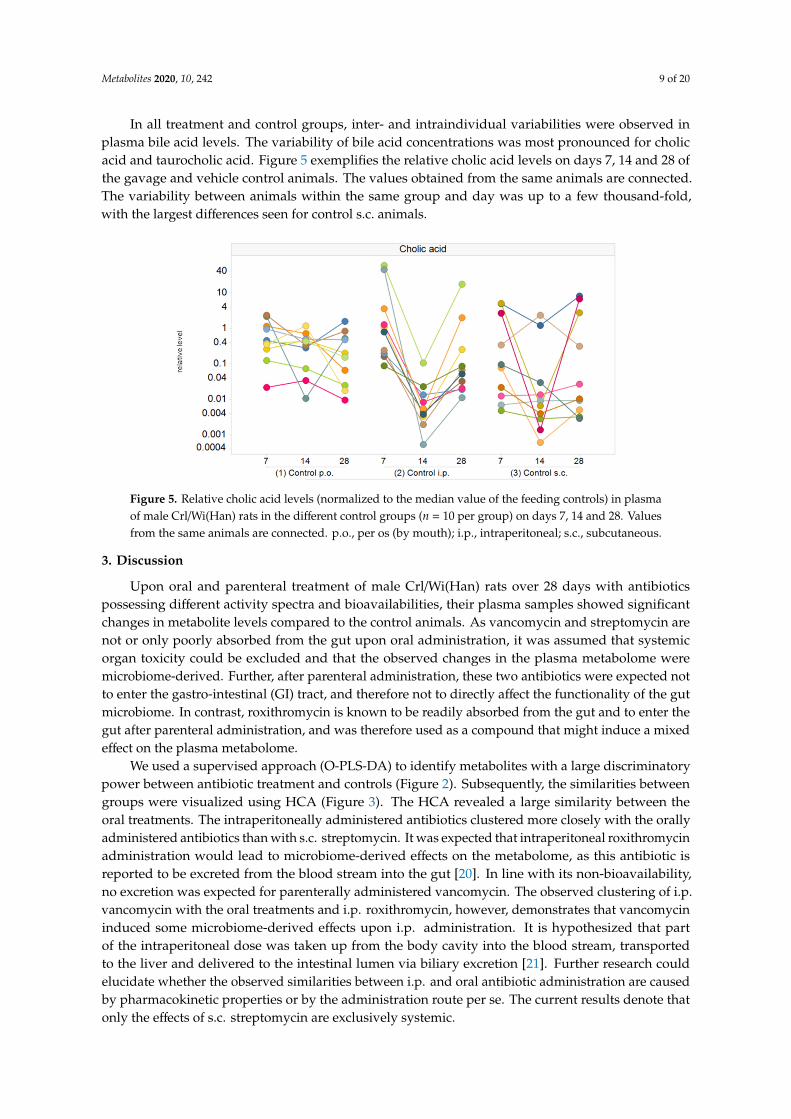
In all treatment and control groups, inter- and intraindividual variabilities were observed inplasma bile acid levels. The variability of bile acid concentrations was most pronounced for cholicacid and taurocholic acid. Figure 5 exemplifies the relative cholic acid levels on days 7, 14 and 28 ofthe gavage and vehicle control animals. The values obtained from the same animals are connected.The variability between animals within the same group and day was up to a few thousand-fold,with the largest differences seen for control s.c. animals.
Metabolites 2020, 10, x FOR PEER REVIEW 10 of 22
In all treatment and control groups, inter- and intraindividual variabilities were observed in plasma bile acid levels. The variability of bile acid concentrations was most pronounced for cholic acid and taurocholic acid. Figure 5 exemplifies the relative cholic acid levels on days 7, 14 and 28 of the gavage and vehicle control animals. The values obtained from the same animals are connected. The variability between animals within the same group and day was up to a few thousand-fold, with the largest differences seen for control s.c. animals.
Figure 5. Relative cholic acid levels (normalized to the median value of the feeding controls) in plasma of male Crl/Wi(Han) rats in the different control groups (n = 10 per group) on days 7, 14 and 28. Values from the same animals are connected. p.o., per os (by mouth); i.p., intraperitoneal; s.c., subcutaneous.
3. Discussion
Upon oral and parenteral treatment of male Crl/Wi(Han) rats over 28 days with antibiotics possessing different activity spectra and bioavailabilities, their plasma samples showed significant changes in metabolite levels compared to the control animals. As vancomycin and streptomycin are not or only poorly absorbed from the gut upon oral administration, it was assumed that systemic organ toxicity could be excluded and that the observed changes in the plasma metabolome were microbiome-derived. Further, after parenteral administration, these two antibiotics were expected not to enter the gastro-intestinal (GI) tract, and therefore not to directly affect the functionality of the gut microbiome. In contrast, roxithromycin is known to be readily absorbed from the gut and to enter the gut after parenteral administration, and was therefore used as a compound that might induce a mixed effect on the plasma metabolome.
We used a supervised approach (O-PLS-DA) to identify metabolites with a large discriminatory power between antibiotic treatment and controls (Figure 2). Subsequently, the similarities between groups were visualized using HCA (Figure 3). The HCA revealed a large similarity between the oral treatments. The intraperitoneally administered antibiotics clustered more closely with the orally administered antibiotics than with s.c. streptomycin. It was expected that intraperitoneal roxithromycin administration would lead to microbiome-derived effects on the metabolome, as this antibiotic is reported to be excreted from the blood stream into the gut [20]. In line with its non-bioavailability, no excretion was expected for parenterally administered vancomycin. The observed clustering of i.p. vancomycin with the oral treatments and i.p. roxithromycin, however, demonstrates that vancomycin induced some microbiome-derived effects upon i.p. administration. It is hypothesized that part of the intraperitoneal dose was taken up from the body cavity into the blood stream, transported to the liver and delivered to the intestinal lumen via biliary excretion [21]. Further research could elucidate whether the observed similarities between i.p. and oral antibiotic administration are caused by pharmacokinetic properties or by the administration route per se. The current results denote that only the effects of s.c. streptomycin are exclusively systemic.
Figure 5. Relative cholic acid levels (normalized to the median value of the feeding controls) in plasmaof male Crl/Wi(Han) rats in the different control groups (n = 10 per group) on days 7, 14 and 28. Valuesfrom the same animals are connected. p.o., per os (by mouth); i.p., intraperitoneal; s.c., subcutaneous.
3. Discussion
Upon oral and parenteral treatment of male Crl/Wi(Han) rats over 28 days with antibioticspossessing different activity spectra and bioavailabilities, their plasma samples showed significantchanges in metabolite levels compared to the control animals. As vancomycin and streptomycin arenot or only poorly absorbed from the gut upon oral administration, it was assumed that systemicorgan toxicity could be excluded and that the observed changes in the plasma metabolome weremicrobiome-derived. Further, after parenteral administration, these two antibiotics were expected notto enter the gastro-intestinal (GI) tract, and therefore not to directly affect the functionality of the gutmicrobiome. In contrast, roxithromycin is known to be readily absorbed from the gut and to enter thegut after parenteral administration, and was therefore used as a compound that might induce a mixedeffect on the plasma metabolome.
We used a supervised approach (O-PLS-DA) to identify metabolites with a large discriminatorypower between antibiotic treatment and controls (Figure 2). Subsequently, the similarities betweengroups were visualized using HCA (Figure 3). The HCA revealed a large similarity between theoral treatments. The intraperitoneally administered antibiotics clustered more closely with the orallyadministered antibiotics than with s.c. streptomycin. It was expected that intraperitoneal roxithromycinadministration would lead to microbiome-derived effects on the metabolome, as this antibiotic isreported to be excreted from the blood stream into the gut [20]. In line with its non-bioavailability,no excretion was expected for parenterally administered vancomycin. The observed clustering of i.p.vancomycin with the oral treatments and i.p. roxithromycin, however, demonstrates that vancomycininduced some microbiome-derived effects upon i.p. administration. It is hypothesized that partof the intraperitoneal dose was taken up from the body cavity into the blood stream, transportedto the liver and delivered to the intestinal lumen via biliary excretion [21]. Further research couldelucidate whether the observed similarities between i.p. and oral antibiotic administration are causedby pharmacokinetic properties or by the administration route per se. The current results denote thatonly the effects of s.c. streptomycin are exclusively systemic.
Metabolites 2020, 10, 242 10 of 20
The 16S rRNA community analysis shows that orally administrated roxithromycin and vancomycininduce different treatment-related effects, while no clear treatment-related effect of streptomycin wasobserved. Streptomycin is active only against aerobic bacteria, which constitute only a minor part ofthe gut microbiome [22]. The depletion of aerobic bacteria, however, can modify the gut microbiome’scomposition of anaerobes, such as an increased abundancy of Bacteroidacaea and Ruminococcaceae [23].The differences in the gut microbiome’s composition after oral roxithromycin and vancomycintreatment as observed in the current study confirm that these antibiotics have different activity spectra.The different activity spectra of antibiotics provide the opportunity to target undesired species in thegut microbiome. Pre- and probiotics have been proposed as solutions to restore disruptions in thebacterial population. Probiotics can introduce microbial strains that are beneficial for human health.Prebiotics can amend the proliferation of beneficial microbial strains. Combinations of antibiotics,probiotics and prebiotics could possibly provide a balanced approach for the prevention or treatment ofvarious diseases, such as antibiotic-associated diarrhea and colitis, inflammatory bowel disease or acutegastroenteritis, while limiting or reversing the reduction in the number of beneficial microbes [24,25].
The shikimate pathway was discovered to be the biosynthetic pathway present in plants andmicroorganisms that forms the aromatic acids phenylalanine, tyrosine and tryptophan via theirprecursor chorismate [26]. Mammals were considered to lack this pathway, but recent studies haveindicated the formation of metabolites derived from the shikimate pathway by the gut microbiome [27].The products of the shikimate pathway can give rise to indoles, which fulfill many functions in microbialcommunities, such as quorum sensing, intercellular communication and signaling pathways [28].They also play an important role in human health, which will be discussed later in this section.The combination of O-PLS-DA, ANOVA and HCA in the current study identified the downregulationsof plasma tyrosine and phenylalanine, which are products of the shikimate pathway, as discriminantsbetween oral streptomycin treatment and the controls. The third product of the shikimate pathway,tryptophan, was upregulated in the current study, although not significantly. A subgroup of entericbacteria, mainly Bacteroides and Alistipes, expresses tryptophanase activity [29]. Hereby, tryptophanis converted into pyruvate, indole and ammonia. Tryptophanase activity in conventional mice canbe elevated nearly twofold by dosing with tryptophan [30]. Germ-free mice show an increase intryptophan levels [14], which indicates a loss of bacterial tryptophanase activity. It is hypothesizedthat tryptophanase activity is drastically downregulated in the current study, hence, no net result ontryptophan levels can be observed. Furthermore, pyruvate levels are not increased but rather decreasedin most cases. The observed decreases in plasma tyrosine and phenylalanine after oral streptomycintreatment make it plausible that this antibiotic impairs the shikimate pathway.
Hippuric acid (HA) was downregulated after the administration of all three antibiotics via alladministration routes (Figure 3). HA is a well-known urinary metabolite of host-microbial origin.Its precursor benzoate is derived from the microbial degradation of polyphenols from the diet orsynthesized via the shikimate pathway [27,31]. Chorismate can be converted directly into benzoateor with phenylalanine as an intermediate [26]. Benzoate is subsequently conjugated with glycine inthe kidney, liver and intestine to form HA [31–33]. Abnormal concentrations of HA in bodily fluidsare associated with a variety of disease states. For example, morbidly obese and insulin-resistantpatients show a remarkably lower urinary level of HA compared to healthy and lean individuals [34].Decreased HA excretion is also associated with high blood pressure and atherosclerosis in rat models [31].Antibiotic treatment is known to suppress the urinary excretion of HA in rats [35,36]. In germ-freemice, lower plasma levels of HA were observed compared to conventional animals [14]. The strongestHA decrease (up to around fivefold) in the current study was observed after oral antibiotic treatment.Oral antibiotic administration probably resulted in a reduced formation of benzoate and subsequent HAlevels. Moreover, vancomycin and streptomycin can be nephrotoxic [37,38], hence, the HA decreaseafter parenteral administration could (partially) result from an impairment of the conjugation ofbenzoate in the kidney. Ryu and Kim [39] identified an increase in 3-hydroxybutyrate, citrate, creatine,glycine and lactate as sensitive plasma biomarkers for nephrotoxicity in Sprague Dawley rats. In the
Metabolites 2020, 10, 242 11 of 20
current study, plasma creatine levels were upregulated, while 3-hydroxybutyrate and citrate werepredominantly downregulated after the antibiotic treatments. Lactate and glycine levels were notprioritized in the O-PLS-DA, yet sporadic significant upregulations in lactate (data not shown) andglycine were observed, but not at multiple time points. As no clinical signs and no consistent increasesin plasma nephrotoxicity biomarkers were observed, it is assumed that the doses of vancomycin andstreptomycin as administered in the current studies are not nephrotoxic. The authors hypothesize thata small amount of the parenterally administered dose ends up in the intestinal tract via biliary secretionand modulate the microbiome [21,40,41]. Thereby, the observed decrease in HA after both oral andparenteral administration indicates that HA is a sensitive indicator of gut microbial modulation.
Indole-3-acetic acid (IAA), a protein-bound uremic solute, was significantly downregulatedat multiple time points after parenteral roxithromycin and oral streptomycin treatment. IAA isderived either from bacterial indole production or from dietary tryptophan degradation by bothendogenous and bacterial cells. Clostridium sporogenes, Clostridium bartlettii and Escherichia coli are ableto degrade tryptophan into IAA [42]. High IAA plasma levels were previously shown to induce thepro-inflammatory enzyme COX-2 and oxidative stress via the aryl hydrocarbon receptor (AhR) pathwayin the endothelial cells of patients suffering from chronic kidney disease (CKD) and therefore areused for the prediction of mortality and cardiovascular events [43]. From the other indole-derivativesmeasured in the current study, 3-hydroxyindole (with additional 3-indoxylsulfate) is prioritized andsignificantly upregulated after oral roxithromycin treatment at multiple time points. In a previousstudy, 3-indoxylsulfate (IS) was identified only in the serum of conventional and not germ-free mice [14],hence, can be considered to be microbiome-derived. IS is a nephrotoxin that is formed in the liver fromindole. IS accumulates in the blood of patients suffering from CKD [44]. Previously, it was hypothesizedthat treatment with vancomycin and streptomycin decreased the microbiome’s tryptophanase activity.In this way, the plasma concentrations of indole and indole metabolites would be reduced. However,in our study, after oral antibiotic treatment, not many significant downregulations in indole-derivativeswere noticed. Our results indicate that IAA is the most sensitive indole-derivatized indicator of gutmicrobial modulation, as it was clearly downregulated after parenteral roxithromycin treatment.
The most abundant ontology class among the 55 metabolites prioritized in the O-PLS-DA is that ofbile acids. These findings confirm that bile acids are strongly modulated by antibiotic administration.While bile acids were initially recognized as important for the emulsification of hydrophobic compounds,recently the role of bile acids as signaling molecules in glucose, lipid, energy and bile acid metabolismhas become clearer. Bile acids activate FXR to induce fibroblast growth factor (FGF) 15, which ultimatelyleads to inhibition of the transcription of CYP7A1 and CYP8B1, which facilitate the formation of primarybile acids from cholesterol in the liver [8]. The current results demonstrate that oral roxithromycinand vancomycin treatment decreased the levels of primary bile acids, while the taurine conjugatesof primary bile acids were increased with oral administration of all three antibiotics and parenteralroxithromycin administration. It is shown in the literature that taurine-conjugated bile acids dominatethe bile acid profiles in the liver, kidneys, heart and plasma in germ-free rats, while unconjugated bileacids dominate these bile acid profiles in conventional rats [45]. Since in the current study the increasein taurine conjugates is nearly exclusively observed for antibiotics that enter the gut, this is considereda robust indicator of microbiome modulation. The liver secretes taurine or glycine conjugates of thebile acids into the bile canaliculus. In the intestine, these conjugated bile acids are deconjugatedto primary bile acids by bile salt hydrolases (BSH), which are expressed by Bacteroides, Clostridium,Lactobacillus, Bifidobacterium and Listeria species. Antibiotic-induced disturbance of this deconjugationpathway would lead to the accumulation of conjugated bile acids and a decrease in primary bile acids.Secondary bile acids are formed from primary bile acids by a wide range of microbial reactions [46].Hence, reduced levels of primary bile acids would lead to reduced levels of secondary bile acids, whichis confirmed by the current study. As the decreases in secondary bile acids were typically strongerafter oral than after parenteral treatment, they seem very sensitive to alterations in the microbiome.Studies have shown that tauromuricholic acid is a potent antagonist that inhibits FXR induction of
Metabolites 2020, 10, 242 12 of 20
FGF15 in the ileum [47]. Thereby, not only does the lack of microbial deconjugation by BSH lead tothe increased levels of primary bile acids, but also the increased levels of tauromuricholic acid lead toincreased primary bile acid synthesis via the inhibition of FXR.
Profound variability in the bile acid levels both between and within animals was observed(Figures 4 and 5). The technical variability (i.e., variability introduced by the analytical measurement)in the current study was determined to be about 10% and therefore much lower than the observedbiological variability. Biological variability in bile acid levels is a well-known phenomenon. Bile acidsare known to undergo cyclic daily variation in both rodents [48,49] and humans [50]. Cyclic dailyvariation is strongly influenced by the circadian rhythm, an endogenously generated rhythm witha period close to 24 h which is tightly coupled to the light-dark cycle and food intake [51]. Possibly,the overnight fasting in the current experiment disrupted the food intake and as a consequencethe bile acid metabolism, which might explain part of the observed variability between and withinanimals. Bile acid biosynthesis predominantly takes place in hepatic cells via the multistep oxidation ofcholesterol. Prior to secretion into the bile canaliculus, bile acids are conjugated by addition of taurineor glycine. After secretion in the intestinal lumen, bile salts are modified by gut bacteria and recycledvia enterohepatic circulation. Therefore, any change in the production of primary bile acids will affecttheir intestinal concentration, which in turn affects the production of secondary bile acids. As analtered bile acid pool is implicated in various disease states [12,13], the current study demonstrates theneed to better understand the influence of environmental factors on the gut microbiome–liver axis.
4. Materials and Methods
Animal handling, treatment and clinical examinations were performed according to theOrganisation for Economic Co-operation and Development (OECD) guideline 407. Briefly, Wistar rats(CrI/WI(Han)) were supplied by Charles River, Germany, and were approximately 70 days old at thebeginning of the studies. The animals were kept in enriched cages at a temperature of 20 to 24 ◦C,a relative humidity of 30% to 70%, 15 air changes per hour and a 12 h light/12 h dark cycle. Ground Klibamouse/rat maintenance diet was supplied by Provimi Kliba SA, Kaiseraugst, Switzerland. The diet anddrinking water were available ad libitum and regularly assayed for chemical contaminants and thepresence of microorganisms. Food and water intake were restricted before blood sampling. Metaboliteprofiling of plasma samples was performed for all control and treated animals. On study day 28, feceswere sampled from the animals that received oral antibiotic treatment plus the corresponding controls,and the gut microbial community was analyzed.
4.1. Treatment of the Animals
The antibiotics were administered daily for 28 days to treatment groups consisting of five maleanimals. Dose levels, routes of administration and the form of preparation of the antibiotics aresummarized in Table 2. A feeding control group was included in each study (10 males). This manuscriptcombines data from multiple previously performed unpublished studies, hence, two different parenteraladministration routes were used, i.e., intraperitoneal (i.p.) and subcutaneous (s.c.). Besides feedingcontrols, vehicle controls for i.p., s.c. and gavage administration were tested (n = 5 per group) to examinethe effect of the vehicle and the administration procedure on the plasma metabolome. The feedingcontrols served as a common reference present in all studies and were used to normalize betweenstudies and the different vehicle controls and treatments (this is required for the semi-quantitativemetabolome analysis to account for general study-to-study differences, data not shown). The controlgroups are summarized in Table 3. The i.p. and s.c. vehicle control groups were injected daily with asaline solution. The control animals in the gavage group received 0.5% carboxymethylcellulose (CMC)Tylose CB30000 in drinking water via gavage. The treated and vehicle control animals were normalizedto feeding controls according to time point and study and compared. In former studies, the metabolomeof control groups with different administration routes had been compared. Rats gavaged with 0.5%CMC had less than 5% significantly altered metabolites compared to diet controls (Welch t test, p < 0.05).
Metabolites 2020, 10, 242 13 of 20
This is regarded as an incidental change, which did not interfere with antibiotic-related effects on thetreatment groups in our study.
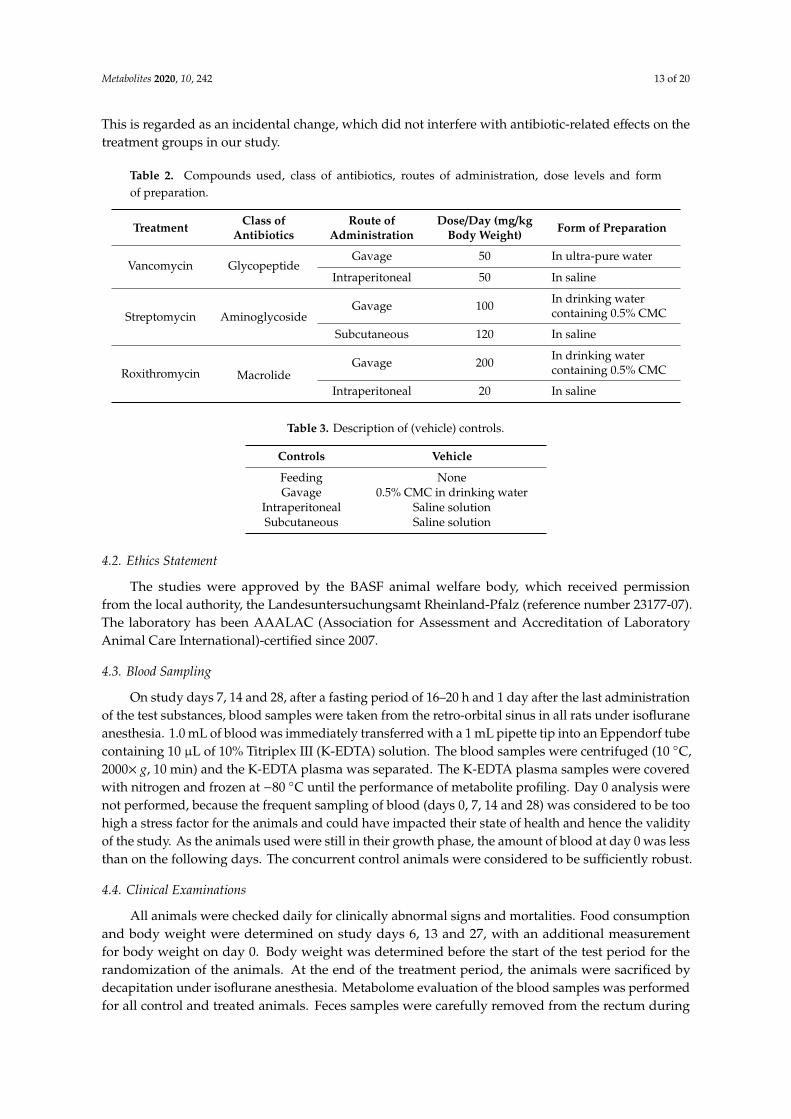
Table 2. Compounds used, class of antibiotics, routes of administration, dose levels and formof preparation.
Treatment Class ofAntibiotics
Route ofAdministration
Dose/Day (mg/kgBody Weight) Form of Preparation
Vancomycin GlycopeptideGavage 50 In ultra-pure water
Intraperitoneal 50 In saline
Streptomycin AminoglycosideGavage 100 In drinking water
containing 0.5% CMC
Subcutaneous 120 In saline
Roxithromycin MacrolideGavage 200 In drinking water
containing 0.5% CMC
Intraperitoneal 20 In saline
Table 3. Description of (vehicle) controls.
Controls Vehicle
Feeding NoneGavage 0.5% CMC in drinking water
Intraperitoneal Saline solutionSubcutaneous Saline solution
4.2. Ethics Statement
The studies were approved by the BASF animal welfare body, which received permissionfrom the local authority, the Landesuntersuchungsamt Rheinland-Pfalz (reference number 23177-07).The laboratory has been AAALAC (Association for Assessment and Accreditation of LaboratoryAnimal Care International)-certified since 2007.
4.3. Blood Sampling
On study days 7, 14 and 28, after a fasting period of 16–20 h and 1 day after the last administrationof the test substances, blood samples were taken from the retro-orbital sinus in all rats under isofluraneanesthesia. 1.0 mL of blood was immediately transferred with a 1 mL pipette tip into an Eppendorf tubecontaining 10 µL of 10% Titriplex III (K-EDTA) solution. The blood samples were centrifuged (10 ◦C,2000× g, 10 min) and the K-EDTA plasma was separated. The K-EDTA plasma samples were coveredwith nitrogen and frozen at −80 ◦C until the performance of metabolite profiling. Day 0 analysis werenot performed, because the frequent sampling of blood (days 0, 7, 14 and 28) was considered to be toohigh a stress factor for the animals and could have impacted their state of health and hence the validityof the study. As the animals used were still in their growth phase, the amount of blood at day 0 was lessthan on the following days. The concurrent control animals were considered to be sufficiently robust.
4.4. Clinical Examinations
All animals were checked daily for clinically abnormal signs and mortalities. Food consumptionand body weight were determined on study days 6, 13 and 27, with an additional measurementfor body weight on day 0. Body weight was determined before the start of the test period for therandomization of the animals. At the end of the treatment period, the animals were sacrificed bydecapitation under isoflurane anesthesia. Metabolome evaluation of the blood samples was performedfor all control and treated animals. Feces samples were carefully removed from the rectum during
Metabolites 2020, 10, 242 14 of 20
necropsy on day 28 after a fasting period of 16–20 h and one day after the last administration of thetest substances. The samples were collected in pre-cooled (dry-ice) vials, immediately snap-frozen inliquid nitrogen and stored at −80 ◦C until the community analysis was performed.
4.5. Metabolite Profiling
Broad Profiling
Mass-spectrometry-based broad metabolite profiling of the K-EDTA plasma sampleswas performed by GC-MS (gas chromatography-mass spectrometry) and LC-MS/MS (liquidchromatography-tandem mass spectrometry) techniques as described in detail in previous work [52–55]and below.
Online SPE–LC–MS/MS (solid phase extraction–LC–MS/MS; SPARK Holland Symbiosis) wasapplied for the determination of catecholamine and steroid hormone levels. Proteins were removedfrom 60 µL K-EDTA plasma samples by precipitation using 200 µL acetonitrile. Subsequently, polarand non-polar fractions were separated for both GC-MS and LC-MS/MS analysis by adding water anda mixture of ethanol and dichloromethane (1:2, v:v). For the GC-MS analysis (CTC GC PAL, Agilent6890 GC gas chromatograph, 5973 MSD mass spectrometer), the non-polar fraction was treated withmethanol under acidic conditions to yield the fatty acid methyl esters derived from both free fattyacids and hydrolyzed complex lipids. The non-polar and polar fractions were further derivatizedwith O-methyl-hydroxylamine hydrochloride and pyridine to convert oxo-groups to O-methyl-oximes,and subsequently with a silylating agent, before analysis [56]. For the LC-MS analysis (Agilent 1100,AB Sciex 4000), both fractions were reconstituted in appropriate solvent mixtures. High-performanceliquid chromatography (HPLC) was performed by gradient elution on reversed-phased separationcolumns. Mass spectrometric detection technology was applied, allowing targeted and high-sensitivityMRM (Multiple Reaction Monitoring) profiling in parallel to a full-screen analysis as described inpatent WO2003073464 [57]. For GC-MS the acquisition in scan mode m/z 15–600 for polar compoundsand m/z 40–600 for lipid compounds was applied. For LC-MS, MRM and a Q3 scan of m/z 100–1000were used. MRM was determined for all analytes using solutions of the authentic standard.
GC-MS conditions: CTC GC PAL, Agilent 6890 GC gas chromatograph, 5973 MSD massspectrometer, gradient: 70 to 340 ◦C and carrier gas: helium. For polar compounds a J&W DB-XLBand for lipid compounds an Agilent HP-5MS were used. Both columns provide 30 m length, an innerdiameter (ID) of 0.25 mm and 0.25 µm film thickness.
LC-MS conditions: an LC-MS system consisting of an Agilent 1100 HPLC system coupled to anAB Sciex API 4000 mass spectrometer equipped with an ESI ion source running in negative ionizationmode at a source temperature of 600 ◦C and ion spray voltage of −4000 V for acquiring data afterthe injection of 10 µL polar compounds containing extract to be chromatographically separated ona C18 reversed-phased column (Grom-Sil 80 ODS7 PH, 4 µm, 60 × 2.0 mm, 5 ◦C) and a gradientelution profile (0.0 min: 100% A; 0.5 min: 100% A; 3.5 min: 0% A; 4.5 min: 0% A; 4.6 min, 100% A;6.0 min: 100% A) running at 200 µL/min where solvent A consisted of deionized water with 0.1 Mammonium formate (99/1; w/w) and solvent B consisted of acetonitrile with 0.1 M ammonium formate(99/1; w/w). The LC-MS system for the analysis of lipid compounds consisted likewise of an Agilent1100 HPLC system coupled to an AB Sciex API 4000 mass spectrometer equipped with an ESI ionsource, but running in positive ionization mode at a source temperature of 400 ◦C and ion sprayvoltage of +5500 V for acquiring data after the injection of 5 µL of lipid compounds containing extractto be chromatographically separated on a C18 reversed-phased column (Thermo Betasil C18, 5 µm,50 × 2.1 mm, 35 ◦C) and a gradient elution profile (0.0 min: 100% A; 0.5 min: 60% A; 5.5 min: 0% A;6.0 min: 0% A; 6.1 min: 100% A; 7.0 min: 100% A) running at 200 µL/min where solvent A consisted ofmethanol, deionized water, 2-methoxy-2-methylpropan (MTBE) and formic acid (100/25/5/0.6; w:w:w:w)and solvent B consisted of MTBE, methanol, deionized water and formic acid (100/7.7/1.6/0.5; w:w:w:w).
Metabolites 2020, 10, 242 15 of 20
For GC-MS and LC-MS/MS profiling, data were normalized to the median of reference sampleswhich were derived from a pool formed from aliquots of all samples to account for inter- andintra-instrumental variation. In plasma, 274 semiquantitative metabolites could be analyzed usingthe single peak signal of the respective metabolite and a normalization strategy according to thepatent WO2007012643A1 [58] resulting in ratio values representing the metabolite change in treatedversus control animals. 248 plasma analytes were chemically identified and 26 were structurallyunknown. This list of 274 metabolites contains metabolites measured more than once among thedifferent analytical methods (e.g., LC- and GC-MS, lipid and polar phases). These metabolites wereused to confirm the validity of the measurements. Six metabolites were removed due to many missingvalues. The duplicate-free list from broad profiling included 196 metabolites.
4.6. Targeted Bile Acid Analysis
The bile acid concentration of plasma samples obtained from orally treated rats was measured asdescribed by Behr and Slopianka [59]. The bile acid analysis of samples obtained from parenterallytreated, feeding and vehicle control rats was performed with ultra-high-performance liquidchromatography-electrospray ionization-MS/MS (UHPLC–ESI-MS/MS) consisting of a Spark HollandUHPLC system coupled with an SCIEX 5500 Triple Quad™ LC-MS/MS system equipped with an ESIion source, which enabled the measurement of a total number of 22 bile acids. To ensure accuracyand precision, the method provided 7 calibration standards, a mixture of 9 isotope-labeled internalstandards, and a quality control sample. A total of 10 µL of plasma was added together with 10 µLof internal standards mixture onto filter spots suspended in the wells of a 96-well filter plate (PALLAcroPrep, PTFE 0.2 µm) fixed on top of a deep-well plate and extracted with 100 µL methanol byshaking at 600 rpm for 20 min on an Eppendorf ThermoMixer C (Eppendorf AG, Hamburg). The elutionof the methanol extracts was performed by centrifugation (5700 rpm, 5 min) into the lower receivingdeep-well plate, which was then detached from the upper filter plate. After adding 60 µL Milli-Q®
water to the extracts and shaking briefly (600 rpm, 5 min), the 96-well plate containing the sampleswas analyzed by LC-MS/MS. All target isobaric bile acids were baseline-separated under UHPLCconditions based on a previously described method [60]. Briefly, UHPLC systems were used at a flowrate of 0.7–1 mL/min. Mobile phase A was water with 0.02% formic acid and 10 mM ammonium acetateand mobile phase B was 30% (v/v) acetonitrile/methanol with 0.02% formic acid and 10 mM ammoniumacetate. The gradient program initially started at 35% B, increased to 100% B in 3.5 min, was held at100% B for 0.5 min, decreased to 35% B and was held for 1.0 min, enabling a short runtime of 5 min.Chromatographic separation was performed with a proprietary reversed-phased UHPLC analyticalcolumn (Ascentis Express C18 2.7 µm 50 × 2.1 mm) kept at 50 ◦C. An injection volume of 5 µL wasused. Mass spectrometric detection was accomplished with electrospray ionization in negative ionmode. Two MRM transitions were used for each target bile acid for quantitative evaluation; 22 bileacids were measured. Bile acids with more than 50% missing values were discarded from furtheranalysis, resulting in a final list of 18 bile acids.
4.7. Community Analysis
On study day 28, feces were sampled from the animals which received oral antibiotic treatment.DNA was isolated from the fecal samples using an InnuPREP stool DNA Kit (Analytik Jena, Jena,Germany) according to the manufacturer’s instructions. Based on observations made during the process,the incubation temperature for the cells’ lysis was lowered to 75 ◦C. DNA yield and integrity were assessedusing a Nanodrop. Samples were sent to IMGM® laboratories (Martinsried, Germany) for polymerasechain reaction (PCR), library preparation and sequencing. DNA was amplified using 16S V3–V4 primers(Bakt_341F: 5′-CCTACGGGNGGCWGCAG-3′ and Bakt_805r: 5′-GACTACHVGGGTATCTAATCC-3′).Sequencing was performed on the IlluminaMiSeq® next-generation sequencing system (Illumina Inc.,San Diego, CA, USA). Signals were processed to FASTQ files and the resulting 2 × 250 bp reads weredemultiplexed using the MiSeq® Reporter software version 2.5.1.3.

Metabolites 2020, 10, 242 16 of 20
4.8. Bioinformatics
Forward and reverse primers corresponding to the sequences 5′CCTACGGGNGGCWGCAG-3′
and 5′-GACTACHVGGGTATCTAATCC-3′ were trimmed from the raw reads using Cutadapt [61]and forward/reverse read pairs that did not contain both primers were removed. A table of ampliconsequence variants (ASV) was obtained by denoising using QIIME2’s (Quantitative Insights IntoMicrobial Ecology) “dada2 denoise-single” command [62,63]. ASVs that did not have a count of atleast 1 in 2 or more samples were excluded from further analysis. Counts were normalized using therelative rank. A PCoA was computed based on the Bray distance matrix at the taxonomic family level.The plot was made using the RAM (R for Amplicon-Sequencing-Based Microbial-Ecology) package.More details can be found in the R markdown file in the Supplementary Materials.
4.9. Statistics
The data were analyzed by univariate and multivariate statistical methods. ANOVA was appliedusing the R package “nlme” with treatment (the combination of substance and application route)and day as fixed and the animal-identifier as random factor to compare metabolite levels betweentreatments with respective controls and days [64]. Hereby, ratios were calculated that are referred toas “relative abundance in plasma.” Whenever “significantly” is written, “statistically significantly” ismeant. For the metabolite data, Principal Component Analysis (PCA) and O-PLS-DA analyses wereperformed using the commercial software Simca (version 15, Sartorius-Stedim Data Analytics AB,Umeå, Sweden). For multivariate analysis, log10-transformed, feeding control-normalized metabolitevalues were used as input. Metabolites and samples with >50% missing values were discarded.The average of all samples was centered, i.e., set to 0. Scaling to unit variance was applied, i.e.,the standard deviation of all samples was set to 1. For O-PLS-DA, six separate models (3 antibioticstimes 2 application routes) were calculated. In each case, all controls (irrespective of the applicationroute) were defined as the first group and the treatment (antibiotic plus application route) as the secondgroup. This was done to ensure that the model would differentiate the treatment from all the controls.In order to have a higher power, data from all three days were combined. Hierarchical clusteringanalysis (HCA) was done in TIBCO Spotfire (version 6, TIBCO, Palo Alto, CA, USA) using t-valuesderived from ANOVA as input with the following settings (for both row and column dendrograms):Ward’s clustering method with half-square Euclidean as distance measure, input average rank asordering weight and Z-score normalization.
5. Conclusions
The downregulation of HA following both oral and parenteral administration of all three antibioticsindicate that HA is a sensitive indicator of microbiome modulation, as a small amount of the antibiotic isassumed to be secreted via the bile in the gut after parenteral administration. Furthermore, the bile acidpool is very sensitive to antibiotic administration. Besides antibiotic-induced depletion of microbialspecies responsible for the conversion of bile acids, potential feedback mechanisms regarding bileacid production might alter the plasma metabolome. Bile acid levels show large variability withinand between animals. Reduction of this variability, e.g., by the development of standardized in vivoand in vitro models, would increase the statistical quality of the bile acid data. Revealing meaningfulinteractions between the microbiome and bile acid metabolism will offer new opportunities for bettertreatment and prevention of microbiome-associated diseases, as well as improved evaluations of theinfluence of environmental factors on this system.
Supplementary Materials: The following are available online at http://www.mdpi.com/2218-1989/10/6/242/s1,Figure S1: PCA of treatment effect of vancomycin, streptomycin and roxithromycin on the plasma metabolome ofmale rats, Figure S2: O-PLS-DA loading plots; Table S1: ANOVA results for the full metabolite list.
Author Contributions: Conceptualization, C.B. and B.v.R.; data curation, T.W. and V.H.; formal analysis, P.T. andV.H.; methodology, V.H., M.S. and T.W.; writing—original draft preparation, V.d.B.; writing—review and editing,

Metabolites 2020, 10, 242 17 of 20
B.v.R. and S.S.; visualization: P.T. and V.H.; supervision, S.S. and K.B. All authors have read and agreed to thepublished version of the manuscript.
Funding: This research received no external funding.
Acknowledgments: We would like to thank Irmgard Weber for her skillful assistance in taking plasma samples.We would like to thank Varun Giri for his help with the analysis of the 16S rRNA data.
Conflicts of Interest: The authors declare no conflict of interest, there is no connection between BASF SE and thesubject of this manuscript.
Abbreviations
AAALAC Association for Assessment and Accreditation of Laboratory AnimalCare International
CKD chronic kidney diseaseCMC carboxymethylcelluloseDa DaltonESI electrospray ionisationFGF fibroblast growth factorFXR farnesoid X receptorGC gas chromatographyGCDCA glycochenodeoxycholic acidHA hippuric acidHCA hierarchical clustering analysisi.p. intraperitonealIAA indole-3-acetic acidIS 3-indoxylsulfateID inner diameterLC liquid chromatographyMS mass spectrometryMRM multiple reaction monitoringMTBE 2-Methoxy-2-methylpropanOECD Organisation for Economic Co-operation and DevelopmentO-PLS-DA orthogonal projection of latent structuresp.o. per os, by mouthPCA principal component analysisPCoA principal coordinate analysisPCR Polymerase chain reactions.c. subcutaneousSPE solid phase extractionTCA taurocholic acidTCDCA taurochenodeoxycholic acidTGR5 trans-membrane-bound G-protein-coupled receptorUHPLC-ESI ultra-high-performance liquid chromatography-electrospray ionizationVDR vitamin D receptorQIIME Quantitative Insights Into Microbial Ecologyα-MCA alpha-muricholic acid
References
1. Zhang, Y.-J.; Li, S.; Gan, R.; Zhou, T.; Xu, N.-P.; Li, H.-B. Impacts of Gut Bacteria on Human Health andDiseases. Int. J. Mol. Sci. 2015, 16, 7493–7519. [CrossRef] [PubMed]
2. Xu, J.; Gordon, J.I. Honor thy symbionts. Proc. Natl. Acad. Sci. USA 2003, 100, 10452–10459. [CrossRef][PubMed]
3. Behr, C.; Kamp, H.; Fabian, E.; Krennrich, G.; Mellert, W.; Peter, E.; Strauss, V.; Walk, T.; Rietjens, I.M.C.M.; VanRavenzwaay, B. Gut microbiome-related metabolic changes in plasma of antibiotic-treated rats. Arch. Toxicol.2017, 91, 3439–3454. [CrossRef] [PubMed]
Metabolites 2020, 10, 242 18 of 20
4. Lindon, J.; Holmes, E.; Bollard, M.E.; Stanley, E.G.; Nicholson, J. Metabonomics technologies and theirapplications in physiological monitoring, drug safety assessment and disease diagnosis. Biomarkers 2004, 9,1–31. [CrossRef]
5. Ramirez, T.; Daneshian, M.; Kamp, H.; Bois, F.; Clench, M.R.; Coen, M.; Donley, B.; Fischer, S.M.; Ekman, E.R.;Fabian, E.; et al. Metabolomics in Toxicology and Preclinical Research. ALTEX 2013, 30, 209–225. [CrossRef][PubMed]
6. Fiorucci, S.; Mencarelli, A.; Palladino, G.; Cipriani, S. Bile-acid-activated receptors: Targeting TGR5 andfarnesoid-X-receptor in lipid and glucose disorders. Trends Pharmacol. Sci. 2009, 30, 570–580. [CrossRef]
7. Begley, M.; Hill, C.; Gahan, C.G. Bile Salt Hydrolase Activity in Probiotics. Appl. Environ. Microbiol. 2006, 72,1729–1738. [CrossRef]
8. Chiang, J.Y. Bile acid metabolism and signaling in liver disease and therapy. Liver Res. 2017, 1, 3–9. [CrossRef]9. Pandak, W.M.; Kakiyama, G. The acidic pathway of bile acid synthesis: Not just an alternative pathway.
Liver Res. 2019, 3, 88–98. [CrossRef]10. Ridlon, J.M.; Kang, D.-J.; Hylemon, P.B. Bile salt biotransformations by human intestinal bacteria. J. Lipid Res.
2005, 47, 241–259. [CrossRef]11. Chiang, J.Y. Bile acids: Regulation of synthesis. J. Lipid Res. 2009, 50, 1955–1966. [CrossRef] [PubMed]12. Staley, C.; Weingarden, A.R.; Khoruts, A.; Sadowsky, M.J. Interaction of gut microbiota with bile acid
metabolism and its influence on disease states. Appl. Microbiol. Biotechnol. 2016, 101, 47–64. [CrossRef][PubMed]
13. Kalhan, S.C.; Guo, L.; Edmison, J.; Dasarathy, S.; McCullough, A.J.; Hanson, R.W.; Milburn, M. Plasmametabolomic profile in nonalcoholic fatty liver disease. Metabolism 2010, 60, 404–413. [CrossRef] [PubMed]
14. Wikoff, W.R.; Anfora, A.T.; Liu, J.; Schultz, P.G.; Lesley, S.A.; Peters, E.C.; Siuzdak, G. Metabolomics analysisreveals large effects of gut microflora on mammalian blood metabolites. Proc. Natl. Acad. Sci. USA 2009, 106,3698–3703. [CrossRef]
15. Shoaie, S.; Ghaffari, P.; Kovatcheva-Datchary, P.; Mardinoglu, A.; Sen, P.; Pujos-Guillot, E.; De Wouters, T.;Juste, C.; Rizkalla, S.; Chilloux, J.; et al. Quantifying Diet-Induced Metabolic Changes of the Human GutMicrobiome. Cell Metab. 2015, 22, 320–331. [CrossRef]
16. Visconti, A.; Le Roy, C.I.; Rosa, F.; Rossi, N.; Martin, T.C.; Mohney, R.P.; Li, W.; De Rinaldis, E.; Bell, J.T.;Venter, J.C.; et al. Interplay between the human gut microbiome and host metabolism. Nat. Commun. 2019,10, 4505–4510. [CrossRef]
17. Brown, S.A.; Riviere, J.E. Comparative pharmacokinetics of aminoglycoside antibiotics. J. Vet. Pharmacol. Ther.1991, 14, 1–35. [CrossRef]
18. Musther, H.; Olivares-Morales, A.; Hatley, O.J.; Liu, B.; Rostami-Hodjegan, A. Animal versus human oraldrug bioavailability: Do they correlate? Eur. J. Pharm. Sci. 2013, 57, 280–291. [CrossRef]
19. Geraci, J.; Heilman, F.; Nichols, D.; Wellman, W.; Ross, G.; Dorothy, R. Some laboratory and clinicalexperiences with a new antibiotic, vancomycin. Proc. StaffMeet. Mayo Clin. 1956, 31, 564–582.
20. Arimori, K.; Miyamoto, S.; Fukuda, K.; Nakamura, C.; Nakano, M. Characteristic difference in gastrointestinalexcretion of clarithromycin and roxithromycin. Biopharm. Drug Dispos. 1998, 19, 433–438. [CrossRef]
21. Currie, B.P.; Lemos-Filho, L. Evidence for Biliary Excretion of Vancomycin into Stool duringIntravenous Therapy: Potential Implications for Rectal Colonization with Vancomycin-Resistant Enterococci.Antimicrob. Agents Chemother. 2004, 48, 4427–4429. [CrossRef]
22. Turnbaugh, P.J.; Ley, R.E.; Hamady, M.; Fraser, C.M.; Knight, R.; Gordon, J.I. The Human Microbiome Project.Nature 2007, 449, 804–810. [CrossRef]
23. Lichtman, J.S.; Ferreyra, J.A.; Ng, K.M.; Smits, S.A.; Sonnenburg, J.L.; Elias, J.E. Host-Microbiota Interactionsin the Pathogenesis of Antibiotic-Associated Diseases. Cell Rep. 2016, 14, 1049–1061. [CrossRef]
24. Preidis, G.; Versalovic, J. Targeting the Human Microbiome with Antibiotics, Probiotics, and Prebiotics:Gastroenterology Enters the Metagenomics Era. Gastroenterology 2009, 136, 2015–2031. [CrossRef]
25. Hungin, A.P.S.; Mitchell, C.R.; Whorwell, P.; Mulligan, C.; Cole, O.; Agréus, L.; Fracasso, P.; Lionis, C.;Mendive, J.; De Foy, J.-M.P.; et al. Systematic review: Probiotics in the management of lower gastrointestinalsymptoms—An updated evidence-based international consensus. Aliment. Pharmacol. Ther. 2018, 47,1054–1070. [CrossRef]
26. Herrmann, K.M. The shikimate pathway: Early steps in the biosynthesis of aromatic compounds. Plant Cell1995, 7, 907. [CrossRef]

Metabolites 2020, 10, 242 19 of 20
27. Paley, E.L. Diet-Related Metabolic Perturbations of Gut Microbial Shikimate Pathway-Tryptamine-tRNAAminoacylation-Protein Synthesis in Human Health and Disease. Int. J. Tryptophan Res. 2019, 12. [CrossRef]
28. Gertsman, I.; Gangoiti, J.A.; Nyhan, W.L.; Barshop, B. Perturbations of tyrosine metabolism promote theindolepyruvate pathway via tryptophan in host and microbiome. Mol. Genet. Metab. 2015, 114, 431–437.[CrossRef]
29. Devlin, A.S.; Marcobal, A.; Dodd, D.; Nayfach, S.; Plummer, N.; Meyer, T.; Pollard, K.S.; Sonnenburg, J.L.;Fischbach, M.A. Modulation of a Circulating Uremic Solute via Rational Genetic Manipulation of the GutMicrobiota. Cell Host Microbe 2016, 20, 709–715. [CrossRef]
30. Botsford, J.L.; Demoss, R.D. Escherichia coli Tryptophanase in the Enteric Environment. J. Bacteriol. 1972,109, 74–80. [CrossRef]
31. Lees, H.J.; Swann, J.R.; Wilson, I.D.; Nicholson, J.; Holmes, E. Hippurate: The Natural History of aMammalian–Microbial Cometabolite. J. Proteome Res. 2013, 12, 1527–1546. [CrossRef]
32. Poon, K.; Pang, K.S. Benzoic acid glycine conjugation in the isolated perfused rat kidney. Drug Metab. Dispos.1995, 23.
33. Strahl, N.R.; Barr, W.H. Intestinal Drug Absorption and Metabolism III: Glycine Conjugation andAccumulation of Benzoic Acid in Rat Intestinal Tissue. J. Pharm. Sci. 1971, 60, 278–281. [CrossRef]
34. Calvani, R.; Capuani, G.; Miccheli, A.T.; Puccetti, C.; Delfini, M.; Iaconelli, A.; Nanni, G.; Mingrone, G. Gutmicrobiome-derived metabolites characterize a peculiar obese urinary metabotype. Int. J. Obes. 2010, 34,1095–1098. [CrossRef]
35. Williams, R.; Eyton-Jones, H.W.; Farnworth, M.J.; Gallagher, R.; Provan, W.M. Effect of intestinal microfloraon the urinary metabolic profile of rats: A 1 H-nuclear magnetic resonance spectroscopy study. Xenobiotica2002, 32, 783–794. [CrossRef]
36. Zheng, X.; Xie, G.; Zhao, A.; Zhao, L.; Yao, C.; Chiu, N.H.L.; Zhou, Z.; Bao, Y.; Jia, W.; Nicholson, J.; et al.The Footprints of Gut Microbial–Mammalian Co-Metabolism. J. Proteome Res. 2011, 10, 5512–5522. [CrossRef]
37. Marsot, A.; Boulamery, A.; Bruguerolle, B.; Simon, N. Vancomycin. Clin. Pharmacokinet. 2012, 51, 1–13.[CrossRef]
38. Motta, I.; Calcagno, A.; Bonora, S. Pharmacokinetics and pharmacogenetics of anti-tubercular drugs: A toolfor treatment optimization? Expert Opin. Drug Metab. Toxicol. 2017, 14, 59–82. [CrossRef]
39. Ryu, S.H.; Kim, J.W.; Yoon, D.; Kim, S.; Kim, K.-B. Serum and urine toxicometabolomics followinggentamicin-induced nephrotoxicity in male Sprague-Dawley rats. J. Toxicol. Environ. Heal. Part A 2018, 81,408–420. [CrossRef]
40. Harrison, P.M.; Stewart, G.T. Excretion of Antibiotics in Bile. Br. J. Pharmacol. Chemother. 1961, 17, 420–423.[CrossRef]
41. Robinson, H.J. Streptomycin and Streptothricin: The Absorption, Excretion, and Chemotherapeutic Properties.Ann. N. Y. Acad. Sci. 1946, 48, 119–142. [CrossRef]
42. Ramezani, A.; Massy, Z.A.; Meijers, B.; Evenepoel, P.; Vanholder, R.; Raj, D.S. Role of the gut microbiome inuremia: A potential therapeutic target. Am. J. Kidney Dis. 2016, 67, 483–498. [CrossRef] [PubMed]
43. Dou, L.; Sallée, M.; Cerini, C.; Poitevin, S.; Gondouin, B.; Jourde-Chiche, N.; Fallague, K.; Brunet, P.; Calaf, R.;Dussol, B.; et al. The Cardiovascular Effect of the Uremic Solute Indole-3 Acetic Acid. J. Am. Soc. Nephrol.2014, 26, 876–887. [CrossRef] [PubMed]
44. Deguchi, T.; Ohtsuki, S.; Otagiri, M.; Takanaga, H.; Asaba, H.; Mori, S.; Terasaki, T. Major role of organic aniontransporter 3 in the transport of indoxyl sulfate in the kidney. Kidney Int. 2002, 61, 1760–1768. [CrossRef]
45. Swann, J.R.; Want, E.J.; Geier, F.M.; Spagou, K.; Wilson, I.D.; Sidaway, J.E.; Nicholson, J.; Holmes, E. Systemicgut microbial modulation of bile acid metabolism in host tissue compartments. Proc. Natl. Acad. Sci. USA2010, 108, 4523–4530. [CrossRef] [PubMed]
46. Jia, W.; Xie, G.; Jia, W. Bile acid–microbiota crosstalk in gastrointestinal inflammation and carcinogenesis.Nat. Rev. Gastroenterol. Hepatol. 2017, 15, 111–128. [CrossRef] [PubMed]
47. Inagaki, T.; Moschetta, A.; Lee, Y.-K.; Peng, L.; Zhao, G.; Downes, M.; Yu, R.T.; Shelton, J.M.; Richardson, J.A.;Repa, J.; et al. Regulation of antibacterial defense in the small intestine by the nuclear bile acid receptor.Proc. Natl. Acad. Sci. USA 2006, 103, 3920–3925. [CrossRef] [PubMed]
48. Noshiro, M.; Nishimoto, M.; Okuda, K. Rat liver cholesterol 7 alpha-hydroxylase. Pretranslational regulationfor circadian rhythm. J. Boil. Chem. 1990, 265, 10036–10041.
Metabolites 2020, 10, 242 20 of 20
49. Nakano, A.; Tietz, P.S.; LaRusso, N.F. Circadian rhythms of biliary protein and lipid excretion in rats. Am. J.Physiol. Liver Physiol. 1990, 258, G653–G659. [CrossRef]
50. Gälman, C.; Angelin, B.; Rudling, M. Bile Acid Synthesis in Humans Has a Rapid Diurnal Variation That IsAsynchronous with Cholesterol Synthesis. Gastroenterol. 2005, 129, 1445–1453. [CrossRef]
51. Challet, E.; Caldelas, I.; Graff, C.; Pevet, P. Synchronization of the Molecular Clockwork by Light- andFood-Related Cues in Mammals. Boil. Chem. 2003, 384. [CrossRef]
52. Kamlage, B.; Maldonado, S.G.; Bethan, B.; Peter, E.; Schmitz, O.; Liebenberg, V.; Schatz, P. Quality MarkersAddressing Preanalytical Variations of Blood and Plasma Processing Identified by Broad and TargetedMetabolite Profiling. Clin. Chem. 2014, 60, 399–412. [CrossRef] [PubMed]
53. Van Ravenzwaay, B.; Cunha, G.C.-P.; Leibold, E.; Looser, R.; Mellert, W.; Prokoudine, A.; Walk, T.; Wiemer, J.The use of metabolomics for the discovery of new biomarkers of effect. Toxicol. Lett. 2007, 172, 21–28.[CrossRef]
54. Van Ravenzwaay, B.; Cunha, G.C.-P.; Strauss, V.; Wiemer, J.; Leibold, E.; Kamp, H.; Walk, T.; Mellert, W.;Looser, R.; Prokoudine, A.; et al. The individual and combined metabolite profiles (metabolomics) ofdibutylphthalate and di(2-ethylhexyl)phthalate following a 28-day dietary exposure in rats. Toxicol. Lett.2010, 198, 159–170. [CrossRef]
55. Van Ravenzwaay, B.; Herold, M.; Kamp, H.; Kapp, M.; Fabian, E.; Looser, R.; Krennrich, G.; Mellert, W.;Prokoudine, A.; Strauss, V.; et al. Metabolomics: A tool for early detection of toxicological effects and anopportunity for biology based grouping of chemicals—From QSAR to QBAR. Mutat. Res. Toxicol. Environ.Mutagen. 2012, 746, 144–150. [CrossRef] [PubMed]
56. Roessner, U.; Wagner, C.; Kopka, J.; Trethewey, R.N.; Willmitzer, L. Simultaneous analysis of metabolites inpotato tuber by gas chromatography-mass spectrometry. Plant J. 2000, 23, 131–142. [CrossRef] [PubMed]
57. Walk, T.; Dostler, M. Mass Spectrometry Method for Analyzing Mixtures of Substances. U.S. Patent No.7,196,323, 27 March 2007.
58. Walk, T.B.; Looser, R.; Bethan, B.; Herold, M.M.; Kamlage, B.; Schmitz, O.; Wiemer, J.C.; Prokoudine, A.;van Ravenzwaay, B.; Mellert, W.; et al. System and Method for Analyzing a Sample Using ChromatographyCoupled Mass Spectrometry. U.S. Patent No. 7,873,481, 18 January 2011.
59. Behr, C.; Slopianka, M.; Haake, V.; Strauss, V.; Sperber, S.; Kamp, H.; Walk, T.; Beekmann, K.; Rietjens, I.;Van Ravenzwaay, B. Analysis of metabolome changes in the bile acid pool in feces and plasma ofantibiotic-treated rats. Toxicol. Appl. Pharmacol. 2019, 363, 79–87. [CrossRef]
60. Slopianka, M.; Herrmann, A.; Pavkovic, M.; Ellinger-Ziegelbauer, H.; Ernst, R.; Mally, A.; Keck, M.; Riefke, B.Quantitative targeted bile acid profiling as new markers for DILI in a model of methapyrilene-induced liverinjury in rats. Toxicology 2017, 386, 1–10. [CrossRef]
61. Martin, M. Cutadapt removes adapter sequences from high-throughput sequencing reads. EMBnet J. 2011,17, 10. [CrossRef]
62. Callahan, B.J.; McMurdie, P.; Rosen, M.J.; Han, A.W.; Johnson, A.J.; Holmes, S. DADA2: High-resolutionsample inference from Illumina amplicon data. Nat. Methods 2016, 13, 581–583. [CrossRef]
63. Caporaso, J.G.; Kuczynski, J.; Stombaugh, J.; Bittinger, K.; Bushman, F.D.; Costello, E.K.; Fierer, N.; Peña, A.G.;Goodrich, J.K.; Gordon, J.I.; et al. QIIME allows analysis of high-throughput community sequencing data.Nat. Methods 2010, 7, 335–336. [CrossRef]
64. Pinheiro, J.; Bates, D.; DebRoy, S.; Sarkar, D. Nlme: Linear and Nonlinear Mixed Effects Models, R packageversion 3.1-145 ed; R Core Team: 2020. Available online: https://ftp.yz.yamagata-u.ac.jp/pub/cran/web/
packages/nlme/ (accessed on 2 June 2020).
© 2020 by the authors. Licensee MDPI, Basel, Switzerland. This article is an open accessarticle distributed under the terms and conditions of the Creative Commons Attribution(CC BY) license (http://creativecommons.org/licenses/by/4.0/).