Anti-proliferative effect of hibernating American bullfrog ...
47
University of Northern Iowa University of Northern Iowa UNI ScholarWorks UNI ScholarWorks Dissertations and Theses @ UNI Student Work 2017 Anti-proliferative effect of hibernating American bullfrog, Anti-proliferative effect of hibernating American bullfrog, Lithobates catesbeianus, blood plasma on the THP-1 cells Lithobates catesbeianus, blood plasma on the THP-1 cells Sean L. Robbins University of Northern Iowa Let us know how access to this document benefits you Copyright ©2017 Sean L. Robbins Follow this and additional works at: https://scholarworks.uni.edu/etd Part of the Biology Commons Recommended Citation Recommended Citation Robbins, Sean L., "Anti-proliferative effect of hibernating American bullfrog, Lithobates catesbeianus, blood plasma on the THP-1 cells" (2017). Dissertations and Theses @ UNI. 436. https://scholarworks.uni.edu/etd/436 This Open Access Thesis is brought to you for free and open access by the Student Work at UNI ScholarWorks. It has been accepted for inclusion in Dissertations and Theses @ UNI by an authorized administrator of UNI ScholarWorks. For more information, please contact [email protected].
Transcript of Anti-proliferative effect of hibernating American bullfrog ...

University of Northern Iowa University of Northern Iowa
UNI ScholarWorks UNI ScholarWorks
Dissertations and Theses @ UNI Student Work
2017
Anti-proliferative effect of hibernating American bullfrog, Anti-proliferative effect of hibernating American bullfrog,
Lithobates catesbeianus, blood plasma on the THP-1 cells Lithobates catesbeianus, blood plasma on the THP-1 cells
Sean L. Robbins University of Northern Iowa
Let us know how access to this document benefits you
Copyright ©2017 Sean L. Robbins
Follow this and additional works at: https://scholarworks.uni.edu/etd
Part of the Biology Commons
Recommended Citation Recommended Citation Robbins, Sean L., "Anti-proliferative effect of hibernating American bullfrog, Lithobates catesbeianus, blood plasma on the THP-1 cells" (2017). Dissertations and Theses @ UNI. 436. https://scholarworks.uni.edu/etd/436
This Open Access Thesis is brought to you for free and open access by the Student Work at UNI ScholarWorks. It has been accepted for inclusion in Dissertations and Theses @ UNI by an authorized administrator of UNI ScholarWorks. For more information, please contact [email protected].

Copyright by
SEAN ROBBINS
2017
All Rights Reserved

ANTI-PROLIFERATIVE EFFECT OF HIBERNATING AMERICAN BULLFROG,
LITHOBATES CATESBEIANUS, BLOOD PLASMA ON THP-1 CELLS
An Abstract of a Thesis
Submitted
in Partial Fulfillment
of the Requirements of the Degree
Master of Science
Sean L Robbins
University of Northern Iowa
July 2017

ABSTRACT
Hibernation is a remarkable process that allows an organism to go dormant
for long periods of time during the winter, when food is scarce and living conditions
can be lethal. Much is unknown about the physiology behind hibernation, and most
research comes from mammalian models. For example, it is known that during
hibernation many of the cells in the body are impeded from going though mitosis
but the mechanism that caused this was unknown. It was recently discovered that
13-lined ground squirrels (Ictidomys tridecemlineatus) and woodchucks (Marmota
monax) have a protein, alpha-2-macroglobulin, in their blood plasma, which has
significant anti-proliferative effects on spleen cells (Sieckman et al., 2014).
The goal of my study was to determine if an ectothermic organism, the
American bullfrog, Lithobates catesbeianus, also actively suppresses mitosis while
hibernating and if so, determine if it is caused by a component in their blood plasma.
Cellular assays using Human THP-1 cells were conducted by incubating cells in
different treatments of plasma collected from active and hibernating bullfrogs. After
incubation, the cells were either counted to determine if the rate of cell growth had
been inhibited or stained with a dye that attaches to DNA and run through a flow
cytometer. Results of the cell count assays were inconclusive regarding how the rate
of growth had been affected by hibernating plasma treatment. Flow cytometry
assays found that the majority of cells in the hibernating plasma treatment were in

the M phase of the cell cycle, instead of the G0 phase. This suggests that the majority
of cells had replicated their DNA, but mitosis was halted before the cell divided. This
may be because there is substantial cell death throughout hibernation and by
stopping mitosis just after DNA replication, the cells are better prepared for
proliferation when the animal is exiting hibernation.

ANTI-PROLIFERATIVE EFFECT OF HIBERNATING AMERICAN BULLFROG,
LITHOBATES CATESBEIANUS, BLOOD PLASMA ON THP-1 CELLS
A Thesis submitted
in Partial Fulfillment
of the Requirements of the Degree
Master of Science
Sean L Robbins
University of Northern Iowa
July 2017

ii
This Study By: Sean L Robbins
Entitled: Anti-proliferative Effects of Hibernating American Bullfrog, Lithobates catesbeianus, Blood Plasma on THP-1 Cells has been approved as meeting the thesis requirement for the
Degree of Master of Science
________________ ________________________________________________________________ Date Dr. David Saunders, Chair, Thesis Committee ________________ ________________________________________________________________ Date Dr. David McClenahan, Thesis Committee ________________ ________________________________________________________________ Date Dr. James Demastes, Thesis Committee ________________ ________________________________________________________________ Date Dr. Kavita Dhanwada, Dean, Graduate College

iii
ACKNOWLEDGMENTS
This work would not have been possible without the University of Northern Iowa
Biology Department and Dr. David Saunders. Also thank you to, my loving wife,
Mellissa, my supportive parents, Randy and Deb, and my friends.
To all, thank you for believing in me.

iv
TABLE OF CONTENTS
PAGE
LIST OF FIGURES .................................................................................................................................... v
LIST OF TABLES ..................................................................................................................................... vi
CHAPTER 1. INTRODUCTION AND LITERATURE REVIEW .................................................... 1
Hibernation ........................................................................................................................................ 1
Mammalian Hibernation ............................................................................................................... 2
Amphibian Hibernation ................................................................................................................ 3
Ant-proliferation During Hibernation ..................................................................................... 4
CHAPTER 2. MATERIALS AND METHODS .................................................................................... 8
Bullfrogs .............................................................................................................................................. 8
Drawing Blood Plasma .................................................................................................................. 9
Cell Colony ........................................................................................................................................11
Cell Count Assays ...........................................................................................................................11
Flow Cytometry Assays ...............................................................................................................13
Statistical Analysis ........................................................................................................................15
CHAPTER 3. RESULTS .........................................................................................................................17
CHAPTER 4. DISCUSSION ..................................................................................................................28
REFERENCES ..........................................................................................................................................35

v
LISTS OF FIGURES
FIGURE PAGES
1 Histogram Showing the Results From the Flow Cytometry Analysis Carried
Out on THP-1 Cells That Were Incubated in Active Bullfrog Plasma .................18
2 Histogram Showing the Results From the Flow Cytometry Analysis Carried
Out on THP-1 Cells That Were Incubated in Hibernating Bullfrog Plasma .....20
3 Bar Graph Showing the Mean Percentage of Cells Found in the R2 Gate per
Individual Bullfrog .................................................................................................................22
4 Bar Graph Showing the Mean Percentage of Cells Found in the R4 Gate per
Individual Bullfrog .................................................................................................................23
5 Bar Graph Showing the Average of the Percent of Cells Within the R2 Gate
and the Standard Error Within Each Group .................................................................25
6 Bar Graph Showing the Average of the Percent of Cells Within the R3 Gate
and the Standard Error Within Each Group ................................................................. 26
7 Bar Graph Showing the Average of the Percent of Cells Within the R4 Gate
and the Standard Error Within Each Group .................................................................27

vi
LIST OF TABLES
TABLE PAGE
1 The Number of Cells Within Each Gate In the Histogram of Figure 1 and Their
Proportion To the Total Number of Cells......................................................................19
2 The Number of Cells Within Each Gate In the Histogram of Figure 2 and Their
Proportion To the Total Number of Cells...................................................................... 21
1
CHAPTER 1
INTRODUCTION AND LITERATURE REVIEW
Hibernation
Many groups of organisms can enter into a state of dormancy, or torpor,
whether to live throughout a period of time when food is sparse or conditions are
unfavorable. In this dormancy the organism goes through a significant metabolic
suppression. The heart and respiration rate dramatically decreases. The digestive
tract nearly shuts down and the core body temperature drops down to ambient
temperatures. Some organisms such as reptiles, amphibians, mollusks, fish,
arthropod and mammals, which live in very hot and dry climates, can go into a state
of torpor known as aestivation. In general these organisms go into aestivation
during the period of the year when precipitation is very low and therefore there is a
risk of desiccation (Boutilier et al., 1997). Aestivation is also mostly characterized as
occurring in shorter cycles and the organism is easily able to come out of aestivation
fairly quickly. The African lungfish, for example, will burrow under the mud of pools
of water before that pool dries up and go into aestivation until adequate
precipitation occurs.
In contrast, hibernation is when an organism enters into a state of long term
torpor in order to essentially skip over those months in which there is little food
present. As a result the organism has to contend with different environmental
pressures, such as preventing ice from forming in their bodies and having sufficient

2
energy reserves to service throughout the winter. Organisms such as amphibians,
fish, arthropods, a few birds, and mammals have adapted to use hibernation.
Mammalian Hibernation
Most of what we know about the physiology of hibernation is drawn from
experiments using mammalian models, most commonly the thirteen-lined ground
squirrel (Ictidomys tridecemlineatus). Hibernation in mammals is thought to be
triggered by a change in ambient temperature and photoperiod length. This causes a
behavioral response to over feed so that they gain fat, which will then be burned for
energy throughout hibernation. They may also start to collect and store excess food
in their burrows. Mammals are endothermic and homoeothermic organisms. As
such they produce and maintain their own body heat. However, prior to hibernation
their bodies go through extensive physiological changes so that they essentially
become ectothermic and their core body temperatures will then mimic the ambient
temperature of their burrows. Their heart rate will drastically slow down to the
point that their blood will become viscous. The average heart rate of a thirteen-lined
ground squirrel during hibernation is three to five beats per minute (Cooper et al,
2012). While in hibernation blood platelet counts in these animals decrease by 90%
and their clotting factors decline by 70% to prevent the blood from clotting (Cooper
et al, 2012). Metabolic rate is also reduced to below 5% of the squirrel’s normal
metabolic rate in order to preserve as much energy as possible (Wu & Storey, 2012).
Mammals also do not constantly stay in a state of deep torpor throughout
3
hibernation. They will periodically become aroused out of torpor, raising their core
body temperature, then lower their body temperature again, entering deep torpor,
multiple times throughout hibernations (Carey et al., 2003). Why mammals
periodically exit torpor during hibernation is poorly understood but it is speculated
that doing so is important in order to restore metabolic homeostasis in the spring
(Ratigan and McKay, 2016).
Amphibian Hibernation
Amphibian hibernation differs from mammalian hibernation in a few ways.
Amphibians, unlike mammals, are ectothermic and poikilothermic. This means that
they do not need a specific mechanism to drop their core body temperature because
their core body temperature is already the same as the surrounding temperature.
Also, unlike mammals, amphibians rely on breathing subcutaneously and therefore
need moisture in order for that to occur.
In frogs there are two general methods of hibernation: terrestrial
hibernation and, the more commonly used, aquatic hibernation. For aquatic
hibernation, individual frogs seek out a pool of water, and once there, the frog will
swim to the bottom of the water and hibernate on top of the mud where it can
breathe subcutaneously (Stewart et al. 2004). At the onset of hibernation, several
biochemical and physiological changes take place. The bone marrow no longer
generates new blood cells and instead becomes a site for fat storage, acting as an
energy reserve during hibernation (Cooper et al. 1992). The antioxidant defense

4
system of the frog shuts down, as there is a lack of antioxidant enzymes, such as
superoxide dismutase and catalase, present in the heart and muscle tissue during
hibernation (Feidantsis et al., 2013). The immune system of the frog also almost
completely shuts down (Cooper et al. 1992). The heart rate significantly decreases
and respiration is slowed down as the frog relies solely on subcutaneous
respiration. On the other hand, brain activity is fully active during hibernation. It has
been found that there is an increase in the proliferation of brain cells during
hibernation. This is to combat massive cell death due to cold temperatures and to
keep the brain active so that baseline functions, needed to maintain life, can still be
carried out (Cerri et al., 2009).
Anti-proliferation During Hibernation
It is known that during hibernation, most cellular activity is suppressed
throughout the body. It costs energy and resources in order for cells to go through
mitosis. Other studies have found that the synthesis of DNA, RNA, and proteins in
hibernating tissues is significantly decreased during hibernation (Kolaeva et al.
1980). However, the mechanism, which prevents the cells from going through
mitosis, is poorly understood. There could be multiple factors at play causing anti-
proliferation, one of which is that enzymatic activity is greatly reduced with
declining temperature. Biological processes have an approximate Q10, or
temperature sensitivity factor, of 2-3, such that the rate of an enzymatic reaction is
changed by a factor of 2-3 for every 10-degree change in temperature (Boyer and

5
Barnes. 1999). Therefore, it could be that the temperature is too low for enzymatic
reactions to take place.
Another possibility is that during hibernation there may be a down
regulation of proteins called growth factors. In order for cells to start mitosis, there
must be a certain concentration of growth factors present around the cell, which
will create an extracellular signal to start the process of mitoses in the cell. Once
this signal starts, it activates cyclin-CDK complexes, which regulate the progression
of cell proliferation. One study measured the level of concentration of these proteins
in the liver cells of hibernating thirteen-lined ground squirrel, Ictidomys
tridecemlineatus, in order to analyze the stasis of the cell cycle during hibernation.
They found that during hibernation the cells have a reduction of cyclin D and E,
which are the cyclins responsible for getting the cells out of G0 or interphase (Wu &
Storey, 2012). This suggests that there is a degree of under regulation of growth
factors at play during hibernation.
Another mechanism for the suppression of mitosis during hibernation could
be that a protein is produced which causes an inhibitory response to cell
proliferation. It has been shown that the rate of proliferation of tumor cells that
have been transplanted into hibernating hamsters was dramatically decreased
(Lyman and Fawcett, 1954). Also blood plasma taken from hibernating ground
squirrels has been shown to induce hibernation when transferred to summer active
ground squirrels (Dawe and Spurrier, 1969). These studies indicated that there was

6
something in the plasma causing a suppression of mitosis. The substance was
identified much later as being a protein (Siechmann et al., 2014). Cultured mouse
spleen cells, incubated in different concentrations of plasma from hibernating
thirteen-lined ground squirrels found that the higher the concentration of plasma
incubated with the cells the lower the uptake of the radioactive thymidine in the
cells, indicating that the rate of mouse spleen cells division was significantly slowed.
A western blot test analysis found that it was a protein responsible in the plasma
and that this protein was in the alpha-2-macroglobulin family (Sieckmann et al.,
2014). This gives evidence to the presence of an inhibitory protein that is causing
mitotic suppression.
For ectothermic organisms there are no known studies that have been
performed to determine the mechanism causing anti-proliferation in their cells
during hibernation. The goal of this study is to determine if an ectothermic
vertebrate, such as the American bullfrog, Lithobates catesbeianus, also actively
suppresses mitosis while hibernating, and if so, determine if it is caused by a
component in their blood plasma. This was done by conducting cellular assays in
which a human cell line, THP-1 cells, were incubated in the blood plasma collected
from bullfrogs that were at different durations of hibernation and bullfrogs that
remained active, at room temperature, when plasma was extracted. A cell count was
performed at the end of the incubation period to measure the rate of proliferation
with in the cell population. Assays were also conducted to determine how the

7
hibernating plasma affected the cell cycle in comparison to plasma collected from
active bullfrogs. This was done by staining the cells with a florescent dye that
attaches to DNA and using a flow cytometry to determine the percentage of cells in
the various mitotic stages.

8
CHAPTER 2
MATERIALS AND METHODS
Bullfrogs All bullfrogs used throughout this study were treated as humanely as
possible, following protocol designed to minimize pain or discomfort to the animals.
Twenty-one of American bullfrogs (Lithobates catesbeianus) were purchased from
Kons Direct (Germantown, WI 53022). The Bullfrogs were delivered on November
12th 2015. Once the frogs were delivered they were separated and placed into four,
twenty-gallon transparent plastic storage containers with ventilated lids and placed
in a temperature controlled room held at 28°C. Each container was filled with
approximately four centimeters of tap water. The water used to fill the containers
ounce the temperature was lowered in the cold room was stored in the same cold
room as the hibernating bullfrogs to ensure that the water was at the same
temperature as that of the surrounding environment, thus reducing potential stress.
The water in each of the containers was changed once per week.
Four of the bullfrogs were randomly selected and placed in a container that
was kept separate and at room temperature in the laboratory. These bullfrogs were
classified as the active non-hibernating bullfrogs. The remaining 17 bullfrogs were
randomly assigned and placed into one of three containers, with five individuals in
one container and six individuals in each of the other two containers. These

9
containers were then kept in a temperature controlled cold room. The individuals
kept in this manner were classified as the hibernating bullfrogs.
Starting on November 19th, 2015 the temperature of the cold room was
lowered to 24° C. The temperature was then lowered by 4°C every seven days until
the temperature of the cold room reached 4°C on December 17th 2015. The
temperature was maintained at this temperature until March 31st, 2016, when it
was raised to 9°C. The temperature was then raised to 15°C on April 7th, 2016. No
bullfrogs were fed during hibernation.
Drawing Blood Plasma
The experiments reported herein were conducted according to the protocol
set for in the “AVMA Guidelines for the Euthanasia of Animals: 2013 Edition,”
American Veterinary Medical Association, 2013. The four bullfrogs kept at room
temperature in the lab, here after referred to as active bullfrogs, were kept in the
laboratory for three weeks. Blood was drawn from two individuals on December 1st,
2015. The individuals were anesthetized using a solution of tricaine mesylate, also
known as MS-222, purchased from Syndel USA (Ferndale, WA 98248) with 2.5
grams of MS-222 per liter of water. MS-222 is acidic with an approximate pH of 5,
thus sodium bicarbonate was added to the solution to raise the pH to approximately
7-7.5. The bullfrogs were submerged in the solution until they were immobile,
which occurred approximately 8 to 12 minutes after submersion in active bullfrogs.
Once anesthetized, the individual was placed on their dorsal side and blood was

10
drawn through a cardiac puncture. To expose the heart, a vertical incision was made
on the ventral side, just to the right of the sternum. A sterile syringe, flushed with
0.105M (3.5%) sodium citrate was used to draw blood from the ventricle. The
sodium citrate was used to prevent coagulation of blood entering the syringe. The
volume of the drawn blood was initially placed into tubes containing 0.105 M
sodium citrate. Blood from these tubes was separated into centrifuge tubes, with
approximately 1.5 ml of blood per centrifuge tube. The blood in each of the
centrifuge tubes was centrifuged for five minutes at 2500g to separate the plasma
from the blood cells. The plasma was then pipetted into a separate centrifuge tubes,
with approximately 1ml of plasma per tube. Each plasma sample was then stored at
-80°C. This same procedure was used for each individual bullfrog in this study. The
blood from the other active bullfrogs was drawn within nine days of that for the first
active bullfrog.
Blood was drawn from two hibernating individuals on the same day. The first
blood to be drawn from hibernating bullfrogs was drawn on December 8th, 2015,
five days after the temperature of the cold room was lowered to 12°C. The same
procedure that was used on the active Bullfrog specimens was repeated on all of the
hibernating bullfrogs. Blood was drawn from hibernating frogs on the proceeding
dates: on December 18th, after the temperature of the cold room was lowered to 8°C,
January 21st, 2016, at 4°C, February 22nd at 4°C, and March 23rd at 4°C. The
temperature was gradually increased to 15°C. Once this temperature was reached,

11
blood was drawn from two individuals on April 14th, two individuals on May 12th,
and three individuals on June 3rd.
Cell Colony
THP-1 cells were used to conduct cellular assays throughout the entirety of
my study. THP-1 cells are monocytic cells that were acquired from a one-year-old
patient with acute monocytic leukemia. Cells are spherical in shape and non-
adhesive. The cells were kept in a cell media which was comprised of the Roswell
Park Memorial Institute (RMPI) medium, 10% Fetal Bovine Serum (FBS), and .35 μl
2-Mercaptoethanol. Cells were kept in an incubator set at 37°C and 5% CO2. The
colony was kept at 10 ml in a cell culture flask. Once per week, half of the cell
suspension was removed and 5ml of fresh media was added back into the flask.
Cell Count Assays
Cell count assays were conducted by incubating the THP-1 cells in different
treatments of bullfrog plasma in order to determine if there was a difference in rate
of cell proliferation between cells incubated in the active bullfrog’s plasma and the
hibernating bullfrog’s plasma. The cells were washed free of any storage media
before use in the cell assays by drawing up 1 ml of cell suspension from the cell
colony and placing it in a sterile 5 ml Falcon tube. This tube was then centrifuged at
10,000 xg for five minutes. The liquid in the Falcon tube was poured off carefully as
to not to dislodge the clump of cells at the bottom from the tube. 1ml of phosphate-
buffered saline (PBS) was then added to the tube, followed by mixing with a

12
vortexer for ten seconds. The Falcon tube was again centrifuged at 10,000 xg for five
minutes and the top liquid was poured out. Another 1 ml of PBS was added to the
tube and the contents were agitated again using a vortexer.
To conduct the cell count assays, the initial cell count had to be determined
for each separate assay. 10μl of the washed cell suspension was placed into each of
the two chambers of a hemocytometer. The hemocytometer was then placed under
a compound light microscope. Using the low power objective (4x), cells in each of
the nine largest squares were counted in each of the two chambers using an
electronic counter. The number of cells obtain from the count was divided by 18 and
then multiplied by 10,000 to determine the approximate number of cells total in a
1ml cell suspension. The estimated number of cells had to be within the range of
300,000-500,000 in order to be used in the cellular assay.
Sterile 96 well plates with lids were used for all cellular assays. Before adding
the cell suspension, wells were filled with 100 μl of treatment solution. Treatment
solutions varied from assay to assay but always consisted of a control group, an
active bullfrog plasma group, and several hibernating bullfrog plasma groups. The
control group consisted of the same FBS media used to grow the cell colony. The
active bullfrog plasma group consisted of blood plasma that was drawn from a
bullfrog that was kept at room temperature in the lab. The hibernating bullfrog
plasma groups consisted of blood plasma that was drawn from the individuals that
were in hibernation while being kept in the cold room.

13
Once the initial cell count was determined and the plasmas were added to the
wells, 10 μl of the cell suspension was pipetted into each of the respective wells. The
well plate was then placed in an incubator set at 37°C and at 5% CO2 for 72 hours.
At the end of the incubation period the plate was taken out and a sample from each
well was pipetted into a hemocytometer to be counted. Every cell within the nine
square grid was counted in both of the chambers. The number of cells in 1ml was
determined by dividing the total count by 18 and multiplying by 10,000 and then by
10 (for the factor of dilution). This number represents the approximate number of
cells that were in 1 ml of plasma in that well at the end of the 72 hour incubation.
Flow Cytometry Assays
To determine if the cell cycle was being effected differently between THP-1
cells incubated in active bullfrog plasma and THP-1 cells incubated in hibernating
bullfrog plasma, the cells were incubated with a fluorescent dye that attaches to
DNA. An Applied Biosystems Attune Acoustic Flow Cytometer (Life Technologies)
was used to measure the proportionality of the cells that were in the different stages
of the cell cycle. The flow cytometer measured the intensity of the dye bound to the
cell’s DNA, which then indicates if the DNA has been duplicated. For these assays the
same procedure previously stated for washing the cells was used with the exception
that 1.5 ml of cell suspension from the colony was used instead of 1 ml of
suspension. The same general treatment groups were also used for these assays as
well. Sterile 96 well plates with lids were used for these assays. 100 μl of either FBS

14
treatment, plasma from active fogs, or plasma from hibernating frogs were added to
each of the wells being used in the experiment. A sample was drawn from the cell
suspension after the washing process to determine number of cells in 1 ml using a
hemocytometer. For the flow cytometer assays, the initial cell count had to be at, or
over, one million cells in order for it to be used in the assay. Once the initial cell
count was determined, 10μl of the washed cells were pipetted into each of the
treatment well. The well plate would then be incubated for 72 hours in an incubator
at 37°C and 5% CO2.
Following incubation, the contents of two of the wells, within the same
treatment group, were combined into one loose-caped test tube and 850μl of PBS
was added to bring the total volume of liquid to 1 ml. 2 μl of Vybrant DyeCycle Green
stain (Fisher Scientific) was then added to each of the test tubes and each test tube
was mixed well using a vortexer. The test tubes were placed in the incubator for 30
minutes to allow the dye to stain the DNA.
The blue light laser of the flow cytometer was used to measure the amount of
dye in each sample. A 1 ml sample of the original cell colony was also stained with
the Vibrant DyeCycle Green stain and incubated with the treatment test tubes. This
sample was the first to be drawn through the flow cytometer in order to adjust the
appropriate parameters in the software so that it would measure cells that were
within the same size range as the THP-1 cells. This was done by adjusting the
forward scatter (FSC), side scatter (SSC), and blue light frequency (BL1) until the

15
cell population could be seen on a dot diagram. For all of the separate flow
cytometer assays, the machine was set to analyze a maximum of 10,000 events,
objects that fit in the pre-established parameter of size, or 750 μl of sample liquid.
After calibration was completed, each sample was agitated with a vortexer and then
run through the flow cytometer. A histogram comparing the event count and BL1
was set up for each sample and three gates were established on histograms. The
first gate marked the estimate frequency range, which would represent the cells in
the G0 or G1 phase. The second gate was to frame the cells in S phase and the last
gate framed the cells in G2 or M phase.
Statistical Analysis
Data collected was analyzed using the statistical software R Studio. Data
collected from the cell count assays was normalized using log transformation and an
ANOVA test was used to compare the differences between the active bullfrog plasma
group and the hibernating bullfrog plasma group. Data from the flow cytometer
assays was normalized using the arcsine-square root transformation on the
proportion of cells in the different gates. The data was then grouped together based
on the temperature of the bullfrog when the plasma was collected. The groups were
as followed: FBS, room temperature (RT), hibernation, and post-hibernation. The RT
group consisted of data collected from cells incubated in active bullfrog plasma. The
hibernation group consisted of data collected from bullfrogs that were at 4°C when
plasma was collected and were at various durations of time in hibernation. The
16
post-hibernation group consisted of data from bullfrogs that were at 15°C when
plasma was collected. An ANOVA test was run on the transformed data to
determine if any significant differences existed between the active and hibernating
bullfrog plasma treatment groups in each of the gates set up on the histograms.
17
CHAPTER 3
RESULTS
For this study, I conducted experiments to try to discover evidence that an
ectothermic organism does regulate cellular division during hibernation and that
this regulation was not directly dependent on temperature. To accomplish this goal,
cellular assays were carried out using a human cell line (THP-1 cells) that was
incubated with different treatments of bullfrog plasma. The data collected from cell
count assays had too much variance within all experimental groups, including the
positive control, to ascertain any statistical significance or trend.
Results from the flow cytometer assays showed a trend that the majority of
cells grown in hibernating bullfrog plasma treatments were in the G2/M phase of
the cycle. Inversely, the cells grown in the plasma extracted from the active bullfrogs
show a normal distribution on the histogram, and more of the cells were in the
G0/G1 phase. Figure 1 is an example of a histograms produced from the flow
cytometry data collected from active bullfrog plasma. Table 1 represents the
statistical readings gained from that histogram in the form of the proportionality of
the cells residing under each peak. The first peak on the left-hand side, which is in
the gate labeled R2, represents the proportion of cells in the G0/G1 phase and the
taller peak on the right-hand side, which is in the gate labeled R4, represent the cells
in G2/M phase. In this example 41.89% of the total cells fall within the R2 gate and
are in the G0/G1 phase, while 28.15% of the total cells are in the R4 gate and thus in

18
the G2/M phase. Figure 2, shows a histogram produced from the data collected from
cells incubated in hibernating blood plasma. Table 2 shows the proportionality of
cells within each of the gates in figure 2, indicating that 51.16% of the total cells fall
within gate G4 and thus are in the G2/M phase and only 11.55% of the cells are in
the G0/G1 phase. This pattern is consistent for flow cytometry data collected from
cells incubated in hibernating bullfrog plasma.
Figure 1. A histogram showing the results from the flow cytometry analysis carried out on THP-1 cells that were incubated in plasma extracted from an active bullfrog. The R2 region represents the cells in the G0/G1 phase, The R3 gate represents the cells in the S phase, and the R4 gate represents the cells in the G2/M phase.

19
Name Event Count % Total
All Events 10,000 100%
Gate R1 8,717 87.17%
Gate R2 (G0/G1) 4,189 41.89%
Gate R3 (S) 540 5.4%
Gate R4 (G2/M) 2.815 28.15%
Table 1. The number of cells within each gate in the histogram of figure 1 and their proportion to the total number of cells. The phase of the cell cycle that each gate represents is noted in the parenthesis.

20
Figure 2. A histogram showing the results from the flow cytometry analysis carried out on THP-1 cells that were incubated in plasma extracted from a hibernating bullfrog. The R2 region represents the cells in the G0/G1 phase, The R3 gate represents the cells in the S phase, and the R4 gate represents the cells in the G2/M phase.

21
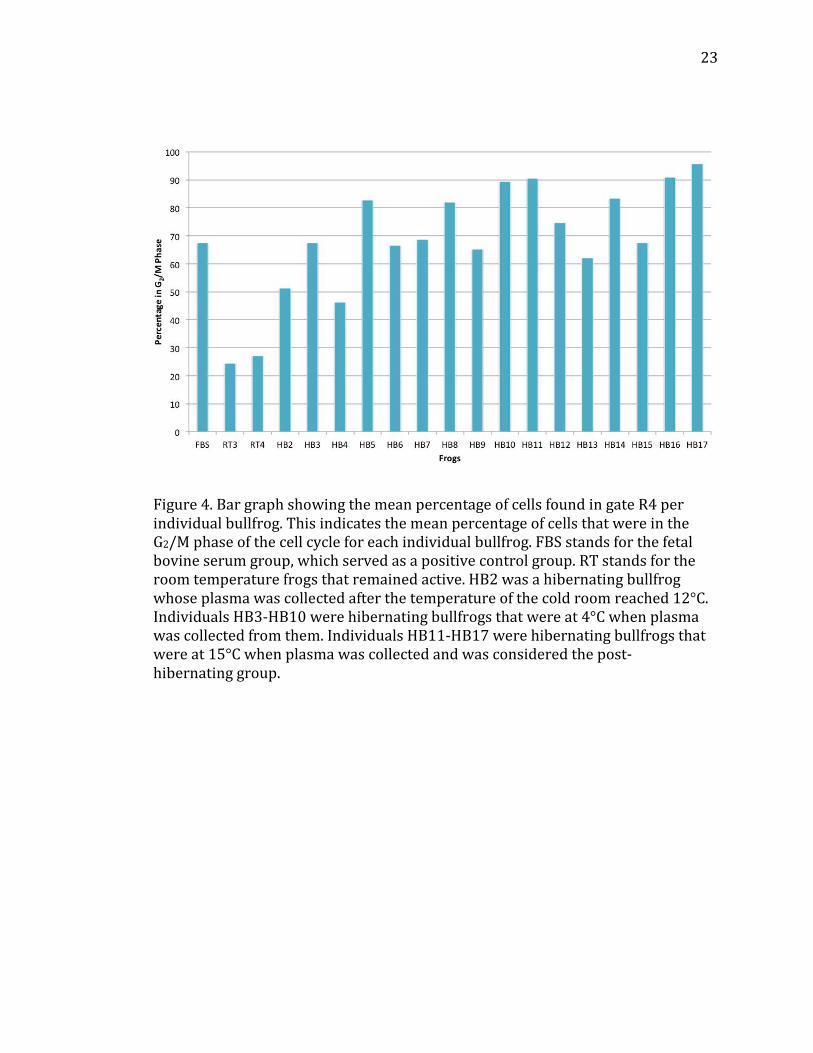
The average percentage of cells in each gate for each individual bullfrog in
the study was calculated and plotted over time (figure 3 and 4), which illustrated
the trend that the longer the duration of hibernation, the greater the proportion of
the cells in the G2/M phase. Figure 3 illustrates the data derived for each individual
from all of the flow cytometer readings within the R2 gate, which represented the
cells in G0/G1 phase. Figure 4 illustrates all of the data for each individual derived
from the flow cytometer readings within gate R4, representing the cells in the G2/M
phase.
Name Event Count % Total
All Events 8,145 100%
Gate R1 5,818 71.43%
Gate R2 (G0/G1) 941 11.553%
Gate R3 (S) 340 5.844%
Gate R4 (G2/M) 4,167 51.160%
Table 2. The number of cells within each gate in the histogram of figure 2 and their proportion to the total number of cells. The phase of the cell cycle that each gate represents is noted in the proceeding parentheses.

22
Figure 3. Bar graph showing the mean percentage of cells found in gate R2 per individual bullfrog. This indicates the mean percentage of cells that were in the G0/G1 phase of the cell cycle for each individual bullfrog. FBS stands for the fetal bovine serum group, which served as a positive control group. RT stands for the room temperature frogs that remained active. HB2 was a hibernating bullfrog whose plasma was collected after the temperature of the cold room reached 12°C. Individuals HB3-HB10 were hibernating bullfrogs that were at 4°C when plasma was collected from them. Individuals HB11-HB17 were hibernating bullfrogs that were at 15°C when plasma was collected and was considered the post-hibernating group.
23
Figure 4. Bar graph showing the mean percentage of cells found in gate R4 per individual bullfrog. This indicates the mean percentage of cells that were in the G2/M phase of the cell cycle for each individual bullfrog. FBS stands for the fetal bovine serum group, which served as a positive control group. RT stands for the room temperature frogs that remained active. HB2 was a hibernating bullfrog whose plasma was collected after the temperature of the cold room reached 12°C. Individuals HB3-HB10 were hibernating bullfrogs that were at 4°C when plasma was collected from them. Individuals HB11-HB17 were hibernating bullfrogs that were at 15°C when plasma was collected and was considered the post-hibernating group.

24
An ANOVA was conducted on the data collected from the flow cytometry
assays. Bullfrogs were separated into groups based on the temperature exposure of
bullfrog when plasma was extracted. The groups consisted of the FBS control group,
the room temperature or RT group, the hibernation group, and post-hibernation
group. Figure 5, 6, and 7 shows the means for each of the groups within their
respective gates on the flow cytometer readings. The ANOVA test showed data
within each of the three gates were significant with a p value for the R2 gate being
2.038x10⁻¹², the R3 gate being 0.0004069, and the R4 gate being 2.2x10⁻¹⁶.
A Tukey HSD test was used to determine the level of significance between
each of the groups, the results of which are illustrated in Figures 5, 6, and 7. In the
R2 gate data, cells within the hibernating group and the post-hibernating group are
significantly different from the room temperature group. Likewise, Tukey tests
showed that both of the hibernation groups are significantly different from the room
temperature group.

25
Figure 5. Bars showing the average of the percent of cells within the R2 gate, which indicates cells were in the G0/G1 phase, and the standard error within each group. Room Temperature represents the group treated with active bullfrog plasma. Statistical significance recognized with a p value of less then 0.05. Means with same letter are not significantly different.

26
Figure 6. Bars showing the average of the percent of cells within the R3 gate, which indicates cells were in the S phase, and the standard error within each group. Room Temperature represents the group treated with active bullfrog plasma. Statistical significance recognized with a p value of less then 0.05. Means with the same letter are not significantly different.

27
Figure 7. Bars showing the average of the percent of cells with in the R4 gate, which indicate that they were in the G2/M phase, and the standard error within each group. Room Temperature represents the group treated with active bullfrog plasma. Statistical significance recognized with a p value of less then 0.05. Means with the same letter are not significantly different.
28
CHAPTER 4
DISCUSSION
Hibernation is the ability for some organisms in colder regions to go dormant
in order to wait out the cold season. The organism undergoes complex physiological
changes in order to enter and exit hibernation. During hibernation, the rate of most
of the vital systems in the body is dramatically decreased so that the animal can
conserve as much energy as possible (Geiser, 2013). One aspect of this is halting or
significantly slowing down the process of cellular proliferation (Sieckmann et al.,
2014). If the cells are proliferating, it costs the organism energy and resources,
which it is trying to conserve in order to survive throughout the cold season.
There are several mechanisms that could be causing this suppression of
mitosis in the organism. One of these factors is that enzymatic activity drastically
slows down by a factor of 2 to 3 for every 10-degree decrease in temperature (Boyer
and Barnes. 1999). This means that decreasing the body’s core temperature to that
of their surroundings during winter may cause enzymatic activity to decrease to a
degree where the cells are no longer capable of going through mitosis. This
prediction, however, is not supported by the background literature. Several studies
have measured the metabolic rate of hibernating mammalian models and have
concluded that the degree of metabolic suppression could not be explained by the
decrease in temperature alone and that a physiological inhibition must be occurring
(Geiser, 2004).

29
Another mechanism by which the cells could be impeded from going though
mitosis is the down regulation of growth factors in the body. In order for mitosis to
be initiated, an extracellular signal must be received on the cell membrane in the
form of growth factors, which are proteins secreted by the endocrine system. During
hibernation, many systems are stopped or significantly slowed (Sieckmann et al.,
2014). By analyzing the concentration of cyclins and CDKs in the liver cells of
hibernating thirteen-lined ground squirrels, scientists have found that there is far
less cyclin D in the cells during hibernation (Wu & Storey, 2012). Cyclin D is the first
cyclin produced when the cell starts the process of proliferation. This could mean
that there is a lack of growth factor present to signal the cell to initiate mitosis.
Another possibility is that there is a protein that is actively inhibiting mitosis
in the cells. In the plasma of hibernating thirteen-lined ground squirrels and
woodchucks, there exists a protein, alpha-2-macroglobulin, which inhibits mouse
spleen cells from going through mitosis (Sieckmann et al., 2014). Almost all previous
studies were conducted on mammalian models and very little is known about the
mechanism, which causes anti-proliferation in hibernating ectothermic organisms.
The goal of this study was to determine if there was a mitotic inhibitor
present in the blood plasma of the hibernating American bullfrog, which is an
ectothermic organism, and if so, how this inhibitor affects the cell cycle. I
hypothesized that there would be anti-proliferative effect on the THP-1 cells when
they are incubated in plasma from hibernating bullfrogs. This correlated with the

30
hypothesis that there is a protein in the plasma that actively inhibits mitosis, similar
to the alpha-2-macroglobulin found in thirteen-lined ground squirrels. The results
collected from the cell count assays were inconclusive due to extreme variance
within the data and a non-normal distribution, possibly due to the fact that a human
cell line was used with the bullfrog plasma.
The data collected from the flow cytometry assays showed that there was a
clear difference between cells that had been incubated in active bullfrog plasma and
cells that were incubated in hibernating bullfrog plasma. The cells that were
incubated in the active bullfrog plasma (room temperature group shown in figures
5, 6, and 7) were predominately in the G0 or G1 phases of the cell cycle. The G0 phase
is the stage of the cell cycle in which the cell spends the majority of its time and is
when the cell is in a resting state. This is as expected for this group because the cells
were incubated in plasma from adult bullfrogs and, therefore, the plasma would
have less growth factors leading to a majority of the cells in their resting state.
The cells incubated in the plasma taken from hibernating bullfrogs showed
that a vast majority of the cells were in the G2 or M phase of the cell cycle, shown in
figure 7. At these phases of the cell cycle the DNA has been duplicated resulting in
greater binding to the dye and a higher intensity of light is emitted when passing
though the flow cytometer. As a result, it is speculated that the majority of the cells
incubated in the hibernating plasma have gone through the G1 and S phase and are
being stopped in the G2 or M phase, after the DNA has been duplicated. It is the

31
cyclin B/ Cdk 1 complex that regulates the division of the cell once it is in the M
phase (Wu and Strorey, 2012). Therefore, the substance in the hibernating plasma
causing the majority of cells to be in the M phase could be playing a roll in the
negative regulation of the cell cycle and inhibiting this complex from activating.
Stopping at this point in the cell cycle could be a mechanism for the bullfrog
to more quickly recover from cellular death during hibernation. It is well known
that many cells die during the process of hibernation due to the stresses of cold and
being in a reduced metabolic state (Cerri et al., 2009). Therefore, by having the cells
already duplicate their DNA and then stop before going through the M phase, the
cells can divide quickly while the frog is exiting hibernation reducing the time
needed to replace damaged cells. Further experimentation is needed in order to
determine whether or not this substance is in fact a protein, similar to the inhibiting
protein found in the thirteen-lined ground squirrel. The data of this study does not
coincide with a previous study that used a flow cytometer assays as well, in which
researchers found that the majority of the cells in hibernating mammal organs were
in the G1 phase of the cell cycle (Kolaeva et al., 1980). The reason that my data
differed from theirs could be because in that study they used a mammalian model.
This could indicate that there may be a difference in the mechanism of mitotic
suppression between amphibian and mammals.
Other studies looking at the mitotic index of several immortal mammalian
cell lines have found similar results to this study. As the temperature lowers on

32
mammalian cell cultures, which proliferate optimally at 37°C, the rate of
proliferation hits a threshold where the cell progresses through G2 but is stopped
before entry into M phase (Rieder and Cole, 2002). This suggest that there exists a
temperature dependent mechanism that acts as a checkpoint just after G2, which
prevents the cell from entering M phase if the temperature is too cold. The majority
of the THP-1 cells incubated in plasma extracted from hibernating bullfrogs in this
study also progressed through the cell cycle until they were stopped in the G2 phase.
However, all of the cells used in this study were incubated at 37°C. Other studies
have found that when mammalian immortal cell lines, such as HeLa and C3-H.Ep-2
cells, are incubated at 4°C for one hour and then brought back up to 37°C their
mitotic index drops for about 17 hours, after which the mitotic activity increases
dramatically for 2 hours with 60-80% of the cells entering into mitosis (Newton and
Wildly, 1959, Rapp, 1960, Manabe, 1969). This gives merit to the above speculation
that the cells are being inhibited from entering M phase as a mechanism to more
quickly duplicate cells while exciting hibernation.
All experiments were carried out in an incubator set at 37°C, and the
corresponding differences in mitotic suppression cannot then be explained by
incubation in differing temperatures. The information gathered from this study also
leads me to believe that this occurrence is not caused by a down regulation of
growth factors because the majority of the cells incubated in hibernating plasma
were in the M phase of the cell cycle. If the suppression of mitotic activity was

33
caused a down regulation of growth factors one would expect that the majority of
the cells would be in the G0 phase because with out a concentration of growth
factors the cells would not have been triggered to duplicate their DNA. Therefore, it
is believed that there is an inhibitory agent present in the hibernating plasma, which
is causing an anti-proliferative effect on the cells during hibernation. Cells
incubated in the active bullfrog plasma had normal growth with the expected
majority of the cells being in the G0 phase of the cell cycle. On the other hand, the
cells incubated in hibernating plasma showed that the majority of cells had
duplicated their DNA and were in either the G2 or M phase. This means that there is
most likely a substance in the hibernating plasma, which is not in the active plasma
causing a different effect on the cell cycle in these cells. The findings of this study
does support my hypotheses, that this regulation of mitosis would be caused by a
protein, or other substance, in the blood plasma of hibernating bullfrogs, which is
actively causing an inhibition of proliferation.
Conducting research to better understand this mechanism that hibernating
organisms use to actively suppressing cellular proliferation is important and has
significant applications in a wide array of fields. Knowledge gained about the
biochemical response to the body when hibernation is initiated could lead to great
medical advancements in organ donation and transplantation. By isolating the
substance that causes the mitotic inhibition of cells and decreases the metabolic rate
one could drastically extend the viability of a donated organ before the tissue

34
becomes too damaged, thus increasing transplant success rates. Discovery of this
substance that is causing mitotic inhibition could also lead to safer cancer treatment.
The cancerous tumor could be inoculated with this substance, causing the rate of
proliferation in the cancer cells to dramatically slow down while other treatments
such as radiation and chemotherapy have more time to work. Further possible
application for this research could also reach to placing humans into suspended
animation for deep space travel.

35
REFERENCES
Boutilier RG, Donohoe PH, Tattersall GJ, West TG. 1997. Hypometabolic Homeostasis in Overwintering Aquatic Amphibians. The Journal of Experimental Biology 200: 387-400. Boyer BB, Barnes BM. 1999. Molecular and Metabolic Aspects of Mammalian Hibernation. BioScience 49: 713-724. Carey HV, Andrews MT, Martin SL. 2003. Mammalian Hibernation: Cellular and Molecular Responses to Depressed Metabolism and Low Temperature. Physiological Reviews 83: 1153-1181. Cerri S, Bottiroli G, Bottone MG, Barni S, Bernocchi G. 2009. Cell Proliferation and Death in the Brain of Active and Hibernating Frogs. Journal of Anatomy 215: 124-131. Cooper EL, Wright RK, Klempau AE, Smith CT. 1992. Hibernation Alters the Frog’s Immune System. Cryobiology 29: 616-631. Cooper ST, Richters KE, Melin TE, Liu Z, Hordyk PJ, Benrud RR, Geiser LR, Cash SE, Shelley CS, Howard DR, Ereth MH, Sola-Visner MC. 2012. The Hibernating 13- lined Ground Squirrel as a Model Organism for Potential Cold Storage of Platelets. American Journal of Physiology – Regulatory, Integrative and Comparative Physiology 302. Dawe AR, Spurrier WA. 1969. Hibernation Induced in Ground Squirrels by Blood Transfusion. Science 163: 298–299. Feidantsis K, Anestis A, Michaelidis B. 2013. Seasonal Variations of Anti-/apoptic and Antioxidant Proteins in the Heart and Gastrocnemius Muscle of the Water Frog, Pelophylax rdibundus. Cryobiology 67: 175-183. Geiser F. 2004. Metabolic Rate and Body Temperature Reduction During Hibernation and Daily Torpor. Annual Review of Physiology 66: 239-274. Geiser F. 2013. Hibernation. Current Biology 23: R188-193.

36
Kolaeva SG, Kramarove LI, Ilyasova EN, Ilyosov FE. 1980. The Kinetics and Metabolism of the Cell of Hibernating Animals During Hibernation. International Review of Cytology 66: 147-170. Lyman CP, Fawcett DW. 1954. The Effect of Hibernation on the Growth of Sarcoma in the Hamster. Cancer Res. 14: 25–28. Manabe S. 1969. Parasynchronous Division of Strain L Mouse Fibroblasts Cells Induced by Cooling. Arch Jap Chir 38: 155-170. Newton AA, Wildly P. 1959. Parasynchronous Division of HeLa cells. Experimental Cell Research 16: 624-635. Rapp F. 1960. Observations on Measles Virus Infection of Human Cells. Virology 10: 86-96. Ratigan ED, McKay DB. 2016. Exploring Principles of Hibernation For Organ Preservation. Transplantation Reviews 30: 13-19. Rieder CL, Cole RW. 2002. Cold-Shock and the Mammalian Cell Cycle. Cell Cycle 1: 168-174. Sieckmann DG, Jaffe H, Golech S, Cai D, Hallenbeck JM, McCarron RM. 2014. Anti-lymphoproliferative Activity of Alpha-2-Macroglobulin in the Plasma of Hibernating 13- Ground Squirrels and Woodchucks. Veterinary Immunology and Immunopathology 162: 1-11. Stewart ER, Reese SA, Ultsch GR. 2004. The Physiology of Hibernation in Canadian Leopard Frogs (Rana popiens) and Bullfrogs (Rana catesbeiana). Physiological and Biochemical Zoology 77: 65-73. Wu C, Storey KB. 2012. Pattern of Cellular Quiescence Over the Hibernation Cycle on the Liver of Thirteen-lined Ground Squirrels. Cell Cycle 11: 1714-1726.


![An epidemiological model for proliferative kidney disease ... · An epidemiological model for proliferative ... [18, 35]. Overt infec-tion ... An epidemiological model for proliferative](https://static.fdocuments.net/doc/165x107/5c00b25409d3f225538b84ad/an-epidemiological-model-for-proliferative-kidney-disease-an-epidemiological.jpg)


![Hibernating in the Cloud – Implementation and Evaluation ...€¦ · Hibernating in the Cloud – Implementation and Evaluation of ... [AWS], Cassandra [Apa], RIAK [Bas], or Neo4j](https://static.fdocuments.net/doc/165x107/5ec5f5a090ca1d693c70616b/hibernating-in-the-cloud-a-implementation-and-evaluation-hibernating-in-the.jpg)