Anthropogenetic Profile of denotified Tribes (Vimukt Jatis...
63
Final Report on UGC Major Research Project (MRP) Anthropogenetic Profile of "denotified" Tribes (Vimukt Jatis) of Punjab (North-West India) and its Social Implication (From 01/ 04/ 2013 to 31/ 03/ 2017) Submitted to The University Grants Commission, New Delhi by Prof. (Dr.) S. M .S. Chahal Principal Investigator Department of Human Genetics (earlier Department of Human Biology) Punjabi University, Patiala 147002 (Punjab)
Transcript of Anthropogenetic Profile of denotified Tribes (Vimukt Jatis...
Final Report on UGC Major Research Project (MRP)
Anthropogenetic Profile of "denotified" Tribes (Vimukt Jatis) of
Punjab (North-West India) and its Social Implication
(From 01/ 04/ 2013 to 31/ 03/ 2017)
Submitted to
The University Grants Commission, New Delhi
by
Prof. (Dr.) S. M .S. Chahal
Principal Investigator
Department of Human Genetics (earlier Department of Human Biology)
Punjabi University, Patiala 147002 (Punjab)

"Anthropogenetic Profile of "denotified" Tribes (Vimukt Jatis) of Punjab
(North-West India) and its Social Implication"
INTRODUCTION
The “denotified” tribes, also known as the Vimukt Jatis, are the tribes that were originally
listed under the Criminal Tribes Act of 1871, as Criminal Tribes and "addicted to the systematic
commission of non-bailable offences." Once a tribe became "notified" as criminal, all its
members were required to register with the local magistrate, failing which they would be charged
with a crime under the Indian Penal Code.
The Act was repealed in August 1949 and former "criminal tribes" were “denotified” in
1952, when the Act was replaced with the Habitual Offenders Act 1952 of Government of India,
and in 1961 state governments started releasing lists of such tribes. At the time of the
independence in 1947, there were 13 million people in 127 communities who faced constant
surveillance, search and arrest without warrant if any member of the group was found outside the
prescribed area.
The creation of these categories should be seen in the context of colonialism. The British
authorities listed them separately by creating a category of castes or tribes labeled as criminal.
The first Census of India was conducted in 1871 and at that time there was no consensus or any
definition of "tribe". The terms "Tribe" and "Caste" were used interchangeably for these
communities. In this colonial context, the term "Tribe" connoted the notions of primitiveness and
backwardness and hence the assumption that these tribes needed to be civilized or transformed.
Today, there are 313 Nomadic Tribes and 198 “denotified” tribes in India, yet the legacy
of the Act continues to haunt the majority of 60 million people belonging to these tribes,
especially as their notification over a century ago has meant not just alienation and stereotyping
by the police and the media, but also economic hardships. A large number of them can still only
subscribe to a slightly altered label, the "Vimukt jatis" (or the Ex-Criminal Tribes).

Located on the North-West border of India, Punjab has been the gateway of the country
for the entry of different racial/ethnic stocks over millennia. Historically, the people of Punjab
are supposed to be progeny of a mixture of several proto- and post-Harappa invaders who
entered this land from the West from time to time, and of original autochthonous settlers of the
area (Rose, 1919).
Officially, presently there is no tribe in Punjab. However, there are seven “denotified”
tribes inhabiting the state namely, the Bauria, Bazigar, Bangala, Barad, Gandhila, Nat and Sansi.
Most of these have their pockets of concentration though few are distributed all over Punjab.
Their total population as per the Census of India 2001 was 436,809, the Bazigar having the
highest population (208,442), followed by the Sansi (105,337), Bauria (102,232), Barar (8,679),
Bangali (7,765), Gandhila (3,283) and Nat (1,071). The distribution of these “denotified” tribes
in Punjab is shown in Table 1.
Table 1. The “denotified” tribes and their distribution in Punjab (Census of India, 2001).
“Denotified” tribe Population District(s) of Punjab
Bauria 102,232 Faridkot, Bathinda, Mansa, Moga, Ferozepur,
Muktsar, Sangrur, Ludhiana, Kapurthala
Bazigar 208,442 Whole State
Bangali
7,765
Ropar, Gurdaspur, Amritsar, Ludhiana,
Bathinda, Sangrur, Jalandhar, Kapurthala,
Muktsar, Hoshiarpur
Barar 8,679 Hoshiarpur, Gurdaspur, Jalandhar, Amritsar
Gandhila 3,283 Patiala
Nat 1,071 Amritsar, Ferozepur, Sangrur, Ludhiana,
Jalandhar
Sansi 105,337 Gurdaspur, Hoshiarpur, Jalandhar, Ludhiana,
Patiala, Sangrur
Total 436,809 All districts

The “denotified” tribes (Vimukt Jatis) of Punjab had been struggling since India’s
independence, first to remove the tag of criminality attached to them during the British colonial
regime and second, to acquire the status of Schedule Tribe (ST). It is ironic that they had been
wrongly placed in the category of Scheduled Caste (SC) in Punjab and they see this as an attempt
to denigrate them.
The Vimukt Jatis had been contesting for Scheduled Tribe (ST) status for long so that
they have a stake in reservation quota for jobs, admissions, scholarships and other benefits
announced from time to time by the government for the ST. Since as of now they are clubbed
with the Scheduled Castes of Punjab, the so-called ‘creamy SC layer’ (e.g. the Ramdasia,
Balmiki etc.) takes all the benefits meant for SC. In fact, the illiteracy and backwardness of the
Vimukt Jatis are coming in their way to garner the benefits of any govermental reservation
policy.
The present study is a biological anthropology approach to establish the genetic profile of
the Vimukt Jatis of Punjab. As a detailed social anthropological study is already available on the
Vimukt Jatis of Punjab which indicate a tribal status for them (Singh, 2010), it would be
interesting to examine if the results from the present anthropogenetic approach corroborate this
finding. That is, the present study is an attempt to provide genetic basis to the findings of the
social-anthropological inquiry already reported in literature on the Vimukt Jatis of Punjab. This
will help make the case of the Vimukt Jatis, a socially disadvantaged group of people, for a tribal
status more rational and logical thereby helping them get their true identity validated, enabling
them get the financial and other benefits due to them.
Social anthropological evidence
The “denotified” tribes have been relevant to other communities of Punjab, directly or
indirectly, but they neither adopted the Punjabi culture nor mixed with them till they were settled
forcibly by the colonial British government. Even then the “denotified” tribes maintained
distance from the other communities. These people were suspected to pose threat to the law and
order, as thieves and burglars. Thus they were interned in the reformatories – industrial and
agricultural settlements – where they were compelled to work for their living.

After remaining in denial over the existence of Scheduled Tribes in Punjab, the Punjab
government has now been handed a report of a survey conducted by the Punjabi University,
Patiala (Singh, 2010) that concludes that seven ex-criminal (“denotified”) tribes and Gurjar
fulfill the parameters of "tribe" laid down by the Union Government and the social
anthropologists. It states that the conditions under which the “denotified” tribes live in are dismal
compared to the major Scheduled Caste communities of Punjab such as Adharmis and Balmikis,
but even then the former have been denied the benefits of any reservation policy.
Physical (biological) anthropological evidence
With only a couple of serological observations on the ABO blood groups (Sidhu and
Sidhu, 1980, 1988) in the Bazigar and Sansi and a solitary report on the RH(D) blood groups in
the Bazigar (Sidhu and Sidhu, 1988), the “denotified” Tribe populations of Punjab are little
represented on the genetic map of the state.
AIM AND OBJECTIVES
The main aim of the present investigation was to anthropogenetically characterize the
“denotified” tribes of Punjab using original data from 10 different genetic markers and 5
anthropometric measurements and use the results thus generated to address the problem of their
tribal status scientifically and rationally. The two main objectives of the present investigation
were as follows.
1. To characterize genetically the 7 "denotified" tribes (Vimukt Jatis) of Punjab viz., the
Bazigar, Sansi, Bauria, Barad, Bangala, Gandhila and Nat using original allele frequency
data from a battery of serological and DNA markers. Their anthropometric profile will
also be investigated.
2. To ascertain the tribal character, if any, of the "denotified" tribes (Vimukt Jatis) of Punjab
using the present genetic data and that reported in the literature on common markers on
different non-tribal and tribal populations of North and Central India, respectively.

METHODOLOGY
The anthropometric measurements such as stature and those required for the calculation
of the cephalic index i.e. maximum head breadth and maximum head length, and nasal index i.e.
nasal breadth and nasal height were taken in the field on a total of 1,154 male and female
subjects belonging to seven "denotified" tribes of Punjab viz., the Bazigar, Sansi, Bauria,
Bangala, Barad, Gandhila and Nat (Table 2), following standard anthropometric techniques as
given in Martin and Saller (1957) and Singh and Bhasin (1989). Ethical clearance for the present
project was obtained from the Institutional Ethical Committee of the Punjabi University, Patiala.
Table 2. Village and district wise sampling and sample sizes for the present study.
"Denotified"
tribe Village District
Sample size
Genetic
analysis
Anthropometry
Bazigar
Arnetu Patiala 68
Sanour Patiala 64
Bahadurgarh Patiala 28
Amargarh Sangrur 72
Total 232 303
Sansi
Dudhad Patiala 15
Langroi Patiala 23
Mithu Majra Patiala 14
Bagrian Sangrur 25
Kheri Jattan Sangrur 34
Rohti Channa Patiala 20
Kakrala Patiala 28
Samadgarh Sangrur 63
Total 222 241
Bauria
Leelan Megh Singh Ludhiana 198
Sherpur Kalan Ludhiana 2
Total 200 202
Bangala Doraha Ludhiana 68

Dugri 37
Total 105 105
Barar Piplanwala
Hoshiarpur
37
Saila Khurd 30
Singdiwala 07
Banga Shaheed Bhagat Singh
Nagar 43
Total 117 114
Gandhila Arnetu (n=89)
Patiala
Sadharanpur 13
Bakraha 12
Total 114 134
Nat
Bhedpura
Patiala
10
Dhablan 07
Mehmadpur 04
Shutrana 02
Aakad 02
Wazirpur Sangrur
07
Chuharpur 03
Khunimajra Rupnagar 22
Bhankarpur Sahibzada Ajit Singh
Nagar
04
Total 55 55
Grand total 1055 1154
Anthropometry
The following 5 anthropometric measurements were taken on subjects belonging to
seven "denotified" tribes of Punjab following the standardized techniques as given by Martin
and Saller (1957) and Singh and Bhasin (1989). Stature (height vertex) was measured with the
help of an anthropometric rod. For head and nose measurements, respectively, spreading and
sliding calipers were used.

1. Stature: It was taken as the vertical distance from the highest point on the head
(vertex) of the subject to the floor in the Frankfort horizontal (F-H) plane.
2. Head length: It was measured as the distance from the most prominent point in the
mid-sagittal plane of forehead (glabella) to the most prominent point on external
Occipital protuberance of the subject.
3. Head breadth: It was taken as the greatest transverse diameter on the head of the
subject from euryon to euryon (a bilaterally paired point that forms the terminus of
the line of greatest breadth of the skull).
4. Nasal height: It was measured as a distance from the point of deepest concavity of
the soft tissue contour of the root of the nose (nasion) of the subject to the point
where the lowest border of the nose meets the outer contour of the lip (subnasale).
5. Nasal breadth: It was measured as the distance between two alar points on the nose
of the subject.
The head and nose measurements so obtained were used to calculate the following two
indices.
Cephalic Index (C.I.) = (Head Breadth / Head Length) X 100
Nasal Index (N.I.) = (Nasal Breadth /Nasal Height) X 100
After obtaining the prior informed consent (Appendix-I), 3-5 ml blood sample was
collected in sterile EDTA.K2 vial from a total of 1,051 randomly chosen, unrelated, healthy adult
male and female subjects belonging to the seven "denotified" tribes of Punjab viz. the Bazigar
(n=232), Sansi (n=222), Bauria (n=200), Bangala (n=105), Barad (n=117), Gandhila (n=114) and
Nat (n=61) (Table 2). The samples were collected from various districts of Punjab in different
field works transported personally to the laboratory in the Department of Human Genetics,
Punjabi University, Patiala for their detailed laboratory analyses.
Serological analyses
In the laboratory, the red cells were typed for A1A2BO and RH(D) blood groups by the
tube method using Anti-A, Anti-A1, Anti-B and Anti-D, following standard serological
techniques (Dunsford and Bowley, 1967).

DNA genotyping
For the genetic analysis, genomic DNA was extracted from the collected blood samples
using the inorganic method of Miller et al. (1988) and it was subjected to quality and quantity
checks using a spectrophotometer. Each DNA sample was genotyped for a battery of 8 Alu
Ins/Del loci (APO, CD4, PV92, TPA25, FXIIIB, ACE, PLAT, D1) following the primer
sequences and annealing temperatures listed in Table 3. Genotyping involved amplification of
the DNA by polymerase chain reaction (PCR) using locus-specific primers for 8 Alu Ins/Del loci.
The amplified PCR products were run on 2% agarose gel with Ethidium Bromide (EtBr) as a
stain dye. The results were visualized in a UVP Gel Doc-It Imaging System and recorded (Figs.
1-8).
Table 3. Primer sequences and annealing temperatures for the studied Alu Ins/Del loci.
Marker
Primer sequence
Annealing
temperature
Reference
ACE F : 5’– CTGGAGACCACTCCCATCCTTTCT - 3’
R : 5’– GATGTGGCCATCACATTCGTCAGAT - 3’
58° C Majumder et
al. (1999)
APO F : 5’– AAGTGCTGTAGGCCATTTAGATTAG - 3’
R : 5’–AGTCTTCGATGACAGCGTATACAGA - 3’
50° C Majumder et
al. (1999)
CD4 F : 5’-AGGCCTTGTAGGGTTGGTCTGATA - 3’
R : 5’- TGCAGCTGCTGAGTGAAAGAACTG-3’
63° C Majumder et
al. (1999)
D1 F : 5’-TGCTGATGCCCAGGGTTAGTAAA - 3’
R : 5’TTTCTGCTATGCTCTTCCCTCTC -3’
56.8° C Majumder et
al. (1999)
FXIIIB F : 5’ TCAACTCCATGAGATTTTCAGAAGT - 3’
R : 5’- CTGGAAAAATGTATTCAGGTGAGT -3’
54.4° C Majumder et
al. (1999)
PLAT F : 5’-GTG AAA AGC AAG GTCTAC CAG - 3’
R : 5’- TGCAGCTGCTGAGTAAAGAATG-3’
59° C Stoneking et
al. (1999)
PV92 F:5’AACTGGGAAAATTTGAAGAGAAAGT - 3’
R : 5’GAC ACC GAG TTC ATC TTG AC -3’
52.5° C Majumder et
al. (1999)
TPA25 F : 5’- GTAAGAGTTCCGTAACAGGAC AGCT- 3’
R : 5’- CCCCACCCTAGGAGAACTTCT CTTT-3’
54° C Majumder et
al. (1999)

Fig. 1. Gel image of genotypes of Alu ACE
Allele Genotype Band size Lane number(s)
Insertion (I) Homozygous insertion (I/I) 490bp 2, 3, 6
Deletion (D) Heterozygous (I/D) 490bp, 190bp 1, 4, 5, 7, 8, 9
- Homozygous deletion (D/D) 190bp -
Fig. 2. Gel image of genotypes of Alu APO
Allele Genotype Band Size Lane number(s)
Insertion (I) Homozygous insertion (I/I) 400bp 1, 2, 3, 4
Deletion (D) Heterozygous (I/D) 400bp, 100bp 5, 7
Homozygous deletion (D/D) 100bp 6

Fig. 3. Gel image of genotypes of Alu CD4
Allele Genotype Band Size Lane number(s)
Insertion (I) Homozygous insertion (I/I) 1500bp 1, 2, 4, 5, 6, 7
Deletion (D) Heterozygous (I/D) 1500bp, 1200bp 3
Homozygous deletion (D/D) 1200bp -
Fig. 4. Gel image of genotypes of Alu D1
Allele Genotype Band Size Lane number(s)
Insertion (I) Homozygous insertion (I/I) 650bp 2, 3, 5, 8, 9
Deletion (D) Heterozygous (I/D) 650bp, 350bp 1, 7
Homozygous deletion (D/D) 350bp 4, 6
Fig. 5. Gel image of genotypes of Alu FXIIIB
Allele Genotype Band Size Lane number(s)
Insertion (I) Homozygous insertion (I/I) 700bp 1, 2, 6, 8
Deletion (D) Heterozygous (I/D) 700bp, 460bp 5, 7
- Homozygous deletion (D/D) 460bp 3, 4, 9
Fig. 6. Gel image of genotypes of Alu PLAT
Allele Genotype Band Size Lane number(s)
Insertion (I) Homozygous insertion (I/I) 570bp 3, 6
Deletion (D) Heterozygous (I/D) 570bp, 260bp 4, 5, 7
- Homozygous deletion (D/D) 260bp 1, 2

Fig. 7. Gel image of genotypes of Alu PV92
Allele Genotype Band Size Lane number(s)
Insertion (I) Homozygous insertion (I/I) 400bp 4
Deletion (D) Heterozygous (I/D) 400bp, 110bp 1, 2, 3, 5, 6
- Homozygous deletion (D/D) 110bp 7
Fig. 8. Gel image of genotypes of Alu TPA25
Allele Genotype Band Size Lane number(s)
Insertion (I) Homozygous insertion (I/I) 400bp 1, 2, 3, 4
Deletion (D) Heterozygous (I/D) 400bp, 100bp 5, 7
Homozygous deletion (D/D) 100bp 6

Statistical Analyses
Allele frequencies were calculated in the ABO blood group system following Yasuda
(1984), in the RH(D) blood group system by the square root method and in the DNA markers by
the gene counting method (Mourant et al., 1976). Deviations from the Hardy–Weinberg
equilibrium were studied by the goodness-of-fit chi-square (χ2HW) test using phenotype/genotype
data. Contingency χ2 test was used to study overall inter-group differences using phenotype
counts of A1A2BO and RH(D) loci and genotype counts for Alu Ins/Del markers. To assess the
extent of gene differentiation among the present "denotified" ” tribes of Punjab, the Nei’s (1973)
measure of gene differentiation was calculated. To seek genomic affinities among the present
"denotified" ” tribes of Punjab, the pair wise estimates of genetic distance (D) (Nei, 1972) were
calculated and dendrograms were constructed by UPGMA method (Sneath and Sokal, 1973)
using PHYLIP 3.695 Software
RESULTS
Anthropometric Analysis
Five anthropometric measurements (Stature, head breadth, head length, nasal height and nasal
breadth) were taken on a total of 1154 male and female subjects belonging to 7 "denotified"
tribes of Punjab viz., the Gandhila, Barad, Bangala, Bazigar, Sansi, Bauria and Nat, using the
standard anthropometric instruments and techniques (Martin and Saller, 1957; Singh and Bhasin,
1989).
Head and nose measurements were used to calculate cephalic index (C.I.) and nasal index
(N.I.), respectively. Tables 4-11 present the results of the anthropometric investigation in the
present study.
Stature, Nasal Index and Cephalic Index
Descriptive statistics for the stature, nasal index and cephalic index such as mean,
standard deviation (S.D.) and standard error (S.E.) are given in Table 4.

Table 4. Descriptive statistics of the Stature, Nasal Index and Cephalic Index in various
"denotified" tribes of Punjab, North West India.
"Denotified"
tribe
Gender
n
Stature
(mm)
Nasal Index
(N.I.)
Cephalic Index
(C.I.)
Mean S.D. S.E. Mean S.D. S.E. Mean S.D. S.E.
Gandhila
Male 26 1563.8 70.0 13.7 79.6 9.1 1.8 77.1 3.9 0.8
Female 108 1577.1 73.3 7.1 82.5 9.1 0.9 76.5 3.8 0.4
Total 134 1574.5 72.6 6.3 81.9 9.1 0.8 76.6 3.9 0.3
Barad
Male 38 1532.1 86.0 14.0 80.5 11.8 1.9 79.6 3.7 0.6
Female 76 1536.3 63.1 7.2 79.0 9.6 1.1 79.2 2.9 0.3
Total 114 1534.9 71.2 6.7 79.5 10.4 1.0 79.3 3.2 0.3
Bangala
Male 27 1714.2 56.0 10.8 76.5 8.1 1.6 78.2 4.3 0.8
Female 78 1542.6 52.1 5.9 74.1 7.6 0.9 83.1 3.2 0.4
Total 105 1586.7 92.1 9.0 74.7 7.8 0.7 81.9 4.1 0.4
Bazigar
Male 84 1678.6 63.2 6.9 78.7 9.3 1.0 75.4 3.4 0.4
Female 219 1538.5 53.9 3.6 75.7 8.7 0.6 78.2 3.1 0.2
Total 303 1577.4 84.5 4.9 76.5 8.9 0.5 77.5 3.4 0.2
Bauria
Male 55 1650.9 68.2 9.2 73.8 8.4 1.1 78.6 3.3 0.5
Female 147 1537.3 54.1 4.5 70.5 8.4 0.7 80.7 3.5 0.3
Total 202 1568.1 77.0 5.4 71.4 8.5 0.6 80.1 3.5 0.3
Sansi
Male 72 1596.9 88.2 10.4 84.9 4.8 0.6 78.6 3.4 0.4
Female 169 1571.6 71.8 5.5 71.5 5.2 0.4 79.0 4.1 0.3
Total 241 1579.1 77.8 5.0 75.5 7.9 0.5 78.9 3.9 0.3
Nat
Male 11 1677.3 39.8 12.0 72.4 8.9 2.7 76.9 4.0 1.2
Female 44 1532.6 54.3 8.2 68.4 7.1 1.1 77.7 5.0 0.8
Total 55 1561.5 77.8 10.5 69.2 7.6 1.0 77.5 4.8 0.7
Stature
Table 5 presents gender wise classification of the stature as proposed by Martin and
Saller (1957). Based on the results of the stature observed in the present "denotified" tribes of
Punjab, the subjects were classified into different categories as shown in Table 6. Short stature
was common only in the Barad with a total (male + female) frequency of 40.3%. The Gandhila,
Bazigar and Sansi showed an overall preponderance for lower medium stature while the Bauria
and Nat were observed to have medium type of stature and tall stature was observed to be
common in the Bangala. No subject was classified under pygmy and giant stature types in the
present "denotified" tribes of Punjab.
Table 5. Classification of stature according to Martin and Saller (1957).
Class
Stature range (mm)
Males Females
Pygmy Under 1290 Under 1209
Very Short 1300 - 1499 1210 – 1399
Short 1500 – 1599 1400 – 1489
Lower Medium 1600 – 1639 1490 – 1529
Medium 1640 – 1669 1530 – 1559
Upper Medium 1670 – 1699 1560 – 1589
Tall 1700 – 1799 1590 – 1679
Very Tall 1800 – 1999 1680 – 1869
Giant 2000 and above 1870 and above

Table 6. Distribution of subjects of seven "denotified" tribes of Punjab according to stature
type.
“Denotified”
tribe
Gender
Stature type
Very Short
Short Lower Medium
Medium Upper Medium
Tall Very Tall
Gandhila
(n=134)
Male
00
(0.0%)
04
(3.0%)
04
(3.0%)
03
(2.2%)
05
(3.7%)
09
(6.7%)
01
(0.75%)
Female
00 (0.0%)
09 (6.7%)
30 (22.4%)
26 (19.4%)
19 (14.2%)
23 (17.2%)
01 (0.75%)
Total 00
(0.0%)
13
(9.7%)
34
(25.4%)
29
(21.6%)
24
(17.9%)
32
(23.9%)
02
(1.5%)
Barad
(n=114)
Male
01 (0.9%)
20 (17.5%)
11 (9.6%)
04 (3.5%)
00 (0.0%)
02 (1.7%)
00 (0.0%)
Female
02
(1.7%)
26
(22.8%)
22
(19.3%)
15
(13.2%)
07
(6.1%)
04
(3.5%)
00
(0.0%)
Total 03 (2.6%)
46 (40.3%)
33 (28.9%)
19 (16.7%)
07 (6.1%)
06 (5.2%)
00 (0.0%)
Bangala
(n=105)
Male
00
(0.0%)
00
(0.0%)
02
(1.9%)
04
(3.8%)
03
(2.8%)
17
(16.2%)
01
(0.95%)
Female
01 (0.95%)
10 (9.5%)
20 (19.0%)
19 (18.1%)
15 (14.3%)
13 (12.4%)
00 (0.0%)
Total 01
(0.95%)
10
(9.5%)
22
(20.9%)
23
(21.9%)
18
(17.1%)
30
(28.6%)
01
(0.95%)
Bazigar
(n=303)
Male
00 (0.0%)
08 (2.6%)
13 (4.3%)
14 (4.6%)
15 (4.9%)
31 (10.2%)
01 (0.3%)
Female
00
(0.0%)
42
(13.9%)
55
(18.1%)
49
(16.2%)
40
(13.2%)
32
(10.6%)
03
(1.0%)
Total 00 (0.0%)
50 (16.5%)
68 (22.4%)
63 (20.8%)
55 (18.1%)
63 (20.8%)
04 (1.3%)
Bauria
(n=202)
Male
02
(1.0%)
09
(4.4%)
13
(6.4%)
10
(5.0%)
08
(3.9%)
12
(5.9%)
01
(0.5%)
Female
00 (0.0%)
28 (13.9%)
31 (15.3%)
36 (17.8%)
29 (14.4%)
22 (10.9%)
01 (0.5%)
Total 02
(1.0%)
37
(18.3%)
44
(21.7%)
46
(22.8%)
37
(18.3%)
34
(16.8%)
02
(1.0%)
Sansi
(n=241)
Male
00 (0.0%)
08 (3.3%)
16 (6.6%)
13 (5.4%)
18 (7.5%)
15 (6,2%)
02 (0.8%)
Female
00
(0.0%)
25
(10.4%)
44
(18.3%)
44
(18.3%)
28
(11.6%)
24
(10.0%
04
(1.7%)
Total 00 (0.0%)
33 (13.7%)
60 (24.9%)
57 (23.6%)
46 (19.1%)
39 (16.2%)
06 (2.5%)
Nat (n=55)
Male
00
(0.0%)
00
(0.0%)
00
(0.0%)
05
(9.1%)
03
(5.5%)
03
(5.5%)
00
(0.0%)
Female
01 (1.8%)
07 (12.7%)
12 (21.8%)
12 (21.8%)
08 (14.5%)
04 (7.3%)
00 (0.0%)
Total 01
(1.8%)
07
(12.7%)
12
(21.8%)
17
(30.9%)
11
(20.0%)
07
(12.8%)
00
(0.0%)

Nasal Index
Table 7 presents the classification of nose type based on mean Nasal Index (NI) proposed
by Martin and Saller (1957).
Table 7. Different nose types on the basis of Nasal Index (NI) according to Martin and
Saller (1957).
Nose type Nasal Index Range (mm)
Leptorrhine < 69.9
Mesorrhine 70 – 84.9
Platyrrhine 85 – 99.9
Hyperplatyrrhine > 100
Table 8 shows the frequency distribution of different nose types in seven "denotified"
tribes of Punjab. The table shows that mesorrhine nose type was commonly found in all of them
with a frequency distribution ranging from 66.7% in the Bangala to 50.0% in the Bauria except
for the Nat (38.2%). The frequency distribution of different nose types in the present Bangala,
Bazigar, Bauria and Sansi "denotified" tribes of Punjab followed a sequence pattern mesorrhine
> leptorrhine > platyrrhine > hyperplatyrrhine. While for the Gandhila and Barad the sequence
pattern observed was mesorrhine > platyrrhine > leptorrhine > hyperplatyrrhine.
Hyperplatyrrhine showed the lowest frequency in all the studied "denotified" tribes of the present
study and the nose type was found absent in both the Sansi and Nat.
Table 8. Frequency distribution of nose types in 7 "denotified" tribes of Punjab, North
West India.
"Denotified"
tribe
Nasal
index
(NI)
Nose type
Male
%
Female
%
Total
%
Gandhila
< 69.9 Leptorrhine 3 2.2 9 6.7 12 8.9
70 – 84.9 Mesorrhine 15 11.2 59 44.0 74 55.2
85 – 99.9 Platyrrhine 8 6.0 36 26.9 44 32.9

> 100 Hyperplatyrrhine 0 0.0 4 3.0 4 3.0
Total 26 19.4 108 80.6 134 100
Barad
< 69.9 Leptorrhine 7 6.1 17 15.0 24 21.1
70 – 84.9 Mesorrhine 21 18.4 37 32.5 58 50.9
85 – 99.9 Platyrrhine 9 7.9 20 17.5 29 25.4
> 100 Hyperplatyrrhine 1 0.9 2 1.7 3 2.6
Total 38 33.3 76 66.7 114 100
Bangala
< 69.9 Leptorrhine 4 3.8 23 21.9 27 25.7
70 – 84.9 Mesorrhine 21 20.0 49 46.7 70 66.7
85 – 99.9 Platyrrhine 2 1.9 6 5.7 8 7.6
> 100 Hyperplatyrrhine 0 0.0 0 0.0 0 0.0
Total 27 25.7 78 74.3 105 100
Bazigar
< 69.9 Leptorrhine 13 4.3 53 17.5 66 21.8
70 – 84.9 Mesorrhine 51 16.8 133 43.9 184 60.7
85 – 99.9 Platyrrhine 20 6.6 31 10.2 51 16.8
> 100 Hyperplatyrrhine 0 0.0 2 0.6 2 0.6
Total 84 27.7 219 72.3 303 100
Bauria
< 69.9 Leptorrhine 18 8.9 69 34.2 87 43.1
70 – 84.9 Mesorrhine 32 15.8 69 34.2 101 50.0
85 – 99.9 Platyrrhine 4 2.0 9 4.5 13 6.4
> 100 Hyperplatyrrhine 1 0.5 0 0.0 1 0.5
Total 55 27.2 147 72.8 202 100
< 69.9 Leptorrhine 16 6.6 43 17.9 59 24.5
70 – 84.9 Mesorrhine 47 19.5 108 44.8 155 64.3

Sansi 85 – 99.9 Platyrrhine 9 3.7 18 7.5 27 11.2
> 100 Hyperplatyrrhine 0 0 0 0 0 0
Total 72 29.8 169 70.2 241 100
Nat
< 69.9 Leptorrhine 6 10.9 26 47.3 32 58.2
70 – 84.9 Mesorrhine 3 5.5 18 32.7 21 38.2
85 – 99.9 Platyrrhine 2 3.6 0 0.0 2 3.6
> 100 Hyperplatyrrhine 0 0.0 0 0.0 0 0.0
Total 11 20.0 44 80.0 55 100
Cephalic Index
Table 9 presents the classification of head types based on Cephalic Index (C.I.) as
proposed by Martin and Saller (1957).
Table 9. Different head types on the basis of Cephalic Index (C.I.) according to Martin and
Saller (1957).
Head type Cephalic Index
range (mm)
Dolichocephalic < 74.9
Mesocephalic 75 – 79.9
Brachycephalic 80 – 84.9
Hyperbrachycephalic > 85
The distribution frequency for different head types in present “denotified” tribes of
Punjab is given in Table 10 according to which mesocephalic head was observed in the highest
frequency among the Gandhila, Barad, Bazigar, Sansi and Nat ranging from as high as 57.4% in
the Bazigar to 45.4% in the Nat. However, brachycephalic head type was observed in highest
frequency in the Bangala (44.8%) and Bauria (42.1%). The sequence pattern for distribution of
different head types in order of high to low frequency was observed to be similar in the Gandhila
and Nat (mesocephalic > doliococephalic >brachycephalic > hyperbrachycephalic). While a

similar pattern as mesocephalic >brachycephalic > dolicocephalic > hyperbrachycephalic was
observed in the Barad, Bazigar and Sansi. The Bauria and Bangala showed a different pattern
from rest of the five populations, the sequence pattern observed in former two populations was
brachycephalic > mesocephalic > hyperbrachycephalic > dolicocephalic and brachycephalic >
hyperbrachycephalic > mesocephalic > dolicocephalic.
Table 10. Distribution of head types in 7 "denotified" tribes of Punjab, North West India.
"Denotified"
tribe
Cephalic
Index (CI)
Head type Male % Female % Total %
Gandhila
< 74.9 Dolichocephalic 10 7.5 35 26.1 45 33.6
75 – 79.9 Mesocephalic 10 7.5 52 38.8 62 46.3
80 – 84.9 Brachycephalic 5 3.7 19 14.2 24 17.9
> 85 Hyperbrachycephalic 1 0.7 2 1.5 3 2.2
Total 26 19.4 108 80.6 134 100
Barad
< 74.9 Dolichocephalic 4 3.5 6 5.3 10 8.8
75 – 79.9 Mesocephalic 21 18.4 35 30.7 56 49.1
80 – 84.9 Brachycephalic 9 7.9 34 29.8 43 37.7
> 85 Hyperbrachycephalic 4 3.5 1 0.9 5 4.4
Total 38 33.3 76 66.7 114 100
Bangala
< 74.9 Dolichocephalic 6 5.7 2 1.9 8 7.6
75 – 79.9 Mesocephalic 15 14.3 8 7.6 23 21.9
80 – 84.9 Brachycephalic 4 3.8 43 41.0 47 44.8
> 85 Hyperbrachycephalic 2 1.9 25 23.8 27 25.7
Total 27 25.7 78 74.3 105 100
Bazigar
< 74.9 Dolichocephalic 34 11.2 29 9.6 63 20.8
75 – 79.9 Mesocephalic 43 14.2 131 43.2 174 57.4

80 – 84.9 Brachycephalic 7 2.3 57 18.8 64 21.1
> 85 Hyperbrachycephalic 0 0.0 2 0.7 2 0.7
Total 84 27.7 219 72.3 303 100
Bauria
< 74.9 Doliochocephalic 7 3.4 6 3 13 6.4
75 – 79.9 Mesocephalic 27 13.4 56 27.7 83 41.1
80 – 84.9 Brachycephalic 19 9.4 66 32.7 85 42.1
> 85 Hyperbrachycephalic 2 1 19 9.4 21 10.4
Total 55 27.2 147 72.8 202 100
Sansi
< 74.9 Dolichocephalic 22 9.1 15 6.2 37 15.3
75 – 79.9 Mesocephalic 41 17.0 71 29.5 112 46.5
80 – 84.9 Brachycephalic 9 3.7 70 29.1 79 32.8
> 85 Hyperbrachycephalic 0 0.0 13 5.4 13 5.4
Total 72 29.8 169 70.2 241 100
Nat
< 74.9 Dolichocephalic 3 5.5 11 20.0 14 25.5
75 – 79.9 Mesocephalic 6 10.9 19 34.5 25 45.4
80 – 84.9 Brachycephalic 2 3.6 11 20.0 13 23.6
> 85 Hyperbrachycephalic 0 0.0 3 5.5 3 5.5
Total 11 20.0 44 80.0 55 100
Table 11 presents gender wise distribution of stature, head and nose type in male and
female subjects of the seven “denotified” tribes of Punjab. As inferred from the mean stature in
male subjects of the seven “denotified” tribes, the short stature type was found most common in
the Gandhila, Barad and Sansi populations followed by medium stature type in the Bauria males
and upper medium in the Bazigar and Nat males. In contrast to this the female subjects of the
“denotified” tribes showed a preponderance of medium stature in all except Gandhila and Sansi
females among which upper medium stature was most commonly found. The mesorrhine nose

type was most commonly observed for all “denotified” tribes of Punjab except for the Nat
females in which leptorrhine nose type was most commonly observed and mesocephalic head
type was most commonly observed in all “denotified” tribes of Punjab except in the Bauria and
Bangala females in which brachycephalic head type was found to be most common.
Table 11. Gender wise distribution of the stature, head type and nose type in 7"denotified"
tribes of Punjab.
"Denotified"
tribe
Gender
Mean
Stature
(mm)
Stature type Mean
Nasal
Index
Nose type
Mean
Cephalic
Index
Head type
Gandhila Male 1563.8 Short 79.6 Mesorrhine 77.1 Mesocephalic
Female 1577.1 Upper medium 82.5 Mesorrhine 76.5 Mesocephalic
Barad Male 1532.1 Short 80.5 Mesorrhine 79.6 Mesocephalic
Female 1536.3 Medium 79.0 Mesorrhine 79.2 Mesocephalic
Bangala Male 1714.2 Tall 76.5 Mesorrhine 78.2 Mesocephalic
Female 1542.6 Medium 83.6 Mesorrhine 83.1 Brachycephalic
Bazigar Male 1678.6 Upper medium 78.7 Mesorrhine 75.4 Mesocephalic
Female 1538.5 Medium 75.7 Mesorrhine 78.2 Mesocephalic
Bauria Male 1650.9 Medium 73.8 Mesorrhine 78.6 Mesocephalic
Female 1537.3 Medium 70.5 Mesorrhine 80.7 Brachycephalic
Sansi Male 1596.9 Short 84.9 Mesorrhine 78.6 Mesocephalic
Female 1571.6 Upper medium 71.5 Mesorrhine 79.0 Mesocephalic
Nat Male 1677.3 Upper medium 72.4 Mesorrhine 76.9 Mesocephalic
Female 1532.6 Medium 68.4 Leptorrhine 77.7 Mesocephalic
A1A2BO and RH(D) blood groups
The results of serological analysis are presented in Table 12-13. No typing could be done
for the Barad population due to haemolysis of blood during the transportation from field area to
the laboratory. Table 12 shows the observed phenotype numbers of A1A2BO blood groups for
six "denotified" tribes of Punjab investigated. The frequency of phenotype B was observed high
in the Gandhila (38.05%), Sansi (52.61%) and Bauria (52.74%) whereas the phenotype O

showed high frequency in the Bangala (49.52%), Nat (42.00%) and Bazigar (42.96%).
Phenotype A2 was found in low proportions in all "denotified" tribes of Punjab (range 0.88% in
Gandhila - 6.67% in Bangala) barring the Bauria. The phenotype A2B was not observed in the
Bangala and Bauria while it was found in low frequency in the Bazigar (0.43%) and Sansi
(1.61%). Hardy Weinberg Chi-square test revealed that barring the Nat (χ2=10.4621, p<0.05,
statistically significant) all studied populations were in genetic equilibrium with respect to the
distribution of A1A2BO blood groups. One possible reason for genetic disequilibrium in the Nat
may be the genetic drift due to its small sample size.
Table 12. Distribution of the A1A2BO blood groups in "denotified" tribes of Punjab.
“Denotified”
tribe
Number
tested
A1
A2
B
A1B
A2B
O
χ2HW
(d.f. 2)
Gandhila 113 25
(22.12)
01
(0.88)
43
(38.05)
21
(18.58)
02
(1.77)
21
(18.58)
3.1844
Bangala 105 22
(20.95)
07
(6.67)
22
(20.95)
02
(1.90)
00
(0.00)
52
(49.52)
1.8993
Nat 50 11
(22.00)
01
(2.00)
13
(26.00)
02
(4.00)
02
(4.00)
21
(42.00)
10.4621*
Bazigar 233 30
(12.88)
03
(1.29)
85
(36.48)
16
(6.87)
01
(0.43)
98
(42.06)
2.0255
Sansi 249 26
(10.44)
09
(3.61)
131
(52.61)
21
(8.43)
04
(1.61)
58
(23.29)
1.5513
Bauria 201 17
(8.46)
00
(0.00)
106
(52.74)
10
(4.98)
00
(0.00)
68
(33.83)
0.0087
Figures in parentheses are percentages
*Statistically significant (p≤ 0.05)
For RH(D) blood group system (Table 13). The absence of RH(D)- phenotype is
considered to be a tribal characteristic in populations of India which in the present study was the
case observed in the Nat "denotified" tribe. However, RH(D)- phenotype was detected in other 5
"denotified" tribes of Punjab, albeit in low frequency, ranging from 1.77% (Gandhila) to 8.03%
(Sansi).

Table 13. Distribution of the RH(D) blood groups in "denotified" tribes of Punjab.
“Denotified” tribe
Number tested
RH(D) +
RH(D) –
Gandhila 113 111 (98.23) 02 (1.77)
Bangala 105 99 (94.29) 06 (5.71)
Nat 50 50 (100.00) 00 (0.00)
Bazigar 233 222 (95.28) 11 (4.72)
Sansi 249 229 (91.97) 20 (8.03)
Bauria 201 190 (94.53) 11 (5.47)
Figures in parentheses are percentages.
Distribution of allele frequencies for the A1A2BO blood groups for the studied six
“denotified” tribes of Punjab are presented in Table 14. The frequency of the B allele was found
to be high in all the "denotified" tribes of Punjab ranging from 0.1235 in the Bangala to 0.3888
in the Sansi and the frequency of allele A1 was observed in a range of 0.0695 in the Bauria to
0.2243 in the Gandhila while, A2 was detected in low frequency (range 0.0097 in the Bazigar to
0.0461 in the Bangala) in all but the Bauria "denotified" tribe of Punjab. Overall the distribution
pattern of A1A2BO locus allele frequencies observed in the "denotified" tribes of Punjab was
0>B>A1>A2. At the RH(D) locus, the frequency of d allele was observed low in the "denotified"
tribes of Punjab ranging from 0.1330 (Gandhila) to 0.2834 (Sansi) while the allele was lacking in
the Nat.
Table 14. Distribution of the allele frequencies of the A1A2BO and RH(D) blood group
systems in six "denotified" tribes of Punjab.
“Denotified”
tribe
Allele frequencies
A1A2BO RH(D)
A1 A2 B O D d
Gandhila 0.2243 0.0099 0.3437 0.4221 0.8670 0.1330

Bangala 0.1226 0.0461 0.1235 0.7078 0.7609 0.2391
Nat 0.1411 0.0155 0.1856 0.6578 1.0000 0.0000
Bazigar 0.1029 0.0097 0.2471 0.6402 0.7827 0.2173
Sansi 0.0986 0.0357 0.3888 0.4769 0.7166 0.2834
Bauria 0.0695 0.0000 0.3494 0.5811 0.7661 0.2339
Contingency χ2 test
Contingency χ2 test was conducted to study overall inter-group variation among the six
"denotified" tribes of Punjab with respect to A1A2BO and RH(D) blood group systems and the
results are presented in Tables 15 and 16, respectively. The contingency χ2 for A1A2BO blood
groups (χ2=130.2237, p<0.05 at 25 d.f.) demonstrated statistically significant heterogeneity
among the six "denotified" tribes of Punjab. However, the contingency χ2 test for RH(D) blood
groups (χ2 = 9.5794, p>0.05 at 5 d.f.) revealed no such inter-group differences demonstrating
genetic homogeneity among the six "denotified" tribes of Punjab for RH(D) blood groups
distribution.
Table 15. Contingency Chi Square test for the A1A2BO blood group system among six
"denotified" tribes of Punjab
Phenotype Number Gandhila Bangala Nat Bazigar Sansi Bauria Chi square (d.f. 25)
A1 Obs. No. 25 22 11 30 26 17
130.2237
Exp. No. 15.56 14.46 6.88 32.10 34.30 27.68
A2 Obs. No. 01 07 01 03 09 00
Exp. No. 2.49 2.31 1.10 5.14 5.49 4.44
B Obs. No. 43 22 13 85 131 106
Exp. No. 47.52 44.16 21.03 98.00 104.73 84.54
A1B Obs No. 21 02 02 16 21 10
Exp. No. 8.55 7.95 3.78 17.64 18.85 15.21
A2B Obs. No. 02 00 02 01 04 00
Exp. No. 1.07 0.99 0.47 2.20 2.35 1.90
0 Obs. No. 21 52 21 98 58 68
Exp. No. 37.78 35.11 16.72 77.91 83.26 67.21
Obs. No. = Observed number, Exp. No. = Expected number

Table 16. Contingency Chi Square test for the RH(D) blood group system among six
"denotified" tribes of Punjab.
Phenotype Number Gandhila Bangala Nat Bazigar Sansi Bauria Chi square
(d.f. 5)
RH(D) + Obs. No. 111 99 50 222 229 190
9.5794 Exp. No. 107.06 99.48 47.37 220.75 235.91 190.43
RH(D) - Obs. No. 02 06 00 11 20 11
Exp. No. 5.94 5.52 2.63 12.25 13.09 10.57
Obs. No. = Observed number, Exp. No. = Expected number.
Heterozygosity
In the present study the heterozygosity (h), a measure of genetic variation, was estimated
at the A1A2BO and RH(D) loci in the six “denotified” tribes of Punjab following Nei (1973) and
the results are presented in Table 17. For A1A2BO locus h was found to be high for all the seven
“denotified" tribes of Punjab ranging from 0.4666 in the Bangala to 0.6533 in the Gandhila with
an average of 0.5495. For RH(D) locus, heterozygosity was observed nil in the Nat while in the
remaining “denotified” tribes of Punjab the range was 0.2306 in the Gandhila to 0.4062 in the
Sansi with an average of 0.2832. The average heterozygosity (H) for both A1A2BO and RH(D)
varied from 0.2564 in the Nat to 0.5084 in the Sansi.
Table 17. Heterozygosity (h) values at the A1A2BO and RH(D) loci in six "denotified"
tribes of Punjab.
“Denotified” tribe
Heterozygosity (h)
Average
Heterozygosity (H)
A1A2BO RH(D)
Gandhila 0.6533 0.2306 0.4420
Bangala 0.4666 0.3639 0.4153
Nat 0.5127 0.0000 0.2564
Bazigar 0.5184 0.3402 0.4293
Sansi 0.6105 0.4062 0.5084
Bauria 0.5354 0.3584 0.4469
Average 0.5495 0.2832 0.4164

Gene diversity and differentiation
Nei's gene diversity estimates (Nei, 1973) for the A1A2BO and RH(D) in the seven
“denotified” tribes of Punjab are presented in Table 18. For A1A2BO locus the total gene
diversity (HT) was high 0.5715 and most of it was attributed to the intra-populational gene
diversity (HS) 0.5495 than the inter-populational gene diversity (DST) 0.0220. For RH(D) locus
total genetic diversity was found moderate (HT) 0.3009 , and like A1A2BO locus, most of it was
due to intra-populational gene diversity (HS) 0.2832 while only a small fraction (0.0177) was due
to inter-populational gene diversity (DST). The coefficient of gene differentiation (GST) at
A1A2BO locus was 0.0386 which was less than that obtained at RH(D) locus (0.0588), with an
average of 0.0487 at both serological loci.
Table 18. Coefficient of gene differentiation (GST) at the A1A2BO and RH(D) loci in 6
"denotified" tribes of Punjab, North West India
Locus
Total gene
diversity of
the population
(HT)
Intra-
populational
gene diversity
(HS)
Inter-
populational
gene diversity
(DST)
Coefficient of
gene
differentiation
(GST)
A1A2BO 0.5715 0.5495 0.0220 0.0386
RH(D) 0.3009 0.2832 0.0177 0.0588
Average 0.4362 0.4164 0.0199 0.0487
Genetic Distance
To study genetic relationships among the present "denotified" tribes of Punjab, the Nei's
measure of genetic distance (D) was estimated from the allele frequencies and the results are
presented in Table 19. The D value varied from a low of 0.0058 between the Bazigar and Nat,
suggesting close genomic affinities between them to as high as 0.1526 between the Gandhila and
Bangala suggesting little affinities between them.

Table 19. Pair wise genetic distance (D) among various "denotified" tribes of Punjab.
“Denotified”
tribe
Gandhila Bangala Nat Bazigar Sansi Bauria
Gandhila -
Bangala 0.1526 -
Nat 0.0964 0.0064 -
Bazigar 0.0770 0.0202 0.0058 -
Sansi 0.0279 0.1324 0.0847 0.0504 -
Bauria 0.0521 0.0725 0.0405 0.0160 0.0133 -
An UPGMA dendrogram was constructed using this distance matrix (Table 19) and is
presented in Fig. 9. The figure shows that the present "denotified" tribes of Punjab were placed
into two sub-clusters, each with three "denotified" tribes - one cluster comprised the Sansi,
Bauria and Gandhila while the other included the Bazigar, Nat and Bangala.
Fig. 9. UPGMA Tree depicting genetic affinities among the six "denotified" tribes of
Punjab based on blood groups data.
Alu Ins/Del POLYMORPHISMS
Distribution of Alu Ins/Del genotype counts
The observed genotype numbers for the 8 Alu Ins/Del loci studied in the 7 "denotified"
tribes of Punjab were tested for genetic equilibrium by Hardy–Weinberg (HW) χ2 goodness of fit
test and for inter-group heterogeneity by the contingency χ2 test (Table 20). The results showed
that the distribution of genotypes of Alu ACE, APO, FXIIIB and PV92 were in Hardy–Weinberg
equilibrium (HWE) in all the seven "denotified" tribes investigated. Overall statistically

significant departures were observed for 11 out of total 56 HWE tests. Notably as many as 6 of
the 11 departures were found at D1 locus, while CD4 locus showed significant departures in the
Bazigar and Sansi, PLAT locus showed such departures in the Gandhila and Barad and TPA25
locus showed it only in the Gandhila. Further, to rule out fluke findings as a result of expected
genotype number obtained as less than 5, Yates’ correction was applied for CD4 locus in the
Sansi and for PLAT locus in the Barad. Contingency χ2 test was carried out at each of the eight
loci with respect to seven populations and the χ2 values were found to be statistically significant
(p≤ 0.05 at 12 d. f.) for all of them (Table 10).
Table 20. Observed genotype numbers, allele frequencies, H.-W. Chi-square (χ2H-W) and
Contingency χ2 for eight Alu Ins/Del loci in the seven "denotified" tribes of Punjab
Marker
locus
"Denotified"
tribe
Number
tested
Genotype numbers
observed
Allele
frequencies
χ2 H-W
(d.f. 1)
Contingency
χ2
(d.f. 12)
I/I I/D D/D I D
154.4945*
APO Gandhila 92 79 12 1 0.9239 0.0761 0.0723
Barad 104 51 47 6 0.7163 0.2837 1.3056
Bangala 78 44 25 9 0.7244 0.2756 3.0380
Bazigar 200 160 35 5 0.8875 0.1125 2.1803
Bauria 198 82 95 21 0.6540 0.3460 0.7181
Sansi 190 165 25 0 0.9342 0.0658 0.9422
Nat 60 45 12 3 0.85 0.15 1.7542
ACE Gandhila 100 14 52 34 0.4000 0.6000 0.6945
78.8431*
Barad 96 55 32 9 0.7396 0.2604 1.7404
Bangala 96 48 44 4 0.7292 0.2708 2.4711
Bazigar 192 72 87 33 0.6016 0.3985 0.5755
Bauria 189 60 90 39 0.5556 0.4444 0.2411
Sansi 192 63 102 27 0.5937 0.4063 1.9670
Nat 58 29 26 3 0.7241 0.2759 0.8636

CD4 Gandhila 86 73 11 2 0.9128 0.0872 1.6485
64.6330*
Barad 100 88 10 2 0.9300 0.0700 2.8086
Bangala 85 83 2 0 0.9882 0.0118 0.0120
Bazigar 194 154 26 14 0.8608 0.1392 35.0145*
Bauria 195 186 9 0 0.9770 0.0230 0.1088
Sansi 197 189 6 2 0.9746 0.0254 16.3156#*
Nat 61 47 12 2 0.8688 0.1312 0.4735
D1 Gandhila 98 48 18 34 0.5612 0.4388 38.5341*
116.7084*
Barad 98 12 18 68 0.2143 0.7857 20.2480*
Bangala 104 18 24 62 0.2885 0.7115 19.9370*
Bazigar 195 81 42 72 0.5231 0.4769 62.9800*
Bauria 195 30 42 123 0.2615 0.7385 38.1653*
Sansi 201 87 24 90 0.4925 0.5075 116.446*
Nat 58 5 22 31 0.2759 0.7241 0.1484
FXIIIB Gandhila 96 18 52 26 0.4583 0.5417 0.7934
41.1978*
Barad 94 34 50 10 0.6277 0.3723 1.7905
Bangala 96 46 36 14 0.6667 0.3333 2.3437
Bazigar 201 54 105 42 0.5299 0.4701 0.4731
Bauria 192 57 84 51 0.5157 0.4843 2.9591
Sansi 180 69 81 30 0.6083 0.3917 0.5578
Nat 61 13 29 19 0.4508 0.5492 0.0970
PLAT Gandhila 91 24 61 6 0.5989 0.4011 14.2167*
144.6662*
Barad 101 9 24 68 0.2080 0.7920 6.8334#*
Bangala 97 8 47 42 0.3247 0.6753 1.0656
Bazigar 195 48 87 60 0.4692 0.5308 2.1213
Bauria 191 35 88 68 0.4136 0.5864 0.4810
Sansi 197 18 99 80 0.3426 0.6574 2.6313
Nat 60 28 29 3 0.7083 0.2917 1.7288

PV92
Gandhila 95 9 43 43 0.3210 0.6790 0.1390
56.1548*
Barad 95 36 50 9 0.6421 0.3579 2.0010
Bangala 96 20 52 24 0.4792 0.5208 0.6971
Bazigar 183 36 88 59 0.4372 0.5628 0.0952
Bauria 195 21 99 75 0.3616 0.6384 1.9390
Sansi 188 41 88 59 0.4521 0.5479 0.5722
Nat 60 13 29 18 0.4583 0.5417 0.0423
TPA25 Gandhila 94 26 62 6 0.6064 0.3936 13.6951*
52.7877*
Barad 96 32 40 24 0.5417 0.4583 2.4834
Bangala 96 40 42 14 0.6354 0.3646 0.2982
Bazigar 194 78 96 20 0.6495 0.3505 1.4628
Bauria 190 42 95 53 0.4710 0.5290 0.0021
Sansi 191 57 105 29 0.5733 0.4267 2.9190
Nat 60 22 32 6 0.6333 0.3667 1.3200
*Statistically significant (p≤0.05) #* Yates' correction applied
Distribution of Alu Ins/Del allele frequencies
Out of the eight Alu Ins/del loci, 7 are insertion polymorphisms while 1 locus (CD4) is a
deletion polymorphism and All of them were polymorphic in the present material of the seven
"denotified" tribes of Punjab. The allele frequencies were calculated by the gene counting
method (Mourant et al., 1976) and are listed in Table 10. It was observed that the APO (I) allele
was found with high frequency ranging from 0.6540 in the Sansi to 0.9342 in the Bauria.
Whereas, CD4 (D) allele was observed with low frequency in all the seven "denotified" tribes,
ranging from 0.0118 in the Bangala to 0.1392 in Bazigar. ACE (I) allele was found with
moderate to high frequency as 0.4000 in the Gandhila to 0.7396 in the Barad. For PLAT (I) allele

the range was observed from as low of 0.2080 in the Barad to as high of 0.7083 in Nat.
Similarly, D1 (I) allele was found in the range of 0.2143 in the Barad to 0.5612 in Gandhila. The
(I) allele of FXIIIB (ranging from 04508 in the Nat to 0.6667 in the Bangala) and TPA25
(ranging from 04710 in the Bauria to 0.6495 in the Bazigar) was found to have moderate
frequencies in the present populations. Fig. 10 demonstrates the distribution of insertion/deletion
allele frequency at 8 Alu loci studied in the seven “denotified” tribes of Punjab.
Fig. 10. Distribution of insertion/deletion allele frequency for eight Alu loci studied in seven
“denotified” tribes of Punjab.
Heterozygosity (h)
Heterozygosity estimates were obtained from eight Alu Ins/Del markers in the seven
denotified tribes of Punjab following the method of Nei (1973) and the results are presented in
Table 21. Considerably high heterozygosity estimates were found at 6 Alu loci viz., ACE (range
0.3852-0.4582), D1 (range 0.3367-0.4999), PLAT (range 0.3294-0.4981), PV92 (range 0.4054-
0.4991), TPA25 (range 0.4553-0.4987), FXIIIB (range 0.4444-0.4995) across all seven
populations investigated, while low amount of heterozygosity was observed at CD4 locus (range
0.0232-0.2396). The average heterozygosity (H) was considerably high for all the seven
“denotified” tribes ranging from 0.3721 in the Sansi to 0.4202 in the Bazigar.
0
0.1
0.2
0.3
0.4
0.5
0.6
0.7
0.8
0.9
1
APO ACE CD4 D1 FXIIIB PLAT PV92 TPA25
Gandhila
Barad
Bangala
Bazigar
Bauria
Sansi
Nat

Table 21. Locus wise distribution of Nei’s heterozygosity (h) and average heterozygosity
(H) in 7 "denotified" tribes of Punjab
"Denotified"
tribe
Heterozygosity (h) Average
heterozygosity
(H) APO ACE CD4 D1 FXIIIB PLAT PV92 TPA25
Gandhila 0.1406 0.4800 0.1592 0.4925 0.4965 0.4804 0.4360 0.4774 0.3953
Barad 0.4064 0.3852 0.1302 0.3367 0.4674 0.3294 0.4596 0.4965 0.3764
Bangala 0.3993 0.3950 0.0232 0.4105 0.4444 0.4386 0.4991 0.4633 0.3842
Bazigar 0.1997 0.4794 0.2396 0.4990 0.4982 0.4981 0.4921 0.4553 0.4202
Bauria 0.4525 0.4938 0.0451 0.3863 0.4995 0.4851 0.4617 0.4983 0.4153
Sansi 0.1230 0.4824 0.0495 0.4999 0.4765 0.4505 0.4054 0.4892 0.3721
Nat 0.2550 0.3995 0.2280 0.3995 0.4952 0.4132 0.4965 0.4644 0.3939
Nei's gene diversity analysis
Gene diversity estimates (HS, HT and DST) and the coefficient of gene differentiation (GST)
at eight Alu Ins/Del loci in the seven "denotified" tribes of Punjab following Nei (1973) are
presented in Table 22. The results showed that the total gene diversity (HT) in the present
populations ranged between 0.1297 (CD4) and 0.4972 (PLAT) with an average of 0.4181. Most
of it was attributable to intra-subpopulational gene diversity (HS) with an average of 0.3988
(ranging from 0.1250 at CD4 to 0.4825 at FXIIIB). By comparison, the inter-subpopulational gene
diversity (DST) was rather low ranging from 0.0047 at CD4 to 0.0550 at PLAT loci. The coefficient
of gene differentiation (GST) was quite high ranging from 0.0146 for TPA25 to 0.1106 for PLAT
with an average of 0.0540, demonstrating a high degree of gene differentiation among the seven
"denotified" tribes of Punjab.

Table 22. Gene diversity estimates (HS, HT, DST) and the coefficient of gene differentiation
(GST) at eight Alu loci in the 7 "denotified" tribes of Punjab.
Locus
Total gene
diversity of the
population
(HT)
Intra-
subpopulational
gene diversity
(HS)
Inter-
subpopulational
gene diversity
(DST)
Coefficient of gene
differentiation
(GST)
APO 0.3042 0.2823 0.0219 0.0720
ACE 0.4709 0.4450 0.0259 0.0550
CD4 0.1297 0.1250 0.0047 0.0362
D1 0.4682 0.4321 0.0361 0.0771
FXIIIB 0.4948 0.4825 0.0123 0.0249
PLAT 0.4972 0.4422 0.0550 0.1106
PV92 0.4950 0.4772 0.0178 0.0360
TPA25 0.4848 0.4777 0.0071 0.0146
Average 0.4181 0.3955 0.0226 0.0540
Genetic distance
The pair wise standard genetic distances (D) were estimated from the observed allele
frequencies using the method of Nei (1972) and the results are listed in Table 23. It was evident
from this table that the genetic distance between the Bazigar and Sansi was lowest (0.0088),
suggesting their genetic closeness while D value was highest (0.1227) between the Barad and
Gandhila, suggesting their little genetic affinities. A tree depicting genomic relationships among
seven "denotified" tribes of Punjab based on Alu Ins/Del markers is depicted in Fig. 11

Table 23. Pair wise genetic distance (D) among the various "denotified" tribes of Punjab
based on Alu Ins/Del markers.
"Denotified"
tribe
Gandhila Barad Bangala Bazigar Bauria Sansi Nat
Gandhila -
Barad 0.1227 -
Bangala 0.0794 0.0121 -
Bazigar 0.0175 0.0592 0.0326 -
Bauria 0.0535 0.0230 0.0222 0.0393 -
Sansi 0.0317 0.0419 0.0231 0.0088 0.0347 -
Nat 0.0477 0.0735 0.0470 0.0301 0.0440 0.0512 -
Fig. 11. UPGMA Tree depicting genomic relationships among seven "denotified" tribes of
Punjab based on Alu Ins/Del markers.
DISCUSSION
Stature, Nasal Index and Cephalic Index
Table 24 presents the mean stature (mm) of the present “denotified” tribes of Punjab as
well as various other tribal and non tribal populations from India. Most of the data reported was
for males, whereas very little data was available on females. It was evident that 7 out of the 9
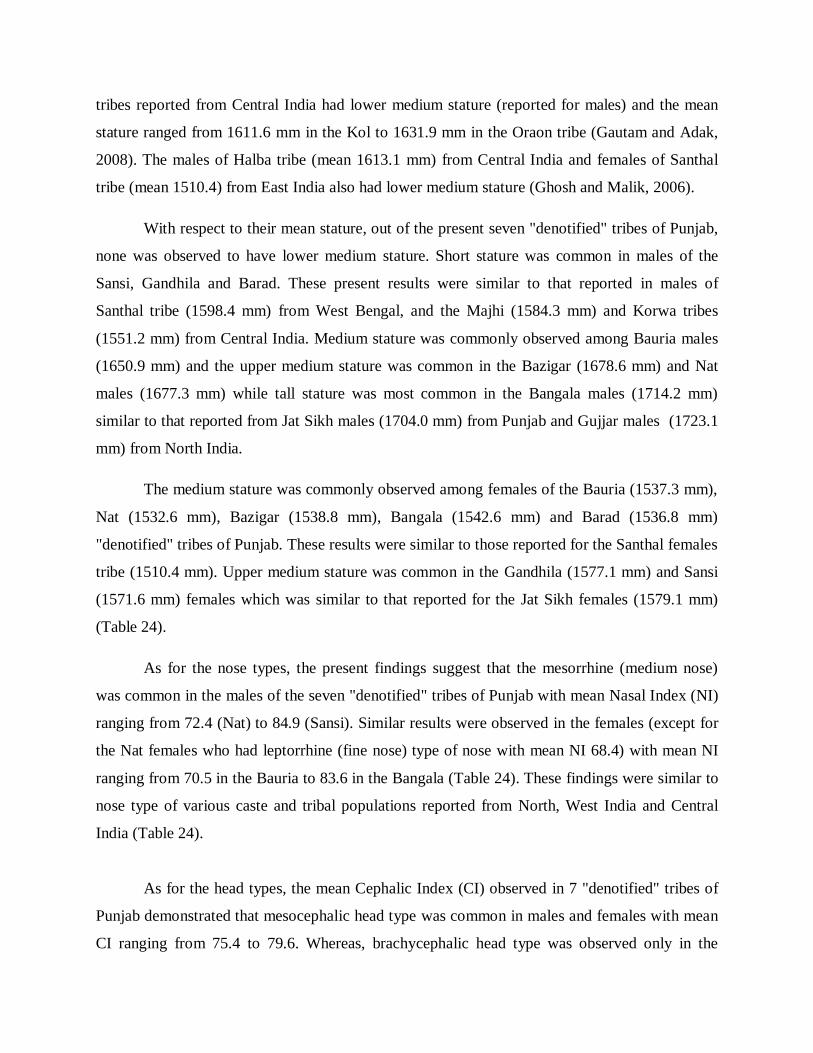
tribes reported from Central India had lower medium stature (reported for males) and the mean
stature ranged from 1611.6 mm in the Kol to 1631.9 mm in the Oraon tribe (Gautam and Adak,
2008). The males of Halba tribe (mean 1613.1 mm) from Central India and females of Santhal
tribe (mean 1510.4) from East India also had lower medium stature (Ghosh and Malik, 2006).
With respect to their mean stature, out of the present seven "denotified" tribes of Punjab,
none was observed to have lower medium stature. Short stature was common in males of the
Sansi, Gandhila and Barad. These present results were similar to that reported in males of
Santhal tribe (1598.4 mm) from West Bengal, and the Majhi (1584.3 mm) and Korwa tribes
(1551.2 mm) from Central India. Medium stature was commonly observed among Bauria males
(1650.9 mm) and the upper medium stature was common in the Bazigar (1678.6 mm) and Nat
males (1677.3 mm) while tall stature was most common in the Bangala males (1714.2 mm)
similar to that reported from Jat Sikh males (1704.0 mm) from Punjab and Gujjar males (1723.1
mm) from North India.
The medium stature was commonly observed among females of the Bauria (1537.3 mm),
Nat (1532.6 mm), Bazigar (1538.8 mm), Bangala (1542.6 mm) and Barad (1536.8 mm)
"denotified" tribes of Punjab. These results were similar to those reported for the Santhal females
tribe (1510.4 mm). Upper medium stature was common in the Gandhila (1577.1 mm) and Sansi
(1571.6 mm) females which was similar to that reported for the Jat Sikh females (1579.1 mm)
(Table 24).
As for the nose types, the present findings suggest that the mesorrhine (medium nose)
was common in the males of the seven "denotified" tribes of Punjab with mean Nasal Index (NI)
ranging from 72.4 (Nat) to 84.9 (Sansi). Similar results were observed in the females (except for
the Nat females who had leptorrhine (fine nose) type of nose with mean NI 68.4) with mean NI
ranging from 70.5 in the Bauria to 83.6 in the Bangala (Table 24). These findings were similar to
nose type of various caste and tribal populations reported from North, West India and Central
India (Table 24).
As for the head types, the mean Cephalic Index (CI) observed in 7 "denotified" tribes of
Punjab demonstrated that mesocephalic head type was common in males and females with mean
CI ranging from 75.4 to 79.6. Whereas, brachycephalic head type was observed only in the
Bangala (mean CI = 83.1) and the Bauria (mean CI = 80.7) females (Table 24). The present
results on mesocephaly preponderance were similar to that reported from Bhil, Barelia, Halba
and Gond tribes from Central (Bhargav and Kher, 1961; Ghosh and Malik, 2006; Chatterjee et
al., 2015) as well as to the populations from West (Uttekar et al., 2013; Jadhav et al., 2011;
Jaiswal et al., 2016) India. While the Brachycephalic head type observed common among the
present Bangala and Bauria females was similar to that reported from North India populations
(Anupama et al., 2010, Seema and Verma, 2016).
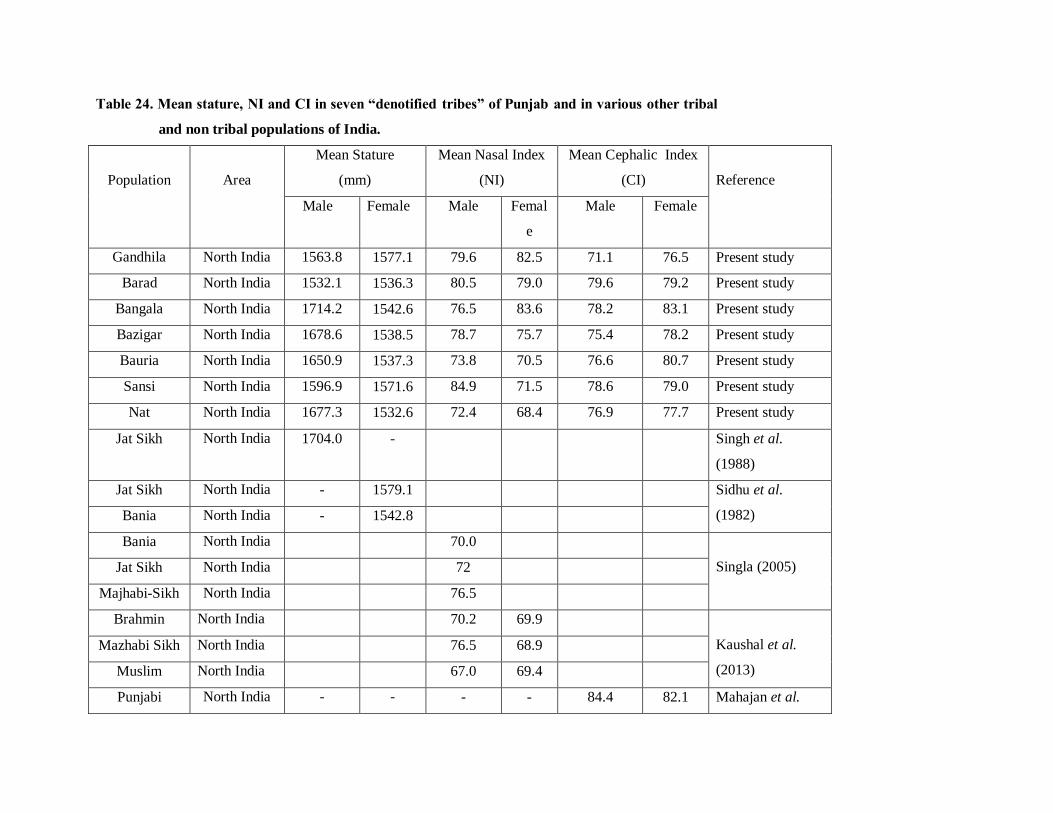
Table 24. Mean stature, NI and CI in seven “denotified tribes” of Punjab and in various other tribal
and non tribal populations of India.
Population
Area
Mean Stature
(mm)
Mean Nasal Index
(NI)
Mean Cephalic Index
(CI)
Reference
Male Female Male Femal
e
Male Female
Gandhila North India 1563.8 1577.1 79.6 82.5 71.1 76.5 Present study
Barad North India 1532.1 1536.3 80.5 79.0 79.6 79.2 Present study
Bangala North India 1714.2 1542.6 76.5 83.6 78.2 83.1 Present study
Bazigar North India 1678.6 1538.5 78.7 75.7 75.4 78.2 Present study
Bauria North India 1650.9 1537.3 73.8 70.5 76.6 80.7 Present study
Sansi North India 1596.9 1571.6 84.9 71.5 78.6 79.0 Present study
Nat North India 1677.3 1532.6 72.4 68.4 76.9 77.7 Present study
Jat Sikh North India 1704.0 - Singh et al.
(1988)
Jat Sikh North India - 1579.1 Sidhu et al.
(1982) Bania North India - 1542.8
Bania North India 70.0
Singla (2005) Jat Sikh North India 72
Majhabi-Sikh North India 76.5
Brahmin North India 70.2 69.9
Kaushal et al.
(2013)
Mazhabi Sikh North India 76.5 68.9
Muslim North India 67.0 69.4
Punjabi North India - - - - 84.4 82.1 Mahajan et al.

Population (2009)
Punjabi
Population
North India - - - - 80.5 84.3 Seema and Verma
(2016)
Bania North India 1687.1 1551.8 - - - -
Kumar and
Patnaik (2013)
Koli North India 1526.5 - Krishan and
Kumar (2007)
Gujjar North India 1723.1 - Krishan (2008)
Indian
population
North India 1688.6 1563.9 Asha and Prabha
(2011)
UP Population North India 75.8 72.1 Ray et al. (2016)
Indian
population
South India 1696.2 1568.2 Asha and Prabha
(2011)
Santhal Tribe East India 1598.4 1510.4 79.7 79.4 73.4 75.9 Ghosh and Malik
(2006)
Orissa
Population
East India 77.3 78.4 Patro et al. (2014)
Bhil Tribe Central India 76.9 Bhargav and Kher
(1960)
Barela Tribe Central India 79.8 Bhargav and Kher
(1961)
Bhil Tribe Central India 1614.2 - Gautam and Adak
(2008)

Gond Tribe Central India 1623.5 - 79.9 77.5 Gautam and Adak
(2008)
Kol Tribe Central India 1611.6 - Gautam and Adak (2008)
Korku Tribe Central India 1624.5 - Gautam and Adak
(2008)
Majhi Tribe Central India 1584.3 - Gautam and Adak (2008)
Oraon Tribe Central India 1631.9 - Gautam and Adak
(2008)
Sonr Tribe Central India 1620.6 - Gautam and Adak (2008)
Korwa Tribe Central India 1551.2 - Gautam and Adak
(2008)
Saharia Tribe Central India 1627.8 - Gautam and Adak (2008)
Halba Tribe Central India 1613.1 81.7 Chatterjee et al.
(2015)
Ahirwar Central India 81 82.4 73.7 73.4
Singh and Purkit
(2006)
Dhangi Central India 76.5 76.2 71.9 71.6
Bhopal Central India - - 81.2 80.3 Nair et al. (2014)
Reva Central India 75.8 79.2 Mishra et al.
(2014)
Gujarat
Population
West India 1659.2 - 81.2 80.4 Jadhav and Shah
(2004)
Gujarat
Population
West India - 82.5 Uttekar et al.
(2013)
Bheel Meena West India - - 83.0 79.7 - - Gangrade (2012)

Rabari West India 80.8 -
Jadhav et al.
(2011)
Bhil West India 80.8 -
Sindhi West India 77.8 -
Siddi West India 78.8 -
Sindhi West India 82.8 -
Patel West India 81.0 -
Kharwa West India 79.8 -
Bania West India 77.0 78.0
Jaiswal et al.
(2016)
Brahmin West India 75.7 78.3
Jat West India 76.7 78.8
Meena West India 77.0 78.6
Others West India 78.1 77.3
Jat West India 68.1 Choudhary et al.
(2012) Sindhi West India 70.7

A1A2BO and RH(D) blood group systems
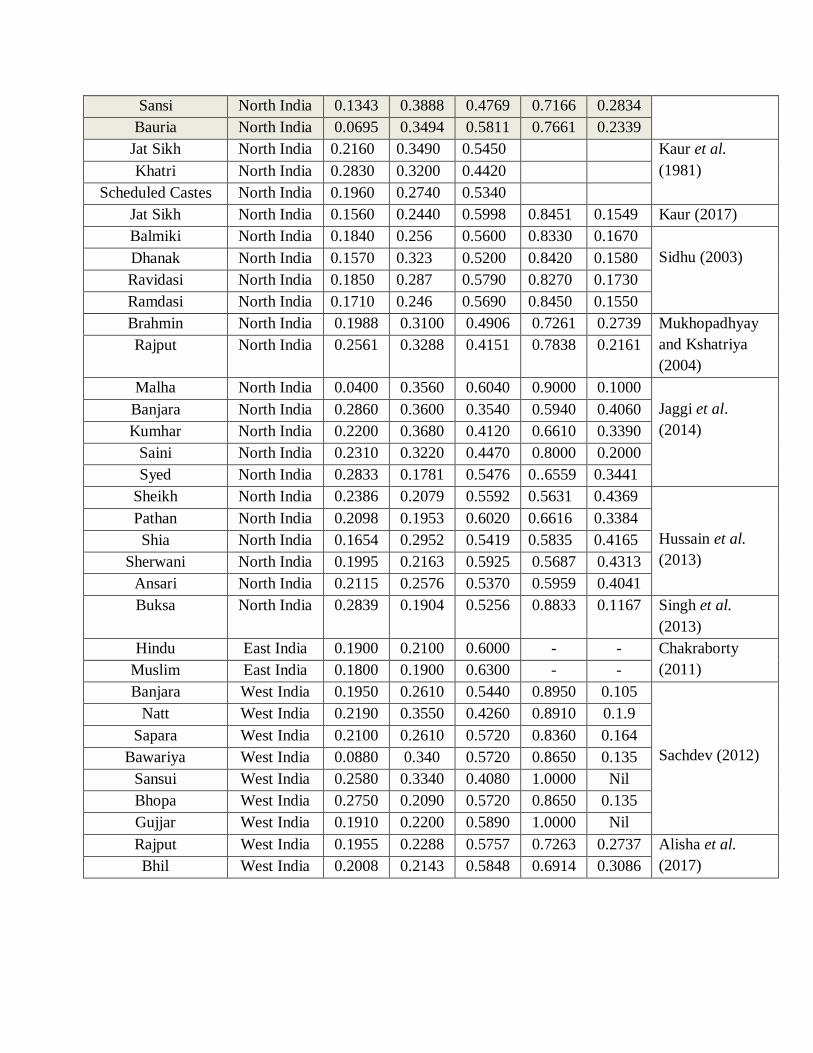
Table 25 presents the distribution of A1+A2, B, O and RH allele frequencies in different
caste and tribal populations of India. In the present study the average frequencies of A1+A2
(range 0.0695-0.2342), B (range 0.1235-0.3888) and O (range 0.4221-0.7071) alleles for six (out
of seven) "denotified" tribes of Punjab were 0.1459, 0.2730 and 0.5809, respectively. These
frequencies were not comparable with the allele frequency data of other caste populations of
Punjab, viz., the Jat Sikh (0.216, 0.239, 0.545) and the Khatri (0.283, 0.320, 0.442) (Kaur et al.,
1981). On the other hand, the present ABO results were similar to the A, B, O allele frequencies
of the scheduled caste population of Punjab reported by Kaur et al. (1981) (0.196, 0.274, 0.530)
and the Balmiki (0.1840, 0.2560, 0.5600), Dhanak (0.1570, 0.3230, 0.5200), Ravidasi (0.1850,
0.2870, 0.5790) and Ramdasi (0.1710, 0.2460, 0.5690) Scheduled Castes of Punjab (Sidhu,
2003). The present results were also similar to the 7 nomadic tribal populations of Rajasthan with
average values being 0.209, 0.286, 0.505, respectively for A1+A2, B and O alleles (Sachdev,
2012) as well as the tribal Bhil of Rajasthan (Alisha, 2017) with frequencies 0.2008, 0.2143 and
0.5848, respectively for A1+A2, B and O alleles (Table 25).
The average Rh(D) + allele frequency was observed high (range 0.7166-1.0000) in the
present "denotified" tribes of Punjab. The results were similar to those reported in were reported
for four Scheduled Caste populations viz., the Balmiki (0.8330), Dhanak (0.8420), Ravidasi
(0.8270) and Ramdasi (0.8450) (Sidhu, 2003) and the Jat Sikh (0.8451) of Punjab (Kaur, 2017)
as well as with 7 nomadic tribal populations of West (range 0.8650-1.000; Sachdev, 2012), while
the tribal Bhil surprisingly showed moderate frequency for Rh(D)+ allele (0.6914) (Alisha, 2017)
(Table 25).
Table 25. Distribution of ABO and RH(D) allele frequencies in different caste and tribal
populations of India
Population
Region
Distribution of allele frequencies
Reference A/
A1+A2
B O D D
Gandhila North India 0.2342 0.3437 0.4221 0.8670 0.1330
Present study
Bangala North India 0.1687 0.1235 0.7078 0.7609 0.2391
Nat North India 0.1566 0.1856 0.6578 1.0000 0.0000
Bazigar North India 0.1126 0.2471 0.6402 0.7827 0.2173
Sansi North India 0.1343 0.3888 0.4769 0.7166 0.2834
Bauria North India 0.0695 0.3494 0.5811 0.7661 0.2339
Jat Sikh North India 0.2160 0.3490 0.5450 Kaur et al.
(1981) Khatri North India 0.2830 0.3200 0.4420
Scheduled Castes North India 0.1960 0.2740 0.5340
Jat Sikh North India 0.1560 0.2440 0.5998 0.8451 0.1549 Kaur (2017)
Balmiki North India 0.1840 0.256 0.5600 0.8330 0.1670
Sidhu (2003) Dhanak North India 0.1570 0.323 0.5200 0.8420 0.1580
Ravidasi North India 0.1850 0.287 0.5790 0.8270 0.1730
Ramdasi North India 0.1710 0.246 0.5690 0.8450 0.1550
Brahmin North India 0.1988 0.3100 0.4906 0.7261 0.2739 Mukhopadhyay
and Kshatriya
(2004)
Rajput North India 0.2561 0.3288 0.4151 0.7838 0.2161
Malha North India 0.0400 0.3560 0.6040 0.9000 0.1000
Jaggi et al.
(2014)
Banjara North India 0.2860 0.3600 0.3540 0.5940 0.4060
Kumhar North India 0.2200 0.3680 0.4120 0.6610 0.3390
Saini North India 0.2310 0.3220 0.4470 0.8000 0.2000
Syed North India 0.2833 0.1781 0.5476 0..6559 0.3441
Sheikh North India 0.2386 0.2079 0.5592 0.5631 0.4369
Hussain et al.
(2013)
Pathan North India 0.2098 0.1953 0.6020 0.6616 0.3384
Shia North India 0.1654 0.2952 0.5419 0.5835 0.4165
Sherwani North India 0.1995 0.2163 0.5925 0.5687 0.4313
Ansari North India 0.2115 0.2576 0.5370 0.5959 0.4041
Buksa North India 0.2839 0.1904 0.5256 0.8833 0.1167 Singh et al.
(2013)
Hindu East India 0.1900 0.2100 0.6000 - - Chakraborty
(2011) Muslim East India 0.1800 0.1900 0.6300 - -
Banjara West India 0.1950 0.2610 0.5440 0.8950 0.105
Sachdev (2012)
Natt West India 0.2190 0.3550 0.4260 0.8910 0.1.9
Sapara West India 0.2100 0.2610 0.5720 0.8360 0.164
Bawariya West India 0.0880 0.340 0.5720 0.8650 0.135
Sansui West India 0.2580 0.3340 0.4080 1.0000 Nil
Bhopa West India 0.2750 0.2090 0.5720 0.8650 0.135
Gujjar West India 0.1910 0.2200 0.5890 1.0000 Nil
Rajput West India 0.1955 0.2288 0.5757 0.7263 0.2737 Alisha et al.
(2017) Bhil West India 0.2008 0.2143 0.5848 0.6914 0.3086

Alu Ins/Del polymorphisms
Table 26 presents the distribution of allele frequencies of six Alu loci (ACE, APO, CD4,
D1, PV92, FXIIIB) in the present “denotified” tribes and various other tribal and caste
populations reported from North (Kaur et al., 2002; Panjaliya et al., 2012, 2013; Majumder et
al., 1999; Chakrabarti et al., 2002), Central (Mukherjee et al., 2000) and West (Dada et al.,
2011; Kshatriya et al., 2011) India.
The frequency APO (I) allele was observed varying from moderate to high in the present
“denotified” tribes of Punjab (range 0.6540-0.9342) as observed in other populations reported
from North (range 0.4400-0.9460), Central (range 0.4810-0.7140) and West (range 0.6290-
0.9480) India. The frequency of CD4 (D) allele was observed low in seven “denotified” tribes
(range 0.0118-0.1392) of Punjab as well as in other populations reported from North (range nil-
0.1650), Central (range 0.0180-0.1011) and West (range 0.0170-0.2320) India. The overall allele
frequency distribution pattern of the present denotified tribes of Punjab was found similar to the
Indo-European speaking tribes of West India (Kshatriya et al., 2011).
The higher heterozygosity (range 0.3721-0.4202) with respect to eight Alu loci reflected
greater genetic variability in the seven “denotified tribes of Punjab”. The coefficient of gene
differentiation (GST=5.4%) in the present “denotified” tribes of Punjab depicted the extent of
genetic heterogeneity prevalent in the present study populations. Gene differentiation (GST)
recorded in the present study was much greater than that reported among various caste
populations of Punjab viz., the Jat Sikh, Brahmin, Khatri and Scheduled Castes (GST=1.3%)
(Kaur et al., 2002) and various endogamous populations of Haryana (GST=2.7%, Yadav and
Arora, 2011). Various studies on some tribal populations of India have reported GST values
ranging from 2.5% (Mukherjee et al., 2000) followed by 4.9% reported among tribal populations
from West India (Dada et al., 2011) to as high as 6.8% reported by on various tribal and caste
populations of India (Majumder et al., 1999). Thus the present value of GST (5.4%) was much
higher than caste populations but similar to GST values reported among tribal populations of
India.

Table 26. Distribution of insertion/deletion allele frequencies of common six Alu markers in 7 “denotified”
tribes of Punjab and various other populations reported from India.
Population Area Allele frequency Reference
ACE APO D1 CD4* FXIIIB PV92
Gandhila1 North India 0.4000 0.9239 0.5612 0.0872 0.4583 0.3210
Present study
Bangala1 North India 0.7292 0.7244 0.2885 0.0118 0.6667 0.4792
Barad1 North India 0.7396 0.7163 0.2143 0.0700 0.6277 0.6421
Bazigar1 North India 0.6016 0.8875 0.5231 0.1392 0.5299 0.4372
Bauria1 North India 0.5556 0.6540 0.2615 0.0230 0.5157 0.3616
Sansi1 North India 0.5937 0.9342 0.4925 0.0254 0.6083 0.4521
Nat1 North India 0.7241 0.8500 0.2759 0.1312 0.4508 0.4583
Jat Sikh1 North India 0.5150 0.8866 0.3775 0.1650 0.6100 0.3655
Kaur et al.
(2002) Brahmin1 North India 0.4895 0.9062 0.4687 0.0834 0.5418 0.3541
Khatri1 North India 0.6250 0.8750 0.5104 0.0625 0.5937 0.4062
Scheduled
Castes1
North India 0.4791 0.9062 0.3645 0.0521 0.6875 0.5000
Brahmin2 North India 0.7200 0.6150 0.4400 0.1100 0.4850 0.5500
Panjaliya et al.
(2012) and
Panjaliya et al.
(2013)
Rajput2 North India 0.5750 0.7400 0.4900 0.1400 0.6500 0.4750
Gujjar2 North India 0.3800 0.4400 0.5700 0.1300 0.5700 0.3600
Jat Sikh2 North India 0.6200 0.8100 0.5000 0.1600 0.6700 0.3000
Brahmin3 North India 0.5930 0.8890 0.3700 0.1150 0.5930 0.3330
Majumdar
et al. (1999) Chamar3 North India 0.7000 0.7200 0.5000 0.0000 0.7800 0.5400

Muslim3 North India 0.6430 0.9460 0.4640 0.0370 0.5000 0.3150
Rajput3 North India 0.5380 0.9020 0.3070 0.0200 0.7040 0.3370
Katharia
Tharu3
North India 0.5690 0.8470 0.4170 0.0140 0.7920 0.6940
Chakrabarti
et al. (2002) Rana Tharu3 North India 0.6230 0.7260 0.4430 0.0290 0.8210 0.8210
Toto4 North East
India 0.5670 0.8500 0.3330 0.0000 0.9140 0.9330
Ho4 North East
India 0.7310 0.8490 0.4520 0.0000 0.8020 0.5650
Mizo5 North East
India
0.6030 0.8450 0.2860 0.0000 0.6480 0.8620
Paite5 North East
India
0.6750 0.9050 0.3150 0.0000 0.5420 0.7790
Meitei et al.
(2010) Meitei5 North East
India
0.5440 0.9170 0.2630 0.0340 0.6330 0.6760
Kom5 North East
India
0.2590 0.9060 0.4540 0.0000 0.7860 0.4370
Thadou5 North East
India
0.7780 0.9170 0.3970 0.0400 0.3970 0.8170
Kabui5 North East
India
0.5610 0.7930 0.2690 0.0000 0.7840 0.8680
Aimol5 North East
India
0.5870 0.9230 0.3500 0.0000 0.6640 0.8820

Manipur
Muslim5
North East
India
0.5730 0.8240 0.2800 0.0000 0.4760 0.4400
Manipur
Bamon5
North East
India
0.5910 0.7220 0.3510 0.0000 0.6200 0.6330
Zeme5 North East
India
0.4710 0.5290 0.2170 0.4530 0.6100 0.8350
Panmei et al.
(2016)
Liangmai5 North East
India
0.4510 0.7750 0.2200 0.1110 0.5933 0.8680
Rongmei5 North East
India
0.5090 0.7280 0.2790 0.1880 0.5740 0.7440
Muria6 Central India 0.5310 0.7140 0.3470 0.1011 0.7860 0.5200
Mukherjee
et al. (2000) Halba6 Central India 0.6460 0.6910 0.4270 0.0940 0.6980 0.5630
Kamar6 Central India 0.6400 0.6490 0.3420 0.0180 0.7460 0.5540
Chinda
Bhunjia6
Central India 0.7960 0.4810 0.6200 0.0380 0.7310 0.4070
Chakhutia
Bhunjia6
Central India 0.6490 0.6220 0.2890 0.0900 0.7500 0.4120
Rajput7 West India 0.6130 0.8940 0.3360 0.0380 0.7090 0.4220
Dada et al.
(2011)
Bhil7 West India 0.5100 0.8800 0.2340 0.0358 0.7150 0.4050
Saharia7 West India 0.5780 0.8000 0.3120 0.0709 0.6290 0.4330
Mina7 West India 0.4160 0.6290 0.3260 0.0170 0.5830 0.5230
Garasia7 West India 0.7300 0.9230 0.4610 0.0800 0.5190 0.4030
Damaria7 West India 0.5440 0.9480 0.3100 0.2320 0.4210 0.2960

Vasava8 West India 0.7500 0.8020 0.3140 0.1180 0.5380 0.5290
Kshatriya et al.
(2011)
Gamit8 West India 0.6900 0.7300 0.3040 0.0500 0.4010 0.4120
Konkana8 West India 0.4710 0.7840 0.3230 0.1150 0.4510 0.5120
Mota
Chaudhary8
West India 0.5800 0.6910 0.3040 0.1060 0.2200 0.3060
Pavagadhi
Chaudhary8
West India 0.5610 0.7890 0.3540 0.0730 0.5730 0.4880
Nana
Chaudhary8
West India 0.6180 0.7750 0.4000 0.0500 0.6270 0.3730
Dhodia8 West India 0.6380 0.8320 0.3510 0.0480 0.4100 0.4780
Dubla8 West India 0.7240 0.8130 0.3170 0.0620 0.5900 0.4900
*Denotes the frequency of deletion allele
1=Punjab, 2=Jammu, 3=Uttar Pradesh, 4=West Bengal, 5=Manipur, 6=Madhya Pradesh, 7=Rajasthan, 8=Gujarat

Genetic affinities of the “denotified” tribes of Punjab with other caste populations of state
The genetic affinities of the seven investigated “denotified” tribes of Punjab with other
caste populations of the state viz., the Jat Sikh, Brahmin, Khatri and Scheduled Castes (Kaur et
al., 2002) were studied using 7 Alu Ins/Del loci viz., ACE, APO, CD4, D1, FXIIIB, PV92, PLAT.
The UPGMA tree (Fig. 12) depicting the hierarchial clustering between populations clearly
presented that the five out of the seven “denotified” tribes viz., the Barad, Bangala, Bazigar,
Bauria and Nat formed a separate cluster while, the Sansi was observed clustered with the caste
populations reported from Punjab (Kaur et al., 2002). Interestingly Gandhila was separated from
this major cluster. The MDS plot (Fig. 13) clearly separated the “denotified” tribes of Punjab
from the caste populations suggesting no genetic closeness between the “denotified” tribes and
caste populations reported from Punjab.
SC = Scheduled Castes
Fig.12. UPGMA tree depicting genetic affinities of the seven denotified tribes with other
caste populations reported from Punjab based on 7 Alu loci.

Fig.13. MDS plot demonstrating genetic affinities of the seven "denotified" tribes of Punjab
with other caste populations reported from the state based on 7 Alu loci.
Genetic affinities of the investigated seven “denotified” tribes of Punjab with different
populations reported from India
The genetic affinities of the seven investigated “denotified” tribes with various caste and
tribal populations from North (Kaur et al., 2002; Panjaliya et al., 2012, 2013; Majumder et al.,
1999; Chakrabarti et al., 2002), Central (Mukherjee et al., 2000) and West (Dada et al., 2011;
Kshatriya et al., 2011) India were studied using data on 6 common Alu Ins/Del loci viz., ACE,
APO, CD4, D1, FXIIIB, PV92 (Table 23).
As per the UPGMA tree (Fig. 14) four “denotified” tribes viz., the Bangala, Bauria,
Barad and Nat were observed clustered with Indo-European speaking tribes (Vasava, Gamit,
Dubla, Dhodia, Konkana) of West India (Kshatriya et al., 2011) while the remaining three, the
Gandhila, Bazigar and Sansi were observed clustered together and close to the MC (Mota
Choudhary) tribe from West India (Kshatriya et al., 2011). The MDS plot (Fig. 15) showed that
the “denotified” tribes were clustered away from the caste populations from North India and
appeared relatively close to the Indo-European speaking tribal populations from West India
(Kshatriya et al., 2011).

Fig.14. UPGMA tree depicting genetic affinities of the seven “denotified” tribes of Punjab
with various caste and tribal populations of India.

Fig. 15. MDS plot genetic affinities of the even “denotified” tribes of Punjab with various
caste and tribal populations of India.
CONCLUSIONS
(i) Short stature was predominantly observed in males of the Sansi, Gandhila, and Barad
"denotified" tribes of Punjab which was similar to that reported in males of Santhal tribe
of West Bengal as well as the Majhi and Korwa tribes of Central India. The medium
stature was commonly observed among females of the Bauria, Nat, Bazigar, Bangala and
Barad "denotified" tribes of Punjab, similar to that reported from females of the Santhal
tribe.
(ii) The present results suggested the preponderance of mesorrhine (medium nose) in the
males of the seven "denotified" tribes of Punjab, barring the Nat females. These results
were similar to the findings reported on predominance of mesorrhine in different tribal
and non tribal populations from North, Central and West India.
(iii) Mesocephalic head type was found to be common in males of the 7 "denotified"
tribes of Punjab as well as in females of 5 (Gandhila, Barad, Bazigar, Sansi and Nat) out
of 7 “denotified” tribes of Punjab demonstrated the preponderance of mesocephaly.
These results were similar to that reported in the Bhil, Barelia, Santhal and Gond tribes of

Central and East India. The brachycephalic head type was common in the present
Bangala and the Bauria females, a finding which was similar to that reported in
population of West India.
(iv) The average frequencies of A, B, O alleles for six (out of seven) "denotified" tribes
of Punjab were similar to the scheduled caste populations of Punjab (Kaur et al., 1981;
Sidhu et al., 2003) as well as to 7 nomadic tribal populations of Rajasthan (Sachdev,
2012) and the tribal Bhil of Rajasthan (Alisha, 2017).
(v) The Rh(D)+ allele frequency in the present study six "denotified" tribes (range
0.8156) was similar to the value reported in the Scheduled Castes (0.836; Sidhu, 2003)
and Jat Sikh (0.8451; Kaur, 2017) of Punjab as well as to the Rajputs (0.7260; Alisha,
2017) and 7 nomadic tribal populations of Rajasthan (range 0.8650-1.0000; Sachdev,
2012).
(vi) In case of 8 Alu Ins/Del markers studied in the seven “denotified” tribes of Punjab,
the average allele frequency distribution pattern was similar to the Indo-European
speaking tribes of South Gujarat, West India (Kshatriya et al., 2011).The frequency of
APO (I) allele was observed varying from moderate to high in the seven “denotified”
tribes (range 0.6540-0.9342) of Punjab similar to the tribal population reported from
West India (range 0.6290-0.9480). The frequency of CD4 (D) allele was observed low in
seven “denotified” tribes (range 0.0118-0.1392) of Punjab which was similar to the caste
and tribal populations reported from North (range nil-0.1650), Central (range 0.0180-
0.1011) and West (range 0.0170-0.2320) India.
(vii) The coefficient of gene differentiation value estimated in the present “denotified”
tribes of Punjab (GST = 5.4%) demonstrated great genetic heterogeneity in the present
study populations. The GST value recorded in present “denotified” tribes of Punjab was
greater than that reported in caste populations (the Jat Sikh, Brahmin, Khatri and
Scheduled Castes) of the state (GST = 1.3%) (Kaur et al., 2002) but similar to GST value
(4.9%) reported among tribal populations from West India (Dada et al., 2011).
(viii) The UPGMA tree of populations of Punjab (Fig. 12) demonstrated that the
Gandhila separated at an early stage of evolution from the remaining six “denotified”
tribes. The Barad, Bangala, Bazigar, Bauria and Nat formed a subcluster while, the Sansi
was observed clustered with the caste populations reported from Punjab (Kaur et al.,

2002). The MDS plot (Fig.13) clearly separated the “denotified” tribes of Punjab from
the caste populations, suggesting no genetic closeness between them.
(ix) The UPGMA tree (Fig. 14) and MDS plot (Fig. 15) of the genetic affinity of the
seven “denotified” tribes of Punjab with various caste and tribal populations of India,
clearly showed that the “denotified” tribes were clustered away from the caste
populations of North India and appeared relatively close to the Indo-European speaking
tribal populations of West India.
SUMMARY
There are seven “denotified” tribes inhabiting the state namely, the Bauria, Bazigar,
Bangala, Barad, Gandhila, Nat and Sansi. Their total population as per the Census of India 2001
was 436,809, the Bazigar having the highest population (208,442), followed by the Sansi
(105,337), Bauria (102,232), Barar (8,679), Bangali (7,765), Gandhila (3,283) and Nat (1,071).
The “denotified” tribes (Vimukt Jatis) of Punjab had been struggling since India’s
independence, first to remove the tag of criminality attached to them during the British colonial
regime and second, to acquire the status of Schedule Tribe (ST). It is ironic that they had been
wrongly placed in the category of Scheduled Caste (SC) in Punjab and they see this as an attempt
to denigrate them. The Vimukt Jatis had been contesting for Scheduled Tribe (ST) status for long
so that they have a stake in reservation quota for jobs, admissions, scholarships and other
benefits announced from time to time by the government for the ST. Since as of now they are
clubbed with the Scheduled Castes of Punjab, the so-called ‘creamy SC layer’ (e.g. the
Ramdasia, Balmiki etc.) takes all the benefits meant for SC.
The present study is a biological anthropology approach to establish the genetic profile of
the Vimukt Jatis of Punjab. As a detailed social anthropological study is already available on the
Vimukt Jatis of Punjab which indicate a tribal status for them (Singh, 2010), it would be
interesting to examine if the results from the present anthropogenetic approach corroborate this
finding. That is, the present study is an attempt to provide genetic basis to the findings of the
social-anthropological inquiry already reported in literature on the Vimukt Jatis of Punjab. This
will help make the case of the Vimukt Jatis, a socially disadvantaged group of people, for a tribal

status more rational and logical thereby helping them get their true identity validated, enabling
them get the financial and other benefits due to them. The main findings of the present project
are listed below.
1. The stature was predominantly observed short in males of the Sansi, Gandhila, and Barad
"denotified" tribes of Punjab which was similar to that reported in males of Santhal tribe
of West Bengal as well as the Majhi and Korwa tribes of Central India. The medium
stature was commonly observed among females of the Bauria, Nat, Bazigar, Bangala and
Barad "denotified" tribes of Punjab, similar to that reported from females of the Santhal
tribe. The present results suggested the preponderance of mesorrhine (medium nose) in
the males of the seven "denotified" tribes of Punjab, barring the Nat females. These
results were similar to the findings reported on predominance of mesorrhine in different
tribal and non tribal populations from North, Central and West India. Mesocephalic head
type was found to be common in males of the 7 "denotified" tribes of Punjab as well as in
females of 5 (Gandhila, Barad, Bazigar, Sansi and Nat) out of 7 “denotified” tribes of
Punjab demonstrated the preponderance of mesocephaly. These results were similar to
that reported in the Bhil, Barelia, Santhal and Gond tribes of Central and East India. The
brachycephalic head type was common in the present Bangala and the Bauria females, a
finding which was similar to that reported in population of West India.
2. As for the average frequencies of A, B, O alleles for six (out of seven) "denotified" tribes
of Punjab, these were similar to the scheduled caste populations of Punjab (Kaur et al.,
1981; Sidhu et al., 2003) as well as to 7 nomadic tribal populations of Rajasthan
(Sachdev, 2012) and the tribal Bhil of Rajasthan (Alisha, 2017). The Rh(D)+ allele
frequency in the present study six "denotified" tribes (range 0.8156) was similar to the
value reported in the Scheduled Castes (0.836; Sidhu, 2003) and Jat Sikh (0.8451; Kaur,
2017) of Punjab as well as to the Rajputs (0.7260; Alisha, 2017) and 7 nomadic tribal
populations of Rajasthan (range 0.8650-1.0000; Sachdev, 2012).
3. In case of 8 Alu Ins/Del markers studied in the seven “denotified” tribes of Punjab, the
average allele frequency distribution pattern was similar to the Indo-European speaking
tribes of South Gujarat, West India (Kshatriya et al., 2011).The frequency of APO (I)
allele was observed varying from moderate to high in the seven “denotified” tribes (range
0.6540-0.9342) of Punjab similar to the tribal population reported from West India (range

0.6290-0.9480). The frequency of CD4 (D) allele was observed low in seven “denotified”
tribes (range 0.0118-0.1392) of Punjab which was similar to the caste and tribal
populations reported from North (range nil-0.1650), Central (range 0.0180-0.1011) and
West (range 0.0170-0.2320) India.
4. The coefficient of gene differentiation (GST) value estimated in the present “denotified”
tribes of Punjab (5.4%) showed great genetic heterogeneity in the present study
populations of the state. The GST value recorded in present “denotified” tribes of Punjab
was greater than that reported in caste populations (the Jat Sikh, Brahmin, Khatri and
Scheduled Castes) of the state (GST = 1.3%) (Kaur et al., 2002) but similar to GST value
(4.9%) reported among tribal populations from West India (Dada et al., 2011).
5. The assessment of the genetic affinities of the “denotified” tribes of Punjab with other
caste populations of state (Fig. 12) demonstrated that the Gandhila separated at an early
stage of evolution from the remaining six “denotified” tribes. The Barad, Bangala,
Bazigar, Bauria and Nat formed a subcluster while, the Sansi was observed clustered with
the caste populations reported from Punjab (Kaur et al., 2002). The MDS plot (Fig.13)
clearly separated the “denotified” tribes of Punjab from the caste populations, suggesting
no genetic closeness between them.
6. The UPGMA tree (Fig. 14) and MDS plot (Fig. 15) of the genetic affinity of the seven
“denotified” tribes of Punjab with various caste and tribal populations of India, clearly
demonstrated that these “denotified” tribes were clustered away from the caste
populations of North India and appeared relatively close to the Indo-European speaking
tribal populations of West India.
Like the social anthropological evidence already available on the “denotified” tribes (Vimukt
Jatis) of Punjab indicating a tribal status for them (Singh, 2010), the present physical (biological)
anthropological project on these populations also corroborate their affinities with various tribal
populations of West India than the caste populations of Punjab. Thus it is
suggested/recommended that the Bauria, Bazigar, Bangala, Barad, Gandhila, Nat and Sansi
populations of Punjab should be provided the scheduled tribe (ST) status in the state to so that
they have a stake in reservation quota for jobs, admissions, scholarships and other benefits

provided by the Central government for the ST enabling these illiterate and backward
populations of Punjab get social justice.
ACKNOWLEDGEMENT
The Principal Investigator is grateful to the UGC, New Delhi for providing the financial
assistance for the Major Research Project entitled "Anthropogenetic Profile of "denotified"
Tribes (Vimukt Jatis) of Punjab (North-West India) and its Social Implication" vide UGC
approval reference File No. 42-494/2013(SR).
REFERENCES
Alisha. 2017. A study of A1A2BO blood group and Rho (D) status among Bhils and Rajputs of
Sirohi district, Mt. Abu, Rajasthan. International Journal of Applied Research 3: 421- 428.
Asha, K.R. and Laxmi-Prabha, R. 2011. Estimation of stature from cephalic dimensions in
Indian population. Anatomica 5(1):1-5.
Bhargava, I. and Kher, G.A. 1960. An anthropometric study of Central India Bhils of Dhar
district of Madhya Pradesh. Journal of Anatomical Society of India 9: 14 - 19.
Bhargava, I. and Kher, G.A. 1961. A comparative anthropometric study of Bhils and Barelas of
Central India. Journal of Anatomical Society of India 10: 26 - 33.
Basu, A. 1963. Anthropometry of the Kayasthas of Bengal. Journal of Anatomical Society of
India 3: 20-25.
Chakraborty, S. 2011. Heterozygosity and fixation index for ABO gene in Barak valley
populations vis-à-vis a few exotic populations. Notulae Scientia Biologicae 3(1): 07-11.
Chatterjee, M., Mehra, K.P., Pander, K., Banerjee, C. and Roul, B. 2015. Anthropometric study
of Gond tribe in Gariyaband district of Chhattisgarh state. International Journal of
Advanced Research 3: 612 - 617.
Chatterjee, M. and Pandher, K. 2015. Anthropometric study of Halba tribe in Gariyaband district
of Chhattisgarh state. Journal of Anatomical society of India 64: 521-522.
Choudhary, A. and Choudhary, D.S. 2012. Comparative anthropometric study of nasal
parameters between two ethnic groups of Rajasthan state. International Journal of
Medicine and Public Health 2: 46-48.
Dada, R., Saraswathy, K.N., Meitei, K.S., Mondal, P.R., Kaur, H., Kucheria, K., Bhardwaj, S.,
Gaznavi, I. 2011. Genetic sketch of the six population groups of Rajasthan: a study based
on 12 autosomal loci. Anthropological Science 119: 259-264.
Felsenstein, J. 2005. PHYLIP (Phylogeny Inference Package) Version 3.6. Department of
Genome Sciences, University of Washington, Seattle.
Gangrade, P. R. and Babel, H. 2012. Anthropometric study of the nasal index of the Bheel -
Meena tribe of southern Rajasthan. IJCRR 4: 88-91.
Gautam and Adak. 2008. Nutrition and variation among Central Indian Tribes. Proceedings of
National Symposium on Tribal Health 141-153.
Ghosh, S. and Malik, S. 2006. Assessing intergenerational differences in anthropo-physiological
variables: case study of a tribal population. The Internet Journal of Biological
Anthropology 1(1).
Hussain, R., fareed, M., Shah, A. and Afzal, M. 2013. Prevalence and gene frequencies of
A1A2BO and RH(D) blood group alleles among some Muslim populations of North
India. The Egyptian Journal of medical Human Genetics 14: 69-76.
Jadav, H. R., Kariya, V. B., Kodiyatar and Pensi, C. A. 2011. A study to correlate cephalic Index
of various castes/races of Gujarat state. NJIRM 2(2): 18-22.
Jaggi, S. and Yadav, A. S. 2014. Distribution of ABO and RH (D allele frequency among four
endogamous populations of Haryana. International Journal of Research in Applied,
Natural and Social Sciences 2(2): 77-80.
Jaiswal, P., Rathore, K. B. and Masih, W. F. 2016. Cephalic Index and head shape in various
castes of Hadoti region. International Journal of Scientific Study 4 (2): 242-246.
Kaur, H., Sehajpal, P. K. and Shrivastava, P. K. 1981. Distribution of some genetic traits in three
population groups from Punjab, North West India. Anthropologischer Anzeiger 39: 66 -
69.
Kaur, I., Roy, S., Chakrabarti, S., Sarhadi, K. V., Majumder, P. P., Bhanwer, A. J. S. and Singh,
J. R. 2002. Genomic diversities and affinities among four endogamous groups of Punjab
(India) based on autosomal and mitochondrial DNA polymorphisms. Human Biology 74:
819 - 836.
Kaur, H.P. 2017. Genetic structure of Jat Sikh of Faridkot district. WJPPS, ISSN – 22784357.

Kaushal, S., Patnaik, V.V.G. and Kaur, P. 2013. Somatometric analysis of nasal morphology in
the endogamous groups of Punjab. Human Biology Review 2: 1-11.
Krishan, K. and Kumar, R. 2007. Determination of stature from cephalo-facial dimensions in a
North Indian population. Leg Med. 9: 128-133.
Krishan, K. 2008. Estimation of stature from cephalo-facial anthropometry in North Indian
Population. Forensic Intern. 18: 1-3.
Kumar, M. and Patnaik, V.V.G. 2013. The Anthropometric variation among Haryanvi
population. International Journal of Science and Research 2: 446-449.
Mahajan, A., Khurana B.S., Seema and Batra, A.P. 2009. The study of cephalic index in Punjabi
students. Journal of Punjab Academy of Forensic Medicine & Toxicology 10: 24-26.
Majumder, P.P., Roy, B., Banerjee, S., Chakraborty, M., Dey, B., Mukherjee, N., Roy, M.,
Thakurta, P.G. and Sil, S.K. 1999. Human-specific insertion/deletion polymorphisms
in Indian populations and their possible evolutionary implications. Eur. J. Hum. Genet.7:
435-446.
Martin, R., and Saller, K. 1957. Lehrbuch der anhropologie. Gustav Fischer Verlag. Vol II.
Miller, S.A., Dykes, D.D. and Polesky, H.F. 1988. A simple salting out procedure for extracting
DNA from human nucleated cells. Nuc. Acids Res. 16: 1215.
Mishra, M., Tiwari, A., Naik, D.C. 2014. Study of Cephalic Index in Vindhya region of Madhya
Pradesh. International Journal of Medical Science and Public Health 3(12): 1464-1465.
Mourant, A.E, Kopec, A.C. and Domaniewska-Sobczak, K. 1976. The Distribution of the
Human Blood Groups and Other Polymorphisms, 2nd ed. Oxford University Press,
London.
Mukherjee, N., Mitra, M., Chakraborty, M., and Majumder, P.P. 2000. Congruence of genomic
and ethnolinguistic affinities among five tribal populations of Madhya Pradesh. Journal
of Genetics 79: 41- 46.
Mukhopadhyay, R. and Kshatriya, G. K. 2004. Distribution of blood groups among Brahmins
and Rajputs of Himachal Pradesh. Anthropologist 6 (4): 293-294.
Nair, K.S., Ajankar, V.P, Singh, S., Bindra, M., Satpathy, D.K. 2014. The study of cephalic
index of medical students of Central India. Asian Journal of Biomedical and
Pharmaceutical Sciences 28: 48-50.
Nei, M. 1972. Genetic distance between populations. Am. Naturalist 106: 283-292.
Nei, M. 1973. Analysis of gene diversity in subdivided populations. Proc. Natl. Acad. Sci. USA.
70: 3321-3323.
Patil, G.V., Kumar, S., Apoorva, D., Thejeswari, Sharif, J., Sheshgiri, C. and Sushant, N. K.
2014. Study on nasal index in South Indian population. International Journal of Current
Research 6: 8163- 8164.
Patro, S., Sahu, R. and Rath, S. 2014. Study of Cephalic Index in South Odisha population.
Journal of Dental and Medical Sciences 13 (1): 41-44.
Ray, K.S., Saha, k., Kumar, A. and Banjare, S. 2016. Anthropometric study of Nasal Index
among the population of Western Uttar Pradesh region. International Journal of Scientific
Study 4(2): 65-70.
Saini, J. S., Kumar, A., Matharoo, K., Sokhi, J., Badaruddoza and Bhanwer, A. J. S. 2012.
Genomic diversity and affinities in populations of North West India: An analysis of Alu
insertion and a single nucleotide polymorphism. Gene 511: 293-299.
Saraswathy, K.N., Sachdeva, M.P., Mukhopadhyay, R., Shukla, D., Devi, N.K., Rawat, S., Rao,
A.P. and Kalla, A.K. 2008. Diversified genomic contribution among south Indian
populations - a study on four endogamous groups of Andhra Pradesh. Annals of Human
Biology 35: 499-508.
Saraswathy, K. N., Naorem, K., Murry, B., Sinha, E., Saksena, D., Kaur, H., Sachdeva, M. P.
and Kalla, A. K. 2009. A genomic insight into diversity among tribal and non tribal
population groups of Manipur, India. Biochem. Genet. 47: 694-706.
Seema and Verma P. 2016. The study of cephalic index in north Indian popuation. Int. J.
Morphol. 34: 660-664.
Shah, G.V. and Jadav, H.R. 2004. The study of CI in students of Gujarat. J Anat. Soc. India 53:
25-26.
Sidhu, L. S., Singal, P. and Kaur, S. 1982. Physique and body composition of Jat-Sikh and Bania
girl students of Punjab. Z. Morph. Anthrop. 73: 51-58.
Sidhu, S. 2003. Distribution of ABO blood groups and Rh (D) factor among the Scheduled
Caste populations of Punjab. Anthropologist 5: 203-204.

Singh, I. P. and Bhasin, M. K. 1989. Anthropometry. Kamla Raj Enterprises, Delhi.
Singh, S.P., Sidhu, L. S. and Malhotra, P. 1988. Body measurements and somatotypes of young
adult Jat Sikh men of Punjab. Anthropologischer Anzeiger 46 (3): 261-267.
Singh, P. and Pukrait, R. 2006. A Cephalometric study among sub caste groups of Dangi and
Ahirwar of Khurai block of Madhya Pradesh. Anthropologist 8: 215-217.
Singh, A., Chahal, S. M. S. and Kaur, M. I. 2013. The distribution of A1A2BO blood groups in
the Buksa – A primitive tribe of Uttarakhand, North India. Anthropologist 15(2): 241-
243.
Singla, M. 2005. Facial anthropometry in adult Jat-Sikh and Bania males of Punjab, India.
Thesis, Government Medical College, Patiala.
Sneath, P.H. and Sokal, R.R. 1973. Numerical Taxonomy. W.H. Freeman and Company, San
Francisco.
Uttekar, K., Gupta, D.S., Andani, R.,Kubavat, D.M., Nagar, S.K., Varlekar, P. 2013. Study of
cephalic index in South Gujarat. International journal of recent trends in science and
technology 8: 87-89.
Yadav, A.S. and Arora, P. 2011. Genomic diversities and affinities among eight endogamous
groups of Haryana (India): a study on insertion/deletion polymorphisms. Annals of
Human Biology 38: 114-118.
Appendix-I
Consent Form and General Information Sheet
Study Title: "Anthropogenetic Profile of "denotified" Tribes (Vimukt Jatis) of Punjab (North-
West India) and its Social Implication"
Participant: Name ________________ Caste ______________ Gender _____________
Age _____ (in years) Place ________________ Marital Status ___________
Please read the following before putting your signature below: [X]
I have genuinely informed the investigator about my current health status that I
am not under any serious medical condition which includes suffering from any
genetic or psychological disorder.
[ ]
I am free to participate or not to participate in this study. [ ]
I have been given the opportunity to ask questions and reply was given for all
the questions to my satisfaction. [ ]
I have been informed by the investigators about the process including the
nature, objective and known and likely inconveniences related to this study and
I have understood them.
[ ]
By signing this form, I give my free and informed consent to take part in this
study as outlined in the information sheet and this consent form. [ ]
I give permission for any blood that is left over after the tests to be stored and
used for further laboratory tests for medical research. [ ]
By signing this form I have not given up my legal rights.
________________________________________ Date: ___ / ___ /_______
Signature/Thumb Impression of Participant (or Legal Representative)
________________________________________ ________________________________________
Name and Signature of Investigator Name and Signature of the Witness