Anthony Rose Chief Financial Officer Presentation to the 13th UBS ...€¦ · Presentation to the...
17
Presentation to the 13 th UBS Australian Financial Services Conference 25 June 2014 Bank of Queensland Limited ABN 32 009 656 740. AFSL No 244616. Anthony Rose Chief Financial Officer
Transcript of Anthony Rose Chief Financial Officer Presentation to the 13th UBS ...€¦ · Presentation to the...
Presentation to the 13th UBS Australian Financial Services Conference 25 June 2014
Bank of Queensland Limited ABN 32 009 656 740. AFSL No 244616.
Anthony Rose Chief Financial Officer

2
Key messages
Potential upside still to be realised in new Retail channels and Business Banking
2
3
4
5
6
Disciplined approach to growth has continued – not compromising quality
Balance sheet quality and strength evidenced by two credit rating upgrades
Proactive management of levers to deliver results – strong improvement in margin, cost to income, risk metrics and ROTE
1 Simple, well executed strategy delivering record results
Investec businesses being acquired provide a strong fit with the four strategic pillars of BOQ’s strategy

3
Proactive margin management
Strong 5bps improvement on 2H13
Tailwinds Rating upgrades reducing wholesale
costs and opening up counterparty limits
Deposit pricing adjustments with lower lending growth
Headwinds High margin asset run-off (eg. Line of
Credit) Lending front-book pricing
competition Low interest rate environment
2.05% 2.10%
3rd Party costs NIM
( ) ( )

4
Run-off & deleveraging restraining growth
Focus on improving quality of the book and building a sound platform for growth
Line of Credit (LOC) run-off still high as portfolio re-weighting continues – down to $3.9bn from $5.2bn in Feb 2012
QLD continues to underperform national system growth (0.5x)1, but interstate expansion will further reduce impact
( )
( )
(1) Source: Cannex market share report Feb 2014.

5
Multi-channel: improving momentum in Retail channels
Retail channels: source of lending applications
Total = $739m
Total = $764m
Corporate
OMB
Digital
Broker
Owner-managed branch (OMB) – 70% of branches posted positive lending growth (excluding legacy run-off)
Improved corporate branch productivity following restructure & refocus – lending applications up 8% year on year
~1,000 brokers now accredited, lending applications flow doubled between 1Q14 and 2Q14
Refreshed website and new mobile apps generating significant new leads
Mobile
Bankers
Team of 10 mobile bankers recruited & deployed with application pipeline growing strongly

6
Risk-Return: focus on profitable growth
Targeting growth and expansion in higher margin Business Banking, but not compromising price or risk
Sound risk management practices embedded in the lending processes across the business, contributing to quality improvement
Actively reduced reliance on high cost retail deposit segments, given lower asset growth
Commercial loans: diversifying by geography(1)
Total = $5.29bn Total = $5.37bn
(1) Note this includes commercial loans originated by Retail

7
Operational excellence: reinvesting in future growth
Reinvestment for growth: Lending platform – digitisation, straight-through processing
Consolidation of technologies across the group
Front line staffing and capability uplift, particularly in Business Banking
Savings harvested in: Procurement $3.6m
Property & service rationalisation $0.8m
Corporate network restructuring $1.1m

8
Talent & culture: driving customer satisfaction
Retail customer satisfaction metrics improving 68% of customers classified as ‘high advocates’ (scored
8-10/10) – ranked #1 in February 2014 among all major banks from #7 a year ago(1)
Business Banking surveys consistently rank BOQ #1 across a range of engagement metrics Recently named Best Relationship Bank by AB+F
BOQ Finance ranks #1 in pre-deal service and #2 in ease of use and product performance against leading primary financiers (2)
Driving culture of customer focus across the organisation and targeting top quartile employee engagement scores
(1) Source: Roy Morgan Research Consumer Single Source, 6 months average -
February 2014. Net Promoter Score is a trademark of “Satmetrix Systems, Inc.,
Bain & Company, and Fred Reichheld”
(2) Source: East & Partners Business Banking Index June 2013
(3) Source: East & Partners Business Banking Index March 2014
(3)
BOQ ANZ CBA NAB WBC
+17.5 -7.5 +1.5 +1.6 -10.9
Net Promoter Scores – February 2014(1)

9
Impaired levels now in line with peers
10
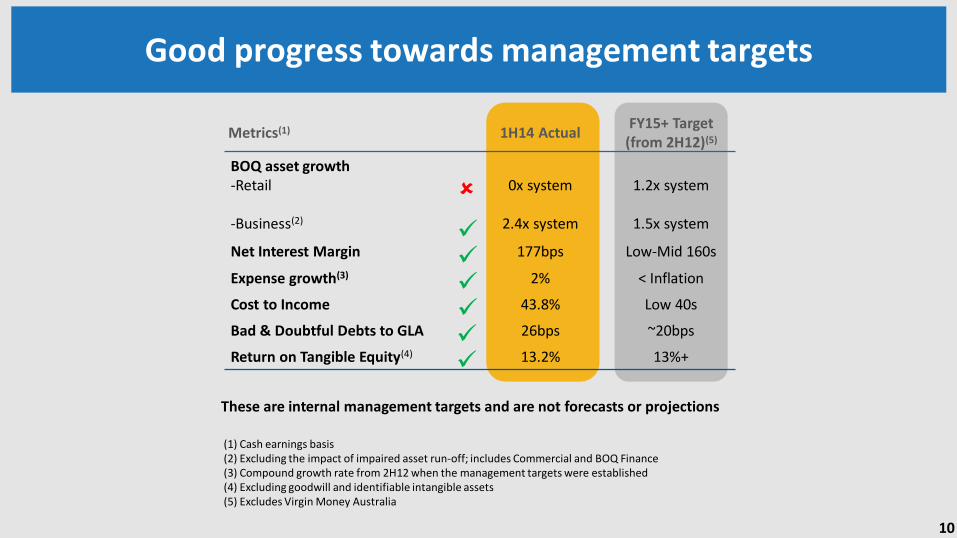
Good progress towards management targets
(1) Cash earnings basis (2) Excluding the impact of impaired asset run-off; includes Commercial and BOQ Finance (3) Compound growth rate from 2H12 when the management targets were established (4) Excluding goodwill and identifiable intangible assets (5) Excludes Virgin Money Australia
Metrics(1) 1H14 Actual FY15+ Target
(from 2H12)(5)
BOQ asset growth
-Retail -Business(2)
0x system
2.4x system
1.2x system
1.5x system
Net Interest Margin 177bps Low-Mid 160s
Expense growth(3) 2% < Inflation
Cost to Income 43.8% Low 40s
Bad & Doubtful Debts to GLA 26bps ~20bps
Return on Tangible Equity(4) 13.2% 13%+
These are internal management targets and are not forecasts or projections

11
Opportunities for growth
Historical Channel Mix
(2013)
85%
15%
Target Channel Mix
(2015+)
~60%
~15%
~20%
~5%
Source of origination
New commission model launched in 1Q15 will increase focus on quality and share of wallet
Transformation of back office & increased capability will improve franchisee productivity
Leverage refresh of digital assets to drive online sales and lead generation
Corporate
Branch
Digital
Broker
OMBs
Mobile
Bankers
National roll out and scale up of BDM & processing resource – target to double accredited brokers & aggregators from 1H14 to 2H14
New sources of growth
Doubling of mobile business development resource to build on strong initial pipeline
Currently operating at ~30% of OMB productivity – significant growth potential as new talent and productivity initiatives embedded Growth &
relationship excellence

12
Opportunities for growth
Business Banking expansion Continue to invest in existing metropolitan hubs with planned expansion into regional and rural
Victoria / WA over the next 12 months Focus on credit quality, pricing for risk and achieving return hurdles Remain committed to growing a strong, high quality agribusiness portfolio Non interest income opportunities with further investment in financial markets capability and
expertise Further push into the SME segment by leveraging unique operating model of the OMB network and
recruitment of 3 additional SME specialist lenders (10 in total) Other Further cost and productivity initiatives including digitisation and process re-engineering BOQ Finance targeting increased penetration into BOQ branch network Virgin Money Australia business build-out strategy progressing – profitability achieved six months
early

13
Investec businesses are a good strategic fit
Specialist provider of practice and personal finance to medical, dental and veterinary practitioners (82% of outstanding loans) and accounting and other professionals (18% of outstanding loans)
Mortgage originator and manager of off-balance sheet mortgage portfolio (approximately $1.0bn originated in CY13)
c.19,000 customers
Professional Finance
Asset Finance & Leasing
Deposit Book
Provider of specialist asset finance and leasing solutions via a mix of vendors, intermediaries and direct client relationships
c.14,000 customers
$2.7bn deposit book (comprising $2.3bn retail and $0.4bn wholesale)
Greater than 50% of the retail deposit book is sourced from high net worth individuals and clients of the Professional Finance business
c.9,000 customers
$173m of loans on
balance sheet (1)
$2.7bn deposit book (1)
Note: Following a restructuring of Investec Bank (Australia) Limited to remove certain businesses outside of the scope of the acquisition, BOQ will acquire 100% of the shares in Investec Bank (Australia) Limited which will include the above businesses.
(1) As at 31-Mar-2014.
$2.2bn of total loans(1)

14
Professional Finance – Financial Profile
Asset Spread(1)
Bad & Doubtful Debts Expense as a % of Gross Lending Assets(2) Non-Interest Income as a % of Gross Lending Assets(2)
Loan Book Growth
Source: Acquired Businesses’ management.
¹ Spread to swap curve at last repricing date. Source: Bloomberg.
² Non-Interest Income and Bad & Doubtful Debts Expense based on 9 months actual to 31-Dec-2013 plus 3 months estimate to 31-Mar-2014. Gross Lending Assets at end of period.
$bn
% %
%

15
Summary & outlook
Continued focus on execution with disciplined approach to growth, margin, risk management and costs
Increasing returns to shareholders off a lower risk, lower volatility platform
Further growth potential in Retail distribution and Business Banking expansion, as well as internal productivity and efficiency gains
On track to meet key management targets for FY15
1
2
3
4
5 Investec businesses provide good strategic fit and additional avenue for growth

16
Important notices
Financial amounts
All dollar values are in Australian dollars (A$) and financial data is presented as at the date stated. Pro-forma financial information and past information provided in this Presentation is for illustrative purposes only and is not represented as being indicative of BOQ's views on its future financial condition and/or performance. Past performance, including past trading or share price performance, of BOQ cannot be relied upon as an indicator of (and provides no guidance as to) future BOQ performance including future trading or share price performance.
Future performance
This Presentation contains certain "forward looking statements". Forward looking statements can generally be identified by the use of forward looking words such as "anticipate", "believe", "expect", "project", "forecast", "estimate", "likely", "intend", "should", “will”, "could", "may", "target", "plan" and other similar expressions within the meaning of securities laws of applicable jurisdictions. The forward looking statements contained in this Presentation involve known and unknown risks and uncertainties and other factors, many of which are beyond the control of BOQ, and may involve significant elements of subjective judgement as to future events which may or may not be correct.
There can be no assurance that actual outcomes will not differ materially from these forward-looking statements.
Financial performance
In assessing financial performance, BOQ discloses the net profit (loss) after tax on both a ‘Statutory basis’ and a ‘Cash Earnings basis’. The Statutory basis is prepared in accordance with the Corporations Act 2001 and the Australian Accounting Standards, which comply with International Financial Reporting Standards (IFRS). The Cash Earnings basis is used by Management to present a clear view of BOQ’s underlying operating results. This excludes a number of items that introduce volatility and/or one off distortions of BOQ’s current period performance, and allows for a more effective comparison of BOQ’s performance across reporting periods and against peers. These items, such as amortisation of intangibles from acquisitions, and accounting for economic hedges, are calculated consistently year on year and do not discriminate between positive and negative adjustments. BOQ also uses the measure of ‘Underlying Profit’, which represents the profit before loan impairment expense and tax, to prov ide users with a view on the underlying growth rate of the business. Further details of items excluded from statutory profit are provided in the reconciliation of the net profit after tax (“Cash Earnings basis”) in this Presentation.
Non statutory financial disclosures are not audited.