ANSUT report: A Culture of Entitlement
32
A CULTURE OF ENTITLEMENT A REPORT ON RISING ADMINISTRATIVE COMPENSATION AT NOVA SCOTIA UNIVERSITIES
-
Upload
the-chronicle-herald -
Category
Documents
-
view
18.150 -
download
0
description
A report on rising administrative compensation at Nova Scotia universities from the Association of Nova Scotia University Teachers, which represents faculty, librarians and academic staff at eight Nova Scotia universities.
Transcript of ANSUT report: A Culture of Entitlement
A Culture
ofentitlement
A report on rising AdministrAtive CompensAtion At novA sCotiA Universities

pUbliC Universities,pUbliC ACCoUntAbility
over the past several years, students, staff, and faculty have raised concerns related to the remuneration and hiring practices of senior level administrators,
and also to the lack of oversight of university expenditures across the country. As publicly funded institutions, universities need to be accountable to the public. The public should be able to expect that decision-makers are spending funding appropriately to achieve the two key functions of the university – teaching and research. Unfortunately, universities are not subjected to the same public oversight as other public institutions such as district health authorities, P-12 schools, and community colleges.
Since the early 1990s, there has been a significant shift in funding for post-secondary education away from primarily public funding and towards significant private funding. Private funding takes many forms including tuition fees, the outsourcing of food service, student housing, information technology and other services, the direct solicitation of private donations from individuals and corporations, and the privatization and commercialization of research.
Some have argued that this private funding means that universities are independent institutions that receive public assistance rather than being public institutions. This ideology leads to the idea that university administrators are similar to senior executives in the private sector and that the key to adequate funding for universities is fundraising, increasing for-profit industry on campus, and expansive marketing to attract students (and their tuition fees).
The shift towards private funding is based on policy decisions made by successive governments to divest from universities in Nova Scotia, and across Canada. In 1989, government funding provided more than three quarters of university revenue in Nova Scotia.1 By 2009, government sources accounted for less than half of university funding.2 Between 1990 and 2004, per-student funding dropped by 41 per cent and for several years per-student funding in Nova Scotia was the lowest in the country.3
Starting in 2005, the government began negotiating multi-year funding agreements with the Council of Nova Scotia University Presidents. The first two funding agreements, covering 2005 to 2008 and 2008 to 2011, respectively, agreed to increase funding to universities in return for controls on tuition fees.
In the first agreement, universities were told to find one per cent efficiencies in their operations. This government request was especially concerning in light of the hundreds of millions of dollars that successive provincial governments had cut from the sector during the previous two decades. Funding increases under the two MOUs meant that by 2009, gross funding for universities in Nova Scotia reached, in real dollars, 1989 levels, but between 1989 and 2009, funding cuts had resulted in $676 million less being directed to universities than if university funding had kept pace with inflation (Figure 1).4 To compound the issue of underfunding, between 1992 and 2005, enrolment also increased at Nova Scotia universities by twenty per cent.5 So even after a significant injection of funding, per-student funding was still not at the levels it had been in the early 1990s.
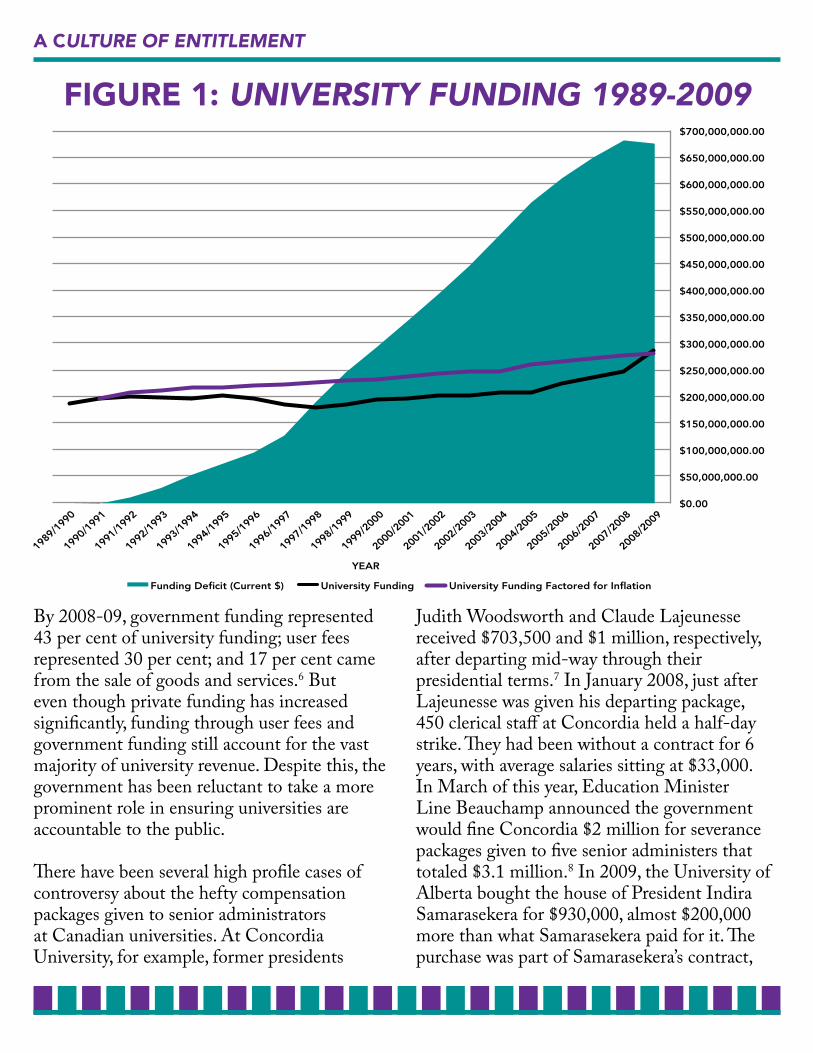
figure 1: university Funding 1989-2009
By 2008-09, government funding represented 43 per cent of university funding; user fees represented 30 per cent; and 17 per cent came from the sale of goods and services.6 But even though private funding has increased significantly, funding through user fees and government funding still account for the vast majority of university revenue. Despite this, the government has been reluctant to take a more prominent role in ensuring universities are accountable to the public.
There have been several high profile cases of controversy about the hefty compensation packages given to senior administrators at Canadian universities. At Concordia University, for example, former presidents
Judith Woodsworth and Claude Lajeunesse received $703,500 and $1 million, respectively, after departing mid-way through their presidential terms.7 In January 2008, just after Lajeunesse was given his departing package, 450 clerical staff at Concordia held a half-day strike. They had been without a contract for 6 years, with average salaries sitting at $33,000. In March of this year, Education Minister Line Beauchamp announced the government would fine Concordia $2 million for severance packages given to five senior administers that totaled $3.1 million.8 In 2009, the University of Alberta bought the house of President Indira Samarasekera for $930,000, almost $200,000 more than what Samarasekera paid for it. The purchase was part of Samarasekera’s contract,
A Culture oF entitlement
which was worth a total of $936,000 in salary and benefits without the house purchase.9 Governor General David Johnston was paid $610,506 in 2011 in unused vacation and leave pay from his time as the President of the University of Waterloo. He left that position in October 2010.10 Yet while the compensation levels of senior administrators in Nova Scotia have not resulted in this degree of controversy, the concerns of opaque compensation practices and inadequate oversight of public money raised by these cases are relevant to Nova Scotia’s university system.
In January 2010, the Nova Scotia government announced they would conduct a review of post-secondary education in Nova Scotia. The Report on the University System in Nova Scotia, written for the government by former Bank of Montreal Vice President Tim O’Neill, was released on September 17, 2010. The report made several troubling recommendations and was opposed by students, faculty, and support staff. The report’s recommendations focused on the further privatization of our public universities, including increasing tuition fees, outsourcing more campus services, focusing more on research that can quickly be applied to industry, and merging campuses.
In the report, O’Neill acknowledged that the government should explore the cost of university administration, but then later brushed off the issue of administrative salary expenditures. While he points to an article that shows that “the share of expenditures going to instruction had fallen from 65 per cent to 58 per cent between 1998 and 2008, while the proportion spent on central administration had risen from 12 per cent to 20 per cent over the same period” he disagrees that this in and of itself should be cause for concern. Yet at the same time he states,
“Without joining that debate, it is interesting to examine what the actual patterns are in the total university system in Canada, and in Nova Scotia specifically.”11 Unfortunately, O’Neill fails to address “the actual patterns” in any depth. Instead, he comments briefly on a slight decline in the broad category of “administration” and then offers this insight:
“If, for example, universities were utilizing more of their resources to provide better human resource management services in their operations or to raise more funds from outside sources, these would be arguably good reasons for any increase in the central administration share of total spending. Conversely, a decrease in the share of resources being used for instruction is not necessarily evidence that the faculty and students are somehow being short-changed in the allocation of finances.”12
These comments reflect O’Neill’s ideological position about the use of university resources rather than providing insight into the way resources are allocated. It is equally possible that universities have achieved an overall decline in the “administration” budget line through reducing support for departments and offloading administrative duties to faculty, while increasing resources provided to marketing, communications, and government lobbying. Nowhere in the report are senior administrator salaries separated from those of other non-teaching staff, such as clerical or facilities staff, most of whom are represented by unions and hold collective agreements with pay scales laid out transparently.
Instead of addressing the issue of mushrooming administrative expenditures, O’Neill recommends the merger or “significant affiliation” of institutions, even though he admits
A Culture oF entitlement
there was no evidence that such initiatives actually save money or improve quality. Indeed, one need only point to the example of the amalgamation of HRM for evidence that if anything the reverse is the case. There is no evidence that the merger of the Technical University of Nova Scotia with Dalhousie in the 1990s reduced costs or enhanced the quality of education. In the case the Dalhousie-Nova Scotia Agricultural College merger, the government’s commitment of $9 million to cover “transition costs” suggests that mergers are hardly a recipe for saving money. It should be noted that this sum would have been sufficient to resolve NSCAD’s current financial difficulties, without necessitating the draconian measures currently being proposed to address the problem.
In 2011, in line with the O’Neill report, the government announced that it would cut funding to universities by four per cent and would lift the tuition fee freeze, allowing tuition fees to increase by three per cent, so that universities would be able to offset some of the loss in funding. The government continued this policy with the latest Memorandum of Understanding (MOU) with university presidents on university funding. The agreement, which covers the period 2012 to 2015, lays the groundwork for significant changes to universities in Nova Scotia, including the implementation of “full cost recovery programs” – programs that receive no government funding and are completely funded through tuition fees.
Over the 2011-2012 academic year, the government and the Council of Nova Scotia University Presidents (CONSUP) negotiated a third MOU on university funding. While students and some business leaders were involved in discussions around the negotiations, faculty and staff continued to be shut out of the
development of this very important piece of government and university policy.
The most recent MOU indicates that university presidents and the provincial government will work towards a “Change Mandate” for the university system. The agreement also forms a Partnership with all the university presidents and up to five deputy ministers that is intended to help achieve this mandate. Neither faculty nor staff are guaranteed any input into the Change Mandate or its implementation. Potential elements of the Change Mandate identified by the MOU include: collaborative innovation projects to reduce costs and strengthen quality, quality assurance, articulation of University Mission and Institutional Capacity, transparency and accountability, fostering further coordination and collaboration across the system, standardized and public financial reporting, and developing of a Funding Stability Mechanism. It is concerning that faculty and staff will have no role in this process when such changes to the university system are being contemplated. By confining university representation in the process to senior administration, the government is ensuring that no serious attempt will be made to address possible reductions in the cost of senior administration.
This report sheds light on the steep increases in compensation for senior administrators since 2004 and on the growth in the number of senior administrative hirings at campuses across the province. It also makes recommendations to strengthen public accountability for our public universities and data collection in the province on university expenditures. This report’s findings and recommendations intend to contribute to the conversation the government and university presidents have begun, but that faculty and other university stakeholders have been excluded from.
A Culture oF entitlement
methodology & notes on the dAtA in this report
n October 2011, Freedom of Information and Protection of Privacy Act (FOIPOP) requests were sent to universities where the faculty are represented by the
Association of Nova Scotia University Teachers (ANSUT): Acadia University, the Atlantic School of Theology, Cape Breton University, Mount Saint Vincent University, Nova Scotia College of Art and Design University, St. Francis Xavier University, Saint Mary’s University, and Université Sainte Anne. Each requested the salaries, bonuses, severance, and other monetary benefits given to the universities’ presidents, vice presidents, assistant/associate vice presidents, directors, and equivalent staff members outside of the bargaining units at the universities over the period 2004/05 to 2010/11.
Unfortunately, many universities took considerably longer than the mandated 30 days to deliver the data, and one university, NSCAD, initially refused the request. Even though NSCAD eventually delivered complete data, their refusal led to delays. Other universities claimed to have limited staff capacity to carry out such requests, and Acadia, Cape Breton University, and St. FX all failed to provide the data until four to six months after the request was sent.
The data that was received is compiled in this report. Every effort has been made to give an accurate portrayal of administrative costs at universities, although this was rendered more difficult by the fact that some universities provided data for the calendar or payroll year, while others provided data from the fiscal year. To balance this discrepancy, data received by calendar year is listed with the fiscal year that starts with corresponding calendar year; i.e. data for 2004 is listed with 2004-05; 2005 is listed with 2005-06; and so on.
This report assumes that jobs performed by administrators at the eight universities with each of the following job titles are similar enough that they can be compared: President, Vice President, Assistant or Associate Vice President, and Dean. In the case of Directors, it was not assumed that directors’ job descriptions were comparable across universities because of the significant differences in compensation and potential job functions. In cases where the job title was not one of the above, every effort has been made to fit it within the appropriate management category.
I
AdministrAtor sAlAries At Universities, 2004-05 to 2010-11
hile the public has a major financial stake in our universities as taxpayers, students, potential or future students, relatives of students, and university
employees, they have little access to information about how that money is being spent. This year is the first that universities will be required to post the salaries of employees receiving more than $100,000 in salaries. When it comes to other expenditures that the government has to release, such as who precisely receives payments from government, universities are not required to comply. Universities also have very different practices when it comes to budgeting, making it difficult to identify where funding is being spent over time and across institutions.
In the face of government funding cuts or other financial strains, universities have generally chosen a path that involves aggressively recruiting, particularly targeting international students who pay higher fees and lowering admission standards in order to increase enrollment; charging students more in tuition, ancillary, and auxiliary fees; and cutting costs through outsourcing, service cuts and staff cuts. Sometimes the decisions of management to address budget shortfalls have been unreasonable, either misunderstanding the reality of potential growth or possible private funding sources, or attempting to thwart government agreements on fees. For example, a report written last year on how to make NSCAD “more sustainable,” reveals that the university’s senior administration believed that
enrollment could be increased by 40 per cent. The report author, Howard Windsor, points out that there is “insufficient evidence to support this assumption.”13
Similarly, the lack of public oversight means that practices around hiring senior administrators and compensation for these employees can be opaque, making it difficult for the public and government to assess whether universities are spending funds appropriately. For example, the University of King’s College hired a headhunting firm to help in the search process for their most recent President, however, the successful candidate left after only one year in the position. The value of headhunting services, and the use of public money in their procurement warrants attention. Similar attention should be given to the budgets of senior administrative offices, fundraising activities at the universities and the various partnerships the universities have with private companies for the provision of services.
The following sections look at the compensation practices for senior administrators at the surveyed universities. The eight surveyed universities collectively spend $16.4 million on salaries for the Presidents, Vice Presidents Associate/Assistant Vice Presidents, Deans, Directors, and other administrators who are not part of bargaining units at the university. This is an increase of 27 per cent since 2004 (Figure 2). Even when factoring out inflation, these salary costs increased 14 per cent, and before the slight decline in 2010-11, salaries had increased
W
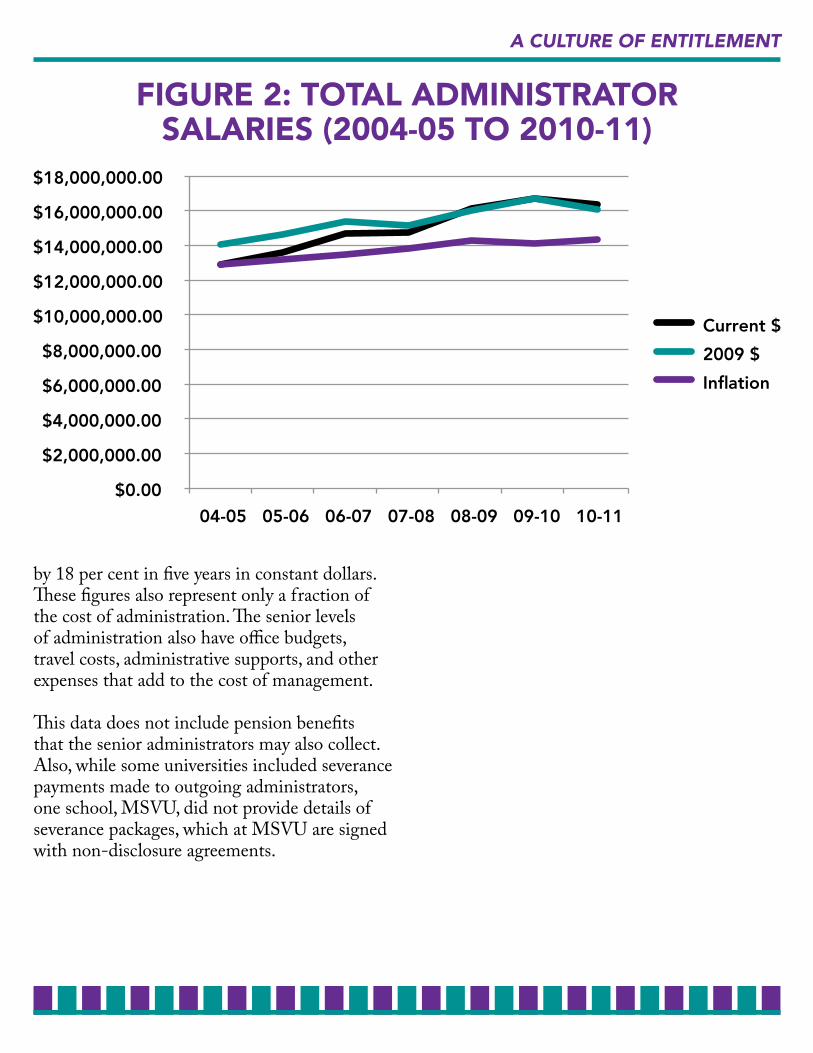
by 18 per cent in five years in constant dollars. These figures also represent only a fraction of the cost of administration. The senior levels of administration also have office budgets, travel costs, administrative supports, and other expenses that add to the cost of management.
This data does not include pension benefits that the senior administrators may also collect. Also, while some universities included severance payments made to outgoing administrators, one school, MSVU, did not provide details of severance packages, which at MSVU are signed with non-disclosure agreements.
A Culture oF entitlement
figure 2: ToTAl AdminisTrATorsAlAries (2004-05 To 2010-11)
presidentsnsurprisingly, Presidents were the highest paid administrators at each university. They also usually receive benefits such as housing and car allowances on
top of their salaries. Presidents may receive performance and/or signing bonuses and many universities pay full salary when the president and sometimes other senior administrators take administrative leave. From 2004-05 and 2010-11, compensation for the President at the each university increased between 8.44 per cent and 45 per cent (Figure 3). The median compensation for university presidents at the surveyed universities increased by about a quarter between 2004-05 and 2010-11, from $198,598 to $246,400.
NSCAD’s Presidential compensation increased the most modestly. However, the relatively low increase reflects a significant reduction in compensation when the President changed from Dr. Paul Greenhalgh to David B. Smith in 2006. Even so, Smith’s compensation increased over 17 per cent from 2006-07 to 2010-11. Smith also received a bonus of $40,000 in 2009, and it appears that following his resignation earlier this year, he will continue to be paid an “administrative stipend” on top of his regular academic salary, even though there is no indication that he will be performing any administrative duties.
In 2010-11, Sean Riley, President of St. FX, was the highest paid president of the universities included in the data for this report. He received $305,360 in compensation in 2010-2011. Riley took a 10 per cent cut in 2010-11, but had seen
his compensation increase 52 per cent between 2004-2005 and 2009-2010, meaning that even with a pay cut today he receives 37 per cent more than what he received in remuneration in 2004-05. In comparison, the average salary for academic staff increased between 11 and 18 per cent from 2004-05 to 2009-10, depending on their rank.
In 2010-11, SMU President Colin Dodds, the next highest paid on the list, was paid $220,265 in salary, plus $35,700 for teaching and another $30,718 in housing and car allowances. Even if he were receiving the maximum compensation given per course to part-time instructors, he would have had to teach 3.25 full credits worth of classes. Part-time instructors are restricted to teaching two full credits in the academic year and two full credits in the summer. Based on the demands of the Presidents’ role, it is safe to assume that Dodds taught a much lighter load, but was paid well above what part-time instructors at the university are paid.
At MSVU, the President and other senior administrators receive substantial bonuses in addition to their salaries. These bonuses added an additional seven to nine per cent to the President’s salary each year. Bonuses are concerning because the criteria for how they are determined are opaque. While the criteria may be included in the administrator’s contract, this information is negotiated at a senior management level and stakeholders on the board, such as students and faculty, do not have access to these contracts. The value of administrator bonuses at MSVU has more than doubled since 2004. In 2010-11, the university
U
paid administrators bonuses ranging from $2700 to $16,800 and the total cost of bonuses was over $110,000.
In addition to bonus criteria, perks for university presidents may also include paid leave. At Acadia, when Dr. Kelvin K. Ogilvie left office in September 2003 after being president for 10 years, he had accumulated more than two years of administrative leave. This meant that in each 2004-05 and 2005-06, Ogilvie was paid $210,000 at the same time as Acadia was paying their new president. A similar issue would arise with Ogilvie’s successor, Gail Dinter-Gottlieb. President Dinter-Gottlieb left in March 2008, but was on administrative leave until the end of her term in April 2011. Acadia paid her $235,873 in 2008-09, and $232,000 in 2009-10. In each year between 2004-2005 and 2010-11, Acadia was paying its current president as well as a former president. In total, Acadia paid
$907,627 in administrative leave pay to past presidents during this time. Over this same time, the university paid $1,476,882 in salaries to presidents or acting presidents at the university. By comparison, full-time, tenured faculty and some full-time non-tenured faculty at Acadia are eligible to take a 12-month sabbatical every six years. During this time, they receive 80 per cent of their annual pay, must be approved by a committee, and must provide a report to the Vice President Academic regarding their activities during their sabbatical. There is no pay in lieu of taking leave.14
At SMU there is a similar practice, with the added feature that in the event that an administrator does not take their leave, they may instead take the extra year’s salary. No such benefit exists for faculty who do not take sabbatical.
A Culture oF entitlement
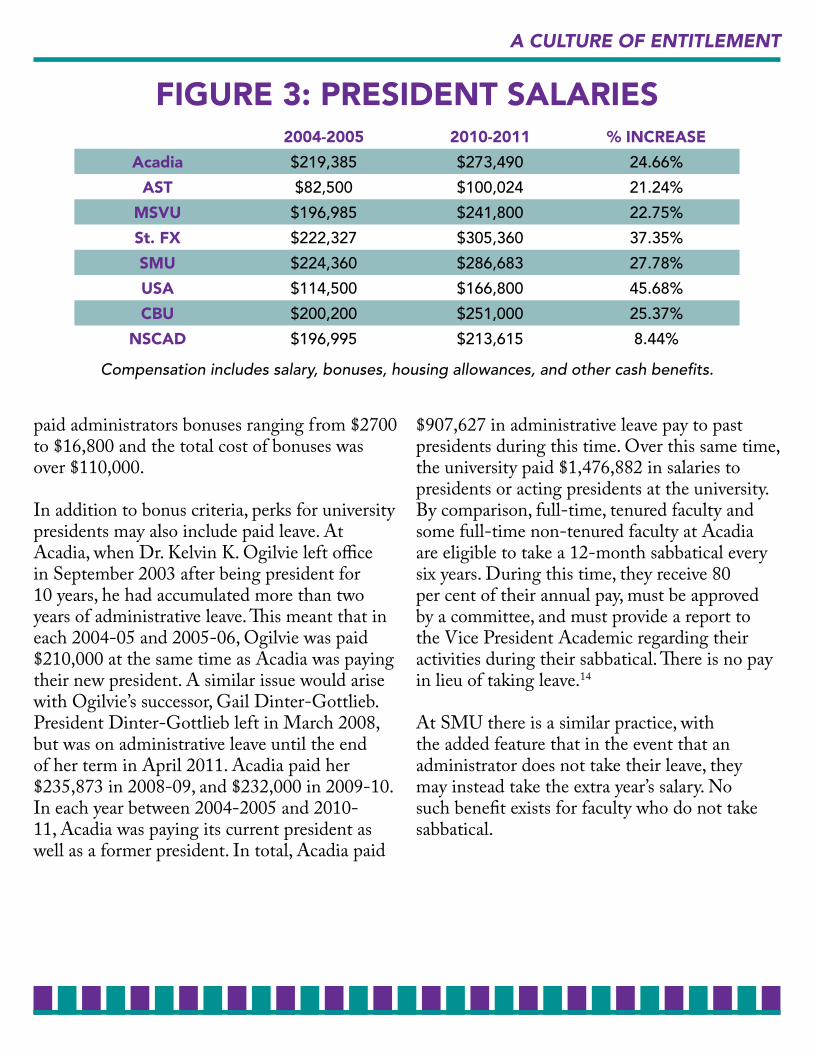
2004-2005 2010-2011 % inCreAse
Acadia $219,385 $273,490 24.66%
AsT $82,500 $100,024 21.24%
msVu $196,985 $241,800 22.75%
st. fX $222,327 $305,360 37.35%
smu $224,360 $286,683 27.78%
usA $114,500 $166,800 45.68%
CBu $200,200 $251,000 25.37%
nsCAd $196,995 $213,615 8.44%
Compensation includes salary, bonuses, housing allowances, and other cash benefits.
figure 3: PresidenT sAlAries
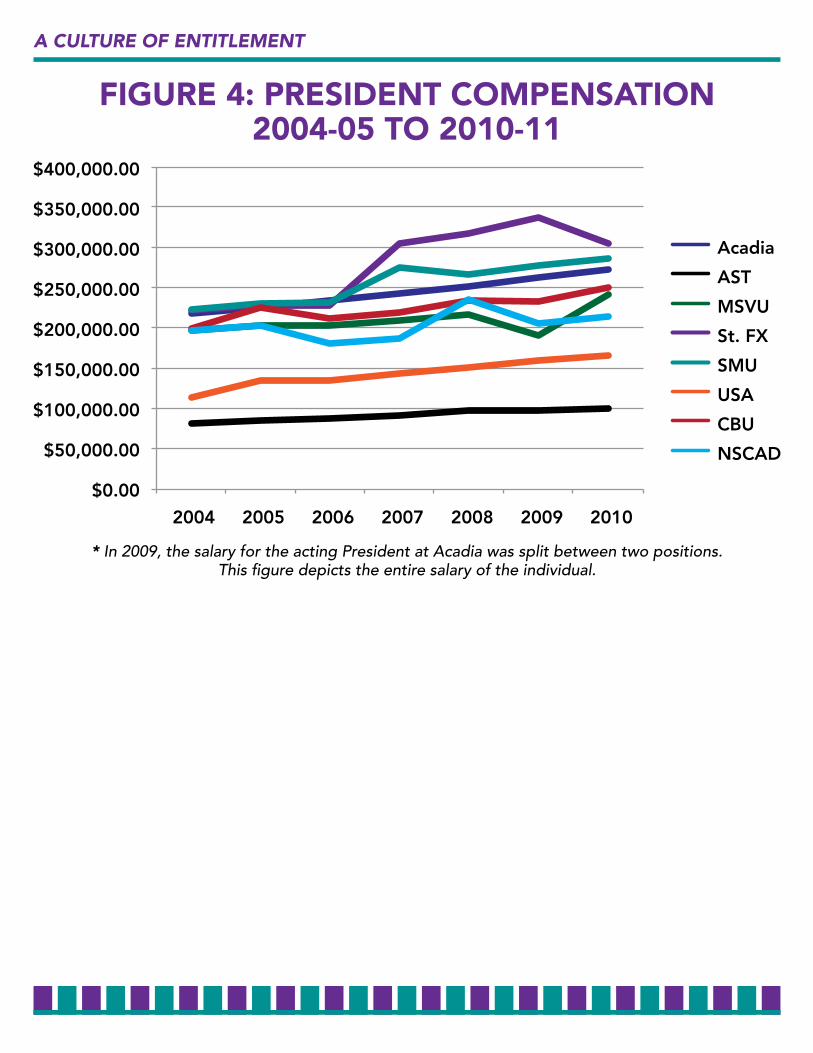
* In 2009, the salary for the acting President at Acadia was split between two positions.This figure depicts the entire salary of the individual.
A Culture oF entitlement
figure 4: PresidenT ComPensATion2004-05 To 2010-11
viCe presidents & AssistAnt/ AssoCiAte viCe presidents
very university except for the Atlantic School of Theology has a number of Vice Presidents (VPs) who concentrate on particular elements of the university’s
operations. Generally, universities have VPs in the area of academics and research, finance and administration, student services, and development or advancement. Like university presidents, the compensation that these VPs receive may be in the form of salary, bonuses, and housing allowances. There is no standard for how many VPs a university has. For example, Université Sainte-Anne with fewer than 1000 students has four VPs, while Mount Saint Vincent University with an enrolment three times that size, has only two. In some cases universities also have associate or assistant VPs to assist in the work of the offices of the VPs.
In 2004-05, the universities we surveyed spent $2.3 million on compensation for VPs. By 2010, that number had reached over $3 million, an increase of 35 per cent. One of the reasons for the increase is something that could be called “administrative creep.” At several universities new VP positions have been established for areas that had previously been managed by lower-ranking (and lower paid) employees. In 2004, Cape Breton University had only one VP, the VP Finance and Administration. By 2010, it had four, having added VPs Academic, Student Services and Registrar, and Development (later re-named VP External). These positions replaced associate VP positions, and doubled in cost.
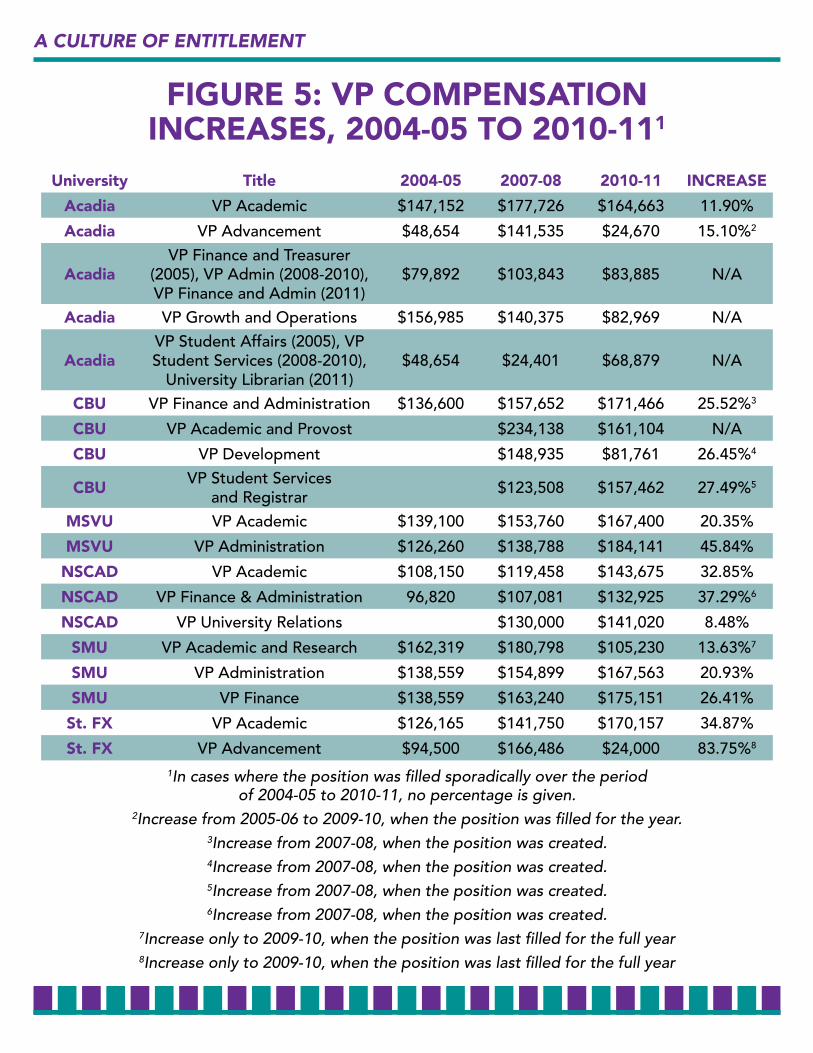
This isn’t to say that compensation increases for VPs have not also been very generous in some cases (Figure 5). At the Université
of Sainte-Anne, compensation for their VP Administration increased 48 per cent between 2004-05 and 2010-11. Between 2005-06 and 2009-10, the compensation for their VP Academic increased by 30 per cent. Compensations costs for their two other VPs increased just 10 per cent from 2004 to 2010. Still, in that time, compensation for one VP jumped 17 per cent in a single year.
In 2010-11, the highest paid VP, the VP Finance at St. FX, received $212,507 in compensation, an increase of 54 per cent since 2004-05. The second highest paid VP at the surveyed institutions, MSVU’s VP Administration was paid $184,141 in 2010-11, an increase in compensation of 46 per cent from 2004-05. The MSVU VP Administration had fairly consistent pay increases in the range of 3 per cent until 2009-10. In 2009-10 and 2010-11 this position’s compensation increased 12 and 14 per cent, respectively. While these increases are especially high, most VP positions had compensation increases over 25 per cent from 2004-05 to 2010-11.
Currently, Acadia, MSVU, St. FX, and SMU have one or more associate or assistant vice presidents. These positions totaled to about $983,500 in 2010-11, an increase of 27 per cent since 2004-05, even with a reduction in the number of associate or assistant vice-presidents from nine to seven. In 2009-10, compensation for three of MSVU’s Associate VPs increased by over 18 per cent in a single year. Compensation for the MSVU Associate VP of Communications and Marketing increased an additional 15 per cent compensation the following year.
E
A Culture oF entitlement
university Title 2004-05 2007-08 2010-11 inCreAse
Acadia VP Academic $147,152 $177,726 $164,663 11.90%
Acadia VP Advancement $48,654 $141,535 $24,670 15.10%2
AcadiaVP Finance and Treasurer
(2005), VP Admin (2008-2010), VP Finance and Admin (2011)
$79,892 $103,843 $83,885 N/A
Acadia VP Growth and Operations $156,985 $140,375 $82,969 N/A
AcadiaVP Student Affairs (2005), VP Student Services (2008-2010),
University Librarian (2011)$48,654 $24,401 $68,879 N/A
CBu VP Finance and Administration $136,600 $157,652 $171,466 25.52%3
CBu VP Academic and Provost $234,138 $161,104 N/A
CBu VP Development $148,935 $81,761 26.45%4
CBu VP Student Services and Registrar $123,508 $157,462 27.49%5
msVu VP Academic $139,100 $153,760 $167,400 20.35%
msVu VP Administration $126,260 $138,788 $184,141 45.84%
nsCAd VP Academic $108,150 $119,458 $143,675 32.85%
nsCAd VP Finance & Administration 96,820 $107,081 $132,925 37.29%6
nsCAd VP University Relations $130,000 $141,020 8.48%
smu VP Academic and Research $162,319 $180,798 $105,230 13.63%7
smu VP Administration $138,559 $154,899 $167,563 20.93%
smu VP Finance $138,559 $163,240 $175,151 26.41%
st. fX VP Academic $126,165 $141,750 $170,157 34.87%
st. fX VP Advancement $94,500 $166,486 $24,000 83.75%8
figure 5: VP ComPensATion inCreAses, 2004-05 To 2010-111
1In cases where the position was filled sporadically over the periodof 2004-05 to 2010-11, no percentage is given.
2Increase from 2005-06 to 2009-10, when the position was filled for the year.3Increase from 2007-08, when the position was created.4Increase from 2007-08, when the position was created.5Increase from 2007-08, when the position was created.6Increase from 2007-08, when the position was created.
7Increase only to 2009-10, when the position was last filled for the full year8Increase only to 2009-10, when the position was last filled for the full year
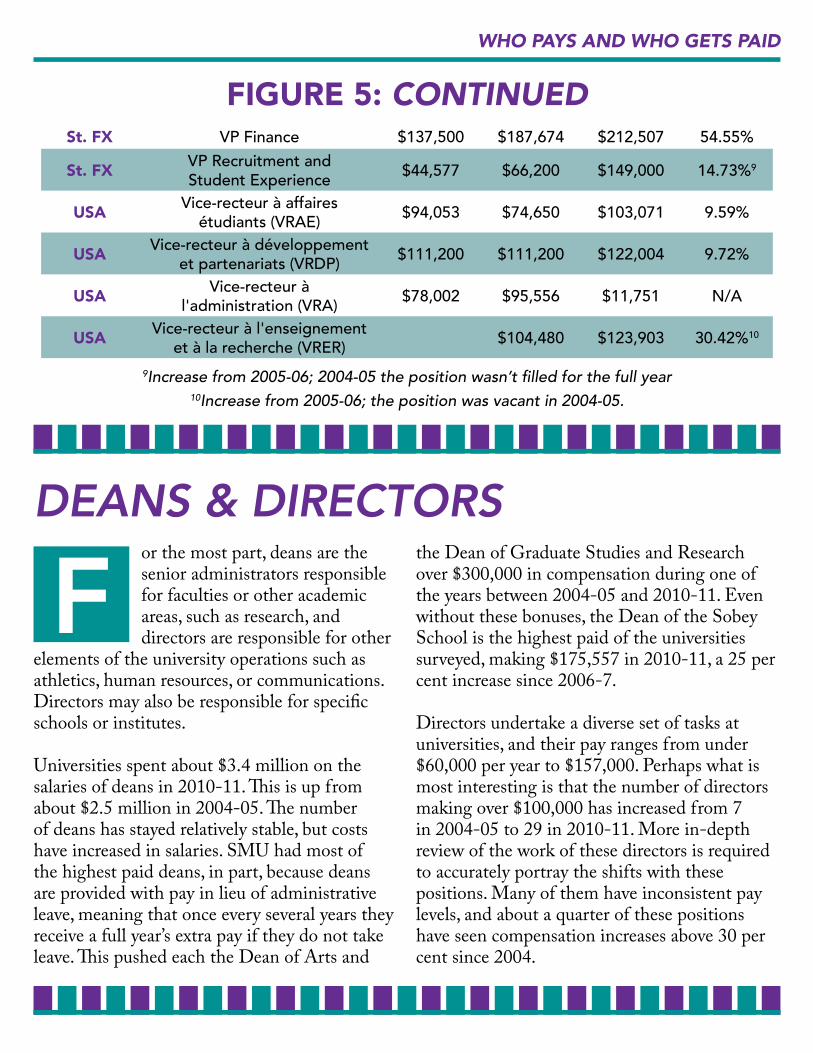
st. fX VP Finance $137,500 $187,674 $212,507 54.55%
st. fX VP Recruitment and Student Experience $44,577 $66,200 $149,000 14.73%9
usA Vice-recteur à affaires étudiants (VRAE) $94,053 $74,650 $103,071 9.59%
usA Vice-recteur à développement et partenariats (VRDP) $111,200 $111,200 $122,004 9.72%
usA Vice-recteur à l'administration (VRA) $78,002 $95,556 $11,751 N/A
usA Vice-recteur à l'enseignement et à la recherche (VRER) $104,480 $123,903 30.42%10
9Increase from 2005-06; 2004-05 the position wasn’t filled for the full year10Increase from 2005-06; the position was vacant in 2004-05.
figure 5: Continued
Who PAys And Who gets PAid
deAns & direCtorsor the most part, deans are the senior administrators responsible for faculties or other academic areas, such as research, and directors are responsible for other
elements of the university operations such as athletics, human resources, or communications. Directors may also be responsible for specific schools or institutes.
Universities spent about $3.4 million on the salaries of deans in 2010-11. This is up from about $2.5 million in 2004-05. The number of deans has stayed relatively stable, but costs have increased in salaries. SMU had most of the highest paid deans, in part, because deans are provided with pay in lieu of administrative leave, meaning that once every several years they receive a full year’s extra pay if they do not take leave. This pushed each the Dean of Arts and
the Dean of Graduate Studies and Research over $300,000 in compensation during one of the years between 2004-05 and 2010-11. Even without these bonuses, the Dean of the Sobey School is the highest paid of the universities surveyed, making $175,557 in 2010-11, a 25 per cent increase since 2006-7.
Directors undertake a diverse set of tasks at universities, and their pay ranges from under $60,000 per year to $157,000. Perhaps what is most interesting is that the number of directors making over $100,000 has increased from 7 in 2004-05 to 29 in 2010-11. More in-depth review of the work of these directors is required to accurately portray the shifts with these positions. Many of them have inconsistent pay levels, and about a quarter of these positions have seen compensation increases above 30 per cent since 2004.
F
University FACUlty &sUpport stAFF CompensAtion
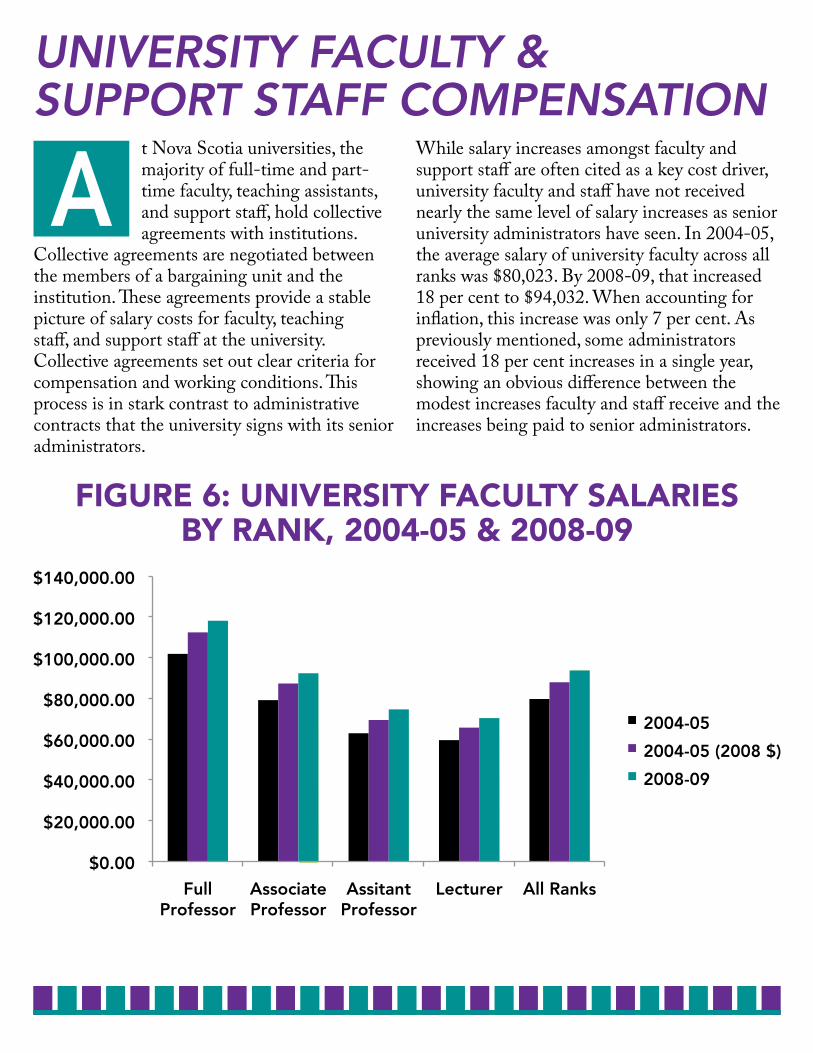
t Nova Scotia universities, the majority of full-time and part-time faculty, teaching assistants, and support staff, hold collective agreements with institutions.
Collective agreements are negotiated between the members of a bargaining unit and the institution. These agreements provide a stable picture of salary costs for faculty, teaching staff, and support staff at the university. Collective agreements set out clear criteria for compensation and working conditions. This process is in stark contrast to administrative contracts that the university signs with its senior administrators.
While salary increases amongst faculty and support staff are often cited as a key cost driver, university faculty and staff have not received nearly the same level of salary increases as senior university administrators have seen. In 2004-05, the average salary of university faculty across all ranks was $80,023. By 2008-09, that increased 18 per cent to $94,032. When accounting for inflation, this increase was only 7 per cent. As previously mentioned, some administrators received 18 per cent increases in a single year, showing an obvious difference between the modest increases faculty and staff receive and the increases being paid to senior administrators.
a
figure 6: uniVersiTy fACulTy sAlAries By rAnk, 2004-05 & 2008-09
A Culture oF entitlement
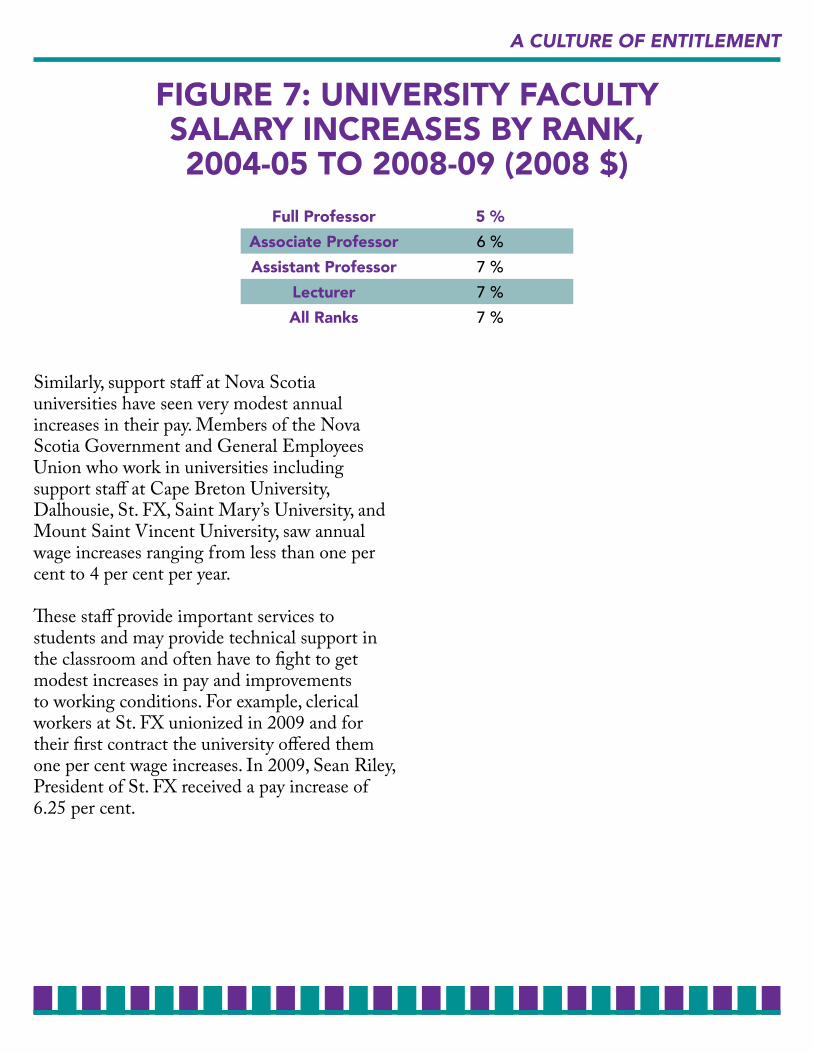
Similarly, support staff at Nova Scotia universities have seen very modest annual increases in their pay. Members of the Nova Scotia Government and General Employees Union who work in universities including support staff at Cape Breton University, Dalhousie, St. FX, Saint Mary’s University, and Mount Saint Vincent University, saw annual wage increases ranging from less than one per cent to 4 per cent per year.
These staff provide important services to students and may provide technical support in the classroom and often have to fight to get modest increases in pay and improvements to working conditions. For example, clerical workers at St. FX unionized in 2009 and for their first contract the university offered them one per cent wage increases. In 2009, Sean Riley, President of St. FX received a pay increase of 6.25 per cent.
figure 7: uniVersiTy fACulTy sAlAry inCreAses By rAnk, 2004-05 To 2008-09 (2008 $)
full Professor 5 %
Associate Professor 6 %
Assistant Professor 7 %
lecturer 7 %
All ranks 7 %
AdministrAtor &FACUlty QUAntities
hile there has not been a significant increase in the total number of administrators, which have increased from 140 to 146, there are, however, several
trends that indicate that and increasing amount of resources are going to certain elements of administration.
The movement of some positions from deans to associate vice-presidents to vice-presidents at CBU has already been touched on. St. FX had the most administrators in 2010-11 at 32, up from 26 in 2004-05. Over that time, the university added Directors of Alumni Affairs, Communications and Marketing, Government Relations, and Human Resources. CBU also introduced a Director of Communications and Public Relations in 2011, and NSCAD added the position of VP University Relations in 2007. The VP University Relations was removed this year as NSCAD struggled with limited resources. Most of these positions focus on elements of the university outside of the core missions, and the allocation of resources to these areas warrants attention.
In 2006, CBU introduced a Director of International Programs and Partnerships, reflecting its investment into international recruitment efforts including the creation of a private college in Egypt and establishing a
“cooperation office” in Beijing. These activities reflect the growing interest of universities to gain access to additional funds through private ventures abroad and international student tuition fees.
A more thorough exploration of shifting expenditures would build on these preliminary observations. Unfortunately little attention has been paid to these shifting priorities at universities.
Instead, attention is paid to the amount of teaching staff at universities. The Report on the University System in Nova Scotia, O’Neill says that universities should have more flexibility to enact layoffs at institutions. The report’s underlying assumption is that there is an excess of staff at our institutions, but when we look at the numbers, a different picture emerges.
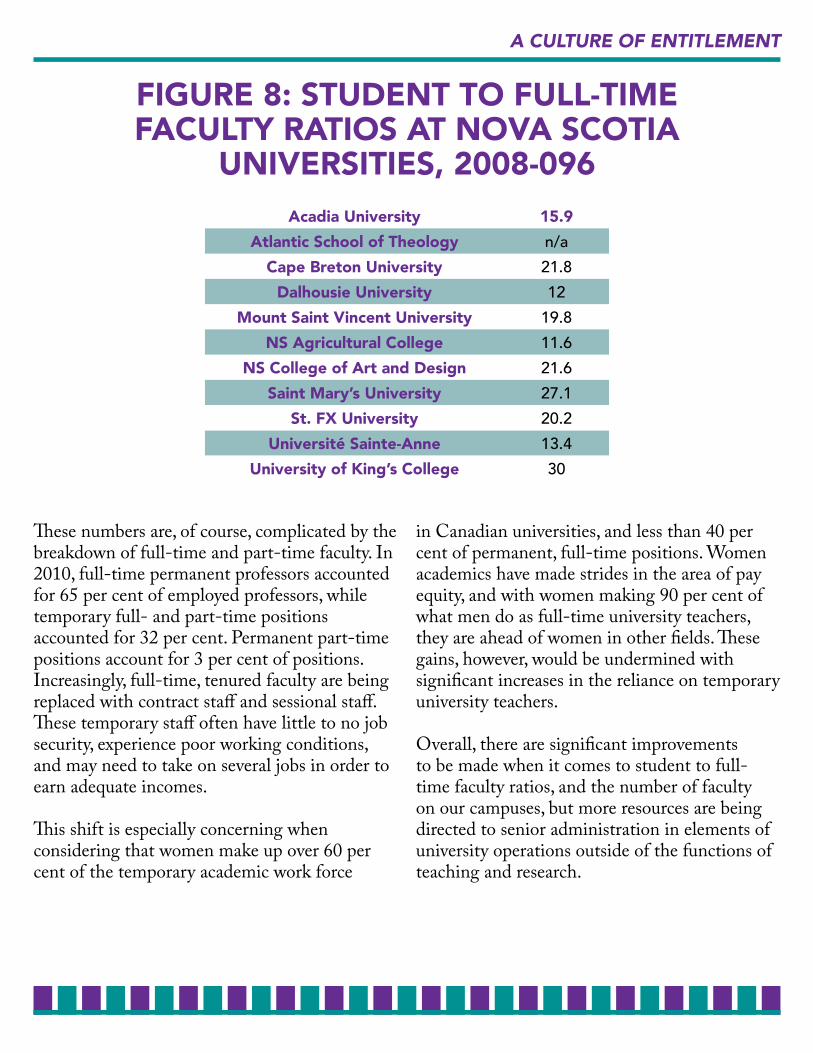
In 1990-91, average full-time faculty to student ratios in Nova Scotia were the second lowest in the country at 13.6, but by 2001-02, the average ratios increased to 23.4. While the ratio has since declined to 19.4, this is still well above the student to full-time faculty ratio from the early nineties. At this point, only Dalhousie, the Nova Scotia Agricultural College and the Université Sainte-Anne have ratios of 14 or below (Figure 8).
W
A Culture oF entitlement
These numbers are, of course, complicated by the breakdown of full-time and part-time faculty. In 2010, full-time permanent professors accounted for 65 per cent of employed professors, while temporary full- and part-time positions accounted for 32 per cent. Permanent part-time positions account for 3 per cent of positions. Increasingly, full-time, tenured faculty are being replaced with contract staff and sessional staff. These temporary staff often have little to no job security, experience poor working conditions, and may need to take on several jobs in order to earn adequate incomes.
This shift is especially concerning when considering that women make up over 60 per cent of the temporary academic work force
in Canadian universities, and less than 40 per cent of permanent, full-time positions. Women academics have made strides in the area of pay equity, and with women making 90 per cent of what men do as full-time university teachers, they are ahead of women in other fields. These gains, however, would be undermined with significant increases in the reliance on temporary university teachers.
Overall, there are significant improvements to be made when it comes to student to full-time faculty ratios, and the number of faculty on our campuses, but more resources are being directed to senior administration in elements of university operations outside of the functions of teaching and research.
figure 8: sTudenT To full-TimefACulTy rATios AT noVA sCoTiA
uniVersiTies, 2008-096Acadia university 15.9
Atlantic school of Theology n/a
Cape Breton university 21.8
dalhousie university 12
mount saint Vincent university 19.8
ns Agricultural College 11.6
ns College of Art and design 21.6
saint mary’s university 27.1
st. fX university 20.2
université sainte-Anne 13.4
university of king’s College 30
ConClUsion &reCommendAtions
t is reasonable to expect that any major institution requires some level of senior management. In the case of public institutions, the question is how we ensure that
senior managers are fairly compensated while also ensuring accountability and transparency with respect to spending public money. In the case of senior administrators at universities, it is difficult to understand why in climates where faculty and support staff received salary increases between zero and four per cent, the compensation given to senior administrators should increase at double, triple, even 4 times that.
The provincial government has a responsibility to ensure that universities are spending money, especially government funding and user fees from students, appropriately. The data in this report shows increasing spending for administrator salaries that outpace the increases to faculty and staff at the university, but there are more areas that warrant attention with regards to spending. These include international student recruitment; public relations, external relations, and communications; fundraising, development, and advancement; international trade; and travel. For example, university presidents have accompanied politicians on trade missions to Asia. Who is paying for these missions, and what purpose are they serving?
It is also difficult for stakeholders and the public to investigate these issues, in part, because the university acts in the province are long outdated and the composition of Boards of Governors often reflects the religious roots of institutions. This creates decision-making and accountability structures that rely on board members who do not interact with the day-to-day life on campus, while students and faculty hold little power. In most cases support staff are excluded entirely from university boards. Improving faculty, student, and support staff representation on university decision-making bodies could help ensure that these key stakeholders are able to ensure universities are fulfilling their missions.
To improve fairness and public accountability, the government could implement several additional legislative and policy measures over the life of the current memorandum of understanding. While some may see space for mergers to reduce administrator costs, this approach has resulted in no cost-savings or even resulted in cost increases.15 There is space for universities to work together on things such as out of province recruitment and for the government to help provide resources such as communications support at a reduced cost, but complete mergers are unlikely to address the steep increases in administrator salaries.
Instead of focusing on mergers, the government
I
could use the current MOU, which outlines a clear interest to improve reporting mechanisms and accountability at universities. To achieve this goal, this report recommends that the government implement the following measures:
In consultation with universities, faculty, support staff, and students determine a set of regulations on university expenditures, including:
Limiting the portion of a university’s budget that can go to funding senior administrative expenses, including salaries, office expenditures, and travel;
Prohibiting the use of public funding or user fees for fundraising activities, lobbying, establishing public-private partnerships, or the provision of private services that may be reasonably completed within the university, such as head-hunting services; and
Establishing a set of common reporting mechanisms for university expenditures that clearly depict university spending, especially on how much the university is spending in the areas of instruction and research.
Review each university act, and amend board
composition to better reflect the interests of faculty, staff, students, and the public. Many of these acts have not been amended since the organizing of unions for clerical staff and/or part-time faculty and teaching assistants. New board composition should include representation for these stakeholders. Board composition should limit voting powers of senior administrative staff that sit on the board.
Ensure that in any consultation the government undertakes with universities, faculty, part-time instructors, and staff are meaningfully included as stakeholders. These policy measures could be undertaken by government with minimal costs, and ensure that universities are better serving the public. These recommendations, however, should not be seen as suggesting that universities are not in need of additional government investment. The need for high quality public post-secondary education that is affordable is key to the development of Nova Scotia, and these recommendations are one part of a larger discussion about strengthening and expanding public post-secondary education in the province.
A Culture oF entitlement
notes1. Canadian Association of University Teachers
(CAUT). 2011 Almanac (Ottawa: CAUT, 2011), 3.
2. Ibid, 3.3. O’Neill, Tim. Report on the University Sys-
tem in Nova Scotia. (Halifax: Government of Nova Scotia, 2010), 23.
4. Canadian Centre for Policy Alternatives, Al-ternative Provincial Budget (Halifax: CCPA, 2009), 26.
5. Canadian Association of University Teachers (CAUT), 2008 Almanac (Ottawa: CAUT, 2008), 442.
6. Canadian Association of University Teachers (CAUT). 2011 Almanac (Ottawa: CAUT, 2011), 3.
7. Dehas, Josh, “Concordian will review mil-lions paid out in severance,” Macleans On Campus, March 5, 2012, accessed July 30, 2012, http://oncampus.macleans.ca/educa-tion/2012/03/05/concordia-will-review-mil-lions-paid-out-in-severance.
8. “Golden handshakes land Montreal’s Con-cordia University a $2-million fine,” the Star, March 9, 2012, accessed July 30, 2012, http://www.thestar.com/news/canada/article/1143866--golden-handshakes-land-montreal-s-concordia-university-a-2-mil-lion-fine.
9. “U of A buys president’s house for $930,000,” CTV News Edmonton, August 5, 2010, accessed July 30, 2012, http://edmonton.ctvnews.ca/u-of-a-buys-president-s-house-for-930-000-1.539505.
10. Howitt, Chuck, “Governor General still on ‘sunshine list’ at UW,” The Record, March 24, 2012, accessed July 30, 2012, http://www.therecord.com/news/local/article/692360--governor-general-still-on-sunshine-list-at-uw
11. O’Neill, Tim. Report on the University Sys-tem in Nova Scotia. (Halifax: Government of Nova Scotia, 2010), p. 70.
12. Ibid, p. 72.13. Windsor, Howard. Report on The Nova
Scotia College of Art and Design: Time to Act (Halifax: Government of Nova Scotia, 2011), 6.
14. Acadia collective agreement.15. See Kennedy, K., MacMillan, L., Saulnier,
C., and Sawler, J. Fairness, Funding, and Our Collective Future. Halifax: Canadian Centre for Policy Alternatives, 2010, for substantial anaylsis about the costs of mergers.
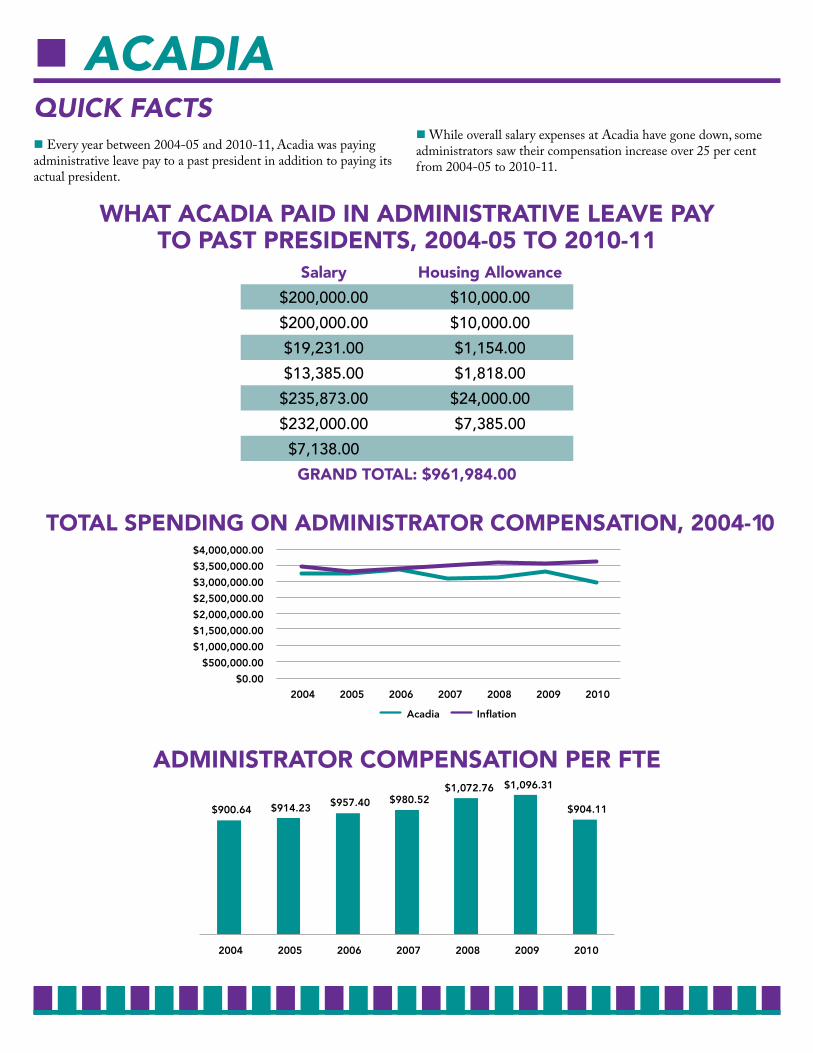
ACAdiAQuiCk FACts Every year between 2004-05 and 2010-11, Acadia was paying administrative leave pay to a past president in addition to paying its actual president.
While overall salary expenses at Acadia have gone down, some administrators saw their compensation increase over 25 per cent from 2004-05 to 2010-11.
WhAT ACAdiA PAid in AdminisTrATiVe leAVe PAyTo PAsT PresidenTs, 2004-05 To 2010-11
salary housing Allowance
$200,000.00 $10,000.00
$200,000.00 $10,000.00
$19,231.00 $1,154.00
$13,385.00 $1,818.00
$235,873.00 $24,000.00
$232,000.00 $7,385.00
$7,138.00
grAnd ToTAl: $961,984.00
ToTAl sPending on AdminisTrATor ComPensATion, 2004-10
AdminisTrATor ComPensATion Per fTe
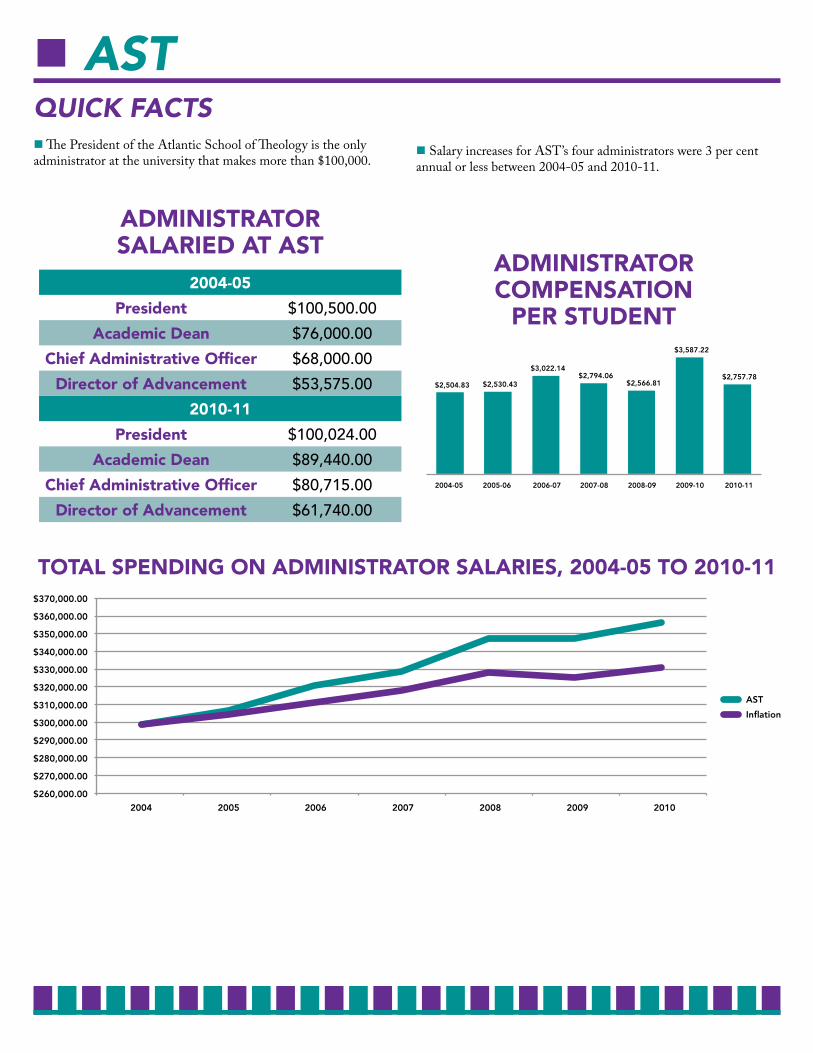
AstQuiCk FACts The President of the Atlantic School of Theology is the only administrator at the university that makes more than $100,000.
Salary increases for AST’s four administrators were 3 per cent annual or less between 2004-05 and 2010-11.
AdminisTrATor sAlAried AT AsT
ToTAl sPending on AdminisTrATor sAlAries, 2004-05 To 2010-11
2004-05
President $100,500.00
Academic dean $76,000.00
Chief Administrative officer $68,000.00
director of Advancement $53,575.00
2010-11
President $100,024.00
Academic dean $89,440.00
Chief Administrative officer $80,715.00
director of Advancement $61,740.00
AdminisTrATorComPensATion
Per sTudenT
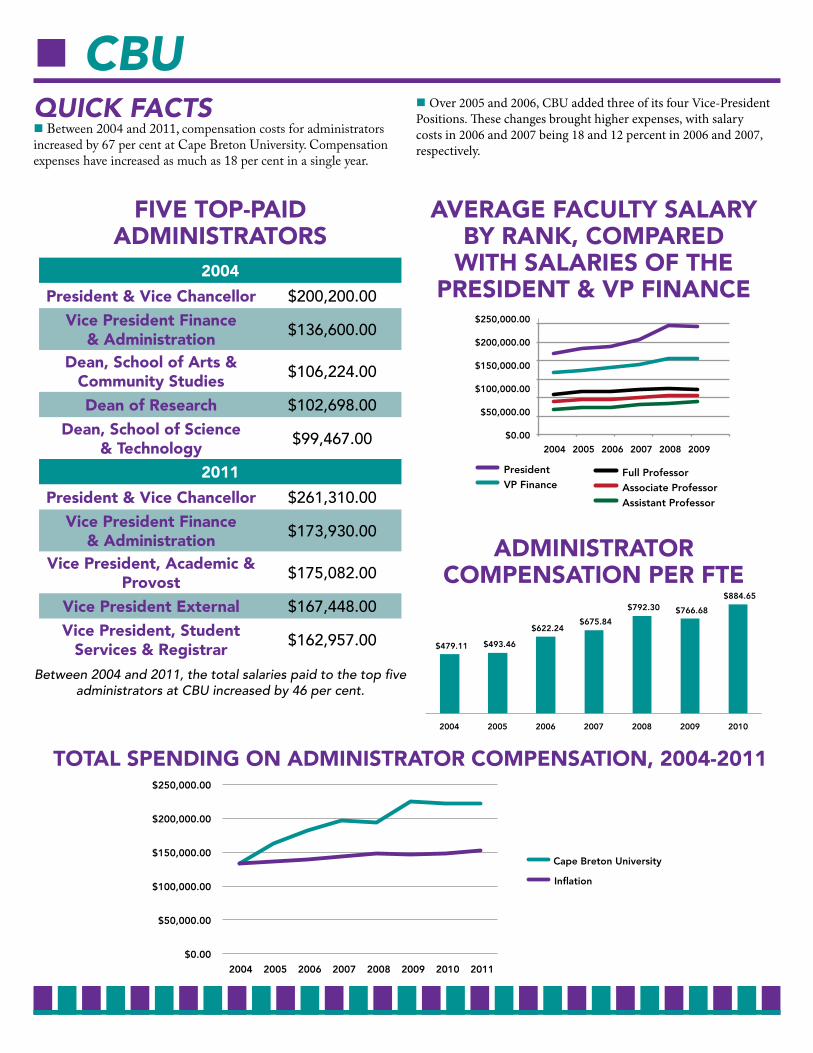
CBuQuiCk FACts Between 2004 and 2011, compensation costs for administrators increased by 67 per cent at Cape Breton University. Compensation expenses have increased as much as 18 per cent in a single year.
Over 2005 and 2006, CBU added three of its four Vice-President Positions. These changes brought higher expenses, with salary costs in 2006 and 2007 being 18 and 12 percent in 2006 and 2007, respectively.
fiVe ToP-PAid AdminisTrATors
AVerAge fACulTy sAlAry By rAnk, ComPAred
WiTh sAlAries of The PresidenT & VP finAnCe
ToTAl sPending on AdminisTrATor ComPensATion, 2004-2011
2004
President & Vice Chancellor $200,200.00Vice President finance
& Administration $136,600.00
dean, school of Arts & Community studies $106,224.00
dean of research $102,698.00dean, school of science
& Technology $99,467.00
2011
President & Vice Chancellor $261,310.00Vice President finance
& Administration $173,930.00
Vice President, Academic & Provost $175,082.00
Vice President external $167,448.00Vice President, student
services & registrar $162,957.00
Between 2004 and 2011, the total salaries paid to the top five administrators at CBU increased by 46 per cent.
AdminisTrATorComPensATion Per fTe
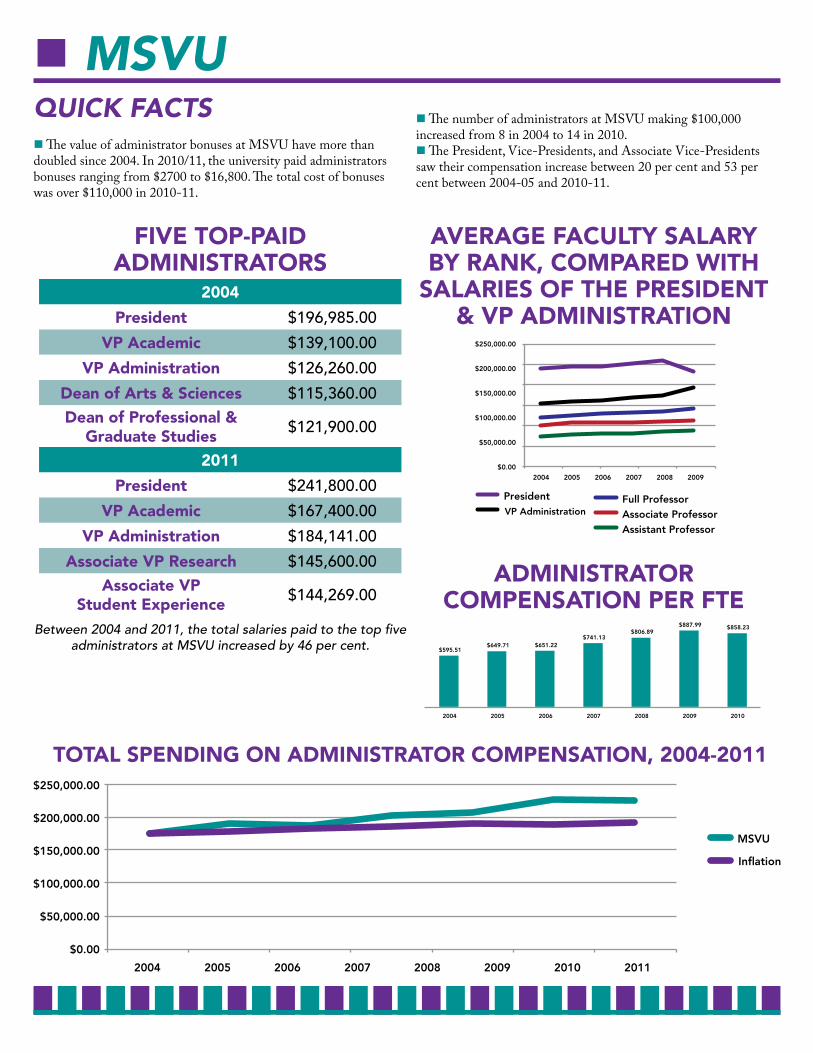
msvuQuiCk FACts The value of administrator bonuses at MSVU have more than doubled since 2004. In 2010/11, the university paid administrators bonuses ranging from $2700 to $16,800. The total cost of bonuses was over $110,000 in 2010-11.
The number of administrators at MSVU making $100,000 increased from 8 in 2004 to 14 in 2010. The President, Vice-Presidents, and Associate Vice-Presidents saw their compensation increase between 20 per cent and 53 per cent between 2004-05 and 2010-11.
fiVe ToP-PAid AdminisTrATors
AVerAge fACulTy sAlAry By rAnk, ComPAred WiTh
sAlAries of The PresidenT & VP AdminisTrATion
ToTAl sPending on AdminisTrATor ComPensATion, 2004-2011
2004
President $196,985.00
VP Academic $139,100.00
VP Administration $126,260.00
dean of Arts & sciences $115,360.00dean of Professional &
graduate studies $121,900.00
2011
President $241,800.00
VP Academic $167,400.00
VP Administration $184,141.00
Associate VP research $145,600.00Associate VP
student experience $144,269.00
Between 2004 and 2011, the total salaries paid to the top five administrators at MSVU increased by 46 per cent.
AdminisTrATorComPensATion Per fTe
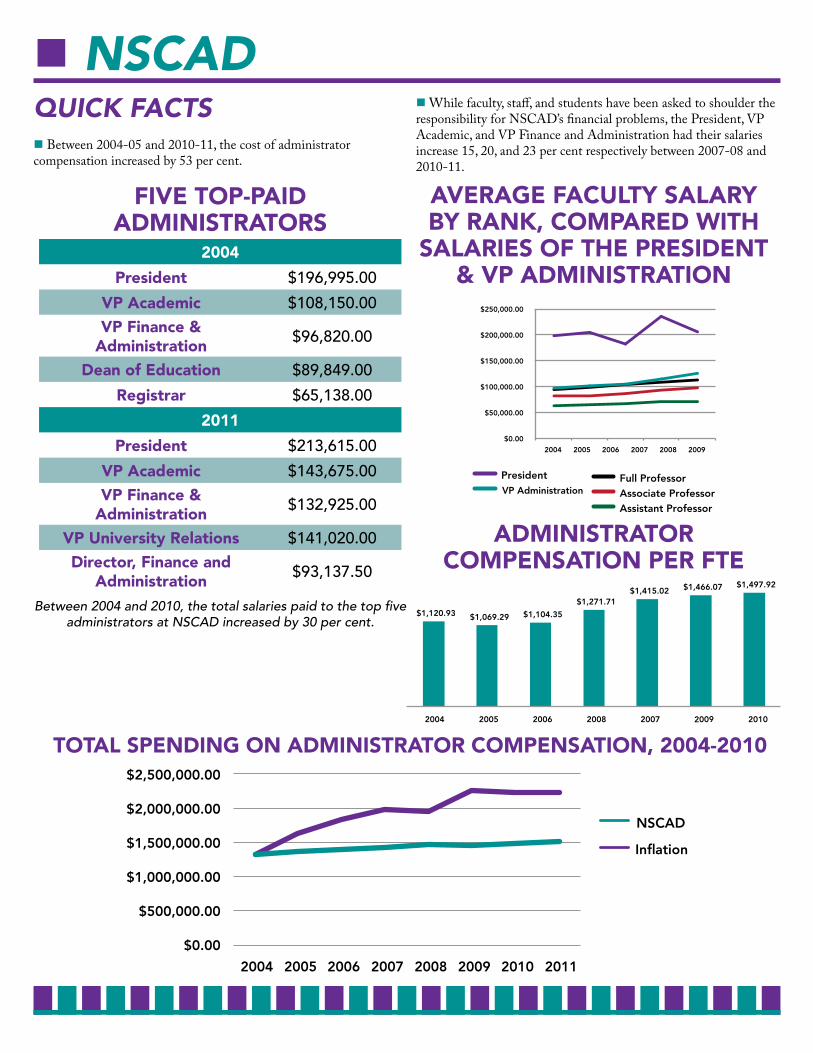
nsCAdQuiCk FACts Between 2004-05 and 2010-11, the cost of administrator compensation increased by 53 per cent.
While faculty, staff, and students have been asked to shoulder the responsibility for NSCAD’s financial problems, the President, VP Academic, and VP Finance and Administration had their salaries increase 15, 20, and 23 per cent respectively between 2007-08 and 2010-11.
fiVe ToP-PAid AdminisTrATors
2004
President $196,995.00
VP Academic $108,150.00VP finance &
Administration $96,820.00
dean of education $89,849.00
registrar $65,138.00
2011
President $213,615.00
VP Academic $143,675.00VP finance &
Administration $132,925.00
VP university relations $141,020.00director, finance and
Administration $93,137.50
Between 2004 and 2010, the total salaries paid to the top five administrators at NSCAD increased by 30 per cent.
AVerAge fACulTy sAlAry By rAnk, ComPAred WiTh
sAlAries of The PresidenT & VP AdminisTrATion
AdminisTrATorComPensATion Per fTe
ToTAl sPending on AdminisTrATor ComPensATion, 2004-2010
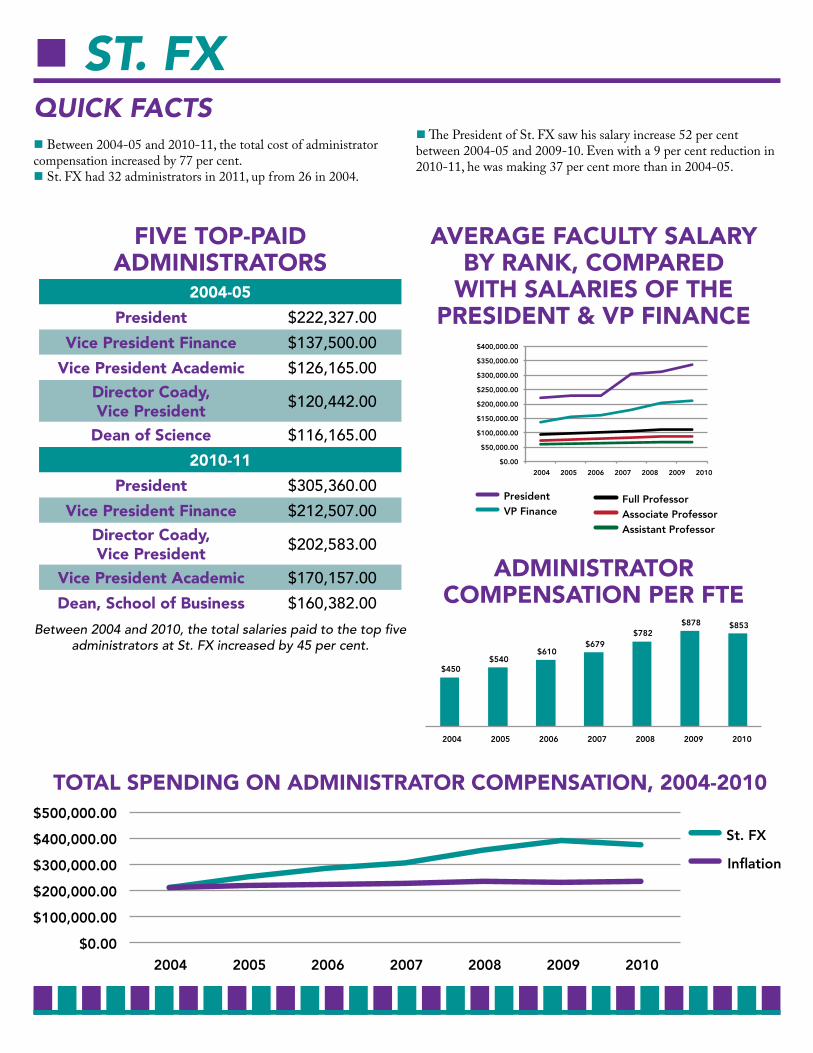
st. FXQuiCk FACts Between 2004-05 and 2010-11, the total cost of administrator compensation increased by 77 per cent. St. FX had 32 administrators in 2011, up from 26 in 2004.
The President of St. FX saw his salary increase 52 per cent between 2004-05 and 2009-10. Even with a 9 per cent reduction in 2010-11, he was making 37 per cent more than in 2004-05.
fiVe ToP-PAid AdminisTrATors
AVerAge fACulTy sAlAryBy rAnk, ComPAred
WiTh sAlAries of The PresidenT & VP finAnCe
ToTAl sPending on AdminisTrATor ComPensATion, 2004-2010
2004-05
President $222,327.00
Vice President finance $137,500.00
Vice President Academic $126,165.00director Coady,Vice President $120,442.00
dean of science $116,165.00
2010-11
President $305,360.00
Vice President finance $212,507.00director Coady,Vice President $202,583.00
Vice President Academic $170,157.00
dean, school of Business $160,382.00
Between 2004 and 2010, the total salaries paid to the top five administrators at St. FX increased by 45 per cent.
AdminisTrATorComPensATion Per fTe
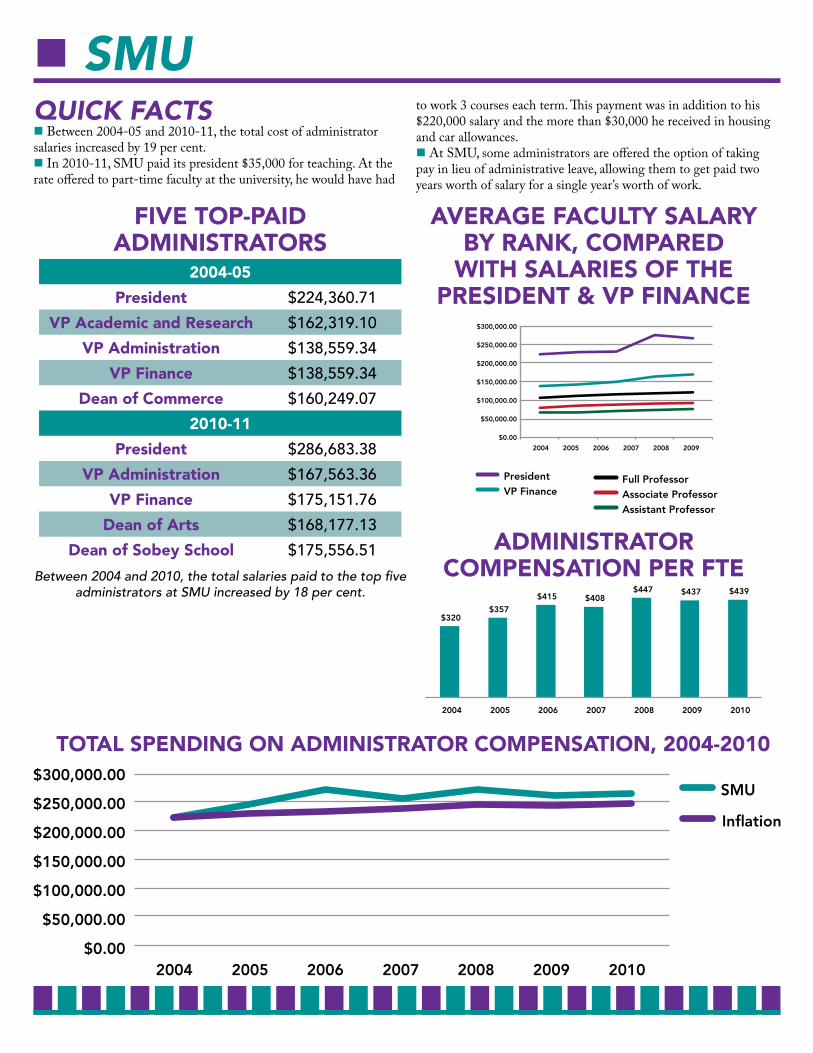
smuQuiCk FACts Between 2004-05 and 2010-11, the total cost of administrator salaries increased by 19 per cent. In 2010-11, SMU paid its president $35,000 for teaching. At the rate offered to part-time faculty at the university, he would have had
to work 3 courses each term. This payment was in addition to his $220,000 salary and the more than $30,000 he received in housing and car allowances. At SMU, some administrators are offered the option of taking pay in lieu of administrative leave, allowing them to get paid two years worth of salary for a single year’s worth of work.
fiVe ToP-PAid AdminisTrATors
AVerAge fACulTy sAlAryBy rAnk, ComPAred
WiTh sAlAries of The PresidenT & VP finAnCe
ToTAl sPending on AdminisTrATor ComPensATion, 2004-2010
2004-05
President $224,360.71
VP Academic and research $162,319.10
VP Administration $138,559.34
VP finance $138,559.34
dean of Commerce $160,249.07
2010-11
President $286,683.38
VP Administration $167,563.36
VP finance $175,151.76
dean of Arts $168,177.13
dean of sobey school $175,556.51
Between 2004 and 2010, the total salaries paid to the top five administrators at SMU increased by 18 per cent.
AdminisTrATorComPensATion Per fTe
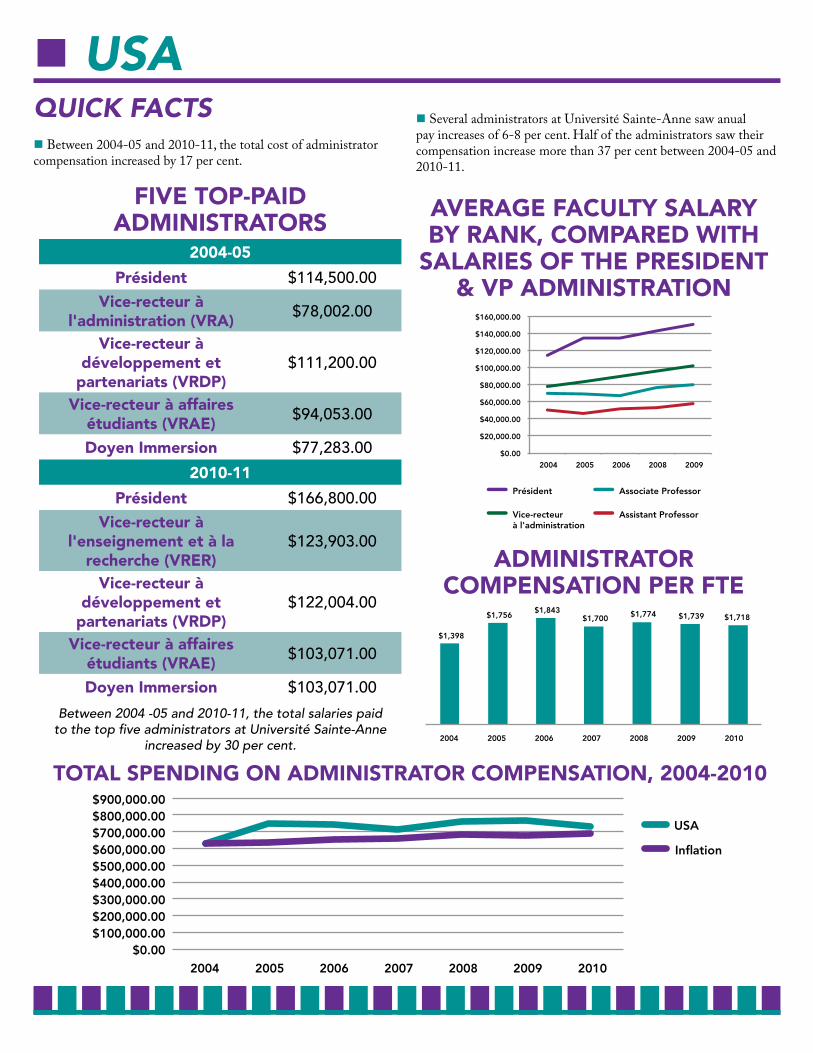
usAQuiCk FACts Between 2004-05 and 2010-11, the total cost of administrator compensation increased by 17 per cent.
Several administrators at Université Sainte-Anne saw anual pay increases of 6-8 per cent. Half of the administrators saw their compensation increase more than 37 per cent between 2004-05 and 2010-11.
fiVe ToP-PAid AdminisTrATors
AVerAge fACulTy sAlAry By rAnk, ComPAred WiTh
sAlAries of The PresidenT & VP AdminisTrATion
ToTAl sPending on AdminisTrATor ComPensATion, 2004-2010
2004-05
Président $114,500.00Vice-recteur à
l'administration (VrA) $78,002.00
Vice-recteur à développement et
partenariats (VrdP)$111,200.00
Vice-recteur à affaires étudiants (VrAe) $94,053.00
doyen immersion $77,283.00
2010-11
Président $166,800.00Vice-recteur à
l'enseignement et à la recherche (Vrer)
$123,903.00
Vice-recteur à développement et
partenariats (VrdP)$122,004.00
Vice-recteur à affaires étudiants (VrAe) $103,071.00
doyen immersion $103,071.00
Between 2004 -05 and 2010-11, the total salaries paid to the top five administrators at Université Sainte-Anne
increased by 30 per cent.
AdminisTrATorComPensATion Per fTe

A Culture
ofentitlement
AssoCiAtion oF novA sCotiA university teAChers Ansut.CA