Anode Break Excitation in Space-Clamped Squid Axons
12
ANODE BREAK EXCITATION IN SPACE-CLAMPED SQUID AXONS RITA GUTTMAN and LON HACHMEISTER From the Department of Biology, Brooklyn College of the City University of New York, Brooklyn, New York 11210, and the Marne Biological Laboratory, Woods Hole, Massachusetts 02543. Mr. Hachmeister's present address is the Department of Oceanography, University of Washington, Seattle, Washington 98115. ABSTRACT Strength-duration curves for space-clamped squid axons, using square wave anode breaks as stimuli, established the existence of four distinct regions. For the average experimental axon the intersection of the first two regions, Ti, occurs at about 7 msec. This agrees with computations based on the Hodgkin-Huxley (HH) equations and corresponds to the accommodation time constant found pre- viously for a linearly rising ramp, as given by the HH equations and as found ex- perimentally. The second break in the curve, 72, at about 200 msec, and the third break, T3, at 1 sec, are far beyond the range of the HH equations and may be the counterpart in the excitability of the long time constants, which have been apparent from a number of other types of experiments. The regions of the curve before 1 msec and beyond 2 or 3 sec are quite variable and may represent breakdown. Rheobase increases in both experimental and computed axons when temperature is raised. In both experimental and computed axons ri decreases slightly when the temperature is raised from 10 to 15°C. At 20 and 25°C, ri of the experimental axon increases markedly. INTRODUCTION According to the two-factor theory of excitation formulated by Rashevsky (1933), Monnier (1934), and Hill (1936), and developed by Cole (1933, 1941), during and immediately after the passage of a constant hyperpolarizing current, the local po- tential of the nerve membrane falls and this is soon followed by a fall of threshold. When the current is terminated, the potential returns quickly to the resting level, while the threshold remains depressed for some time. During this period the ex- citability at the anode is enhanced and with strong enough current "break excita- tion" occurs. This entire process is the reverse of cathodal excitation at the "make" of a constant current. The fully accommodated nerve membrane behaves before the break of the constant current as if no current were flowing. Thus the break at the anode is equivalent to the application of a cathodal pulse to a resting nerve membrane. Early work on strength-duration curves for break excitation occurring at the anode was done by Keith Lucas (1907), Cluzet (1908), and Cardot and BIOPHYSICAL JOURNAL VOLUME 12 1972 552
Transcript of Anode Break Excitation in Space-Clamped Squid Axons

ANODE BREAK EXCITATION IN
SPACE-CLAMPED SQUID AXONS
RITA GUTTMAN and LON HACHMEISTER
From the Department ofBiology, Brooklyn College ofthe City University ofNew York,Brooklyn, New York 11210, and the Marne Biological Laboratory,Woods Hole, Massachusetts 02543. Mr. Hachmeister's present address is the Department ofOceanography, University of Washington, Seattle, Washington 98115.
ABSTRACT Strength-duration curves for space-clamped squid axons, using squarewave anode breaks as stimuli, established the existence of four distinct regions. Forthe average experimental axon the intersection of the first two regions, Ti, occursat about 7 msec. This agrees with computations based on the Hodgkin-Huxley(HH) equations and corresponds to the accommodation time constant found pre-viously for a linearly rising ramp, as given by the HH equations and as found ex-perimentally. The second break in the curve, 72, at about 200 msec, and the thirdbreak, T3, at 1 sec, are far beyond the range of the HH equations and may be thecounterpart in the excitability of the long time constants, which have been apparentfrom a number of other types of experiments. The regions of the curve before 1msec and beyond 2 or 3 sec are quite variable and may represent breakdown.Rheobase increases in both experimental and computed axons when temperatureis raised. In both experimental and computed axons ri decreases slightly when thetemperature is raised from 10 to 15°C. At 20 and 25°C, ri of the experimental axonincreases markedly.
INTRODUCTION
According to the two-factor theory of excitation formulated by Rashevsky (1933),Monnier (1934), and Hill (1936), and developed by Cole (1933, 1941), during andimmediately after the passage of a constant hyperpolarizing current, the local po-tential of the nerve membrane falls and this is soon followed by a fall of threshold.When the current is terminated, the potential returns quickly to the resting level,while the threshold remains depressed for some time. During this period the ex-citability at the anode is enhanced and with strong enough current "break excita-tion" occurs. This entire process is the reverse of cathodal excitation at the "make"of a constant current. The fully accommodated nerve membrane behaves beforethe break of the constant current as if no current were flowing. Thus the break atthe anode is equivalent to the application of a cathodal pulse to a resting nervemembrane. Early work on strength-duration curves for break excitation occurringat the anode was done by Keith Lucas (1907), Cluzet (1908), and Cardot and
BIOPHYSICAL JOURNAL VOLUME 12 1972552

Laugier (1912). Solandt (1936) found quite good agreement between results frombreak excitation and determinations utilizing exponentially rising currents.
It has been known for a very long time that the time scale for the local excitatoryprocess is much shorter than for accommodation. Discussions of the time constantof excitation k and of accommodation X can be found in the papers of Hill andSolandt already cited and for modern work on squid axons in a paper of Guttman(1968). Both exponentially and linearly rising currents were used for these studies.The considerable contributions of Cole to the problem of excitation are summarizedin Cole (1968, see especially Fig. 2.5).The phenomenological concepts of excitation and accommodation have proven
extremely useful when a more detailed analysis is not available or is not needed.They have, however, been completely superseded by the far higher level of empiricismgiven by Hodgkin and Huxley (1952). Wherever applicable, these equations havebeen computed for comparison with the experimental findings. All of these calcu-lated values as presented in the figures or discussed in the text were computed byRichard FitzHugh and John Shaw (see Appendix). Since such computations aretedious and rather expensive, however, they have usually been limited to the im-mediate objective, and separate print-outs of sodium, potassium, and leakage cur-rents have not been obtained.The present study on squid giant axons involves only break excitation after square
wave hyperpolarizing pulses, i.e., anode break excitation. As was found by theearlier workers (cf. Katz, 1939), strength-duration curves for anodal break shocksinvolve much higher intensity of voltage than do such curves for depolarizing pulses.As will be discussed, special precautions and techniques were required to preventinjury from such large pulses and to insure reproducibility of results; however, in-creased leakage was quite possibly a source of the variability of results that wasencountered.The present work may be of possible interest to those studying sensory mech-
anisms, especially vision. For in several molluscan systems primary inhibition isobserved, i.e., these systems respond only to decreasing illumination (cf. Wiederholdand MacNichol, 1970; McReynolds and Gorman, 1970).
MATERIAL AND METHODSThe dissection of the giant axon of the squid, the axon chamber, the solutions, the tempera-ture control, and the instrumentation used were identical with that described in previous work(cf. Guttman and Barnhill, 1970).
Space clamp was maintained by the double sucrose gap technique. The measured experi-mental area of membrane was usually about 0.01 cm2. Constant current stimuli were appliedthrough a 470 kQ isolating resistance to platinum electrodes.
Difficulties of Measurement
Investigation of this subject posed a number of unique difficulties. For one thing, in the earlyexperiments it was necessary to make probes over five decades of durations before the three
GUTrMAN AND HACHMEISTER Anode Break Excitation5 55s3

time constants could be identified; however, once they were fairly well pinpointed, the prob-lem became somewhat less difficult, because it was then known roughly in which areas itwould probably be necessary to concentrate readings to determine time constants in futureexperiments.
Also, the injuriousness of stimuli at (a) long durations and (b) short durations and highvoltages posed a serious problem. In general, we had to be content with establishing only onetime constant for a particular axon before irreparable injury was inflicted and further readingswere rendered unfeasible. It was only after considerable experience and improvement oftechnique that finally it was possible to establish all three time constants on one axon (Fig. 1).When readings are attempted for durations much beyond T3, the amount of scatter of data
points increases markedly, resulting in considerable deviation from the line that representsrheobase3 . This scatter is undoubtedly associated with breakdown of the membrane. If suchlong duration stimuli are used repeatedly, irreversible injury occurs and the experiment mustbe abandoned.
Stimulation at the other extreme of the curve, where durations are very short but voltagesextremely high, is also quite drastic. One can stimulate with greater impunity in the middleregion of the curve, i.e., in the vicinity of T2 and rheobase2 .
It is interesting that after one has with considerable difficulty recorded an anode breakexcitation curve, taking many precautions (such as repeatedly treating the fiber with three orfour subthreshold cathodal stimuli between readings, to restore the membrane to its original
2000- T-= 4 msec
T2= 250 msec
7T3= 800 msec
1000 _
I0
(cm2)500
200
Exp. 45-70 T
(10C)
100I1 2 5 10 20 50 100 200 500 1000
DURATION (msec)FIGURE 1 Anode break strength-duration curve showing three time constants of excitation,rI , T2, and T3, occurring at 4, 250. and 800 msec, respectively. Threshold current Io, in mi-croamperes per square centimeter vs. duration in milliseconds, both on log scales. All datapoints obtained on same axon at 10°C.
BIOPHYSICAL JOURNAL VOLUME 12 1972554
condition), and then finally given up the possibility of continuing anode break readings onthat axon, one is surprised to find that a good and reproducible cathodal threshold curvecan subsequently be obtained. Apparently, the membrane does not respond as regularly to"unphysiological" anode break stimuli as it does to "physiological" stimuli such as cathodalstimulation.
RESULTS
The strength-duration curves of the axons studied varied in the following ways.Axons in good condition with relatively high resting potentials exhibited strength-duration curves associated with lower threshold currents and relatively high timeconstants compared with axons in poorer condition.
Absence of Threshold Oscillation at Anode
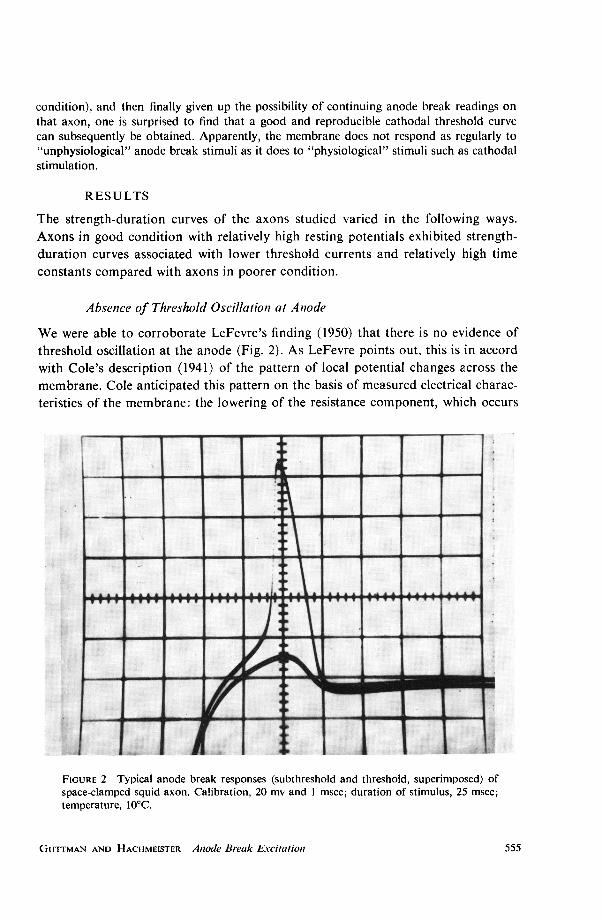
We were able to corroborate LeFevre's finding (1950) that there is no evidence ofthreshold oscillation at the anode (Fig. 2). As LeFevre points out, this is in accordwith Cole's description (1941) of the pattern of local potential changes across themembrane. Cole anticipated this pattern on the basis of measured electrical charac-teristics of the membrane: the lowering of the resistance component, which occurs
FIGURE 2 Typical anode break responses (subthreshold and threshold, superimposed) ofspace-clamped squid axon. Calibration, 20 mv and 1 msec; duration of stimulus, 25 msec;temperature, 10°C.
GUTTMAN AND HACHMEISTER Antode Break Excitation5 555

at the cathode and the raising of the resistance at the anode, would, in Cole's equiv-alent circuit, favor underdamping at the cathode and increa.sed damping at the anode.Mauro et al. (1970) discuss this feature in relation to the HH parameters.
Time Constants and Constant Quantity Regions
In the experiment shown in Fig. 1, where all three time constants were establishedon one axon, the values obtained for the breaks in the strength-duration curve,T = 3.8, r = 250, and r = 800 msec, are quite similar to the average for all axonsstudied, 7 msec, 200 msec, and 1 sec, respectively (Fig. 3).
In the experiment shown in Fig. 1, where such a large range of durations wascovered on one axon, we had to content ourselves with fewer data points for eachbreak than when just one break was being established for an axon; however, dataobtained on other axons confirm that the 450 lines preceding Ti and T3 are real andthat constant quantity regions can be expected there. The constant quantity aspectat durations less than -r is displayed in Fig. 4, which is a composite of six runs onfive axons. In this composite, individual runs have been displaced vertically and
I04 ~~~~~~~ ~~~~~~250C -00
- T 200 C 0)O 1500C D
100C 0'0
(Cm2) - e3 _ _cm 0-
310 0 0 -
- <[D 423 -+-~~~~~~~~(M T -a0~~ ~ ~ ~ ~ ~ ~ ~~ -
0~~~~0 0~~~~~~~~~~~~
- 0 0
0 ~~~~00~ 0
00 0102 II pi I
10 o0 j°DURATION (msec)
FIGURE 3 Correlation between threshold rheobase current (Io) in microamperes persquare centimeter and value of time constants (n , 2 , T3) in milliseconds, both on log scales.Data from 47 runs on 37 axons at 10, 15, 20, and 25°C as indicated. Broken line connectspoints which represent the means of averaged T's at 10, 15, and 20°C, respectively. (Since 25°Cdata were not taken for r2 and 7r3, these data are omitted from the averages.)
BIOPHYSICAL JOURNAL VOLUME 12 1972556

501-Exp. v h39 460 50
log 40 0 0
Io/Ijo \ 43a la 408
~~~~ ~~~45 45 0
20 \3 Average 54 46
\° R h.a
10 T,
1 2 5 10log D/D'
FiouRs 4 Composite graph showing data from five runs on four axons normalized to ex-periment 40. Log threshold current vs. log duration for short durations. Average amount(absolute value) of vertical displacement is 51% and of horizontal displacement is 46%.Note constant quantity region (450 line) preceding T1 .
horizontally by the amount indicated on the graph for best fit to a particular run(experiments 40-70). The data suggest that the time factors (T1, T2 , and T8) do notremain constant during an experiment and on the assumption that they change by afactor, the curves have been translated to the right or to the left in order to showthat they are of the same general form. Similarly, there were changes in the ampli-tude of threshold stimuli and a vertical displacement has been used in the same way.Since we are interested primarily in the shape of the curve and not in absolute values,these considerable displacements are felt to be justified. In our excitation studies ofthe past decade, we have invariably found very large variation in rheobase, reflectingpresumably differences in physiological condition of the various axons studied.During the course of our experiments, the axons presumably become more leaky,action potential amplitude decreases, and resting potentials occasionally decline.The values used are those obtained when the axons were in the freshest condition.The values of the breaks in the curves of all axons as a function of threshold cur-
rent are shown in Fig. 3, which represents data taken in 47 runs on 37 axons atvarious temperatures. Although there is variation from fiber to fiber, the breaks fallinto three clusters, and the means of the averaged T'S at 10, 15, and 20°C for eachcluster are indicated by crosses. Disregarding the influence of temperature for themoment, the average for the first break, rT, occurs at about 7 msec, r2 at about 200msec, and ra at about 1 sec.
These times agree fairly well with the time constants of the slow processes de-scribed in papers by Adelman et al. (1965), Adelman and Palti (1969), and Chandlerand Meves (1970). Narahashi (1964) has described an effect of [Ko] on the transient
GurrmAN AND HAcHnmisTEs Anode Break Excitation 55?o

sodium current which has a time constant of about 1 sec. Slow sodium inactivationhas been suggested by Cole (1958) as an explanation for these slow processes.There is thus a considerable body of literature on voltage-clamped, perfused, and
other squid axons, utilizing quite different techniques, with which this present studycan be compared, and our results do violence to none of these observations.The first break in our curve, ri, agrees with the experimental values found for
accommodation time in experiments using linearly rising ramps as stimuli and withcomputations based on the HH equations (Guttman, 1968). But while xi may rep-resent the time constant of the accommodation process, the evidence given aboveis not yet sufficient to identify the processes represented by the time constants T2and rs .
Fig. 3 indicates that there is significant correlation in the anode break excitationcurves between time constant values and IO, the intensity of threshold stimulation;i.e., the value ofthe associated rheobasic threshold decreases as the value ofthe timeconstant increases.
COMPUTED AXON- ~ ANODAL BREAK THRESHOLD CURRENTS-- CATHODAL THRESHOLD CURRENTS
%b2
~*- ~q4--4 15 C
0.1 1 10 100
DURATION (msec)FIGVRE 5 Calculated anodal break strength-duration curves (continuous lines) at 10 and150C and cathodal strength-duration curves (broken lines) at 10, 15, and 20°C for shortdurations. Stimulus duration in milliseconds and threshold current in microamperes persquare centimeter, both on log scales. The time constant of excitation, n, for these shorttimes is 1.7 msec for cathodal and 5.6 msec for anodal threshold currents at 10°C.
BIOPHYSICAL JouRNAL VOLUmE 12 1972
1000
10
cm)
558

Comparison of Experiments with Computations
Computations based on the HH equations (1952) generally confirm the value foundfor ri in the experiments here reported: computations give 5.6 msec and experiments5.9 msec for 7i at 10°C (Fig. 5). This figure also agrees, as has been mentioned, withprevious experiments on accommodation time calculations (cf. Guttman, 1968),but the empirical HH equations do not apply to data taken with stimuli of longerdurations. Therefore, the possible correlation of experiment and calculation couldnot be tested for T2 and r ; the portion of our experimental anode break excitationcurve at durations longer than ri and its associated rheobase, is not predicted at allby the equations.Computations based on the HH equations give values for rheobase, which are
about an order of magnitude lower than found experimentally. One suggestion toexplain this discrepancy was given by H. Lecar and R. Nossal (1971). They usedFitzHugh's Vm-reduced HH equations (cf. FitzHugh, 1969) to show the sensitivityof rheobase to the leakage current and suggest that better agreement may be ob-tained if more realistic leakage values are used in the HH equations.
Comparison of Excitation Time Values Obtainedfrom Cathodal and AnodeBreak Stimuli
Computed and experimental results for the time constant of excitation using cathodalpulses and for the first time constant of excitation (ri) using anode break stimuliare compared. In both the computed axon (6.0 msec compared with 2.3 msec) andthe experimental axon (5.8 msec compared with 0.8 msec) the anode break timeconstant, ri, is longer than the excitation time obtained using cathodal currents.The agreement is very good for the anode break time constant, ri, in experimentaland computed axons (5.8 and 6.0 respectively).
Effect of Temperature
It was difficult to study the effect of temperature upon the anode break strength-duration curve of real axons since the experimental procedure was so drastic thatrepeated runs at different temperatures could usually not be carried out on the sameaxon. Rheobase values varied greatly from fiber to fiber, depending upon how muchthe fibers had previously been stimulated. But in one experiment, it was possible todetermine rheobases at three different temperatures on the same axon, and therheobase was found to increase strongly with temperature, especially at high tem-perature (Fig. 6). This is consistent with the result obtained previously from strength-duration excitation curves involving cathodal stimuli where rheobase increasedwith temperature, the temperature effect being more marked at the higher tempera-tures (cf. Fig. 4, Guttman, 1966). This finding is also consistent with the result ob-tained for the calculated axon, where rheobase increases as temperature is raised inboth anode break and cathodal strength-duration curves (Fig. 5).
GUTrMAN AND HACHMEISTER Anode Break Excitation 559

Rheobase3(Exp. 18-70)
Temp Io (L a/cm2)10°C 22015° C 343200C 593
I I1 1115 20
TEMP (0C)
FIGURE 6 Values for rheobase3 (rheobase after the third break, r8, in anode break excita-tion curve) in microamperes per square centimeter vs. temperature in degrees centigrade.The three points are taken from three runs on same axon.
TABLE I
EFFECT OF TEMPERATURE ON T'S OF ANODEBREAK STRENGTH-DURATION CURVES OFCOMPUTED AND EXPERIMENTAL AXONS
ExperimentalTemperature Computed r
T1 72 73
oc
10 6.0 5.9 250 113215 5.7 5.6 171 122520 9.7 163 97725 8.6
BIOPHYSICAL JOURNAL VOLUME 12 1972
600 1-
500 F-
IO
/-auVCm2
400 1-
300
10e-UL ,
560

In both computed and experimental axons, raising the temperature from 10 to15°C decreased the value of ri slightly in the anode break strength-duration studies(Table I); however, when the temperature was raised to 20 or 15°C the value of rincreased markedly in the experimental axon. Preliminary experiments at 20°C re-sulted in shorter r2's and T3s' as compared with values for r2 and Tr obtained at lowertemperatures (Fig. 3 and Table I).
CONCLUSIONS
The following possible explanations are offered for the portion of the anode breakexcitation curve at (a) short durations and (b) durations longer than those thatgive ri and rheobasel.
Short Duration Portion ofAnode Break Excitation CurveDuring the stimulating pulse, V goes negative (hyperpolarized direction) and as aresult m and n approach small values and h becomes large (m, n, and h are terms inthe HH equations). Because m and n are small, so are gN. and gK , leaving the leak-age current as the main current. V settles down to a value just far enough from theleakage potential to drive the stimulating current through the membrane prin-cipally as leakage. Then when the stimulating current is switched back to zero atthe end of the stimulus, V starts back toward VL exponentially with the C/gL timeconstant. The first conductance variable to respond to this change of V is m, whichhas the smallest time constant. m increases quickly to the point where gNa is largerthan at rest, because h is larger than at rest and has not had time to decrease much.This makes the sodium current so large that excitation takes place. This explanationis essentially an elaboration of that given by Hodgkin and Huxley (1952) and wassuggested to us by R. FitzHugh and H. Lecar (personal communication).
Long Duration StimuliThe above may account for the upper left part of the exponential curve (Fig. 1)down to the first leveling off. What may happen beyond there? There is recentexperimental evidence for very slow Na and K inactivations not included in the HHequations; Narahashi (1964), Adelman et al. (1965), Adelman and Palti (1969),Chandler and Meves (1970), and Cole long ago (1958) suggested slow sodium inac-tivation as an explanation for these slow processes.
It is suggested by R. FitzHugh and H. Lecar (personal communication) that suchslow "inactivations" decrease the conductance for depolarizations; for hyperpolar-izations they might be expected to increase them. A slow Na inactivation would actin the same way as the HH inactivation h, decreasing threshold still more, as wefound experimentally. A slow K inactivation would thus tend to make it moredifficult to stimulate and would increase them. A slow Na inactivation would actin the same way as the HH inactivation h, decreasing threshold still more, as we
GurrmAN AND HACHMEISTER Anode Break Excitation 561

found experimentally. A slow K inactivation would thus tend to make it moredifficult to stimulate and would increase the threshold as the stimulus durationsincreased. This is the opposite of what we observed experimentally. Or there maybe some totally different effect than the above appearing during very long stimuli,i.e., the accumulation of some ion at some interface setting up an E.M.F. to favor ex-citation.
We are indebted to Richard FitzHugh and John Shaw for the computations in this paper.We are also very grateful to Kenneth S. Cole for suggestions and discussion.
This work has been aided by National Science Foundation grant GB-28527 awarded to Dr. Guttman.
Receivedfor publication 7 September 1971 and in revisedform 2 December 1971.
REFERENCES
ADELMAN, W. J., JR., F. M. DYRO, and J. SENFY. 1965. J. Gen. Physiol. 48(Pt. 2) :1.ADELmAN, W. J., JR., and Y. PALTI. 1969. J. Gen. Physiol. 54:589.CARDar, H., and H. LAUGIER. 1912. J. Physiol. Pathol. Gen. 14:263.CHANDLER, W. K., and H. MEVEs. 1970. J. Physiol. (London). 211:707.CLuzEr, J. 1908. J. Physiol. Pathol. Gen. 10:392.COLE, K. S. 1933. Cold Spring Harbor Symp. Quant. Biol. 1:131 .CoLE, K. S. 1941. J. Gen. Physiol. 25:29.CoLE, K. S. 1958. Biophys. Soc. Annu. Meet. Abstr. 22.COLE, K. S. 1968. Membranes, Ions and Impulses. University of California Press, Berkeley.F1TZHUGH, R. 1969. In Bioelectronics. H. P. Schwan, editor. McGraw-Hill Book Company, NewYork. 1.
GurMAN, R. 1966. J. Gen. Physiol. 49:1007.GUTrMAN, R. 1968. J. Gen. Physiol. 51:759.GurMwAN, R., and R. BARNHILL. 1970. J. Gen. Physiol. 55:104.HaL, A. V. 1936. Proc. Roy. Soc. Ser. B. Biol. Sci. 119:305.HODGKIN, A. W., and A. F. HUXLEY. 1952. J. Physiol. (London). 117:500.KATZ, B. 1939. Electric Excitation of Nerve. Oxford University Press, London.LECAR, H., and R. NossAL. 1971. Biophys. J. 11:1048.LEFEvRE, P. G. 1950. J. Gen. Physiol. 34:19.LucAs, K. 1907. J. Physiol. (London). 35:310.MAURO, A., F. CONTI, F. DODGE, and R. SCHOR. 1970. J. Gen. Physiol. 55:497.MCREYNOLDs, J. S., and A. L. F. GORMAN. 1970. J. Gen. Physiol. 56:376.MONNER, A. M. 1934. L'excitation el&trique des tissues. Hermann, Paris.NARAHASHI, T. 1964. J. Cell. Comp. Physiol. 64:73.RASHEVSKY, N. 1933. Protoplasma. 20:42.SOLANDT, D. Y. 1936. Proc. Roy. Soc. Ser. B. Biol. Sci. 120:389.WIEDERHOLD, M. L., and E. F. MACNICHOL, JR. 1970. Biol. Bull. (Woods Hole). 139:442.
APPENDIX
COMPUTATION OF THE ANODE BREAK THRESHOLD FOR THEHoDGoN-HuxLEY MODEL OF THE SQUiD AXON
RicHARD FITZHUGH and JOHN SHAwFrom the National Institutes of Health, Bethesda, Maryland 20014
The threshold computations were done using a PDP-10 time-sharing computer with a 340cathode-ray display. The Hodgkin-Huxley equations were solved using Runge-Kutta integra-
562 BIOPHYSICAL JOURNAL VOLUME 12 1972

tion with step size automatically adjusted to control truncation error. The automatic searchprocedure for threshold was monitored by watching curves of V vs. t on the display for eachstinulus value, a useful way to eliminate errors. The criterion for distinguishing subthresholdresponses was not the usual one of comparing peak V with an arbitrary criterion level. Thechoice of criterion level can affect the threshold value at higher temperatures, where responsesbecome more graded. Instead, the search was for the inflection point on the stimulus-responsecurve (peak V vs. stimulus strength), to within an accuracy limited by roundoff error.
R. FitzHugh and J. Shaw wish to thank the staff of the PDP-10 computer group, Division of Com-puter Research and Technology, National Institutes of Health, Bethesda, Maryland, for making thiscomputer available.
GuTrmAN AND HACHMEisTER Anode Break Excitation 563