
Annuity Options in Public Pension Plans · Annuity Options in Public Pension Plans ... bear both...
32
Annuity Options in Public Pension Plans Robert L. Clark and Janet Raye Cowell May 2016 PRC WP2016 Pension Research Council Working Paper Pension Research Council The Wharton School, University of Pennsylvania 3620 Locust Walk, 3000 SH-DH Philadelphia, PA 19104-6302 Tel.: 215.898.7620 Fax: 215.573.3418 Email: [email protected] All findings, interpretations, and conclusions of this paper represent the views of the author(s) and not those of the Wharton School or the Pension Research Council. © 2016 Pension Research Council of the Wharton School of the University of Pennsylvania. All rights reserved.
Transcript of Annuity Options in Public Pension Plans · Annuity Options in Public Pension Plans ... bear both...
Annuity Options in Public Pension Plans
Robert L. Clark and Janet Raye Cowell
May 2016
PRC WP2016
Pension Research Council Working Paper
Pension Research Council
The Wharton School, University of Pennsylvania
3620 Locust Walk, 3000 SH-DH
Philadelphia, PA 19104-6302
Tel.: 215.898.7620 Fax: 215.573.3418
Email: [email protected]
All findings, interpretations, and conclusions of this paper represent the views of the author(s) and not those of
the Wharton School or the Pension Research Council. © 2016 Pension Research Council of the Wharton School
of the University of Pennsylvania. All rights reserved.
Annuity Options in Public Pension Plans
Robert L. Clark and Janet Raye Cowell
Abstract
The paper will review available data on the annuity choices offered to retirees who participate
in defined benefit (DB) plans. DB plans are most commonly offered by state and local
governments to their employees, and information on annuity options is readily available. We
will examine all state pension plans that cover general state employees and teachers, and we
will develop a table showing the similarities and differences across these approximately 80
separate state retirement plans. We will contact the managers of a subset of these plans and
request information on the proportion of retirees selecting each of the annuity options. Where
possible, we will compare annuity options in the public sector to those offered by private sector
employers. The paper will also include a review of the empirical literature on who chooses the
various annuity options offered in DB plans. Finally, we will consider the policy implications
of plan design and how this affects the types of annuities offered to retirees.
Robert Clark
Stephen Zelnak Jr. Professor
Poole College of Management
North Carolina State University
Research Associate of the National Bureau of Economic Research
Janet Cowell
Treasurer of the State of North Carolina

194
Annuity Options in Public Pension Plans
Public sector retirement plans need to be regularly evaluated and updated to ensure that
they meet the needs of current and future public sector workers and retirees. This has not
happened to the extent needed, in part because public pensions have been controversial in many
places and recent debates on pension reform have focused on the retirement plans’ costs. Even
when a plan’s fundamentals are strong, trustees have had to play defense concerning the
generosity and cost of the plans rather than being able to direct their attention to managerial
improvements. Incremental improvements in plan design nonetheless are vital to maintaining
plans that match the needs of today’s public sector employees.
This chapter investigates an important issue affecting almost all retirees in public
employee retirement plans, namely the choice of annuity payment option. Most public sector
plans are of the defined benefit variety, where benefits are a function of years of service, final
average salary, and age at retirement. Nevertheless, most public retirement plans in the U.S. offer
retirees a menu of options for how their benefit can be paid. The annuity option that retiring
employees elect will have significant long-term financial implications for retirees and their
households.
In the private sector, concern has been expressed that pension participants often request
lump sum distributions instead of selecting annuities provided by the plan (Mitchell et al. 1999;
Brown 2001). When a lump sum distribution is taken, retirees must manage their resources and
bear both investment and longevity risk. This is less of an issue in the public sector, as most
individuals who retire from public employment select one of the annuity options offered by the
pension plan. They do so in part because selecting a lump sum distribution may make them
ineligible to remain in the employer’s retiree health insurance plan. Therefore annuity options

195
offered by public retirement plans serve many retirees well by providing lifetime benefits, thus
eliminating the risk that people might outlive their retirement savings. An emerging question is
whether the annuity options currently offered by public retirement plans will continue to be
attractive as the population continues to age, life expectancy increases, and retirement patterns
change. This chapter describes current annuity options offered by large public pension systems
and then explores several modified annuity options to potentially address these emerging issues
and improve public sector workers’ utilization of retirement benefits.
We begin with a review of the annuity options offered by 85 large, state-managed
retirement plans for public employees. The lifetime patterns of payments of these annuity
options differ considerably. Next, we report the results of a survey sent to the state Treasurers
(or comparable official) requesting information on the proportion of retirees selecting each
option offered under the public plans in their states. We also examine how well the available
annuity options serve the needs of public employees. Finally, we examine two new types of
annuity payouts that could enhance the likelihood that public retirees will be able to achieve a
reliable standard of living throughout their retirement.
Retirement Benefit Options in Public Retirement Plans
We explore the current options offered by public sector retirement plans, focusing on 85
state-managed retirement plans included in the 2012 Comparative Study of Major Public
Employee Retirement Systems prepared by the Wisconsin Legislative Council (2013).1 We then
reviewed the websites of each of these plans and created a list of the various annuity options
offered in each case. The plans included in this review cover general employees and teachers;
pensions offered to police, firefighters, and elected officials are excluded from our analysis.2

196
Among the 85 plans, 13 cover only state employees, 27 cover only teachers, eight cover only
local employees, 14 cover state and local employees, three cover state employees and teachers,
and 20 include state employees, local employees, and teachers.
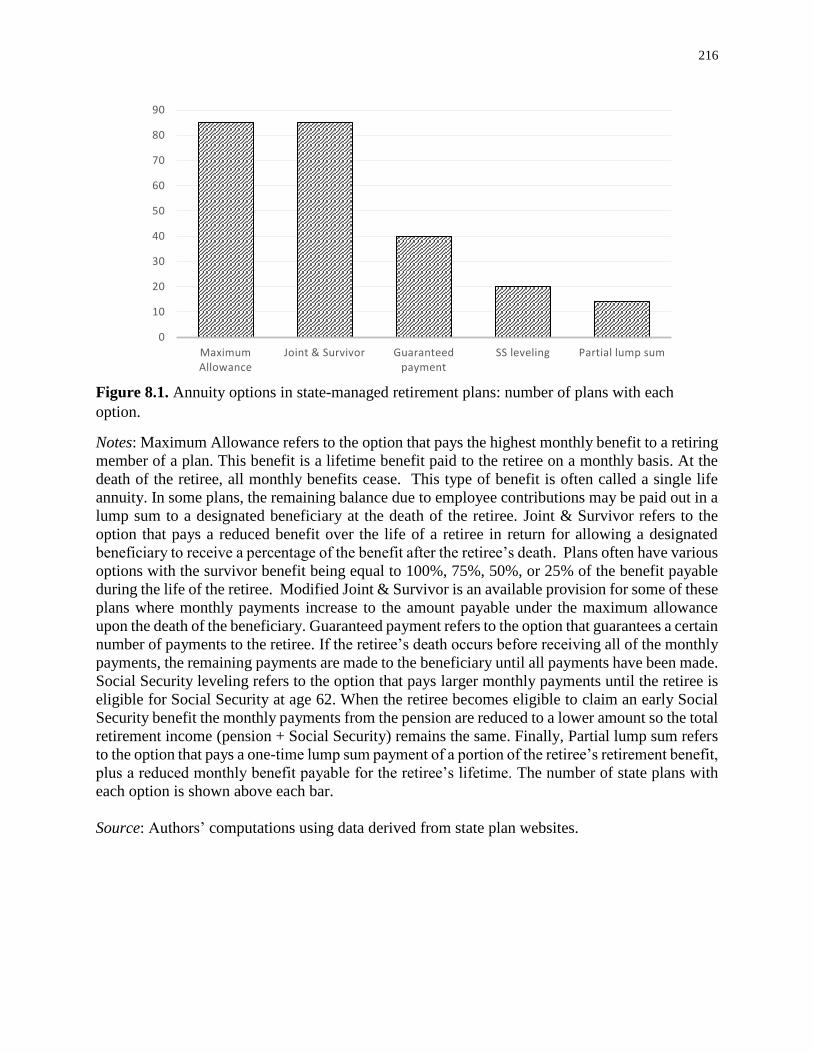
Figure 8.1 depicts the number of plans that offer each of the most frequently available
annuity options.3 Using assumptions concerning age-specific life expectancies of the retirees
and beneficiaries, as well as the plan assumed discount rate or rate of return, each retirement
system attempts to calculate the benefits under each of the payment options so that the expected
present value of each annuity option is the same. For example, the monthly benefit is higher if
the retiree selects a single life annuity (often referred to as the maximum allowance), and it is
lower if a joint and survivor benefit is chosen.4 Public plans usually offer separating employees
the option to request a lump-sum distribution. Unlike lump-sum options in the private sector,
this distribution option in most public plans is based on employee contributions compounded
over time using a specified interest rate.5 Public sector employees who are eligible for an
immediate benefit upon terminating employment rarely request a lump-sum distribution.
Insert Figure 8.1 here
Each plan offers an annuity in which the retiree is paid a monthly benefit based on a
formula specified in the plan. In Figure 8.1, this option is labeled the maximum allowance and is
basically a single life annuity where all payments cease with the death of the retiree.6 Each plan
also offers some type of joint and survivor annuity option (J&S). These annuities provide a
lower income stream than the maximum allowance during the retiree’s life but then they
continue to pay monthly benefits for the remaining lifetime of the beneficiary. Plans usually
offer several versions of the joint and survivor benefits. The options specify the benefit of the
survivor as a percent of the benefit paid to the retiree prior to her death. Typically, the benefit

197
paid to the survivor represents a specified percentage of the benefit paid to the retiree during her
lifetime. Most retirement systems offer a range of J&S payout options (see Appendix Table 8.2).
Among the plans in our sample, 77 plans allow retirees to select a 100 percent benefit for the
beneficiary while 78 plans have a 50 percent option. In addition, 33 plans have a 75 percent
option and 7 plans have a 25 percent survivor option. Finally, 16 plans have additional J&S
options. For example, Virginia’s SRS allows retirees to choose any whole percentage of the
retiree benefit to be paid to the survivor between 10 and 100 percent. The larger the benefit paid
to the survivor, the lower the initial benefit that is paid during the life of the retiree.
Slightly fewer than half of the plans have an annuity option that provides a single life
annuity with a guaranteed number of payments. If the retiree were to die before all of the
guaranteed payments are made, the remaining payments will be made to the named beneficiary;
however, after the specified number of payments, the survivor receives no further benefits from
the retirement system. Of course, this option provides lower monthly benefits than that the
maximum benefit option.
Another option offered by 14 plans allows retirees to select a partial lump sum
distribution. These retirees then receive an immediate payout reflecting some portion of the
present value of their benefit, and by accepting this distribution, retirees agree to permanently
lower monthly benefits from the retirement system in the form of single life annuities. The lump
sum payments are typically specified as a percent of the annuity or a number of months of
benefits. For example, Georgia ERS restricts the lump sum to between 1 and 36 months of the
normal benefit, and Ohio PERS/STRS, Mississippi PERS, Virginia SRS and Texas ERS have
similar options. Kansas PERS Tier 2 allows the retiree to select a 10, 20, or 30 percent option
which provides a lump sum equal to the percentage of the present value of the maximum

198
allowance and requires a corresponding reduction in the size of the monthly benefit. Some states
limit eligibility for this option to individuals retiring at or after their full retirement date.
Twenty plans have an annuity option called “Social Security Leveling.”7 This option
requires retirees to report to the retirement system their expected Social Security benefit at
specified age. Most state plans with the Social Security Leveling options stipulate that age 62 be
used to determine the Social Security benefit. However, Idaho PERS and Illinois SRS specify
that the leveling aging is the full retirement age for Social Security, and North Dakota TRF
allows either age 62 or the full retirement age to be used in the calculation. Virginia SRS allows
the worker to choose any age between 62 and the Social Security full retirement age in this
option, while Alaska PERS uses age 65 in its calculation; however that option is only available
to individuals who entered the system prior to July 1, 1996. Workers selecting the option
receive a higher initial benefit from their state pension, compared to the maximum benefit
option, and the annual pension benefit is reduced when the individual reaches the specified
leveling age, at which time the retiree is expected to claim a Social Security benefit. The idea is
that the retiree will receive the same total retirement benefit (pension plus Social Security) before
and after the age given for claiming Social Security benefits.
This option may appeal to some retirees because many public sector workers retire prior
to age 62 and hence before becoming eligible for social security. To these early retirees, the
higher initial pension benefit can seem attractive. A concern with this option is that, by linking
the reduction in the pension benefit to age 62, retirees are encouraged to claim Social Security
benefits as soon as they become available at age 62. This may not be optimal for all retirees
(Goda et al. 2015). The pension benefit in the leveling option is also based on the single life of
the retiree and provides no beneficiary payments after the death of the retiree.
199
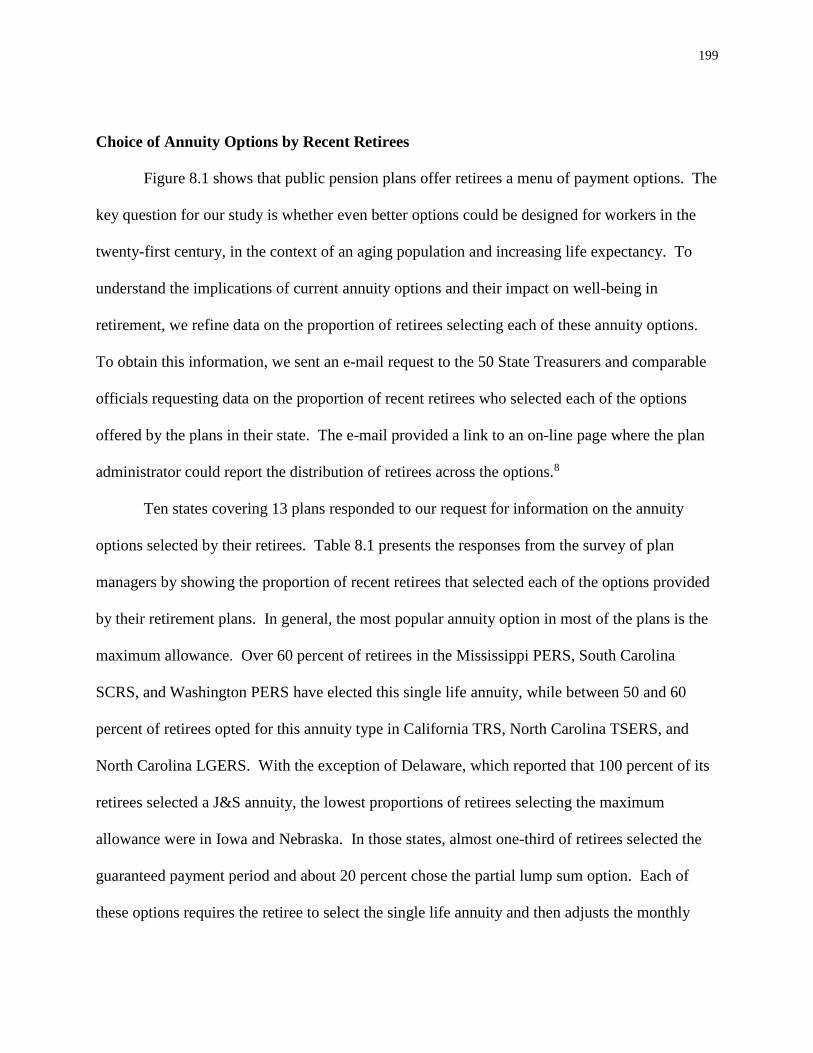
Choice of Annuity Options by Recent Retirees
Figure 8.1 shows that public pension plans offer retirees a menu of payment options. The
key question for our study is whether even better options could be designed for workers in the
twenty-first century, in the context of an aging population and increasing life expectancy. To
understand the implications of current annuity options and their impact on well-being in
retirement, we refine data on the proportion of retirees selecting each of these annuity options.
To obtain this information, we sent an e-mail request to the 50 State Treasurers and comparable
officials requesting data on the proportion of recent retirees who selected each of the options
offered by the plans in their state. The e-mail provided a link to an on-line page where the plan
administrator could report the distribution of retirees across the options.8
Ten states covering 13 plans responded to our request for information on the annuity
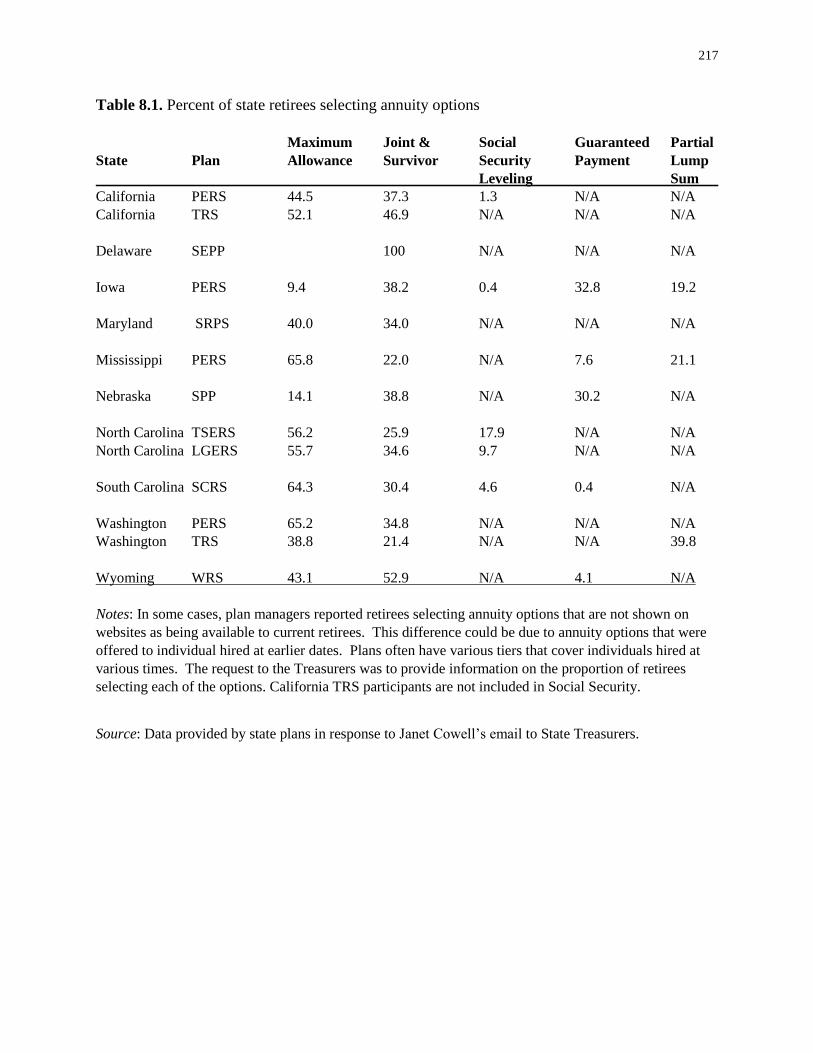
options selected by their retirees. Table 8.1 presents the responses from the survey of plan
managers by showing the proportion of recent retirees that selected each of the options provided
by their retirement plans. In general, the most popular annuity option in most of the plans is the
maximum allowance. Over 60 percent of retirees in the Mississippi PERS, South Carolina
SCRS, and Washington PERS have elected this single life annuity, while between 50 and 60
percent of retirees opted for this annuity type in California TRS, North Carolina TSERS, and
North Carolina LGERS. With the exception of Delaware, which reported that 100 percent of its
retirees selected a J&S annuity, the lowest proportions of retirees selecting the maximum
allowance were in Iowa and Nebraska. In those states, almost one-third of retirees selected the
guaranteed payment period and about 20 percent chose the partial lump sum option. Each of
these options requires the retiree to select the single life annuity and then adjusts the monthly

200
payment to offset the expected payments associated with the option. Neither of these options
provide a retiree’s surviving beneficiary a benefit for life.
Insert Table 8.1 here
All of these options provide a retirement benefit to retirees for the duration of their lives
but, in general, they do not provide any benefit to survivors. The J&S options enable retirees to
engage in long term planning for a beneficiary, typically a surviving spouse.9 With the exception
of Delaware SEPP that reported 100 percent of its retirees selecting a J&S option, only in
Wyoming WRS and California TRS does the proportion of retirees selecting a J&S option
approach 50 percent. All of the other benefit options are based on single life annuities and
provide little in the way of expected lifetime income protection to surviving spouses. Since
public retirement plans are not subject to ERISA, there has been no requirement that the interest
of a spouse be considered when the retiree is selecting a distributional option.
Five of the 12 plans in which workers are also covered by Social Security offer a Social
Security leveling option. Among these plans, only in North Carolina is the incidence of this
option greater than 10 percent of retirees.10 The partial lump sum option seems to be a desirable
choice for some but by no means all retirees. Only Iowa PERS, Mississippi PERS, and
Washington TRS offer retirees the option of partial lump sum distributions where 20 to 40
percent of retirees in each of these plans select this option. Five states offer a guaranteed
payment period annuity option. This distribution option is popular in Iowa and Nebraska, where
almost one-third of retirees select this option; however, the proportion of retirees in Mississippi,
South Carolina, and Wyoming selecting this option is under 10 percent.
Do these options represent the best payout choices for public sector retirees, given the
early ages at which many retire and the rising number of years that many will spend in

201
retirement? Since many public retirees find new employment shortly after leaving their career
jobs, their need for immediate income from their pension may be less pressing compared to older
persons who do not work after retirement. Moreover delaying the start of Social Security benefits
is an excellent method of enhancing retirement income, but the Social Security leveling option
encourages people to take their benefits as soon as they are eligible. In what follows, we develop
two annuity options that could enhance the probability that public retirees will achieve their
retirement goals.
New Annuity Options for Public Retirement Plans
We now examine two potential new annuity options that could improve retirement well-
being for some households. One would be to allow retirees to defer receiving their retirement
benefits to a specified age, with the proviso that the retirement system would recalculate the
monthly benefit so that the lifetime expected present value would be the same as if benefits had
begun at the time of retirement. In the following, we refer to this option as a “deferred annuity.”
This could appeal to young retirees in good health and who expect to shift from their career
public job to new employment.11 The second option would be for public retirement systems to
modify the Social Security Leveling options so workers could elect later target ages for claiming
Social Security. We call this a “flexible Social Security leveling.” This second approach could
appeal to young retirees who do not plan to re-enter the labor force after retirement but who
would like to maximize their retirement income. Both options should provide increased income
in the later years of retirement compared to currently available options.

202
Deferred annuity. Many career public employees retire from their state or local jobs at
relatively young ages, in their 50s or early 60s.12 Many of these young retirees move directly, or
after a short period, into bridge jobs or new careers.13 Clark et al. (2015) reported that 85 percent
of public employees age 50 - 59 in North Carolina planned to work after retiring from their
current state or local government job. Younger retirees are much more likely to anticipate a
period of employment following retirement from their public sector jobs. Depending on whether
they work full or part-time, these individuals may not need to draw their pension immediately
after leaving the public sector.
A deferred annuity option would offer public sector retirees the opportunity to select
some future year to start retirement benefits with the annual benefit being recalculated, so that
the expected present value of lifetime retirement benefits remained the same regardless of when
they were initiated. Using the restriction that the new option would be cost-neutral to the system,
the increase in annual benefits would be an easy calculation using the same assumptions
currently used by the system to determine other benefit calculations. This new annuity option
should be cost-neutral to the system in the same manner as joint and survivor annuities are cost-
neutral relative to the maximum benefit options in public sector retirement plans.
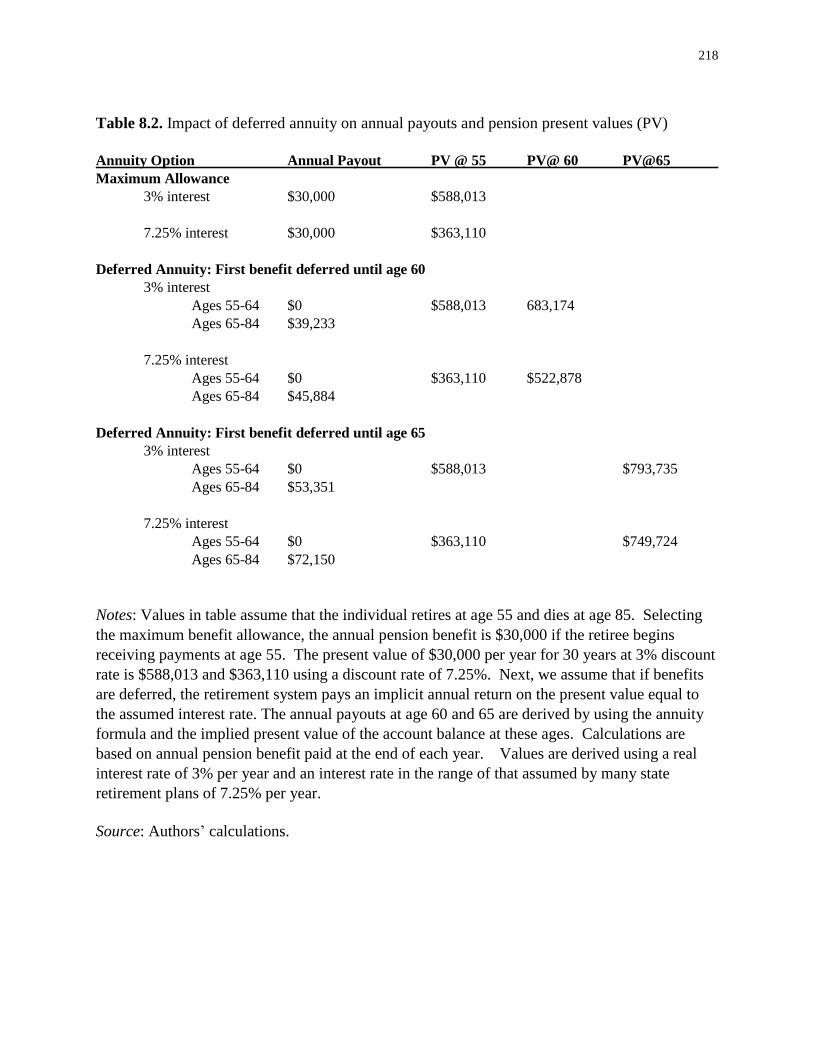
A simple example helps illustrate the impact on annual retirement benefits of postponing
the start of annual payouts based on a deferred annuity option. Assume that a worker leaves
public employment at age 55 with the option to start receiving a benefit of $30,000 immediately
(the maximum allowance), or a higher annual benefit beginning at some point in the future. She
can expect to live until age 85, for 30 years of benefits in retirement. Table 8.2 shows the benefit
if the worker selected the deferred annuity option and delayed the start of benefits for five years
until age 60, or 10 years until age 65.
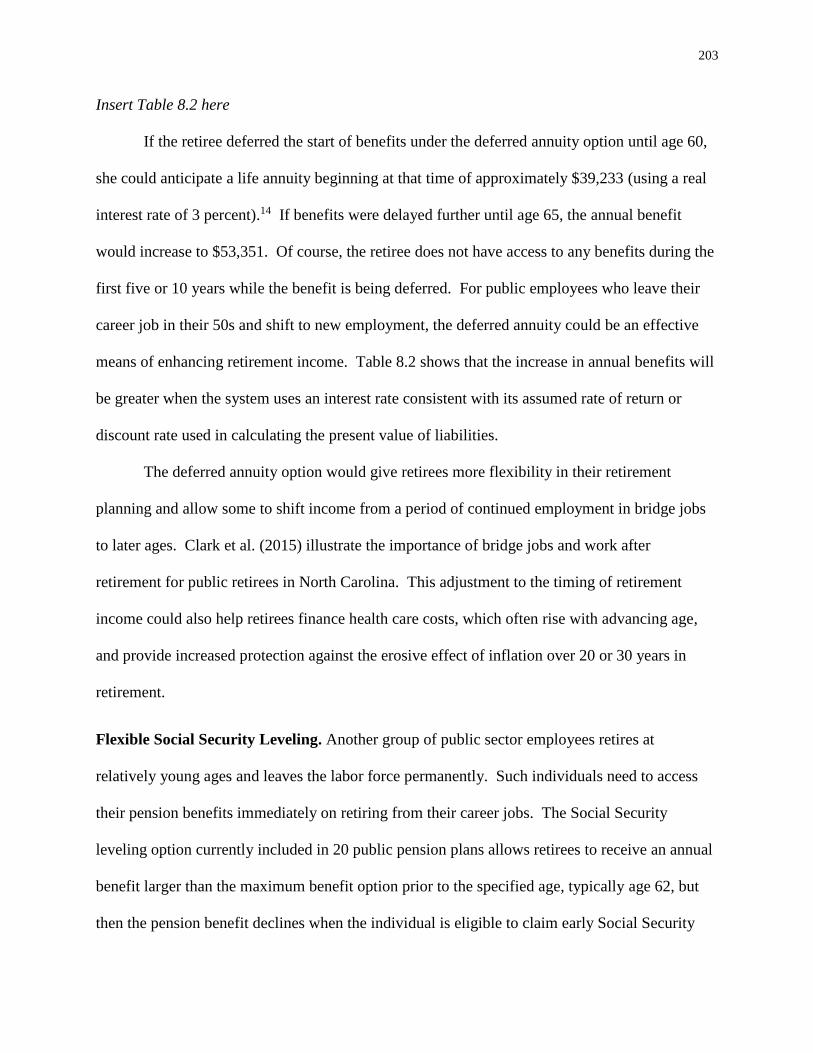
203
Insert Table 8.2 here
If the retiree deferred the start of benefits under the deferred annuity option until age 60,
she could anticipate a life annuity beginning at that time of approximately $39,233 (using a real
interest rate of 3 percent).14 If benefits were delayed further until age 65, the annual benefit
would increase to $53,351. Of course, the retiree does not have access to any benefits during the
first five or 10 years while the benefit is being deferred. For public employees who leave their
career job in their 50s and shift to new employment, the deferred annuity could be an effective
means of enhancing retirement income. Table 8.2 shows that the increase in annual benefits will
be greater when the system uses an interest rate consistent with its assumed rate of return or
discount rate used in calculating the present value of liabilities.
The deferred annuity option would give retirees more flexibility in their retirement
planning and allow some to shift income from a period of continued employment in bridge jobs
to later ages. Clark et al. (2015) illustrate the importance of bridge jobs and work after
retirement for public retirees in North Carolina. This adjustment to the timing of retirement
income could also help retirees finance health care costs, which often rise with advancing age,
and provide increased protection against the erosive effect of inflation over 20 or 30 years in
retirement.
Flexible Social Security Leveling. Another group of public sector employees retires at
relatively young ages and leaves the labor force permanently. Such individuals need to access
their pension benefits immediately on retiring from their career jobs. The Social Security
leveling option currently included in 20 public pension plans allows retirees to receive an annual
benefit larger than the maximum benefit option prior to the specified age, typically age 62, but
then the pension benefit declines when the individual is eligible to claim early Social Security
204
benefits. The idea is to provide retirees a constant total annual benefit (pension plus Social
Security) from retirement until death. While retirees are not required to claim Social Security at
age 62, if they do not, their annual incomes will fall. Thus there is a strong incentive for retirees
who have chosen the Social Security leveling option to claim benefits at age 62.
It is worth noting, however, that Social Security currently specifies age 66 as the age for
full retirement benefits and imposes penalties for claiming benefits between 62, the early
retirement age, and 66. Similarly, the system currently provides delayed retirement credits for
postponing the start of benefits up to age 70.15 Claiming benefits prior to age 66 results in a
reduction in monthly benefits of 5/9 of 1 percent per month for the first 36 months and 5/12 of 1
percent for each additional month.16 Delaying claiming benefits after age 66 increases benefits
by 8 percent per year up to age 70. Assume that if benefits are begun at the full retirement age of
66, the monthly benefit will be $1,000. If benefits are claimed at 62, the earliest age of
eligibility, the monthly benefit is only $750 per month or a 25 percent reduction in monthly
benefits for the rest of one’s life. Despite these penalties for early claiming, almost half of all
individuals claim benefits at age 62.17 In contrast, if benefit claiming is delayed until age 70, the
monthly benefit would be $1,320 or 32 percent greater than would be true if benefits are begun at
age 66. Comparing the benefit at age 70 benefit to the benefit at 62, the monthly benefit is 76
percent greater when benefits are claimed at age 70.18
Experts examining the Social Security rules have also argued that, for most households,
delaying the start of Social Security benefits results in a higher lifetime present value of these
benefits (Shoven and Slavov 2014 a,b). Moreover, the rise in lifetime benefits resulting from a
claiming delay has been increasing due to changes in Social Security rules.19 Shoven and Slavov
(2013, p.1) state that “with today’s life expectancies and today’s extremely low interest rates, it
205
is in almost everyone’s interest to delay the commencement of Social Security. For many
people, delaying to 70 is the value maximizing strategy.”20
Instead of claiming Social Security benefits at age 62, Goda, et al. (2015) examine how
retirees could draw on their assets in retirement saving accounts (IRAs and 401(k) accounts) to
fund consumption for several years prior to claiming Social Security benefits. Because the
lifetime expected present value of Social Security benefits is greater when individuals wait to
begin claiming their benefit until an older age, drawing on personal saving, such as the
retirement savings accounts mentioned above, after age 62 and waiting to claim Social Security
benefits at older ages will yield higher annual retirement income.
A flexible Social Security leveling annuity would allow public sector retirees to select
any age between 62 and 70 for the target date on which the pension annuity would decline and
Social Security benefits would begin.21 This option would use the same assumptions currently
used to derive the pension annuity before and after age 62, and thus should be cost-neutral to the
system. If the lifetime present value of Social Security benefits rises with delayed claiming
while the present value of the pension benefits is held constant, then total annual income will be
higher if Social Security leveling were based on a later retirement age.
Conclusions
State and local retirement plans typically offer retirees a range of annuity options.
Nevertheless, increasing life expectancy and delayed retirement suggest some new options are
needed. Specifically, the deferred annuity option we outline here would allow young retirees
who are moving to new jobs the ability to defer the start of their pension, providing for a greater
benefit in future years. A flexible Social Security leveling option would provide greater annual

206
benefits for early retirees throughout their retirement. This second innovation will take
advantage of the fact that the present value of Social Security benefits increase if claiming is
delayed for most individuals.
In the wake of the economic downturn, many public pension plan administrators and
lawmakers came to the conclusion that modifying or even terminating existing public sector
defined benefit plans would provide cheaper, more sustainable retirement benefits. Pension
reforms have ranged from simple reductions in benefit generosity, including benefit multiplier
reductions or increased normal retirement ages, to a more drastic restructuring of benefit design.
Such changes have typically aimed to shift some or all of the investment and longevity risk onto
employees while protecting the employers against risk, market volatility, and further increases in
pension costs. But the efficacy of these pension reforms in minimizing employer costs and risks,
as well as the broader impact on public sector retirement security and human resource needs,
remain to be seen.
Meanwhile, we have outlined two ways to re-structure the traditional defined benefit
plans to ensure that these plans can meet the needs of current and future public sector workers
and retirees. Ultimately, the true value of a public employee benefits system is that retirement
benefits help government employers recruit and retain qualified personnel to deliver essential
services and then provide adequate retirement income to career employees. This policy goal
reflects a tradeoff between the cost of funding the plan and the benefit of maintaining a quality
labor force that is able to produce the goods and services that its citizens desire. To this end, it is
essential to administer the plan benefits in a manner that encourages sensible public employee
choices in the face of evolving economic circumstances and preferences. Modernization of this
benefit structure will build the continued value, equity, and cost effectiveness of these plans.

207
Reforming traditional defined benefit plans instead of shifting to defined contribution plans or
hybrid plans is a viable path forward for some state and local governments.
Our study highlights one important plan characteristic within the larger design of defined
benefit plans that demonstrates the valuable role that independent policy and economic research
can play in pension reforms. Reinventing pension administration requires that adequate time and
resources be devoted to understand the costs, benefits, efficiencies, and opportunities with the
current system. Changing public sector retirement plans without such analysis could yield
undesirable outcomes and produce unanticipated, and even potentially harmful fallout for public
employers, employees, and taxpayers.

208
Appendix
Insert Appendix Table 8.1 here
Insert Appendix Table 8.2 here

209
Acknowledgements
The authors acknowledge the helpful suggestions and comments of Emma Hanson Turner,
Christelle Khalaf, Sam Watts, and Matthew Leatherman. Partial support for Clark in the
preparation of this paper was provided by the Sloan Foundation, Grant Number 2013-10-20.

210
References
Brown, J. and J. Poterba (2000). ‘Joint Life Annuities and the Demand for Annuities
by Married Couples,’ The Journal of Risk and Insurance, 67(4): 527-553.
Brown, J (2001). ‘Private Pensions, Mortality Risk, and the Decision to Annuitize,’
Journal of Public Economics, 82(1): 29-62.
Cahill, K., M. Giandrea, and J. Quinn (2012). ‘Older Workers and Short-
Term Jobs: Patterns and Determinants,’ Monthly Labor Review, 135(5): 19-32.
Cahill, K., M. Giandrea, and J. Quinn (2015). ‘Retirement Patterns and the
Macroeconomy, 1992 - 2010: The Prevalence and Determinants of Bridge Jobs, Phased
Retirement, and Re-entry among Different Cohorts of Older Americans,’ The
Gerontologist, 55(3): 384-403.
Clark, R., R. Hanmond, M. Morrill, and A. Pathak (2015). ‘Working after
Retiring from Career Jobs: Worklife Transitions of Public Employees in North Carolina,’
Paper presented to 2015 SIEPR Conference Working Longer and Retirement, Stanford
University, October 2015.
Clark, R. and M. Morrill (2016). ‘Extending Worklife: Employer Interest and
Concerns,’ North Carolina State University Working Paper.
Goda, G. S., S. Ramnath, J. Shoven, and S. Slavov (2015). ‘The Financial
Feasibility of Delaying Social Secruity: Evidence from Administrative Tax Data,’ NBER
Working Paper No. 21544.
Knoll, M. and A. Olsen (2014). ‘Incentivizing Delayed Claiming of Social Security
Retirement Benefits Before Reaching the Full Retirement Age,’ Social Security Bulletin
74(4): 1-31.
211
Mitchell, O. S., J. Poterba, M. Warshawsky, and J. Brown (1999). ‘New Evidence
on the Money’s work of Individual Annuities,’ The American Economic Review, 89(5):
1299-1318.
Munnell, A. and A. Chen (2015). ‘Trends in Social Security Claiming,’ Center for
Retirement Research at Boston College Working Paper No. 15-8.
Shoven, J. and S. Slavov. (2013). ‘Efficient Retirement Design: Combining Private Assets
and Social Security to Maximize Retirement Resources.’ Stanford Institute for Economic
Policy Research Policy Brief. Stanford: CA: SEPR
Shoven, J. and S. Slavov (2014a). ‘Does It Pay to Delay Social Security?’ Journal of
Pension Economics and Finance 13(2): 121-144.
Shoven, J. and S. Slavov (2014b). ‘Recent Changes in the Gains from Delaying Social
Security,’ Journal of Financial Planning 27(3): 32-41.
Wisconsin Legislative Council (2013). ‘2012 Comparative Study of Major Public Employee
Retirement Systems,’ Wisconsin Legislative Council Issue Brief. Madison, WI: WLC.

212
Endnotes
1 The Wisconsin report compares important characteristics of retirement plans covering major
state and local retirement systems in the United States. Similar reports have been prepared bi-
annually since 1982 and are a useful source of pension characteristics and how they have
evolved over the past 30 years. Key characteristics of plans include normal and early retirement
provisions, contribution rates, vesting requirements, benefit formulas, COLAs, and actuarial
methods and assumptions. Many public plans have specific features that vary by when
employees were hired. For these plans, the report describes the features that apply to the most
recently hired employees.
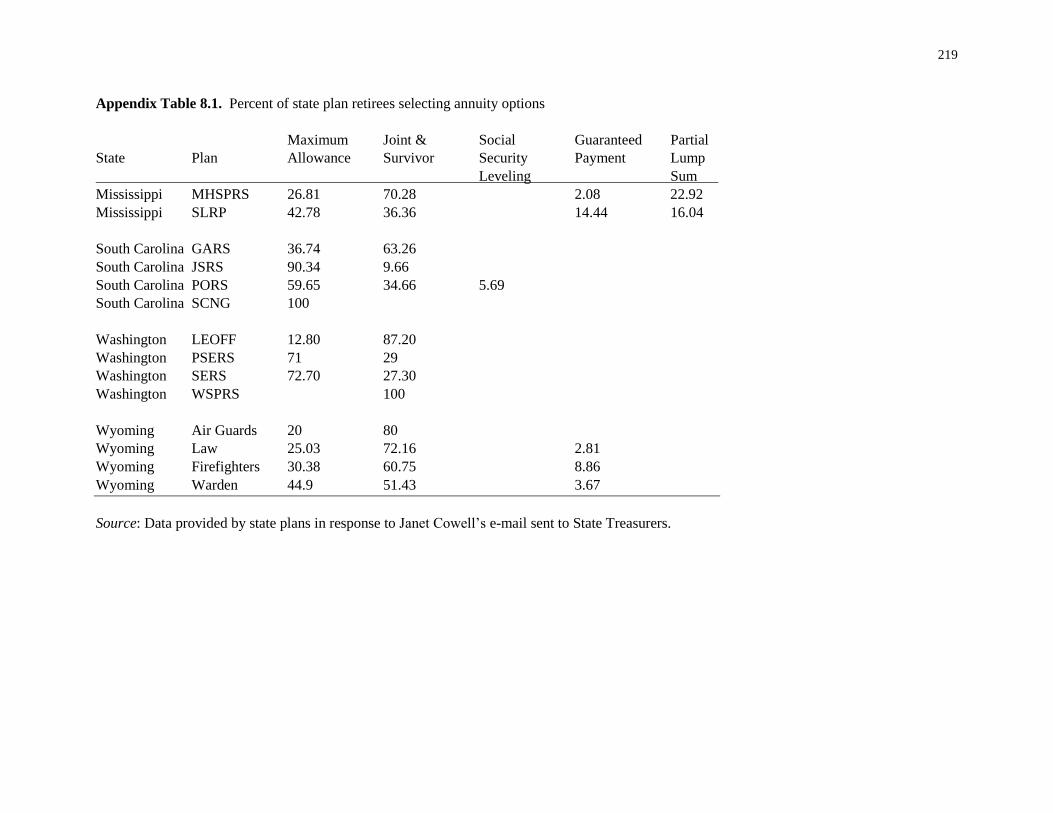
2 While these plans for specific types of employees are not included in the Wisconsin survey, we
did receive information from some of the states indicating the proportion of retirees in these
plans that selected specific types of annuities. See Appendix Table 8.1.
3 The options available to current retirees in each of the plans are reported in Appendix Table
8.2.
4 The benefit paid to the retiree who selects a joint and survivor option will depend on the age of
the beneficiary and benefit paid to the survivor relative to the benefit payable while the retiree
was alive.
5 In the private sector, most defined benefit plans do not require employee contributions. The
lump sum distribution is based on a calculation of the discounted present value of the promised
annuity.
6 The maximum benefit allowance in some plans includes a provision to provide a payment to
the survivor if the total pension payout has not exceeded the worker’s contributions to the plan.

213
7 Workers in 17 of the 85 plans are not covered by Social Security. Ten of these plans in which
participants are not included in Social Security cover only teachers.
8 The e-mail requested information on the proportion of retirees selecting each of the annuity
options. In some cases, certain options may no longer be offered so we observe some differences
in the annuity options that are shown in Appendix Table 8.2 and the responses to the survey
presented in Table 8.1.
9 Brown and Poterba (2000) examine the importance of joint life annuities and the demand for
this type of annuity by married couples.
10 It is important to remember that only individuals who retire prior to the specified age in the
leveling options would be able to select Social Security Leveling. Thus, the proportion of
eligible retirees selecting Social Security Leveling will be higher than the proportion of all
retirees choosing this annuity.
11 Cahill, Giandrea, and Quinn (2012 and 2015) use the Health and Retirement Survey to
document this type of return to work after retirement from a career job.
12 The retirement plans included in this study typically have several age and service requirements
that allow career employees to retire in their 50s with unreduced benefits. In 2012, 40 plans had
normal retirement requirements that allowed workers with 30 or fewer years of service to retire
at age 55 with unreduced benefits. Another 11 plans determine eligibility by the sum of an
individual’s age and service (“Rule of 85” or “Rule of 80”) which allows career employees who
began their employment in their 20s to receive unreduced benefits in their 50s. Public retirement
plans are now moving to increase normal retirement ages. According to Wisconsin Comparative
Study of major Plans, between the 2010 and 2012, 29 plans increased the requirements for
normal retirement.

214
13 Clark and Morrill (2016) provide a comprehensive review of retirement transitions including
workers remaining on career jobs until complete retirement, shifts into phased retirement, and
movement into bridge jobs or self-employment.
14 This calculation is based on the present value of $30,000 per year for 30 years is $588,013. If
the retirement system credits this balance with a 3 percent per year return for 10 years, the
account balance would be $793,734 at age 65. Again using a discount rate of 3 percent, the
annual payout for an expected 20 years would be $53,351. Thus, the increase in the annual
retirement benefit is due to the increase in the account balance from delaying the start of the
annuity and the shorter payout period associated with a higher age for starting the annuity. A 3
percent rate discount rate is consistent with the rate that most economists would recommend as
an approximation of the real interest rate. Most public pension plans use a much higher rate,
typically between 7 and 8 percent. Thus, we also provide the impact of using a higher interest
rate consistent with the assumption adopted by most plans.
15 Under current law, the full retirement age is schedule to rise to 67 for individuals born in 1960
or thereafter.
16 Knoll and Olsen (2014) describe how these reductions for claiming early and increases for
delaying claiming after the full retirement age have changed over time to provide increased
incentives for delaying the start of benefits. Based on their analysis and review of the literature,
they conclude that “delaying the claiming of Social Security retirement benefits is now
recognized as an important way to enhance retirement security.
17 Munnell and Chen (2015) find, using a cohort analysis, that the proportion of recent cohorts
claiming benefits at age 62 has fallen to 36 percent for men and 40 percent for women.
215
18 The impact of claiming age on monthly benefits is nicely shown in “When to Start Receiving
Retirement Benefits,” https://www.ssa.gov/pubs/EN-05-10147.pdf
19 For instance, the increase in the delayed retirement credit after the full retirement age, lower
real interest rates, and increases in life expectancy for individuals in their 60s.
20 Shoven and Slavov (2013) provide a detailed review of claiming options and how delaying the
start of Social Security benefits increases lifetime benefits.
21 This option is similar to the one used by Virginia SRS except we would allow the individual to
specify any age between 62 and 70 for the calculation of retirement benefit.
216
Figure 8.1. Annuity options in state-managed retirement plans: number of plans with each
option.
Notes: Maximum Allowance refers to the option that pays the highest monthly benefit to a retiring
member of a plan. This benefit is a lifetime benefit paid to the retiree on a monthly basis. At the
death of the retiree, all monthly benefits cease. This type of benefit is often called a single life
annuity. In some plans, the remaining balance due to employee contributions may be paid out in a
lump sum to a designated beneficiary at the death of the retiree. Joint & Survivor refers to the
option that pays a reduced benefit over the life of a retiree in return for allowing a designated
beneficiary to receive a percentage of the benefit after the retiree’s death. Plans often have various
options with the survivor benefit being equal to 100%, 75%, 50%, or 25% of the benefit payable
during the life of the retiree. Modified Joint & Survivor is an available provision for some of these
plans where monthly payments increase to the amount payable under the maximum allowance
upon the death of the beneficiary. Guaranteed payment refers to the option that guarantees a certain
number of payments to the retiree. If the retiree’s death occurs before receiving all of the monthly
payments, the remaining payments are made to the beneficiary until all payments have been made.
Social Security leveling refers to the option that pays larger monthly payments until the retiree is
eligible for Social Security at age 62. When the retiree becomes eligible to claim an early Social
Security benefit the monthly payments from the pension are reduced to a lower amount so the total
retirement income (pension + Social Security) remains the same. Finally, Partial lump sum refers
to the option that pays a one-time lump sum payment of a portion of the retiree’s retirement benefit,
plus a reduced monthly benefit payable for the retiree’s lifetime. The number of state plans with
each option is shown above each bar.
Source: Authors’ computations using data derived from state plan websites.
0
10
20
30
40
50
60
70
80
90
Maximum Allowance
Joint & Survivor Guaranteed payment
SS leveling Partial lump sum
217
Table 8.1. Percent of state retirees selecting annuity options
Maximum Joint & Social Guaranteed Partial
State Plan Allowance Survivor Security Payment Lump
Leveling Sum
California PERS 44.5 37.3 1.3 N/A N/A
California TRS 52.1 46.9 N/A N/A N/A
Delaware SEPP 100 N/A N/A N/A
Iowa PERS 9.4 38.2 0.4 32.8 19.2
Maryland SRPS 40.0 34.0 N/A N/A N/A
Mississippi PERS 65.8 22.0 N/A 7.6 21.1
Nebraska SPP 14.1 38.8 N/A 30.2 N/A
North Carolina TSERS 56.2 25.9 17.9 N/A N/A
North Carolina LGERS 55.7 34.6 9.7 N/A N/A
South Carolina SCRS 64.3 30.4 4.6 0.4 N/A
Washington PERS 65.2 34.8 N/A N/A N/A
Washington TRS 38.8 21.4 N/A N/A 39.8
Wyoming WRS 43.1 52.9 N/A 4.1 N/A
Notes: In some cases, plan managers reported retirees selecting annuity options that are not shown on
websites as being available to current retirees. This difference could be due to annuity options that were
offered to individual hired at earlier dates. Plans often have various tiers that cover individuals hired at
various times. The request to the Treasurers was to provide information on the proportion of retirees
selecting each of the options. California TRS participants are not included in Social Security.
Source: Data provided by state plans in response to Janet Cowell’s email to State Treasurers.
218
Table 8.2. Impact of deferred annuity on annual payouts and pension present values (PV)
Annuity Option Annual Payout PV @ 55 PV@ 60 PV@65
Maximum Allowance
3% interest $30,000 $588,013
7.25% interest $30,000 $363,110
Deferred Annuity: First benefit deferred until age 60
3% interest
Ages 55-64 $0 $588,013 683,174
Ages 65-84 $39,233
7.25% interest
Ages 55-64 $0 $363,110 $522,878
Ages 65-84 $45,884
Deferred Annuity: First benefit deferred until age 65
3% interest
Ages 55-64 $0 $588,013 $793,735
Ages 65-84 $53,351
7.25% interest
Ages 55-64 $0 $363,110 $749,724
Ages 65-84 $72,150
Notes: Values in table assume that the individual retires at age 55 and dies at age 85. Selecting
the maximum benefit allowance, the annual pension benefit is $30,000 if the retiree begins
receiving payments at age 55. The present value of $30,000 per year for 30 years at 3% discount
rate is $588,013 and $363,110 using a discount rate of 7.25%. Next, we assume that if benefits
are deferred, the retirement system pays an implicit annual return on the present value equal to
the assumed interest rate. The annual payouts at age 60 and 65 are derived by using the annuity
formula and the implied present value of the account balance at these ages. Calculations are
based on annual pension benefit paid at the end of each year. Values are derived using a real
interest rate of 3% per year and an interest rate in the range of that assumed by many state
retirement plans of 7.25% per year.
Source: Authors’ calculations.
219
Appendix Table 8.1. Percent of state plan retirees selecting annuity options
Maximum Joint & Social Guaranteed Partial
State Plan Allowance Survivor Security Payment Lump
Leveling Sum
Mississippi MHSPRS 26.81 70.28 2.08 22.92
Mississippi SLRP 42.78 36.36 14.44 16.04
South Carolina GARS 36.74 63.26
South Carolina JSRS 90.34 9.66
South Carolina PORS 59.65 34.66 5.69
South Carolina SCNG 100
Washington LEOFF 12.80 87.20
Washington PSERS 71 29
Washington SERS 72.70 27.30
Washington WSPRS 100
Wyoming Air Guards 20 80
Wyoming Law 25.03 72.16 2.81
Wyoming Firefighters 30.38 60.75 8.86
Wyoming Warden 44.9 51.43 3.67
Source: Data provided by state plans in response to Janet Cowell’s e-mail sent to State Treasurers.
220
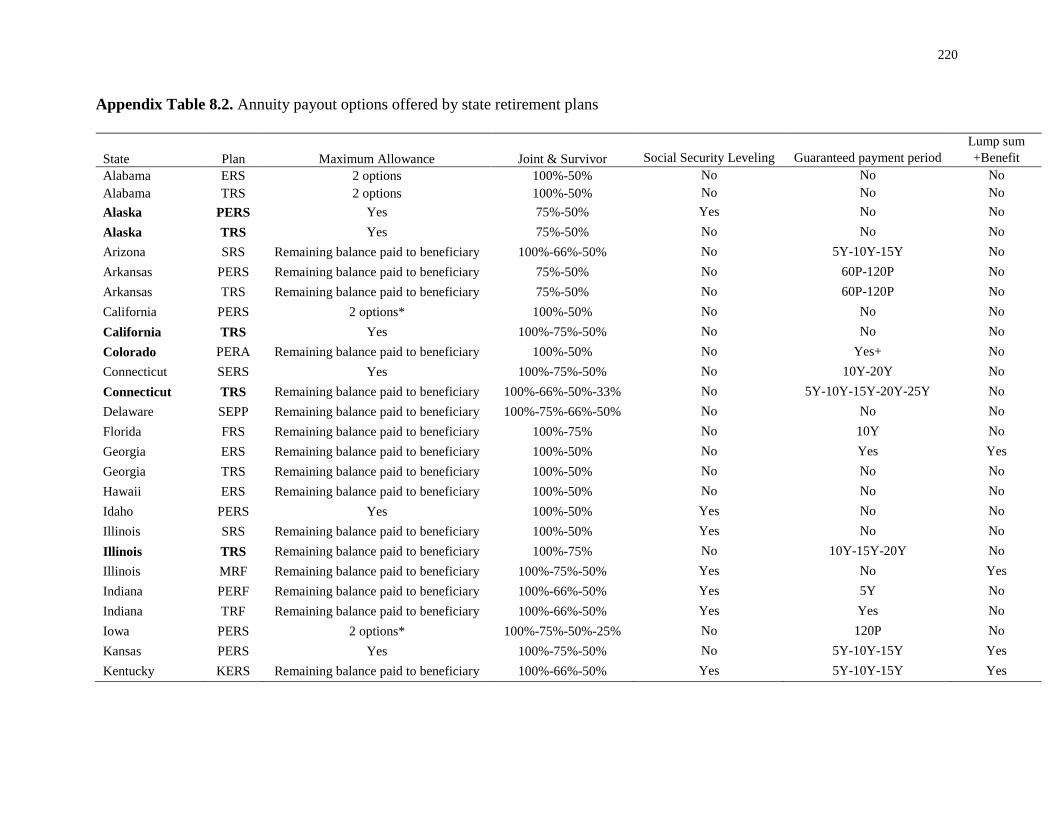
Appendix Table 8.2. Annuity payout options offered by state retirement plans
State Plan Maximum Allowance Joint & Survivor Social Security Leveling Guaranteed payment period
Lump sum
+Benefit
Alabama ERS 2 options 100%-50% No No No
Alabama TRS 2 options 100%-50% No No No
Alaska PERS Yes 75%-50% Yes No No
Alaska TRS Yes 75%-50% No No No
Arizona SRS Remaining balance paid to beneficiary 100%-66%-50% No 5Y-10Y-15Y No
Arkansas PERS Remaining balance paid to beneficiary 75%-50% No 60P-120P No
Arkansas TRS Remaining balance paid to beneficiary 75%-50% No 60P-120P No
California PERS 2 options* 100%-50% No No No
California TRS Yes 100%-75%-50% No No No
Colorado PERA Remaining balance paid to beneficiary 100%-50% No Yes+ No
Connecticut SERS Yes 100%-75%-50% No 10Y-20Y No
Connecticut TRS Remaining balance paid to beneficiary 100%-66%-50%-33% No 5Y-10Y-15Y-20Y-25Y No
Delaware SEPP Remaining balance paid to beneficiary 100%-75%-66%-50% No No No
Florida FRS Remaining balance paid to beneficiary 100%-75% No 10Y No
Georgia ERS Remaining balance paid to beneficiary 100%-50% No Yes Yes
Georgia TRS Remaining balance paid to beneficiary 100%-50% No No No
Hawaii ERS Remaining balance paid to beneficiary 100%-50% No No No
Idaho PERS Yes 100%-50% Yes No No
Illinois SRS Remaining balance paid to beneficiary 100%-50% Yes No No
Illinois TRS Remaining balance paid to beneficiary 100%-75% No 10Y-15Y-20Y No
Illinois MRF Remaining balance paid to beneficiary 100%-75%-50% Yes No Yes
Indiana PERF Remaining balance paid to beneficiary 100%-66%-50% Yes 5Y No
Indiana TRF Remaining balance paid to beneficiary 100%-66%-50% Yes Yes No
Iowa PERS 2 options* 100%-75%-50%-25% No 120P No
Kansas PERS Yes 100%-75%-50% No 5Y-10Y-15Y Yes
Kentucky KERS Remaining balance paid to beneficiary 100%-66%-50% Yes 5Y-10Y-15Y Yes

221
State Plan Maximum Allowance Joint & Survivor
Social Security
Leveling Guaranteed payment period
Lump sum
+Benefit
Kentucky CERS Yes 100%-66%-50% Yes 5Y-10Y-15Y Yes
Kentucky TRS Remaining balance paid to beneficiary 100%-50% No 10Y No
Louisiana SERS Remaining balance paid to beneficiary 100%-50% No No No
Louisiana TRSL 2 options* 100%-66%-50% No No No
Maine PERS 2 options* 100%-50% No No No
Maryland SRPS Remaining balance paid to beneficiary 100%-50% No No No
Massachusetts SERS 2 options* 66% No No No
Massachusetts TRS 2 options* 66% No No No
Michigan SERS Remaining balance paid to beneficiary 100%-75% Yes No No
Michigan MERS Remaining balance paid to beneficiary 100%-75%-50% No 5Y-10Y-15Y-20Y No
Michigan PSERS Remaining balance paid to beneficiary 100%-75%-50% Yes No No
Minnesota MSRS Remaining balance paid to beneficiary 100%-75%-50% No 15Y No
Minnesota PERA Remaining balance paid to beneficiary 100%-75%-50%-25% No No No
Minnesota TRA 2 options* 100%-75%-50% No 15Y No
Mississippi PERS Remaining balance paid to beneficiary 100%-75%-50% No 10Y-15Y-20Y No
Missouri SERS Remaining balance paid to beneficiary 100%-50% No 60P-120P No
Missouri LAGERS Yes 100%-75%-50% No No No
Missouri PSRS Remaining balance paid to beneficiary 100%-75%-50% No 60P-120P No
Montana PERS Remaining balance paid to beneficiary 100%-50% No 10Y-20Y No
Montana TRS Remaining balance paid to beneficiary 100%-66%-50% No 10Y-20Y No
Nebraska SEPP 2 options* 100%-75%-50% No 5Y-10Y-15Y No
Nebraska CEPP 2 options* 100%-75%-50% No 5Y-10Y-15Y No
Nebraska SPP 2 options* 100%-75%-50% No 5Y-10Y-15Y No
Nevada PERS Yes 100%-50% No No No
New Hampshire NHRS Remaining balance paid to beneficiary 100%-50% No No No

222
State Plan Maximum Allowance Joint & Survivor
Social Security
Leveling
Guaranteed payment
period
Lump sum
+Benefit
New Jersey PERS 2 options* 100%-75%-50%-
25% No No No
New Jersey TPAF 2 options* 100%-75%-50%-
25% No No No
New Mexico PERA Remaining balance paid to beneficiary 100%-50% No No No
New Mexico ERA Remaining balance paid to beneficiary 100%-50% No No No
New York ERS Yes 100%-75%-50%-
25% No 5Y-10Y No
New York TRS 2 options* 50% No 5Y-10Y No
North Carolina TSERS Yes 100%-50% Yes No No
North Carolina LGERS Yes 100%-50% Yes No No
North Dakota PERS Remaining balance paid to beneficiary 100%-50% No 10Y-20Y Yes
North Dakota TRF Remaining balance paid to beneficiary 100%-50% Yes 10Y-20Y Yes
Ohio PERS Remaining balance paid to beneficiary 100%-75%-66%-
50%-25% No No Yes
Ohio STRS Remaining balance paid to beneficiary 100%-50% No Yes+ Yes
Oklahoma PERS Yes 100%-50% No 10Y No
Oklahoma TRS Remaining balance paid to beneficiary 100%-50% No 120P Yes
Oregon PERS 2 options* 100%-50% No 15Y Yes
Pennsylvania SERS Remaining balance paid to beneficiary 100%-50% No No No
Pennsylvania PSERS Remaining balance paid to beneficiary 100%-50% No No Yes
Rhode Island ERS Yes 100%-50% Yes No No
South Carolina SCRS Remaining balance paid to beneficiary 100%-50% No No No
South Dakota SRS Remaining balance paid to beneficiary 66% Yes No No
Tennessee CRS Remaining balance paid to beneficiary 100%-50% Yes No No
Texas ERS Remaining balance paid to beneficiary 100%-75%-50% No 60P-120P Yes
Texas TRS Remaining balance paid to beneficiary 100%-75%-50% No No No
Texas MRS Remaining balance paid to beneficiary 100%-75%-50% No 60P-120P No
Utah SRS 2 options* 100%-50% No No No
Vermont SRS 2 options* 100%-50% Yes No No

223
State Plan Maximum Allowance Joint & Survivor Social Security Leveling Guaranteed payment period
Lump sum
+Benefit
Vermont TRS 2 options* 100%-50% Yes No No
Virginia SRS Remaining balance paid to beneficiary 100%-75%-66%-50%-25% Yes No Yes
Washington PERS Remaining balance paid to beneficiary 100%-66%-50% No No No
Washington TRS 2 options* 100%-66%-50% No No No
West Virginia PERS Yes 100%-50% No No No
West Virginia TRS Yes 100%-50% No 120P No
Wisconsin WRS Yes 100%-75% Yes 60P-180P No
Wyoming WRS 2 options* 100%-50% No 10Y-20Y No
Notes: Alaska also offers a 66% last survivor plan. The last survivor (retiree or beneficiary) gets 66% of the benefit. Employees in
state plans in bold are not covered by social security. Employees covered by plans shown in bold are not included in the Social
Security system.
Source: Authors’ derivations using data from all plan websites.