annualreport2017 - IOOF · Corporate directory ... Grand Hyatt 123 Collins Street ... alternative...
124
annualreport2017 Turn your life goals into a reality ioof.com.au
Transcript of annualreport2017 - IOOF · Corporate directory ... Grand Hyatt 123 Collins Street ... alternative...

CRA-
6580
annualreport2017
IOO
F Holdings | Annual Report 2017
Turn your life goals into a reality
ioof.com.au

ContentsAbout IOOF 1
Our major brands 2
Chairman and Managing Director’s commentary 3
Our �nancial performance 7
Directors 10
Environmental, Social & Governance report 13
IOOF Foundation 21
Financial report 23
Corporate directory(as at 28 September 2017)
Directors Mr George Venardos B.Com, FCA, FGIA, FAICD, FTIA Chairman
Mr Christopher Kelaher B.Ec, LL.B, F Fin Managing Director
Ms Elizabeth Flynn LL.B, Grad Dip AppCorpGov, FAICD, FGIA, FCIS, F Fin
Ms Jane Harvey B.Com, MBA, FCA, FAICD
Mr Allan Gri�ths B.Bus, DipLi
Mr John Selak Dip Acc, FCA, FAICD
Company Secretary Mr A Paul M Vine LL.B, FGIA, GAICD
Notice of Annual General Meeting The Annual General Meeting of IOOF Holdings Ltd will be held at:
Verandah Room Grand Hyatt 123 Collins Street Melbourne, Victoria 3000
Time 9.30am
Date 23 November 2017
A formal notice of meeting is available on our website and has been sent to shareholders
Principal registered o�ce in Australia Level 6, 161 Collins Street Melbourne, VIC 3000
(03) 8614 4400
Share registry Boardroom Pty Limited Level 12, 225 George Street Sydney NSW 2000
Auditor KPMG Tower Two, Collins Square, 727 Collins Street Docklands VIC 3008
Solicitors King & Wood Mallesons Level 50, Bourke Place 600 Bourke Street Melbourne VIC 3000
Bankers Commonwealth Bank Limited Tower 1, 201 Sussex Street, Sydney NSW 2000
Securities exchange listing IOOF Holdings Ltd shares are listed on the Australian Securities Exchange
(ASX: IFL)
Website address www.ioof.com.au
CRA-6580 IOOF Annual Report 2017 - COVER SPREADS_V4.indd 2-4 6/10/17 11:39 am

1
IOOF annual report 2017
About IOOFAt IOOF, we have been helping Australians secure their �nancial independence for over 170 years, and have grown to become a leading provider of quality �nancial advice, products and services.
Today, IOOF is one of the largest �nancial services group in Australia. We are an ASX top 100 company with $147.2 billion in funds under management, administration, advice and supervision, and we currently provide services to more than 500,000 customers around Australia.*
Our broad range of products and services means that our ability to provide tailored solutions to help our clients achieve their �nancial goals is unparalleled.
What does IOOF do?
IOOF provides a range of wealth management solutions for Australians, including:
Financial Advice and Distribution Services We believe in the value of �nancial advice. Whether provided through the organisations we partner with or our own extensive network of �nancial advisers and stockbrokers, our goal is to help clients build, maintain and protect their wealth.
Platform Management and Administration We o�er �nancial advisers, their clients and hundreds of employers around Australia leading superannuation and investment administration platforms. Our unique open architecture model means we not only o�er our IOOF platforms but selective leading external platforms to ensure advisers and their clients can choose the product and service solutions that best suit their individual needs.
Investment Management Through our investment management expertise, we o�er a range of highly rated multi-manager solutions that add value on several fronts; those being our active management of underlying investment managers, our dynamic asset allocation and our robust risk management approach. We also o�er a tax e�ective alternative to Super through our leading investment bond.
Trustee Services Our trustee business includes compensation trusts, estate planning and administration, personal trustee services, philanthropy, self-managed super fund (SMSF) solutions and corporate trust services.
* As at 30 June 2017
CRA-6580 IOOF Annual Report 2017 - EDITORIAL V6.indd 1 10/10/17 11:35 am

2
IOOF annual report 2017
2
Our major brands
IOOF Employer Super
Investment managementFinancial advicePlatform management
and administration Trustee
Corporate Trust
Private Client Services
Superannuation
IOOF Pursuit IOOF WealthBuilder
IOOF MultiMix
IOOF MultiSeriesIOOF PlatformConnect
IOOF Alliances
As at 28 September 2017
CRA-6580 IOOF Annual Report 2017 - EDITORIAL V6.indd 2 10/10/17 11:35 am

Meeting our commitments to clients, advisers and shareholders 2017 has delivered another year of consistent, strong �nancial performance.
IOOF’s unique value proposition
2017 was hallmarked by solid �nancial results and positive momentum in each of our businesses. During the year, we achieved outstanding funds growth, exceptional cost control and our underlying business performance metrics are on an upward trajectory. Our strong balance sheet remains and will allow us to capitalise on future growth opportunities when they arise.
Our advice-led wealth management strategy, multi-brand model and unique open architecture means that IOOF is an extremely attractive alternative for advisers looking to partner with a non-bank aligned dealer group. In addition, we have delivered on implementation of strategic initiatives – including ClientFirst and the IOOF Advice Academy – ensuring we are providing the level of service that often exceeds advisers’ and their clients’ expectations.
Chairman and Managing Director’s
Commentary
3
IOOF annual report 2017
Christopher KelaherGeorge Venardos
3
CRA-6580 IOOF Annual Report 2017 - EDITORIAL V6.indd 3 10/10/17 11:35 am

44
IOOF annual report 2017
Meeting commitments delivers shareholder value
Underlying pro�t for the year was $169.4m. For our shareholders, this strong �nancial performance translated into a total dividend for the full year of 53cps, fully franked.
This result is a testament to the continued hard work and dedication of all of our people, the Leadership Group and our fellow Board members. Thank you all for your ongoing commitment to delivering e�ciencies and generating long-term, sustainable shareholder value. value.
Strong organic growth continues
2017 saw IOOF recording an 18th consecutive quarter of positive platform net in�ows, with $1.2 billion of net in�ows. This is an increase of 130% vs 2016 and demonstrates that our commitment to service excellence is resulting in signi�cantly increased �ows.
Our adviser numbers continue to grow, which appears to be counter to industry trend. Advice net in�ows of $3.0 billion, up 131% vs 2016, included $976 million from 33 new advisers joining IOOF from another licensee. Our advice-led strategy is leading to record levels of interest in our advice businesses. Our open architecture approach continues to set us apart from our peers. The choice that this a�ords is a major reason why advisers choose to partner with an IOOF advice group, as it is a tangible demonstration of o�ering solutions which best service the needs of our advisers and their clients.
The value of �nancial advice
At IOOF, we believe in the value of �nancial advice. With our Advice Academy, we are committed to improving the quality of �nancial advice for all Australians, in addition to improving the e�ciency of its delivery.
Recently, 14 of the top 50 advisers in Barron’s inaugural survey of Australian �nancial advisers were IOOF employed or aligned. This was the highest number achieved by any institution and showcases that our advisers are delivering high quality �nancial advice and superior outcomes for their clients.
Focus on core capabilities
During the year, we continued to undertake activities to simplify and streamline our business. In 2017, we divested a number of small non-core businesses which allows us to focus on our core wealth management capabilities. In addition, with the major platform consolidation �nalised in June 2016, early completion of the MySuper transition, continual product enhancements and dedication to our ClientFirst approach, we are demonstrating our ongoing commitment to reducing complexity and duplication to best serve the interests of our advisers and their clients.
CRA-6580 IOOF Annual Report 2017 - EDITORIAL V6.indd 4 10/10/17 11:35 am

5
IOOF annual report 2017
Acquisition to bolster Trustee business strength
In June 2017, we announced the acquisition of National Australia Trustees Limited. Upon completion of the acquisition, IOOF will become the largest provider of compensation trusts in Australia. This acquisition demonstrates our commitment to building our Trustee business, enhancing our national presence and providing our clients with a range of �nancial solutions to meet their individual needs.
Environmental, Social and Governance matters
We are committed to ensuring Environmental, Social and Governance (ESG) practices are deeply embedded in our culture and we consider ESG as our responsibility to clients, shareholders and the communities in which we operate.
Our IOOF Foundation has continued its work in assisting some of our most disadvantaged communities. The Foundation has now surpassed the $12.5m mark in total donations since its formal establishment in 2001.
In 2017, we continued our journey to ensure we are appropriately monitoring and reporting our material ESG matters. Our ESG Report provides further details on our approach to material ESG matters, how these are linked to strategic initiatives and our assessment of their impact. We remain committed to the sector with our signi�cant shareholding in Australian Ethical, Australia’s largest dedicated ESG investment manager.
We encourage you to read the further detail on our ESG matters and the IOOF Foundation in our ESG report on page 13.
Board and Management changes
This year we welcomed three new non-executive Directors; John Selak, who joined the IOOF Holdings Limited Board, and Dawn Oldham and Martin Walsh, who joined our APRA Regulated Entity Boards. John, Dawn and Martin bring valuable experiences, skills and perspectives which bolster the existing strength of our Boards of Directors. We recognise the importance that individual skills and experiences can bring to ensuring diversity of thinking at Board level and at all sta� levels around the Group. The skills of our Directors are outlined in our Board Skills Matrix which can be found at www.ioof.com.au/about-us/about-ioof/corporate-governance
At Management level, 2017 saw us welcome Sharam Hekmat to the role of Chief Information O�cer. Sharam is also a member of the IOOF Leadership Group. Sharam joined IOOF at a time of signi�cant growth in IOOF’s technology capabilities following recent simpli�cation and enhancements to its platform o�erings and client experience.
In addition, Dan Farmer was appointed to the role of Chief Investment O�cer. Dan’s appointment followed the retirement of longstanding CIO, Steve Merlicek. Steve built a strong and capable investment team, testament to which is the elevation of Dan to the Chief Investment O�cer role. Dan has been with IOOF for seven years and during this time has played an integral part in the award winning team’s delivery of quality multi-manager investment solutions and strong performance. Steve will be remaining on IOOF’s Investment Management Committee.
Outlook
IOOF’s unique positioning in the industry sees us well placed to deliver positive long-term outcomes for our advisers, their clients and our shareholders. As the industry continues to consolidate, there is ample opportunity for acquisitive growth to augment our signi�cant organic growth momentum. We have an exceptional track record of delivering value-accretive acquisitions and have the scale, experience and, importantly, �nancial strength, to take advantage of these opportunities.
To our shareholders, the Board and management of IOOF thank you again for your support over this past year. We are excited by the prospects that our unique position in the wealth management industry present and look forward to continuing our track record of success.
George Venardos Chairman
Christopher Kelaher Managing Director
CRA-6580 IOOF Annual Report 2017 - EDITORIAL V6.indd 5 10/10/17 11:35 am

6
IOOF annual report 2017
We are excited by the prospects that our unique position in the wealth management industry present and look forward to continuing our track record of success.
CRA-6580 IOOF Annual Report 2017 - EDITORIAL V6.indd 6 10/10/17 11:35 am

7
IOOF annual report 2017
Our financial performance
divisional updates
■ Funds Under Supervision■ Investment Management■ Platform Management and Administration■ Financial Advice and Distribution
Funds by segment
June 2014 June 2015 June 2016 June 2017
$50.0b
$32.6b
$49.9b
$34.9b
$20.0b
$29.6b
$31.9b
$12.6b
$26.0b$19.6b
$27.0b
$131.1b$134.3b
$103.1b
$34.5b
$57.2b
$20.6b
$32.2b
$147.2b
$37.2b
Financial Advice & Distribution
% contribution to Group UNPAT
45%
$’m 2016/2017 2015/2016
Revenue 354.9 354.5
UNPAT 76.4 78.4
Closing FUA ($’b) 57.2 50.0
About the division
Our IOOF Advice division supports over 1,000 �nancial advisers and stockbrokers that provide �nancial advice services to over 500,000 clients across both retail and institutional sectors.
Advice covers wealth accumulation, retirement planning and investment strategies and is provided by our well-known brands Shadforth Financial Group, Bridges Financial Services, Consultum Financial Advisers, Lonsdale Financial Group and Ord Minnett.
Key activities
• Advice-led strategy delivers growth in adviser numbers – 50 advisers committed to join IOOF licenses, counter to industry trend.
• IOOF achieved the top ranking for the number of advisers in Barron’s inaugural survey of Australian �nancial advisers. Among the list of ‘Australia’s Top 50 Financial Advisers’, 14 out of 50 advisers and 4 out of the top 15, were IOOF aligned advisers.
• Business simpli�cation activities undertaken to divest non-core businesses. This allows us to focus on our core Wealth Management capabilities.
• Continued focus on quality of advice via our IOOF Advice Academy - a training and coaching resource for the �nancial planning industry helping advisers build high quality businesses that in turn helps clients to achieve their �nancial and lifestyle goals.
• Ongoing commitment to open architecture through PlatformConnect, providing IOOF with an attractive di�erentiator by o�ering real choice. Two key initiatives implemented during the year included:
– launch of the Symetry Active platform, including a managed account service to the Bridges Financial Services group; and
– launch of a superannuation version of Asset Administrator platform.
CRA-6580 IOOF Annual Report 2017 - EDITORIAL V6.indd 7 10/10/17 11:35 am

8
IOOF annual report 2017
Platform Management & Administration
% contribution to Group UNPAT
46%
$’m 2016/2017 2015/2016
Revenue 393.8 399.9
UNPAT 77.3 79.0
Closing FuAd ($’b) 37.2 34.5
About the division
Our platforms allow clients, employers and advisers to manage a wide range of superannuation and investment options, including managed and listed investments. Our �agship platforms are IOOF Pursuit and IOOF Employer Super.
Key activities
• Launch of a brand new adviser website for IOOF Employer Super featuring a powerful search facility, enhanced reporting and transaction capabilities as well as the ability for advisers to grant access to their support sta�. The launch of this website consolidated �ve adviser portals into one convenient location.
• Upgrade of the member website for IOOF Employer Super including simpli�ed trading for both managed and listed investments, functionality for members to update their investment strategy, personalised performance information, and the visual representation of their account balance over time.
• A new reweight portal was released for IOOF Pursuit which allows advisers to rebalance their client’s portfolio in percentages and automatic reweights gave advisers the ability to nominate an investment strategy which is reviewed and rebalanced at the chosen frequency.
• Other IOOF Pursuit enhancements included the addition of an online pension application form and reporting for regulatory change such as capital gains/losses for pensions, rate of return for closed accounts, client deposit reporting, and fee reporting.
• Consolidation of the Kingston Superannuation Trust into IOOF Pursuit Select completed in March 2017. This is another tangible example of our commitment to reducing complexity and duplication to deliver better outcomes for our clients.
• Successful transfer of Accrued Default Amounts (ADA) from an external non-MySuper authorised superannuation fund to IOOF MySuper within IOOF Employer Super.
Investment Management
% contribution to Group UNPAT
19%
$’m 2016/2017 2015/2016
Revenue 84.1 101.2
UNPAT 32.7 31.4
Closing FuM ($’b) 20.6 19.6
About the division
Our investment management business o�ers multi-manager products that are easy to understand with well-rounded investment options across a range of asset classes. In addition, the Wealthbuilder investment bond products and the equity accounted contribution from our 42% stake in Perennial Value Management are reported in this segment.
Key activities
• Dan Farmer appointed Chief Investment O�cer following the retirement of Stephen Merlicek – (e�ective 3 July 2017). Stephen Merlicek to remain on IOOF Investment Committee.
• Stanley Yeo appointed Deputy Chief Investment O�cer (May 2017).
• Successful launch of the low-cost multi-manager range of funds, IOOF MultiSeries in October 2016 to complement the award winning fully active IOOF MultiMix range of funds.
• Following the upgrade of IOOF MultiMix International Shares Trust and IOOF MultiMix Australian Equities Trust to ‘Recommended’, the full suite of IOOF multi-manager funds are now rated as ‘Recommended’ by Lonsec. The IOOF MultiSeries range on its debut was given this ‘Recommended’ rating – a fantastic achievement for a new range of funds.
• Launch of an online client engagement tool for advisers called Investment Central, allowing more transparency and enhancing the conversation on the multi-manager investment solution.
• IOOF WealthBuilder celebrated 35 years of the bond in 2016 and continues to grow in popularity for when super is not an option.
CRA-6580 IOOF Annual Report 2017 - EDITORIAL V6.indd 8 10/10/17 11:35 am

9
IOOF annual report 2017
Trustee Services
% contribution to Group UNPAT
4%
$’m 2016/2017 2015/2016
Revenue 30.8 29.6
UNPAT 6.7 6.0
Closing FuS ($’b) 32.2 27.0
About the division
Our Trustee Services business includes estate planning, estate administration, compensation trust services, �duciary services, philanthropic services and corporate trust services, operating under the brand Australian Executor Trustees (AET). AET is also a specialist provider of self-managed super fund (SMSF) solutions including the AET Small APRA Fund.
Acquisition of National Australia Trustees
In June 2017, IOOF announced the acquisition of National Australia Trustees (NATL).
• On completion of the purchase, IOOF will:
– become Australia’s largest provider of compensation trust services for personal injury clients.
– increase its distribution network on the East Coast of Australia.
– expand its Wills bank.
– deepen its capability towards becoming Australia’s preferred Trustee.
Key activities
• Signi�cant growth from the compensation trust and Native Title Trust businesses – particularly in the Western Australian market.
• Successful partnerships with industry bodies including the Australian Lawyers Alliance (ALA) and the SMSF Association.
• Stronger alignment between the AET and IOOF Distribution and Operations teams to provide specialist estate and trustee solutions to advisers and their clients.
• Importantly, AET continues to be a highly complementary business to IOOF. AET’s advice partners direct funds under supervision for compensation trusts, Native Title trusts, philanthropic trusts to IOOF platforms.
• Development of a national estate planning o�ering.
We believe that success comes from caring about people and providing quality �nancial advice, product and service solutions.
CRA-6580 IOOF Annual Report 2017 - EDITORIAL V6.indd 9 10/10/17 11:35 am

10
IOOF annual report 2017
Directors Mr George VenardosB.Com, FCA, FGIA, FAICD, FCIS
Chairman – Independent Non-Executive Director
Independent Non-Executive Director since 2009
Mr Venardos is an experienced director with broad listed company experience across a range of di�erent industries including �nancial services, a�ordable leisure, oil and gas services and technology development.
Mr Venardos has over 30 years’ experience in executive roles in �nancial services, insurance and funds management. For a period of 10 years, Mr Venardos was the Chief Financial O�cer of Insurance Australia Group and Chairman of the Insurance Council of Australia’s Finance and Accounting Committee.
Mr Venardos was a director of Miclyn Express O�shore Ltd from 2010 to 2013, Bluglass Ltd from 2008 to 2016 and Ardent Leisure Group from 2009 to 2017.
Signi�cant non-listed directorships
• Chairman of Guild Group
• Cuscal Ltd
• Lawcover Pty Ltd
Special responsibilities
• Chairman of IOOF since November 2016
• Chairman of the Nominations Committee
• Member of the Group Audit Committee
• Member of the Remuneration Committee
CRA-6580 IOOF Annual Report 2017 - EDITORIAL V6.indd 10 10/10/17 11:35 am

11
Mr Christopher KelaherB.Ec, LL.B, F Fin.
Managing Director
Managing Director since 2009
Mr Kelaher is the Managing Director of IOOF Holdings Ltd. He was appointed in 2009, after IOOF’s merger with Australian Wealth Management Limited (AWM), a company he had led since 2006. Prior to AWM, Mr Kelaher was the CEO of Select Managed Funds Limited for nine years, a private company which was brought to market in 2005 and in turn ultimately merged with AWM in 2006. In the following periods, he has been instrumental in executing multiple mergers and acquisitions that have added materially to the IOOF Group and its antecedent businesses. Mr Kelaher has extensive capital markets experience from his time during the late 1980s with Citicorp where he oversaw the establishment of Citicorp Investment Management and Global Asset Management businesses in Australia and New Zealand.
He holds a Bachelor of Economics and a Bachelor of Laws from Monash University and is a Fellow of the Financial Services Institute of Australia.
Special responsibilities
• Managing Director of the IOOF Group since 2009
• Member of the Nominations Committee
Ms Elizabeth FlynnLL.B, Grad Dip AppCorpGov, FAICD, FFin, FGIA, FCIS.
Independent Non-Executive Director
Independent Non-Executive Director since 2015
Ms Flynn has more than 30 years’ experience in the �nancial services industry, including roles within law and corporate governance as well as executive responsibilities. From 1998 to 2010, Ms Flynn was the Chief Legal Counsel, Group Compliance Manager and Group Company Secretary of �nancial services group Aviva Australia, and a director of NULIS Nominees, Aviva Australian’s superannuation trustee company. Prior to her time at Aviva, Ms Flynn spent 18 years as a commercial lawyer with Minter Ellison, including eight years as a partner, specialising in managed funds, banking and securitisation and superannuation. Ms Flynn was a director of Bennelong Funds Management from 2010 to 2015.
Signi�cant non-listed directorships
• AIA Australia Limited
• Victorian Government’s Emergency Services Superannuation Board
Special responsibilities
• Chair of the Risk and Compliance Committee
• Member of the APRA Regulated Entities Audit Committee
• Member of the Remuneration Committee
IOOF annual report 2017
CRA-6580 IOOF Annual Report 2017 - EDITORIAL V6.indd 11 10/10/17 11:35 am

12
IOOF annual report 2017
Ms Jane HarveyB.Com, MBA, FCA, FAICD
Independent Non-Executive Director
Independent Non-Executive Director since 2005
Ms Harvey has more than 30 years’ experience in the �nancial and advisory services industry. Prior positions include as a Partner at PricewaterhouseCoopers, a Director of David Jones Limited from 2012 to 2014, a Director of UGL Limited from 2015 to 2017, and as a Director of DUET Finance Limited, a stapled entity within the ASX Listed DUET Group from 2013 to 2017.
Signi�cant non-listed directorships
• Bupa Health Services Pty Ltd
• Opera Victoria Ltd
• Colonial Foundation Ltd
Special responsibilities
• Chair of the Group Audit Committee
• Member of the APRA Regulated Entities Audit Committee
• Member of the Nominations Committee
Mr Allan Gri�thsB.Bus, DipLi
Independent Non-Executive Director
Independent Non-Executive Director since 2014
More than 30 years’ experience with a deep understanding of the �nancial services industry. Mr Gri�ths has held a number of executive positions within the industry most notably as Chief Executive O�cer Aviva Australia and later Managing Director South Asia, Aviva Asia Pte Ltd based in Singapore. Prior to joining Aviva he held executive positions with Colonial Ltd and Commonwealth Bank of Australia.
Signi�cant non-listed directorships
• Chairman of the Westpac/ BT Insurance Boards
• Chairman of Metrics Credit Partners
• CARE Australia
Special responsibilities
• Chairman of the Remuneration Committee
• Member of the Group Audit Committee
Mr John SelakDip Acc, FCA, FAICD
Independent Non-Executive Director
Independent Non-Executive Director since 2016
Mr Selak has over 40 years’ experience in the �nancial and advisory services industry. From 2000 to 2016 he was a partner in the Corporate Finance Practice of Ernst & Young, providing valuation services to a broad range of local and international clients and also serving on their Global Corporate Finance Executive.
Signi�cant non-listed directorships
• Chairman of Corsair Capital
• National Tiles
• Advisory board member of Turi Foods
Special responsibilities
• Chairman of the APRA Regulated Entities Audit Committee
• Member of the Risk and Compliance Committee
• Member of the Group Audit Committee
Directors
CRA-6580 IOOF Annual Report 2017 - EDITORIAL V6.indd 12 10/10/17 11:35 am

13
IOOF annual report 2017
Environmental Social and Governance
reportOur ethics, values and culture are key factors to our continued success. Environmental, Social & Governance (ESG) practices are about managing risks and opportunities in a way that balances the long term needs of stakeholders, including customers, employees, shareholders, suppliers, the community and the environment.
Material exposure to Environmental and Social Sustainability RisksThere are a number of material ESG matters that impact the IOOF Group, the achievement of our strategic aims and the communities in which we operate.
In determining our material ESG matters, the Board considers our business model, the industry in which we operate, current areas of focus of our regulators, media and public commentary and the interests of our stakeholders, including industry bodies, investors and analysts.
Material ESG matters and their link to our strategic initiatives are outlined below.
Governance
Cultu
re
Stakeholder Material ESG matter Strategic initiative
Our business
• Corporate Governance
• Establishing trusted relationships with advisers
• Responsible investment
• Tax transparency
• Climate change and the environment
• ClientFirst
• Open Architecture
• Advice Academy
• Business simpli�cation
Our clients & community
• Acting in the best interests of our clients
• Advocating for quality �nancial advice for all Australians
• ClientFirst
• Advice Academy
Our people
• Diversity and inclusion
• Corporate culture and attracting and retaining talent• Engagement
The IOOF corporate brand and our reputation as a leading provider of quality �nancial services could be damaged by failing to identify, monitor and report our material ESG matters.
CRA-6580 IOOF Annual Report 2017 - EDITORIAL V6.indd 13 10/10/17 11:35 am

14
IOOF annual report 2017
Our businessAt IOOF, we believe in the value of �nancial advice. In today’s complex and ever-changing �nancial world, it has never been more important for people to seek quali�ed and experienced guidance to secure their �nancial future. One of our major goals is to make it easier for all Australians to access and bene�t from receiving the right advice for their individual needs and objectives. ESG practices are deeply embedded in our day to day operations and to the creation of long-term �nancial outcomes for our advisers, clients and shareholders.
1 IOOF: The true value of advice (2015)
Corporate GovernanceRobust corporate governance policies, practices and procedures are a fundamental part of our culture and lay the foundations that underpin everything we do.
IOOF has adopted Listing Rule 4.10.3 which allows companies to publish their corporate governance statement on their website rather than in their annual report. The Directors of IOOF have reviewed and approved the statement, which is available at: www.ioof.com.au/about-us/about-ioof/corporate-governance
Establishing trusted relationships with advisersAt IOOF, we recognise the true value of advice and, because of this, we have trusted relationships with over 1,000 �nancial advisers.
The true value of advice
IOOF undertook a survey of 521 advised and non-advised clients and discovered that those who receive ongoing �nancial planning advice experience1:
• 13% greater levels of overall personal happiness.
• 21% overall increase in peace of mind.
• 19% less likelihood to have arguments with loved ones.
Meanwhile those who don’t receive �nancial advice were:
• 22% more likely to have their sleep disrupted due to money concerns.
• 15% more likely to feel stress and anxiety.
• 11% more likely to feel concerned about their �nances.
Responsible investmentOur multi-manager investment management o�ering ensures ESG factors are considered by underlying investment managers in their investment decision-making processes in order to protect and manage investments for the long term.
In 2017 an ESG clause was added to all of our Investment Management Agreements with external fund managers. These managers must now identify and manage risks associated with ESG as part of their investment process.
In addition, IOOF has a 20% shareholding in Australian Ethical (ASX: AEF). This represents a long-standing commitment to responsible investing with our initial investment dating back to 2005.
Tax TransparencyThe IOOF Group is committed to tax transparency and integrity. IOOF is a signatory to the Board of Taxation’s Voluntary Tax Transparency Code (the Code), which was released on 3 May 2016.
The Code is a set of principles and ‘minimum standards’ to guide disclosure of tax information by businesses, encourage those businesses to avoid aggressive tax planning, and to help educate the public about their compliance with Australia’s tax laws.
Tax strategy and governance
Tax governance is part of the IOOF Group’s overall risk management framework, as well as being part of an overall tax strategy. The overall tax strategy drives the IOOF Group’s approach to tax risk management and is aimed at good corporate tax compliance and reporting, the ability to meet and be prepared for regulatory changes, and in ensuring shareholder value. The IOOF Group regards its relationship with the ATO as e�ective and open, thereby maintaining transparency and collaboration.
In addition, 83% of clients surveyed endorsed the value of �nancial advice by saying it’s also important for their loved ones to have good �nancial advice.
A �nancial adviser provides the peace of mind of a well thought out plan which ensures better preparation for the future. Also, advice extends beyond measurable �nancial gains, to improved physical health, stronger relationships and personal happiness.
Due to our advice-led wealth management strategy, we are seeing record levels of interest in our advice businesses. In 2017, this has resulted in 33 new advisers joining IOOF since 31 December 2016 from another large �nancial institution, with further growth in adviser numbers targeted.
New advisers can join one of IOOF’s Advice Groups subject to meeting minimum adviser education standards and undergoing rigorous compliance and onboarding processes, to ensure that the quality of �nancial advice IOOF is o�ering our clients is uncompromised.
In addition to our advice-led strategy, IOOF o�ers open architecture. This means that our advisers have the choice to use our platform, or those of competitors. Choice of products and services presents a fundamental di�erence from our peers in the industry. This is a major reason for advisers to choose to partner with an IOOF advice group and a tangible demonstration of o�ering solutions which best service our advisers and their clients’ individual needs.
Our IOOF Advice Academy ensures we are at the forefront of advocacy for improving the quality of �nancial advice. Further information on our Advice Academy can be found in the ‘Our clients & community’ section of this report.
CRA-6580 IOOF Annual Report 2017 - EDITORIAL V6.indd 14 10/10/17 11:35 am

15
IOOF annual report 2017
Tax contribution analysis
The IOOF Group contributed a total of $131.5m in taxes to Australian, New Zealand and Hong Kong governments (state and federal) in the 2017 tax year. $131.0m or 99.6% of this amount was attributable to the Australian Government. The below tables provide an analysis of the types of taxes the IOOF Group is liable for and those payable in Australia versus those in foreign jurisdictions.
Further detail on tax paid by the IOOF Group can be found in note 2-6 to the �nancial statements within this Annual Report.
Climate change and the environmentClimate change presents signi�cant challenges for society and generates both risks and opportunities for IOOF’s business and stakeholders. As a diversi�ed �nancial services company, we seek to minimise our impact on the environment through a range of waste, energy and emission-reduction activities.
Environmental impact
During 2017 we commenced a signi�cant project to consolidate our property footprint, which will better enable us to monitor and manage our environmental impact.
In Melbourne, our current corporate headquarters is undergoing signi�cant refurbishment. We expanded our existing �oorplan to enable all Melbourne based sta� to work in one energy e�cient o�ce building from the end of September 2017.
Once stage 1 building works are complete, a 4 Star NABERS Energy Rating is targeted, with the intention to target a 4.5 Star NABERS rating once all stage 2 building works are complete. A designated waste area with a co-mingled recycling capability is also planned for the completed building to ensure we are managing our waste outputs in an environmentally sustainable way.
In Sydney, we are moving all of our people to 30 The Bond by the end of December 2017; a 5.5 Star NABERS rated building. Environmental sustainability and enablement of our people were signi�cant factors in choosing this building. Combining heritage preservation and modern day environmentally sustainable design, the building o�ers some of the largest �oor plates in Sydney which provides for optimum workspace e�ciency, integration and sta� interaction. It has a 3.5 Star NABERS water rating and a 5 Green Star rating, meaning it is currently one of the most environmentally sustainable buildings in Sydney.
We will seek to measure, report and incrementally improve our emissions year on year, once the move to our new premises has completed in our major locations.
Other environmental activities
We also continue to seek better ways to minimise our environmental impact, including:
• Working with contractors, landlords and service providers to increase waste recycling. Outside of our major o�ce movements, we continue to work with our landlords in all locations to ensure we are limiting our waste emissions and will look to report on total overall improvements as part of our annual ESG reporting process.
• Reducing non-essential air travel. During 2017, we upgraded our internal communications system to better facilitate video conferencing in all of our o�ce locations. In July 2017, we changed our corporate air travel arrangements to a single provider for all domestic and international travel.
• Encouraging employee work practices that reduce environmental impacts. To encourage a move to a paperless environment, during 2017 we implemented ‘Follow Me’ printing to reduce unnecessary printing of documents and paper wastage.
2017 tax contribution by type (total $131.5m)
2017 tax contribution by country (total $131.5m)
Income Tax $70.4mGST $45mPayroll Tax $12.2mFringe Bene�ts Tax $1.3mOther $2.6m
Australia $131mNew Zealand $0.495mHong Kong $0.005m
CRA-6580 IOOF Annual Report 2017 - EDITORIAL V6.indd 15 10/10/17 11:35 am

16
IOOF annual report 2017
Our clients and communityOver 170 years ago, IOOF was established with a commitment to helping people and positively contributing to the communities we serve. This commitment remains unchanged.
Advocating for quality �nancial advice for all AustraliansOur unique advice-led wealth management strategy is di�erentiating us from our peers and is focused on delivering quality �nancial advice to all Australians.
As one of Australia’s leading �nancial services businesses, we are pleased to be investing in the continued improvement in the quality of advice for the bene�t of all Australians.
In July 2016, we launched the IOOF Advice Academy, which aims to be the pre-eminent training and coaching resource for the �nancial planning industry. Our vision for the IOOF Advice Academy is to create an environment where ongoing �nancial planning relationships deliver continued mutual value and enable our clients to live their ideal lives and be free of �nancial concern.
The 2017 target for participation in the IOOF Advice Academy was 10% of our adviser base. For the 2017/18 year, the IOOF Advice Academy is fully subscribed, with 100 advisers scheduled to commence various modules of the Academy.
In addition to our investment in the quality of �nancial advice via the IOOF Advice Academy, 14 of the top 50 advisers in Barron’s inaugural survey of Australian �nancial advisers were IOOF employed or aligned. This was the highest number achieved by any institution. This result showcases that our advisers are delivering high quality �nancial advice and superior outcomes for their clients.
ourAdvice Academy
Enabling advice businesses and their clients to achieve
their ultimate measure of success
Objectives and outcomes based advice framework
Integrated advice philosophies
Developing industry talent
Coaching focused on client progression
Practice support and team member training
Tools, templates and education
CRA-6580 IOOF Annual Report 2017 - EDITORIAL V6.indd 16 10/10/17 11:35 am

17
IOOF annual report 2017
Acting in the best interests of our clientsSupported by robust corporate governance foundations, IOOF is committed to our ClientFirst strategy. In an environment where product has become a commodity, and technology can be easily replicated, client experience is fast becoming a sustainable competitive advantage.
ClientFirst is much more than changing a process or a technology system. It’s about completely changing the way we work. It requires us to systematically understand client demand types, variation and the roles all people through the organisation play in delivering demand. ClientFirst is about revealing unmet client needs, reframing client problems, and helping us to rethink the entire client experience.
Giving back to our communities
IOOF Foundation
Since its formal establishment in 2001, the IOOF Foundation has donated more than $12.5 million to community groups across Australia. Our IOOF Foundation develops strong partnerships with non-pro�t organisations that are bringing opportunities to those less fortunate and are helping communities to grow and thrive.
We have continued our �nancial support for programs that support the aged, disadvantaged families, children and young people. In 2017, we also maintained our focus on programs that improve �nancial literacy to support young people in making con�dent and informed choices about their money.
Further information on the programs that have been supported by the IOOF Foundation, can be found on page 21 of this report.
Reconciliation Action Plan
We believe that all Australians can contribute to the reconciliation of the nation. With this in mind, two of our businesses, AET and Shadforth Financial Group (SFG) are coming together to develop a joint Reconciliation Action Plan (RAP). The purpose of the RAP is to promote and facilitate reconciliation by building relationships, respect and trust between the wider Australian community and Aboriginal and Torres Strait Islander peoples. The AET / SFG Reconciliation Action Plan will articulate clearly how AET and SFG will play their part in achieving this goal. AET and SFG have committed to completing their Reconciliation Action Plan by the end of 2017.
PR
OD
UC
T & D
I STR IBUT ION ADV ICE OPERATION
S
GO
VE
RN
AN
C E S E R V I C E S F I N A N C E TE C H
NO
LOG
YPURPOSE
ME
AS U
R E S M E T HO
DSClients
Vision andLeadership
Knowledge and documentation
ImprovementVisual
Management
PlanningOperating
rhythm
Data drivendecisionmaking
Systemcapability
Coachingand
capability
Celebratesuccess
Deep alignment on culture and new operating model around our clientsTrusted by clients and partners as a leader in advice and �nancial services.
Leadership developmentInvesting in our leaders to help them better support our people. Our leaders meet quarterly to discuss progress.
Knowledge and documentationWe have documented processes from a client perspective. This is revealing signi�cant opportunity to innovate and redesign the way our clients interact with us.
Our peopleAre embracing our ClientFirst strategy. It is
driving empowerment and enablement. New methods and measures emerging.
Date driven decision makingCapturing new data that reveals ‘what
really matters’ to clients. Building new capability to utilise the data to
deliver more value for clients.
ImprovementEmpowering our people and leaders to
solve client problems in ‘the moment’. New support tools and techniques to identify
and address the root cause of client issues.
CRA-6580 IOOF Annual Report 2017 - EDITORIAL V6.indd 17 10/10/17 11:35 am

18
IOOF annual report 2017
Our peopleOur people are our most important asset. Our success depends on them.
Corporate culture & attracting and retaining talent
We are committed to attracting and retaining the best talent. We recognise the value of diversity and embrace an inclusive culture where people from diverse backgrounds, with di�erent skills, knowledge and experiences can develop their unique talents.
Our culture is underpinned by four core values;
• Commitment – We do what we say we will do. We persevere in the face of challenges.
• Excellence – We search for ways to improve. We strive to exceed expectations.
• Empathy – We listen, we feel and we care. We treat each other with respect.
• Trust – We act honestly, openly and reliably. We nurture positive working relationships.
Development of our people
Equipping our people with the right tools, knowledge and development opportunities is an investment we make for our future success. IOOF has a number of initiatives to support all of our people, including career development and planning, extensive tailored learning and development opportunities and commitment to �nancial study support.
These programs not only provide scope to extend individual skills, but remain critical to succeed in a complex and competitive industry landscape. All employees are encouraged to set personal development plans with their managers and to undertake training which is appropriate for their role and future career aspirations.
We have been holding innovation events to harness the creativity and abilities of our people. These innovation days invite our people to form multi-disciplinary teams and generate innovative ideas for new services and products. The best ideas have moved into an incubation stage with funding for further development.
Employee engagement and alignment
In August 2016, we undertook a comprehensive survey of our people in order to identify opportunities to further improve employee engagement and alignment. Employee engagement and alignment is a critical requirement for achieving sustainable high performance. The survey was completed by 73% of our people across the entire IOOF Group.
Using the results of this survey, we implemented initiatives to develop and foster improved employee engagement which will lead to increased job satisfaction for our people. During 2017, some of the group-wide initiatives have introduced are:
• Our renewed Purpose Statement.
• Leadership Group Webinars showcasing strategic areas of focus.
• Inspire (Sta� Newsletter).
• Refreshed IOOF values and behaviours.
• New platform for IOOF Performance Management.
• Leadership programs.
To ensure we were on the right track in key areas, in early 2017, we undertook a ‘pulse survey’ with a focus on �ve key areas; Alignment, Engagement, Long Term Direction, Team Leadership and Investment in People.
The 2017 Pulse Survey results show that we have made improvements in all of these key areas. We look forward to continually improving to ensure we are building a workplace which attracts and retains the best talent.
Commitment to balance and encouraging community participation
We o�er a range of programs and services to employees to help achieve an appropriate balance between work and family. As well as o�ering �exible work arrangements, we provide our employees with a range of additional bene�ts
CRA-6580 IOOF Annual Report 2017 - EDITORIAL V6.indd 18 10/10/17 11:35 am

19
IOOF annual report 2017
Salary packaging
IOOF o�ers employees a range of salary sacri�ce options:
• Additional superannuation contributions.
• Motor vehicle novated leasing.
• Car parking, where available.
• Workplace charitable giving program.
Work �exibility
To enable our people to make arrangements about their working conditions to suit their personal circumstances, IOOF provides a range of �exible working arrangements:
• Opportunity to purchase additional annual leave.
• Eight weeks paid parental leave.
• Job share.
• Community Day.
Leisure and Lifestyle Bene�ts
We believe in promoting a healthy work/life balance and, to assist with this, IOOF o�ers:
• Con�dential Employee Assistance program (EAP).
• Wellbeing program including Nutrition checks, Health Heart check and Flu vaccinations.
• IOOF’s iBene�ts program – exclusive access to discounted gift cards, e-gift cards and discounts at large retailers and leisure outlets.
• Gymnasium discounts.
• Service awards.
• Recruitment referral bonuses.
• Study leave and CPD support.
• One Professional membership paid annually.
• Preferred health insurance rates with select insurers.
• Discounted public transport tickets (Victoria).
• IOOF Pursuit Select sta� rates.
Volunteering and giving
For the last decade, we have supported employees who are interested in volunteering through the use of paid volunteer leave. This equates to more than 16,000 hours of volunteer time available for our people.
Activities ranged from cooking at homeless shelters, supporting Christmas giving programs, looking after neglected/ maltreated animals, to supporting local school programs and providing gardening support. Organisations assisted include Hobart City Mission, RSCPA, Wesley Mission, Salvation Army and Easy Gardens.
Our people actively support a number of key community initiatives in our o�ces throughout the year. In 2017, some of the initiatives we supported include the Cancer Council’s Biggest Morning Tea, Fight Cancer Foundations ‘Footy Colours Day’, RSPCA ‘Cupcake Day’, Legacy Appeal, R U OK day and Earth Hour.
Our Workplace Giving program encourages all of our people to make a tax-e�ective donation that IOOF matches dollar for dollar. This is a simple and e�ective way for our people to make small regular donations. We have committed to invest further in this program, moving to a new online platform and expanding the number of organisations we will support. We have listened to our employees and understand that it is important to give them a choice in where they give their time and money, which encourages greater participation.
CRA-6580 IOOF Annual Report 2017 - EDITORIAL V6.indd 19 10/10/17 11:35 am

20
IOOF annual report 2017
Diversity and inclusion People with di�erent skills and experience and from di�erent backgrounds bring fresh ideas and perspectives. IOOF acknowledges diversity as critical to enabling innovation and broader thinking and, ultimately, to the group’s greater success.
IOOF has a Diversity and Inclusion Plan 2017/2018 that sets out the diversity initiatives for the IOOF Group. In this context, diversity and inclusion covers gender, age, ethnicity, race, sexual orientation, physical abilities, religious beliefs and other beliefs. It also extends to di�erences surrounding socio economic or educational background, marital status, mental health, family responsibilities and addressing matters of domestic violence.
We recognise that building a diverse, inclusive workforce increases the possibility to recruit, retain and develop the best talent whilst forging a stronger understanding and connection with our clients and broader communities. As part of our employee engagement survey completed in August 2016, 31% of our people identi�ed as being from a culturally or linguistically diverse background.
IOOF targets being a diversity leader in the �nancial sector by;
• providing a diverse, inclusive workplace in which everyone has the opportunity to participate and be valued for their distinctive skills, experiences and perspectives;
• incorporating diversity into business practices through its corporate social responsibility initiatives that aim to improve quality of life for our workforce, their families, communities and society at large; and
• ensuring diversity extends and is embraced across all aspects of the Group, including recruitment and appointment to roles, talent development, Board appointments, retention, mentoring and coaching programs, �exible work arrangements, succession planning, training and development and across all of the relevant Group policies and procedures.
The table below sets out the number of women at board, senior management and all sta� levels:
Group September 2016
September 2017
Women on the IOOF Holdings Limited Board
33% 33%
Women in senior management 31% 29%
Women at all sta� levels 50% 49%
In order to create a focus on encouraging a gender balanced workplace, IOOF has supported a number of initial research programs to address any gaps that may be evident. A pay equity audit has been conducted annually since 2011 amongst all levels of IOOF sta� to determine whether a gender pay gap existed within the IOOF Group in order to identify any trends. Our People and Culture Committee will continue to address matters of equal pay and continue to support the programs to further increase the number of women in senior management positions.
In 2017, 49% of appointments to Manager roles were women.
Other initiatives include:
• leadership fundamentals education series and mentoring programs;
• awareness/education on work life balance and �exibility;
• a section dedicated to wellbeing on employee intranet portal;
• networking functions; and
• opportunities for small groups to attend industry networking and skills speci�c conferences and workshops to enhance their education and potential to encourage networking with industry and business peers.
The Board approved Diversity and Inclusion Plan for 2017-2018 is available on our website.
CRA-6580 IOOF Annual Report 2017 - EDITORIAL V6.indd 20 10/10/17 11:35 am

21
IOOF annual report 2017
During 2017, the IOOF Foundation passed the $12.5 million mark in grants it has awarded since its formation in 2001. This year, the Foundation has continued to support charitable organisations working to bene�t the community on a range of initiatives.
The IOOF Foundation is provided with ongoing support from the IOOF group, covering the expenses and resourcing of our Foundation. With the support of IOOF our Foundation aspires to create opportunities for the aged, disadvantaged families, youth and children by investing in initiatives that reduce the obstacles to improved quality of life and help others achieve their potential and meaningfully participate in the community.
The grants that are approved are innovative, yet sustainable, and are those that will provide value to the community. This helps ensure that grants provided make a real impact on the community and achieve a meaningful result.
Youth Focus WAYouth Focus WA Youth Focus do an incredible job with young people in Western Australia, providing counselling and other support services to prevent depression and youth suicide. We were pleased to provide $45,000 to support their counselling service and support their annual fundraising event – the Hawaiian Ride for Youth. Some 11,000km from Honolulu, this charity rides actually travels 700km through the wheat belt of Western Australia over �ve days in March. The 2017 Hawaiian Ride for Youth was a record breaking success with more the $2.5 million raised.
Juvenile Diabetes Research FoundationThe e�ects of Type 1 Diabetes are life changing. For many people who face this diagnosis it can be a frightening and overwhelming time. The IOOF Foundation was pleased to provide a $30,000 grant to the JDRF peer support program. This program allows su�erers to reach out to the diabetes community for practical advice and support.
2017 Community Partners• Spinal Research Institute
• Red Dust
• The Smith Family
• Maggie Beer Foundation
• Righteous Pups
• Kids Under Cover
• Ardoch Youth Foundation
• Parkinsons Australia
• Youth Focus WA
• Juvenile Diabetes Research Foundation
• Ronald McDonald House Westmead
CRA-6580 IOOF Annual Report 2017 - EDITORIAL V6.indd 21 10/10/17 11:35 am

22
IOOF annual report 2017
Alzheimer’s Australia We are proud to support the good work of Edie (pronounced Eddie). You won’t ever meet him, however. Edie’s just an app, after all. Edie is the ‘Educational Dementia Immersive Experience’ – an innovative way to increase empathy and awareness of the devastating e�ects of dementia by letting anybody view the world through the eyes of a person su�ering from this condition. The 360-degree virtual reality experience was developed with the help of $160,000 funding from the IOOF Foundation. This initiative lets Alzheimer’s Australia use technology to improve care for dementia patients, in Australia and around the world.
Ardoch Youth Foundation With �nancial support from the IOOF Foundation, the Shadforth team in Melbourne worked with the Ardoch Youth Foundation to support schools in disadvantaged communities. The Shadforth volunteers have been instrumental in helping build students’ literacy and social skills through the Literacy Buddies® program. Both the teachers and students alike have been very inspired by the Big Buddies’ creative letter writing skills. The program will expand to Queensland, Western Australia and New South Wales in late 2017 with the help of the IOOF Foundation.
Maggie Beer Foundation ‘Stop using the F word’ is the catch-cry Australian chef Maggie Beer uses to grab attention for her Foundation’s new workshop ‘Creating an Appetite for Life’. The ‘F’, in this case, refers to facilities for aged care. Ms Beer believes that aged care homes should feel like home and a signi�cant part of that comes down to cooking healthy, �avoursome meals that don’t have to break the bank. ‘If we can give aged care residents the smells of home cooked food, that feeling they are a person and still living, not just existing, that’s the thing we most want to do,’ Maggie said. As an o�cial community partner of the Maggie Beer Foundation, the IOOF Foundation o�ers scholarships for not-for-pro�ts to attend her Creating an Appetite for Life workshops. We have committed to expand our partnership to further support these worthwhile educational programs throughout 2018.
Find out more about the IOOF Foundation at www.ioo�oundation.org.au
CRA-6580 IOOF Annual Report 2017 - EDITORIAL V6.indd 22 10/10/17 11:35 am

232323
Financial reportfor the year ended 30 June 2017
23
IOOF annual report 2017
ContentsDirectors’ Report 24
Remuneration Report 38
Directors’ Declaration 55
Lead Auditor’s Independence Declaration 56
Independent Auditor’s Report to the Members 57
Consolidated Statement of Comprehensive Income 61
Consolidated Statement of Financial Position 62
Consolidated Statement of Changes in Equity 63
Consolidated Statement of Cash Flows 65
Notes to the financial statements 66

24
IOOF annual report 2017
24
Directors’ reportThe Directors present their report together with the �nancial report of IOOF Holdings Ltd (the “Company” or “Parent”) and of the IOOF Group, being the Company and its subsidiaries and the consolidated Group’s interest in associates for the �nancial year ended 30 June 2017 and the auditor’s report thereon.
Directors The Directors of the Company during or since the end of the �nancial year were:
Name, quali�cations and independence status
Experience, special responsibilities and other directorships
Mr George VenardosBComm, FCA, FGIA, FAICD.Independent Non-Executive DirectorDirector since 2009Chairman since November 2016
An experienced Director with broad listed company experience across a range of di�erent industries, including �nancial services, a�ordable leisure, oil and gas services and technology development. Over 30 years’ experience in executive roles in �nancial services, insurance and funds management including 10 years as CFO of Insurance Australia Group and Chairman of the Insurance Council of Australia Finance and Accounting Committee. Other ASX listed directorships include Ardent Leisure Group since 2009, appointed Chairman in November 2016. Former Director of Miclyn Express O�shore Ltd from 2010 to 2013 and Bluglass Ltd from 2008 to 2016. Member of the Risk and Compliance Committee until 24 November 2016 and Chairman of the Remuneration and Nominations Committee until 24 November 2016. Member of the Group Audit and Remuneration Committees from 24 November 2016. Chairman of the Nominations Committee from 24 November 2016.
Dr Roger Sexton AMB.Ec. (Hons), M.Ec. Ph.D (Econ), FAICD, FAIM. SFFin, C. P Mgr, C.UnivChairman and Independent Non-Executive DirectorRetired 24 November 2016
More than 30 years experience in senior management in �nance and the investment banking industry. A specialist in the areas of corporate reconstruction, mergers and acquisitions, and asset management. Chairman of Beston Global Food Company Ltd. A Former Member of the Australian Accounting Standards Board.Chairman of the Remuneration and Nominations Committee and Chairman of Perennial Investment Partners Ltd. Member of the Group Audit and Remuneration and Nominations Committees. Director from 2012 to November 2016.
Mr Christopher KelaherB.Ec, LL.B, F Fin.Managing DirectorDirector since 2009
In 2009, Mr Kelaher became the Managing Director of the IOOF Group after its merger with Australian Wealth Management Limited (AWM), a company he had led since 2006. Prior to AWM, Mr Kelaher was the CEO of Select Managed Funds Limited for nine years, a private company which was brought to market in 2005 and in turn ultimately merged with AWM in 2006. In the following periods, he has been instrumental in executing multiple mergers and acquisitions that have added materially to the IOOF Group and its antecedent businesses. Mr Kelaher has extensive capital markets experience from his time during the late 1980s with Citicorp where he oversaw the establishment of Citicorp Investment Management and Global Asset Management businesses in Australia and New Zealand. Member of the Nominations Committee from 24 November 2016.
Mr Allan Gri�thsB.Bus, DipLI.Independent Non-Executive DirectorDirector since 2014
More than 30 years’ experience with a deep understanding of the �nancial services industry. Mr Gri�ths has held a number of executive positions within the industry most notably as Chief Executive O�cer Aviva Australia and later, Managing Director South Asia, Aviva Asia Pte Ltd based in Singapore. Prior to joining Aviva Mr Gri�ths held executive positions with Colonial Ltd and Norwich Union. Chairman of the Risk and Compliance Committee until 24 November 2016. Member of the Group Audit and Risk and Compliance Committees. Chairman of the Remuneration Committee from 24 November 2016.
Ms Jane HarveyB.Com, MBA, FCA, FAICD.Independent Non-Executive DirectorDirector since 2005
Ms Harvey has more than 30 years’ experience in the �nancial and advisory services industry. Prior positions include as a Partner at PricewaterhouseCoopers, a Director of David Jones Limited from 2012 to 2014, a Director of UGL Limited from 2015 to 2017, and as a Director of DUET Finance Limited, a stapled entity within the ASX Listed DUET Group from 2013 to 2017. Ms Harvey is currently a Director of BUPA ANZ. Ms Harvey is the Chairperson of the IOOF Group Audit Committee and member of the Risk and Compliance Committee. Member of Remuneration and Nominations Committee until 24 November 2016. Member of Nominations and APRA Regulated Entity Audit Committees from 24 November 2016.
Ms Elizabeth Flynn LLB, Grad Dip App Corp Gov, FAICD, FFin, FGIA, FCIS.Director since 2015
Ms Flynn has more than 30 years’ experience in the �nancial services industry, including roles within law and corporate governance as well as executive responsibilities. From 1998 to 2010, Ms Flynn was the Chief Legal Counsel, Group Compliance Manager and Group Company Secretary of �nancial services group Aviva Australia, and a director of NULIS Nominees, Aviva Australia’s superannuation trustee company. Prior to her time at Aviva, Ms Flynn spent 18 years as a commercial lawyer with Minter Ellison, including eight years as a Partner, specialising in managed funds, banking and securitisation and superannuation. Ms Flynn was a director of Bennelong Funds Management from 2010 to 2015. Member of the Group Audit Committee until 24 November 2016. Member of the Risk and Compliance Committee and appointed as Chairperson from 24 November 2016. Member of Remuneration and APRA Regulated Entity Audit Committees from 24 November 2016.

25
IOOF annual report 2017
25
Name, quali�cations and independence status
Experience, special responsibilities and other directorships
Mr John SelakDip Acc, FCA, FAICDAppointed 14 October 2016
Mr Selak has over 40 years’ experience in the �nancial and advisory services industry. From 2000 to 2016 Mr Selak was a Partner in the Corporate Finance Practice of Ernst & Young serving on their Global Corporate Finance Executive. From 2014 to 2017 Mr Selak was an advisory board member of Quest Apartment Hotels. Mr Selak is currently Chairman of Corsair Capital, a non-executive director of National Tiles and an advisory board member of Turi Foods. Chairman of APRA Regulated Entity Audit Committee from 24 November 2016 and member of Group Audit Committee from 24 November 2016.
All Directors held o�ce during and since the end of the �nancial year, unless otherwise noted.
The Remuneration and Nominations Committees review the balance of skills, experience, independence, knowledge and diversity of Directors. This involves the creation of a board skills matrix setting out the mix of skills and diversity that the Board currently has or is looking to achieve in its membership.
During the year each Board member completed a skills matrix. The Board was satis�ed that the skills matrix results demonstrate that the Board has the appropriate skills and experience necessary to oversee the operations and governance of the IOOF Group. The Board Skills Matrix is available as part of our Corporate Governance Statement which is available on the IOOF website.
Principal activitiesThe principal continuing activities of the IOOF Group during the �nancial year consisted of:
• �nancial advice and distribution;
• platform management & superannuation administration;
• investment management; and
• trustee services including estate planning and corporate trust.
Operating and �nancial reviewIn accordance with current Australian Accounting Standards, the audited �nancial results of the bene�t funds of IOOF Ltd are included in the consolidated results of the IOOF Group. The inclusion of the bene�t funds has no impact on the pro�t after tax for the year (2016: $nil), but results in o�setting pre-tax pro�t and income tax amounts not available to shareholders.
The following table, which has not been audited, provides a reconciliation between the reported results of the IOOF Group and underlying net pro�t after tax pre-amortisation (UNPAT), with the results of the bene�t funds excluded. In calculating its UNPAT, the IOOF Group reverses the impact on pro�t of certain, predominantly non cash, items to enable a better understanding of its operational result. It is the UNPAT result which will be analysed in detail in this section of the Directors’ Report. It should be noted, however, that the items reversed, and the rationale for that reversal, is also addressed in detail.
Shareholders can review the more detailed results presentation by visiting the Company website at www.ioof.com.au

26
IOOF annual report 2017
26
Directors’ report (cont’d) Operating and �nancial review (cont’d)
Note 2017 2016
$’000 $’000
Pro�t for the year from continuing operations 119,851 140,542
Less non-controlling interest (3,861) (2,620)
Pro�t attributable to Owners of the Company from continuing operations 115,990 137,922
Pro�t for the year from discontinued operation - 58,924
Pro�t attributable to Owners of the Company - total 115,990 196,846
Underlying net pro�t after tax pre-amortisation (UNPAT) adjustments:
Reverse the impact of:
Amortisation of intangible assets 2-4 38,611 39,681
Termination and retention incentive payments 2-4 4,125 6,005
Gain on divestment of subsidiaries 2-2,2-3 (6,261) (71,988)
Pro�t on divestment of assets 2-3 (11,930) (8,125)
Non-recurring professional fees 2-4 2,013 5,061
Acquisition tax provision release (5,707) -
Impairment of goodwill 2-4 38,592 -
Unwind of deferred tax liability recorded on intangible assets (10,056) (10,056)
Acquisition and divestment transaction costs - 1,516
Onerous contracts 2-4 - 951
Reinstatement of Perennial non-controlling interests - (825)
Income tax attributable 3,980 14,301
UNPAT 169,357 173,367
Discontinued operation - (2,097)
UNPAT from continuing operations 169,357 171,270
The IOOF Group services the needs of �nancial advisers and their clients through appropriately licensed and regulated entities. The pool of investable funds emanates predominantly from superannuation which has been supported by Australia’s mandatory contributions regime since the early 1990s. Competition for service o�erings to superannuants and investors (fund members) in the Australian market place is currently drawn from �ve main fund types with the following di�erentiating features:
Retail - privately operated trusts and other schemes. The majority of funds are channelled to administration services and investment management products through �nancial advisers. However, technological development is enabling an increasing range of o�erings direct to fund members.
Industry Funds - superannuation entities which historically have provided for employees working in the same union, industry or group of related industries. Many industry funds now o�er membership to members of the public. Industry funds generally administer these funds, but may outsource the management of investments.
Self-Managed - the fund member acts as Trustee for his or her pool of funds, which may include funds from a limited number of other family members and associates. These funds are predominantly utilised where the Trustee perceives they have the requisite time and expertise to manage their own investment strategy and a su�cient scale of funds to make the �xed administration costs economically justi�able.
Corporate - funds established for the bene�t of employees of a particular entity or a group of related entities, with joint member and employer control.
Public Sector - funds which provide bene�ts largely for government employees or employees of statutory authorities, or are schemes established by a Commonwealth, State or Territory law.
Self Managed Funds are regulated by the Australian Taxation O�ce (ATO) whereas all others above are regulated by the Australian Prudential Regulation Authority (APRA).

27
IOOF annual report 2017
27
The IOOF Group administers and manages Retail funds. Australian Superannuation assets totalled $2.3 trillion as at 30 June 2017. Over the 12 months to June 2017 there was an 10.0% increase in total superannuation assets and retail providers had a market share of approximately 25%. The IOOF Group’s market share of that sub-set, as represented by our platform administration segment’s �ows to Funds Under Administration, was approximately 9%. There is a high degree of competition between the �ve fund types and fragmentation and competition among the participants within each fund type.
As at the end of June 2017, for funds with greater than four members, 49.8% of investments were invested in equities; with 22.8% in Australian listed equities, 22.9% in international listed equities and 4.0% in unlisted equities. Fixed income and cash investments accounted for 33.3% of investments; 20.9% in �xed income and 12.4% in cash. Property and infrastructure accounted for 13.3% of investments and 3.7% were invested in other assets, including hedge funds and commodities.
The IOOF Group operates in the Wealth Management sector. The sector has a substantial and growing pool of funds underpinned by government compulsion. The attraction of the sector is further enhanced by high regulatory and technological barriers to entry from new competitors. As an incumbent participant, we seek to grow our Funds Under Management, Administration, Advice and Supervision (FUMAS) faster than our competitors. In doing so, the portion of our revenue net of direct costs (gross margin) which is levied on asset balances may reasonably be expected to rise proportionately with FUMAS. This proportionate rise may be a�ected by the impact of di�erentiated product pricing and competitive pressure on management fee rates. In conjunction, we seek to leverage a cost base which is largely �xed relative to the scale of our FUMAS.
The IOOF Group’s future FUMAS growth will be underpinned by organic and acquisition initiatives. Organic growth will be advanced through:
• increasing brand and product awareness to increase revenue;
• enhancing the adviser and fund client experience through continued technology development and experienced knowledgeable support sta�;
• operating an open architecture environment which allows our advisers and clients to utilise the administration service which best meets their objectives irrespective of whether it is an IOOF Group proprietary service or a competitor’s service. All options, however, generate a favourable economic return for the IOOF Group;
• enhanced training initiatives and leading minimum quali�cation standards to give our sta� and advisers every opportunity to optimise the experience of our clients;
• establishing skilled teams and robust analytical processes to enhance the prospect of achieving above benchmark performance in investment management; and
• continuous improvement in process e�ciency to minimise operating costs.
The IOOF Group also has a long-term strategy of pursuing growth through acquisitions and has completed several acquisitions in previous years. The IOOF Group will continue to pursue acquisitions within the Wealth Management sector on an opportunistic basis. However acquisitions will only be considered where they present a logical strategic �t with existing operations and are priced reasonably for the expected value accretion to shareholders. The funding of acquisitions will be considered on a case by case basis taking into account the relative cost of available funding sources and the impact on balance sheet structure overall.
On 14 June 2017, the IOOF Group announced its agreement with National Australia Bank Limited to acquire National Australia Trustees Limited (NATL). NATL is a signi�cant provider of trustee services with a recognised history in Western Australia, New South Wales, Queensland and Victoria. NATL’s o�ering is considered a strong strategic �t with the IOOF Group’s existing trustee business, Australian Executor Trustees Limited (AET), as combined customers will bene�t from greater scale and more specialist product o�erings. Completion of the sale is subject to regulatory approval and is expected to be �nalised in the next half-yearly reporting period. As such, there has been no impact on the IOOF Group’s results for the current year.
The IOOF Group’s UNPAT of $169.4m for the year ended 30 June 2017 was materially in line with $171.3m UNPAT from continuing operations in the prior year.
In the prior year Perennial Fixed Interest and Perennial Growth Management were divested to the Henderson Group plc (Henderson) for an upfront consideration of $71.6m and a deferred component dependent on future business performance, payable after two and four years. $0.7m has been recognised in statutory pro�t only as deferred consideration for the year ended 30 June 2017. The results of these businesses have been disclosed as a discontinued operation in the �nancial statements. These divestments allow the IOOF Group to concentrate on its core advice, superannuation, multimanager and trustee business. The proceeds from the divestment will fund congruent acquisitions.

28
IOOF annual report 2017
28
Directors’ report (cont’d) Operating and �nancial review (cont’d)
Analysis of �nancial results - IOOF GroupAnalysis of the IOOF Group’s result excludes the divested Perennial businesses from the review and the impact on particular items of revenue or expense highlighted in discontinued operations disclosures. Variances compare the year to 30 June 2017 with the year to 30 June 2016.
Gross margin decreased $9.6mDuring the current year, average Funds Under Management, Administration and Advice (FUMA) were $109.5b, an increase of 5.5% on the prior year average. The increases were derived largely from equity market performance in the current year augmented by organic growth in advice based funds. Platform and advice �ows of $4.2b were up 131% on prior year. Organic growth bene�ted from higher levels of �ows across the sector and better penetration of the IOOF Group’s exisiting client base. As far as the latter is concerned, the transfer of clients from the Bridges aligned TPS platform to the IOOF Group’s contemporary, more marketable, Pursuit o�ering was the prime cause of this positive outcome. The improvement on prior year was also impacted by the loss of a single low margin corporate account which had an outsize impact in that prior year.
The revenue impact from higher average funds was o�set by negative impacts from product mix on earning rates or margins. It should be noted, however, that margins improved signi�cantly across the two halves of the current year. Within platform administration, the lower rates for the current year principally re�ected the ability of clients transferred via platform rationalisation to access lower fee scales. In addition, there is a continuing trend for a higher proportion of funds to be directed towards more contemporary platforms with lower fees, but commensurately lower attributable overheads. Notwithstanding, higher platform margins were achieved in the second half of the current year due to service fee repricing. Investment management margins were stable, with an improved second half of the current year driven by consolidation of underlying fund managers and resultant lower costs. In �nancial advice, Shadforth margins declined due to divestment and service mix impacts whilst new business from incoming advisers was dilutive on segment margin overall.
Other revenue increased $2.7mThe IOOF Group’s broking businesses’, (Ord Minnett and Bridges) contributions were up in comparison to prior year due to improved equity market conditions for new issues and traded volumes more broadly. In comparison to prior year, service charges to associated entities were reduced in line with the signi�cant number of divested holdings enacted in 2015 and 2016.
Operating expenditure decreased by $9.0mThe decrease in operating expenditure excludes the impact of expenditure items identi�ed as reversed in calculating UNPAT. As a �nancial services provider, labour represents the IOOF Group’s most material cost. Labour costs have reduced by $2.1m despite higher rates of pay due to lower sta� numbers following realisation of e�ciencies through platform rationalisation. This rationalisation, in addition to a strategic imperative to build enhanced functionality in the prior year, has also seen computer expenditure reduce by approximately $8.8m relative to prior year. Professional fees have increased largely because specialist advisers have been engaged to assess signi�cant acquisition opportunities. In addition, the IOOF Group has outsourced a signi�cant component of its research capability which has the e�ect of increasing professional fees, but lowering sta� numbers.
Net �nancing costs stableNet �nancing costs have not varied materially as there has been a reasonably stable interest rate environment over the two years to 30 June 2017 in addition to similar patterns of sources and applications of funds over that period.
Other pro�t impacts decreased by $1.7mNon-controlling interests excluded Perennial entities due to classi�cation as discontinued operations and was $1.2m higher in line with Ord Minnett’s increased pro�tability. Share of associates pro�ts declined $1.4m relative to prior year as a result of mandate out�ows and higher costs within the Perennial Value Management (PVM) Group. Share-based payments expense was $0.7m lower due to the roll o� of non-employee stakeholder plans.
Income tax increased by $2.4mIncome tax expense relative to prior year re�ected a $4.1m lower spend on treasury shares to ful�l employee share plans ($1.2m tax impact). This was due principally to a wind down in scale and breadth of plans overall. Assessable income, as opposed to accounting pro�t before tax, was higher than the prior year and R&D claims lower on the back of lower software development expenditure.

29
IOOF annual report 2017
29
Analysis of �nancial results - Segments (excluding discontinued operations)
Financial advice and distribution 2017 2016 Movement
$’000 $’000 $’000 %
Net operating revenue 261,808 261,667 141 0.1%
Other revenue (incl equity accounted pro�ts) 3,856 4,700 (844) (18.0%)
Operating expenditure (148,755) (147,715) (1,040) (0.7%)
Net �nancing 560 731 (171) (23.4%)
Net non-cash items (3,221) (3,967) 746 18.8%
Income tax expense and non-controlling Interest (37,894) (36,981) (913) (2.5%)
Underlying Pro�t after Tax 76,354 78,435 (2,081) (2.7%)
• Average funds growth has been o�set by Shadforth fee mix impacts and divestments of owned advice business into owner operated dealer groups. The addition of advisers has brought new revenue streams into the IOOF group, albeit at a dilutive margin in percentage of average funds terms.
• Operating expenditure has been impacted by redistribution of corporate charges in the wake of signi�cant divestments in the prior year. In particular, there has been signi�cant re-weighting toward front line support for advisers under the IOOF Group’s Client First initiatives.
Platform management and administration 2017 2016 Movement
$’000 $’000 $’000 %
Net operating revenue 212,450 218,161 (5,711) (2.6%)
Other revenue (incl equity accounted pro�ts) - 375 (375) (100.0%)
Operating expenditure (95,865) (99,409) 3,544 3.6%
Net �nancing 1 2 (1) (50.0%)
Net non-cash items (5,380) (5,288) (92) (1.7%)
Income tax expense and non-controlling Interest (33,939) (34,820) 881 2.5%
Underlying Pro�t after Tax 77,267 79,021 (1,754) (2.2%)
• Average funds bene�ted from signi�cantly improved organic growth. Improvements in fund �ows in the sector more generally, the transfer of Bridges’ clients to Pursuit and the administration of increased native title and compensation funds from the trustee segment were the key drivers of this outcome. This growth was complemented by positive investment returns.
• Net operating revenue decrease was driven primarily by lower pricing tiers for Bridges’ clients following the rationalisation of two �agship retail platforms to one and a full year of MySuper pricing on higher balance accounts.
• Signi�cantly reduced operating expenditure resulted primarily from reduced sta� numbers and technology support and license costs following platform rationalisation. In addition, there was higher IT investment in the prior year in order to facilitate higher levels of on-line transacting in future periods.

30
IOOF annual report 2017
30
Directors’ report (cont’d) Operating and �nancial review (cont’d)
Investment management 2017 2016 Movement
$’000 $’000 $’000 %
Net operating revenue 57,508 57,719 (211) (0.4%)
Other revenue (incl equity accounted pro�ts) 2,737 5,572 (2,835) (50.9%)
Operating expenditure (14,284) (19,769) 5,485 27.7%
Net �nancing 436 1,236 (800) (64.7%)
Net non-cash items (723) (1,383) 660 47.7%
Income tax expense and non-controlling Interest (12,967) (11,996) (971) (8.1%)
Underlying Pro�t after Tax 32,707 31,379 1,328 4.2%
• Net operating revenue was stable with broadly equivalent average funds and margins across both years. Other revenue was a�ected by PVM performance.
• Decreased operating expenditure resulted from lower allocation of IOOF Group service costs following the divestment of Perennial.
Trustee services 2017 2016 Movement
$’000 $’000 $’000 %
Net operating revenue 28,490 27,422 1,068 3.9%
Other revenue (incl equity accounted pro�ts) - - - n/a
Operating expenditure (18,341) (18,601) 260 1.4%
Net �nancing - - - n/a
Net non-cash items (578) (246) (332) LARGE
Income tax expense and non-controlling Interest (2,876) (2,578) (298) (11.6%)
Underlying Pro�t after Tax 6,695 5,997 698 11.6%
• Net operating revenue has increased in line with higher client numbers; in particular, an improved contribution from the compensation trust and native title trust businesses resulted from an investment in capability and service delivery.
• Reduced operating expenditure resulted from e�ciencies following stronger alignment with the broader IOOF Group operating model.
Financial PositionThe IOOF Group held cash and cash equivalents of $208.2m at 30 June 2017 (30 June 2016: $187.0m). Cash is held to satisfy regulatory net asset requirements and also to ensure adequate liquidity given management fee receipts are less frequent than payroll and service fee cash out�ows.
The overall debt to equity ratio stood at 13% at 30 June 2017 (30 June 2016: 13%). Net debt, borrowings less cash, stood at 0.0 times underlying earnings before interest, tax, depreciation and amortisation. This compares favourably to a covenant ratio upper limit of 2.5 times. Cash �ow forecasting is conducted monthly which indicates that the IOOF Group’s debt levels are able to be serviced from current business operations. We also conduct stress testing of lending covenants when assessing acquisition opportunities and monitor adherence to licence conditions monthly.
Risks The IOOF Group manages a number of risks in conducting its operations and implementing its strategy. An in depth discussion of risks and sensitivities is outlined in Section 1 of the �nancial statements. Material risks faced by the IOOF Group include, but may not be limited to, the following:

31
IOOF annual report 2017
31
(i) Changes in investment markets
The IOOF Group derives a signi�cant proportion of its earnings from fees and charges based on the level of FUMAS. The level of FUMAS will re�ect (in addition to other factors such as the funds �owing into and out of FUMAS) the investment performance of those funds. Therefore, changes in domestic and/or global investment market conditions could lead to a decline in FUMAS, adversely impacting the amount we earn in fees and charges. Deterioration in investment market conditions could also lead to reduced consumer interest in the IOOF Group’s �nancial products and services. The principal response to this risk has been to establish comprehensive investment governance committees, policies and procedures which are subject to continuous monitoring and oversight.
(ii) Competition
There is substantial competition for the provision of �nancial services in the markets in which the IOOF Group operates. A variety of market participants in specialised investment fund management, wealth advice and corporate trustee services compete vigorously for customer investments and the provision of wealth management services. These competitive market conditions may adversely impact earnings and assets. The IOOF Group manages this risk by continuously investing in product design, stakeholder relationships and continuous improvement initiatives.
(iii) Information technology
The IOOF Group relies heavily on information technology. Therefore, any signi�cant or sustained failure in the IOOF Group’s core technology systems could have a materially adverse e�ect on operations in the short term, which in turn could undermine longer term con�dence and impact the future pro�tability and �nancial position of the IOOF Group. The IOOF Group has implemented a next-generation �rewall, pursues continuous improvements to protect user devices and imposes segregation of duties between technology environments. More broadly, the IOOF Group uses policies and procedures which are subject to continuous monitoring and oversight, maintains a signi�cant complement of experienced sta� and employs specialist advisers. Information technology controls are highly complementary to those employed to minimise cyber security risks.
(iv) Cyber security
There is a risk of signi�cant failure in the IOOF Group’s operations and/or material �nancial loss as a result of cyber attacks. To manage this risk, the IOOF Group has followed the recommendation of ASIC and adopted the United States government’s National Institute of Standards and Technology cybersecurity framework. In doing so, the IOOF Group has implemented measures and controls that cover identi�cation, detection, monitoring and response in relation to cyber threats. More broadly, we have developed and tested our disaster recovery capability and procedures, implemented high availability infrastructure and architectures, conducted mandatory sta� training which is focused on cyber risk and continually monitor our systems for signs of poor performance, intrusion or interruption. Cyber security controls are highly complementary to those employed to minimise information technology risks.
(v) Brands and reputation
The IOOF Group’s capacity to attract and retain �nancial advisers, employees, clients and FUMAS depends to a certain extent upon the brands and reputation of its businesses. A signi�cant and prolonged decline in key brand value or group reputation could contribute to lower new business sales, reduced in�ows of investment funds and assets, damage to client strategies and may impact adversely upon our future pro�tability and �nancial position. The IOOF Group actively monitors media and other public domain commentary on its a�airs as well as proactively promoting the value of its services, products and community initiatives and building a customer centric culture.
(vi) Provision of investment advice
The IOOF Group’s �nancial advisers and authorised representatives provide advice to clients and may be exposed to litigation if this advice is judged to be incorrect or if the authorised representative otherwise becomes liable for client losses. This risk is managed by having high educational, compliance and training standards for the IOOF Group’s advisers whilst its potential �nancial impact is generally mitigated by taking out appropriate insurance cover.

32
IOOF annual report 2017
32
Directors’ report (cont’d) Operating and �nancial review (cont’d)
(vii) Operational risks
Operational risk is the risk arising from the daily functioning of the IOOF Group’s businesses. The IOOF Group has speci�c operational exposures relevant to the industry in which we operate including exposures in connection with product disclosure statements, investment management, tax and �nancial advice, legal and regulatory compliance, product commitments, process error, fraud, system failure, failure of security and physical protection systems and unit pricing errors. This risk is minimised via policies and procedures which are subject to continuous monitoring and oversight. The IOOF Group maintains a signi�cant complement of experienced sta�, builds a positive culture and utilises specialist advisers to carry out such monitoring.
(viii) Conduct risk
Conduct risk is the risk of failure of the IOOF Group’s frameworks, product design or practices to prevent inappropriate, unethical or unlawful conduct (either by negligence or deliberate actions) on the part of the IOOF Group’s management, employees, contractors or representatives. The IOOF Group’s culture of honest and ethical behaviour is supported by the IOOF Code of Conduct and its Compliance Manual for Authorised Representatives, which set out the tenets of professional and personal conduct with which directors, employees, contractors, Authorised Representatives, agents and consultants are required to comply. These include promoting a healthy and safe environment, protecting private and con�dential information, acting at all times within the law and acting in the best interests of the IOOF Group, its shareholders, clients and investors. As an additional safeguard, the IOOF Group’s Whistleblower Policy protects employees from detrimental action where employees disclose, in good faith and with reasonable grounds, any unethical, illegal, fraudulent or undesirable conduct.
(ix) Credit risk
Credit risk refers to the risk that a counterparty will fail to meet its contractual obligations resulting in �nancial loss that arises from receivables, loans and other receivables. The IOOF Group’s counterparties generally do not have an independent credit rating. The IOOF Group assesses the credit quality of the debtor taking into account its �nancial position, past experience with the debtor, and other available credit risk information.
(x) Cash �ow and interest rate risk
Interest rate risk is the risk to the IOOF Group’s earnings and capital arising from changes in market interest rates. The �nancial instruments held that will be impacted by interest rate risk consist of cash and cash equivalents, loans, and borrowings. Short and long-term investment mixes and loans to related entities are in�uenced by liquidity policy requirements. Interest rates (both charged and received) are based on market rates, and are closely monitored by management. They are primarily at variable rates of interest, and will expose the IOOF Group to cash �ow interest rate risk.
(xi) Liquidity risk
Liquidity risk relates to the IOOF Group having insu�cient liquid assets to cover current liabilities and unforeseen expenses. The IOOF Group manages liquidity risk exposure by maintaining su�cient liquid assets and an ability to access a committed line of credit. The liquidity requirements for licensed entities in the IOOF Group is also regularly reviewed and carefully monitored in accordance with those licence requirements.
(xii) Reliance on Australian Financial Services Licence, Registrable Superannuation Entity and other licences
In order to provide the majority of its services in Australia, a number of the IOOF Group’s controlled entities are required to hold a number of licences, most notably AFS or RSE licences. If any of those entities fails to comply with the general obligations and conditions of its licence, this could result in the suspension or cancellation of the licence. While it is not expected to occur, a breach or loss of licences could have a material adverse e�ect on business and �nancial performance. AFS and RSE licences also require the licence holder to maintain certain levels of capital. These capital requirements may change from time to time. Earnings dilution may occur where a higher capital base is required to be held.
(xiii) Insurance
The IOOF Group holds insurance policies, including errors and omissions (professional indemnity) and directors’ and o�cers’ insurance, which are commensurate with industry standards, and adequate having regard to our business activities. These policies provide a degree of protection for the IOOF Group’s assets, liabilities, o�cers and employees. However, no assurance can be given that any insurance that the IOOF Group currently maintains will:

33
IOOF annual report 2017
33
• be available in the future on a commercially reasonable basis; or
• provide adequate cover against claims made against or by the IOOF Group, noting that there are some risks that are uninsurable (e.g. nuclear, chemical or biological incidents) or risks where the insurance coverage is reduced (e.g. cyclone, earthquake, �ood, �re).
The IOOF Group also faces risks associated with the �nancial strength of its insurers to meet indemnity obligations when called upon which could have an adverse e�ect on earnings. If the IOOF Group incurs uninsured losses or liabilities, its assets, pro�ts and prospects may be adversely a�ected.
(xiv) Unit pricing errors
Systems failures or errors in unit pricing of investments are issues a�ecting the broader funds management industry that may result in signi�cant �nancial losses and brand damage to a number of �nancial services organisations. A unit pricing error made by the IOOF Group or its service providers could cause �nancial or reputation loss. This risk is minimised via policies, procedures and contractual enforcement which are subject to continuous monitoring and oversight. The IOOF Group maintains a signi�cant complement of experienced sta� and utilises specialist service providers to maintain robust systems and accurate inputs.
(xv) Dependence on key personnel
The IOOF Group’s performance is dependent on the talents and e�orts of key personnel. The IOOF Group’s continued ability to compete e�ectively depends on our capacity to retain and motivate existing employees as well as attract new employees. The loss of key executives or advisers could cause material disruption to operations in the short to medium term. While equity incentives of key personnel align their interests with the IOOF Group’s future performance, they do not provide a guarantee of their continued employment. The IOOF Group utilises succession planning to manage this risk.
(xvi) Dependence on �nancial advisers
The success of the IOOF Group’s advice and platform business is highly dependent on the quality of the relationships with its �nancial advisers and the quality of their relationships with their clients. The IOOF Group’s ability to retain productive advisers is managed by monitoring and, where necessary, improving service levels, technological capability, suitability of product o�erings and the quality and relevance of professional training.
(xvii) Acquisitions
Acquisition transactions involve inherent risks, including:
• accurately assessing the value, strengths, weaknesses, contingent and other liabilities and potential pro�tability of acquired businesses;
• integration risks including the risk that integration could take longer or cost more than expected or that the anticipated bene�ts and synergies of the integration may be less than estimated;
• diversion of management attention from existing business;
• potential loss of key personnel and key clients;
• unanticipated changes in the industry or general economic conditions that a�ect the assumptions underlying the acquisition; and
• decline in the value of, and unanticipated costs, problems or liabilities associated with, the acquired business.
Any of these risks could result in a failure to realise the bene�ts anticipated to result from any acquisition of new business and could have a material adverse impact on our �nancial position. The IOOF Group maintains a signi�cant complement of experienced sta� and holds relationships with specialist advisers to assess acquisition opportunities. This is designed to ensure the Board is fully informed of the risks and opportunities associated with any potential individual acquisition.
(xviii) Dilution
The IOOF Group’s need to raise additional capital in the future in order to meet its operating or �nancing requirements, including by way of additional borrowings or increases in the equity of any of the consolidated entity’s companies, may change over time. Future capital raisings or equity funded acquisitions may dilute the holdings of particular shareholders to the extent that such shareholders do not subscribe to additional equity, or are otherwise not invited to subscribe in additional equity. This risk will be managed by examination of relevant factors and circumstances prevailing at that time.
(xix) Regulatory and legislative risk and reform The �nancial services sectors in which the IOOF Group operates are subject to extensive legislation, regulation and supervision by a number of regulatory bodies in multiple jurisdictions. The regulatory regimes governing the IOOF Group’s business activities are complex and subject to change. The impact of future regulatory and legislative change upon the IOOF Group cannot be predicted. In addition, if the amount and complexity of new regulation increases, so too may the cost of compliance and the risk of non-compliance. The IOOF Group maintains a signi�cant complement of experienced sta� and holds relationships with specialist advisers to minimise this risk.

34
IOOF annual report 2017
34
Shareholder returnsThe IOOF Group dividend is calibrated to provide shareholders with a bene�t which re�ects performance and o�ers an attractive yield when assessed against a range of other external economic factors and investment options. The Board also understands that dividend payments should not hinder future organisational plans. The Board has therefore determined that a pay-out ratio range of 60% - 90% of UNPAT is generally appropriate, but not binding. Based on historical precedent, the occasions on which this range is not met or exceeded are expected to be infrequent.
Total Shareholder Return (TSR) measures the change in share value over a speci�ed period together with the return by way of dividends received. The IOOF Group’s TSR for the twelve months to 30 June 2017 was 31.9% with 99% of UNPAT paid as dividends augmented by strong share price growth of 25.2%. The market valuation of the IOOF Group remained re�ective of movements in global equity markets generally. TSR in the 5 year period from 1 July 2012 was 103% in total and 15.3% on a compounding annualised basis. The IOOF Group is in a strong �nancial position with low gearing and signi�cant free cash.
2017 2016 2015 2014 2013
Pro�t attributable to owners of the Company ($'000s)1 115,990 196,846 138,371 101,285 79,769
Pro�t for the year from continuing operations ($'000s) 119,851 140,542 140,527 103,378 80,432
Basic EPS (cents per share) 38.7 65.7 47.7 43.7 34.4
Diluted EPS (cents per share) 38.6 65.4 47.4 43.1 34.1
Basic EPS (continuing operations) (cents per share) 38.7 46.0 45.8 43.7 34.4
UNPAT ($'000s) 169,357 173,367 173,758 123,047 108,756
UNPAT EPS (cents per share) 56.5 57.8 59.9 53.1 46.9
UNPAT EPS (continuing operations) (cents per share) 56.5 57.1 58.6 53.1 46.9
Dividends declared ($'000s) 159,071 163,573 159,070 127,260 97,485
Dividends per share (cents per share) 53.0 54.5 53.0 47.5 42.0
Opening share price $7.83 $8.99 $8.40 $7.36 $6.05
Closing share price at 30 June $9.80 $7.83 $8.99 $8.40 $7.36
Return on equity (non-statutory measure)2 12.1% 12.3% 13.4% 15.0% 13.2%
1 Pro�t attributable to owners of the Company has been calculated in accordance with Australian Accounting Standards.
2 Return on equity is calculated by dividing UNPAT by average equity during the year.
Returns to shareholders increase/decrease through both dividends and capital growth/decline. Dividends for 2017 and prior years were fully franked.
Items excluded from underlying net pro�t after tax pre-amortisation (UNPAT)Amortisation of intangible assets: Non-cash entry re�ective of declining intangible asset values over their useful lives. Intangible assets are continuously generated within the IOOF Group, but are only able to be recognised when acquired. The absence of a corresponding entry for intangible asset creation results in a conservative one sided decrement to pro�t only. It is reversed to ensure the operational result is not impacted. The reversal of amortisation of intangibles is routinely employed when performing company valuations. However, the amortisation of software development costs is not reversed in this manner.
Termination and retention incentive payments: Facilitation of restructuring to ensure long term e�ciency gains which are not re�ective of conventional recurring operations.
Gain on divestment of subsidiaries: During the year, the IOOF Group divested its interests in Perennial Investment Management Limited to Perennial Value Management Ltd. The IOOF Group also partially divested a subsidiary (2016: Perennial Fixed Interest and Perennial Growth Management).
Pro�t on divestment of assets: Divestments of non-core businesses, client lists and associates.
Non-recurring professional fees: Costs relating to specialist service and advice providers enlisted to assist the IOOF Group in better informing key stakeholders. These services were required following negative media allegations. In particular, but not limited to, process review, senate inquiry support, government relations, litigation defence and communications advice. It is not anticipated that this type and level of support will be required on a recurrent basis. Costs were predominantly in the prior year.
Directors’ report (cont’d) Operating and �nancial review (cont’d)

35
IOOF annual report 2017
35
Acquisition tax provision release: The acquisition of DKN in the 2012 �nancial year necessitated recognition of a provision related to an uncertain tax position. This was recognised at estimated fair value, however the provision was released during the current year as it was adjudged that a present obligation no longer existed. This was a one-o�, non-cash, non-operational increment to the IOOF Group’s statutory pro�tability.
Impairment of goodwill: A non-cash impairment of $38.6m has been recognised in relation to goodwill allocated to PVM and its subsidiaries. Reduced pro�tability from both lower revenue and higher costs has led to calculated value-in-use declining to below the carrying value of the aggregate goodwill and investment balances. Revenue decline has arisen due to institutional out�ows. These out�ows re�ect changing market dynamics where larger institutions now weight a greater proportion of funds to indexed products. This has combined with below benchmark performance in 2012 which adversely a�ected 3 and 5 year fund performance numbers. Higher costs resulted from an absence of operations scale and subsidisation following the divestment of other Perennial entities as PVM moved to virtually complete autonomy during the current year.
Unwind of deferred tax liability recorded on intangible assets: Acquired intangible asset valuations for AASB 3 Business Combinations accounting are higher than the required cost base as set under tax consolidation rules implemented during 2012. A deferred tax liability (DTL) is required to be recognised as there is an embedded capital gain should the assets be divested at their accounting values. This DTL reduces in future years at 30% of the amortisation applicable to those assets which have di�erent accounting values and tax cost bases. The recognition of DTL and subsequent reductions are not re�ective of conventional recurring operations and are regarded as highly unlikely to be realised due to the IOOF Group’s intention to hold these assets long term.
Acquisition and divestment transaction costs: In 2016, one o� payments to external advisers in pursuit of corporate transactions, such as the divestment of certain Perennial subsidiaries, which were not re�ective of conventional recurring operations.
Onerous contracts: In 2016, non-cash entry to record the estimated present value of expected costs of meeting the obligations under terminated information technology contracts associated with platform rationalisation. For these contracts, the costs exceed the economic bene�ts expected to be received.
Reinstatement of Perennial non-controlling interests: In 2016, embedded derivatives existed given the IOOF Group’s obligation to buy-back shareholdings in certain Perennial subsidiaries if put under the terms of their shareholders’ agreements. International Financial Reporting Standards deems the interests of these non-controlling holders to have been acquired. Those interests must therefore be held on balance sheet as a liability to be revalued to a reserve each reporting year. In calculating UNPAT, the non-controlling interest holders share of the pro�t of these subsidiaries is subtracted from the IOOF Group result as though there were no embedded derivatives to better re�ect the current economic interests of Company shareholders in the activities of these subsidiaries.
Income tax attributable: This represents the income tax applicable to certain adjustment items outlined above.
DividendsIn respect of the �nancial year ended 30 June 2017, the Directors declared the payment of a �nal dividend of 27.0 cents per share franked to 100% at 30% corporate income tax rate to the holders of fully paid ordinary shares to be paid on 1 September 2017. This dividend will be paid to all shareholders recorded on the Register of Members on 18 August 2017.
The Directors declared the payment of an interim dividend of 26.0 cents per share franked to 100% at 30% corporate income tax rate to the holders of fully paid ordinary shares paid on 30 March 2017.
In respect of the �nancial year ended 30 June 2016, a �nal dividend of 26.0 cents per share franked to 100% at 30% corporate income tax rate was paid to the holders of fully paid ordinary shares on 13 October 2016.
Environmental regulationThe IOOF Group is not subject to signi�cant environmental regulation.
Events occurring after balance dateThe Directors have declared the payment of a �nal dividend of 27.0 cents per ordinary share franked to 100% based on tax paid at 30%, to be paid on 1 September 2017.
The Directors are not aware of any other matter or circumstance not otherwise dealt with in this report, or the accompanying �nancial statements and notes thereto, that has arisen since 30 June 2017 that has signi�cantly a�ected, or may signi�cantly a�ect:
• the IOOF Group’s operations in future �nancial years; or
• the results of those operations in future �nancial years; or
• the IOOF Group’s state of a�airs in future �nancial years.

36
IOOF annual report 2017
36
Directors’ report (cont’d)
Lead auditor’s independence declarationThe lead auditor’s independence declaration is included on page 56 of the annual �nancial report and forms part of the Directors’ Report for the year ended 30 June 2017.
Company secretaryThe Company Secretary is Mr A Paul M Vine LLB FGIA FCIS GAICD. Mr Vine was appointed to the position in December 2015 and is also the General Manager Legal, Risk and Compliance, with over 25 years’ experience in legal and governance roles in public companies and leading law �rms.
Directors’ meetingsThe number of Directors’ meetings (including meetings of committees of Directors) and number of meetings attended by each of the Directors of the Company during the �nancial year are:
Director Directors Meetings Committee Meetings
Remuneration Committee
Nominations Committee Remuneration & Nominations
Committee1
Meetings attended
Meetings held
Meetings attended
Meetings held
Meetings attended
Meetings held
Meetings attended
Meetings held
C Kelaher 13 13 n/a n/a 2 2 n/a n/a
G Venardos 13 13 2 2 2 2 2 2
R Sexton 8 8 n/a n/a n/a n/a 2 2
J Harvey 12 13 n/a n/a 2 2 2 2
A Gri�ths 13 13 2 2 n/a n/a n/a n/a
E Flynn 13 13 2 2 n/a n/a n/a n/a
J Selak 7 7 n/a n/a n/a n/a n/a n/a
Director Committee Meetings
Group Audit Committee APRA Regulated Entity Audit Committee2
Risk and Compliance Committee2
Meetings attended
Meetings held
Meetings attended
Meetings held
Meetings attended
Meetings held
C Kelaher n/a n/a n/a n/a n/a n/a
G Venardos 2 2 n/a n/a 6 7
R Sexton 6 6 n/a n/a n/a n/a
J Harvey 8 8 3 3 7 7
A Gri�ths 8 8 n/a n/a 7 7
E Flynn 6 6 3 3 7 7
J Selak 2 2 3 3 n/a n/a
1 The Remuneration and Nominations Committee was reorganised into two separate Committees e�ective 24 November 2016.
2 These Committees include additional members that are not Directors of IOOF Holdings Ltd.
Meetings held represents the number of meetings held during the time the Director held o�ce.
The Directors meetings are those held for IOOF Holdings Ltd. This does not include the meetings held and attended by Directors for the various subsidiary companies. Major subsidiaries averaged a further 7 meetings each during the year.
In addition to the meetings attended during the year, a number of matters were considered and addressed separately via circular resolution.

37
IOOF annual report 2017
37
Shares issued on exercise of optionsDuring the �nancial year, the IOOF Group did not issue any ordinary shares of the Company as a result of the exercise of options. All plans were satis�ed from the purchase of shares.
Unexercised options over shares, performance rights and deferred sharesAt the date of this report unexercised options over shares of the Company under deferral arrangements and performance rights are:
Performance rights
Vesting date Number of rights
30 Jun 18 135,000
30 Jun 19 329,567
31 Dec 19 30,000
494,567
Deferred shares
Vesting date Number of shares
31 Jul 18 35,420
35,420
Shares allocated on vesting will rank equally with all other ordinary shares on issue.
These performance rights do not entitle the holder to participate in any share issue or receive dividends of the Company.
Indemni�cation and insuranceRule 84 of the IOOF Holdings Ltd Constitution requires the Company to indemnify to the extent permitted by law, each Director and Secretary against liability incurred in, or arising out of the conduct of the business of the Company or the discharge of the duties of the Director or Secretary. The Directors and Secretary named in this Directors’ Report have the bene�t of this requirement, as do individuals who formerly held one of those positions.
In accordance with this requirement the Company has entered into Deeds of Access, Indemnity and Insurance (Deeds of Indemnity) with each Director and Secretary. During the �nancial year, the IOOF Group paid insurance premiums to insure against amounts that the IOOF Group may be liable to pay the Directors and Secretary pursuant to Rule 84. The insurance policy also insures the Directors and Secretary of the Company and its controlled entities, and the general o�cers of each of the companies in the IOOF Group. Details of the amount of the premium paid in respect of the insurance contract have not been disclosed as such disclosure is prohibited under the terms of the contract.
The liabilities insured are legal costs that may be incurred in defending civil or criminal proceedings that may be brought against the o�cers in their capacity as o�cers of entities in the IOOF Group and any other payments arising from liabilities incurred by the o�cers in connection with such proceedings, other than where such liabilities arise out of conduct involving a wilful breach of duty by the o�cers or the improper use by the o�cers of their position or of information to gain advantage to themselves or someone else or to cause detriment to the Company.
Rounding o� of amountsThe Company is a company of the kind referred to in ASIC Corporations Instrument 2016/191, dated 24 March 2016, and in accordance with that Instrument amounts in the �nancial report are rounded o� to the nearest thousand dollars, narrative disclosures are expressed in whole dollars or as otherwise indicated.
Non-audit servicesThe Directors are satis�ed that the provision of non-audit services during the year of $499,958, by the auditor is compatible with the general standard of independence for auditors imposed by the Corporations Act 2001. Non-audit services are managed as follows:
• fees earned from non-audit work undertaken by KPMG are capped at 1.0 times the total audit fee;
• all non-audit services have been reviewed and approved to ensure that they do not impact the integrity and objectivity of the auditor; and
• none of the services undermine the general principles relating to auditor independence as set out in the Code of Conduct APES 110 Code of Ethics for Professional Accountants issued by the Accounting Professional & Ethical Standards Board, including reviewing or auditing the auditor’s own work, acting in a management or decision-making capacity for the IOOF Group, acting as advocate for the IOOF Group or jointly sharing economic risks and rewards.
Proceedings on behalf of the CompanyNo person has applied to the Court under section 237 of the Corporations Act 2001 for leave to bring proceedings on behalf of the Company, or to intervene in any proceedings to which the Company is a party, for the purpose of taking responsibility on behalf of the Company for all or part of those proceedings.
No proceedings have been brought or intervened in on behalf of the Company with leave of the Court under section 237 of the Corporations Act 2001.

38
IOOF annual report 2017
Remuneration reportExecutive Summary 39
1. Overview 39
1.1 Key Management Personnel 39
1.2 Summary - Key Management Personnel remuneration 40
1.3 Summary - Non-Executive Directors remuneration 42
2. Remuneration Framework 43
2.1 Objectives 43
2.2 Remuneration governance 43
2.3 Committee members 43
2.4 How remuneration is determined 43
2.5 Services from consultants 45
2.6 Consequences of performance on shareholder wealth 45
3. Managing Director Remuneration 46
3.1 Summary of Managing Director remuneration outcomes for 2017 46
3.2 Managing Director remuneration 46
3.2.1 Short term incentive: targets and outcomes 47
3.2.2 Long term incentive: targets and outcomes 47
3.3 Change of control and cessation of employment 48
3.4 Remuneration for the year ended 30 June 2018 49
4. Key Management Personnel remuneration 49
4.1 Key Management Personnel remuneration 49
4.1.1 Short term incentive: targets and outcomes 49
4.1.2 Long term incentive: targets and outcomes 49
5. Remuneration tables 50
5.1 Deferred shares and performance rights over equity instruments granted as compensation during 2017 50
5.2 Summary of Key Management Personnel deferred shares and performance rights holdings 51
5.3 Performance rights granted since the end of the �nancial year 52
6. Summary of Key Management Personnel Contracts 52
7. Shareholdings of Key Management Personnel 52
8. Non-Executive Directors’ Remuneration 53
8.1 Overview 53
8.2 Terms of appointment 53
8.3 Shareholdings of Non-Executive Directors 54
9. Payments to persons before taking o�ce 54
The information in this report is in accordance with AASB 124 Related Party Disclosures and section 300A of the Corporations Act 2001, and has been audited as required by Section 308(3C) of the Corporations Act 2001 unless otherwise stated.

39
IOOF annual report 2017
Executive SummaryThis report details the remuneration framework and outcomes for Key Management Personnel (KMP) of the IOOF Group for the year ended 30 June 2017. The Board of Directors is committed to a remuneration strategy that aligns remuneration practices with the creation of shareholder value. A number of amendments have been made to the policies over the past few years to ensure that the policies have remained aligned with shifts in the IOOF Group’s business strategy and focus. The key principles of the IOOF Group’s remuneration policy remain unchanged from last year.
This report aims to communicate our remuneration practices, and their link to the creation of shareholder value, in a clear, concise and transparent way and demonstrate how these practices:
• align to our strategic objectives;
• are su�cient to attract, motivate and retain an ambitious and highly talented executive team; and
• support an appropriate governance culture to minimise risks to our clients and shareholders.
2017 pro�tability was broadly equivalent to 2016’s record result from continuing operations, with sustained returns to shareholders over the last three years. These strong results have been re�ected in the short and long term incentive outcomes received by the KMP.
The IOOF Group’s Total Shareholder Return (TSR) performance over the three years to 30 June 2017 was 36.9%, placing it at the 58th percentile relative to the ASX 200. Return on Equity (RoE) for the year to 30 June 2017 was 12.1%. The impact of these outcomes on the Managing Director and other executive KMP Long Term Incentives is detailed at sections 3.2.2 and 4.1.2 below.
Following an independent remuneration consultant review completed during the year, Non-Executive Directors received an increase in fees to align with comparable peers in the �nancial services sector. The remuneration for all Non-Executive Directors remains within the shareholder approved limits.
1. Overview1.1 Key Management PersonnelThis report covers the IOOF Group’s KMP. KMP are the people who have the authority and responsibility for planning, directing and controlling the activities of the IOOF Group:
Name Position Term as KMP
Managing Director
Mr C Kelaher Managing Director Full year
Other Executive KMP
Mr D Coulter Chief Financial O�cer Full year
Mr S Merlicek1 Chief Investment O�cer Full year, retired 3 July 2017
Mr R Mota Group General Manager – Wealth Management Full year
Mr G Riordan Group General Counsel & General Manager Trustee Services Full year
1 Mr D Farmer has taken on this role from 4 July 2017.
The Non-Executive Directors of the IOOF Group are also required to be disclosed as part of this report and are listed below:
Non-Executive Directors
Mr G Venardos Independent Non-Executive Director & Chairman Full year, appointed as Chairman 24 November 2016
Dr R Sexton AM Independent Non-Executive Director & Chairman Retired 24 November 2016
Ms J Harvey Independent Non-Executive Director Full year
Mr A Gri�ths Independent Non-Executive Director Full year
Ms E Flynn Independent Non-Executive Director Full year
Mr J Selak Independent Non-Executive Director Appointed 14 October 2016

40
IOOF annual report 2017
Remuneration report (cont’d)
1.2 Summary - Key Management Personnel remunerationThe IOOF Group uses a total remuneration package approach in determining remuneration that comprises both “�xed” and “at risk” components. These components re�ect an employee’s contribution to the IOOF Group, their skills and quali�cations, market benchmarks and the remuneration environment.
The remuneration arrangements for KMP comprise three key components:
• a base package which is a �xed amount and is reviewed on an annual basis with consideration given to cost of living increases (CPI), market movements or changes in the scope of the individual’s role and responsibilities;
• a Short Term Incentive (STI) amount which is tied to the successful achievement of a set of performance scorecard objectives (including �nancial, strategic, customer, people and governance objectives) for the annual performance period. STI awards are considered “at risk” components of an individual’s remuneration and can be awarded as either cash or share-based arrangements; and
• a Long Term Incentive (LTI) which is intended to provide incentives to KMP to remain with the IOOF Group to enhance the sustainable performance of the IOOF Group over the long term. LTI awards are considered “at risk” components of an individual’s remuneration and are all share-based arrangements.

41
IOOF annual report 2017
The following table sets out the remuneration received by the Managing Director and other executive KMP for the �nancial year ended 30 June 2017 and the prior year to 30 June 2016. The share-based payments shown below are not amounts actually received by KMP during the year, as they include accounting values for unvested share awards. Actual share-based payment amounts received are shown as cash remuneration. Further details are disclosed in sections 2 to 7 below.
Element of Remuneration
Post employ-
ment
Share-based
payments3
Salary Bonus1 Non-monetary2
Super-annu-ation
Perform-ance
Rights
Total Cash remun-eration4
Remuneration components as
a % of total remuneration
Component of Remuneration
Fixed$
At risk$
Fixed$
Fixed $
At risk $ $ $
Fixed%
At risk5
%
Managing Director
C Kelaher 2017 1,211,363 697,765 5,898 19,616 1,102,138 3,036,780 2,886,590 41 59
2016 1,187,756 651,891 8,877 19,308 1,051,796 2,919,628 5,005,194 42 58
Other Executive KMP
D Coulter 2017 420,384 300,000 4,904 19,616 130,138 875,042 810,747 51 49
2016 383,066 200,000 4,918 20,052 130,884 738,920 786,618 55 45
S Merlicek6 2017 406,948 63,645 4,904 17,352 18,495 511,344 649,300 84 16
2016 411,744 225,000 4,918 20,052 80,167 741,881 869,796 59 41
R Mota 2017 480,384 350,000 9,218 19,616 130,138 989,356 870,747 51 49
2016 453,016 200,000 4,918 20,052 130,884 808,870 876,567 59 41
G Riordan 2017 447,048 140,000 1,961 19,616 130,138 738,763 777,411 63 37
2016 438,287 140,000 801 19,308 130,884 729,280 801,095 63 37
Executive KMP – Former
M Farrell7 2016 224,764 70,000 830 11,510 29,599 336,703 559,524 70 30
Total 2017 2,966,127 1,551,410 26,885 95,816 1,511,047 6,151,285 5,994,795
2016 3,098,633 1,486,891 25,262 110,282 1,554,214 6,275,282 8,898,794
1 The bonus re�ects amounts provided under the STI program in relation to the �nancial year. One third of the bonus awarded to Mr Kelaher has been deferred into shares which will vest in July 2018 subject to a “look back.” This component of the STI is included as a share-based payment expense. The expected payment value of the bonuses is the amount shown and includes any amounts that may be sacri�ced into superannuation.
2 Non-monetary bene�ts include company funded bene�ts and fringe bene�ts tax payable on those bene�ts, typically car parking.
3 Share-based payments include accruals in relation to the Executive Performance Share Plan and accruals in relation to other grants of performance rights over shares in the Company. The value of the number of shares and options expected to vest has been apportioned over the term from grant date to vesting date.
4 This non-statutory disclosure provides shareholders with a view of the cash and other bene�ts received by KMP. Cash remuneration includes all remuneration paid during the �nancial year, including superannuation and STIs which were awarded for performance in previous �nancial years. In addition, any shares received by the KMP during the year are included at the value the shares were or could have been converted to cash on the date they were received. This value has been determined as the cash received by the employee where known, or the closing share price on the date the shares were allocated to the KMP less any consideration paid.
5 As payment of the at-risk component is at the discretion of the Board, the minimum value is nil and the maximum is the total amount paid.
6 S Merliceck ceased employment with the IOOF Group on 3 July 2017 and received a termination payment of $160,077. Performance rights due to vest in 2018 and future �nancial years have lapsed.
7 M Farrell ceased employment with the IOOF Group on 22 January 2016. On 26 November 2015, the Board resolved to approve early vesting of 50% of the 2015 rights on the date of Mr Farrell’s cessation of employment. All other rights awarded to Mr Farrell have lapsed. Mr Farrell received a termination payment of $29,407.

42
IOOF annual report 2017
Remuneration report (cont’d)
1.3 Summary - Non-Executive Directors remuneration The total fees paid to the Chairman and the Non-Executive Directors (including fees paid for their involvement on Board committees) have been determined within the total amount for Non-Executive Directors as approved by shareholders. Following an independent remuneration consultant review completed during the year, Non-Executive Directors received an increase in Directors’ fees to align with comparable peers in the �nancial services sector.
Short-term bene�ts
Post-employment bene�ts
Shareholder approved remuner-
ation
Post-employment bene�ts
Total
Directors fees1
$
Non-monetary
$
Superan-nuation
$ $Retirement2
$ $
G Venardos 2017 221,800 - 17,692 239,492 - 239,492
2016 148,832 - 14,139 162,971 - 162,971
J Harvey 2017 155,297 - 14,753 170,050 - 170,050
2016 148,832 - 14,139 162,971 - 162,971
A Gri�ths 2017 155,924 - 14,126 170,050 - 170,050
2016 149,826 - 13,145 162,971 - 162,971
E Flynn 2017 155,297 - 14,753 170,050 - 170,050
2016 115,255 - 10,949 126,204 - 126,204
J Selak3 2017 111,064 - 10,551 121,615 - 121,615
Former Non-Executive Directors
R Sexton 2017 105,379 2,980 8,722 117,081 - 117,081
2016 251,531 - 20,052 271,583 - 271,583
I Gri�ths4 2016 38,584 2,871 3,666 45,121 - 45,121
Total 2017 904,761 2,980 80,597 988,338 - 988,338
2016 852,860 2,871 76,090 931,821 - 931,821
1 Directors’ fees includes any fees sacri�ced into superannuation funds.
2 Non-Executive Directors appointed after 13 April 2003 are not entitled to retirement bene�ts. Non-Executive Directors appointed prior to this date accrued retirement bene�ts. Where entitled, the provision was based on the average emoluments of Non-Executive Directors over the previous three years’ of service. The bene�t accrued after three years of service and varied according to the number of years of service, reaching twice the average annual emoluments after ten years of service. R Sexton was paid $475,000 on his retirement on 24 November 2016. This amount was accrued at 30 June 2016 and relates to Director appointment pre 13 April 2003. Refer to ‘post employment bene�ts’ in section 8.2 for further details.
3 Mr J Selak was appointed as Non-Executive Director e�ective 14 October 2016.
4 Mr I Gri�ths resigned as Non-Executive Director e�ective 2 October 2015.

43
IOOF annual report 2017
2. Remuneration Framework2.1 Objectives
The Board of Directors is committed to a remuneration strategy that aligns remuneration practices with the creation of shareholder value. To realise this objective, the Board is committed to remuneration practices which align to the IOOF Group’s strategic objectives, are su�cient to attract, motivate and retain an ambitious and highly motivated executive team and promote an appropriate governance culture in line with the IOOF Group’s risk appetite.
2.2 Remuneration governanceThe Board of Directors oversees the IOOF Group’s remuneration policies on recommendation from the Remuneration Committee. The Board and the Remuneration Committee review the remuneration policies of the IOOF Group annually to ensure that they support the IOOF Group’s objectives.
The IOOF Group’s Remuneration Framework, established by the Remuneration Committee, considers the adequacy of remuneration policies and practices within the IOOF Group on an annual basis, including:
• determination of Managing Director and other executive remuneration arrangements;
• ensuring that succession planning and development plans are in place for KMP and their potential successors;
• on-going review and monitoring of short-term and long-term incentive schemes;
• setting key performance indicators and assessment of the Managing Director’s and the IOOF Group’s performance against those key performance indicators;
• overall compensation arrangements of the IOOF Group;
• ensuring remuneration policies are appropriate to Non-Executive Directors;
• ongoing review of the composition, skill base and performance of Non-Executive Directors; and
• compliance with regulatory requirements including the ASX Listing Rules and the associated ASX Corporate Governance Principles and meeting both ASIC and APRA requirements.
The Remuneration Committee reviews and makes recommendations to the Board on the remuneration structure and policies applicable to the KMP and Non-Executive Directors of the IOOF Group.
The Remuneration Committee’s charter is available on the Corporate Governance page of the Company’s website at www.ioof.com.au
2.3 Committee MembersThe Remuneration and Nominations Committee was in existence until 24 November 2016. Separate committees were formed for these functions post this date. The members of the Remuneration and Nominations Committee were Mr George Venardos (Chairman), Ms Jane Harvey and Dr Roger Sexton.
The Remuneration Committee was established on 24 November 2016. The Committee is comprised solely of Non-Executive Directors, all of whom are independent. The members of the Remuneration Committee during 2017 were Mr Allan Gri�ths (Chairman), Mr George Venardos and Ms Elizabeth Flynn.
The Board considers that the members of the Remuneration Committee provide an appropriate mix of skills to undertake its terms of reference, having regard to quali�cations, knowledge of the �nancial services industry and experience in business management.
In order to ensure that it is fully informed when making remuneration decisions, the Remuneration Committee receives regular reports and updates from the Company Secretary and the Group General Manager, People and Culture and other members of management invited by the Remuneration Committee to attend meetings when appropriate. The Remuneration Committee can also draw on services from a range of external sources, including access to benchmarking material and remuneration consultants. This enables the IOOF Group to remain competitive with relevant competitors in the �nancial services sector and the broader spectrum of public companies of similar size, revenue and pro�tability.
2.4 How remuneration is determined
Executive remuneration comprises a number of components including total �xed remuneration (TFR), STIs, partially (cash) deferred STI (for the Managing Director only) and LTIs in the form of deferred shares (Managing Director only) and performance rights over ordinary shares. LTIs are subject to appropriate, pre-determined performance hurdles. Each of these forms of remuneration are described in detail below.
Total Fixed Remuneration (TFR)
TFR includes a combination of base salary, employer superannuation contributions and other fringe bene�ts that an individual employee could choose to salary sacri�ce (e.g. superannuation, motor vehicle). TFR is based on what is appropriate to the position taking into consideration expertise, responsibility, knowledge, experience and market competitiveness.

44
IOOF annual report 2017
Remuneration report (cont’d)
Short Term Incentive (STI)
The STI opportunity is a cash-based incentive forming part of each KMP’s total remuneration package, the value of which is tied to the successful achievement of a set of performance objectives, as outlined below. STI opportunities vary for each individual. For the Managing Director, the maximum STI is up to 100% of TFR. The Chief Investment O�cer had up to 100% of TFR if additional KPIs on the performance of the investment management business were satis�ed (ie. top quartile performance). Other executive KMP’s maximum STI opportunity for 2017 is up to 50% of TFR, however variations to STIs may be awarded at the discretion of the Managing Director, subject to Board approval.
Objectives are drawn from the following categories:
• Financial
Performance measures include Underlying Pro�t After Tax (UNPAT), TSR and RoE.
• Business excellence
Performance measures for the year ended 30 June 2017 included operational targets such as long-term structural reductions to the cost base of the IOOF Group, balance sheet and liquidity initiatives and improvements to the performance of business units.
• Strategy
Measurable progress towards achieving longer term strategic goals. This includes, but is not limited to, implementation of major platform consolidation, regulatory adherence, growth through acquisition, divestment of non-core assets and product rationalisation initiatives.
• Governance adherence
KMP are provided with a number of targets at the beginning of the performance period that are set and agreed with the Managing Director. KMP have included in their targets an objective relating to risk management, regulatory and IOOF Group compliance and ensuring that outcomes from internal and external audit are actioned. In addition, KMP have speci�c targets relating to their businesses to ensure they are working towards the IOOF Group’s overall objectives.
Long Term Incentive (LTI)
The Board considers a long-term performance-related incentive component to be an important element of the executive reward framework. The IOOF Group utilises equity based incentives in the form of deferred shares (Managing Director only) and performance rights. These LTIs are subject to the achievement of a gateway qualifying condition (Managing Director only), minimum service periods and appropriate performance hurdles. The LTI element of the Managing Director’s remuneration is described in detail in section 3 of this report.
Early vesting may occur in certain circumstances, subject to the performance hurdle being achieved and Board approval received:
• on a person/entity acquiring more than 20% of the voting shares in the Company pursuant to a takeover bid that has become unconditional;
• on the termination of employee due to death or permanent disability; or
• in other exceptional circumstances where the Board determines appropriate.
The performance hurdle for current LTI plans has been linked to IOOF Group TSR compared to S&P ASX200 companies at the date of grant. TSR represents the change in the value of a share plus the value of dividends paid. TSR was chosen as the most appropriate comparative measure as it focuses on the delivery of shareholder value and is a well understood and tested metric of performance.
The Remuneration Committee engaged the services of an independent external organisation (Value Adviser Associates) to calculate the IOOF Group’s performance against the TSR performance hurdles.
Deferral arrangements
The Board has implemented deferral arrangements and “look back” provisions on a portion of the STI (cash payment) for the Managing Director. The deferral element of the Managing Director’s remuneration is described in detail in Section 3.2 of this report.
Hedging of unvested securities
The IOOF Group Policy - Personal Trading in IOOF Holdings Limited Securities contains a restriction on KMP and other employees entering into a hedging transaction to remove the “at risk” aspect of securities that have been granted to them as part of their remuneration package and which have not vested subject to performance conditions and/or which are still subject to forfeiture conditions. Employees are provided with a copy of this policy and are required to provide annual certi�cation that they have complied with the policy. Failure to comply with the policy may result in disciplinary action, including forfeiture of the securities, suspension or termination of employment.

45
IOOF annual report 2017
Remuneration mix
The table below shows the TFR and target and actual performance base remuneration as a proportion of the total of all forms of remuneration for the 2017 �nancial year:
Position TFR STI LTI
% % %
Managing Director Target 35 34 31
Actual1 41 23 36
Chief Investment O�cer
Target 49 49 2
Actual 84 12 4
Other Executives Target 56 28 16
Actual 55 29 15
1 Actual STI for the Managing Director includes one third of the STI awarded for the 2017 year settled in deferred shares.
2.5 Services from consultantsThe Remuneration Committee seeks and considers advice from independent, external remuneration consultants where appropriate. Remuneration consultants are engaged directly by and report to the Remuneration Committee. Egan Associates Pty Ltd were engaged in July 2016 to provide advice on Non-Executive Director remuneration and benchmarking data on Managing Director remuneration at a cost of $7,881. Following these reviews, the Remuneration Committee resolved to recommend to the Board an increase of 2% for the Managing Director and 8% for the Non-Executive Directors respectively to align fees with comparable peers in the �nancial services sector. The Board is satis�ed that this review was made free from undue in�uence as the recommendation relied on peer data.
2.6 Consequences of performance on shareholder wealthIn considering the IOOF Group’s performance and bene�ts for shareholder wealth, the Remuneration Committee has regard to the following indices in respect of the current �nancial year and the previous four �nancial years.
2017 2016 2015 2014 2013
Pro�t attributable to owners of the Company ($'000s)
115,990 196,846 138,371 101,285 79,769
UNPAT ($'000s)1 169,357 173,367 173,758 123,047 108,756
UNPAT EPS (cents per share) 56.5 57.8 59.9 53.1 46.9
Basic EPS (cents per share) 38.7 65.7 47.7 43.7 34.4
Basic EPS (continuing operations) (cents per share) 38.7 46.0 45.8 43.7 34.4
Share price at start of year 7.83 8.99 8.40 7.36 6.05
Share price at end of year 9.80 7.83 8.99 8.40 7.36
Change in share price 1.97 (1.16) 0.59 1.04 1.31
Dividends per share (cents per share) 53.0 54.5 53.0 47.5 42.0
Return on equity (non-statutory measure)2 12.1% 12.3% 13.4% 15.0% 13.2%
Total STIs paid to key management personnel ($'000s)
1,900 1,813 1,573 1,681 1,156
1 UNPAT is reconciled to pro�t attributable to owners of the Company in the Operating and Financial Review at page 26 of the Directors’ Report.
2 RoE is calculated by dividing UNPAT by average capital on issue during the year.

46
IOOF annual report 2017
Remuneration report (cont’d)
Underlying Pro�t & STI Payments
STI payments awarded to KMP are commensurate to the IOOF Group’s levels of pro�tability and scale of operations. As is consistent with the IOOF Group’s adherence to e�ective cost management, STI levels from 2013 to 2017 recognise KPIs speci�c to individuals rather than being solely determined by pro�tability.
3. Managing Director Remuneration3.1 Summary of Managing Director remuneration outcomes for 2017Performance outcomes for the Managing Director for 2017 were as follows:
• the maximum opportunity for STI in 2017 was 100% of base salary. Assessment against Key Performance Indicators (KPIs) resulted in awarding 85% of the Managing Director’s base salary. Two thirds of this payment was paid in cash ($697,765) and one third in 35,420 deferred shares;
• the Remuneration Committee performed a look-back for the 41,895 deferred shares awarded in July 2016 and determined it was still appropriate to award the deferred shares. The Remuneration Committee recommended this to the Board. These were released to Mr Kelaher in August 2017; and
• the performance rights awarded in 2015 were subject to performance testing during 2017. The IOOF Group’s TSR of 36.9% over the three year performance period placed it at the 58th percentile relative to the ASX 200 as a comparator group. This percentile ranking means that 66%, or 49,500 of the 75,000 performance rights awarded to Mr Kelaher, have vested.
3.2 Managing Director remunerationDuring the �nancial year ended 30 June 2017, Mr Kelaher received a remuneration package comprising TFR of $1,231,350. Mr Kelaher was entitled to a total STI opportunity of up to a maximum of $1,231,350 (100% of TFR) based on achievement of superior performance against set targets determined by the Board on recommendation from the Remuneration Committee, as outlined in section 3.2.1. In August 2017 the Remuneration Committee assessed Mr Kelaher’s performance against those targets and recommended an STI amount of $1,046,648, being 85% of the eligible amount, which was approved by the Board.
The STI opportunity was settled two thirds by cash and one third in the form of deferred shares. The number of deferred shares granted to Mr Kelaher was determined on the basis of the STI deferral amount divided by the �ve day Volume Weighted Average Price up to and including 30 June 2017, which was $9.85. The number of deferred shares to be issued accordingly was 35,420 (capped at 75,000 annually) and there is no consideration payable for the grant of the deferred shares.
The Board has determined that the portion of STI awarded as deferred shares will be subject to Board “look back” arrangements. This means the Board will conduct a review of Mr Kelaher and the IOOF Group’s performance in July 2018 and assess whether any signi�cant unexpected or unintended consequences have occurred that were not foreseen by the Remuneration Committee when it made its recommendation in August 2017, and whether it is still appropriate to award the deferred shares
During August 2017, the Remuneration Committee performed a “look back” review in regards to the 41,895 deferred shares issued in July 2016. The Remuneration Committee recommended that all of the deferred shares should vest in accordance with the terms of the arrangement and this was approved by the Board. The 41,895 shares have since been transferred to Mr Kelaher.
2013 2014 2015 2016 20170200400600800100012001400160018002000
020406080
100120140160180200
UNPAT Aggregate KMP Bonuses
STI A
mou
nt
UN
PAT
$m $’000s

47
IOOF annual report 2017
3.2.1 Short term incentive: targets and outcomes
The key areas of focus for the Managing Director’s STI targets/objectives for the 2017 performance period are shown below. The targets/objectives which were set for the 2016/2017 year included both objective and subjective measures. The Board through its Remuneration Committee assessed each of the Managing Director’s targets and awarded an STI amount of $1,046,648. The STI awarded represents 85% of the total opportunity for the 2017 performance period.
KPI Measure Outcome
Customer Improve key processes and implement new operating model from ClientFirst strategy
Achieved - signi�cant progress on ClientFirst and improvement in Wealth Insights ranking
Operations Continue to simplify the business and drive productivity improvements
Achieved - implementation of Project Unite, product rationalisations and business restructures
Growth/Strategy Drive organic growth initiatives, net �ows and consider appropriate acquisitions
Achieved - net �ows improvement. Consideration of various potential acquisitions, with National Australia Trustees transaction successful
Leadership and people
Employee alignment and engagement, governance KPIs, leadership of the executive team
Achieved - launch of IOOF purpose and strategy on a page and action planning on employee engagement initiatives
Compliance and risk
Testing of implementation of review recommendations
Achieved - all recommendations successfully implemented
The Managing Director received a higher overall STI than in the prior �nancial year in large part for the signi�cant progress on customer initiatives, �nancial performance during a period of signi�cant change, organic growth, cost reduction and a continued disciplined approach to potential acquisition opportunities.
3.2.2 Long term incentive: targets and outcomes
The Managing Director is eligible for an LTI payment, with the amount to be determined each year by the Board. The LTI amount is paid via performance rights, subject to a gateway qualifying condition and TSR hurdle.
Performance rights - gateway condition
Notwithstanding the gateway qualifying condition and TSR hurdle, the awarding of performance rights or similar remuneration bonuses remains at the discretion of the Board.
For consideration to be given to the awarding of any performance rights to the Managing Director, the IOOF Group must achieve a minimum RoE of 1.5 times the Long Term Bond Rate (10 year bond yield) (LTBR). Only when this gateway condition is met, is consideration given to the TSR hurdle and the potential vesting of performance rights. That is, if less than 1.5 times the LTBR is achieved, no performance rights are eligible to vest. If 1.5 and up to 2.0 times the LTBR is achieved, 50% of the performance rights are eligible to vest. If 2.0 to up to 2.5 times is met, then 75% of the performance rights will be eligible to vest and 100% will be eligible to vest if 2.5 times (or above) the LTBR is achieved. The RoE gateway condition has been developed by the Board to ensure that an LTI is not paid in a period of low or negative performance.
RoE is calculated by dividing UNPAT pre-amortisation by average equity on issue during the year. Summary of RoE performance against the LTBR over the past 5 years is outlined below:
2017 2016 2015 2014 2013
IOOF RoE v LTBR 4.5 x 3.8 x 3.9 x 4.0 x 3.3 x
Performance rights eligible to be tested against hurdles
100% 100% 100% 100% 100%
Performance rights - 2017 series performance hurdle
As noted above, only once the gateway qualifying condition is satis�ed, will the performance hurdle be assessed.
The performance hurdle relates to the IOOF Group’s TSR over a three year period from 1 July 2016 to 30 June 2019 measured against the TSR of a group of companies comprising the S&P ASX 200 as at 1 July 2016. The performance rights are subject to a TSR hurdle whereby the IOOF Group’s TSR must be greater than the median TSR of S&P/ASX200. The TSR hurdle has progressive vesting on a straight line basis, such that 2% of LTI awards vest for each 1% ranking increase from 50th percentile. All vest if 75th percentile is achieved.

48
IOOF annual report 2017
Remuneration report (cont’d)
As approved at the Annual General Meeting on 24 November 2016, Mr Kelaher is entitled to participate in an LTI program o�ering a maximum reward opportunity of 120,000 performance rights in respect of the 1 July 2016 to 30 June 2019 performance period. The number of rights submitted to the AGM for approval was determined on 28 July 2016 by the Remuneration and Nominations Committee based on the face value of the shares, up to a maximum of 90% of the Managing Directors base salary. On that date, the face value of IOOF shares was $9.00, hence 120,000 performance rights were granted for a total maximum value of $1,080,000 (89% of total base salary).
A summary of the current performance rights on issue to Mr Kelaher is as follows:
Year Performance Hurdle Grant date
Performance period
Rights eligible to vest
Vesting date
2017 TSR greater than median TSR of the S&P/ASX200 (progressive vesting)
24 Nov 16 2017-2019 120,000 30 Jun 19
2016 TSR greater than median TSR of the S&P/ASX200 (progressive vesting)
26 Nov 15 2016-2018 75,000 30 Jun 18
2015 TSR greater than median TSR of the S&P/ASX200 (progressive vesting) (66% satis�ed)
25 Nov 14 2015-2017 49,500 30 Jun 17
2015-2017 performance results (2015 series performance rights)
The below �gure compares IOOF’s TSR performance against the median TSR of the ASX 200 over the 2015 to 2017 performance period.
Figure 1 IOOF TSR Versus ASX200 Median and Upper Quartile
IOOF Total Shareholder Return Performance vs Members of ASX200Final data points (as at 30 June 2017) are based on 20-day VW APs rather than closing prices.
The IOOF Group’s TSR performance over the period was 36.9% placing it at the 58th percentile relative to the ASX 200. This resulted in 66% or 49,500 of 75,000 performance rights vesting in July 2017.
2018 Series Approval to be sought at the November 2017 Annual General Meeting - Managing Director
Approval will be sought at the 24 November 2017 Annual General Meeting for the issue of 122,500 performance rights. The gateway qualifying condition and performance hurdles will remain the same as those selected for the 2015, 2016 and
2017 grants. The performance period will be from 1 July 2017 to 30 June 2020, with vesting to occur on 1 July 2020. The number of rights was determined on 1 August 2017 by the Remuneration Committee and Board based on the face value of the shares, up to a maximum of 100% of the Managing Director’s base salary. On that date, the face value of IOOF shares was $10.04, hence 122,500 performance rights were granted for a total maximum value of $1,231,350 (100% of total base salary).
3.3 Change of control and cessation of employmentThe Board has determined that, if there is a change of control, any unvested LTIs may vest subject to the approval of the Board. If the Board so determines, any unvested performance rights may become exercisable. On cessation of employment, unvested LTIs will be dealt with as follows:
Reason for termination
Treatment of unvested LTIs
Termination of employment by IOOF by notice
The Board has discretion to waive the performance hurdles or determine that the proportion (if any) of unvested LTIs that will vest
Termination of employment by IOOF for cause
Unvested performance rights and share options are forfeited
Resignation by Mr Kelaher
The Board has discretion to waive the performance hurdles or determine that the proportion (if any) of unvested LTIs that will vest
Dismissal for serious misconduct (eg fraud)
Unvested performance rights and share options are forfeited
0
50
100
150
200
Jun 14 Dec 14 Jun 15 Dec 15 Jun 16 Dec 16 Jun 17 Tota
l Ret
urn
Inde
x (b
ase=
100
@ 3
0-Ju
n-14
)
IOOF Holdings Ltd ASX200 Upper Quartile ASX200 Median

49
IOOF annual report 2017
3.4 Remuneration for the year ended 30 June 2018The Board, on the recommendation of the Remuneration Committee, has increased the Managing Director’s total �xed annual remuneration to $1,257,208 for the �nancial year commencing 1 July 2017.
STI terms will be the same as for the year ended 30 June 2017, with an opportunity of up to 100% of total �xed remuneration, with speci�c performance hurdles relating to: the continuing growth of the business, product development, achievement of management e�ciencies, succession planning, pro�tability, compliance, risk management and corporate governance. The STI deferral arrangements remain unchanged with two thirds of the STI award to be paid in cash shortly after the performance assessment has been completed at year end, and one third will be used to purchase Company shares which will vest in July 2019 after a “look back” review.
4. Key Management Personnel Remuneration 4.1 Key Management Personnel remuneration The remuneration of other executive KMP is determined by the Managing Director, recommended by the Remuneration Committee and approved by the Board. Details of the total value of �xed, STI and LTI for each other executive KMP is provided in section 1 of this report.
4.1.1 Short term incentive: targets and outcomes
At the end of the year, their targets were assessed by the Managing Director and considered and approved by both the Remuneration Committee and the Board. The outcome of each assessment is set out below:
TFR STI opportunity
STI awarded
% awarded in year
% forfeited in year
$ $ $
Other Executive KMP
D Coulter1 440,000 220,000 300,000 136% 0%
S Merlicek 424,300 424,300 63,645 15% 85%
R Mota1 500,000 250,000 350,000 140% 0%
G Riordan 466,800 233,400 140,000 60% 40%
1 Total STI awarded exceeded the maximum STI opportunity at the discretion of the Managing Director, as approved by the Board.
4.1.2 Long term incentive: targets and outcomes
A summary of the current performance rights on issue to key management personnel is as shown below. Vesting of performance rights is subject to serving a three year employment period commencing on the date of grant. 50% of the grant is then subject to a TSR progressive vesting scale. This scale is the same as applies to the Managing Director as outlined in section 3.2.2 of this report.
In July 2017, the other executive KMP each had 8,250 of 12,500 performance rights vest under this TSR measure and a further 12,500 each vested on the basis of ful�lling a three year service period obligation. The aggregated vested performance rights for other executive KMP was 83,000.
Year Performance period
Grant date IOOF TSR for the period%
Ranking relative to
ASX200
Vesting status at
30 Jun 2017
Vesting date
2018 2018-2020 21 Aug 17 Performance period not complete 30 Jun 20
2017 2017-2019 10 Jul 16 Performance period not complete 30 Jun 19
2016 2016-2018 02 Jul 15 Performance period not complete 30 Jun 18
2015 2015-2017 18 Jul 14 36.9% 58th 66% vested 30 Jun 17

50
IOOF annual report 2017
Remuneration report (cont’d)
5. Remuneration tables5.1 Deferred shares and performance rights over equity instruments granted as compensation during 2017Details of deferred shares and performance rights over ordinary shares in the Company that were granted as compensation to each Executive during the reporting year are as follows:
Name Type of instrument Number granted
Grant date
Vesting date
Instrument fair value
Vested during 2017
Managing Director
C Kelaher LTI performance rights 120,000 24-Nov-16 30-Jun-19 $4.50 -
STI deferred shares 35,420 30-Jun-17 01-Jul-18 $9.85 -
Other Executive KMP
D Coulter LTI performance rights 30,000 09-Sep-16 30-Jun-19 $6.10 -
S Merlicek1 LTI performance rights 30,000 09-Sep-16 30-Jun-19 $6.10 -
R Mota LTI performance rights 30,000 09-Sep-16 30-Jun-19 $6.10 -
G Riordan LTI performance rights 30,000 09-Sep-16 30-Jun-19 $6.10 -
1 Rights lapsed on 30 June 2017.
In addition to a continuing employment service condition, the ability to exercise the performance rights is conditional on the IOOF Group achieving certain performance hurdles. Details of the performance criteria are included in the performance rights hurdles at sections 3 and 4 of the Remuneration Report.
The following series performance hurdles were tested during the �nancial year:
Name Type of instrument % vested in year
% forfeited in year1
Managing Director
C Kelaher 2015 deferred shares2 100.0% 0.0%
2015 rights3 66.0% 34.0%
Other Executive KMP
D Coulter 2015 rights3 66.0% 34.0%
S Merlicek 2015 rights3 66.0% 34.0%
R Mota 2015 rights3 66.0% 34.0%
G Riordan 2015 rights3 66.0% 34.0%
1 The percentage forfeited in the year represents the reduction from the maximum number of options or performance rights available to vest due to performance criteria not being achieved.
2 The Remuneration and Nominations Committee performed a “look back” for these deferred shares and determined it was still appropriate to award them.
3 These performance rights are subject to a TSR hurdle. Refer section 2.4 for further details.

51
IOOF annual report 2017
5.2 Summary of Key Management Personnel deferred shares and performance rights holdingsThere have been no alterations to the terms of share-based payment transactions during the current or the prior reporting years. Details on deferred ordinary shares and performance rights in the Company that were granted as compensation to each key management person during the reporting year and details on the vesting pro�les of each are as follows:
Name Type of instrument
Grant date
Number granted1
Balance as at
1 Jul 16
Granted as
compen-sation
Exercised Forfeited/Lapsed
Balance as at
30 Jun 17
Deferred shares vested during
the year
Financial years in
which grant
vests/vested
Managing Director
C Kelaher 2017 rights 24-Nov-16 120,000 - 120,000 - - 120,000 2019
2016 rights 26-Nov-15 75,000 75,000 - - - 75,000 2018
2015 rights 25-Nov-14 75,000 75,000 - - (25,500) 49,500 2017
2014 rights 26-Nov-13 100,000 54,000 - (54,000) - - 2016
2012 rights 1-Jul-11 150,000 32,175 - (32,175) - - 2015-2017
2017 deferred shares2
30-Jun-17 35,420 - 35,420 - - 35,420 - 2019
2016 deferred shares
30-Jun-16 41,895 41,895 - - - 41,895 41,895 2018
2015 deferred shares
19-Aug-15 26,984 26,984 - (26,984) - - - 2017
Other Executive KMP
D Coulter 2017 rights 9-Sep-16 30,000 - 30,000 - - 30,000 2019
2016 rights 2-Jul-15 15,000 15,000 - - - 15,000 2018
2015 rights 18-Jul-14 25,000 25,000 - - (4,250) 20,750 2017
2014 rights 22-Aug-13 25,000 19,250 - (19,250) - - 2016
S Merlicek 2017 rights 9-Sep-16 30,000 - 30,000 - (30,000) - 2019
2016 rights 2-Jul-15 15,000 15,000 - - (15,000) - 2018
2015 rights 18-Jul-14 25,000 25,000 - - (4,250) 20,750 2017
R Mota 2017 rights 9-Sep-16 30,000 - 30,000 - - 30,000 2019
2016 rights 2-Jul-15 15,000 15,000 - - - 15,000 2018
2015 rights 18-Jul-14 25,000 25,000 - - (4,250) 20,750 2017
2014 rights 22-Aug-13 25,000 19,250 - (19,250) - - 2016
G Riordan 2017 rights 9-Sep-16 30,000 - 30,000 - - 30,000 2019
2016 rights 2-Jul-15 15,000 15,000 - - - 15,000 2018
2015 rights 18-Jul-14 25,000 25,000 - - (4,250) 20,750 2017
2014 rights 22-Aug-13 25,000 19,250 - (19,250) - - 2016
1 Exercise price at grant date is $nil.
2 In August 2017, Mr Kelaher was awarded an STI amount of $1,046,648 for the 2017 �nancial year of which one-third was settled in the form of deferred shares. The number of deferred shares issued was 35,420 which will vest in July 2018 subject to Board look-back provisions.

52
IOOF annual report 2017
Remuneration report (cont’d)
5.3 Performance rights granted since the end of the �nancial yearThe Board resolved on 1 August 2017 to o�er the following performance rights to Other Executive KMP:
Name Type of instrument Number granted
Vesting date
Exercise price
$
D Coulter LTI performance rights 30,000 30-Jun-20 $nil
R Mota LTI performance rights 30,000 30-Jun-20 $nil
G Riordan LTI performance rights 20,000 30-Jun-20 $nil
In addition to continued service to the IOOF Group, the performance hurdle remains unchanged from previous TSR hurdle over three years as outlined in section 3.2.2.
6. Summary of Key Management Personnel ContractsDetails of the employment contracts, as applied during the �nancial year, are as follows:
Executive Term Termination notice period – IOOF1,2
Termination notice period – Executive
Managing Director
C Kelaher Ongoing 12 months 3 months
Other Executive KMP
D Coulter Ongoing 6 months 3 months
S Merlicek Ongoing 6 months 3 months
R Mota Ongoing 7 months 5 weeks
G Riordan Ongoing 6 months 6 months
1 Termination provisions - the IOOF Group may elect to make a payment in lieu of part or all of the notice periods, incorporating unpaid leave entitlements and pro-rated entitlement to STI (if applicable).
2 The Board has discretion regarding treatment of unvested short and long-term incentives.
7. Shareholdings of Key Management Personnel The relevant interest of KMP in the shares issued by the Company, is as follows:
Ordinary shares Balance at 1 July
Received on vesting of performance
Net other change
Balance at 30 June1
No. No. No. No.
Managing Director
C Kelaher 2017 3,305,290 113,159 25,000 3,443,449
2016 4,856,291 352,817 (1,903,818) 3,305,290
Other Executive KMP
D Coulter 2017 252,043 19,250 - 271,293
2016 242,043 25,000 (15,000) 252,043
S Merlicek 2017 170,000 - (70,000) 100,000
2016 141,805 25,000 3,195 170,000
R Mota 2017 93,009 19,250 (9,250) 103,009
2016 68,009 25,000 - 93,009
G Riordan 2017 25,000 19,250 - 44,250
2016 - 25,000 - 25,000
1 The equity holdings for the above individuals is inclusive of both direct and indirect shareholdings.

53
IOOF annual report 2017
8. Non-Executive Directors’ Remuneration8.1 OverviewNon-Executive Directors are remunerated for their skilled input, time responsibilities and commitment to the IOOF Group through the payment of a �xed fee inclusive of superannuation. Non-Executive Directors do not receive additional fees for service on individual Board Committees or subsidiary companies.
To ensure that independence and impartiality is maintained, fees to Non-Executive Directors are not linked to the performance of the Company and Non-Executive Directors are not eligible to participate in any of the IOOF Group’s incentive arrangements.
8.2 Terms of appointmentAll Non-Executive Directors have letters of appointment detailing the terms under which they are engaged. The term of appointment for each is open-ended, subject to the provisions of the Corporations Act and the Company’s Constitution. Under the Constitution, one-third of Directors must retire from o�ce each year and may seek re-election by shareholders at the Annual General Meeting of the Company.
The Company’s Constitution requires that the aggregate remuneration paid or provided to all Non-Executive Directors in any �nancial year by the Company, its subsidiaries and associated entities may not exceed an amount approved by shareholders. This ceiling amount includes all remuneration provided to Non-Executive Directors, including superannuation but not including retirement bene�ts. The current limit of $1,250,000 per annum was approved by shareholders at the 2013 Annual General Meeting and the remuneration for all Non-Executive Directors remains within the shareholder approved limits.
Elements Details
Current Board fees 2016/2017 Fees per annum were:IOOF Holdings Board Chairperson fee $285,000 IOOF Holdings Board Non-Executive Director fee $170,000
Post-employment bene�ts Superannuation contributions are made at a rate of 9.5% (up to the Government’s prescribed maximum contributions limit) which satis�es the IOOF Group’s statutory superannuation contributions and are included in the base fee.The Board withdrew the retirement bene�t from the potential remuneration for new Non-Executive Directors. The program continued for Directors appointed prior to 13 April 2003 to ful�l the terms of an historical agreement. However the maximum payment available was capped at $475,000. This bene�t provided for a cash based payment to Non-Executive Directors at the time of their retirement and, subject to the cap noted above, was calculated as follows:
Period of service as a Non-Executive Director Bene�t Value1
0 to < 3 years Nil
3 to 5 years AAE times 1.0
> 5 years to 10 years AAE times 1.5
> 10 years AAE times 2.0
The retirement bene�ts plan sole participant was R Sexton and a payment of $475,000 was paid upon his retirement on 24 November 2016. This plan is no longer in operation.
1 “AAE” = Annual Average Emoluments over the last 3 years of service to date of retirement.

54
IOOF annual report 2017
Remuneration report (cont’d)
8.3 Shareholdings of Non-Executive Directors The relevant interest of each Non-Executive Director in the shares issued by the Company, as noti�ed by the Directors to the ASX in accordance with s.205G(1) of the Corporations Act 2001 is as follows:
Name Balance as at 1 Jul 2016
Shares from changes during the year
Balance as at 30 Jun 2017 1
Balance as at report sign-o� date
G Venardos 41,816 10,000 51,816 51,816
J Harvey 23,578 - 23,578 23,578
A Gri�ths 30,000 - 30,000 30,000
E Flynn 20,000 - 20,000 20,000
J Selak - 25,000 25,000 25,000
1 The following shares (included in the holdings above) were held on behalf of the Non-Executive Directors (ie. indirect bene�cially held shares) as at 30 June 2017: G Venardos - 51,816; J Harvey - 23,578; A Gri�ths - 30,000; E Flynn - 20,000; and J Selak - 25,000.
9. Payments to persons before taking o�ceNo Director or member of senior management appointed during the year received a payment as part of his or her consideration for agreeing to hold the position.
This Directors’ report is signed in accordance with a resolution of the Directors made pursuant to s.298(2) of the Corporations Act 2001.
This report is made by a resolution of the Directors:
Mr George Venardos Chairman
29 August 2017

55
IOOF annual report 2017
Directors’ declarationFor the year ended 30 June 2017
1. In the opinion of the Directors of the Company:
(a) the consolidated �nancial statements and notes set out on pages 61 to 117, and the Remuneration Report, set out on pages 38 to 54 in the Directors’ Report, are in accordance with the Corporations Act 2001 including:
(i) giving a true and fair view of the IOOF Group’s �nancial position as at 30 June 2017 and its performance for the �nancial year ended on that date; and
(ii) complying with Australian Accounting Standards and the Corporations Regulations 2001; and
(b) there are reasonable grounds to believe that the Company will be able to pay its debts as and when they become due and payable.
2. The Directors have been given the declarations required by Section 295A of the Corporations Act 2001 from the Managing Director and Chief Financial O�cer for the �nancial year ended 30 June 2017.
3. The Directors draw attention to section 7-2 to the consolidated �nancial statements, which includes a statement of compliance with International Financial Reporting Standards.
Signed in accordance with a resolution of the Directors:
Mr George Venardos Chairman Melbourne
29 August 2017

56
IOOF annual report 2017
30
Liability limited by a scheme approved under Professional Standards Legislation.
KPMG, an Australian partnership and a member firm of the KPMG network of independent member firms affiliated with KPMG International Cooperative (“KPMG International”), a Swiss entity.
Lead Auditor’s Independence Declaration under
Section 307C of the Corporations Act 2001
To the Directors of IOOF Holdings Ltd
I declare that, to the best of my knowledge and belief, in relation to the audit of IOOF Holdings Ltd for the financial year ended 30 June 2017 there have been:
i. no contraventions of the auditor independence requirements as set out in the Corporations Act 2001 in relation to the audit; and
ii. no contraventions of any applicable code of professional conduct in relation to the audit.
KPMG KPMG
DM Waters Rachel Milum
Partner Partner
Melbourne Melbourne
29 August 2017 29 August 2017
31
KPMG, an Australian partnership and a member firm of the KPMG network of independent member firms affiliated with KPMG International Cooperative (“KPMG International”), a Swiss entity.
Liability limited by a scheme approved under Professional Standards Legislation.
Independent Auditor’s Report
To the members of IOOF Holdings Ltd
Opinion
We have audited the Financial Report of IOOF Holdings Ltd (the Company).
In our opinion, the accompanying Financial Report of the Company is in accordance with the Corporations Act 2001, including:
• giving a true and fair view of the Group’s financial position as at 30 June 2017 and of its financial performance for the year ended on that date; and
• complying with Australian Accounting Standards and the Corporations Regulations 2001.
The Financial Report comprises:
• Consolidated statement of financial position as at 30 June 2017;
• Consolidated statement of comprehensive income, Consolidated statement of changes in equity, and Consolidated statement of cash flows for the year then ended;
• Notes including a summary of significant accounting policies; and
• Directors’ Declaration.
The Group consists of the Company and the entities it controlled at the year-end or from time to time during the financial year.
Basis for opinion
We conducted our audit in accordance with Australian Auditing Standards. We believe that the audit evidence we have obtained is sufficient and appropriate to provide a basis for our opinion.
Our responsibilities under those standards are further described in the Auditor’s responsibilities for the audit of the Financial Report section of our report.
We are independent of the Group in accordance with the Corporations Act 2001 and the ethical requirements of the Accounting Professional and Ethical Standards Board’s APES 110 Code of Ethics for Professional Accountants (the Code) that are relevant to our audit of the Financial Report in Australia. We have fulfilled our other ethical responsibilities in accordance with the Code.
Key Audit Matters
The Key Audit Matter we identified is:
• Valuation of Goodwill and Intangible Assets
Key Audit Matters are those matters that, in our professional judgment, were of most significance in our audit of the Financial Report of the current period.
These matters were addressed in the context of our audit of the Financial Report as a whole, and in forming our opinion thereon, and we do not provide a separate opinion on these matters.

57
IOOF annual report 2017
31
KPMG, an Australian partnership and a member firm of the KPMG network of independent member firms affiliated with KPMG International Cooperative (“KPMG International”), a Swiss entity.
Liability limited by a scheme approved under Professional Standards Legislation.
Independent Auditor’s Report
To the members of IOOF Holdings Ltd
Opinion
We have audited the Financial Report of IOOF Holdings Ltd (the Company).
In our opinion, the accompanying Financial Report of the Company is in accordance with the Corporations Act 2001, including:
• giving a true and fair view of the Group’s financial position as at 30 June 2017 and of its financial performance for the year ended on that date; and
• complying with Australian Accounting Standards and the Corporations Regulations 2001.
The Financial Report comprises:
• Consolidated statement of financial position as at 30 June 2017;
• Consolidated statement of comprehensive income, Consolidated statement of changes in equity, and Consolidated statement of cash flows for the year then ended;
• Notes including a summary of significant accounting policies; and
• Directors’ Declaration.
The Group consists of the Company and the entities it controlled at the year-end or from time to time during the financial year.
Basis for opinion
We conducted our audit in accordance with Australian Auditing Standards. We believe that the audit evidence we have obtained is sufficient and appropriate to provide a basis for our opinion.
Our responsibilities under those standards are further described in the Auditor’s responsibilities for the audit of the Financial Report section of our report.
We are independent of the Group in accordance with the Corporations Act 2001 and the ethical requirements of the Accounting Professional and Ethical Standards Board’s APES 110 Code of Ethics for Professional Accountants (the Code) that are relevant to our audit of the Financial Report in Australia. We have fulfilled our other ethical responsibilities in accordance with the Code.
Key Audit Matters
The Key Audit Matter we identified is:
• Valuation of Goodwill and Intangible Assets
Key Audit Matters are those matters that, in our professional judgment, were of most significance in our audit of the Financial Report of the current period.
These matters were addressed in the context of our audit of the Financial Report as a whole, and in forming our opinion thereon, and we do not provide a separate opinion on these matters.

58
IOOF annual report 2017
32
Valuation of Goodwill and Intangible Assets - $954.8m and $441.1m
Refer to Note 4-3 Goodwill and 4-2 Intangible Assets to the Financial Report
The key audit matter How the matter was addressed in our audit
A key audit matter was whether the Group’s value in use models for goodwill and intangible assets impairment included assumptions that were supportable and appropriate under accounting standards. Specific intangible assets we focussed on related to customer relationships and brand names. The size of the goodwill and intangible assets relative to the total assets of the Group (being 34.7% and 16.0% respectively) and the level of judgement required by the Group, contributed to this being a key audit matter. The models and forecast assumptions incorporated significant judgement in respect of key factors such as discount rates, revenue growth, and forecasted funds under management, as well as economic assumptions such as inflation rates. Changes in the underlying assumptions can significantly impact the recoverable amount of the relevant intangible assets and can therefore give rise to impairment. The Group recorded an impairment charge of $38.6m against goodwill. This related to the Perennial Cash Generating Unit (“CGU”) as a result of reduced profitability from both lower revenue due to institutional outflows, and higher costs due to the absence of operational scale and subsidisation following the divestment of other Perennial entities. This increased the sensitivity of the model to small changes and further increased our audit effort in this key audit area. We involved valuation specialists to supplement our senior audit team members in assessing this key audit matter.
Working with our valuation specialists, our procedures included: • Testing of key controls, such as the review and
approval of internal forecasts, to evaluate the Group’s goodwill and intangible asset valuation process;
• We considered the appropriateness of the value in use method applied by the Group to perform the annual test of goodwill and intangibles for impairment against the requirements of the accounting standards.
• For goodwill, customer relationships and brand names we challenged the Group’s key assumptions, in particular those relating to discount rates, revenue growth and forecasted funds under management by analysing historical data and taking into consideration expected future events, and corroborating the key market related assumptions to external data, through the following procedures: - We compared relevant data in the models to
the latest Board approved forecasts. - We assessed the accuracy of previous Group
forecasts to inform our evaluation of forecasts incorporated in the models.
- We independently developed a discount rate range considered comparable using publicly available market data for comparable entities, adjusted by risk factors specific to the Group’s CGUs and the industry they operate in.
- We assessed the integrity of the value in use models used, including the accuracy of the underlying calculation formulas.
- We considered the sensitivity of the models by varying key assumptions such as revenue growth and discount rates, within a reasonably possible range, to identify those CGUs at higher risk of impairment and to focus our further procedures.
- We assessed the key assumptions for consistent application across the Group.
• We recalculated the impairment charge from the Perennial CGU model against the recorded amount and reconciled it to the amount disclosed; and
• We assessed the disclosures in the financial report using our understanding of the issue obtained from our testing and against the requirements of the accounting standards.
33
Other Information
Other Information is financial and non-financial information in IOOF Holdings Ltd’s annual reporting which is provided in addition to the Financial Report and the Auditor’s Report. The Directors are responsible for the Other Information.
The Other Information we obtained prior to the date of this Auditor’s Report was the Directors’ report and Remuneration report. The remaining other information is expected to include: About IOOF, Our Major Brands, Chairman’s Letter, Managing Director’s Commentary, Our financial Performance, Divisional Updates and Shareholder Information and is expected to be made available to us after the date of the Auditor's Report.
Our opinion on the Financial Report does not cover the Other Information and, accordingly, we do not and will not express an audit opinion or any form of assurance conclusion thereon, with the exception of the Remuneration Report and our related assurance opinion.
In connection with our audit of the Financial Report, our responsibility is to read the Other Information. In doing so, we consider whether the Other Information is materially inconsistent with the Financial Report or our knowledge obtained in the audit, or otherwise appears to be materially misstated.
We are required to report if we conclude that there is a material misstatement of this Other Information, and based on the work we have performed on the Other Information that we obtained prior to the date of this Auditor’s Report we have nothing to report.
Responsibilities of the Directors for the Financial Report
The Directors are responsible for:
• preparing the Financial Report that gives a true and fair view in accordance with Australian Accounting Standards and the Corporations Act 2001
• implementing necessary internal control to enable the preparation of a Financial Report that gives a true and fair view and is free from material misstatement, whether due to fraud or error
• assessing the Group’s ability to continue as a going concern. This includes disclosing, as applicable, matters related to going concern and using the going concern basis of accounting unless they either intend to liquidate the Group or to cease operations, or have no realistic alternative but to do so.
Auditor’s responsibilities for the audit of the Financial Report
Our objective is:
• to obtain reasonable assurance about whether the Financial Report as a whole is free from material misstatement, whether due to fraud or error; and
• to issue an Auditor’s Report that includes our opinion.
Reasonable assurance is a high level of assurance, but is not a guarantee that an audit conducted in accordance with Australian Auditing Standards will always detect a material misstatement when it exists.
Misstatements can arise from fraud or error. They are considered material if, individually or in the aggregate, they could reasonably be expected to influence the economic decisions of users taken on the basis of this Financial Report.
A further description of our responsibilities for the audit of the Financial Report is located at the Auditing and Assurance Standards Board website at: http://www.auasb.gov.au/auditors_files/ar2.pdf. This description forms part of our Auditor’s Report.
59
IOOF annual report 2017
33
Other Information
Other Information is financial and non-financial information in IOOF Holdings Ltd’s annual reporting which is provided in addition to the Financial Report and the Auditor’s Report. The Directors are responsible for the Other Information.
The Other Information we obtained prior to the date of this Auditor’s Report was the Directors’ report and Remuneration report. The remaining other information is expected to include: About IOOF, Our Major Brands, Chairman’s Letter, Managing Director’s Commentary, Our financial Performance, Divisional Updates and Shareholder Information and is expected to be made available to us after the date of the Auditor's Report.
Our opinion on the Financial Report does not cover the Other Information and, accordingly, we do not and will not express an audit opinion or any form of assurance conclusion thereon, with the exception of the Remuneration Report and our related assurance opinion.
In connection with our audit of the Financial Report, our responsibility is to read the Other Information. In doing so, we consider whether the Other Information is materially inconsistent with the Financial Report or our knowledge obtained in the audit, or otherwise appears to be materially misstated.
We are required to report if we conclude that there is a material misstatement of this Other Information, and based on the work we have performed on the Other Information that we obtained prior to the date of this Auditor’s Report we have nothing to report.
Responsibilities of the Directors for the Financial Report
The Directors are responsible for:
• preparing the Financial Report that gives a true and fair view in accordance with Australian Accounting Standards and the Corporations Act 2001
• implementing necessary internal control to enable the preparation of a Financial Report that gives a true and fair view and is free from material misstatement, whether due to fraud or error
• assessing the Group’s ability to continue as a going concern. This includes disclosing, as applicable, matters related to going concern and using the going concern basis of accounting unless they either intend to liquidate the Group or to cease operations, or have no realistic alternative but to do so.
Auditor’s responsibilities for the audit of the Financial Report
Our objective is:
• to obtain reasonable assurance about whether the Financial Report as a whole is free from material misstatement, whether due to fraud or error; and
• to issue an Auditor’s Report that includes our opinion.
Reasonable assurance is a high level of assurance, but is not a guarantee that an audit conducted in accordance with Australian Auditing Standards will always detect a material misstatement when it exists.
Misstatements can arise from fraud or error. They are considered material if, individually or in the aggregate, they could reasonably be expected to influence the economic decisions of users taken on the basis of this Financial Report.
A further description of our responsibilities for the audit of the Financial Report is located at the Auditing and Assurance Standards Board website at: http://www.auasb.gov.au/auditors_files/ar2.pdf. This description forms part of our Auditor’s Report.

60
IOOF annual report 2017
34
Report on the Remuneration Report
Opinion
In our opinion, the Remuneration Report of IOOF Holdings Ltd for the year ended 30 June 2017, complies with Section 300A of the Corporations Act 2001.
Directors’ responsibilities
The Directors of the Company are responsible for the preparation and presentation of the Remuneration Report in accordance with Section 300A of the Corporations Act 2001.
Our responsibilities
We have audited the Remuneration Report included in pages 14 to 28 of the financial report for the year ended 30 June 2017.
Our responsibility is to express an opinion on the Remuneration Report, based on our audit conducted in accordance with Australian Auditing Standards.
KPM_INI_01
KPMG KPMG
DM Waters Rachel Milum Partner Partner Melbourne 29 August 2017
Melbourne 29 August 2017
29 August

61
IOOF annual report 2017
Consolidated statement of comprehensive incomeFor the year ended 30 June 2017
2017 2016
Note $’000 $’000
Continuing operations
Revenue 2-3 907,519 907,882
Expenses 2-4 (724,745) (713,217)
Share of pro�ts of associates accounted for using the equity method 3,478 4,831
Finance costs (6,828) (7,353)
Pro�t before tax 179,424 192,143
Income tax expense 2-6 (59,573) (51,601)
Statutory fund
Statutory fund revenue* 5-4 65,016 62,937
Statutory fund expenses* 5-4 (52,124) (58,200)
Income tax (expense)/bene�t - statutory* 5-4 (12,892) (4,737)
Statutory fund contribution to pro�t, net of tax - -
Pro�t for the year from continuing operations 119,851 140,542
Non-controlling interest (3,861) (2,620)
Pro�t attributable to Owners of the Company from continuing operations 115,990 137,922
Discontinued operation
Pro�t for the year from discontinued operation 2-2 - 58,924
Pro�t for the year attributable to owners of the Company 115,990 196,846
Other comprehensive income
Items that may be reclassi�ed subsequently to pro�t or loss:
Net change in fair value of available-for-sale �nancial assets 3,770 3,648
Exchange di�erences on translating foreign operations 15 118
Income tax on other comprehensive income (1,134) (1,109)
Other comprehensive income/(expense) for the year, net of income tax** 2,651 2,657
Non-controlling interest 3,861 2,620
Total comprehensive income for the year 122,502 202,123
Pro�t attributable to:
Owners of the Company 115,990 196,846
Non-controlling interest 3,861 2,620
Pro�t for the year 119,851 199,466
Total comprehensive income attributable to:
Owners of the Company 118,641 199,503
Non-controlling interest 3,861 2,620
Total comprehensive income for the year 122,502 202,123
Earnings per share:
Basic earnings per share (cents per share) 38.7 65.7
Diluted earnings per share (cents per share) 38.6 65.4
Earnings per share - continuing operations:
Basic earnings per share (cents per share) 38.7 46.0
Diluted earnings per share (cents per share) 38.6 45.8
Notes to the consolidated �nancial statements are included on pages 66 to 117.
* A subsidiary of the Company, IOOF Ltd, is a friendly society in accordance with the Life Insurance Act 1995. The funds operated by IOOF Ltd, and any trusts controlled by those funds, are treated as statutory funds in accordance with the Life Insurance Act 1995. These statutory funds are required to be consolidated in accordance with accounting standards and are shown separately from shareholder funds in the �nancial statements.
** Total items that may be reclassi�ed subsequently to pro�t or loss.

62
IOOF annual report 2017
Consolidated statement of �nancial positionFor the year ended 30 June 2017
2017 2016
Note $’000 $’000
Assets
Cash 1-1(d) 208,218 186,992
Receivables 1-1(d) 108,401 102,378
Other �nancial assets 1-1(d) 45,430 43,378
Prepayments 14,403 11,828
Deferred acquisition costs 1,913 2,482
Associates 4-1 21,081 22,667
Property and equipment 21,480 21,863
Intangible assets 4-2 441,079 480,169
Goodwill 4-3 954,867 991,712
Assets relating to statutory funds* 5-1 934,119 879,349
Total assets 2,750,991 2,742,818
Liabilities
Payables 1-1(d) 60,007 68,781
Borrowings 3-2 206,948 206,975
Current tax liabilities 25,813 17,930
Contingent consideration 1-1(d) 1,839 1,491
Provisions 4-4 64,639 62,394
Deferred tax liabilities 2-6 92,949 101,163
Deferred revenue liability 1,800 2,499
Lease incentives 2,429 2,536
Liabilities relating to statutory funds* 5-2 934,119 879,349
Total liabilities 1,390,543 1,343,118
Net assets 1,360,448 1,399,700
Equity
Share capital 3-3 1,434,459 1,436,460
Reserves 3-5 13,349 11,266
Accumulated losses (97,048) (57,501)
Total equity attributable to equity holders of the Company 1,350,760 1,390,225
Non-controlling interest 9,688 9,475
Total equity 1,360,448 1,399,700
Notes to the consolidated �nancial statements are included on pages 66 to 117.
* A subsidiary of the Company, IOOF Ltd, is a friendly society in accordance with the Life Insurance Act 1995. The funds operated by IOOF Ltd, and any trusts controlled by those funds, are treated as statutory funds in accordance with the Life Insurance Act 1995. These statutory funds are required to be consolidated in accordance with accounting standards and are shown separately from shareholder funds in the �nancial statements.

63
IOOF annual report 2017
Consolidated statement of changes in equityFor the year ended 30 June 2017
For the year ended 30 June 2017
Ordinary shares
Treasury shares
Reserves Accu-mulated
losses
Total Non-controlling
interest
Total equity
$’000 $’000 $’000 $’000 $’000 $’000 $’000
Balance at 1 July 2016 1,439,276 (2,816) 11,266 (57,501) 1,390,225 9,475 1,399,700
Total comprehensive income for the year
Pro�t for the year attributable to owners of the Company
- - - 115,990 115,990 3,861 119,851
Other comprehensive income for the year, net of income tax
- - 2,651 - 2,651 - 2,651
Total comprehensive income for the year
- - 2,651 115,990 118,641 3,861 122,502
Contributions by and (distributions to) owners
Dividends to equity holders - - - (155,934) (155,934) (3,648) (159,582)
Share-based payment expense - - 1,295 - 1,295 - 1,295
Operating Risk Financial Reserve - - (144) - (144) - (144)
Transfer from employee equity-settled bene�ts reserve on exercise of options
1,322 - (1,322) - - - -
Treasury shares transferred to recipients during the year
(1,997) 1,997 - - - - -
Transfer of lapsed share options to retained earnings
- - (397) 397 - - -
Purchase of treasury shares - (3,323) - - (3,323) - (3,323)
Total transactions with owners (675) (1,326) (568) (155,537) (158,106) (3,648) (161,754)
Balance at 30 June 2017 1,438,601 (4,142) 13,349 (97,048) 1,350,760 9,688 1,360,448
Notes to the consolidated �nancial statements are included on pages 66 to 117.

64
IOOF annual report 2017
Consolidated statement of changes in equityFor the year ended 30 June 2017
For the year ended 30 June 2016
Ordinary shares
Treasury shares
Reserves Accu-mulated
losses
Total Non-controlling
interest
Total equity
$’000 $’000 $’000 $’000 $’000 $’000 $’000
Balance at 1 July 2015 1,444,903 (7,146) (8,918) (66,224) 1,362,615 9,643 1,372,258
Total comprehensive income for the year
Pro�t for the year attributable to owners of the Company
- - - 196,846 196,846 2,620 199,466
Other comprehensive income for the year, net of income tax
- - 2,657 - 2,657 - 2,657
Total comprehensive income for the year
- - 2,657 196,846 199,503 2,620 202,123
Transactions with owners, recorded directly in equity
Contributions by and (distributions to) owners
Dividends to equity holders - - - (169,430) (169,430) (2,788) (172,218)
Share-based payment expense - - 1,966 - 1,966 - 1,966
Operating Risk Financial Reserve - - 2,799 - 2,799 - 2,799
Proceeds from exercise of options under executive and employee share option plan
210 - - - 210 - 210
Transfer from employee equity-settled bene�ts reserve on exercise of options
5,931 - (5,931) - - - -
Treasury shares transferred to recipients during the year
(11,768) 11,768 - - - - -
Divestment of discontinued operation
- - 18,728 (18,728) - - -
Transfer of lapsed share options to retained earnings
- - (35) 35 - - -
Purchase of treasury shares - (7,438) - - (7,438) - (7,438)
Total transactions with owners (5,627) 4,330 17,527 (188,123) (171,893) (2,788) (174,681)
Balance at 30 June 2016 1,439,276 (2,816) 11,266 (57,501) 1,390,225 9,475 1,399,700
Notes to the consolidated �nancial statements are included on pages 66–117.

65
IOOF annual report 2017
2017 2016
Note $’000 $’000
Cash �ows from operating activities
Receipts from customers 967,166 1,004,844
Payments to suppliers and employees (725,564) (757,836)
Dividends from associates 3,966 2,757
Net stockbroking purchases (55) (596)
Non-recurring professional fees (2,013) (5,061)
Termination and retention incentive payments (3,933) (5,799)
Income taxes paid (60,288) (69,458)
Net cash provided by operating activities 2-5 179,279 168,851
Cash �ows from investing activities
Dividends and distributions received 823 839
Interest received 4,313 5,002
Net proceeds on divestment of discontinued operation, net of tax - 54,586
Acquisition and divestment transaction costs - (1,516)
Interest and other costs of �nance paid (6,608) (7,022)
Gain on divestment of subsidiaries 6,261 -
Purchase of shares in subsidiaries (1,045) -
Proceeds on divestment of other assets 14,814 5,868
Receipt/(payment) of deferred purchase consideration 325 (4,188)
Purchase of non-controlling interests in subsidiaries - (2,112)
Net proceeds from sales/(purchases) of �nancial assets 1,015 (944)
Payments for property and equipment (7,440) (8,390)
Amounts borrowed from other entities 18 352
Payments for intangible assets (4,934) (842)
Net cash provided by investing activities 7,542 41,633
Cash �ows from �nancing activities
Net borrowings repaid (212) (1,087)
Purchase of treasury shares (3,323) (7,438)
Proceeds from exercise of IFL share options - 210
Dividends paid:
- members of the Company (155,934) (169,430)
- non-controlling members of subsidiary entities (3,648) (2,788)
- shareholders entitled to contractual share buy-back - (1,698)
Net cash used in �nancing activities (163,117) (182,231)
Net increase in cash and cash equivalents 23,704 28,253
Cash and cash equivalents at the beginning of year 186,992 150,533
Cash and cash equivalents divested (2,350) -
E�ects of cash reclassi�ed as assets held for sale at 30 June 2015 - 5,314
Operating Risk Financial Reserve cash requirement 3-5 (144) 2,799
E�ects of exchange rate changes on cash and cash equivalents 16 93
Cash and cash equivalents at the end of year 208,218 186,992
Notes to the consolidated �nancial statements are included on pages 66 to 117.
Consolidated statement of cash �owsFor the year ended 30 June 2017

66
IOOF annual report 2017
Notes to the �nancial statementsFor the year ended 30 June 2017
Section 1 – Financial instruments and risk management
The IOOF Group’s activities expose it to a variety of �nancial and non-�nancial risks. Financial risks include: market risks (including price risk, currency risk and interest rate risk), credit risk, statutory fund and liquidity risk. The nature of the �nancial risk exposures arising from �nancial instruments, the objectives, policies and processes for managing these risks, and the methods used to measure them are detailed below. Key non-�nancial exposures, such as operational risk and a failure to meet regulatory compliance obligations, are discussed in detail in the Operating and Financial Review.
1-1 Risk management
IOOF risk management framework
Risk is de�ned as the chance of an event occurring that will have an impact on the strategic or business objectives of the IOOF Group, including a failure to exploit opportunities. The IOOF Group’s risk management process involves the identi�cation of material risks, assessment of consequence and likelihood, implementation of controls to manage risks, and continuous monitoring and improvement of the procedures in place.
The IOOF Group’s objective is to satisfactorily manage its risks in line with the IOOF Group’s Risk Management Policy set by the Board, and this aligns to International Standard ISO 31000. The IOOF Group’s Risk Management Framework manages the risks faced by the IOOF Group, with approaches varying depending on the nature of the risk. The IOOF Group maintains a framework to ensure regulatory compliance obligations are managed in accordance with Australian Standard 3806 Compliance Programs. The IOOF Group’s exposure to all material risks is monitored by the Risk Team and this exposure, and emerging risks, are regularly reported to the Risk and Compliance Committee, and the Board.
The IOOF Group’s income and operating cash �ows are indirectly impacted by changing market conditions. Its exposure is through the impact of market changes on the level of funds under management and administration, and consequently management fee and service fee revenue. Information has been provided below only on the direct impact of changing market conditions to the IOOF Group’s income and operating cash �ows.
Financial risk
The �nancial risk management objectives, policies and processes and the quantitative data about the exposure to risk at the reporting date, as set out in the remainder of this note, excludes the bene�t funds and the controlled unit trusts. This is because the risks associated with �nancial instruments held by the bene�t funds and controlled trusts are borne by the policyholders and members of those funds and trusts, and not the shareholders of the IOOF Group. There is no direct impact on the net pro�t or the equity of the IOOF Group as a consequence of changes in markets as they apply to �nancial instruments held by those funds and trusts at the reporting date.
Similarly the objectives, policies and processes for managing the risks of the IOOF Group are separate and distinct from those for the bene�t funds and trusts. The funds and trusts are managed under extensive regulatory requirements, and in accordance with speci�c investment guidelines, risk management strategies, risk management plans, and product disclosure statements. The IOOF Group is managed under a set of separate corporate policies and review processes that are directed toward the interests of the shareholders of the IOOF Group.
Information in relation to �nancial risks associated with the bene�t funds and controlled trusts is available in their Product Disclosure Statements and the individual annual �nancial reports of those trusts.
Further information in relation to the Australian Accounting Standards requirement to consolidate the bene�t funds and controlled trusts in the consolidated �nancial statements of the IOOF Group is available in Note 7-3(b) Basis of consolidation.
(a) Market risk
(i) Price risk
Price risk is the risk that the fair value or future earnings of a �nancial instrument will �uctuate because of changes in market prices (other than from interest rate risk or currency risk, as described later). The �nancial instruments managed by the IOOF Group that are impacted by price risk consist of investment units held in trusts and available for sale �nancial assets.
The price risk associated with the units held in trusts is that the fair value of those units will �uctuate with movements in the redemption value of those units, which in turn is based on the fair value of the underlying assets held by the trusts. Available for sale �nancial assets are exposed to price risk as the share price �uctuates.

67
IOOF annual report 2017
IOOF Group sensitivity
At 30 June 2017 had the price of the units / shares held by the IOOF Group in unlisted unit trusts / shares in other entities increased / decreased by 1% (2016: 1%) with all other variables held constant, post-tax pro�t for the year would increase / decrease by $5,000 (2016: $15,000) as a result of gains / losses recorded through pro�t or loss, and available-for-sale reserves would increase / decrease by $178,000 (2016: $147,000).
(ii) Currency risk
The IOOF Group is exposed to insigni�cant foreign exchange risk in relation to the �nancial instruments of its foreign activities in New Zealand and Hong Kong.
(iii) Cash �ow and interest rate risk
Interest rate risk is the risk to the IOOF Group’s earnings and capital arising from changes in market interest rates. The �nancial instruments held that are impacted by interest rate risk consist of cash, loans, and borrowings.
Short and long-term investment mixes and loans to related entities are in�uenced by liquidity policy requirements. Interest rates (both charged and received) are based on market rates, and are closely monitored by management. They are primarily at variable rates of interest, and expose the IOOF Group to cash �ow interest rate risk.
Management regularly assesses the appropriateness of the investment of surplus funds with the objective of maximising returns.
There is limited exposure to fair value interest rate risk because of the relatively short time frame of any �xed rate investments and borrowings.
IOOF Group sensitivity
At 30 June 2017, if interest rates had changed by +/- 100 basis points (2016: +/- 100 basis points) from the year-end rates with all other variables held constant, post tax pro�t for the year would have increased/decreased by $1,448,000 (2016: $1,451,000). Equity would have been higher/lower by the same amount.
(b) Credit risk
Credit risk refers to the risk that a counterparty will fail to meet its contractual obligations resulting in �nancial loss to the IOOF Group. Credit risk arises for the IOOF Group from cash, receivables and loans.
The IOOF Group mitigates its credit risk by ensuring cash deposits are held with high credit quality �nancial institutions and other highly liquid investments are held with trusts operated by the IOOF Group. Where investments are held in units in a trust operated by the IOOF Group, that trust is subject to the rules of the trust deed and the investment in underlying assets is subject to asset allocation guidelines.
Receivables consist of management fees receivable, service fees receivable and other amounts receivable from related parties. These counterparties generally do not have an independent credit rating, and the IOOF Group assesses the credit quality of the debtor taking into account its �nancial position, past experience with the debtor, and other available credit risk information. In relation to management fees receivable, the IOOF Group is contractually entitled to deduct such fees from investors’ account balances, in accordance with the Product Disclosure Statements, and pass the fees to the Responsible Entity or Trustee. Due to this pass-through process the embedded credit risk is considered minimal. Other receivables are regularly monitored by line management.
The maximum exposure to credit risk at the reporting date is the carrying value of the �nancial assets as summarised in the table included in this note below. The IOOF Group does not hold any signi�cant collateral as security over its receivables and loans, apart from its recourse to certain shares in subsidiaries in relation to loans to executives of subsidiaries.
There are no signi�cant concentrations of credit risk within the IOOF Group.
The IOOF Group does not hold any �nancial assets whose terms have been renegotiated, but which would otherwise be past due or impaired.
The credit quality of the �nancial assets that are neither past due nor impaired as at balance date was consistent with that described above, and management assesses the credit risk associated with these reported balances as being minimal. Information in relation to impaired receivables and past due but not impaired receivables is included below.

68
IOOF annual report 2017
Notes to the �nancial statementsFor the year ended 30 June 2017
Impaired receivables
As at 30 June 2017, $3,447,000 trade receivables of the IOOF Group were past due or impaired (2016: $3,495,000). The amount of the impairment provision was $585,000 (2016: $598,000).
Collectability of trade receivables is reviewed on an ongoing basis. Debts which are known to be uncollectible are written o� by reducing the carrying amount directly. An allowance account (provision for impairment of trade receivables) is used when there is objective evidence that the IOOF Group may not be able to collect all amounts due according to the original terms of the receivables. Signi�cant �nancial di�culty of the debtor, probability that the debtor will enter bankruptcy or �nancial reorganisation, and default or delinquency in payments (more than 120 days overdue) are considered indicators that the trade receivable is impaired. The amount of the impairment allowance is the di�erence between the asset’s carrying amount and the present value of estimated future cash �ows, discounted at the original e�ective interest rate. Cash �ows relating to short-term receivables are not discounted if the e�ect of discounting is immaterial.
The amount of the impairment loss is recognised in pro�t or loss within other expenses. When a trade receivable for which an impairment allowance has been recognised becomes uncollectible in a subsequent year, it is written o� against the allowance account. Subsequent recoveries of amounts previously written o� are credited against other expenses in pro�t or loss.
Movements in the provisions for impairment of trade receivables are as follows:
2017 2016
$’000 $’000
Carrying value at 1 July 598 605
Provision for impairment provided/(written back) during the year
(13) 32
Receivables written back during the year as collectible
- (39)
Carrying value at 30 June 585 598
Ageing of trade receivables that were not impaired at 30 June
2017 2016
$’000 $’000
Neither past due nor impaired 54,594 47,561
Past due 31-60 days 1,568 1,042
Past due 61-90 days 563 504
Past due 91-120 days 731 1,351
57,456 50,458
Trade receivables past due but not impaired
3,447 3,495
(c) Statutory Fund Risk
Financial risks are monitored and controlled by selecting appropriate assets to back policy liabilities. The assets are regularly monitored by the Investment Management Committee to ensure there are no material exposures and that liability mismatching issues and other risks such as liquidity risk and credit risk are maintained within acceptable limits. The Investment Management Committee is chaired by an independent expert and its membership is drawn from appropriately skilled senior management. There are no Non-Executive Directors on this Committee.
The IOOF Group’s friendly society operations are subject to regulatory capital requirements which prescribe the amount of capital to be held depending on the type, quality and concentration of investments held. Procedures are in place to monitor compliance with these requirements. Refer to Section 5 - Statutory funds for further details.
(d) Liquidity risk
Liquidity risk relates to the IOOF Group having insu�cient liquid assets to cover current liabilities and unforeseen expenses. The IOOF Group maintains a prudent approach to managing liquidity risk exposure by maintaining su�cient liquid assets and an ability to access a committed line of credit. It is managed by continuously monitoring actual and forecast cash �ows and by matching the maturity pro�les of �nancial assets and liabilities. Temporary surplus funds are invested in highly liquid, low risk �nancial assets.
The IOOF Group had access to undrawn bank borrowing facilities at the balance date, on the terms described and disclosed in section 3-2 Borrowings. The liquidity requirements for licensed entities in the IOOF Group are regularly reviewed and carefully monitored in accordance with those licence requirements.

69
IOOF annual report 2017
Maturities of �nancial liabilities
The tables below analyse the IOOF Group’s �nancial liabilities into relevant maturity groupings based on the remaining years at the balance date to the contractual maturity date. The amounts disclosed therein are the contractual undiscounted cash �ows. Statutory funds are excluded on the basis that monies held in the bene�t funds and controlled trusts are held for the bene�t of the members of those funds, and are not available to shareholders or creditors.
2017 Carrying Amount Contractual cash �ows
Current Non-Current Total 1 year or less
1-5 years 5+ years Total contractual
cash �ows
$’000 $’000 $’000 $’000 $’000 $’000 $’000
Financial liabilities
Payables 60,004 3 60,007 60,004 3 - 60,007
Total payables 60,004 3 60,007 60,004 3 - 60,007
Borrowing facilities 90,000 116,908 206,908 90,000 116,908 - 206,908
Finance lease liabilities
40 - 40 40 - - 40
Total borrowings 90,040 116,908 206,948 90,040 116,908 - 206,948
Contingent consideration
1,447 392 1,839 1,447 392 - 1,839
151,491 117,303 268,794 151,491 117,303 - 268,794
Financial assets available to meet the above �nancial liabilities
Cash 208,218 - 208,218 208,218 - - 208,218
Trade receivables 57,456 - 57,456 57,456 - - 57,456
Other receivables 44,838 718 45,556 44,838 718 - 45,556
Security bonds - 5,389 5,389 - - 5,389 5,389
Total receivables 102,294 6,107 108,401 102,294 718 5,389 108,401
Fair value through pro�t or loss
Shares in listed companies
18 - 18 18 - - 18
Unlisted unit trusts - 679 679 - 679 - 679
Available-for-sale investments
- 25,445 25,445 - - 25,445 25,445
Loans and other receivables
Loans to directors and executives of associated entities
- 8,404 8,404 - - 8,404 8,404
Receivables from statutory bene�t funds
3,731 - 3,731 3,731 - - 3,731
Seed capital receivable
- 7,153 7,153 - - 7,153 7,153
Total other �nancial assets
3,749 41,681 45,430 3,749 679 41,002 45,430
314,261 47,788 362,049 314,261 1,397 46,391 362,049
Net �nancial assets/(liabilities)
162,770 (69,515) 93,255 162,770 (115,906) 46,391 93,255

70
IOOF annual report 2017
Notes to the �nancial statementsFor the year ended 30 June 2017
2016 Carrying Amount Contractual cash �ows
Current Non-Current Total 1 year or less
1-5 years 5+ years Total contractual
cash �ows
$’000 $’000 $’000 $’000 $’000 $’000 $’000
Financial liabilities
Payables 68,778 3 68,781 68,778 3 – 68,781
Total payables 68,778 3 68,781 68,778 3 – 68,781
Borrowing facilities – 206,730 206,730 – 206,730 – 206,730
Finance lease liabilities
192 53 245 192 53 – 245
Total borrowings 192 206,783 206,975 192 206,783 – 206,975
Contingent consideration
721 770 1,491 721 770 – 1,491
69,691 207,556 277,247 69,691 207,556 – 277,247
Financial assets available to meet the above �nancial liabilities
Cash 186,992 – 186,992 186,992 – – 186,992
Trade receivables 50,458 – 50,458 50,458 – – 50,458
Other receivables 44,761 1,785 46,546 44,761 1,785 – 46,546
Security bonds – 5,374 5,374 – – 5,374 5,374
Total receivables 95,219 7,159 102,378 95,219 1,785 5,374 102,378
Fair value through pro�t or loss
Certi�cates of deposit
132 – 132 132 – – 132
Shares in listed companies
181 – 181 181 – – 181
Unlisted unit trusts – 1,963 1,963 – 1,963 – 1,963
Available-for-sale investments
– 20,999 20,999 – – 20,999 20,999
Loans and other receivables
Loans to directors and executives of associated entities
– 8,409 8,409 – – 8,409 8,409
Receivables from statutory bene�t funds
4,541 – 4,541 4,541 – – 4,541
Seed capital receivable
– 7,153 7,153 – – 7,153 7,153
Total other �nancial assets
4,854 38,524 43,378 4,854 1,963 36,561 43,378
287,065 45,683 332,748 287,065 3,748 41,935 332,748
Net �nancial assets/(liabilities)
217,374 (161,873) 55,501 217,374 (203,808) 41,935 55,501

71
IOOF annual report 2017
(e) Accounting policies and fair value estimation
The fair values of �nancial assets and liabilities are equal to the carrying amounts shown in the statement of �nancial position with the exception of �nance lease liabilities which are disclosed in note 3-2 Borrowings.
O�setting assets and liabilities
Financial assets and liabilities are o�set and the net amount presented in the statement of �nancial position when, and only when, the IOOF Group has a legal right to o�set the amounts and intends either to settle on a net basis or to realise the asset and settle the liability simultaneously.
Non-derivative �nancial assets
The IOOF Group initially recognises loans and receivables and deposits on the date that they are originated. All other �nancial assets (including assets designated at fair value through pro�t or loss) are recognised initially on the date at which the IOOF Group becomes a party to the contractual provisions of the instrument.
The IOOF Group derecognises a �nancial asset when the contractual rights to the cash �ows from the asset expire, or it transfers the rights to receive the contractual cash �ows on the �nancial asset in a transaction in which substantially all the risks and rewards of ownership of the �nancial asset are transferred. Any interest in transferred �nancial assets that is created or retained by the IOOF Group is recognised as a separate asset or liability.
The IOOF Group has the following non-derivative �nancial assets:
• cash;
• �nancial assets at fair value through pro�t or loss;
• loans and receivables; and
• available-for-sale �nancial assets.
Cash
Cash includes cash on hand, deposits held at call with �nancial institutions, other short-term, highly liquid investments with original maturities of three months or less that are readily convertible to known amounts of cash.
Financial assets at fair value through pro�t or loss
A �nancial asset is classi�ed as at fair value through pro�t or loss if the IOOF Group manages such investments and makes purchase and sale decisions in accordance with the IOOF Group’s documented risk management or investment strategy. Upon initial recognition attributable transaction costs are recognised in pro�t or loss when incurred. Financial assets at fair value through pro�t or loss are measured at fair value, and changes therein are recognised in pro�t or loss.
Units in unlisted trusts are carried at the current unit price for redemption of those units with the trust.
The fair value of �nancial instruments traded in active markets is based on quoted market prices at the reporting date. The quoted market price used for �nancial assets is the closing price.
Loans and receivables
Loans and receivables are non-derivative �nancial assets with �xed or determinable payments that are not quoted on an active market. They arise when the IOOF Group provides money, assets, or services directly to a debtor with no intention of selling the receivable. Subsequent to initial recognition, loans and receivables are measured at amortised cost using the e�ective interest method and closely approximate their estimated fair value due to their short-term nature.
Available-for-sale �nancial assets
Available-for-sale �nancial assets are non-derivative assets comprising principally marketable equity securities that are either designated in this category or are not classi�ed in any of the other categories of �nancial instruments. Available-for-sale �nancial assets are recognised initially at fair value plus any directly attributable transaction costs.
Subsequent to initial recognition, they are measured at fair value and changes therein, other than impairment losses, are recognised in other comprehensive income and presented within equity in the available-for-sale investment revaluation reserve. When an investment is derecognised, the cumulative gain or loss in equity is transferred to pro�t or loss.

72
IOOF annual report 2017
Notes to the �nancial statementsFor the year ended 30 June 2017
Non-derivative �nancial liabilities
The IOOF Group initially recognises �nancial liabilities on the date at which the IOOF Group becomes a party to the contractual provisions of the instrument. The IOOF Group derecognises a �nancial liability when its contractual obligations are discharged, cancelled or expire.
The IOOF Group has the following non-derivative �nancial liabilities:
• payables;
• borrowings (including �nance leases); and
• other �nancial liabilities (including contingent consideration).
Such �nancial liabilities are recognised initially at fair value plus any directly attributable transaction costs. Subsequent to initial recognition these �nancial liabilities are measured at amortised cost using the e�ective interest method.
Payables
The carrying value of payables are assumed to approximate their fair values due to their short-term nature.
Borrowings and �nance leases
Borrowings and �nance leases are further explained in section 3-2 Borrowings.
Contingent consideration
The contingent consideration amounts payable can rise and fall depending on performance hurdles achieved during the deferral period speci�c to each agreement which may include revenue targets, gross margin targets and/or FUMAS retention requirements.
Where contingent consideration is due for payment after 12 months, the estimated amounts payable are discounted. Assumptions used include pre-tax discount rates in the range of 3-4% which were based on market interest rates upon acquisition of related intangibles.
1-2 Financial Instruments
Fair value hierarchy
The fair values of �nancial assets and liabilities are equal to the carrying amounts shown in the statement of �nancial position with the exception of �nance lease liabilities which are disclosed in note 3-2 Borrowings.
The table below analyses �nancial instruments carried at fair value, by valuation method.
Level 1 Level 2 Level 3 Total
30 June 2017 $’000 $’000 $’000
Financial assets measured at fair value
Available-for-sale investments 25,445 - - 25,445
Shares in listed companies 18 - - 18
Unlisted unit trusts - 679 - 679
25,463 679 - 26,142
Financial liabilities measured at fair value
Contingent consideration - - 1,839 1,839
- - 1,839 1,839
30 June 2016
Financial assets measured at fair value
Available-for-sale investments 20,999 - - 20,999
Certi�cates of deposit - 132 - 132
Shares in listed companies 181 - - 181
Unlisted unit trusts - 1,963 - 1,963
21,180 2,095 - 23,275
Financial liabilities measured at fair value
Contingent consideration - - 1,491 1,491
- - 1,491 1,491

73
IOOF annual report 2017
The de�nitions of each level and the valuation techniques used are as follows:
• Level 1: quoted closing prices (unadjusted) in active markets for identical assets or liabilities.
• Level 2: inputs other than quoted prices included with Level 1 that are observable for the asset or liability, either directly (ie. as prices) or indirectly (ie. derived from prices). Level 2 fair values for the over-the-counter foreign exchange and index swap are provided by the counterparty and veri�ed by the IOOF Group. Fair values are derived from published market indices and include adjustments to take account of the credit risk of the IOOF Group entity and counterparty.
• Level 3: inputs for the asset or liability that are not based on observable market data (unobservable inputs).
The IOOF Group recognises transfers between levels of the fair value hierarchy as of the end of the reporting year during which the transfer has occurred. There were no transfers between Level 1 to Level 2 of the fair value hierarchy during the year ended 30 June 2017.
Reconciliation of movements in level 3 �nancial liabilities Contingent consideration
$’000
Opening balance as at 1 July 2016 1,491
Acquisition of intangibles 1,069
Fair value gain from derecognition of contingent consideration payable (209)
Unwinding of discount 36
Settlement of contingent consideration (548)
Closing balance as at 30 June 2017 1,839

74
IOOF annual report 2017
Notes to the �nancial statementsFor the year ended 30 June 2017
Section 2 - Results for the year
This section focuses on the results and performance of the IOOF Group. On the following pages you will �nd disclosures explaining the IOOF Group’s results for the year, segmental information, taxation and earnings per share.
Where an accounting policy is speci�c to a single note, the policy is described in the note to which it relates.
2-1 Operating segmentsThe IOOF Group has the following �ve strategic divisions, which are its reportable segments. All segments’ operating results are regularly reviewed by the IOOF Group’s Managing Director to make decisions about resources to be allocated to the segment and assess its performance, and for which discrete �nancial information is available.
Financial advice and distribution
The provision of �nancial planning advice and stockbroking services supported by services such as investment research, training, compliance support and access to �nancial products.
Platform management and administration
The provision of administration and management services through master trust platforms, which o�er a single access point to a range of investment products.
Investment management
The management and investment of monies on behalf of corporate, superannuation, institutional clients and private individual investor clients.
Trustee services
The provision of estate planning, trustee, custodial, agency and estate administration services to clients.
Corporate and other
Corporate and other costs include those of a strategic, shareholder or governance nature incurred in carrying on business as a listed entity managing multiple business units.
Information regarding the results of each reportable segment is included below. Performance is measured based on segment underlying pro�t before income tax as management believes that such information is the most relevant in evaluating the results of certain segments relative to other entities that operate within these industries.

75
IOOF annual report 2017
Financial advice and distribution
Platform management
and administration
Investment management
Trustee services Corporate and other
Total
2017$’000
2016$’000
2017$’000
2016$’000
2017$’000
2016$’000
2017$’000
2016$’000
2017$’000
2016$’000
2017$’000
2016$’000
External management and service fee revenue
263,494 260,285 387,608 394,082 81,942 99,318 26,695 24,995 - - 759,739 778,680
External other fee revenue
16,167 22,656 6,239 5,829 2,146 1,847 3,833 4,213 489 562 28,874 35,107
Service fees and other direct costs
(126,443) (119,933) (109,026) (113,866) (26,339) (43,187) (2,321) (2,171) 398 419 (263,731) (278,738)
Deferred acquisition costs
(372) (603) (157) (517) - - - - - - (529) (1,120)
Gross Margin 152,846 162,405 284,664 285,528 57,749 57,978 28,207 27,037 887 981 524,353 533,929
Stockbroking revenue 85,478 73,841 - - - - - - - - 85,478 73,841
Stockbroking service fees expense
(48,549) (41,683) - - - - - - - - (48,549) (41,683)
Stockbroking net contribution
36,929 32,158 - - - - - - - - 36,929 32,158
Inter-segment revenuei 75,467 71,879 - - - - 283 385 139 137 75,889 72,401
Inter-segment expensesi
(3,434) (4,775) (72,214) (67,367) (241) (259) - - - - (75,889) (72,401)
Net Operating Revenue
261,808 261,667 212,450 218,161 57,508 57,719 28,490 27,422 1,026 1,118 561,282 566,087
Other external revenue 3,028 3,537 - 375 75 1,887 - - 1,197 549 4,300 6,348
Finance income 603 800 1 2 436 1,236 - - 4,190 3,743 5,230 5,781
Inter-segment revenuei 12 17 - - - - - - - - 12 17
Share of net pro�ts of associates
816 1,146 - - 2,662 3,685 - - - - 3,478 4,831
Operating and other expenditure
(148,755) (147,715) (95,853) (99,392) (14,284) (19,769) (18,341) (18,601) (40,682) (41,477) (317,915) (326,954)
Share-based payments expense
(102) (409) (189) (503) (211) (296) (15) (20) (778) (726) (1,295) (1,954)
Finance costs (43) (69) - - - - - - (6,785) (7,284) (6,828) (7,353)
Inter-segment expenses(i)
- - (12) (17) - - - - - - (12) (17)
Depreciation (3,119) (3,558) (3,454) (3,048) (512) (1,087) (563) (226) - - (7,648) (7,919)
Amortisation of intangible assets - IT Development
- - (1,737) (1,737) - - - - - - (1,737) (1,737)
Non-controlling interests
(3,861) (2,620) - - - - - - - - (3,861) (2,620)
Income tax expense (34,033) (34,361) (33,939) (34,820) (12,967) (11,996) (2,876) (2,578) 18,166 20,515 (65,649) (63,240)
UNPAT from continuing operations
76,354 78,435 77,267 79,021 32,707 31,379 6,695 5,997 (23,666) (23,562) 169,357 171,270
Discontinued Operations
- 2,097
UNPAT 169,357 173,367
i Segment revenues, expenses and results include transfers between segments. Such transfers are priced on a commercial basis and are eliminated on consolidation.
Segment disclosures have been prepared on an underlying (UNPAT) basis as discussed in the Operating and Financial Review section of the Directors’ Report. Comparatives have been restated to be on a comparable basis.

76
IOOF annual report 2017
Notes to the �nancial statementsFor the year ended 30 June 2017
Reconciliation of reportable segment revenues and expenses
2017 2016
Note $’000 $’000
Pro�t for the year from continuing operations 119,851 140,542
Less non-controlling interest (3,861) (2,620)
Pro�t attributable to Owners of the Company from continuing operations 115,990 137,922
Pro�t for the year from discontinued operation - 58,924
Pro�t attributable to Owners of the Company - total 115,990 196,846
Underlying net pro�t after tax pre-amortisation (UNPAT) adjustments:
Amortisation of intangible assets 2-4 38,611 39,681
Termination and retention incentive payments 2-4 4,125 6,005
Gain on divestment of subsidiaries 2-2,2-3 (6,261) (71,988)
Pro�t on divestment of assets 2-3 (11,930) (8,125)
Non-recurring professional fees 2-4 2,013 5,061
Acquisition tax provision release (5,707) -
Impairment of goodwill 2-4 38,592 -
Unwind of deferred tax liability recorded on intangible assets (10,056) (10,056)
Acquisition and divestment transaction costs - 1,516
Onerous contracts 2-4 - 951
Reinstatement of Perennial non-controlling interests - (825)
Income tax attributable 3,980 14,301
UNPAT 169,357 173,367
Discontinued operation - (2,097)
UNPAT from continuing operations 169,357 171,270
The signi�cant accounting policies which apply to the major revenue and expense items below follow each of the notes. More general information on how these are recognised/measured can be found in note 7-2 Basis of preparation.
2-2 Discontinued operationIn the prior year Perennial Fixed Interest and Perennial Growth Management were divested to Henderson for an upfront consideration of $71.6m and a deferred component dependent on future business performance, payable after two and four years. The divestment to Henderson was completed on 1 November 2015. $735k has been recognised as deferred consideration at 30 June 2017. These components of the Perennial Group were previously classi�ed as held-for-sale.
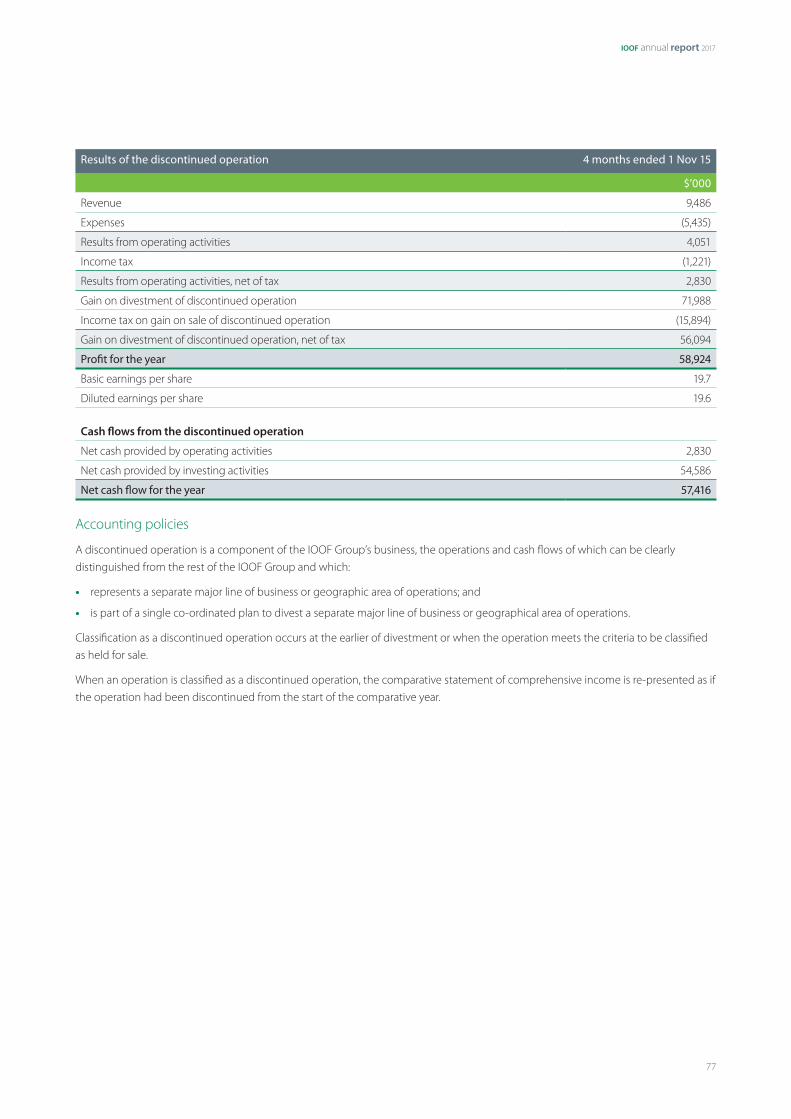
77
IOOF annual report 2017
Results of the discontinued operation 4 months ended 1 Nov 15
$’000
Revenue 9,486
Expenses (5,435)
Results from operating activities 4,051
Income tax (1,221)
Results from operating activities, net of tax 2,830
Gain on divestment of discontinued operation 71,988
Income tax on gain on sale of discontinued operation (15,894)
Gain on divestment of discontinued operation, net of tax 56,094
Pro�t for the year 58,924
Basic earnings per share 19.7
Diluted earnings per share 19.6
Cash �ows from the discontinued operation
Net cash provided by operating activities 2,830
Net cash provided by investing activities 54,586
Net cash �ow for the year 57,416
Accounting policies
A discontinued operation is a component of the IOOF Group’s business, the operations and cash �ows of which can be clearly distinguished from the rest of the IOOF Group and which:
• represents a separate major line of business or geographic area of operations; and
• is part of a single co-ordinated plan to divest a separate major line of business or geographical area of operations.
Classi�cation as a discontinued operation occurs at the earlier of divestment or when the operation meets the criteria to be classi�ed as held for sale.
When an operation is classi�ed as a discontinued operation, the comparative statement of comprehensive income is re-presented as if the operation had been discontinued from the start of the comparative year.

78
IOOF annual report 2017
Notes to the �nancial statementsFor the year ended 30 June 2017
2-3 Revenue
Policy note
2017 2016
$’000 $’000
Management and service fees revenue (i) 759,739 778,680
Stockbroking revenue (ii) 85,478 73,841
External other fee revenue (ii) 28,874 35,107
Finance income (iii)
Interest income on loans to Directors of controlled and associated entities 254 295
Interest income from non-related entities 4,098 4,661
Dividends and distributions received 824 839
Net fair value gains/(losses) on other �nancial assets at fair value through pro�t or loss 54 (14)
5,230 5,781
Other revenue
Service revenue charged to related parties - 1,887
Pro�t on divestment of assets 11,930 8,125
Gain on divestment of subsidiaries 6,261 -
Other 10,007 4,461
28,198 14,473
Total revenue from continuing operations 907,519 907,882
Accounting policies
Revenue is measured at the fair value of the consideration received or receivable.
(i) Management and service fees revenue
The IOOF Group provide management services to unit trusts and funds operated by the IOOF Group at normal commercial rates. Management and service fees earned from the unit trusts and funds are calculated based on an agreed percentage of the respective funds under management or administration as disclosed in the respective product disclosure statements, and are recognised on an accruals basis.
Management and service fees revenue from the provision of �nancial advisory services together with revenue from the rendering of services are recognised at the time the service is provided.
(ii) Stockbroking revenue and external other fee revenue
Other fee revenue and stockbroking revenue from the rendering of services are recognised at the time the service is provided.
(iii) Finance income
Finance income comprises interest income on funds invested (including available-for-sale �nancial assets), dividend income, gains on the divestment of available-for-sale �nancial assets and changes in the fair value of �nancial assets at fair value through pro�t or loss. Interest income is recognised as it accrues in pro�t or loss, using the e�ective interest method. Dividend income is recognised in pro�t or loss on the date that the IOOF Group’s right to receive payment is established, which in the case of quoted securities is the ex-dividend date.

79
IOOF annual report 2017
2-4 Expenses
Policy note
2017 2016
$’000 $’000
Service Fees and other direct costs (i)
Service and marketing fees expense 241,153 254,591
Stockbroking service fees expense 48,549 41,683
Other direct costs 22,578 24,147
312,280 320,421
Operating expenditure
Salaries and related employee expenses (ii) 197,898 199,990
Employee de�ned contribution plan expense (iii) 14,089 14,812
Information technology costs 41,532 50,296
Professional fees 10,959 7,492
Marketing 8,446 9,250
O�ce support and administration 17,120 18,539
Occupancy related expenses 21,989 20,335
Travel and entertainment 5,877 6,066
Other 5 -
317,915 326,780
Other expenses
Share-based payments expense (iv) 1,295 1,954
Acquisition and divestment transaction costs - 1,414
Termination and retention incentive payments (v) 4,125 6,005
Depreciation of property and equipment 7,648 7,919
Amortisation of intangible assets (vi) 38,611 39,681
Amortisation of intangible assets - IT development (vi) 1,737 1,737
Loss on divestment of non-current assets - 174
Impairment of goodwill (vi) 38,592 -
Deferred acquisition costs (vii) 529 1,120
Non-recurring professional fees 2,013 5,061
Onerous contracts - 951
94,550 66,016
Total expenses from continuing operations 724,745 713,217

80
IOOF annual report 2017
Notes to the �nancial statementsFor the year ended 30 June 2017
Accounting policies
Expenses are recognised at the fair value of the consideration paid or payable for services received, further speci�c expense policies are listed below.
(i) Service Fees and other direct costs
Service fees and other direct costs include amounts paid to advisers, dealer groups and other suppliers in the course of operating and marketing products and services of the IOOF Group. Examples of direct costs include custodian fees, audit services and the printing and mailing of client statements and other communications. The values are recognised at the fair value of the consideration paid or payable for the goods or services received.
(ii) Salaries and related employee expenses
These entitlements including salaries, wages, bonuses, overtime, allowances, annual and long service leave, but exclude share-based payments. The accounting policies for the three major expense categories under this de�nition are as follows.
Short-term employee bene�ts
Short-term employee bene�t obligations are measured on an undiscounted basis and are expensed as the related service is provided.
A liability is recognised for the amount expected to be paid if the IOOF Group has a present legal or constructive obligation to pay this amount as a result of past service provided by the employee and the obligation can be estimated reliably.
Short-term incentive plans
A provision for employee bene�ts in the form of an incentive plan is recognised when there is no realistic alternative but to settle the liability, and at least one of the following conditions is met:
• there are formal terms in the plan for determining the amount of the bene�t;
• the amounts to be paid are determined before the time of completion of the �nancial report; or
• past practice gives clear evidence of the amount of the obligation.
Annual and long service leave bene�ts
The IOOF Group’s net obligation in respect of long-term employee bene�ts is the amount of future bene�t that employees have earned in return for their service in the current and prior years plus related on-costs.
Liabilities for long-term bene�ts that are expected to be settled beyond 12 months are discounted using rates attaching to high quality corporate bonds which most closely match the terms of maturity of the related liabilities at balance date.
In determining the liability for employee entitlements, consideration is given to future increases in wage and salary rates, experience with employee departures and years of service.
(iii) Employee de�ned contribution plan expense
A de�ned contribution plan is a post-employment bene�t plan under which an entity pays �xed contributions into a separate entity and will have no legal or constructive obligation to pay further amounts. Obligations for contributions to de�ned contribution plans are recognised in pro�t or loss in the years during which services are rendered by employees. Prepaid contributions are recognised as an asset to the extent that a cash refund or a reduction in future payments is available.
(iv) Share-based payments expense
The grant date fair value of share-based payment awards granted to employees is recognised as a share-based payment expense, with a corresponding increase in the share-based payments reserve, over the year that the employees unconditionally become entitled to the awards. The amount recognised as an expense is adjusted to re�ect the number of awards for which the related service and non-market vesting conditions are expected to be met, such that the amount ultimately recognised as an expense is based on the number of awards that meet the related service and non-market performance conditions at vesting date.
For share-based payment awards with non-vesting conditions, the grant date fair value of the share-based payment is measured to re�ect such conditions and there is no true-up for di�erences between expected and actual outcomes.
The fair value at grant date is independently determined where considered appropriate.

81
IOOF annual report 2017
Shares held by the IOOF Equity Plan Trust will contribute to the employee allocation of shares on satisfaction of vesting performance hurdles. The IOOF Group has no right to recall placed shares. However, a subsidiary company acts as the Trustee of the Trust, and can direct the voting rights of shares held and strategic direction.
Non-Executive Directors have the opportunity to participate in the IOOF Deferred Share Purchase Plan. The plan provides a facility for Non-Executive Directors to sacri�ce base salary or future incentive entitlements in order to acquire shares. As the purchase is funded by Directors’ salary sacri�ce, no additional expense is recorded by the IOOF Group.
(v) Termination and retention incentive payments
Termination bene�ts or redundancy costs are recognised as an expense when the IOOF Group is committed demonstrably, without realistic opportunity of withdrawal, to a formal detailed plan without possibility of withdrawal, or providing termination bene�ts as a result of an o�er made to encourage voluntary redundancy.
(vi) Amortisation and impairment
The value of intangible assets, with the exception of goodwill and brand names with inde�nite useful lives, reduces over the number of years the IOOF Group expects to use the asset, the useful economic life, via an annual amortisation charge to pro�t and loss. The values and useful lives ascribed are re�ective of arms-length transactions and independent expert advice thereon.
Where there has been a technological change or decline in business performance the Directors review the value of assets to ensure they have not fallen below their amortised value. Should an asset’s value fall below its amortised value an additional one-o� impairment charge is made against pro�t.
(vii) Deferred acquisition costs
Deferred acquisition costs relate to service fees paid, and are deferred as an asset in recognition that they relate to a future economic bene�t. Deferred acquisition costs are initially measured at historical cost and are written down immediately to their recoverable amount if the carrying amount is greater than its estimated recoverable amount.
Deferred acquisition costs are progressively amortised in pro�t or loss by a systematic allocation over the years the future economic bene�ts are expected to be received. The amortisation period is between 5 and 7 years.

82
IOOF annual report 2017
Notes to the �nancial statementsFor the year ended 30 June 2017
2-5 Net cash provided by operating activitiesCash includes cash on hand, deposits held at call with �nancial institutions, other short-term, highly liquid investments with original maturities of three months or less that are readily convertible to known amounts of cash.
This note reconciles the operating pro�t to the cash provided by operating activities per the cash �ow statement.
2017 2016
$’000 $’000
Pro�t for the year 119,851 199,466
Depreciation on property and equipment 7,648 7,919
Amortisation of intangible assets 40,348 41,418
Impairment of goodwill 38,592 -
(Pro�t)/loss on divestment of assets (18,228) (80,533)
Interest and other costs of �nance 6,828 7,353
Interest received and receivable (4,352) (4,990)
Dividends and distributions received and receivable (823) (839)
Dividends received from associates 3,966 2,757
Share of pro�ts of associates accounted for using the equity method (3,478) (4,831)
Share-based payments expense 1,295 1,966
Acquisition and divestment transaction costs - 1,516
Other 1,144 (49)
Changes in net operating assets and liabilities:
(Increase)/decrease in receivables (7,575) 8,444
(Increase)/decrease in other assets (833) 52
(Increase)/decrease in other �nancial assets 1,674 3,031
(Increase)/decrease in deferred acquisition costs 569 1,157
Increase/(decrease) in payables (8,275) (3,515)
Increase/(decrease) in deferred revenue liabilities (699) (1,238)
Increase/(decrease) in provisions 1,919 (6,078)
Increase/(decrease) in income tax payable 7,871 (11,219)
Increase/(decrease) in contingent consideration 1,089 (9)
Increase/(decrease) in other liabilities 103 (114)
Increase/(decrease) in deferred taxes (9,355) 7,187
Net cash provided by operating activities 179,279 168,851

83
IOOF annual report 2017
2-6 Income taxes
Income taxes 2017 2016
$’000 $’000
Current tax expense
Current year 70,408 61,494
Adjustment for prior years (1,478) (958)
68,930 60,536
Deferred tax expense
Origination and reversal of temporary di�erences (9,460) (8,606)
Adjustments recognised in the current year in relation to the deferred tax of prior years 103 (329)
(9,357) (8,935)
Total income tax expense from continuing operations 59,573 51,601
Income tax recognised in other comprehensive income
2017 $’000
2016 $’000
Before tax Tax expense Net of tax Before tax Tax expense Net of tax
Available-for-sale �nancial assets 3,770 (1,131) 2,639 3,648 (1,105) 2,543
Exchange di�erences on translating foreign operations
15 (3) 12 118 (4) 114
3,785 (1,134) 2,651 3,766 (1,109) 2,657
2017 2016
% $’000 % $’000
Reconciliation of e�ective tax rate
Pro�t before tax from continuing operations 179,424 192,143
Tax using the IOOF Group's domestic tax rate 30.0% 53,827 30.0% 57,643
Tax e�ect of:
Share of tax credits with statutory funds 0.5% 978 0.7% 1,304
(Non assessable income)/Non-deductible expenses (1.8%) (3,264) (1.5%) (2,874)
Impairment of goodwill 6.5% 11,578 - -
Share of net pro�ts of associates (0.6%) (1,044) (0.8%) (1,449)
Assessable associate dividends 2.1% 3,771 2.2% 4,264
Imputation credits (2.2%) (4,012) (2.3%) (4,509)
Other (0.5%) (886) (0.8%) (1,491)
Under/(over) provided in prior years (0.8%) (1,375) (0.7%) (1,287)
33.2% 59,573 26.9% 51,601
The IOOF Holdings Ltd tax consolidated group (the IOOF tax group) paid $66.6m in income tax relating to the �nancial year ended 30 June 2016. In December 2016 the ATO published the tax information in respect of large public taxpayers in its tax transparency report. For the IOOF tax group the ATO published payment of $78.9m in income tax relating to the �nancial year ended 30 June 2015.
For statutory reporting purposes, the Group had an e�ective tax rate of 33.2% on its continuing operations for the year ended 30 June 2017 (2016: 26.9%) compared to a statutory corporate tax rate of 30%. The rate di�erence in the year ended 30 June 2017 is primarily due to research and development tax o�sets, tax o�sets for fully franked dividend income and impairment of goodwill. For the year ended 30 June 2016, the rate di�erence is primarily due to research and development tax o�sets and tax o�sets for fully franked dividend income. Excluding these items IOOF’s e�ective tax rate would be 30% across both years. The e�ective tax rate for New Zealand and Hong Kong operations was 29.7%, and 18.0% respectively.

84
IOOF annual report 2017
Notes to the �nancial statementsFor the year ended 30 June 2017
2017 2016
$’000 $’000
Deferred tax assets and liabilities
Deferred tax asset balance comprises temporary di�erences attributable to:
Salaries and related employee expenses 18,721 17,525
Provisions, accruals and creditors 3,349 4,642
Carry forward capital and revenue losses 99 102
Other 1,934 2,413
Deferred tax asset balance as at 30 June 24,103 24,682
Set-o� of deferred tax liabilities pursuant to set-o� provisions (24,103) (24,682)
Net deferred tax asset balance as at 30 June - -
Deferred tax liability balance comprises temporary di�erences attributable to:
Customer relationships 107,534 117,869
Unrealised gains 5,087 3,947
Fixed assets and computer software 1,230 1,987
Other 3,201 2,042
117,052 125,845
Set-o� of deferred tax liabilities pursuant to set-o� provisions (24,103) (24,682)
Net deferred tax liability balance as at 30 June 92,949 101,163
Reconciliation of movements
Net carrying amounts at the beginning of the year (101,163) (92,527)
Acquisitions and divestments (9) -
Credited/(charged) to pro�t or loss 9,357 8,935
Discontinued operation - (16,459)
Temporary di�erences directly attributable to equity (1,134) (1,112)
Carrying amount at the end of the year (92,949) (101,163)
Unrecognised deferred tax assets
Tax losses - -
Potential tax bene�t at the Australian tax rate of 30% - -
The deductible temporary di�erences and tax losses do not expire under current tax legislation. Deferred tax assets have not been recognised in respect of these items because it is not probable that future taxable pro�t will be available against which the IOOF Group can utilise the bene�ts there from.
Accounting policies
Income tax
Income tax comprises current and deferred tax. Current and deferred tax are recognised in pro�t or loss except to the extent that it relates to a business combination, or items recognised directly in equity or in other comprehensive income.
Current tax
Current tax is the expected tax payable or receivable on the taxable income for the year, using tax rates enacted or substantively enacted at the reporting date, and any
adjustment to tax payable in respect of previous years. Current tax also includes any tax arising from dividends.
Current tax assets and liabilities are o�set only if certain criteria are met.
Deferred tax
Deferred tax is recognised in respect of temporary di�erences between the carrying amounts of assets and liabilities for �nancial reporting purposes and the amounts used for taxation purposes. Deferred tax is not recognised for:

85
IOOF annual report 2017
• temporary di�erences on the initial recognition of assets or liabilities in a transaction that is not a business combination and that a�ects neither accounting nor taxable pro�t or loss;
• temporary di�erences related to investments in subsidiaries and associates to the extent that the IOOF Group is able to control the timing of the reversal of the temporary di�erences and it is probable that they will not reverse in the foreseeable future; and
• taxable temporary di�erences arising on the initial recognition of goodwill.
Deferred tax is measured at the tax rates that are expected to be applied to temporary di�erences when they reverse, based on the laws that have been enacted or substantively enacted by the reporting date.
Deferred tax assets and liabilities are o�set when there is a legally enforceable right to o�set current tax assets and liabilities and when deferred tax balances relate to the same taxation authority.
Tax consolidation
IOOF Holdings Ltd and its wholly owned Australian resident entities (including IOOF Ltd bene�t funds) are part of a tax-consolidated group under Australian taxation law. As a consequence, all members of the tax-consoldiated group are taxed as a single entity.
Tax transparency
The IOOF Group is committed to tax transparency and integrity. It is a signatory to the Board of Taxation’s Voluntary Tax Transparency Code (the Code), which was released on 3 May 2016.
The Code is a set of principles and ‘minimum standards’ to guide disclosure of tax information by businesses, encourage those businesses to avoid aggressive tax planning, and to help educate the public about their compliance with Australia’s tax laws.
The IOOF Group provides a reconciliation of accounting pro�t to tax expense, and to income tax paid/payable including identi�cation of material temporary and non-temporary di�erences and accounting e�ective company tax rates for the IOOF Groups Australian and global operations.
Information about international related party dealings
The IOOF Group conducts foreign activities in New Zealand, via IOOF New Zealand, and in Hong Kong, via share broking business, Ord Minnett. Each of those entities is subject to the local tax regime and e�ective tax rates are disclosed with the IOOF Group’s e�ective tax rate. Related party dealings between the IOOF Group’s Australian and foreign jurisdictions are supported by transfer pricing documentation.
Approach to tax strategy and governance
Tax governance is part of the IOOF Group’s overall risk management framework, as well as being part of an overall tax strategy. The overall tax strategy drives the IOOF Group’s approach to tax risk management and is aimed at good corporate tax compliance and reporting, ability to meet and be prepared for regulatory changes, and in ensuring shareholder value. Tax governance is continuously monitored and in line with the IOOF Group’s strategy. The IOOF Group regards its relationship with the ATO as e�ective and open thereby maintaining transparency and collaboration.
Tax contribution analysis
The IOOF Group contributed a total of $131.5m in taxes to Australian, New Zealand and Hong Kong governments (state and federal) in the 2017 tax year. $131.0m or 99.6% of this amount was attributable to the Australian Government. The below tables provide an analysis of the types of taxes the IOOF Group is liable for and those payable in Australia versus those in foreign jurisdictions.
2017 tax contribution by type (total $131.5m)
Income Tax $70.4m
GST $45m
Payroll Tax $12.2m
Fringe Bene�ts Tax $1.3m
Other $2.6m
2017 tax contribution by country (total $131.5m)
Australia $131m
New Zealand $0.495m
Hong Kong $0.005m
Further taxes paid by the IOOF Group on behalf of others, including employees and members, are not directly borne by the Group. These include income tax, GST, pay-as-you-earn withholding taxes, and local duties, which total a further $76.0m.

86
IOOF annual report 2017
Notes to the �nancial statementsFor the year ended 30 June 2017
2-7 DividendsAfter 30 June 2017 the following dividends were declared by the directors. The dividends have not been provided for and there are no income tax consequences.
Cents per share
Total amount
Date of payment
Franked/ unfranked
$’000
Final 2017 dividend 27.0 81,036 1 September 2017 Franked
2017 2016
$’000 $’000
Dividend franking account
30 per cent franking credits available to shareholders of IOOF Holdings Ltd for subsequent �nancial years
84,469 83,923
The above available amounts are based on the balance of the dividend franking account at year-end adjusted for:
(a) franking credits that will arise from the payment of the current tax liabilities; and
(b) franking credits that the IOOF Group may be prevented from distributing in subsequent years.
The ability to utilise the franking credits is dependent upon there being su�cient available pro�ts to declare dividends. The impact on the dividend franking account of dividends declared after the balance date but not recognised as a liability is to reduce it by $34,730,000 (2016: $33,443,000).
The following dividends were declared and paid by the IOOF Group during the current and preceding �nancial year:
Cents per share
Total amount
Date of payment
Franked/ unfranked
$’000
2017
Interim 2017 dividend 26.0 78,035 30 March 2017 Franked
Final 2016 dividend 26.0 78,035 13 October 2016 Franked
52.0 156,070
2016
Interim 2016 dividend 28.5 85,538 07 April 2016 Franked
Final 2015 dividend 28.0 84,037 15 October 2015 Franked
56.5 169,575
Franked dividends declared or paid during the year were franked at the tax rate of 30 per cent.
Dividend amounts shown are inclusive of any dividends paid on treasury shares.

87
IOOF annual report 2017
2-8 Earnings per share
2017 2016
Cents per share
Cents per share
Basic earnings per share 38.7 65.7
Diluted earnings per share 38.6 65.4
Continuing operations
Basic earnings per share 38.7 46.0
Diluted earnings per share 38.6 45.8
Basic earnings per share
The earnings and weighted average number of ordinary shares used in the calculation of basic earnings per share are as follows:
2017 2016
$’000 $’000
Pro�t for the year attributable to owners of the Company 115,990 196,846
Earnings used in the calculation of basic EPS 115,990 196,846
2017 2016
No. ’000 No. ’000
Weighted average number of ordinary shares
Weighted average number of ordinary shares (basic) 299,820 299,838
E�ect of unvested performance rights 673 1,011
E�ect of share options on issue - 4
Weighted average number of ordinary shares (diluted) 300,493 300,853
Accounting policies
The IOOF Group presents basic and diluted earnings per share data for its ordinary shares. Basic earnings per share is calculated by dividing the pro�t or loss attributable to ordinary shareholders of the Company by the weighted average number of ordinary shares outstanding during the year, adjusted for treasury shares held.
Diluted earnings per share is determined by adjusting the pro�t or loss attributable to ordinary shareholders and the weighted average number of ordinary shares outstanding, adjusted for treasury shares held, for the e�ects of all dilutive potential ordinary shares, which comprise performance rights and share options granted to employees.
At 30 June 2017, there were no options outstanding.
The average market value of the Company’s shares for purposes of calculating the dilutive e�ect of share options was based on quoted market prices for the year.

88
IOOF annual report 2017
Notes to the �nancial statementsFor the year ended 30 June 2017
Section 3 - Capital management and �nancing
This section outlines how the IOOF Group manages its capital structure and related �nancing costs, including its balance sheet liquidity and access to capital markets.
The IOOF Group’s objectives when managing capital are to safeguard its ability to continue as a going concern, so that it can continue to provide returns to shareholders and bene�ts to other stakeholders, and to maintain an optimal structure to reduce the cost of capital.
3-1 Capital managementIn order to maintain or adjust the capital structure, the IOOF Group may adjust the amount of dividends paid to shareholders, return capital to shareholders, buy back its shares on market, issue new shares, sell assets, or otherwise adjust debt levels.
The IOOF Group monitors capital on the basis of investment capital, working capital and regulatory capital.
Investment capital is the IOOF Group’s capital that is not required for regulatory and working capital requirements of the business. The investment capital is invested in:
• bank bills and deposits;
• subsidiaries;
• available-for-sale assets;
• unit trusts, as investments; and
• IOOF Group operated unit trusts, as seed capital.
The investment capital is available to support the organic development of new businesses and products and to respond to investment and growth opportunities such as acquisitions, as they arise. Seed capital is primarily available to support the business in establishing new products and is also used to support capital adequacy requirements of the bene�t funds.
Working capital is the capital that is required to meet the day to day operations of the business.
Regulatory capital is the capital which the IOOF Group is required to hold as determined by legislative and regulatory requirements in respect of its friendly society and �nancial services licensed operations. During the year, the IOOF Group has complied with all externally imposed capital requirements to which it is subject.
The Board of each operational subsidiary manages its own capital required to support planned business growth and meet regulatory requirements. Australian Prudential Regulation Authority (APRA) regulated subsidiaries have their own capital management plan which speci�cally addresses the regulatory requirements of that entity and sets a target surplus over minimum regulatory requirements. Regular monitoring of regulatory requirements ensures su�cient capital is available and appropriate planning is made to retain target surpluses. IOOF Holdings Ltd is primarily the provider of equity capital to its subsidiaries. Such investment is funded by IOOF Holding Ltd’s own investment capital, through capital issues, pro�t retention and, in some instances, by debt.
Subsidiary capital generated in excess of planned requirements is returned to IOOF Holdings Ltd, usually by way of dividends.
A standby facility is in place as a safeguard against a temporary need for funds and to provide a short term funding facility that allows the business to take advantage of acquisition opportunities as they arise.
The weighted average cost of capital is regularly monitored. Funding decisions take into consideration the cost of debt versus the cost of equity with emphasis on the outcome that is best for shareholder interests.
The IOOF Group’s capital risk management strategy was not changed during the year.
Further information in relation to capital adequacy requirements imposed by the Life Insurance Act is provided in section 5-7 Capital adequacy position.

89
IOOF annual report 2017
3-2 BorrowingsThis note provides information about the contractual terms of the IOOF Group’s interest-bearing borrowings, which are measured at amortised cost.
For more information about the IOOF Group’s exposure to interest rate and liquidity risk, see section 1-1 Risk management.
2017 2016
$’000 $’000
Syndicated facility agreement 206,908 206,730
Finance lease liabilities – refer (c) 40 245
206,948 206,975
(a) Cash Advance & Working Capital Facility
The unsecured cash advance facilities and working capital facility is provided under an Australian dollar line of credit facility, to which unrestricted access was available at balance date as follows:
2017 2016
$’000 $’000
Total facilities 225,000 225,000
Used at 30 June 206,908 206,730
Unused at 30 June 18,092 18,270
The �nancial liability under the facility has a fair value equal to its carrying amount.
Accounting policies
Finance costs comprise interest expense on borrowings, unwinding of the discount on provisions, changes in the fair value of �nancial assets at fair value through pro�t or loss and impairment losses recognised on �nancial assets.
Borrowing costs that are not directly attributable to the acquisition, construction or production of a qualifying asset are recognised in pro�t or loss using the e�ective interest method.
(b) Other bank facilities
In addition to the cash advance and working capital facilities, the IOOF Group has a number of facilities under the Syndicated Facility Agreement. These include equipment �nance and contingent liability facilities. The aggregate of these facilities is $40 million of which $34.3m was used at 30 June 2017 (2016: $31.8m). The IOOF Group has other facilities outside the Syndicated Facility Agreement of $8m of which $5.05m was used at 30 June 2017 (2016: $0.2m).
(c) Finance lease liabilities
Finance leases relate to computer hardware.
2017 2016
Future minimum
lease payments
Present value of
minimum lease
payments
Future minimum
lease payments
Present value
of minimum lease
payments
$’000 $’000 $’000 $’000
IOOF Group Finance lease liabilities are payable as follows:
Less than one year 40 40 213 205
Between one and �ve years - - 40 40
40 40 253 245
Less future �nance charges - (8)
40 245

90
IOOF annual report 2017
Notes to the �nancial statementsFor the year ended 30 June 2017
3-3 Share capitalThe Company does not have authorised capital or par value in respect of its issued shares. All issued shares are fully paid. The holders of ordinary shares are entitled to receive dividends as declared from time to time, and are entitled to one vote per share at meetings of the Company. All shares rank equally with regard to the Company’s residual assets.
2017 2016
$’000 $’000
300,133,752 fully paid ordinary shares (2016: 300,133,752) 1,438,601 1,439,276
476,411 treasury shares (2016: 320,731) (4,142) (2,816)
1,434,459 1,436,460
2017 2016
No. ’000 $’000 No. ’000 $’000
Ordinary shares
On issue at 1 July 300,134 1,439,276 300,134 1,444,903
Issue of shares on exercise of options under executive and employee share option plan
- - - 210
Transfer from employee equity-settled bene�ts reserve on exercise of options
- 1,322 - 5,931
Treasury shares transferred to recipients during the year - (1,997) - (11,768)
On issue at 30 June 300,134 1,438,601 300,134 1,439,276
Treasury shares
On issue at 1 July (321) (2,816) (732) (7,146)
Purchase of treasury shares (380) (3,323) (830) (7,438)
Treasury shares transferred to recipients during the year 225 1,997 1,241 11,768
On issue at 30 June (476) (4,142) (321) (2,816)
299,658 1,434,459 299,813 1,436,460
Accounting policies
Ordinary shares
Ordinary shares are classi�ed as equity. Incremental costs directly attributable to the issue of new shares and share options are shown in equity as a deduction, net of any tax e�ects.
Treasury shares
Shares in the Company which are purchased on-market by the IOOF Equity Plan Trust are classi�ed as treasury shares and are deducted from share capital. Treasury shares are excluded from the weighted average number of ordinary shares used in the earnings per share calculations. The IOOF Equity Plan Trust is controlled by the IOOF Group and is therefore consolidated. Dividends received on treasury shares are eliminated on consolidation.

91
IOOF annual report 2017
3-4 Capital commitments and contingenciesThe only capital commitments entered into by the IOOF Group are operating lease commitments disclosed below.
Operating lease commitments
Payments made under operating leases are recognised in pro�t or loss on a straight-line basis over the term of the lease. Lease incentives received are recognised as an integral part of the total lease expense, over the term of the lease.
Commitments for minimum lease payments in relation to non-cancellable operating leases are payable as follows:
2017 Less than one year
1 to 5 years Later than �ve years
Total
$’000 $’000 $’000 $’000
Premises 18,045 50,600 30,322 98,967
O�ce equipment 3 - - 3
18,048 50,600 30,322 98,970
2016 Less than one year
1 to 5 years Later than �ve years
Total
$’000 $’000 $’000 $’000
Premises 17,307 31,676 4,619 53,602
O�ce equipment 117 3 - 120
17,424 31,679 4,619 53,722
2017 2016
$’000 $’000
Guarantees and underwriting commitments
Rental bond guarantees 16,281 11,447
ASX settlement bond guarantee 500 500
ASIC bond guarantees 140 120
Other guarantees 3,000 3,000
19,921 15,067
Contingent liabilities
Contingent liabilities exist in relation to claims and/or possible claims which, at the date of signing these accounts, have not been resolved. An assessment of the likely loss to the Company and its controlled entities has been made in respect of the identi�ed claims, on a claim by claim basis, and speci�c provision has been made where appropriate. The IOOF Group does not consider that the outcome of any other current proceedings, either individually or in aggregate, is likely to materially a�ect its operations or �nancial position.

92
IOOF annual report 2017
Notes to the �nancial statementsFor the year ended 30 June 2017
3-5 Reserves
2017 2016
$’000 $’000
Available-for-sale investment revaluation reserve 13,074 10,436
Business combinations reserve (326) (326)
Foreign currency translation reserve 121 109
Operating Risk Financial reserve* 2,655 2,799
Share-based payments reserve (2,175) (1,752)
13,349 11,266
*This reserve is held for certain AET Superannuation products. Other similar reserves exist within the IOOF Group, however these are generally held by the relevant funds.

93
IOOF annual report 2017
Section 4 - Operating assets and liabilities
This section shows the assets used to generate the IOOF Group’s trading performance and the liabilities incurred as a result. Liabilities relating to the Group’s �nancing activities are addressed in Section 3.
4-1 AssociatesAssociates are those entities over which the IOOF Group has signi�cant in�uence, but not control, over the �nancial and operating policies.
The IOOF Group has interests in a number of associates. For one of these associates, Perennial Value Management Limited, the IOOF Group owns 52.4% (2016: 52.4%) of the equity interests but has 42.4% of the voting rights and dividend entitlements. The IOOF Group has determined that it does not have control but has signi�cant in�uence because it has representation on the board of the investee.
The table below discloses material associates individually:
Associate Country of incorporation
Ownership interest Carrying value
IOOF Group’s
share of pro�t/
(loss)
2017 2016
% % $’000 $’000
Perennial Value Management Ltd Australia 52.4 52.4 9,733 2,662
Other associates 11,348 816
21,081 3,478
Other associates had a carrying value of $12,634,000 and share of pro�t of $1,147,000 in 2016.
The following table summarises the �nancial information of the IOOF Group’s material associate, Perennial Value Management Limited, as included in its own �nancial statements. All fair values and accounting policies are consistent with those of the IOOF Group.
2017 2016
$’000 $’000
Bene�cial ownership interest 42.4% 42.4%
Current assets 14,655 18,854
Non-current assets 7,516 1,226
Current liabilities (5,376) (3,350)
Non-current liabilities (619) (500)
Net assets (100%) 16,176 16,230
IOOF Group's share of net assets (42.4%) 6,851 6,873
IOOF Group's share of movements in equity and other reserves (42.4%) (1,569) (1,291)
Goodwill 4,451 4,451
Carrying value of interest in associate 9,733 10,033
Revenue (100%) 27,196 25,497
Pro�t and total comprehensive income (100%) 6,285 8,700
Pro�t and total comprehensive income (42.4%) 2,662 3,684
Dividends received by the IOOF Group 2,961 2,115
None of the IOOF Group’s equity-accounted investees are publicly listed entities and consequently do not have published price quotations.
Dividends received from associates
During the year, the IOOF Group has received dividends of $3,966,000 (2016: $2,757,000) from its associates.

94
IOOF annual report 2017
Notes to the �nancial statementsFor the year ended 30 June 2017
Accounting policies
Interests in associates are accounted for using the equity method. They are initially recognised at cost, which includes any transaction costs. Subsequent to initial recognition, the consolidated �nancial statements include the IOOF Group’s share of the pro�t or loss and Other Comprehensive Income of the associates, until the date on which signi�cant in�uence ceases.
4-2 Intangible assets (other than goodwill)
2017 2016
$’000 $’000
Cost 670,159 669,101
Accumulated amortisation (229,080) (188,932)
441,079 480,169
IT Develop-ment
Computer software
Customer relationships
Brand names
Other Intangibles
Total
$’000 $’000 $’000 $’000 $’000 $’000
Carrying value at 1 July 2016 2,378 6,090 394,232 68,547 8,922 480,169
Additions - 178 5,663 - 340 6,181
Divestments - - (3,417) - (1,506) (4,923)
Amortisation expense (1,737) (1,022) (34,920) (801) (1,868) (40,348)
Carrying value at 30 June 2017 641 5,246 361,558 67,746 5,888 441,079
Accounting policies
Intangible assets are non-physical assets used by the IOOF Group to generate revenues and pro�ts. These assets include brand names, software, customer and adviser relationships and contractual arrangements. The cost of these assets is the amount that the IOOF Group has paid or, where there has been a business combination, the fair value of the speci�c intangible assets that could be sold separately or which arise from legal rights.
The value of intangible assets, with the exception of goodwill and brand names with inde�nite useful lives, reduces over the number of years the IOOF Group expects to use the asset, the useful economic life, via an annual amortisation charge to pro�t and loss. The values and useful lives ascribed are re�ective of arms-length transactions and independent expert advice thereon. Where there has been a technological change or decline in business performance the Directors review the value of assets to ensure they have not fallen below their amortised value. Should an asset’s value fall below its amortised value an additional one-o� impairment charge is made against pro�t.
Subsequent expenditure
Subsequent expenditure is capitalised only when it increases the future economic bene�ts embodied in the speci�c asset to which it relates. All other expenditure, including expenditure on brands, is recognised in pro�t or loss as incurred.
Amortisation
Amortisation is charged to the income statement over the estimated useful lives of intangible assets unless such lives are judged to be inde�nite. Inde�nite life assets are not amortised but are tested for impairment at each reporting date. The estimated useful lives for the current and comparative years are as follows:
• adviser relationships 5–10 years • brand names 20 years
• software 2.5–10 years • contract agreements 9–10 years
• customer relationships 10–20 years • IT development 4 years
Amortisation methods, useful lives and residual values are reviewed at each reporting date and adjusted if appropriate.

95
IOOF annual report 2017
Impairment testing for cash-generating units containing inde�nite life intangible assets
For the purposes of impairment testing, inde�nite life intangibles are allocated to the IOOF Group’s operating divisions, or CGUs, which represent the lowest level within the IOOF Group at which intangible assets are monitored for internal management purposes.
Each CGU is not higher than the IOOF Group’s operating segments as reported in Note 2-1 operating segments.
Inde�nite life intangible assets
The inde�nite life intangible assets relate to brand names. The below table excludes $9.5m of intangibles which have a �nite life. The aggregate carrying amounts of inde�nite-life intangible assets allocated to each CGU are as follows:
2017 2016
$’000 $’000
Shadforth 51,000 51,000
Ord Minnett group 6,773 6,773
Lonsdale 500 500
58,273 58,273
In designating brand names as inde�nite life, consideration was given to the length of time the brand names have been in existence and it was determined that there is no foreseeable limit to the years over which the brand names are expected to generate net cash in�ows for the IOOF Group.
The recoverable amount for the brand names have been determined based on a royalty savings method of calculating value in use. The calculation incorporates estimated costs of brand maintenance. The discount rate of 12.5% (2016: 10.7%) used re�ects the IOOF Group’s pre-tax nominal weighted average cost of capital (WACC). Management’s assessment of inde�nite life intangible value-in-use exceeds the value of the intangible asset allocated to the CGU, therefore any reasonably possible changes to assumptions used in management’s assessment is not expected to result in impairment.
4-3 Goodwill
2017 2016
$’000 $’000
Cost 1,010,468 1,008,721
Accumulated impairment (55,601) (17,009)
Net carrying value of goodwill 954,867 991,712
Carrying value at 1 July 991,712 1,013,105
Acquisition of subsidiaries 1,747 -
Impairment of goodwill (38,592) -
Divestment of discontinued operation - (21,393)
Carrying value at 30 June 954,867 991,712
A non-cash impairment of $38.6m has been recognised in relation to goodwill allocated to Perennial Value Management (PVM) and its subsidiaries. Reduced pro�tability from both lower revenue and higher costs has led to calculated value-in-use declining to below the carrying value of the aggregate goodwill and investment balances. Revenue decline has arisen due to institutional out�ows. These out�ows re�ect changing market dynamics where larger institutions now weight a greater proportion of funds to indexed products. This has combined with below benchmark performance in 2012 which adversely a�ected 3 and 5 year fund performance numbers. Higher costs resulted from an absence of operations scale and subsidisation following the divestment of other Perennial entities as PVM moved to virtually complete autonomy during the current year.

96
IOOF annual report 2017
Notes to the �nancial statementsFor the year ended 30 June 2017
Accounting policies
Goodwill represents the future economic bene�ts that arise from assets that are not capable of being individually identi�ed and separately recognised. Its cost is the amount the IOOF Group has paid in acquiring a business over and above the fair value of the individual assets and liabilities acquired. The value of goodwill is an ‘intangible’ value that comes from, for example, a uniquely strong market position and the outstanding productivity of its employees. The goodwill recognised by the IOOF Group has all arisen as a result of business combinations.
For the measurement of goodwill at initial recognition, see section 7-3(b)(i) Business combinations.
Subsequent measurement
Goodwill is measured at cost less accumulated impairment losses. In respect of equity-accounted investees, the carrying amount of goodwill is included in the carrying amount of the investment, and any impairment loss is allocated to the carrying amount of the equity accounted investee as a whole.
Impairment testing for cash-generating units containing goodwill
For the purposes of impairment testing, goodwill is allocated to the IOOF Group’s cash-generating units (CGUs). These represent the lowest level within the IOOF Group at which the goodwill is monitored for internal management purposes. Assets that cannot be tested individually are grouped together into the smallest group of assets that generates cash in�ows from continuing use that are largely independent of the cash in�ows from continuing use of other assets or groups of assets (the CGU).
These CGUs are not higher than the IOOF Group’s operating segments as reported in 2-1 Operating segments.
The aggregate carrying amounts of goodwill allocated to each CGU are as follows:
Value in Use element
2017 2016 Cash in�ows yrs 2-5
Cash out�ows yrs 2-5
Cash �ows – perpetuity
$’000 $’000
Shadforth1 431,191 434,812 B E 2.5% growth from yr 5
Platform management and administration
347,509 347,509 B E 2.5% growth from yr 5
Perennial 37,829 76,421 C - 2.5% growth from yr 5
DKN 80,339 80,339 B E 2.5% growth from yr 5
Multi manager 39,735 39,735 B E 2.5% growth from yr 5
IOOF Ltd 11,970 11,970 D D 2.5% growth from yr 5
Consultum1 4,344 723 A E 2.5% growth from yr 5
Bridges2 1,950 203 B E 2.5% growth from yr 5
954,867 991,712
A Reserve Bank of Australia forecast GDP growth rate3
B Observed Australian managed funds annual compounding growth for March 2012 to March 20174
C Forecast for Perennial Value Management Limited
D Observed Australian friendly societies annual compounding growth for March 2012 to March 20174
E Blended rate of the underlying Australian forecast in�ation levels and the applicable Reserve Bank of Australia GDP growth rate3
1 Re�ects adviser transfer during the year
2 Bridges includes CUA FP and SA Carrington
3 source - RBA Statement of Monetary Policy
4 source - ABS 5655.0 Managed Funds Australia

97
IOOF annual report 2017
The recoverable amounts for goodwill allocated to all CGUs have been determined based on value-in-use calculations using 2017 actual balances to forecast 2018 and beyond cash �ows. The manner in which the IOOF Group conducts each impairment assessment for years 2 to 5 and into perpetuity is discussed below for each relevant CGU.
The growth rates applied do not exceed the long-term average growth rate for businesses in which each CGU operates. The pre-tax discount rate of 12.5% (2016: 10.7%) used re�ects the IOOF Group’s pre-tax nominal weighted average cost of capital (WACC). Management’s assessment of goodwill’s value-in-use exceeds the value of goodwill allocated to these CGUs, except for the Perennial CGU where a $38.6m non-cash impairment has been recognised in 2017. Any reasonably possible changes to assumptions used in management’s assessment is not expected to result in impairment.
Management has applied post tax WACC increments of 2.5% for Perennial and 3.5% for Consultum to re�ect speci�c company risk premiums. These incremental amounts are judgement based and are consistent with accepted valuation industry practice.
4-4 Provisions
2017 2016
$’000 $’000
Directors' retirement obligations - 475
Onerous contracts 350 2,063
Employee entitlements 62,456 57,999
Other provisions 1,833 1,857
64,639 62,394
Directors' retirement
Onerous contracts
Employee entitle-
ments
Other Total
$’000 $’000 $’000 $’000 $’000
Balance at 1 July 2016 475 2,063 57,999 1,857 62,394
Provisions made during the year - - 33,094 1,724 34,818
Provisions utilised during the year (475) (1,713) (28,637) (1,748) (32,573)
Balance at 30 June 2017 - 350 62,456 1,833 64,639
Accounting policies
A provision is recognised if, as a result of a past event, the IOOF Group has a present legal or constructive obligation that can be estimated reliably, and it is probable that an out�ow of economic bene�ts will be required to settle the obligation. Provisions are determined by discounting the expected future cash �ows at a pre-tax rate that re�ects current market assessments of the time value of money.
Directors’ retirement obligations
Retirement bene�ts were paid to Non-Executive Directors appointed prior to 13 April 2003 to ful�l the terms of historical agreements. The bene�t provided for a cash based payment to Non-Executive Directors at the time of their retirement. The retirement bene�t obligation was measured on an undiscounted basis, was capped at $475,000 and was expensed as the related service was provided. The sole participant of this plan Dr Roger Sexton was paid $475,000 on his retirement on 24 November 2016. The plan is no longer in operation.
Onerous contracts
A provision for onerous contracts is recognised when the expected bene�ts to be derived by the IOOF Group from a contract are lower than the unavoidable cost of meeting its obligations under the contract. The provision is valued as the estimated present value of future lease payments net of anticipated recoveries from third parties, that the IOOF Group is presently obligated to make under non-cancellable operating lease contracts. The estimate may vary as a result of changes in the utilisation of the leased premises and sub-lease arrangements where applicable. Provisions relate to onerous lease contracts. The unexpired term of these leases is less than 1 year.

98
IOOF annual report 2017
Notes to the �nancial statementsFor the year ended 30 June 2017
Employee entitlements
The provision for employee bene�ts includes provisions for remuneration in the form of incentive plans and expected leave bene�ts that employees have earned in return for their service in the current and prior years plus related on-costs.
A provision for employee bene�ts in the form of an incentive plan is recognised when there is no realistic alternative but to settle the liability, and at least one of the following conditions is met:
• there are formal terms in the plan for determining the amount of the bene�t;
• the amounts to be paid are determined before the time of completion of the �nancial report; or
• past practice gives clear evidence of the amount of the obligation.
A provision for restructuring is recognised when the IOOF Group has approved a detailed and formal restructuring plan, and the restructuring either has commenced or has been announced publicly. Future operating losses are not provided for.
Liabilities for incentives are expected to be settled within 12 months and are measured at the amounts expected to be paid when they are settled.
Other provisions
Other provisions have been made for the present value of the Directors’ best estimates of legal settlements. The information usually required by AASB 137 Provisions, Contingent Liabilities and Contingent Assets, is not disclosed on the grounds that it can be expected to prejudice the outcome of litigation.

99
IOOF annual report 2017
Section 5 - Statutory funds
A subsidiary of the Company, IOOF Ltd, is a friendly society in accordance with the Life Insurance Act 1995. Balances below are disclosed inclusive of amounts collected/receivable from or paid/payable to IOOF Group entities. These funds are not available to shareholders.
5-1 Assets relating to statutory funds
Statutory
2017 2016
$’000 $’000
Cash at bank 3,717 5,263
Receivables 32,794 26,716
Unlisted unit trusts 875,079 832,061
Loans to policyholders 22,529 15,309
Investments backing policyholder liabilities designated at fair value through pro�t or loss 934,119 879,349
Assets held in the Statutory Funds (including the Bene�t Funds) are subject to the distribution and transfer restrictions and other requirements of the Life Insurance Act 1995. Monies held in the bene�t funds and controlled trusts are held for the bene�t of the members of those funds, and are subject to the constitution and rules of those funds. Accordingly, with the exception of permitted pro�t distributions, the investments held in the statutory funds are not available for use by other parties of the IOOF Group.
The IOOF Group has determined that all �nancial assets held within its reported statutory funds (including the bene�t funds which are treated as statutory funds) represent the assets backing policy liabilities and are measured at fair value through pro�t or loss. Other than loans and receivables held by the IOOF Group and its controlled entities, assets backing policy liabilities have been designated at fair value through pro�t or loss as the assets are managed on a fair value basis.
5-2 Liabilities relating to statutory funds
Statutory
2017 2016
$’000 $’000
Payables 6,360 6,421
Seed capital 7,153 7,153
Deferred tax liabilities 2,307 1,718
Investment contract liabilities with DPF 267,220 300,259
Investment contract liabilities 651,079 563,798
934,119 879,349
Policy liabilities have been determined in accordance with applicable accounting standards. Policy liabilities for life insurance contracts are valued in accordance with AASB 1038, whereas life investment contracts are valued in accordance with AASB 139 and AASB 118. There are di�erences between the valuation requirements of the accounting standards and those of the Life Insurance Act 1995.
100
IOOF annual report 2017
Notes to the �nancial statementsFor the year ended 30 June 2017
Accounting policies
Contract classi�cation
The accounting treatment of certain transactions varies depending on the nature of the contract underlying the transaction. The major contract classi�cations are insurance contracts and investment contracts.
(i) Insurance contracts
Insurance contracts are those containing signi�cant insurance risk at the inception of the contract, or those where at the inception of the contract there is a scenario with commercial substance where the level of insurance risk may be signi�cant. The signi�cance of insurance risk is dependent on both the probability of an insured event and the magnitude of its potential e�ect. Life insurance contract liabilities are calculated in accordance with actuarial standards.
Once a contract has been classi�ed as an insurance contract, it remains an insurance contract for the remainder of its lifetime, even if the insurance risk reduces signi�cantly during the year.
(ii) Investment contracts
Contracts not considered insurance contracts are classi�ed as investment contracts. The accounting treatment of investment contracts depends on whether the investment has a discretionary participation feature (‘DPF’). A DPF represents a contractual right to receive, as a supplement to guaranteed bene�ts, additional bene�ts that are:
• likely to be a signi�cant portion of the total bene�ts;
• distributed at the discretion of the insurer; and
• are based on the performance of a speci�ed pool of assets.
Deposits collected and bene�ts paid under investment contracts with DPF are accounted for through pro�t or loss. The gross change in the liability to these policyholders for the year, which includes any participating bene�ts vested in policyholders and any undistributed surplus attributed to policyholders, is also recognised in pro�t or loss.
Deposits collected and withdrawals processed for investment contracts without DPF are accounted for directly through the statement of �nancial position as a movement in the investment contract liability. Distributions on these contracts are charged to pro�t or loss as an expense.
Where contracts contain both an investment component and an insurance component and the deposit component can be separately measured, the underlying amounts are unbundled. Premiums relating to the insurance component are accounted for through pro�t or loss and the investment component is accounted for as a deposit through the statement of �nancial position as described above.

101
IOOF annual report 2017
5-3 Reconciliation of movements in contract liabilities
Statutory
2017 2016
$’000 $’000
Investment contract liabilities with DPF
Investment contract liabilities with DPF at beginning of the year 300,259 338,709
Net increase in investment contract liabilities with DPF 2,371 2,027
Investment contract liabilities with DPF contributions 6,249 6,105
Investment contract liabilities with DPF withdrawals (41,659) (46,582)
Investment contract liabilities with DPF at end of the year 267,220 300,259
Other investment contract liabilities
Investment contract liabilities at beginning of the year 563,798 533,281
Net increase in investment contract policy liabilities 36,490 12,256
Investment contract contributions 129,571 113,266
Investment contract withdrawals (78,780) (95,005)
Investment contract liabilities at end of the year 651,079 563,798
5-4 Statutory fund contribution to pro�t or loss, net of tax
Statutory
2017 2016
$’000 $’000
Statutory fund revenue
Interest income 563 552
Dividends and distributions received 54,595 44,841
Net fair value gains/(losses) on other �nancial assets designated as fair value through pro�t or loss 4,999 (17,827)
Investment contracts with DPF:
Contributions received - investment contracts with DPF 6,249 6,105
DPF policyholder liability decrease 33,038 38,450
Non - DPF policyholder liability (increase) (36,490) (12,256)
Other fee revenue 2,062 3,072
65,016 62,937
Statutory fund expenses
Service and marketing fees expense 10,354 11,523
Direct operating expenses 5 5
Investment contracts with DPF:
Bene�ts and withdrawals paid 41,636 46,516
Termination bonuses 23 66
Interest 106 90
52,124 58,200
Income tax 12,892 4,737
Statutory fund contribution to pro�t, net of tax - -

102
IOOF annual report 2017
Notes to the �nancial statementsFor the year ended 30 June 2017
Accounting policies
Investment contracts with DPF
The value of these liabilities changes in relation to the change in unit prices for unit linked contracts, and are decreased by management fee charges. In accordance with the rules of the funds, any remaining surplus is attributed to the policyholders. Adjustments to the liabilities at each reporting date are recorded in pro�t or loss.
Other investment contracts
The value of these liabilities changes in relation to the change in unit prices for unit linked contracts, and are decreased by management fee charges. In accordance with the rules of the funds, any remaining surplus is attributed to the members of the fund. Amounts distributable to members are recorded in pro�t or loss as an expense.
There is no claims expense in respect of life investment contracts. Surrenders and withdrawals which relate to life investment contracts are treated as a movement in life investment contract liabilities. Surrenders are recognised when the policyholder formally noti�es of their intention to end the policy previously contracted.
Insurance contract liabilities and claims expense
A claim expense is recognised when the liability to the policyholder under the policy contract has been established, or upon noti�cation of the insured event. Withdrawal components of life insurance contracts are not expenses and are treated as movements in life insurance contract liabilities.
5-5 Actuarial assumptions and methodsThe e�ective date of the actuarial report on the policy liabilities and capital adequacy reserves is 30 June 2017. The actuarial report for IOOF Ltd was prepared by Mr Andrew Mead, FIAA, and was dated 18 August 2017. The actuarial report indicates that Mr Mead is satis�ed as to the accuracy of the data upon which the policy liabilities have been determined.
Actuarial Methods
Policy liabilities have been calculated in accordance with relevant actuarial guidance issued by the Australian Prudential Regulation Authority under the Life Insurance Act 1995. Policy liabilities are based on a systematic release of planned margins as services are provided to policyholders and premiums are received.
Processes used to select assumptions
Mortality and Morbidity
All mortality and morbidity risk is fully reinsured and the gross risk to the IOOF Group is low. The mortality and morbidity assumptions have been taken to be equal to the reinsurer’s mortality and morbidity assumptions.
Other Assumptions
In adopting the accumulation method to assess the policy liabilities, one material assumption is required. It is assumed that the future overall experience as to expense levels, surrender/lapse rates and discount rates will likely remain within a satisfactory range so that the policies produce future pro�ts for the business. In which case, there is no need to set aside provisions, in addition to the accumulation amounts, for future losses (i.e. there is no loss recognition concerns for the business). This assumption has been adopted on the basis that, based on the current actual experience of the business, the policies are producing satisfactory pro�ts for the business and there is no circumstances known that would indicate that the current position (i.e. general experience levels and ongoing pro�tability) will not continue into the future.
Sensitivity analysis
The policy liabilities are not sensitive to changes in variables within a moderate range. Increases in mortality and morbidity assumptions will result in an increase in gross policy liabilities for IOOF Ltd, however as the mortality and morbidity risk is fully reinsured any change in these assumptions would be consistent with the reinsurer’s assumptions and the net change in policy liabilities would be nil.

103
IOOF annual report 2017
5-6 Disclosures on asset restrictions, managed assets and trustee activities
(i) Restrictions on assets
Investments held in life statutory funds can only be used in accordance with the relevant regulatory restrictions imposed under the Life Act and associated rules and regulations. The main restrictions are that the assets in a life statutory fund can only be used to meet the liabilities and expenses of that life statutory fund, to acquire investments to further the business of the life statutory fund or as distributions when capital adequacy and other regulatory requirements are met.
(ii) Managed Funds and other �duciary duties
Entities in the IOOF Group, including the IOOF Ltd Bene�t Funds, hold controlling investments in managed funds. A subsidiary of the Company is the Responsible Entity for these managed funds and has a �duciary responsibility for managing these trusts. Arrangements are in place to ensure that such activities are managed separately from the other activities of the IOOF Group.
5-7 Capital adequacy positionCapital adequacy reserves are required to meet the prudential standards determined in accordance with Prudential Standard LPS 110 Capital Adequacy issued by the Australian Prudential Regulation Authority under paragraph 230A(1)(a) of the Life Insurance Act 1995. Capital adequacy reserves provide additional protection to policy holders against the impact of �uctuations and unexpected adverse circumstances on the Company.
The �gures in the table below represent the number of times coverage of the aggregate of all bene�t funds and statutory funds in the Life Group over the prescribed capital amount.
Statutory
2017 2016
$’000 $’000
(a) Capital Base 35,139 28,292
(b) Prescribed capital amount 14,883 6,623
Capital in excess of prescribed capital amount = (a) - (b) 20,256 21,669
Capital adequacy multiple (%) (a) / (b) 236% 427%
Capital Base comprises:
Net Assets 35,139 28,292
Regulatory adjustment applied in calculation of Tier 1 capital - -
(A) Common Equity Tier 1 Capital 35,139 28,292
Additional Tier 1 Capital - -
Regulatory adjustment applied in calculation of Additional Tier 1 capital - -
(B) Total Additional Tier 1 Capital - -
Tier 2 Capital - -
Regulatory adjustment applied in calculation of Tier 2 capital - -
(C) Total Tier 2 Capital - -
Total capital base 35,139 28,292
For detailed capital adequacy information on a statutory fund basis, users of this annual �nancial report should refer to the �nancial statements prepared by the friendly society.

104
IOOF annual report 2017
Notes to the �nancial statementsFor the year ended 30 June 2017
Section 6 - Other disclosures6-1 Parent entity �nancialsAs at and throughout the �nancial year ended 30 June 2017, the parent entity of the IOOF Group was IOOF Holdings Ltd.
2017 2016
$’000 $’000
Result of the parent entity
Pro�t for the year 159,871 138,091
Total comprehensive income for the year 159,871 138,091
Financial position of parent entity at year end
Current assets 75,845 62,842
Total assets 1,677,687 1,667,452
Current liabilities 114,215 17,257
Total liabilities 231,124 223,988
Total equity of the parent entity comprising of:
Share capital 1,438,601 1,439,276
Share-based payments reserve 2,062 2,485
Retained earnings 5,900 1,702
Total equity 1,446,563 1,443,464
Parent entity contingent liabilities
There are currently no complaints or claims made against the parent entity.
The parent entity does not provide any guarantees to subsidiaries or related parties.
6-2 Share-based paymentsThe IOOF Group operates a number of employee share and option schemes operated by the IOOF Equity Plan Trust (the “Trust”). The employee share option plans were approved by the Board of Directors.
IOOF Executive and Employee Share Option Plan
The IOOF Group has an ownership-based compensation scheme for executives and senior employees.
Selected employees may be granted options which entitle them to purchase ordinary fully paid shares in the Company at a price �xed at the time the options are granted. Voting and dividend rights will be attached to the unissued ordinary shares when the options have been exercised. Options may be exercised at any time from the date of vesting to the date of their expiry.
The Remuneration Committee regards the grant of options to employees as an appropriate long-term incentive and retention component of total remuneration for executives and senior employees. It is expected that future annual grants of options will be made, the vesting of which will be subject to attainment of appropriate performance hurdles and on the basis of continuing employment with the IOOF Group.
Options granted under the plan carry no dividend or voting rights. All plans are equity-settled. There were no options granted in 2017.

105
IOOF annual report 2017
IOOF Executive Performance Rights Plan
The IOOF Executive Performance Rights Plan is the vehicle used to deliver equity based incentives to executives and senior employees of the IOOF Group.
Each employee receives ordinary shares of the Company on vesting of the performance rights. No amounts are paid or payable by the recipient on receipt of the performance rights or on vesting. The performance rights carry neither rights to dividends nor voting rights prior to vesting.
The Remuneration Committee regards the grant of performance rights to employees as an appropriate long-term incentive and retention component of total remuneration for executives and senior employees. It is expected that future annual grants of performance rights will be made, subject to the Board’s determination of the overall performance of the Company and market conditions. The vesting of any performance rights awarded will be subject to attainment of appropriate performance hurdles and on the basis of continuing employment with the IOOF Group.
Performance rights granted under the plan carry no dividend or voting rights. All plans are equity-settled.
Deferred Share Plan
A Short Term Incentive (STI) mandatory deferral program exists with equity deferral relating to a third of the Managing Directors’ STI for each year.
The following share-based payment arrangements were in existence during the current and comparative reporting years:
Options Series – Recipient Exercise price
Earliest vesting
date
Exercise year Performance related vesting
conditions
$ Commence Expires
2012-02 Managing Director $6.81 1-Jul-14 1-Jul-14 1-Jul-17 EPS & RoE
2010-03 Executives $7.01 4-May-13 4-May-13 4-May-16 Nil
2009-16 Managing Director $5.20 27-Nov-12 27-Nov-12 27-Nov-15 EPS & RoE
On vesting of performance rights, ordinary shares are transferred to the employee’s name or sold. The employee receives all dividends on the ordinary shares while held in trust. The vesting of all issuances is subject to continuing employment.
Performance Rights
Deferred Shares
Total
Number of rights
Number of shares
Number of rights & shares
No. No. No.
Opening balance at 1 July 2016 587,425 68,879 656,304
Forfeited or lapsed during the year (176,750) - (176,750)
Exercised during the year (182,425) (26,984) (209,409)
Granted during the year 419,567 35,420 454,987
Outstanding at 30 June 2017 647,817 77,315 725,132
Exercisable at 30 June 2017 - - -

106
IOOF annual report 2017
Notes to the �nancial statementsFor the year ended 30 June 2017
Disclosure of share-based payment plans
Series – Recipient Exercise price
Opening balance
as at 1 July 2016
Granted Forfeited or Lapsed
Exercised Closing balance
as at 30 June 2017
Performance rights
2012-01 Managing Director $nil 32,175 - - (32,175) -
2014-01 Executives $nil 96,250 - - (96,250) -
2014-02 Managing Director $nil 54,000 - - (54,000) -
2015-01 Executives $nil 150,000 - (46,250) - 103,750
2015-02 Managing Director $nil 75,000 - (25,500) - 49,500
2016-01 Executives $nil 105,000 - (45,000) - 60,000
2016-02 Managing Director $nil 75,000 - - - 75,000
2017-01 Executives $nil - 240,000 (60,000) - 180,000
2017-02 Managing Director $nil - 120,000 - - 120,000
2017-03 Executives $nil - 30,000 - - 30,000
2017-04 Other Key Stakeholders $nil - 29,567 - - 29,567
587,425 419,567 (176,750) (182,425) 647,817
Deferred shares
2015-03 Managing Director $nil 26,984 - - (26,984) -
2016-03 Managing Director $nil 41,895 - - - 41,895
2017-03 Managing Director $nil - 35,420 - - 35,420
68,879 35,420 - (26,984) 77,315
656,304 454,987 (176,750) (209,409) 725,132
There are no options outstanding at 30 June 2017.
Inputs for measurement of grant date fair values granted during the �nancial year
The grant date fair value of share-based payment plans granted during the year were measured based on a binomial options pricing model for non-market performance conditions and a monte carlo simulation model for market performance conditions. Expected volatility is estimated by considering historic average share price volatility. The inputs used in the measurement of the fair values at grant date of the share-based payment plans are the following:
Series Fair value Grant date share price
Expected volatility
Expected life (years)
Dividend yield
Risk-free interest rate
2017-01 Executives $6.10 $8.80 25% 3 6.2% 1.5%
2017-02 Managing Director $4.50 $8.40 25% 3 6.3% 1.9%
2017-03 Executives $5.60 $8.68 25% 3 6.1% 2.0%
2017-04 Other Key Stakeholders $7.11 $8.74 n/a 3 6.0% 2.0%

107
IOOF annual report 2017
The following share-based payment arrangements were in existence during the current and comparative reporting years:
Performance Rights Series – Recipient Exercise price
Earliest vesting
date
Last tranche vesting date
Performance related vesting
conditions
2017-04 Other Key Stakeholders nil 30-Jun-19 n/a n/a
2017-03 Executives nil 31-Dec-19 n/a TSR
2017-02 Managing Director nil 30-Jun-19 n/a TSR & RoE
2017-01 Executives nil 30-Jun-19 n/a TSR
2016-02 Managing Director nil 30-Jun-18 n/a TSR & RoE
2016-01 Executives nil 30-Jun-18 n/a TSR
2015-02 Managing Director nil 30-Jun-17 n/a TSR & RoE
2015-01 Executives nil 30-Jun-17 n/a TSR
2014-02 Managing Director nil 30-Jun-16 n/a TSR & RoE
2014-01 Executives nil 30-Jun-16 n/a TSR
2013-04 Other Key Stakeholders nil 30-Nov-15 n/a Compliance1
2013-03 Other Key Stakeholders nil 30-Nov-15 n/a Compliance1
2012-01 Managing Director nil 01-Jul-14 01-Jul-16 TSR & RoE
2010-06 Managing Director nil 23-Nov-13 23-Nov-15 TSR & RoE
1 The compliance condition requires maintenance of authorised representative status, attendance at professional development days, compliance with CPD
requirements and the achievement of a minimum compliance audit score.
The breakdown of share-based payments expense for the year by recipient is as follows. This represents the expense recorded to date and does not re�ect the opportunity to transfer to retained pro�ts the value of those legacy series that will lapse.
Recipient 2017 2016
$’000 $’000
Managing Director 753 726
Senior Management 513 806
Other Key Stakeholders 29 434
1,295 1,966
Accounting policies
The grant date fair value of share-based payment awards granted to employees is recognised as a share-based payment expense, with a corresponding increase in the share-based payments reserve, over the years that the employees unconditionally become entitled to the awards. The amount recognised as an expense is adjusted to re�ect the number of awards for which the related service and non-market vesting conditions are expected to be met, such that the amount ultimately recognised as an expense is based on the number of awards that meet the related service and non-market performance conditions at vesting date.
For share-based payment awards with non-vesting conditions, the grant date fair value of the share-based payment is measured to re�ect such conditions and there is no true-up for di�erences between expected and actual outcomes.
The fair value at grant date is independently determined where considered appropriate. The option pricing model used takes into account the exercise price, the term of the option, the impact of dilution, the share price at grant date and expected price volatility of the underlying share, the expected dividend yield and the risk free interest rate for the term of the option.
Shares held by the Trust will contribute to the employee allocation of shares on satisfaction of vesting performance hurdles. The IOOF Group has no right to recall placed shares. However, a subsidiary company acts as the Trustee of the Trust, and can direct the voting rights of shares held.
Shares in the Company held by the Trust are classi�ed and disclosed as treasury shares, and deducted from share capital. Dividends received by the Trust are recorded as dividend income in the �nancial statements of the Trust and are eliminated on consolidation.

108
IOOF annual report 2017
Notes to the �nancial statementsFor the year ended 30 June 2017
Set out below is a list of material subsidiaries of the IOOF Group.
Country of incorporation
Ownership interest
2017 2016
% %
Parent entity
IOOF Holdings Ltd Australia
Material subsidiaries
AET Structured Finance Services Pty Limited Australia 100.0 100.0
Australian Executor Trustees Limited Australia 100.0 100.0
Bridges Financial Services Pty Limited Australia 100.0 100.0
Consultum Financial Advisers Pty Ltd Australia 100.0 100.0
Executive Wealth Management Financial Services Pty Limited Australia 100.0 100.0
I.O.O.F. Investment Management Limited Australia 100.0 100.0
IOOF Ltd Australia 100.0 100.0
IOOF Equity Plan Trust Australia 100.0 100.0
IOOF NZ Ltd New Zealand 100.0 100.0
IOOF Service Co Pty Ltd Australia 100.0 100.0
Lonsdale Financial Group Limited Australia 100.0 100.0
Questor Financial Services Pty Ltd Australia 100.0 100.0
SFG Australia Limited Australia 100.0 100.0
Financial Acuity Limited Australia 100.0 100.0
Shadforth Financial Group Limited Australia 100.0 100.0
Perennial Investment Management Limited Australia - 100.0
Actuate Alliance Services Pty Ltd Australia 100.0 100.0
Ord Minnett Limited Australia 70.0 70.0
Ord Minnett Financial Planning Pty Limited Australia 70.0 70.0
Ord Minnett Management Limited Australia 70.0 70.0
Unconsolidated structured entities
The IOOF Group has interests in various structured entities that are not consolidated. An ‘interest’ in an unconsolidated structured entity is any form of contractual or non-contractual involvement which exposes the IOOF Group to variability of returns from the performance of that entity. Such interests include holdings of equity securities, seed capital and fees from funds management activities. The seed capital is primarily available to support the business in establishing new products and is also used to support capital adequacy requirements of the bene�t funds.
The IOOF Group has investments in managed investment funds through its asset management subsidiaries. Control of these managed investment funds may exist since the IOOF Group has power over the activities of the fund. However, these funds have not been consolidated because the IOOF Group is not exposed to signi�cant variability in returns from the funds. The IOOF Group earns management fees from the management of these investment funds which are commensurate with the services provided and are reported in external management and service fee revenue in note 2-3. Management fees are generally based on the value of the assets under management. Therefore, the fees earned are impacted by the composition of the assets under management and �uctuations in �nancial markets.
Investment funds are investment vehicles that consist of a pool of funds collected from several investors for the purpose of investing in securities such as money market instruments, debt securities, equity securities and other similar assets. For all investment funds, the IOOF Group’s maximum exposure to loss is equivalent to the carrying amount of the investment in the fund.

109
IOOF annual report 2017
6-4 Remuneration of auditors Auditors’ remuneration paid or payable by members of the IOOF Group to the auditors of the corporate entities in relation to audit services of the corporate entities and products operated by the IOOF Group during the year and for the prior year:
2017 2016
$ $
Audit services
Auditors of the Company
KPMG Australia
Audit and review of �nancial reports 2,903,518 2,856,236
Other regulatory audit services 1,052,624 1,187,388
3,956,142 4,043,624
Other services
Auditors of the Company
KPMG Australia
Taxation services 131,452 267,585
Due diligence services 185,744 82,398
Other services 182,762 180,305
499,958 530,287
4,456,100 4,573,911
All amounts payable to the Auditors of the Company were paid by an IOOF Group subsidiary.
6-5 Key management personnelThe key management personnel compensation comprised:
2017 2016
$ $
Short-term employee bene�ts 5,452,163 5,466,517
Post-employment bene�ts 176,413 186,372
Share-based payments 1,511,047 1,554,214
7,139,623 7,207,103
Key management personnel compensation reconciles to disclosures in the remuneration report as follows:
Executive key management personnel 6,151,285 6,275,282
Non-executive Directors 988,338 931,821
7,139,623 7,207,103
Individual Directors and executives compensation disclosures
Information regarding individual Directors and executives compensation and some equity instruments disclosures as required by Corporations Regulation 2M.3.03 is provided in the remuneration report section of the Directors’ Report.
No Director has entered into a material contract with the IOOF Group since the end of the prior �nancial year and there were no material contracts involving directors’ interests existing at year-end.

110
IOOF annual report 2017
Notes to the �nancial statementsFor the year ended 30 June 2017
6-6 Related party transactions
(a) Ultimate parent entity
IOOF Holdings Ltd is the ultimate parent entity in the IOOF Group.
(b) Loans to Directors and executives of associates and subsidiaries
Financial year
Opening balance
1 July
Closing balance
June
Interest paid and payable
during the year
Highest balance
during the year
$ $ $ $
Interest free loans
Perennial Value Management Limited 2017 2,286,717 2,286,717 - 2,286,717
2016 2,286,717 2,286,717 - 2,286,717
Interest bearing loans
Perennial Value Management Limited 2017 6,263,882 6,267,091 234,588 6,336,367
2016 6,183,013 6,263,882 250,543 6,393,615
The amounts above were advanced by Perennial Investment Partners Pty Ltd and I.O.O.F. Investment Management Limited for the speci�c purpose of assisting executives to acquire an equity interest in subsidiaries and associates of the Company. Secured interest bearing loans totalling $6,267,091 were made on commercial terms and conditions and loans totalling $2,286,717 are unsecured interest free loans.
(c) Transactions with key management personnel
i. Key management personnel compensation
Details of key management personnel compensation are disclosed in section 6-5 to the �nancial statements and in the Remuneration Report.
ii. Loans to key management personnel
There are no loans between the IOOF Group and key management personnel.
iii. Other transactions with key management personnel of the IOOF Group
There were no other transactions with key management personnel of the IOOF Group during the 2017 and 2016 �nancial years.
(d) Transactions with other related parties
Other related parties of the IOOF Group include associates listed in section 4-1 Associates.
2017 2016
$ $
Receipt of service charge revenue from associates - 1,886,860
Payment of management fees to associates - 8,096,435

111
IOOF annual report 2017
Section 7 - Basis of preparation
This section sets out the IOOF Group’s accounting policies that relate to the �nancial statements as a whole. Where an accounting policy is speci�c to a single note, the policy is described in the note to which it relates. This section also shows new accounting standards, amendments and interpretations, and whether they are e�ective in 2017 or later years. We explain how these changes are expected to impact the �nancial position and performance of the IOOF Group.
7-1 Reporting entityThe Company is a public company listed on the Australian Stock Exchange (trading under the symbol ‘IFL’), domiciled in Australia. The consolidated �nancial statements of the Company as at and for the year ended 30 June 2017 comprise the Company and its controlled entities and the IOOF Group’s interests in associates.
The IOOF Group is a for-pro�t entity and is primarily involved in the provision of wealth management services.
The Company’s registered o�ce and its principal place of business are Level 6, 161 Collins Street, Melbourne.
7-2 Basis of preparation
(a) Statement of compliance
These general purpose �nancial statements have been prepared in accordance with Australian Accounting Standards (AASBs) adopted by the Australian Accounting Standards Board (AASB) and the Corporations Act 2001. The consolidated �nancial statements comply with International Financial Reporting Standards (IFRS) adopted by the International Accounting Standards Board (IASB).
The annual �nancial report was approved by the Board of Directors on 29 August 2017.
(b) Basis of measurement
The consolidated �nancial statements have been prepared on the historical cost basis except for the following material items in the statement of �nancial position:
• �nancial instruments at fair value through pro�t or loss are measured at fair value; and
• available-for-sale �nancial assets are measured at fair value.
The statement of �nancial position is presented in order of liquidity.
(c) Functional and presentation currency
These consolidated �nancial statements are presented in Australian dollars, which is the Company’s functional currency. All amounts have been rounded to the nearest thousand unless otherwise stated.
(d) Rounding of amounts
The Company is a company of the kind referred to in ASIC Corporations Instrument 2016/191, dated 24 March 2016, and in accordance with that Instrument amounts in the �nancial report are rounded o� to the nearest thousand dollars, narrative disclosures are expressed in whole dollars or as otherwise indicated.
(e) Use of estimates and judgements
To conform with AASBs management is required to make judgements, estimates and assumptions that a�ect the application of accounting policies and the reported amounts of assets, liabilities, income and expenses. Actual results may di�er from these estimates.
Estimates and underlying assumptions are reviewed on an ongoing basis. Revisions to accounting estimates are recognised in the year in which the estimates are revised and in any future years a�ected.
Information about critical judgements in applying accounting policies that have the most signi�cant e�ect on the amounts recognised in the �nancial statements is included in the following notes:
• section 2-4 - (vii) Deferred acquisition costs;
• section 4-2 - Intangible assets (other than goodwill);
• section 4-3 - Goodwill; and
• section 6-2 - Share-based payments.
Information about assumptions and estimation uncertainties that have a signi�cant risk of resulting in a material adjustment within the next �nancial year are included in the following notes:
• note 4-2 & 4-3 - key assumptions used in discounted cash �ow projections; and
• note 3-4 & 4-4 - contingencies and provisions.

112
IOOF annual report 2017
Notes to the �nancial statementsFor the year ended 30 June 2017
7-3 Other signi�cant accounting policiesSigni�cant accounting policies have been included in the relevant notes to which the policies relate. Other signi�cant accounting policies are listed below.
Certain comparative amounts have been reclassi�ed to conform with the current year’s presentation.
(a) Changes in accounting policies
The IOOF Group has consistently applied the accounting policies to all years presented in these consolidated �nancial statements.
(b) Basis of consolidation
The consolidated �nancial statements incorporate the assets and liabilities of all subsidiaries of the Company as at 30 June 2017 and the results of all controlled subsidiaries for the year then ended. This includes the bene�t funds of its subsidiary, IOOF Ltd, and any controlled trusts.
The bene�t funds, and any trusts controlled by those funds, are treated as statutory funds in accordance with the Life Insurance Act 1995. These statutory funds, in addition to the statutory funds of the life insurance business conducted by the IOOF Group, are shown separately from shareholder funds in the notes to the �nancial statements.
Refer to Note 5-2 Liabilities relating to statutory funds for information in relation to the di�erent accounting treatment of investment contracts with discretionary participating features.
(i) Business combinations
The IOOF Group accounts for business combinations using the acquisition method when control is transferred. The consideration transferred in the acquisition is generally measured at fair value, as are the identi�able net assets acquired. Any goodwill that arises is tested annually for impairment. Any gain on a bargain purchase is recognised in pro�t or loss immediately. Transaction costs are expensed as incurred, except if related to the issue of debt or equity securities.
Any contingent consideration payable is recognised at fair value at the acquisition date. If the contingent consideration is classi�ed as equity, it is not remeasured and settlement is accounted for within equity. Otherwise, subsequent changes to the fair value of the contingent consideration are recognised in pro�t or loss.
When share-based payment awards (replacement awards) are required to be exchanged for awards held by the acquiree’s employees (acquiree’s awards) and relate to past services, then all or a portion of the amount of the acquiree’s replacement awards is included in measuring the consideration transferred in the business combination. This determination is based on the market-based value of the replacement awards compared with the market-based value of the acquiree’s awards and the extent to which the replacement awards relate to past and/or future service.
(ii) Non-controlling interests (NCI)
NCI are measured at their proportionate share of the acquiree’s identi�able net assets at the acquisition date. Changes in the IOOF Group’s interest in a subsidiary that do not result in a loss of control are accounted for as equity transactions.
(iii) Subsidiaries
Subsidiaries are entities controlled by the IOOF Group. The IOOF Group controls an entity when it is exposed to, or has rights to, variable returns from its involvement with the entity and has the ability to a�ect those returns through its power over the entity. The �nancial statements of subsidiaries are included in the consolidated �nancial statements from the date on which control commences until the date on which control ceases.
(iv) Loss of control
When the IOOF Group loses control over a subsidiary, it derecognises the assets and liabilities of the subsidiary, and any related NCI and other components of equity. Any resulting gain or loss is recognised in pro�t or loss. Any interest retained in the former subsidiary is measured at fair value when control is lost.
(v) IOOF Equity Plan Trust (the “Trust”)
The IOOF Group has formed a trust to administer the IOOF Group’s employee share schemes. The Trust is consolidated, as the substance of the relationship is that the Trust is controlled by the IOOF Group. Shares held by the Trust are disclosed as treasury shares and are deducted from share capital.

113
IOOF annual report 2017
(vi) Transactions eliminated on consolidation
Intra-IOOF Group balances and transactions, and any unrealised income and expenses arising from intra-IOOF Group transactions, are eliminated in preparing the consolidated �nancial statements. Unrealised gains arising from transactions with equity accounted investees are eliminated against the investment to the extent of the IOOF Group’s interest in the investee. Unrealised losses are eliminated in the same way as unrealised gains, but only to the extent that there is no evidence of impairment. Dividends paid to the Trust are also eliminated.
(c) Foreign currency
Foreign currency transactions
Transactions in foreign currencies are translated at the foreign exchange rate ruling at the date of the transaction. Monetary assets and liabilities denominated in foreign currencies at the balance sheet date are translated to Australian dollars at the foreign exchange rate ruling at that date. Foreign exchange di�erences arising on translation are recognised in pro�t or loss. Non-monetary assets and liabilities that are measured in terms of historical cost in a foreign currency are translated using the exchange rate at the date of the transaction.
Foreign operations
The assets and liabilities of foreign operations, including goodwill and fair value adjustments arising on consolidation, are translated to Australian dollars at foreign exchange rates ruling at the balance sheet date. The revenue and expenses of foreign operations are translated to Australian dollars at rates approximating the foreign exchange rates ruling at the dates of the transactions.
Foreign currency di�erences are recognised directly in equity in the foreign currency translation reserve (FCTR).
(d) Property and equipment
(i) Recognition and measurement
Property and equipment are measured at cost less any accumulated depreciation and any accumulated impairment losses.
Cost includes expenditure that is directly attributable to the acquisition of the asset.
The gain or loss on divestment of an item of property and equipment is determined by comparing the proceeds from divestment with the carrying amount of the property and equipment and is recognised net within other income/other expenses in pro�t or loss. When revalued assets are sold, any related amount included in the revaluation reserve is transferred to retained earnings.
(ii) Subsequent costs
Subsequent costs are included in the asset’s carrying amount or recognised as a separate asset, as appropriate, only when it is probable that future economic bene�ts associated with the item will �ow to the IOOF Group. Repairs and maintenance costs are charged to pro�t or loss as they are incurred.
(iii) Depreciation
Depreciation is recognised in pro�t or loss on a straight-line basis over the estimated useful lives of each component of an item of property and equipment. Leased assets are depreciated over the shorter of the lease term and their useful lives unless it is reasonably certain that the IOOF Group will obtain ownership by the end of the lease term.
Items of property and equipment are depreciated from the date that they are installed and are ready for use, or in respect of internally constructed assets, from the date that the asset is completed and ready for use.
The estimated useful lives for the current and comparative year are as follows:
• o�ce equipment 3-10 years
• leasehold improvements 3-10 years
• equipment under �nance lease 3-10 years
Depreciation methods, useful lives and residual values are reviewed at each reporting date, and adjusted if appropriate.

114
IOOF annual report 2017
Notes to the �nancial statementsFor the year ended 30 June 2017
(e) Impairment
(i) Non-derivative �nancial assets
A �nancial asset not carried at fair value through pro�t or loss is assessed at each reporting date to determine whether there is objective evidence that it is impaired. A �nancial asset is impaired if objective evidence indicates that a loss event has occurred after the initial recognition of the asset, and that the loss event had a negative e�ect on the estimated future cash �ows of that asset that can be estimated reliably.
Objective evidence that �nancial assets (including equity securities) are impaired can include default or delinquency by a debtor, restructuring of an amount due to the IOOF Group on terms that the IOOF Group would not consider otherwise, indications that a debtor or issuer will enter bankruptcy, adverse changes in the payment status of borrowers or issuers in the IOOF Group, economic conditions that correlate with defaults or the disappearance of an active market of a security. In addition, for an investment in an equity security, a signi�cant or prolonged decline in its fair value below its cost is considered objective evidence of impairment.
Financial assets measured at amortised cost
An impairment loss in respect of a �nancial asset measured at amortised cost is calculated as the di�erence between its carrying amount and the present value of the estimated future cash �ows discounted at the asset’s original e�ective interest rate. Losses are recognised in pro�t or loss and re�ected as an allowance account against loans and receivables. Interest on the impaired asset continues to be recognised. When a subsequent event (eg. a repayment by a debtor) causes the amount of impairment loss to decrease, the decrease in impairment loss is reversed through pro�t or loss.
Available-for-sale �nancial assets
Impairment losses on available-for-sale �nancial assets are recognised by reclassifying the losses accumulated in the investment revaluation reserve, to pro�t or loss. The cumulative loss that is reclassi�ed from equity to pro�t or loss is the di�erence between the acquisition cost, net of any principal repayment and amortisation, and the current fair value, less any impairment loss previously recognised in pro�t or loss.
Changes in impairment provisions attributable to application of the e�ective interest method are re�ected as a component of interest income. If, in a subsequent year, the fair value of an impaired available-for-sale debt security increases and the increase can be related objectively to an event occurring after the impairment loss was recognised in pro�t or loss, then the impairment loss is reversed, with the amount of the reversal recognised in pro�t or loss. However, any subsequent recovery in the fair value of an impaired available-for-sale equity security is recognised in other comprehensive income.
Associates
An impairment loss in respect of an associate is measured by comparing the recoverable amount of the investment with its carrying amount. An impairment loss is recognised in pro�t or loss, and is reversed if there has been a favourable change in the estimates used to determine the recoverable amount.
(ii) Non-�nancial assets
The carrying amounts of the IOOF Group’s non-�nancial assets, other than deferred tax assets, are reviewed at each reporting date to determine whether there is any indication of impairment. If any such indication exists, then the asset’s recoverable amount is estimated. For goodwill, and intangible assets that have inde�nite useful lives or that are not yet available for use, the recoverable amount is estimated each year at the same time.
An impairment loss is recognised if the carrying amount of an asset or its related cash-generating unit (CGU) exceeds its estimated recoverable amount.
The recoverable amount of an asset or cash-generating unit is the greater of its value in use and its fair value less costs to sell. In assessing value in use, the estimated future cash �ows are discounted to their present value using a pre-tax discount rate that re�ects current market assessments of the time value of money and the risks speci�c to the asset. Subject to an operating segment ceiling test, for the purposes of goodwill impairment testing, CGUs to which goodwill has been allocated are aggregated so that the level at which impairment is tested re�ects the lowest level at which goodwill is monitored for internal reporting purposes. Goodwill acquired in a business combination is allocated to groups of CGUs that are expected to bene�t from the synergies of the combination.
Impairment losses are recognised in pro�t or loss. Impairment losses recognised in respect of CGUs are allocated �rst to reduce the carrying amount of any goodwill allocated to the units, and then to reduce the carrying amounts of the other assets in the unit (group of units) on a pro rata basis.

115
IOOF annual report 2017
An impairment loss in respect of goodwill is not reversed. In respect of other assets, impairment losses recognised in prior years are assessed at each reporting date for any indications that the loss has decreased or no longer exists. An impairment loss is reversed if there has been a change in the estimates used to determine the recoverable amount. An impairment loss is reversed only to the extent that the asset’s carrying amount does not exceed the carrying amount that would have been determined, net of depreciation or amortisation, if no impairment loss had been recognised.
Goodwill that forms part of the carrying amount of an investment in an associate is not recognised separately, and therefore is not tested for impairment separately. Instead, the entire amount of the investment in an associate is tested for impairment as a single asset when there is objective evidence that the investment in an associate may be impaired.
(f) Goods and service tax (GST)
Revenues, expenses and assets (excluding receivables) are recorded net of GST. GST input tax credits are initially recorded as an asset and GST collected as a liability. These balances are o�set as at the reporting date and recognised as either an amount receivable or payable to the Australian Taxation O�ce. The GST portion relating to �nancial supplies and non-deductible expenditure, for which an input tax credit cannot be claimed, is expensed or is recognised as part of the cost of acquisition of an asset.
Receivables and payables are stated inclusive of the amount of GST receivable or payable. The net amount of GST recoverable from, or payable to, the Australian Taxation O�ce is included with other receivables or payables in the statement of �nancial position.
Cash �ows are presented in the statement of cash �ows on a gross basis. The GST components of cash �ows arising from investing or �nancing activities which are recoverable from, or payable to, the Australian Taxation O�ce are presented as operating cash �ows.
(g) Leases
Leases in terms of which the IOOF Group assumes substantially all the risks and rewards of ownership are classi�ed as �nance leases. Upon initial recognition the leased asset is measured at an amount equal to the lower of its fair value and the present value of the minimum lease payments. Subsequent to initial recognition, the asset is accounted for in accordance with the accounting policy applicable to that asset.
Minimum lease payments made under �nance leases are apportioned between the �nance expense and the reduction of the outstanding liability. The �nance expense is allocated to each year during the lease term so as to produce a constant periodic rate of interest on the remaining balance of the liability. Other leases are operating leases and are not recognised on the IOOF Group’s statement of �nancial position.
7-4 New standards and interpretations not yet adoptedA number of new standards and amendments to standards are e�ective for annual years beginning after 1 January 2016 and earlier application is permitted; however the IOOF Group has not early adopted the following new or amended standards in preparing these consolidated �nancial statements.
IFRS 15 Revenue from Contracts with Customers
IFRS 15 establishes a comprehensive framework for determining whether, how much and when revenue is recognised. It replaces existing revenue recognition guidance, including IAS 18 Revenue, IAS 11 Construction Contracts and IFRIC 13 Customer Loyalty Programmes.
IFRS 15 is e�ective for annual years beginning on or after 1 January 2018, with early adoption permitted.
The IOOF Group has completed an initial assessment of the potential impact of the adoption of IFRS 15 on its consolidated �nancial statements and does not expect that there will be a signi�cant impact.

116
IOOF annual report 2017
Notes to the �nancial statementsFor the year ended 30 June 2017
(i) Management and service fees revenue
The IOOF Group provide management services to unit trusts and funds operated by the IOOF Group at normal commercial rates. Management and service fees earned from the unit trusts and funds are calculated based on an agreed percentage of the respective funds under management or administration as disclosed in the respective product disclosure statements, and are recognised on an accruals basis.
The IOOF Group currently recognises management and service fees revenue at the time the service is provided. No signi�cant changes are expected to this treatment under IFRS 15.
Stockbroking revenue and external other fee revenue are also recognised at the time the service is provided. No signi�cant changes are expected to this treatment under IFRS 15.
The IOOF Group plans to adopt IFRS 15 in its consolidated �nancial statements for the year ending 30 June 2019.
IFRS 9 Financial Instruments
IFRS 9 is e�ective for annual years beginning on or after 1 January 2018, with early adoption permitted. The IOOF Group plans to adopt IFRS 9 in its consolidated �nancial statements for the year ending 30 June 2019.
At 30 June 2017, the IOOF Group had equity investments classi�ed as available-for-sale with a fair value of $25.4m that are held for long-term strategic purposes. Upon application of IFRS 9 the IOOF Group will classify these as Fair Value Other Comprehensive Income with all fair value gains and losses reported in other comprehensive income in line with current treatment.
IFRS 9 replaces the “incurred loss” model in IAS 39 with a forward looking ‘expected credit loss’ (ECL) model when determining provision for impairment of receivables. This will require considerable judgement as to how changes in economic factors a�ect ECLs, which will be determined on a probability-weighted basis. Given the IOOF Group’s receivables are short term, loss allowances are not expected to change signi�cantly when IFRS 9 is adopted.
IFRS 16 Leases
IFRS 16 introduces a single, on-balance sheet lease accounting model for lessees. A lessee recognises a right-of-use asset representing its right to use the underlying asset and a lease liability representing its obligation to make lease payments. There are optional exemptions for short-term leases and leases of low value items.
IFRS 16 replaces existing leases guidance including IAS 17 Leases, IFRIC 4 Determining whether an Arrangement contains a Lease, SIC-15 Operating Leases-Incentives and SIC-27 Evaluating the Substance of Transactions involving the Legal Form of a Lease.
The standard is e�ective for annual years beginning on or after 1 January 2019. Early adoption is permitted for entities that apply IFRS 15 Revenue from Contracts with Customers at or before the date of initial application of IFRS 16.
The IOOF Group has started an initial assessment of the potential impact of its consolidated �nancial statements. So far, the most signi�cant impact identi�ed is that the IOOF Group will recognise new assets and liabilities for its property operating leases ($85m). The nature of expenses related to those leases will now change as IFRS 16 replaces the straight-line operating lease expense with a depreciation charge for right-of-use assets and interest expense on lease liabilities. No signi�cant impact is expected for the IOOF Group’s �nance leases.
The IOOF Group will apply the standard using a retrospective approach and plans to adopt IFRS 16 in the consolidated �nancial statements for the year ended 30 June 2020.
Disclosure Initiative (Amendments to IAS 7)
The amendments require disclosures that enable users of �nancial statements to evaluate changes in liabilities arising from �nancing activities, including both changes arising from cash �ow and non-cash changes.
The amendments are e�ective for annual years beginning on or after 1 January 2017, with early adoption permitted.
To satisfy the new disclosure requirements, the Group intends to present a reconciliation between the 2017 opening and 2018 closing balances for liabilities with changes arising from �nancing activities.

117
IOOF annual report 2017
Other amendments
The following new or amended standards are not expected to have a signi�cant impact on the IOOF Group’s consolidated �nancial statements.
• Classi�cation and Measurement of Share-based payment Transactions (amendments to IFRS 2)
• Sale or Contribution of Assets between an Investor and its Associate or Joint Venture (amendments to IFRS 10 and IAS 28)
• Recognition of Deferred Tax Assets for Unrealised Losses (amendments to IAS 12)
7-5 Subsequent eventsThe Directors have declared the payment of a �nal dividend of 27.0 cents per ordinary share franked to 100% based on tax paid at 30%, to be paid on 1 September 2017.
The Directors are not aware of any other event or circumstance since the end of the �nancial year not otherwise dealt with in this report or the consolidated �nancial report that has or may signi�cantly a�ect the operations of the consolidated entity, the results of those operations or the state of a�airs of the consolidated entity in subsequent �nancial years.

118
IOOF annual report 2017
Shareholder informationShare CapitalIOOF has on issue 300,133,752 fully paid ordinary shares held by 59,932 holders as at 28 September 2017.
Voting RightsIOOF’s fully paid ordinary shares carry voting rights of one vote per share.
Twenty largest shareholders as at 28 September 2017The following table sets out the top 20 registered holders of shares.
Rank Holder Name Balance at 28-Sep-17
% of issued capital
1 HSBC CUSTODY NOMINEES (AUSTRALIA) LIMITED 41,302,623 13.76
2 THE TRUST COMPANY (AUSTRALIA) LIMITED <MR BRUCE WILLIAM NEIL A/C> 25,412,867 8.47
3 J P MORGAN NOMINEES AUSTRALIA LIMITED 23,788,928 7.93
4 CITICORP NOMINEES PTY LIMITED 23,322,538 7.77
5 NATIONAL NOMINEES LIMITED 8,982,179 2.99
6 BNP PARIBAS NOMINEES PTY LTD <AGENCY LENDING DRP A/C> 4,770,787 1.59
7 BNP PARIBAS NOMS PTY LTD <DRP> 4,571,120 1.52
8 MR IAN GREGORY GRIFFITHS 2,760,419 0.92
9 SAM GANNON PTY LTD <THE J B GANNON FAMILY A/C> 2,265,506 0.75
10 CITICORP NOMINEES PTY LIMITED <COLONIAL FIRST STATE INV A/C> 1,946,474 0.65
11 MRS SALLY KELAHER 1,928,518 0.64
12 MILTON CORPORATION LIMITED 1,716,464 0.57
13 HSBC CUSTODY NOMINEES (AUSTRALIA) LIMITED - A/C 2 1,214,453 0.40
14 BKI INVESTMENT COMPANY LIMITED 1,174,094 0.39
15 WPQ HOLDINGS PTY LTD 1,133,098 0.38
16 CUSTODIAL SERVICES LIMITED <BENEFICIARIES HOLDING A/C> 1,124,199 0.37
17 AMP LIFE LIMITED 1,095,032 0.36
18 THANECORP AUSTRALIA PTY LTD <THANECORP INVESTMENT A/C> 1,000,000 0.33
19 THANECORP AUSTRALIA PTY LTD <THANECORP INVESTMENT A/C> 797,756 0.27
20 MRS SUSAN JANE GRIFFITHS 777,520 0.26
Total Securities of Top 20 Holdings 151,084,575 50.34
Total of Securities 300,133,752

119
IOOF annual report 2017
Distribution of members and their holdingsThe following table summarises the distribution of our listed shares as at 28 September 2017.
Range No of Holders No of Units % Issued Capital
1-1,000 34,498 13,425,631 4.47
1,001-5,000 20,181 46,635,460 15.54
5,001-10,000 3,414 24,391,533 8.13
10,001-100,000 1,715 36,315,053 12.10
100,001+ 124 179,366,075 59.76
Totals 59,932 300,133,752 100.00
There were 787 shareholders holding less than a marketable parcel of shares based on a market price of $11.12 at the close of trading on 28 September 2017 and there were 20 per cent of shareholders with registered addresses outside Australia.
Substantial ShareholdingsSubstantial shareholders as at 28 September 2017 are shown below, with the date of their last notice lodged in accordance with section 671B of the Corporations Act:
Name Date of last notice
No of Ord Shares
% of Issued Share Capital as at date of last notice
Bruce W Neill 21-Aug-2014 27,812,867 9.29%
Legg Mason Asset Management Australia Limited 20-Jun-2017 21,394,719 7.12%
Share register and other enquiriesIf you have any questions in relation to your shareholding, share transfers or dividends, please contact our share registry:
Boardroom Pty Limited Level 12, 225 George Street Sydney NSW 2000
Phone: 1300 737 760 (Australia only)Phone: + 612 9290 9600Email: [email protected]: www.boardroomlimited.com.au
Please include your shareholder reference number (SRN) or holder identi�cation number (HIN) in all correspondence to the share registry.
CRA-6580 IOOF Annual Report 2017 - FINANCIALS v6.indd 119 6/10/17 10:19 am

This page has been left blank intentionally.

ContentsAbout IOOF 1
Our major brands 2
Chairman and Managing Director’s commentary 3
Our �nancial performance 7
Directors 10
Environmental, Social & Governance report 13
IOOF Foundation 21
Financial report 23
Corporate directory(as at 28 September 2017)
Directors Mr George Venardos B.Com, FCA, FGIA, FAICD, FCIS Chairman
Mr Christopher Kelaher B.Ec, LL.B, F Fin. Managing Director
Ms Elizabeth Flynn LL.B, Grad Dip AppCorpGov, FAICD, FFin, FGIA, FCIS.
Ms Jane Harvey B.Com, MBA, FCA, FAICD
Mr Allan Gri�ths B.Bus, DipLi
Mr John Selak Dip Acc, FCA, FAICD
Company Secretary Mr A Paul M Vine LL.B, FGIA, FCIS, GAICD
Notice of Annual General Meeting The Annual General Meeting of IOOF Holdings Ltd will be held at:
Verandah Room Grand Hyatt 123 Collins Street Melbourne, Victoria 3000
Time 9.30am
Date 23 November 2017
A formal notice of meeting is available on our website and has been sent to shareholders
Principal registered o�ce in Australia Level 6, 161 Collins Street Melbourne, VIC 3000
(03) 8614 4400
Share registry Boardroom Pty Limited Level 12, 225 George Street Sydney NSW 2000
Auditor KPMG Tower Two, Collins Square, 727 Collins Street Docklands VIC 3008
Solicitors King & Wood Mallesons Level 50, Bourke Place 600 Bourke Street Melbourne VIC 3000
Bankers Commonwealth Bank Limited Tower 1, 201 Sussex Street, Sydney NSW 2000
Securities exchange listing IOOF Holdings Ltd shares are listed on the Australian Securities Exchange
(ASX: IFL)
Website address www.ioof.com.au
CRA-6580 IOOF Annual Report 2017 - COVER SPREADS_V5.indd 2-4 6/10/17 2:54 pm

CRA-
6580
annualreport2017
IOO
F Holdings | Annual Report 2017
Turn your life goals into a reality
ioof.com.au


![IR Fi'J 1323 l, IOOF] 1.188111) 1320 1 1001]] 1.188111 ...sushi.takinogawa-group.co.jp/sushi/img/sushi_menu_201904.pdf · IR Fi'J 1323 l, IOOF] 1.188111) 1320 1 1001]] 1.188111) 1322](https://static.fdocuments.net/doc/165x107/6001ffd6e069e410d43d0a01/ir-fij-1323-l-ioof-1188111-1320-1-1001-1188111-sushitakinogawa-groupcojpsushiimgsushimenu.jpg)