
Annualized net return for various PEWI land use options and practices The following slides provides...
13
zed net return for various PEWI land use options and pr The following slides provides the details of the individual analysis done for each land use or practice (summarized below). Note: In the slides, land use that carries a positive net value has a green band; land uses that carries a net cost cost have red bands. Main Assumptions: • 20 yr assessment horizon • 4% discount real rate • Opportunity costs based on average land rent for central Iowa (District 5); $297/ac. • All costs and revenues based on 2013/2014 Iowa or regionally located prices. • Source data is
-
Upload
evangeline-hopkins -
Category
Documents
-
view
215 -
download
2
Transcript of Annualized net return for various PEWI land use options and practices The following slides provides...
Annualized net return for various PEWI land use options and practices
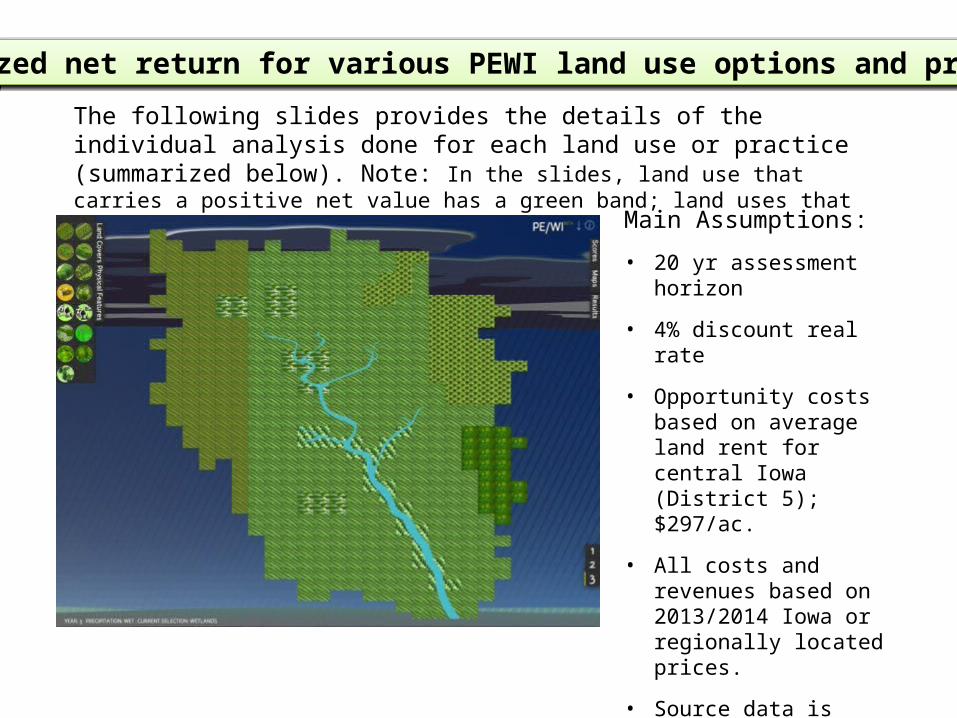
The following slides provides the details of the individual analysis done for each land use or practice (summarized below). Note: In the slides, land use that carries a positive net value has a green band; land uses that carries a net cost cost have red bands.
Main Assumptions:
• 20 yr assessment horizon
• 4% discount real rate
• Opportunity costs based on average land rent for central Iowa (District 5); $297/ac.
• All costs and revenues based on 2013/2014 Iowa or regionally located prices.
• Source data is presented.
• Yield expectations for crops, timber, and biomass are for Central Iowa.

Multi-species Riparian BUFFER COSTS
Quant Unit
Unit Cost
Total Dollar
Value of Costs
Timing (yr; a=annual)
Present Dollar
Value of Costs
Annualized Dollar Value
of CostsCOST DESCRIPTIONGRASS SEEDING & MAINTENANCE Disking Crop Land 1.00 AC $10.00 $10 0 $10 $1 Harrowing 1.00 AC $3.85 $4 0 $4 $0 Burning 1.00 AC $0.35 $0 3 $0 $0 Seed Cost (From Plant Schedule) 1.00 Total $25.67 $26 0 $26 $2 Airflow Spreader 1.00 AC $4.50 $5 0 $5 $0 fertilizer 1.00 AC $13.47 $13 0 $13 $1 Lime 1.00 AC $34.50 $35 0 $35 $3 Mowing 1.00 AC $6.80 $7 a $92 $7 TREE-SHRUB PLANTING & MAINTENANCE Mechanical Site Preparation 1.00 AC $10.00 $10 0 $10 $1 Direct Seeding AC $0 $0 $0 Shrub Cost (From Plant Schedule) Total $234.15 $234 0 $234 $17 Tree Cost (From Plant Schedule) Total $494.68 $495 0 $495 $36 Tree/Shrub Hand Planting Cost 0 Per Plant $2.00 $0 0 $0 $0 Mechanical Tree/Shrub Planting Cost 905 Per Plant $2.00 $1,810 $1,810 $133 Chemical Weed Control 905 Per Plant $0.12 $109 1 $104 $8 Mechanical Weed Control 100 Per Plant $0.06 $6 1 $6 $0 Fabric Mulch Per Plant $2.22 $0 $0 $0 Land Rent @ $256/acre 1.00 $256.00 $256 a $3,479 $256
Totals @4% $6,323 $465/ac
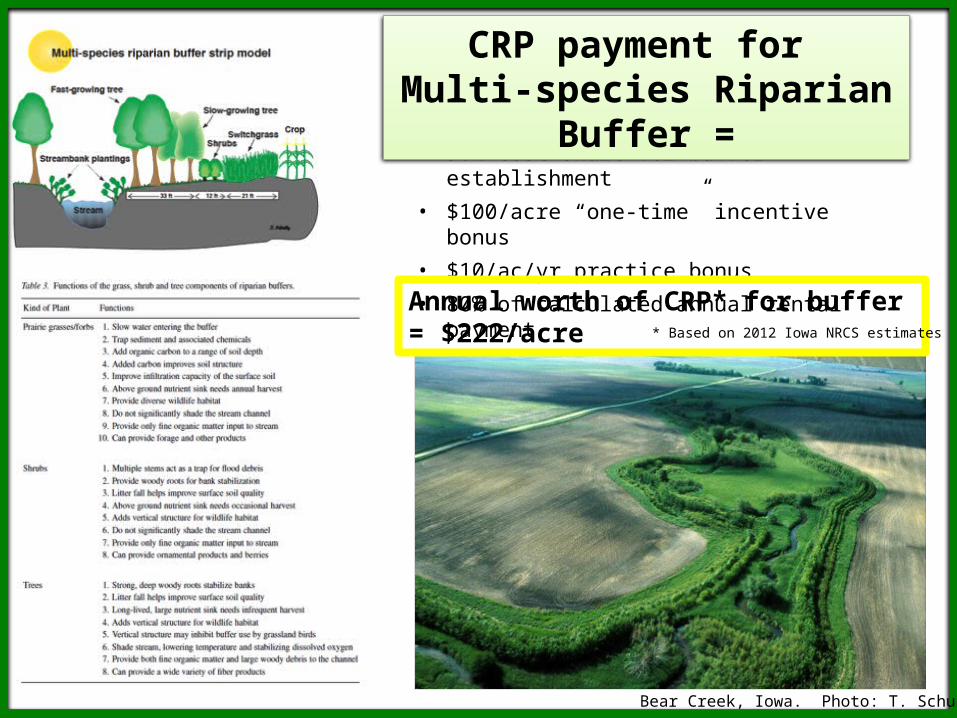
• 90% cost-share for buffer establishment• $100/acre “one-time” incentive bonus• $10/ac/yr practice bonus• 80% of calculated annual rental payment
CRP payment for Multi-species Riparian Buffer =
Bear Creek, Iowa. Photo: T. Schultz
Annual worth of CRP* for buffer = $222/acre* Based on 2012 Iowa NRCS estimates

Broad assumptions:• Uniform yields @ 6
tons per acre• Static input &
biomass prices @ $90/ton
Oak Ridge National lab, 2002
Activities/materials Year(s) Occurring Present Value ($/acre)Establishment Costs (buy seed and plant) 1 $65.54Fertilization Annual $1,334.20Weed Control Annual $129.61Harvesting 2 - 20 $832.16Land Rent (opportunity cost) Annual $3,165.40Total Present Value Costs/acre $5,526.91
Revenue Source Year(s) Occurring Present Value ($/acre)Switchgrass Biomass 2 - 20 $6,189.59Total Present Value Revenues/acre $6,189.59
@ 5% Net Present Value/acre $662.68
Annualized Value/acre $53.18
20-year Switchgrass Management Plan
Analysis adapted from: Duffy 2008. www.extension.iastate.edu/agdm/crops/html/a1-22.html
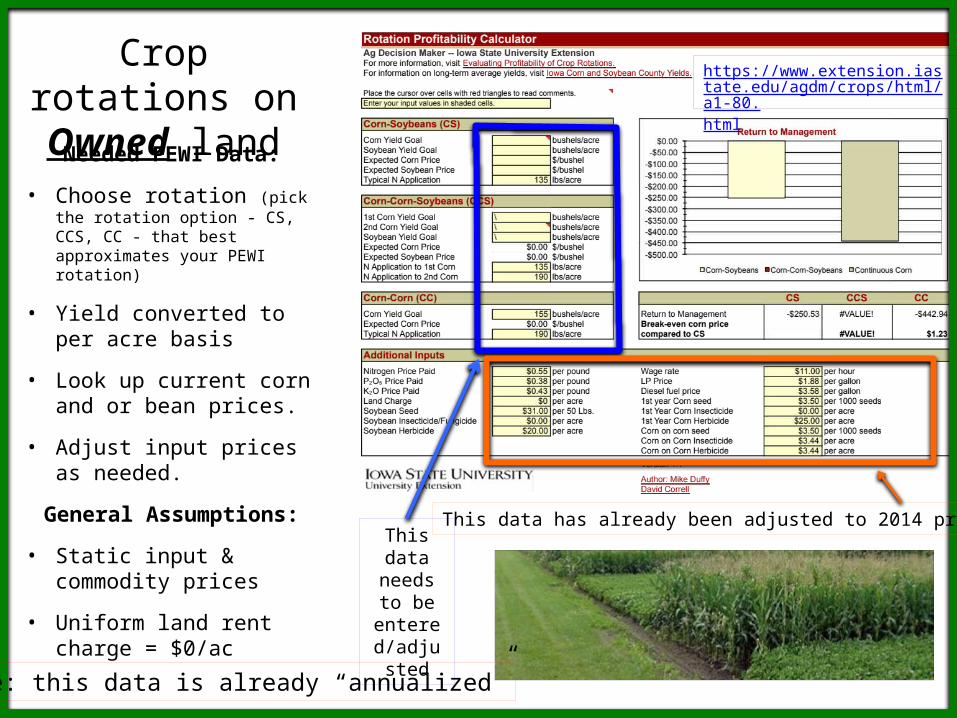
Crop rotations on Owned land
https://www.extension.iastate.edu/agdm/crops/html/a1-80.html
This data needs to
be entered/a
djusted
Needed PEWI Data:
• Choose rotation (pick the rotation option - CS, CCS, CC - that best approximates your PEWI rotation)
• Yield converted to per acre basis
• Look up current corn and or bean prices.
• Adjust input prices as needed.
General Assumptions:
• Static input & commodity prices
• Uniform land rent charge = $0/ac
This data has already been adjusted to 2014 prices
Note: this data is already “annualized”

Crop rotations on Rented land
https://www.extension.iastate.edu/agdm/crops/html/a1-80.html
Needed PEWI Data:
• Choose rotation (pick the rotation option - CS, CCS, CC - that best approximates your PEWI rotation)
• Yield converted to per acre basis
• Look up current corn and or bean prices.
• Adjust input prices as needed.
General Assumptions:
• Static input & commodity prices
• Uniform land rent charge = $297/ac
This data needs to
be entered/a
djusted
This data has already been adjusted to 2014 prices
Note: this data is already “annualized”
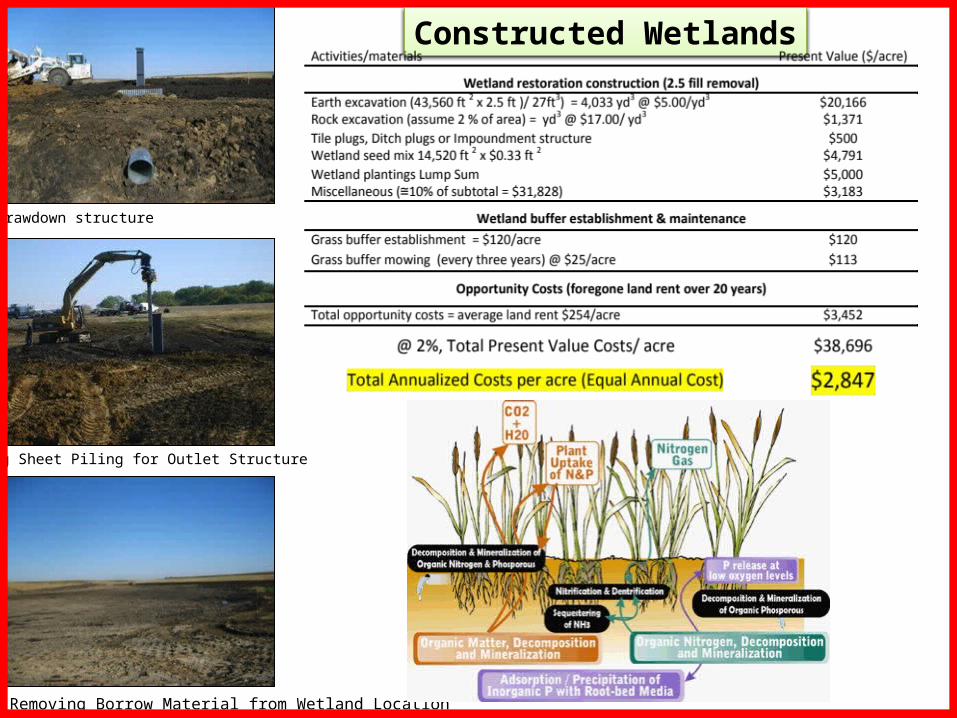
Removing Borrow Material from Wetland Location
Driving Sheet Piling for Outlet Structure
Drawdown structure
Constructed Wetlands

Woody systems contribute to a whole host of potential societal benefits in the form of ecosystem services. For example woody systems:
• Can provide critical habitat and/or travel corridors for a diverse array of species], even in highly managed plantations;
• Can help stabilize soils and maintain soil quality and;• Efficiently cycle water and nutrients and;• Create long-term, below-ground reservoirs for carbon sequestration
(in both natural or plantation systems);• May be ideal for restoring highly degraded lands and for
bioremediation treatments and.
Cost Activities/materials Year(s) Occurring
Present Value ($/acre)
Establishment Costs (buy stock & plant) 1 $306.00Maintenance Costs (mow and spray) 1 - 3 $177.01Harvest and Chip 10 $2,332.87Thin Between Rows 11 $57.30Thin Between Rows 13 $31.18Harvest and Chip 20 $1,432.18Land Rent (opportunity cost) Annual $3,165.40Total Present Value Costs/acre $7,501.94
Revenue Source Year(s) Occurring
Present Value ($/acre)
Woody Biomass * 10 $5,525.22Woody Biomass * 11 $128.92Woody Biomass * 13 $70.16Woody Biomass * 20 $3,392.01Total Present Value Revenues/acre $9,116.31
@ 4% Net Present Value/acre $1,614.37
Annualized Value/acre $129.54
Short-rotation Woody Crop System
(SRWC) – Hybrid Poplars
* Hybrid poplar yield data: R. Hall, Pers. Comm. 2012
20-year Plantation Management Plan

Conventional Forest
Analysis Assumptions: • Stumpage rates for W. Oak/R. Oak = $360/$260 MBF; clearcut
silvicullture; Rotation age = 65 years;
• Biomass sales at $20/ton (tops/bark of merchantable species; all non-merchantable trees)
• Final stumpage value per acre at rotation age = $1,800 per acre
• Additional $200/acre/year in hunting lease fees.
• Harvest & biomass on-site processing costs $150/acre; $5/ac/year overhead charge.
Managed hardwood forests can:
• Habitat & corridors for diversity of game/non-game species.
• Can help stabilize soils and maintain soil quality;
• Efficiently cycle water and nutrients;
• Create long-term, below-ground reservoirs for carbon sequestration
Equal Annual Income = $320/acre• Hunting only $195/ acre
55%
14%
10%
9%
5%
4% 2%2%2%
White oakRed oakShagbark hickoryAmerican ElmAmerican basswoodHackberryCottonwoodBlack walnutother
Scenario Data: Species Distribution, Basal Area per acre
Timber data used for analysis from Amana Colonies, 2001 –
Compartment 10 Upper Amana. Inventory conducted
by ISU Forestry students (Amana is Iowa’s largest
industrial forestland owner)
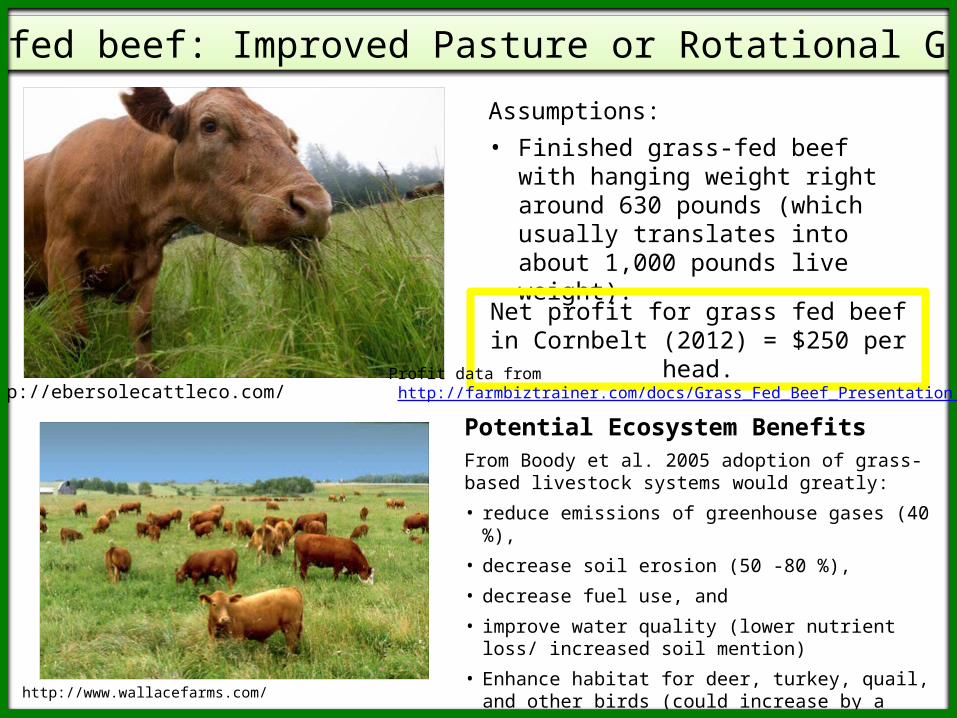
Assumptions: • Finished grass-fed beef with hanging
weight right around 630 pounds (which usually translates into about 1,000 pounds live weight).
http://www.wallacefarms.com/
http://ebersolecattleco.com/
Net profit for grass fed beef in Cornbelt (2012) = $250 per head.
Grass-fed beef: Improved Pasture or Rotational Grazing
Potential Ecosystem BenefitsFrom Boody et al. 2005 adoption of grass-based livestock systems would greatly:
• reduce emissions of greenhouse gases (40 %),
• decrease soil erosion (50 -80 %),
• decrease fuel use, and
• improve water quality (lower nutrient loss/ increased soil mention)
• Enhance habitat for deer, turkey, quail, and other birds (could increase by a factor of five).
Profit data from http://farmbiztrainer.com/docs/Grass_Fed_Beef_Presentation.ppt.
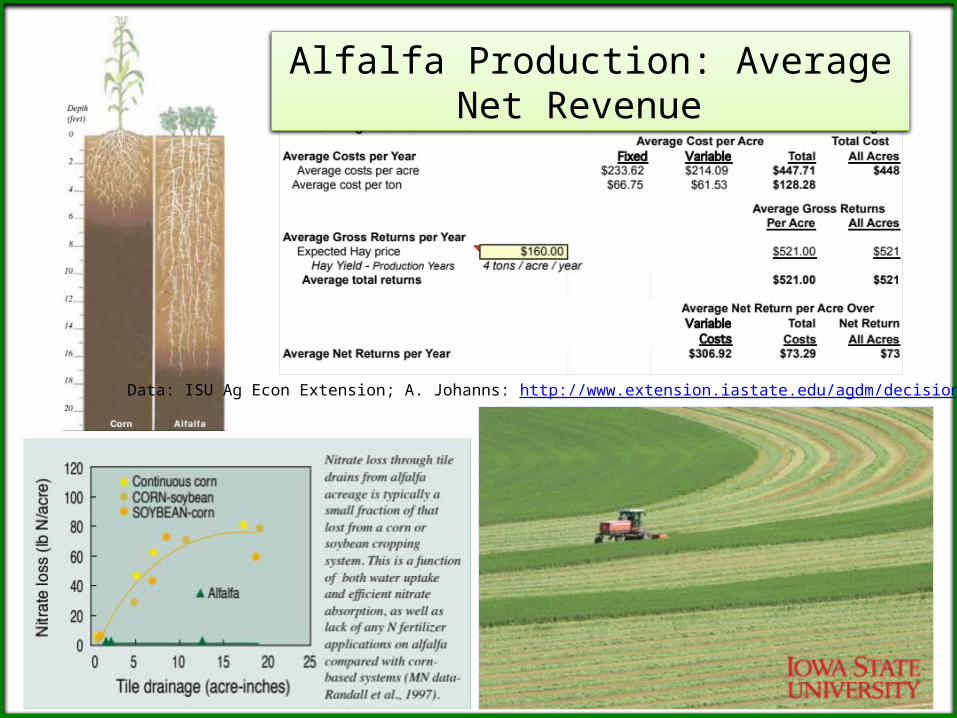
Alfalfa Production: Average Net Revenue
Data: ISU Ag Econ Extension; A. Johanns: http://www.extension.iastate.edu/agdm/decisionaidsall.html
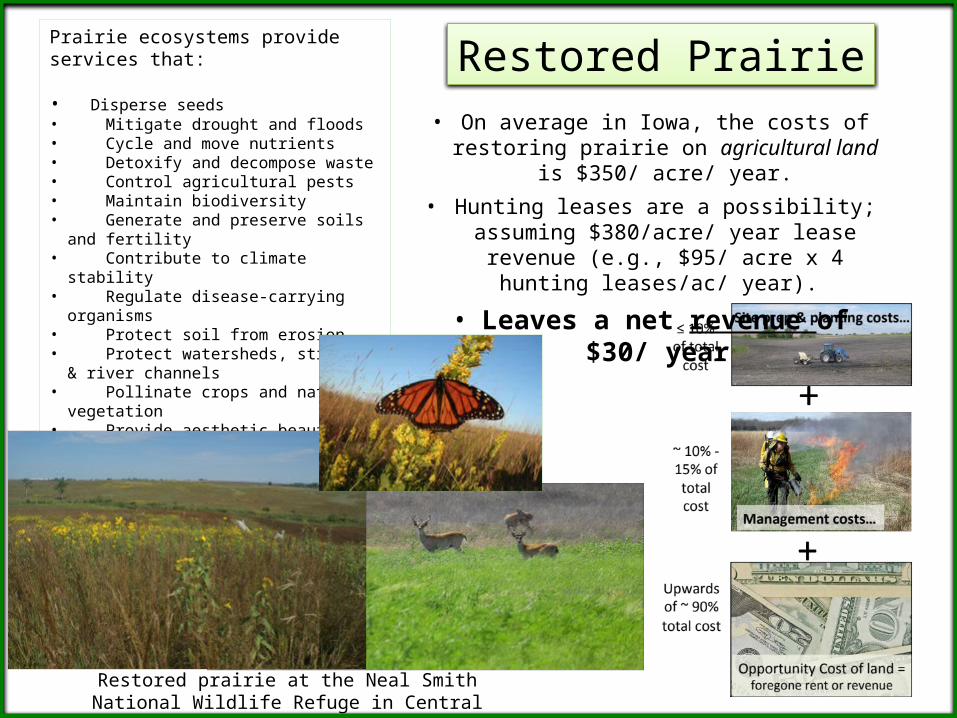
Restored prairie at the Neal Smith National Wildlife Refuge in Central Iowa
Restored PrairiePrairie ecosystems provide services that:
• Disperse seeds• Mitigate drought and floods• Cycle and move nutrients• Detoxify and decompose waste• Control agricultural pests• Maintain biodiversity• Generate and preserve soils and fertility• Contribute to climate stability• Regulate disease-carrying organisms• Protect soil from erosion• Protect watersheds, streams & river channels• Pollinate crops and natural vegetation• Provide aesthetic beauty• Provide wildlife habitat• Provide wetlands, playas• Provide recreation• Provide research opportunities
• On average in Iowa, the costs of restoring prairie on agricultural land is $350/ acre/ year.
• Hunting leases are a possibility; assuming $380/acre/ year lease revenue (e.g., $95/ acre x 4
hunting leases/ac/ year).
• Leaves a net revenue of $30/ year

Net costs of conservation Corn or Beans
Total net costs* for conservation crop ground =
$24/ac/year
* Does not factor any potential yield increase or decrease
Selecting conservation corn or beans assumes that the fields involve the following Best Management Practices:
Data sources: http://www.ipm.iastate.edu/ipm/icm/2000/10-23-2000/notillsteady.html; Kling, C., Rabotyagov, S., Jha, M., Feng, H., Parcel, J., Gassman, P., & Campbell, T. (2007). Conservation practices in Iowa: historical investments, water quality, and gaps. A report to the Iowa farm bureau and partners. Final report. Iowa State University Center for Agricultural and Rural Development, Ames, IA .
No-till cultivation
Cover crops (cereal rye)
Grass waterways
Cost and or savings associated with this suite of BMPs:
• On average in Central Iowa, about .05% of a field could use a grass waterway = $15/ac/year
• Cover crops, aerial seeded = $34/ac/year
• No -till leads to a total savings = $25/ac/year (mostly from using less diesel, labor and depreciation)


