Capitec Bank Case Study: Developing a Companywide Progress of Online Learning

Statement of responsibility by the board of directors Page 100Certificate by the company secretary Page 100Audit committee report Page 101
Directors’ report Page 102
Independent auditor’s report Page 104
Balance sheets Page 105
Income statements Page 106
Statements of comprehensive income Page 107Statements of changes in equity Page 108Statements of cash flows Page 110
Notes to the annual financial statements Page 111
transparency
11Annualfinancialstatements
98 Capitec Bank Holdings Limited

Statement of responsibility by the board of directors Page 100Certificate by the company secretary Page 100Audit committee report Page 101
Directors’ report Page 102
Independent auditor’s report Page 104
Balance sheets Page 105
Income statements Page 106
Statements of comprehensive income Page 107Statements of changes in equity Page 108Statements of cash flows Page 110
Notes to the annual financial statements Page 111
transparency
Integrated Report 2013 99
The preparation of the audited consolidated annual financial
statements was supervised by the chief financial officer, André du Plessis, CA(SA)

100 Capitec Bank Holdings Limited
The directors are responsible for the preparation, integrity and fair presentation of the consolidated and separate annual financial statements of Capitec Bank Holdings Limited. The annual financial statements, comprising the balance sheet at 28 February 2013, and the income statement and statements of comprehensive income, changes in equity and cash flows for the year then ended, and the notes to the financial statements which include a summary of significant accounting policies and other explanatory notes, have been prepared in accordance with International Financial Reporting Standards (IFRS) and the Companies Act of South Africa, and include amounts based on judgements and estimates made by management.
The directors consider that the most appro-priate accounting policies, consistently applied and supported by reasonable and prudent judgements and estimates have been used in the preparation of the annual financial statements and that all statements of IFRS that are considered applicable have been applied. The directors are satisfied that the information contained in the annual financial statements fairly presents the results of operations for the year and the financial position of the group and company at year-end. The directors also prepared the directors’ report and the other information included in the annual report and are responsible for both its accuracy and consistency with the annual financial statements.
The directors’ responsibility includes main-taining adequate accounting records. The accounting records should disclose, with reasonable accuracy, the financial position of the companies to enable the directors to
ensure that the financial statements comply with relevant legislation.
Capitec Bank Holdings Limited operated in a well-established control environ-ment, which is documented and regularly reviewed. The control environment incorpo-rates risk management and internal control procedures, which are designed to provide reasonable, but not absolute, assurance that assets are safeguarded and that the risks facing the business are controlled.
The annual financial statements were pre-pared on a going concern basis. Based on their assessment the directors have no reason to believe that the group or any company in the group will not continue as a going concern in the foreseeable future. The viability of the group is supported by the annual financial statements.
The group adhered to the Code of Corpo-rate Practices and Conduct.
The group’s external auditors, Pricewater-houseCoopers Incorporated, audited the financial statements and their report is pre-sented on page 104.
The annual financial statements set out on pages 100 to 165 were approved by the board of directors and signed on its behalf on 26 March 2013 by:
Michiel le Roux Chairman
Riaan StassenChief executive officer
Statement of responsibilityby the board of directors
Capitec Bank Holdings Limited and its subsidiaries (the ‘group’)
Certificate by the company secretary
I hereby confirm, in my capacity as com-pany secretary of Capitec Bank Holdings Limited (‘the company’), that for the year ended 28 February 2013, the company has filed all required returns and notices in terms of the Companies Act, 2008 and that all such returns and notices are to the best of my knowledge and belief true, correct and up to date.
Christian van SchalkwykStellenbosch26 March 2013

Integrated Report 2013 101
Auditcommittee report
Capitec Bank HoldingsLimited and its subsidiaries(the ‘group’)
The Capitec Bank Holdings group audit committee (‘the committee’) is an inde-pendent statutory committee appointed by the board of directors in terms of sec-tion 64 of the Banks Act (Act 94 of 1990) and the Companies Act (Act 71 of 2008) (‘the Act’).
The committee comprises three inde-pendent non-executive directors. The committee met three times during the year with 100% attendance by members at the meetings.
The committee’s responsibilities include statutory duties in terms of the Act, as well as responsibilities assigned to it by the group’s board of directors. The committee’s terms of reference are determined by a board-approved charter and are detailed in the corporate governance review. The com-mittee conducted its affairs in compliance with, and discharged its responsibilities in terms of, its charter for the year ended 28 February 2013.
The committee performed the following statutory duties during the period under review:• Satisfied itself that the external auditor
is independent of the company, as set out in section 94(8) of the Act.
• Ensured that the appointment of the auditor complied with the Act, and any other legislation relating to the appoint-ment of auditors.
• In consultation with executive manage-ment, agreed to the engagement letter, terms, audit plan and budgeted fees for the 2013 financial year.
• Approved the terms of the master agreement for the provision of non-audit services by the external auditor, and approved the nature and extent of non-audit services that the external auditor may provide.
• Nominated for election at the annual general meeting, Pricewaterhouse-Coopers Inc. as the external audit firm and Mr DG Malan as the designated auditor responsible for performing the functions of the audit.
• Satisfied itself, based on the information and explanations supplied by manage-ment and obtained through discussions with the independent external auditor and internal auditors, that the system of internal financial controls is effective and forms a basis for the preparation of reli-able financial statements
• Reviewed the accounting policies and the group financial statements for the year ended 28 February 2013 and, based on the information provided to the committee, considers that the group complies, in all material respects, with the requirements of the Act, the JSE Listings Requirements, the King III Code and IFRS.
• Undertaken the prescribed functions (in terms of section 94(7) of the Act) on behalf of the subsidiary companies of the group.
The committee performed the following duties assigned by the board during the period under review:• Considered the sustainability informa-
tion as disclosed in the integrated report, which is the result of a combined assur-
ance model, and satisfied itself that the information is reliable and consistent with the financial results. The committee, at its meeting held on 25 March 2013, recommended the integrated report for approval by the board of directors.
• Ensured that the company’s internal audit function is independent and had the necessary resources and authority to enable it to discharge its duties. The committee recommended the internal audit charter for approval by the board and approved the annual audit plan.
• The committee met with the external auditors and with the head of the inter-nal audit function without management being present.
• The committee satisfied itself that the group financial director has appropriate expertise and experience as required by the JSE Listings Requirement 3.84(h).
Pieter van der MerweChairman26 March 2013

102 Capitec Bank Holdings Limited
The directors present their annual report to shareholders for the year ended 28 February 2013.
Nature of the businessCapitec Bank Holdings Limited (‘Capitec’ or ‘the company’) was incorporated in South Africa on 23 November 1999 and registered as a bank controlling company, as envisaged by the Banks Act 1990, on 29 June 2001. Capitec was listed in the Banks sector of the JSE Limited on 18 February 2002.
The company holds 100% of its principal subsidiary, Capitec Bank Limited (‘Capitec Bank’). Capitec Bank is a leading South African retail bank which focuses on essential banking services and provides innovative savings, transacting and unse-cured lending products to individuals.
Review of operationsThe operating results and the state of affairs of the company and the group are fully disclosed in the annual financial statements and commentary is provided in the Chief financial officer’s report, which is included in the integrated report.
Share capitalA total of 15 159 519 ordinary shares were issued during the year ended 28 February 2013 bringing the number of shares in issue to 114 441 719. Included in the shares issued are 14 050 848 related to a successful rights offer that was final-ised in November 2012. Renounceable rights were offered to shareholders at a subscription price of R160.00 per rights offer share, in the ratio of 7 rights offer shares for every 50 Capitec shares held.
The remainder of the shares were issued pursuant to the settlement of share options in terms of the share incentive scheme, which is detailed in the notes to the annual financial statements.
No shares were repurchased during the year and no preference shares were issued.
Dividends to shareholdersThe company declared the following dividends for the year under review and the previous year:
2013 2012Ordinary dividend (cents per share)
Interim 169 125
Final 405 300
Preference dividend (cents per share)
Interim 373.16 340.27
Final 463.49 336.58
The final ordinary dividend for 2013 was approved by the directors on 25 March 2013. In terms of the require-ments of IFRS, no accrual was made for this dividend.
Directors’report
Year ended 28 February 2013

Integrated Report 2013 103
Subsidiaries and associatesInformation relating to the company’s financial interest in its subsidiaries and associates is presented in the notes to the annual financial statements.
Capitec disposed a 47% holding in Key Distributors (Pty) Limited (‘Key’) on 31 January 2013 at net asset value and subsequently held 28% of Key. As of the effective date of the transaction, Key is disclosed and accounted for as an associate in the group annual financial statements in terms of IFRS.
Directors and company secretaryInformation relating to the directors and company secretary are included in section 9 of the integrated report.
The board of directors changed as follows during the year ended 28 February 2013:• Mr JD McKenzie was appointed to the
board of Capitec on 1 March 2012.• Mr MJ Jooste resigned from the board
of Capitec on 2 August 2012.• Mr G Pretorius was appointed to the
board of Capitec on 19 November 2012.• Prof MC Mehl passed away on
30 January 2013. Prof Mehl was a respected businessman and academic and had been on the board of Capitec since 2001. He made a meaningful contribution as a director and will be dearly missed.
The directors’ interest in share capital and contracts, and directors’ remuneration are disclosed in the notes to the annual financial statements.
Material events after balance sheet dateThe directors are not aware of any event which is material to the financial position of the company or the group that has occurred between the balance sheet date and the date of approval of the financial statements.

104 Capitec Bank Holdings Limited
Independent auditor’sreport
To the shareholders of Capitec Bank Holdings Limited
We have audited the consolidated and separate financial statements of Capitec Bank Holdings Limited set out on pages 105 to 165, which comprise the balance sheets as at 28 February 2013, and the income statements, statements of comprehensive income, statements of changes in equity and statements of cash flows for the year then ended, and the notes, comprising a summary of significant accounting policies and other explanatory information.
Directors’ responsibility for the financial statementsThe company’s directors are responsible for the preparation and fair presentation of these consolidated and separate financial statements in accordance with Interna-tional Financial Reporting Standards and the requirements of the Companies Act of South Africa, and for such internal control as the directors determine is necessary to enable the preparation of consolidated and separate financial statements that are free from material misstatements, whether due to fraud or error.
Auditor’s responsibilityOur responsibility is to express an opinion on these consolidated and separate finan-cial statements based on our audit. We conducted our audit in accordance with International Standards on Auditing. Those standards require that we comply with ethi-cal requirements and plan and perform the audit to obtain reasonable assurance about whether the consolidated and separate
financial statements are free from mate-rial misstatement.
An audit involves performing procedures to obtain audit evidence about the amounts and disclosures in the financial statements. The procedures selected depend on the auditor’s judgement, including the assessment of the risks of material misstatement of the financial statements, whether due to fraud or error. In making those risk assessments, the auditor considers internal control relevant to the entity’s preparation and fair presentation of the financial statements in order to design audit procedures that are appropriate in the circumstances, but not for the purpose of expressing an opinion on the effectiveness of the entity’s internal control. An audit also includes evaluating the appropriateness of accounting policies used and the reasonableness of accounting estimates made by management , as well as evaluating the overall presentation of the financial statements.
We believe that the audit evidence we have obtained is sufficient and appropriate to provide a basis for our audit opinion.
OpinionIn our opinion, the consolidated and separate financial statements present fairly, in all material respects, the conso-lidated and separate financial position of Capitec Bank Holdings Limited as at 28 February 2013, and its consolidated and separate financial performance and
its consolidated and separate cash flows for the year then ended in accordance with International Financial Reporting Standards and the requirements of the Companies Act of South Africa.
Other reports required by the Companies ActAs part of our audit of the consolidated and separate financial statements for the year ended 28 February 2013, we have read the directors’ report, the audit committee’s report and the company secretary’s certifi-cate for the purpose of identifying whether there are material inconsistencies between these reports and the audited consoli-dated and separate financial statements. These reports are the responsibility of the respective preparers. Based on reading these reports we have not identified mate-rial inconsistencies between these reports and the audited consolidated and separate financial statements. However, we have not audited these reports and accordingly do not express an opinion on these reports.
PricewaterhouseCoopers Inc.Director: DG MalanRegistered AuditorCape Town 26 March 2013

Integrated Report 2013 105
GROUP COMPANY
R’000 Notes 2013 2012 2013 2012Assets
Cash, cash equivalents and money market funds 5 7 143 092 4 551 203 7 18
Investments designated at fair value 6 2 022 906 1 198 833 – –
Loans and advances to clients 7 27 934 854 16 863 028 2 267 –
Inventory 8 – 42 079 – –
Other receivables 9 140 818 57 745 10 242 9 657
Current income tax assets – 62 331 – –
Interest in subsidiaries 10 – – 5 609 133 3 203 661
Interest in associates 10 167 – – –
Property and equipment 11 697 512 543 121 – –
Intangible assets 12 136 380 69 262 – –
Deferred income tax assets 13 270 995 234 242 – –
Total assets 38 346 724 23 621 844 5 621 649 3 213 336
Liabilities
Loans and deposits at amortised cost 14 29 000 191 17 692 062 – –
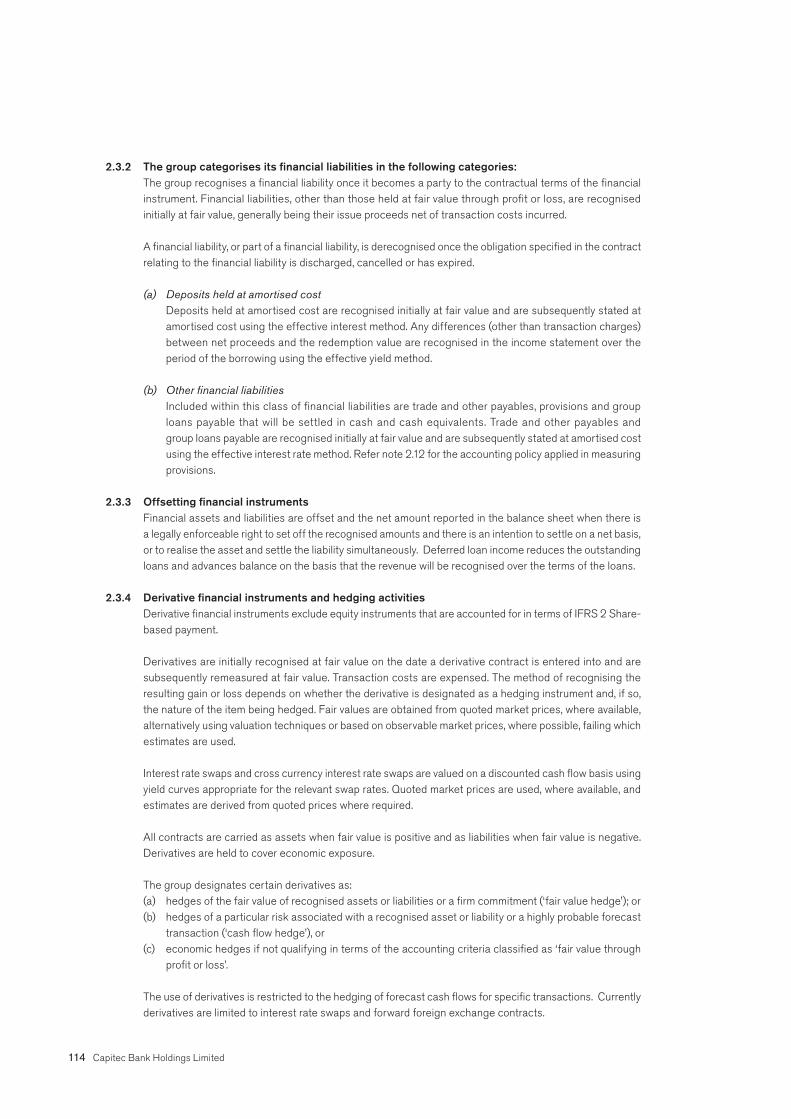
Other liabilities 15 759 083 718 549 11 295 10 303
Current income tax liabilities 46 007 885 – –
Provisions 16 28 449 24 998 – –
Total liabilities 29 833 730 18 436 494 11 295 10 303
Equity
Capital and reserves
Ordinary share capital and premium 17 5 330 710 2 926 435 5 330 710 2 926 435
Cash flow hedge reserve 18 (15 925) (1 920) – –
Retained earnings 2 939 240 2 001 866 20 675 17 629
Share capital and reserves attributable to ordinary
shareholders 8 254 025 4 926 381 5 351 385 2 944 064
Non-redeemable, non-cumulative, non-participating
preference share capital and premium 17 258 969 258 969 258 969 258 969
Total equity 8 512 994 5 185 350 5 610 354 3 203 033
Total equity and liabilities 38 346 724 23 621 844 5 621 649 3 213 336
Balancesheets
As at 28 February 2013

106 Capitec Bank Holdings Limited
GROUP COMPANY
R’000 Notes 2013 2012 2013 2012Interest income 19 7 084 752 4 346 902 – –
Interest expense 19 (1 662 513) (1 022 374) – –
Net interest income 5 422 239 3 324 528 – –
Loan fee income 1 496 009 1 657 018 – –
Loan fee expense (343 209) (186 360) – –
Transaction fee income 2 100 594 1 360 308 – –
Transaction fee expense (751 768) (524 202) – –
Net fee income 2 501 626 2 306 764 – –
Dividend income 20 9 1 532 488 243 337 358
Net impairment charge on loans and advances to clients 21 (2 658 923) (1 604 190) – –
Net movement in financial instruments held at fair value
through profit or loss 22 (298) 12 070 – –
Other income 204 679 4 051 932
Sales 248 358 217 145 – –
Cost of sales (219 480) (191 996) – –
Non-banking income 28 878 25 149 – –
Income from operations 5 293 735 4 066 532 492 294 338 290
Banking operating expenses (2 994 008) (2 486 318) (730) (932)
Non-banking operating expenses (22 451) (22 342) – –
Operating profit before tax 23 2 277 276 1 557 872 491 564 337 358
Shareofprofitofassociates 10 167 – – –
Income tax expense 24 (672 862) (463 532) (275) –
Profit for the year 1 604 581 1 094 340 491 289 337 358
Earnings per share (cents)
Basic 25 1 519 1 122
Diluted 25 1 498 1 096
Incomestatements
Year ended 28 February 2013

Integrated Report 2013 107
GROUP COMPANY
R’000 Notes 2013 2012 2013 2012Profit for the year 1 604 581 1 094 340 491 289 337 358
Cash flow hedge recognised during the year 18 (33 430) (4 916) – –
Cash flow hedge reclassified to profit and loss for the year 18 14 080 7 067 – –
Cash flow hedge before tax (19 350) 2 151 – –
Income tax relating to cash flow hedge 18 5 345 (602) – –
Other comprehensive income that will be reclassified
to profit or loss for the year net of tax 18 (14 005) 1 549 – –
Total comprehensive income for the year 1 590 576 1 095 889 491 289 337 358
Statements of comprehensive income
Year ended 28 February 2013

108 Capitec Bank Holdings Limited
GROUP (R’000) Notes
Ordinary share
capital and premium
Preference share
capital and premium
Cash flow hedge
reserveRetained earnings Total
Balance at 28 February 2011 1 918 677 258 969 (3 469) 1 276 336 3 450 513
Total comprehensive income for the year – – 1 549 1 094 340 1 095 889
Ordinary dividend – – – (317 939) (317 939)
Preference dividend – – – (19 419) (19 419)
Employee share option scheme: Value of
employee services – – – 11 778 11 778
Shares issued and acquired for employee
share options at cost 34 220 505 – – (221 207) (702)
Proceeds on settlement of employee
share options 34 – – – 35 091 35 091
Tax effect on share options – – – 142 886 142 886
Shares issued 798 932 – – – 798 932
Share issue expenses (11 679) – – – (11 679)
Balance at 29 February 2012 2 926 435 258 969 (1 920) 2 001 866 5 185 350
Total comprehensive income for the year – – (14 005) 1 604 581 1 590 576
Ordinary dividend – – – (467 460) (467 460)
Preference dividend – – – (20 783) (20 783)
Employee share option scheme: Value of
employee services – – – 9 037 9 037
Shares issued and acquired for employee
share options at cost 34 244 422 – – (244 422) –
Proceeds on settlement of employee
share options 34 – – – 37 850 37 850
Tax effect on share options – – – 18 571 18 571
Shares issued 2 247 493 – – – 2 247 493
Share issue expenses (87 640) – – – (87 640)
Balance at 28 February 2013 5 330 710 258 969 (15 925) 2 939 240 8 512 994
Notes 17 17 18
Statements of changes in equity
Year ended 28 February 2013

Integrated Report 2013 109
COMPANY (R’000)
Ordinary share
capital and premium
Preference share
capital and premium
Retained earnings Total
Balance at 28 February 2011 1 918 677 258 969 17 629 2 195 275
Total comprehensive income for the year – – 337 358 337 358
Ordinary dividend – – (317 939) (317 939)
Preference dividend – – (19 419) (19 419)
Shares issued 1 019 437 – – 1 019 437
Share issue expenses (11 679) – – (11 679)
Balance at 29 February 2012 2 926 435 258 969 17 629 3 203 033
Total comprehensive income for the year – – 491 289 491 289
Ordinary dividend – – (467 460) (467 460)
Preference dividend – – (20 783) (20 783)
Shares issued 2 491 915 – – 2 491 915
Share issue expenses (87 640) – – (87 640)
Balance at 28 February 2013 5 330 710 258 969 20 675 5 610 354
Notes 17 17
Statements of changes in equity (continued)
Year ended 28 February 2013

110 Capitec Bank Holdings Limited
Statementsofcash flows
Year ended 28 February 2013
GROUP COMPANY
R’000 Notes 2013 2012 2013 2012Cash flow from operating activities
Cash flow from operations 31 2 752 408 2 406 380 488 717 337 038
Income taxes paid 32 (578 246) (603 066) (275) –
2 174 162 1 803 314 488 442 337 038
Cash flow from investing activities
Purchase of property and equipment 11 (354 706) (315 366) – –
Proceeds from disposal of property and equipment 4 565 1 236 – –
Purchase of intangible assets 12 (118 207) (65 873) – –
Investment in subsidiaries/associates – – (2 405 472) (1 007 221)
Acquisition of investments at fair value through profit or loss
and money market unit trusts (2 726 262) (1 542 428) – –
Disposal of investments at fair value through profit or loss and
money market unit trusts 1 199 399 1 344 330 – –
(1 995 211) (578 101) (2 405 472) (1 007 221)
Cash flow from financing activities
Dividends paid 33 (487 257) (337 570) (487 257) (337 570)
Ordinary shares issued 17 2 404 275 1 007 758 2 404 276 1 007 758
Realised loss on settlement of employee share options less
participants’ contributions 34 (206 572) (186 116) – –
1 710 446 484 072 1 917 019 670 188
Net increase in cash and cash equivalents 1 889 397 1 709 285 (11) 5
Cash and cash equivalents at the beginning of the year 4 551 203 2 841 918 18 13
Cash and cash equivalents at the end of the year 5 6 440 600 4 551 203 7 18

Integrated Report 2013 111
Notes to the annual financial statements
Year ended 28 February 2013
1. General information1.1 Nature of business The company’s main business is that of a bank controlling company as envisaged in the Banks Act, 1990. The
company’s subsidiaries conduct retail banking.
1.2 Review of operations The operating results and the state of affairs of the company and the group are fully set out in the attached balance
sheets, income statements, statements of comprehensive income, statements of changes in equity, statements of cash flows and the notes thereto.
The group’s earnings attributable to shareholders amounted to R1 604.6 million (2012: R1 094.3 million).
1.3 Directors and secretary Information relating to the directors and secretary of the company is in section 8 of the integrated report.
1.4 Group details The group’s place of domicile and country of incorporation is the Republic of South Africa and it has a primary listing
on the JSE Limited.
Registered office: 1 Quantum Street, Techno Park, Stellenbosch, 7600
2. Accounting policiesThe principal accounting policies applied in the preparation of these consolidated financial statements are set out below. These policies have been consistently applied to all the years presented, unless otherwise stated. Accounting policies have been consistently applied through subsidiaries in the group.
Basis of preparationThe group’s consolidated financial statements have been prepared in accordance with International Financial Report-ing Standards (IFRS). The consolidated financial statements have been prepared under the historical cost convention, as modified by the revaluation of financial instruments held at fair value through profit or loss.
The preparation of financial statements in conformity with IFRS requires the use of certain critical account-ing estimates. It also requires management to exercise its judgement in the process of applying the group’s accounting policies. The areas involving a higher degree of judgement or complexity, or areas where assumptions and estimates are significant to the consolidated financial statements are disclosed in note 3.
2.1 Basis of consolidationThe consolidated financial statements include those of the company, all its subsidiaries and associates, the share incentive trust and the employee empowerment trust.
Subsidiaries are all entities (including special-purpose entities) over which the group has the power to govern the financial and operating policies generally accompanying a shareholding of more than one half of the voting rights. The existence and effect of potential voting rights that are currently exercisable or convertible are considered when

112 Capitec Bank Holdings Limited
assessing whether the group controls another entity. Subsidiaries are fully consolidated from the date on which control is transferred to the group. They are deconsolidated from the date that control ceases.
The group applies the acquisition method to account for business combinations. The consideration transferred for the acquisition of a subsidiary is the fair value of the assets transferred, the liabilities incurred to the former owners of the acquiree and the equity interests issued by the group. The consideration transferred includes the fair value of any asset or liability resulting from a contingent consideration arrangement. Identifiable assets acquired and liabilities and contingent liabilities assumed in a business combination are measured initially at their fair values at the acquisi-tion date. The group recognises any non-controlling interest in the acquiree on the acquisition-by-acquisition basis, either at fair value or at the non-controlling interest’s proportionate share of the recognised amounts of acquiree’s identifiable net assets.
Acquisition costs are expensed as incurred.
Goodwill is initially measured as the excess of the aggregate of the consideration transferred and the fair value of non-controlling interest over the net identifiable assets acquired and liabilities assumed. If this consideration is lower than the fair value of the net assets of the subsidiary acquired, the difference is recognised in profit or loss.
Intercompany transactions, balances and unrealised gains on transactions between group companies are eliminated.
Investments in subsidiaries are accounted for at cost less allowance for impairment. The carrying amounts of these investments are reviewed annually and written down for impairment where considered necessary.
When the group ceases to have control of a subsidiary any retained interest in the entity is remeasured to its fair value at the date when control is lost, with the change in carrying amount recognised in profit or loss. The fair value is the initial carrying amount for the purpose of subsequently accounting for the retained interest as an associate, joint venture or financial asset.
Associates are all entities over which the group has significant influence but not control, generally accompanying a shareholding of between 20% and 50% of the voting rights. Investments in associates are accounted for using the equity method of accounting. Under the equity method, the investment is initially recognised at cost, and the carrying amount is increased or decreased to recognise the investor’s share of the profit or loss of the investee after the date of acquisition. The group’s investment in associates includes goodwill identified on acquisition.
The group determines at each reporting date whether there is objective evidence that the investment in the associ-ate is impaired. If this is the case, the difference between the recoverable amount of the associate and its carrying value is recognised in the income statement.
Profits and losses resulting from transactions between the group and its associates are recognised in the group’s financial statements only to the extent of unrelated investor’s interests in the associates.
Transactions and non-controlling interests
The group treats transactions with non-controlling interests as transactions with equity owners of the group. For purchases from non-controlling interests, the difference between any consideration paid and the relevant share of the carrying value of the net assets of the subsidiary acquired, is recorded in equity. Gains or losses on disposals to non-controlling interests are also recorded in equity.
2.2 Cash and cash equivalentsCash and cash equivalents comprise balances with less than three months’ maturity from the date of acquisition, including: cash, balances with central banks, treasury bills and other eligible bills, amounts due from banks and short-term government securities. Cash and cash equivalents are stated at cost which approximates fair value due to the short-term nature of these instruments.

Integrated Report 2013 113
2.3 Financial instrumentsThe group recognises financial assets on the balance sheet once it becomes a party to the contractual terms of the particular financial instrument.
Financial assets are derecognised when the rights to receive cash flows from the financial assets have expired or where the group has transferred substantially all risks and rewards of ownership.
Management determines the categorisation of its financial instruments at initial recognition.
2.3.1 The group categorises its financial assets in the following categories: (a) Financial assets at fair value through profit or loss
This category has two subclasses: financial assets held for trading, and those designated at fair value through profit or loss at inception. A financial asset is categorised as held for trading if acquired principally for the purpose of selling in the short term or if so designated by management. Derivatives are categorised as held for trading unless they are designated as hedges.
Purchases and sales of financial assets at fair value through profit or loss are recognised on trade date, being the date on which the group commits to purchase or sell the asset.
Gains and losses on financial assets at fair value through profit or loss are measured as the difference between the fair values and the carrying amounts adjusted for dividend income (2.16.4), and are included in the income statement.
(b) Loans and advancesLoans and advances are non-derivative financial assets with fixed or determinable payments that are not quoted in an active market, other than:
(i) those that the entity intends to sell immediately or in the short term, which are categorised as held for trading, and those that the entity upon initial recognition designates as at fair value through profit or loss;
(ii) those that the entity upon initial recognition designates as available-for-sale; or (iii) those for which the holder may not recover substantially all of its initial investment, other than
because of credit deterioration.
They arise when the group provides money, goods or services directly to a debtor with no intention of trading the advance. Included within this category are group loans receivable and other receivables. Loans and advances are recognised when funds are advanced to the borrowers.
Financial assets, other than those held at fair value through profit or loss, are initially recognised at fair value plus transaction costs.
Financial assets at fair value through profit or loss and available-for-sale financial assets are subsequently carried at fair value. Loans and advances are carried at amortised cost using the effective interest rate method. Gains and losses arising from changes in the fair value of financial assets at fair value through profit or loss are included in the income statement in the period in which they arise. Refer note 2.3.4 with reference to hedging instruments.
The fair values of quoted financial assets in active markets are based on current bid prices.
114 Capitec Bank Holdings Limited
2.3.2 The group categorises its financial liabilities in the following categories:The group recognises a financial liability once it becomes a party to the contractual terms of the financial instrument. Financial liabilities, other than those held at fair value through profit or loss, are recognised initially at fair value, generally being their issue proceeds net of transaction costs incurred.
A financial liability, or part of a financial liability, is derecognised once the obligation specified in the contract relating to the financial liability is discharged, cancelled or has expired.
(a) Deposits held at amortised costDeposits held at amortised cost are recognised initially at fair value and are subsequently stated at amortised cost using the effective interest method. Any differences (other than transaction charges) between net proceeds and the redemption value are recognised in the income statement over the period of the borrowing using the effective yield method.
(b) Other financial liabilitiesIncluded within this class of financial liabilities are trade and other payables, provisions and group loans payable that will be settled in cash and cash equivalents. Trade and other payables and group loans payable are recognised initially at fair value and are subsequently stated at amortised cost using the effective interest rate method. Refer note 2.12 for the accounting policy applied in measuring provisions.
2.3.3 Offsetting financial instrumentsFinancial assets and liabilities are offset and the net amount reported in the balance sheet when there is a legally enforceable right to set off the recognised amounts and there is an intention to settle on a net basis, or to realise the asset and settle the liability simultaneously. Deferred loan income reduces the outstanding loans and advances balance on the basis that the revenue will be recognised over the terms of the loans.
2.3.4 Derivative financial instruments and hedging activitiesDerivative financial instruments exclude equity instruments that are accounted for in terms of IFRS 2 Share-based payment.
Derivatives are initially recognised at fair value on the date a derivative contract is entered into and are subsequently remeasured at fair value. Transaction costs are expensed. The method of recognising the resulting gain or loss depends on whether the derivative is designated as a hedging instrument and, if so, the nature of the item being hedged. Fair values are obtained from quoted market prices, where available, alternatively using valuation techniques or based on observable market prices, where possible, failing which estimates are used.
Interest rate swaps and cross currency interest rate swaps are valued on a discounted cash flow basis using yield curves appropriate for the relevant swap rates. Quoted market prices are used, where available, and estimates are derived from quoted prices where required.
All contracts are carried as assets when fair value is positive and as liabilities when fair value is negative. Derivatives are held to cover economic exposure.
The group designates certain derivatives as:(a) hedges of the fair value of recognised assets or liabilities or a firm commitment (‘fair value hedge’); or(b) hedges of a particular risk associated with a recognised asset or liability or a highly probable forecast
transaction (‘cash flow hedge’), or(c) economic hedges if not qualifying in terms of the accounting criteria classified as ‘fair value through
profit or loss’.
The use of derivatives is restricted to the hedging of forecast cash flows for specific transactions. Currently derivatives are limited to interest rate swaps and forward foreign exchange contracts.

Integrated Report 2013 115
Treatment of hedges qualifying as cash flow hedgesThe effective portion of changes in the fair value of derivatives that are designated and qualify as cash flow hedges is recognised in other comprehensive income. The gain or loss relating to the ineffective portion is recognised immediately in the income statement.
Amounts accumulated in equity are reclassified to profit or loss in the periods when the hedged item affects profit or loss (for example, when the interest payments that are hedged are recognised as an expense). The gain or loss relating to the effective portion of interest rate swaps hedging variable rate borrowings is recognised in the income statement within ‘interest expense’. The gain or loss relating to the ineffective portion is recognised in the income statement within ‘movement in financial instruments held at fair value through profit or loss’.
When a hedging instrument expires or is sold, or when a hedge no longer meets the criteria for hedge accounting, any cumulative gain or loss existing in equity at that time remains in equity and is recognised when the forecast transaction is ultimately recognised in the income statement. When a forecast transaction is no longer expected to occur, the cumulative gain or loss that was reported in equity is immediately transferred to the income statement within ‘movement in financial instruments held at fair value through profit or loss’.
The group documents at the inception of the transaction the relationship between hedging instruments and hedged items, as well as its risk management objectives and strategy for undertaking various hedging transactions. The group also documents its assessment, both at hedge inception and on an ongoing basis, of whether the derivatives that are used in hedging transactions are highly effective in offsetting changes in cash flows of hedged items.
Treatment of economic hedges classified as fair value through profit or lossChanges in the fair value of these derivatives classified as ‘fair value through profit and loss’ are taken to profit or loss immediately on remeasurement.
The fair values of various derivative instruments used for hedging purposes are disclosed in notes 41 and 42. Movements on the hedging reserve in shareholders’ equity are shown in note 17.
2.3.5 Financial guarantee contractsA financial guarantee contract is a contract that requires the group to make specified payments to reimburse the holder for a loss it incurs because a specified debtor fails to make payment when due in accordance with the original or modified terms of a debt instrument.
Financial guarantee liabilities are initially recognised at fair value and then amortised over the life of the financial guarantee. Subsequent to initial recognition, the financial guarantee liability is measured at the higher of the present value of any expected payment, when a payment under the guarantee has become probable, and the unamortised premium.
2.3.6 Resale agreementsFinancial instruments purchased under agreements to resell, at a fixed price or the purchase price plus a lender’s rate of return, are recorded as loans granted under resale agreements and included under cash and cash equivalents or loans and advances as appropriate. The difference between the purchase and sales price is treated as interest and amortised over the life of the reverse repurchase agreement using the effective interest method.

116 Capitec Bank Holdings Limited
2.4 Impairment of advancesThe estimation of allowances for impairments is inherently uncertain and depends on many factors, including general economic conditions, structural changes within industries, changes in individual customer circumstances and other external factors such as legal requirements, regulatory specifications and governmental policy changes.
Loans and advances are stated at amortised cost net of identified impairments and incurred but unidentified impair-ments.
Loans and advances are considered impaired if, and only if, there is objective evidence of impairment as a result of events that occurred after initial asset recognition (known as loss events) and these loss events have an adverse impact on the assets’ estimated future cash flows that can be measured reliably.
Objective evidence that loans and advances may be impaired includes the following observable data:(a) A breach of contract, such as a default or delinquency in interest or principal payments. In this regard instal-
ments past due date are considered in breach of contract.(b) Historical loss experience of groups of financial assets with similar repayment terms.(c) Data indicating that there is a measurable decrease in the estimated future cash flows from a group of financial
assets since the initial recognition of those assets, although the decrease cannot yet be identified with the individual financial assets in the group, including:• adverse changes in the payment status of borrowers in the group; or• national or local economic conditions that correlate with defaults on the assets in the group.
In determining whether a loss event has occurred, loans and advances are subjected to regular evaluations of the overall client risk profile and payments record.
The historical loss experience is adjusted on the basis of observable data to reflect the effects of current condi-tions that did not affect the period on which the historical loss experience is based and to remove the effects of conditions in the historical period that do not currently exist.
On a collective basis, the group assesses whether objective evidence of impairment exists for groups of financial assets with similar repayment terms. If there is objective evidence that an impairment loss on loans and advances has been incurred, the amount of the loss is measured as the difference between the assets’ carrying amounts and the present value of estimated future cash flows (excluding future credit losses that have not yet been incurred) discounted at the respective financial assets’ original effective interest rates (the recoverable amount).
The methodology and assumptions used for estimating future cash flows are reviewed regularly to reduce differences between loss estimates and actual loss experience.
All impaired loans and advances are reviewed on a monthly basis and any changes to the amount and timing of the expected future cash flows compared to previous estimates will result in a change to the charges for impairment of loans and advances in the income statement.
2.4.1 Identified impairmentLoans and advances within the group comprise a large number of small homogenous assets. Statistical techniques are used to calculate impairment allowances collectively, based on historical default and recovery rates. These statistical analyses use as primary inputs the extent to which accounts in the portfolio are in arrears and historical loss experience on the eventual losses encountered from similar delinquent portfolios.
These statistics feed discounted cash flow models, which have been developed for each of the loan products, offered by the group. The models are updated periodically in order to reflect appropriate changes in inputs.
Models contain both judgemental and non-judgemental inputs. The extent of judgement utilised in models

Integrated Report 2013 117
developed for new loan products is greater than that for older products given the limited historical experience available for the new products.
In outline, the statistical analyses are performed on a portfolio basis as follows:• Loans and advances are monitored on a product basis, with each month’s advances being treated as a discrete
portfolio, on which an analysis of the run-off of recoveries, in period buckets and stratified between default statistics, is performed in order to develop a historical base for statistics on probability of default (PD).
• These derived statistics, based on actual experience, are used in plotting default values on a model curve that reflects the risk profile of the portfolio.
• Clients in arrears by more than 90 days are handed over for collection and written off. Recoveries from short-term loans are regarded as negligible as collateral is not required for the granting of advances in the current product range. The estimated recoveries on longer-term loans discounted at the contractual rates are recognised in gross loans and advances.
• Upon write-off the accrual of interest income on the original term of the advance is discontinued.
2.4.2 Incurred but unidentified impairmentIn addition to the impairment estimated for assets with recognised objective evidence of impairment, an estimate is made for impairments associated with those assets in the balance sheet that are impaired, but for which objective evidence is not yet available.• The impairment calculation utilises the results of the statistical analyses referred to above to estimate
the proportion of assets in each portfolio that are likely to display objective evidence of impairment over the emergence period. The emergence period is defined as the experience of the length of time that it takes for objective evidence to become apparent after the asset has become impaired.
• In considering the occurrence of a loss event over the life of a loan, it is assumed that there is a constant risk of the loss event occurring at any point in the life of the loan.
• For a portfolio of loans in a particular month most of the provision is recognised in the early stages of the contractual period, as the outstanding loan balances are larger.
Loans and advances impaired on this basis are reflected as loans not past due.
2.4.3 Loan write-offsClients (and the related impairment allowance accounts) are normally written off in full when they are in arrears for more than 90 days.
2.5 InventoryInventory is stated at the lower of the cost or net realisable value. Cost is determined using the first-in first-out (FIFO) method. Net realisable value is the estimate of the selling price in the ordinary course of business, less selling expenses. Inventory is carried net of rebates. All inventories comprise finished goods.
2.6 Interest-free loans grantedInterest-free group loans with no fixed maturities are viewed as part of the company’s investment in subsidiaries and are carried at cost net of impairment.
2.7 Current taxIncome tax payable on profits, based on the applicable tax law, is recognised as an expense in the period in which profits arise. The current income tax charge is calculated on the basis of the tax laws enacted or substantively enacted at the balance sheet date.
For periods prior to 1 April 2012, secondary tax on companies (STC) was calculated in terms of the applicable tax law and disclosed as part of the tax expense on the income statement.
From 1 April 2012, South African resident companies are no longer subject to STC, which was replaced by a with-holding tax on the declaration of dividends or deemed dividends (as defined under tax law). The withholding tax is not a tax on companies.

118 Capitec Bank Holdings Limited
2.8 Deferred taxDeferred income tax is provided, using the liability method, on temporary differences arising between the tax bases of assets and liabilities and their carrying amounts for financial reporting purposes. Deferred income tax is determined using tax laws and rates that have been enacted or substantively enacted by the reporting date and are expected to apply when the related deferred income tax asset is realised or the deferred income tax liability is settled.
The principal temporary differences arise from depreciation of property and equipment, provisions for doubtful debts, revaluation of certain financial assets and liabilities and tax losses carried forward. Deferred tax assets are raised only to the extent that it is probable that future taxable income will be available against which the unused tax losses can be utilised.
2.9 Property and equipmentLand and buildings comprise a sectional title development right and a warehouse. All property and equipment is stated at historical cost less depreciation. Historical cost includes expenditure that is directly attributable to the acquisition of the items.
Subsequent costs are included in the asset’s carrying amount or are recognised as a separate asset, as appropriate, only when it is probable that future economic benefits associated with the item will flow to the group and the cost of the item can be measured reliably. All other repairs and maintenance costs are charged to the income statement during the financial period in which they were incurred.
Land is not depreciated. Depreciation on other assets is calculated using the straight-line method to allocate their cost to their residual values over their estimated useful lives, as follows:
• Banking application hardware 3 – 5 years• Automated teller machines 8 years• Computer equipment 3 – 5 years• Office equipment 5 – 8 years• Motor vehicles 5 years• Buildings 25 years
The assets’ residual values and useful lives are annually reviewed and adjusted, if appropriate.
Gains and losses on disposals are determined by comparing proceeds with carrying amounts. These are included in the income statement.
2.10 Intangible assets2.10.1 Goodwill
Goodwill represents the excess of the cost of an acquisition over the fair value of the group’s share of the net identifiable assets of the acquired subsidiary at the date of acquisition. Goodwill on acquisitions of subsidiaries is included in ‘intangible assets’. Goodwill is tested annually for impairment and carried at cost less accumulated impairment losses. Gains and losses on the disposal of an entity include the carrying amount of goodwill relating to the entity sold. Goodwill is allocated to cash-generating units for the purpose of impairment testing.
2.10.2 Computer softwareAcquired computer software licences are capitalised on the basis of the costs incurred to acquire and bring to use the specific software. Computer software is carried at cost less accumulated amortisation and impairment losses.
Costs associated with maintaining computer software programmes are recognised as an expense as incurred. Costs that are directly associated with the production of identifiable and unique software products

Integrated Report 2013 119
controlled by the group, and that will probably generate economic benefits exceeding costs beyond one year, are recognised as intangible assets. Direct costs include software development employee costs and an appropriate portion of relevant overheads.
Amortisation on computer software is calculated using the straight-line method to allocate their cost to their residual values over their estimated useful lives, as follows:
• Banking application software 6 years• Server software 3 – 5 years• Desktop application software 2 – 4 years
The assets’ useful lives are annually reviewed and adjusted where appropriate.
2.11 Impairment of non-financial assets Equipment and other non-financial assets (for example property and computer software) are reviewed for impairment losses whenever events or changes in circumstances indicate that the carrying amount may not be recoverable. An impairment loss is recognised for the amount by which the carrying amount of the asset exceeds its recoverable amount, which is the higher of an asset’s net selling price and value in use. For the purpose of assessing impair-ment, assets are grouped at the lowest levels for which there are separately identifiable cash flows (cash-generating units). Non-financial assets, other than goodwill, that suffered impairment are reviewed for possible reversal of the impairment at each reporting date.
2.12 ProvisionsProvisions for expenses are obligations of the group for which there is uncertainty as to the timing or amount of the outflow of economic resources. Provisions are recognised when:
• the group has a present legal or constructive obligation as a result of past events;• it is probable that an outflow of resources embodying economic benefits will be required to settle the obligation;
and• a reliable estimate of the amount of the obligation can be made.
Where there are a number of similar obligations, the likelihood that an outflow will be required in settlement is determined by considering the class of obligations as a whole. A provision is recognised even if the likelihood of an outflow with respect to any one item included in the same class of obligations may be small.
Provisions are measured at the present value of the expenditures expected to be required to settle the obligation using a pre-tax rate that reflects current market assessments of the time value of money and the risks specific to the obligation. The increase in the provision due to passage of time is recognised as interest expense.
2.13 Share capital2.13.1 Categories of share capital
Authorised share capital consists of • ordinary shares, and • non-redeemable, non-cumulative, non-participating preference shares.
2.13.2 Share issue costsIncremental costs directly attributable to the issue of new shares or options or to the acquisition of a business are shown in equity as a deduction, net of tax, from the proceeds.
2.13.3 Dividends declaredDividends on ordinary shares and preference shares are recognised in equity in the period in which they have been approved by the group’s directors. Dividends for the year that are declared after the balance sheet date are dealt with in the directors’ report.

120 Capitec Bank Holdings Limited
2.13.4 Treasury sharesWhere the company or other members of the group purchase the company’s equity share capital, the consideration paid is deducted from total shareholders’ equity as shares held by the group until they are cancelled or sold.
2.13.5 Unissued sharesAt the annual general meeting an amount of 5% (2012: 5%) of the issued ordinary share capital at the time of the meeting and all unissued non-redeemable, non-cumulative, non-participating preference shares were placed under the control of the directors until the next annual general meeting.
2.14 Employee benefits2.14.1 Pension obligations
The group contributes to a provident fund classified as a defined-contribution fund.
For defined-contribution plans, the group pays fixed contributions to privately administered provident fund plans on a contractual basis. The group has no further payment obligations once the contributions have been paid. The contributions are recognised as employee benefit expenses when they are due. Prepaid contributions are recognised as an asset to the extent that a cash refund or a reduction in the future payments is available.
2.14.2 Share-based compensationThe group operates an equity-settled, share-based compensation plan. The fair value of the employee services received in exchange for the grant of the options is recognised as an expense. The total amount to be expensed over the vesting period is determined by reference to the fair value of the options on grant date, excluding the impact of any non-market vesting conditions (for example, profitability and sales growth targets). Non-market vesting conditions are included in assumptions about the number of options that are expected to become exercisable. At each balance sheet date, the entity revises its estimates of the number of options that are expected to vest. It recognises the impact of the revision of original estimates, if any, in the income statement, and a corresponding adjustment to retained income in the statement of changes in equity over the remaining vesting period.
The group also has cash-settled, share-based compensation plans. The fair value of the liability incurred for employee services received is recognised as an expense over the vesting period. Until the liability is settled, the group remeasures the fair value of the liability at each reporting date and at the date of settlement, with any changes in value recognised in profit or loss for the period.
2.14.3 Performance incentive schemeThe group operates a performance incentive scheme for senior and other employees, who are seen to be in leadership roles critical to the current and future success of the group’s business,
The amount recognised as a liability is the present value of the obligation at the end of the reporting period. The rate used to discount the obligation is determined by reference to market yields at the end of the reporting period on government bonds. The currency and term of the bonds is consistent with the currency and term of the obligation.
The employee service cost is recognised in the income statement as the obligation arises.
2.15 Foreign currency translation2.15.1 Functional and presentation currency
Items included in the financial statements of each of the group’s entities are measured using the currency of the primary economic environment in which the entity operates (‘the functional currency’). The consolidated financial statements are presented in South African rands (‘rand’), which is the group and company’s functional and presentation currency. The financial statements of all the subsidiaries are also presented in rand, which is their functional and presentation currency.

Integrated Report 2013 121
2.15.2 Transactions and balancesForeign currency transactions are translated into the functional currency using the exchange rates prevailing at the dates of the transactions. Foreign exchange gains and losses resulting from the settlement of such transactions and from the translation at year-end exchange rates of monetary assets and liabilities denominated in foreign currencies are recognised in the income statement. Translation differences on non-monetary items are reported as part of the fair value gain or loss.
2.16 Revenue recognition2.16.1 Interest income and expense
Interest income and expense are recognised in the income statement for all instruments measured at amortised cost and at fair value through profit or loss using the effective interest rate method.
The effective interest rate method is a method of calculating the amortised cost of a financial asset or a financial liability and of allocating the interest income or interest expense over the relevant period. The effective interest rate is the rate that exactly discounts estimated future cash payments or receipts through the expected life of the financial instrument or, when appropriate, a shorter period to the net carrying amount of the financial asset or financial liability. When calculating the effective interest rate, the group estimates cash flows considering all contractual terms of the financial instrument (for example, prepayment options) but does not consider future credit losses. The calculation includes all fees and points paid or received between parties to the contract that are an integral part of the effective interest rate.
Once a financial asset or a group of similar financial assets has been written down as a result of an impairment loss, interest income is recognised using the rate of interest used to discount the future cash flows for the purpose of measuring the impairment loss.
2.16.2 Fee incomeTransaction fees are recognised on an accrual basis in the period in which the services are rendered. The portion of loan origination fees that relate to the creation of a financial asset, together with the related incremental transaction costs, is amortised over the term of the loan on an effective yield basis. Transaction and service-related loan fee income is recognised when the services are provided.
2.16.3 Non-banking salesNon-banking sales represent the net sales value of all products sold to third parties after the deduction of trade discounts. Revenue is recognised when the risks and rewards of ownership have been transferred to the customer. Revenue is recognised net of value added tax.
2.16.4 Dividend incomeDividend income is recognised in the income statement when the entity’s right to receive payment is established. Dividends on listed preference shares accrue on a day-to-day basis based on the terms of underlying instruments.
2.17 Segment reportingOperating segments are reported in a manner consistent with the internal reporting provided to the chief operating decision-maker. The chief operating decision-maker, who is responsible for allocating resources and assessing the performance of the operating segments, has been identified as the executive management committee that makes strategic decisions.

122 Capitec Bank Holdings Limited
2.18 Leases2.18.1 Where a group company is the lessee
Leases where a significant portion of the risks and rewards of ownership are retained by the lessor are classified as operating leases. Payments made under operating leases, net of any incentives received from the lessor, are charged to the income statement on a straight-line basis over the period of the lease.
When an operating lease is terminated before the lease period has expired, any penalty payment to the lessor is recognised as an expense in the period in which termination takes place.
2.18.2 Where a group company is the lessorRental from the subletting of leased premises is recognised on a straight-line basis over the lease term. Subletting is incidental to the group’s occupation of certain properties.
2.19 Standards, interpretations and amendments to published standards applied for the first time during the current financial year • Amendments to IAS 12 – Deferred tax: recovery of underlying assets (effective 1 March 2012)• Amendment to IFRS 7 Financial Instruments Disclosures – Transfer of financial assets (effective 1 March 2012)• Amendments to IAS 1 – Presentation of items of other comprehensive income (early adopted 1 March 2012)
The implications of these statements have no impact on measurements of assets and liabilities at the previous year-end. Comparatives are provided for new disclosures where required in terms of the standards.
2.20 Standards, interpretations and amendments to published standards that are not yet effective Certain new standards, amendments and interpretations to existing standards have been published that are man-datory for the group’s accounting periods beginning on or after 1 March 2013 or later periods but which the group has not early adopted, as follows:
• Amendments to IFRS 7 Disclosures – Offsetting financial assets and financial liabilities (effective 1 March 2013)• IFRS 9 Financial instruments (effective 1 March 2015)• IFRS 10 Consolidated financial statements (effective 1 March 2013)• IFRS 11 Joint arrangements (effective 1 March 2013)• IFRS 12 Disclosure of interests in other entities (effective 1 March 2013)• IFRS 13 Fair value measurement (effective 1 March 2013)• Amendments to IAS 19 Employee benefits (effective 1 March 2013)• Revised IAS 27 Separate financial statements (effective 1 March 2013)• Revised IAS 28 Investments in Associates and joint ventures (effective 1 March 2013)• Amendment to IAS 32 – Offsetting financial assets and financial liabilities (effective 1 March 2014)• Improvements to IFRSs 2011 (effective 1 March 2013)• IFRIC 20 Stripping costs in the production phase of a surface mine (effective 1 March 2013)
Management is in the process of assessing the impact of these amendments and standards on the reported results of the group and the company.

Integrated Report 2013 123
3. Critical accounting estimates and judgements in applying accounting policiesIn conformity with IFRS, the preparation of financial statements for the group requires management to make estimates and assumptions that affect the reported amounts of assets, liabilities, revenues and expenses, and the disclosure of contingent assets and liabilities in the financial statements and accompanying notes. Although these estimates are based on management’s knowledge of current events and actions that may be undertaken in the future, actual results may ultimately differ from estimates.
The estimates and assumptions that have a significant risk of causing material adjustment to the carrying amounts of assets and liabilities within the next financial year are discussed below.
Impairment losses on loans and advancesThe group reviews its loan portfolio to assess impairment at least on a monthly basis. In determining whether an impairment loss should be recorded in the income statement, the group makes judgements as to whether there is any observable data indicating that there is a measurable decrease in the estimated future cash flows from a portfolio of loans before the decrease can be identified with an individual loan in that portfolio. This evidence may include observable data indicating that there has been an adverse change in the payment status of borrowers in a group, or national or local economic conditions that correlate with defaults on assets in the group. Management uses estimates based on historical loss experience for assets with credit risk characteristics and objective evidence of impairment similar to those in the portfolio when scheduling its future cash flows. The methodology and assump-tions used for estimating both the amount and timing of future cash flows are reviewed regularly to reduce any differences between loss estimates and actual loss experience. Refer note 2.4 for the accounting policy regarding the impairment of advances.
An increase or decrease in 5% in the estimated default rates will have the following impact on the impairment allowance.
Expected default rates (R’000) 2013 2012Expected default rates increase by 5% 37 213 23 966
Expected default rates decrease by 5% (37 259) (23 934)
Property and equipmentProperty and equipment are depreciated over their useful lives, taking into account their residual values at the end of their useful lives. The residual values and useful lives are based on industry knowledge and past experience with similar assets. Refer note 2.9 for the accounting policy regarding property and equipment.

124 Capitec Bank Holdings Limited
4. Segment analysisRetail banking comprises the group’s only operating segment as at 28 February 2013. An interest of 47% in the subsidiary conducting wholesale distribution activities was disposed on 31 January 2013, and the remaining 28% interest is accounted for as an associate in the consolidated group annual financial statements.
Retail banking services offered include savings, deposits, debit cards and consumer loans to individuals. Refer note 28.2 for the geographical distribution of branches. Wholesale distribution consisted of the wholesale distribu-tion of fast-moving consumer goods.
There are no clients that account for more than 10% of revenue and transactions between segments are on normal commercial terms and conditions.
The segment information provided to the executive management committee for the reportable segments is as follows:
R’000 Banking Wholesale distribution
Adjustment for intra-segment
items Total
2013
Segment revenue(1) 10 681 750 248 358 (182) 10 929 926
Segment earnings after tax 1 601 253 3 328 – 1 604 581
The following items are included in ariving at segment
earnings after tax:
Interest income 7 084 923 11 (182) 7 084 752
Interest expense (1 661 743) (952) 182 (1 662 513)
Net fee income 2 501 626 – – 2 501 626
Net impairment charge on loans and advances
to clients (2 658 445) (478) – (2 658 923)
Depreciation (195 634) (474) – (196 108)
Amortisation (51 070) – – (51 070)
Other operating expenses (2 747 304) (21 977) – (2 769 281)
2012Segment revenue(1) 7 367 351 217 145 (912) 7 583 584
Segment earnings after tax 1 092 630 1 710 – 1 094 340
The following items are included in ariving at segment
earnings after tax:
Interest income 4 347 814 – (912) 4 346 902
Interest expense (1 022 329) (957) 912 (1 022 374)
Net fee income 2 306 764 – – 2 306 764
Net impairment charge on loans and advances to
clients (1 604 052) (138) – (1 604 190)
Depreciation (145 141) (457) (145 598)
Amortisation (27 920) – (27 920)
Other operating expenses (2 313 257) (21 885) (2 335 142)
(1) Banking segment revenue consists of interest income and fee income on consumer loans, transaction fee income on savings accounts, dividend income and other income. Wholesale distribution revenue consists of sales of fast-moving consumer goods.

Integrated Report 2013 125
5. Cash, cash equivalents and money market funds
Cash on hand(1) 1 383 300 906 473 – –
Bank balances 3 203 017 2 700 281 7 18
Resale agreements with banks(2) – 558 317 – –
Treasury bills(3) 299 751 – – –
Money market instruments – 909 – –
Central bank balances
Debentures(4) 900 246 – – –
Mandatory reserve deposits with central bank(5) 654 286 385 223 – –
Cash and cash equivalents 6 440 600 4 551 203 7 18
Money market unit trusts(6) 702 492 – – –
7 143 092 4 551 203 7 18
Maximum exposure to credit risk 7 143 092 4 551 203 7 18
Current 7 143 092 4 551 203 7 18
(1) Cash on hand is non-interest bearing.(2) The difference between the purchase and resale price of resale agreements with banks is treated as interest. Resale agreements
relate to treasury bills issued by the South African National Treasury.(3) Treasury bills are short-term fixed interest securities issued by the South African National Treasury.(4) Debentures are short-term fixed interest securities issued by the South African Reserve Bank (SARB).(5) Mandatory reserve deposits with the SARB must be maintained at the average required by the SARB over a 30-day period and
are non-interest bearing. These deposits may be used to manage significant intra- and inter-day cash outflows but are not taken into consideration by the group for cash planning purposes.
(6) Money market unit trusts are liquid floating assets and are taken into consideration for cash planning purposes.
GROUP COMPANY
R’000 2013 2012 2013 2012

126 Capitec Bank Holdings Limited
6. Investments designated at fair valueUnlisted equity investments at fair value
Balance at the beginning of the year – 16 335 – –
Disposals – (28 961) – –
Exchange rate risk – 3 682 – –
Other market risk – 8 944 – –
Balance at the end of the year – – – –
Interest-bearing debt instruments(1)
Balance at the beginning of the year 1 198 833 972 329 – –
Additions 2 023 770 1 542 428 – –
Disposals (1 199 399) (1 315 369) – –
Fair value adjustment – interest rate risk(2) (298) (555) – –
Balance at the end of the year(3) 2 022 906 1 198 833 – –
Total investments at fair value 2 022 906 1 198 833 – –
Maximum exposure to credit risk(4) 2 022 906 1 198 833 – –
Current 2 022 906 1 198 833 – –
(1) Interest-bearing instruments comprise unlisted instruments with a maturity greater than three months from date of acquisition. This figure comprises government instruments (2012: government instruments).
(2) The methods and assumptions applied to calculate the fair value changes due to interest rate risk are set out in note 28.3. (3) The liquid asset requirement of R1 310.5 million (2012: R770.7 million) is included in this balance and is held for regulatory
purposes. It consists of national treasury bills and SARB debentures. Half of this amount is not available for use as working capital or for settlement purposes.
(4) Exposure to credit risk arises from the interest-bearing debt instruments only. Fair value adjustments are not attributable to changes in credit risk during the year, and cumulatively. This group of financial assets and their performance is managed and evaluated on a fair value basis in accordance with a documented risk management strategy. Information about this group is provided internally on that basis to the management committee and board of directors.
GROUP COMPANY
R’000 2013 2012 2013 2012

Integrated Report 2013 127
7. Loans and advances to clientsMaturity analysis
Demand to one month 1 173 564 1 105 723 – –
One to three months 1 229 571 1 184 056 76 –
Three months to one year 5 252 043 4 464 590 198 –
More than one year 23 461 124 12 145 976 1 993 –
Total 31 116 302 18 900 345 2 267 –
Deferred loan fee income (458 634) (492 071) – –
Gross loans and advances 30 657 668 18 408 274 2 267 –
Allowance for impaired loans and advances (2 722 814) (1 545 246) – –
Net loans and advances to clients(1) (2) (3) 27 934 854 16 863 028 2 267 –
Analysis of net loans and advances by status
Gross 28 880 634 17 476 532 2 267 –
Impairment (1 859 324) (1 015 181) – –
Not past due(4) 27 021 310 16 461 351 2 267 –
Gross 1 777 034 931 742 – –
Impairment (863 490) (530 065) – –
Past due(5) 913 544 401 677 – –
27 934 854 16 863 028 2 267 –
Credit quality of performing loans and advances(6)
Low risk 6 879 936 7 678 686
Medium risk 18 815 248 9 592 859
High risk 3 185 450 204 987
Performing loans 28 880 634 17 476 532
Ageing of impaired advances
< 60 days 1 568 709 828 008
60 – 90 days 208 325 103 734
1 777 034 931 742
GROUP COMPANY
R’000 2013 2012 2013 2012

128 Capitec Bank Holdings Limited
7. Loans and advances to clients (continued)
Movement on allowance for impaired advances
Unidentified losses 1 015 181 512 082 – –
Identified losses 530 065 332 644 – –
Opening balance 1 545 246 844 726 – –
Unidentified losses 844 143 503 099 – –
Identified losses 333 425 197 421 – –
Movement 1 177 568 700 520 – –
Unidentified losses 1 859 324 1 015 181 – –
Identified losses 863 490 530 065 – –
Closing balance 2 722 814 1 545 246 – –
Exposure to credit risk
Loans and advances to clients 31 116 302 18 900 345 2 267 –
Conditionally revocable retail loan commitments(7) 725 010 603 816 – –
Maximum exposure to credit risk 31 841 312 19 504 161 2 267 –
(1) Loans and advances comprise unsecured loans to individuals except for amounts detailed in (3) below.(2) Accrued interest receivable of R145.8 million is included in loans and advances (2012: R101.4 million).(3) An investment of R23.8 million in cumulative preference shares bearing interest at 80% of the prime interest rate was included
in the loans and advances in 2012.(4) Loans and advances not past due on which an impairment allowance has been raised are treated as fully performing loans and
advances.(5) Past due loans and advances are in arrears from one day to three months and not handed over. All past due loans and advances
are impaired.(6) The lower-risk clients qualify for longer-term, lower-rate loan combinations, while the higher-risk clients are limited to shorter-term,
higher interest rate products. The interest rate on a loan can be decreased by selecting a term shorter than the term for which the client qualifies.
(7) Conditionally revocable retail loan commitments totalling R725.0 million (2012: R603.8 million) are not included in the maturity analysis. The commitments are a result of undrawn loan amounts. The loans are advanced with a contractual repayment period of one month or less. The group’s contractual commitment is revocable should a client not meet their contractual obligations or where the group has determined that the client’s credit risk profile has changed. A total of 17.8% (2012: 18.3%) of these commitments is expected to be drawn down within one month. As these are one-month loans, repayment of any future draw downs must also occur within the month.
(8) Loans and advances with outstanding balances of R1 343 million (2012: R421 million) that would have reflected as past due are included in loans and advances not past due, due to renegotiated payment terms. Impairment provisions on these loans amount to 10%, while other loans and advances not past due are provided at 2%.
8. Inventory
Finished goods – 42 079 – –
– 42 079 – –
Current – 42 079 – –
No obsolete inventory expense is included in cost of sales for 2012 or 2013.
GROUP COMPANY
R’000 2013 2012 2013 2012

Integrated Report 2013 129
9. Other receivablesRental deposits 2 483 2 356 – –
Accrued income 68 757 28 270 10 104 9 657
Derivatives (note 42) 3 394 263 – –
Prepayments 56 057 26 856 139 –
Other 10 127 – – –
140 818 57 745 10 242 9 657
Current 138 721 55 589 10 242 9 657
Non-current 2 097 2 156 – –
10. Interest in subsidiaries and associatesInterest in subsidiaries
Investment in unlisted subsidiaries at cost(1) – – 5 607 559 3 187 311
Loans to subsidiaries(2) – – 1 574 16 350
– – 5 609 133 3 203 661
Subsidiaries Domicile Holding % Nature of business
Capitec Bank Limited South Africa 100% Banking
Keynes Rational Corporate Services (Pty) Limited South Africa 100% Dormant
Capitec Properties (Pty) Limited South Africa 100% Property
Keymatrix (Pty) Limited South Africa 100% Dormant
Capitec Bank Holdings Share Trust South Africa – Share incentive trust
Capitec Bank Group Employee Empowerment Trust South Africa – Employee empowerment trust
GROUP COMPANY
R’000 2013 2012 2013 2012Interest in associates(3)
Opening balance – – – –
Interest acquired – – – –
Share of profit 167 – – –
Closing balance 167 – – –
The aggregated assets and liabilities of the associate as at
28 February 2013 are as follows:
Assets 42 480 –
Liabilities 34 694 –
The associate’s revenue for February 2013 was as follows:
Revenue 22 864 –
(1) All holdings are in the ordinary and preference share capital of the subsidiary.(2) Loans to subsidiaries are interest-free and have no fixed repayment terms. Loans are managed as part of the investment in
subsidiaries. Loans to associates are capped at R8.25 million.(3) Interest in associates consists of a 28% holding in Key Distributors (Pty) Limited, a wholesale distribution company incorporated
in South Africa.
GROUP COMPANY
R’000 2013 2012 2013 2012

130 Capitec Bank Holdings Limited
11. Property and equipment
GROUP (R’000) Land and buildings(1)
Computer Equipment
Office equipment
and vehicles Total
2013Opening net book value 32 836 256 820 253 465 543 121
Additions – 176 059 178 525 354 584
Disposals (1 490) (776) (1 941) (4 207)
Other – (162) 284 122
Depreciation charge (52) (109 418) (86 638) (196 108)
Net book value at the end of the year 31 294 322 523 343 695 697 512
Cost 31 294 622 074 721 272 1 374 640
Accumulated depreciation – (299 551) (377 577) (677 128)
Net book value at the end of the year 31 294 322 523 343 695 697 512
Non-current 31 294 322 523 343 695 697 512
2012Cost 33 139 332 568 416 505 782 212
Accumulated depreciation (293) (175 484) (231 250) (407 027)
Opening net book value 32 846 157 084 185 255 375 185
Additions 45 180 285 135 036 315 366
Disposals – (1 300) (532) (1 832)
Depreciation charge (55) (79 249) (66 294) (145 598)
Net book value at the end of the year 32 836 256 820 253 465 543 121
Cost 33 184 473 594 547 905 1 054 683
Accumulated depreciation (348) (216 774) (294 440) (511 562)
Net book value at the end of the year 32 836 256 820 253 465 543 121
Non-current 32 836 256 820 253 465 543 121
(1) Land and buildings with a book value of R1.5 million were encumbered in 2012 and disposed in 2013.

Integrated Report 2013 131
12. Intangible assetsComputer software(1)
Cost 148 574 98 294 – –
Accumulated amortisation (79 312) (63 937) – –
Opening net book value 69 262 34 357 – –
Additions 118 200 65 873 – –
Scrappings (19) (3 048) – –
Other 7 –
Amortisation charge (51 070) (27 920) – –
Net book value at the end of the year 136 380 69 262 – –
Cost 265 142 148 574 – –
Accumulated amortisation (128 762) (79 312) – –
Net book value at the end of the year 136 380 69 262 – –
Non-current 136 380 69 262 – –
13.
(1) Computer software is primarily comprised of the banking application system.
Deferred income tax assets(1)
R’000 Provisions
and accruals Cash flow
hedge Capital
allowances Pre-
payments Total
2013Balance at the beginning of the year 261 640 747 (21 787) (6 358) 234 242
Income statement charge 80 907 – (12 609) (2 481) 65 817
Credited directly to equity (34 409) – – – (34 409)
Credited to equity through other
comprehensive income – 5 345 – – 5 345
Balance at the end of the year 308 138 6 092 (34 396) (8 839) 270 995
2012Balance at the beginning of the year 70 366 1 349 (15 929) (6 883) 48 903
Income statement charge 191 274 – (5 858) 525 185 941
Credited to equity through other
comprehensive income – (602) – – (602)
Balance at the end of the year 261 640 747 (21 787) (6 358) 234 242
GROUP COMPANY
R’000 2013 2012 2013 2012Current 197 497 135 854 – –
Non-current 73 498 98 388 – –
(1) Deferred income taxes are calculated on all temporary differences under the liability method using an effective tax rate of 28% (2012: 28%). The deferred tax assets are stated at the rate at which the assets are expected to be realised.
GROUP COMPANY
R’000 2013 2012 2013 2012

132 Capitec Bank Holdings Limited
14. Loans and deposits at amortised cost
By maturity
Within one month 11 053 402 6 911 390 – –
One to three months 939 119 932 963 – –
Three months to one year 4 166 668 3 932 021 – –
More than one year 12 841 002 5 915 688 – –
Loans and deposits at amortised cost(1) 29 000 191 17 692 062 – –
By nature
Retail savings 10 335 171 6 348 206 – –
Retail fixed deposits 6 843 560 4 014 621 – –
Wholesale(1) 1 691 812 1 297 275 – –
Subordinated debt – unlisted bonds 1 006 127 499 254 – –
Subordinated debt – listed bonds 1 925 745 591 533 – –
Listed senior bonds(2) 4 222 222 2 775 944 – –
Other unlisted negotiable instruments 2 832 811 1 998 468 – –
Reserve Bank settlement balance 142 743 166 761 – –
29 000 191 17 692 062 – –
Amounts payable on maturity of the funding(3) 33 944 592 20 547 386 – –
Subordinated debt analysis
Description Nominal amount Term Rate
Subordinated debt – unlisted bonds – floating rate
• First seven years R250 million 12 year 3-month JIBAR plus 6.75%
• Last five years if not called by the bank 3-month JIBAR plus 8.00%
Subordinated debt – unlisted bonds – floating rate R200 million 12 year
• First seven years 3-month JIBAR plus 5.75%
• Last five years if not called by the bank 3-month JIBAR plus 7.00%
Subordinated debt – unlisted bonds – floating rate R44 million 7 year 3-month JIBAR plus 4.50%
Subordinated debt – unlisted bonds – floating rate R500 million 7 year 3-month JIBAR plus 4.75%
Subordinated debt – listed bonds – fixed rate R250 million 7 year R204 government bond plus 3.91%
Subordinated debt – listed bonds – floating rate R150 million 7 year 3-month JIBAR plus 4.50%
Subordinated debt – listed bonds – fixed rate R175 million 7 year R204 government bond plus 4.16%
Subordinated debt – listed bonds – floating rate R400 million 7 year 3-month JIBAR plus 4.49%
Subordinated debt – listed bonds – fixed rate R350 million 7 year R204 government bond plus 4.60%
Subordinated debt – listed bonds – floating rate R572 million 7 year 3-month JIBAR plus 4.49%
(1) Wholesale deposits for 2012 included a mortgage bond of R0.4 million secured as stated in note 11. All other deposits are unsecured.
(2) Listed senior bonds consist of Domestic Medium Term Notes. Domestic Medium Term Notes (nominal value R2 140 million) issued at variable rates are hedged through interest rate swap agreements as set out in notes 18 and 42.
(3) The difference between the amounts payable on maturity and the loans and deposits at amortised cost relates to future finance cost.
GROUP COMPANY
R’000 2013 2012 2013 2012
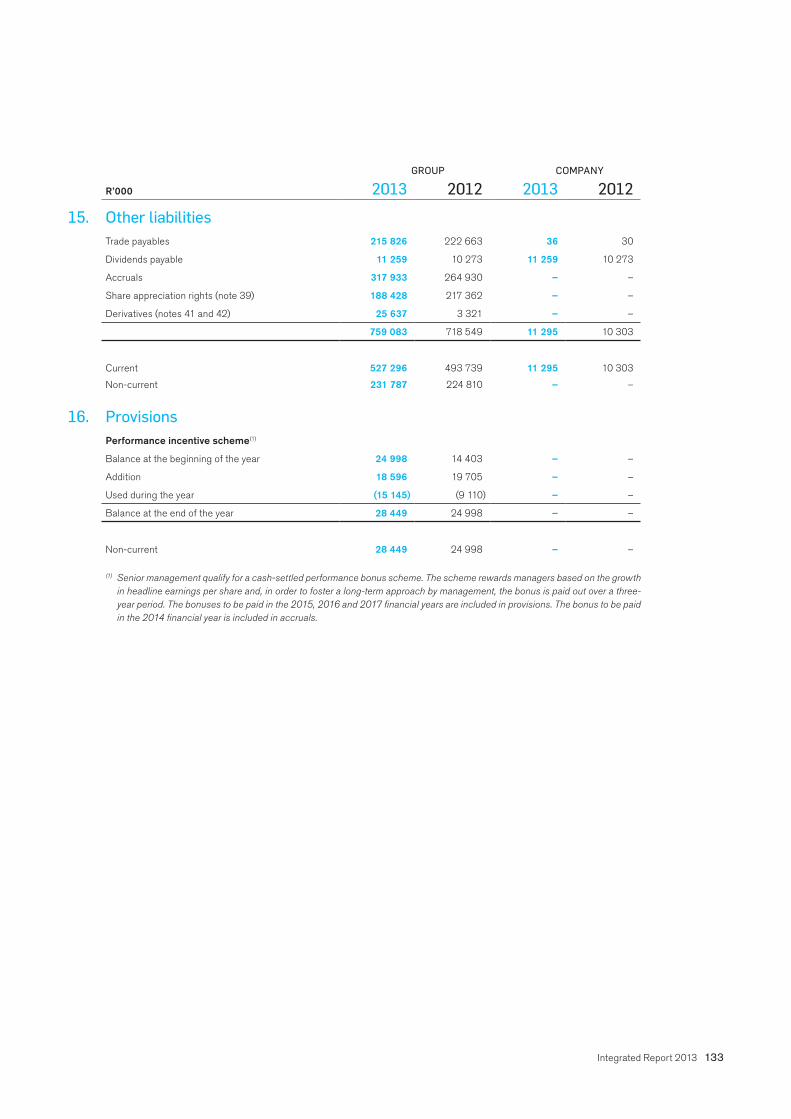
Integrated Report 2013 133
15. Other liabilitiesTrade payables 215 826 222 663 36 30
Dividends payable 11 259 10 273 11 259 10 273
Accruals 317 933 264 930 – –
Share appreciation rights (note 39) 188 428 217 362 – –
Derivatives (notes 41 and 42) 25 637 3 321 – –
759 083 718 549 11 295 10 303
Current 527 296 493 739 11 295 10 303
Non-current 231 787 224 810 – –
16. ProvisionsPerformance incentive scheme(1)
Balance at the beginning of the year 24 998 14 403 – –
Addition 18 596 19 705 – –
Used during the year (15 145) (9 110) – –
Balance at the end of the year 28 449 24 998 – –
Non-current 28 449 24 998 – –
(1) Senior management qualify for a cash-settled performance bonus scheme. The scheme rewards managers based on the growth in headline earnings per share and, in order to foster a long-term approach by management, the bonus is paid out over a three-year period. The bonuses to be paid in the 2015, 2016 and 2017 financial years are included in provisions. The bonus to be paid in the 2014 financial year is included in accruals.
GROUP COMPANY
R’000 2013 2012 2013 2012

134 Capitec Bank Holdings Limited
17. Share capital and premiumAuthorised
Ordinary shares
500 000 000 shares of R0.01 each 5 000 5 000 5 000 5 000
Non-redeemable, non-cumulative, non-participating preference shares
100 000 000 shares of R0.01 each 1 000 1 000 1 000 1 000
Compulsorily convertible or written off non-redeemable, non-cumulative, non-participating preference shares
100 000 000 shares of R0.01 each 1 000 – 1 000 –
7 000 6 000 7 000 6 000
Issued(1)
114 441 719 (2012: 99 282 200) shares of R0.01 each at par 1 144 993 1 144 993
Share premium 5 329 566 2 925 442 5 329 566 2 925 442
Ordinary share capital and premium 5 330 710 2 926 435 5 330 710 2 926 435
2 869 014(2012: 2 869 014) shares of R0.01 each at par 29 29 29 29
Share premium 258 940 258 940 258 940 258 940
Non-redeemable, non-cumulative, non-participating preference share capital and premium(2) 258 969 258 969 258 969 258 969
Total issued share capital and premium(3)(4) 5 589 679 3 185 404 5 589 679 3 185 404
(1) All issued ordinary and preference shares are fully paid up. No ordinary or preference shares were cancelled in the current or prior year.
(2) The preference shares carry a coupon rate of 83.33% of the prime overdraft rate on a face value of R100 per share.(3) Refer note 34 for detail regarding the issue of shares to settle share options. During the year a loss of R206.6 million
(R185.8 million after tax) (2012: R186.1 million, R43.2 million after tax) was realised on settlement of share options as reflected in the statement of changes in equity.
(4) Nil (2012: Nil) of the unissued ordinary shares and 100% of the non-redeemable, non-cumulative, non-participating preference shares that were placed under the control of the directors until the next annual general meeting remained at year-end.
(5) 4 014 (2012: Nil) treasury shares with a value of R0.1 million (2012: Nil) were held by the group at year-end.
18. Cash flow hedge reserveCash flow hedge loss(1)
Balance at the beginning of the year (1 920) (3 469) – –
Amount recognised in comprehensive income during the year (33 430) (4 916) – –
Amount reclassified from comprehensive income to profit and loss for the year 14 080 7 067 – –
(21 270) (1 318) – –
Deferred tax recognised in comprehensive income during the year 5 345 (602) – –
Balance at the end of the year (15 925) (1 920) – –
(1) The hedging reserve is released to the income statement on realisation of the interest expense. Refer note 42 for additional disclosure.
GROUP COMPANY
R’000 2013 2012 2013 2012

Integrated Report 2013 135
19. Net interest incomeLoans and advances to clients 6 830 585 4 188 980
Non-bank money market placements 26 17 – –
Money market funds 130 023 62 894 – –
Treasury bills 6 821 10 485 – –
Bank balances 2 690 761 – –
Resale agreements with banks 4 614 30 705 – –
Debentures 36 993 3 989
Interest-bearing instruments 73 000 49 071 – –
Interest income(1) 7 084 752 4 346 902 – –
– –
Retail savings (365 037) (243 532)
Retail fixed deposits (377 513) (222 946)
Wholesale (143 747) (125 292) – –
Subordinated debt (204 280) (71 629) – –
Domestic Medium Term Note (367 995) (271 103) – –
Negotiable deposits (190 584) (87 855)
Forward foreign exchange contracts (189) (17) – –
Other (13 168) –
Interest expense (1 662 513) (1 022 374) – –
Net interest income 5 422 239 3 324 528 – –
(1) Included in interest income is R72.8 million (2012: R35.3 million) with respect to interest income accrued on impaired financial assets.
20. Dividend incomeOrdinary dividends – – 467 460 317 939
Preference dividends – – 20 783 19 419
Subsidiaries – – 488 243 337 358
Investments at fair value through profit or loss 9 1 532 – –
Dividend income 9 1 532 488 243 337 358
21. Net impairment charge on loans and advances to clients
Bad debts 1 754 530 1 079 237 – –
Movement in impairment allowance 1 177 568 700 520 – –
Bad debts recovered (273 175) (175 567) – –
Net impairment charge 2 658 923 1 604 190 – –
GROUP COMPANY
R’000 2013 2012 2013 2012

136 Capitec Bank Holdings Limited
22. Net movement in financial instruments held at fair value through profit or loss
Change in fair value due to risk factors(1) (298) 12 070 – –
(1) The changes in fair value for 2013 relate to interest rate risk (2012: interest rate, exchange rate and other market risk).
23. Operating profit before taxThe following items have been included in arriving at operating profit before tax:
(Profit)/Loss on disposal of equipment (358) 596 – –
Loss on scrapping of intangibles 19 3 048 – –
Depreciation on fixed assets 196 108 145 598 – –
Amortisation of computer software 51 070 27 920 – –
Loss/(Gain) on disposal of investment in subsidiary 58 – (3 321) –
Foreign exchange gains(1) – (3) – –
Operating lease rentals
Land and buildings 204 271 163 588 – –
Office equipment 3 415 3 160 – –
207 686 166 748 – –
Income from subletting (2 872) (2 529) – –
Auditors’ remuneration
Audit fees – current year 3 245 2 681 2 –
Audit fees – prior year underprovision – 166 – –
Other services 2 636 228 2 185 85
Less: Other services accounted for in equity (2 100) – (2 100) (85)
3 781 3 075 87 –
Employee costs (including directors’ remuneration)(2)
Salaries and wages 1 360 965 1 129 445 – –
Equity-settled share-based payment 9 037 11 778 – –
Cash-settled share appreciation rights 93 066 123 613 – –
Social security cost 31 794 24 522 – –
Training cost(3) 44 376 40 488 – –
Training refund (3 183) (5 287) – –
1 536 055 1 324 559 – –
(1) Excludes change in fair value of financial assets through profit or loss as per note 6.(2) Refer note 30 for details of directors’ remuneration.(3) Excludes internal training department infrastructure and employee cost.
GROUP COMPANY
R’000 2013 2012 2013 2012

Integrated Report 2013 137
24. Income tax expenseNormal company tax 709 773 615 889 275 –
Secondary tax on companies 28 906 33 584 – –
Current tax 738 679 649 473 275 –
Deferred tax (65 817) (185 941) – –
Income tax expense 672 862 463 532 275 –
Effectivetaxrate 30 30 – –
The tax on the profit before tax differs from the theoretical amount that would arise using the basic tax rate as follows:
Profit before tax 2 277 276 1 557 872 491 564 337 358
Tax calculated at a tax rate of 28% 637 637 436 204 137 638 94 460
Secondary tax on companies 28 906 33 584 – –
Adjustments for prior periods (143) (8) – –
Income not subject to tax (42) (5 854) (137 363) (94 460)
Expenses not deductible for tax purposes 7 690 128 – –
Allowancesnotinincomestatement (657) – – –
Withholding tax 1 8 – –
Movement in unutilised tax losses (530) (530) – –
Income tax expense 672 862 463 532 275 –
Estimated tax losses at year-end available for utilisation against future taxable income 11 401 12 814 – 212
Less: Applied in raising a deferred tax asset – – – –
Net calculated tax losses carried forward(1) 11 401 12 814 – 212
Tax relief calculated at current tax rates 3 192 4 928 – 59
(1) The utilisation of the tax losses is dependent on sufficient future taxable income being earned.
GROUP COMPANY
R’000 2013 2012 2013 2012

138 Capitec Bank Holdings Limited
25. Earnings per shareNet profit after tax 1 604 581 1 094 340
Preference dividend (20 783) (19 419)
Net profit after tax attributable to ordinary shareholders 1 583 798 1 074 921
Weighted average number of ordinary shares in issue (thousands) 104 238 95 790
Adjustment for:
Exercise of share options 1 465 2 271
Weighted average number of ordinary shares for diluted earnings per share (thousands)
105 703 98 061
Basic earnings per share (cents)(1) 1 519 1 122
Diluted earnings per share (cents)(2) 1 498 1 096
(1) Basic earnings per share is calculated by dividing the net profit after tax attributable to ordinary equity holders by the weighted average number of ordinary shares in issue during the year.
(2) To calculate diluted earnings per share, the net profit after tax attributable to ordinary equity is divided by the weighted average number of ordinary shares in issue adjusted to assume conversion of all potentially dilutive ordinary shares. Potentially dilutive shares consist of share options. The number of shares that could have been acquired at fair value (the average annual share price of the company’s shares) is determined based on the monetary value of the subscription rights attached to outstanding options.The result is compared to the number of shares that would have been issued assuming the exercise of the share options. The difference is added to the weighted average number of shares as an issue of ordinary shares for no consideration. No adjustment is made to earnings.
26. Headline earnings per share attributable to ordinary shareholders
GROUP
R’000 2013 2012Net profit attributable to ordinary shareholders 1 583 798 1 074 921
Non-headline items
Loss/(Profit) on disposal of property and equipment (358) 596
Income tax charge – property and equipment 100 (192)
Loss on scrapping of intangible assets 19 3 048
Income tax charge – intangible assets (5) (853)
Loss on sale of subsidiary 58 –
Income tax charge – sale of subsidiary (16) –
Headline earnings 1 583 596 1 077 520
Basic headline earnings per share (cents) 1 519 1 125
Diluted headline earnings per share (cents) 1 498 1 099
GROUP COMPANY
R’000 2013 2012 2013 2012

Integrated Report 2013 139
27. DividendsThe company declared the following dividends for the current and previous financial years:
DPS R’000 Declared LDT Date paid
2013Ordinary dividend
Interim 169.00 169 614 25 Sep 2012 12 Oct 2012 22 Oct 2012
Final(1) 405.00 463 489 25 Mar 2013 12 Apr 2013 22 Apr 2013
Preference dividend
Interim 373.16 10 706 31 Aug 2012 14 Sep 2012 25 Sep 2012
Final 351.24 10 077 28 Feb 2013 14 Mar 2013 25 Mar 2013
2012 Ordinary dividend
Interim 125.0 124 103 27 Sep 2011 25 Nov 2011 5 Dec 2011
Final 300.0 297 847 1 Mar 2012 15 Mar 2012 26 Mar 2012
Preference dividend
Interim 340.27 9 763 31 Aug 2011 16 Sep 2011 26 Sep 2011
Final 336.58 9 657 29 Feb 2012 15 Mar 2012 26 Mar 2012
(1) The directors declared a final dividend of 405 cents per share (2012: 300 cents per share) in respect of 2013 on 25 March 2013 amounting to a dividend of R463.5 million (2012: R297.8 million). These financial statements do not reflect this dividend payable, which will be accounted for in shareholders’ equity as an appropriation of retained earnings in the year ending 28 February 2014, which is in line with recommended accounting practice.
28. Financial risk managementThe board of directors is responsible for risk management and views it as an integral part of providing a responsible return on shareholders’ equity.
To assist the board, the group is managed through a system of internal controls functioning throughout the entities. Risk awareness pervades every aspect of the business and is the responsibility of each employee of the group. The board established a risk and capital management committee (RCMC), comprising two independent non-executive directors, two non-executive directors and one executive director, operates in compliance with a formal charter. The committee assists the board in reviewing the processes followed to identify risk and in assessing the potential impact of identified risks in the group environment.
Specific risks are dealt with in a structured manner by the following subcommittees comprising executives and senior management:• Credit committee – credit and counterparty risk• Assets and liability committee (ALCO) – interest rate, market, liquidity, counterparty, currency and capital ade-
quacy risk• Operational risk committee – legal, compliance, technology, operational and reputation risk
The RCMC ensures that risk assessment is an ongoing process and that a formal risk assessment is undertaken at least quarterly. The group operates in a structured manner with defined processes and procedures enabling risk assessment within a controlled environment. Accordingly, an assessment of key risks is performed and weightings are assigned based on impact and probability. Existing controls are assessed and, if necessary, adjusted. Thereafter reports are generated at regular intervals to enable monitoring of risk levels.
The financial instruments carried on the balance sheet are set out in note 28.9.

140 Capitec Bank Holdings Limited Integrated Report 2013 140
28.1 Credit riskRetailThe group grants personal unsecured loans. Exposure to counterparty concentration credit risk is low due to the nature and distribution of the loan book. Exposure to systemic credit risk is regarded as being higher than normal banking activities due to the demographic credit characteristics of the client base. Measures taken by the group to limit credit risk to acceptable levels include, inter alia, the application of standard credit acceptance procedures to assess potential clients, daily monitoring of collectible balances at both branch and head office level and monitoring by the credit and risk committees. No security is obtained for loans and advances, and accordingly the entire balance as per the balance sheet is exposed to credit risk. The credit quality of loans and advances is disclosed in note 7.
The maximum capital advanced in terms of any one personal loan is R230 000 (2012: R150 000). At balance sheet date the number of outstanding loans was 1 153 420 (2012: 1 375 508).
Wholesale The group only invests centrally managed cash surpluses in cash and liquid assets with the SARB, South African registered banking entities and money market funds of high credit standing. Potential exposure to counterparty concentration credit risk exists principally in cash and cash equivalents and interest-bearing instruments (notes 5 and 6). Exposure to counterparty credit risk is controlled using ALCO-approved limits which are monitored and enforced by the credit committee. This ensures that the financial assets that the group may place with any one counterparty are limited, by reference to the long-term and short-term credit ratings assigned for that counterparty by Fitch.
At balance sheet date the international long-term credit ratings, using Fitch ratings, were as follows:
R’000 Notes AAA–A BBB Below BBB Not rated
Total carrying amount
2013Cash on hand 5 – 1 383 300 – – 1 383 300
Bank balances(1) 5 2 509 013 694 007 – (3) 3 203 017
Resale agreements with banks 5 – – – – –
Money market funds(2) 5 – – – 702 492 702 492
Treasury bills (< 3 months)(1) 5 – 299 751 – – 299 751
Central bank balances(1) 5 – 1 554 532 – – 1 554 532
Treasury bills (> 3 months)(1) 6 – 2 022 906 – – 2 022 906
2 509 013 5 954 496 – 702 489 9 165 998
2012Cash on hand 5 906 473 – – – 906 473
Bank balances(1) 5 1 639 902 1 060 374 – 5 2 700 281
Resale agreements with banks 5 – 558 317 – – 558 317
Money market funds(2) 5 – – – 909 909
Treasury bills (< 3 months) 5 – – – – –
Central bank balances 5 385 223 – – – 385 223
Treasury bills (> 3 months) 6 1 198 833 – – – 1 198 833
4 130 431 1 618 691 – 914 5 750 036
(1) The bank balances were with nine institutions (2012: 18), with the maximum exposure to one institution being R3 267 million (2012: R1 514 million).
(2) Money market funds consist of money market unit trust investments. The placements were with five institutions (2012: two).

Integrated Report 2013 141
28.2 Geographical concentration of operationsAll the group’s operating activities are situated within the Republic of South Africa.
Capitec Bank branches are distributed across South Africa and at year-end the breakdown by province was as follows:
2013 2012Eastern Cape 69 61
Free State 33 31
Gauteng 155 140
KwaZulu-Natal 85 79
Limpopo 47 40
Mpumalanga 46 41
North West 32 27
Northern Cape 20 18
Western Cape 73 70
560 507
28.3 Interest rate riskThe current group interest profile is uncomplicated and is monitored by ALCO. Management aims to match the fixed or floating rate nature of funding with the fixed rate elements of the loan book and fixed and floating rate elements of surplus cash positions.
The group operates within the ambit of the National Credit Act when considering interest rates on short-term per-sonal loans, and retail advances are only offered at fixed interest rates. The maturity breakdown of the advances book is set out in note 7 and note 28.6.
Fair value interest rate riskFinancial assets and liabilities are mainly accounted for on an amortised cost basis and therefore the income state-ment is not significantly impacted by fair value interest rate risk.
Cash flow interest rate riskThe return on surplus cash balances placed in call money market accounts varies with changes in interbank interest rates as does the interest payable on floating rate bond liabilities and some retail deposits, resulting in cash flow interest rate risk.
The group has discretion over the rates offered on its demand savings deposits. Floating rate bond and wholesale deposit liabilities may be hedged using interest rate swaps that match positions and mitigate the negative impact that changing market interest rates can have on the value of the business and annual earnings. Interest rate swaps have the economic effect of converting floating rate debt to fixed rate debt, thereby reducing fluctuations in future cash flow commitments. Under the terms of the interest rate swaps, the group agrees with other banking entities to exchange the difference between fixed contractual rates and floating rate interest amounts calculated by reference to the agreed notional amounts on a quarterly basis.
The ALCO meets monthly and considers the results of management’s analysis of the impact of interest rates on the group which includes, inter alia, the results of various models and the impact of interest rate strategy on the gross margin.
142 Capitec Bank Holdings Limited
28.3 Interest rate risk (continued) The sensitivity analysis below is a run-off analysis and reflects the impact of a 200 basis point increase or decrease in interest rates:• Immediately following the reporting date • Based on floating rate assets and liabilities held at amortised cost (cash and cash equivalents, negotiable
instruments, floating bond liabilities)• Assets and liabilities accounted for at fair value through profit and loss• On balance sheet at the reporting date • The movement in rates was applied as a parallel shift in the applicable yield curves
The continuity of items for the purpose of this analysis is the contractual maturity dates.
Impact on income statement Impact on equity
2013 2012 2013 2012200 basis points R’000 Pre-tax Post-tax Pre-tax Post-tax Pre-tax Post-tax Pre-tax Post-tax
Increase (234 467) (168 816) (111 592) (80 346) (83 756) (61 755) (82 223) (60 133)
Decrease 234 467 168 816 111 592 80 346 83 756 61 755 82 223 60 133
28.4 Currency risk The exposure to foreign currency purchase risk relating to the importation of capital equipment, technology and technology support services needed for the core banking activities is managed through the purchase of forward foreign exchange contracts. Wholesale loans and deposits for 2013 (refer note 14) include a foreign denominated loan. The currency exposure is mitigated by a hedging instrument (refer note 42).
28.5 Other market risk There is no exposure to other pricing risk.
28.6 Liquidity risk The group manages liquidity cautiously and operates an uncomplicated maturity profile which is monitored by ALCO. The matching of the term of funding to the term of the loan book reduces the liquidity risk of the group.
The table below analyses the group’s assets and liabilities into maturity groupings based on the remaining period, at balance sheet date, to the contractual maturity date. The table was prepared on the following basis: • Asset and liability cash flows are presented on an undiscounted basis with an adjustment to reflect the total
discounted result.• The cash flows of floating rate financial instruments are calculated using published forward market rates at
balance sheet date.• The cash flows of the derivative financial instruments are included on a gross basis.• Contractual cash flows with respect to items which have not yet been recorded on the balance sheet (off-balance
sheet items), are excluded. Refer note 35.• Conditionally revocable retail loan commitments totalling R725.0 million (2012: R603.8 million) are not included
in the liquidity analysis. The commitments are a result of undrawn loan amounts. The loans are advanced with a contractual repayment period of one month or less. The group’s contractual commitment is revocable should a client not meet his/her contractual obligations or where the group has determined that the client’s credit risk profile has changed. A total of 17.8% (2012: 18.3%) of these commitments is expected to be drawn down within one month. As these are one-month loans, repayment of any future draw downs must also occur within the month.
• Adjustments to loans and advances to clients relate to initiation fee income.• Non-cash liabilities, representing leave pay and the straight-lining of operating leases, are disclosed as adjustments
to trade and other payables.

Integrated Report 2013 143
28.6 Liquidityrisk(continued)
Maturities of financial assetsand financial liabilities (discounted cash flows)R’000 Notes
Demandto one month
One tothree
months
Three months to
one year
More than
one year Adjustment(4) Total
2013Undiscounted assets
Cash and cash equivalents – sovereigns 5 1 854 283 – – – – 1 854 283
Cash and cash equivalents – banks 5 4 588 013 – – – – 4 588 013
Money markets unit trusts 5 702 492 – – – – 702 492
Investments at fair value through profit or loss – sovereigns 6 270 900 211 260 1 584 400 – – 2 066 560
Loans and advances to clients – retail personal 7 2 003 556 2 688 862 11 103 896 37 720 055 (458 634) 53 057 735
Loans and advances to clients – retail other 7 1 027 – – – – 1 027
Loans and advances to clients – corporate other 7 19 509 – – – – 19 509
Other receivables 9 79 218 (375) (1 429) 7 347 – 84 761
Current income tax assets – – – – – –
Undiscounted assets 9 518 998 2 899 747 12 686 867 37 727 402 (458 634) 62 374 380
Adjustments for undiscounted assets (852 915) (1 461 231) (5 892 875) (14 258 931) – (22 465 952)
Discounted assets
Loan impairment provision 7 (189 472) (89 537) (352 590) (2 091 215) – (2 722 814)
Total discounted assets 8 476 611 1 348 979 6 441 402 21 377 256 (458 634) 37 185 614
Undiscounted liabilities
Loans and deposits at amortised cost 14 11 062 854 1 078 056 4 927 845 16 875 837 – 33 944 592
Trade and other payables 15 302 633 193 101 31 562 132 927 98 860 759 083
Current income tax liabilities – – 46 007 – – 46 007
Provisions 16 – – – 28 449 – 28 449
Undiscounted liabilities 11 365 487 1 271 157 5 005 414 17 037 213 98 860 34 778 131
Adjustments for undiscounted liabilities to depositors (9 452) (138 937) (761 177) (4 034 835) – (4 944 401)
Total discounted liabilities 11 356 035 1 132 220 4 244 237 13 002 378 98 860 29 833 730
Net liquidity excess/(shortfall) (2 879 424) 216 759 2 197 165 8 374 878 (557 494) 7 351 884
Cumulative liquidity
(shortfall)/excess (2 879 424) (2 662 665) (465 500) 7 909 378 7 351 884 7 351 884

144 Capitec Bank Holdings Limited
28.6 Liquidityrisk(continued)
Maturities of financial assetsand financial liabilities (discounted cash flows)R’000 Notes
Demandto one month
One tothree
months
Three months to
one year
More than
one year Adjustment(4) Total
2012Undiscounted assets
Cash and cash equivalents – sovereigns 5 385 223 – – – – 385 223
Cash and cash equivalents – banks 5 4 152 999 15 274 – – – 4 168 273
Money markets unit trusts 5 909 – – – – 909
Investments at fair value through profit or loss – sovereigns 6 48 290 75 000 1 127 060 – – 1 250 350
Loans and advances to clients – retail personal 7 1 504 581 2 052 357 7 650 217 17 724 937 (492 071) 28 440 021
Loans and advances to clients – retail other 7 802 – – – – 802
Loans and advances to clients – corporate other 7 14 438 – – 23 781 – 38 219
Other receivables 9 28 733 – – 2 156 – 30 889
Current income tax assets – – 62 331 – – 62 331
Undiscounted assets 6 135 975 2 142 631 8 839 608 17 750 874 (492 071) 34 377 017
Adjustments for undiscounted assets (417 208) (869 345) (3 236 192) (5 602 742) – (10 125 487)
Discounted assets
Loan impairment provision 7 (130 479) (237 420) (493 418) (683 929) – (1 545 246)
Total discounted assets 5 588 288 1 035 866 5 109 998 11 464 203 (492 071) 22 706 284
Undiscounted liabilities
Loans and deposits at amortised cost 14 6 916 087 1 015 697 4 350 825 8 264 777 – 20 547 386
Trade and other payables 15 277 809 116 671 99 259 145 849 78 997 718 585
Current income tax liabilities – 885 – – – 885
Provisions 16 – – – 24 998 – 24 998
Undiscounted liabilities 7 193 896 1 133 253 4 450 084 8 435 624 78 997 21 291 854
Adjustments for undiscounted liabilities to depositors (4 697) (82 745) (418 893) (2 349 025) – (2 855 360)
Total discounted liabilities 7 189 199 1 050 508 4 031 191 6 086 599 78 997 18 436 494
Net liquidity (shortfall)/excess(2) (1 600 911) (14 642) 1 078 807 5 377 604 (571 068) 4 269 790
Cumulative liquidity (shortfall)/excess (1 600 911) (1 615 553) (536 746) 4 840 858 4 269 790 4 269 790
(1) The contractual maturity of the financial assets and liabilities of the company are all on demand to one month.(2) Much of the liquidity shortfall in the demand to three-month categories results from the investment of excess cash in treasury bills
and SARB debentures with maturities in excess of three months. These instruments are highly liquid and can be converted into cash should the need arise.
(3) The definitions of sovereign, corporate and retail are aligned with the Banks Act Regulations.(4) The adjustments relate to deferred initiation fees, leave pay provision, deferred income and straight-lining of lease accruals.

Integrated Report 2013 145
28.6 Liquidity risk (continued)
Analysis of financial assets and liabilities (discounted cash flows) with maturities of more than one year
R’000 NoteMore than
one yearOne to
two yearsTwo to
three yearsThree to
four yearsFour to
five yearsFive to
ten yearsMore than ten years
2013Undiscounted assets
Loans and advances to clients – retail personal 7 37 720 055 12 768 272 10 254 981 7 330 388 4 432 740 2 932 877 797
Other receivables 9 7 347 1 620 3 643 1 926 – 158 –
Undiscounted assets 37 727 402 12 769 892 10 258 624 7 332 314 4 432 740 2 933 035 797
Adjustments for undiscounted assets
(14 258 931) (6 010 706) (4 107 191) (2 436 652) (1 184 911) (519 471) –
Discounted assets
Loan impairment provision 7 (2 091 215) (694 161) (551 073) (398 008) (258 847) (189 126) –
Total discounted assets 21 377 256 6 065 025 5 600 360 4 497 654 2 988 982 2 224 438 797
Undiscounted liabilities
Loans and deposits at amortised cost 14 16 875 837 3 009 637 4 224 363 3 604 250 2 371 649 3 601 330 64 608
Trade and other payables 15 132 927 85 558 15 383 1 024 745 30 217 –
Provisions 16 28 449 19 151 9 298 – – – –
Undiscounted liabilities 17 037 213 3 114 346 4 249 044 3 605 274 2 372 394 3 631 547 64 608
Adjustments for undiscounted liabilities to depositors (4 034 835) (941 861) (866 683) (875 716) (647 507) (693 102) (9 966)
Total discounted liabilities 13 002 378 2 172 485 3 382 361 2 729 558 1 724 887 2 938 445 54 642
Net liquidity excess/(shortfall) 8 374 878 3 892 540 2 217 999 1 768 096 1 264 095 (714 007) (53 845)
Cumulative liquidity excess/(shortfall) 7 909 378 11 801 918 14 019 917 15 788 013 17 052 108 16 338 101 16 284 256

146 Capitec Bank Holdings Limited
Common Equity Tier 1 (CET1)
Ordinary share capital 5 330 710 2 926 435 5 801 143 3 380 895
Accumulated profit 2 939 240 2 001 866 2 243 936 1 210 468
8 269 950 4 928 301 8 045 079 4 591 363
Regulatory adjustments
Intangible assets in terms of IFRS (136 380) (69 258) (136 380) (69 258)
Specified advances (137) (28 063) (137) (28 063)
Unappropriated profit (128 561) (275 094) (128 561) (275 094)
Total CET1 8 004 872 4 555 886 7 780 001 4 218 748
Additional Tier 1 capital (AT1)
Issued preference share capital 258 969 258 969 258 969 258 969
Phase out – non-loss absorbent(1) (25 897) – (25 897) –
Total AT1 233 072 258 969 233 072 258 969
Total Tier 1 capital (T1) 8 237 944 4 814 855 8 013 073 4 477 917
Tier 2 capital (T2)
Issued subordinated debt 2 891 000 1 069 000 2 891 000 1 069 000
Phase out – non-loss absorbent(1) (289 100) – (289 100) –
Third-party capital issued by bank subsidiary(2) (179 585) – – –
Total subordinated debt 2 422 315 1 069 000 2 601 900 1 069 000
Unidentified impairments 295 582 175 987 295 582 175 987
Total Tier 2 capital (T2) 2 717 897 1 244 987 2 897 482 1 244 987
Total qualifying regulatory capital 10 955 841 6 059 842 10 910 555 5 722 904
28.7 CapitalmanagementThe group’s principal objectives when managing capital are to:• address the expectations of its shareholders, and optimise business activities to ensure return on capital targets
are achieved through efficient capital management;• ensure that the group and bank hold sufficient risk capital. Risk capital caters for unexpected losses that may arise,
protects shareholders and depositors and thereby assures the sustainability of the bank through the business cycle; and
• comply with the capital supervisory requirements of the South African Reserve Bank (SARB) as codified in the Banks Act 1990 (as amended) and related regulations.
The group conducts a Capitec internal capital adequacy assessment process (CICAAP) on an ongoing basis, which drives the group’s position on capital management matters. The CICAAP reviews the historic, current and future capital positioning of the group, both from an internal and regulatory capital perspective.
The table below summarises the composition of regulatory capital for the group and the bank:
GROUP BANK
R’000 2013 2012 2013 2012
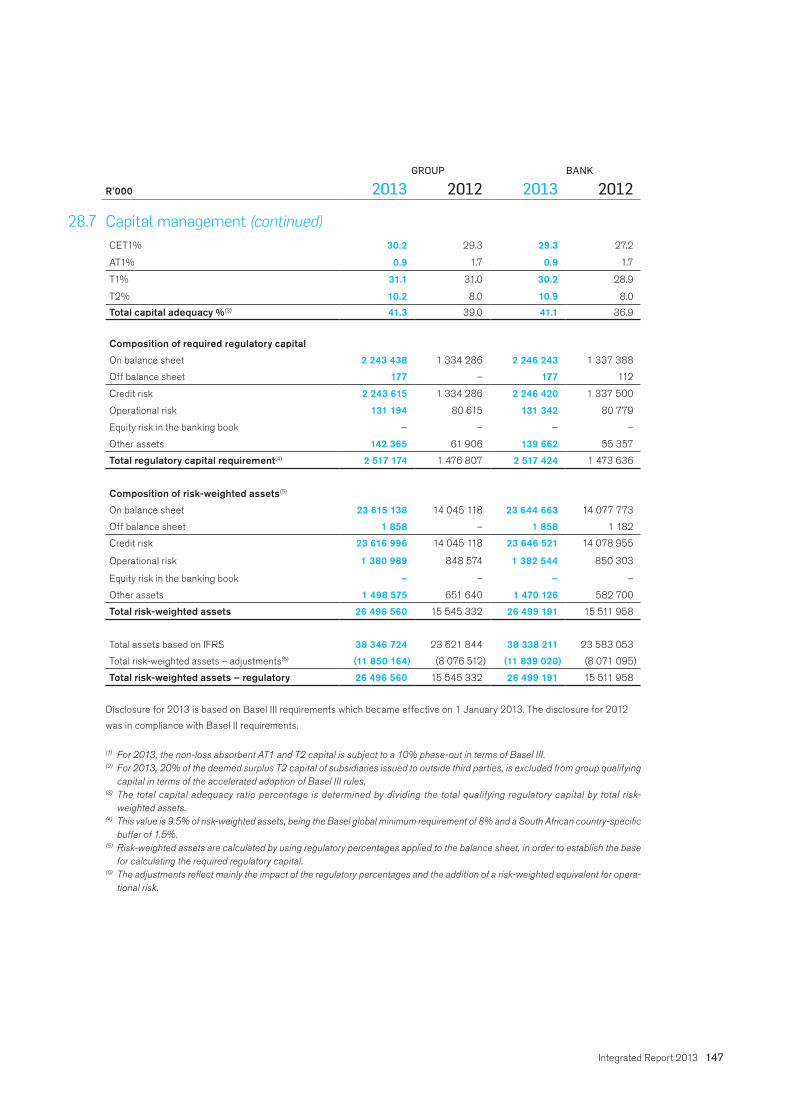
Integrated Report 2013 147
CET1% 30.2 29.3 29.3 27.2
AT1% 0.9 1.7 0.9 1.7
T1% 31.1 31.0 30.2 28.9
T2% 10.2 8.0 10.9 8.0
Total capital adequacy % (3) 41.3 39.0 41.1 36.9
Composition of required regulatory capital
On balance sheet 2 243 438 1 334 286 2 246 243 1 337 388
Off balance sheet 177 – 177 112
Credit risk 2 243 615 1 334 286 2 246 420 1 337 500
Operational risk 131 194 80 615 131 342 80 779
Equity risk in the banking book – – – –
Other assets 142 365 61 906 139 662 55 357
Total regulatory capital requirement(4) 2 517 174 1 476 807 2 517 424 1 473 636
Composition of risk-weighted assets(5)
On balance sheet 23 615 138 14 045 118 23 644 663 14 077 773
Off balance sheet 1 858 – 1 858 1 182
Credit risk 23 616 996 14 045 118 23 646 521 14 078 955
Operational risk 1 380 989 848 574 1 382 544 850 303
Equity risk in the banking book – – – –
Other assets 1 498 575 651 640 1 470 126 582 700
Total risk-weighted assets 26 496 560 15 545 332 26 499 191 15 511 958
Total assets based on IFRS 38 346 724 23 621 844 38 338 211 23 583 053
Total risk-weighted assets – adjustments(6) (11 850 164) (8 076 512) (11 839 020) (8 071 095)
Total risk-weighted assets – regulatory 26 496 560 15 545 332 26 499 191 15 511 958
Disclosure for 2013 is based on Basel III requirements which became effective on 1 January 2013. The disclosure for 2012
was in compliance with Basel II requirements.
(1) For 2013, the non-loss absorbent AT1 and T2 capital is subject to a 10% phase-out in terms of Basel III.(2) For 2013, 20% of the deemed surplus T2 capital of subsidiaries issued to outside third parties, is excluded from group qualifying
capital in terms of the accelerated adoption of Basel III rules.(3) The total capital adequacy ratio percentage is determined by dividing the total qualifying regulatory capital by total risk-
weighted assets.(4) This value is 9.5% of risk-weighted assets, being the Basel global minimum requirement of 8% and a South African country-specific
buffer of 1.5%.(5) Risk-weighted assets are calculated by using regulatory percentages applied to the balance sheet, in order to establish the base
for calculating the required regulatory capital.(6) The adjustments reflect mainly the impact of the regulatory percentages and the addition of a risk-weighted equivalent for opera-
tional risk.
GROUP BANK
R’000 2013 2012 2013 2012
28.7 Capitalmanagement(continued)

148 Capitec Bank Holdings Limited
28.8 Gainsandlossespercategoryoffinancialassetsandfinancialliabilities
R’000 Notes
Heldfor
trading
Designated
at fair value
Loans and receivables
Financial liabilities at
amortised cost Total
2013Interest income 19 – 73 000 7 011 752 – 7 084 752
Interest expense 19 (189) – – (1 662 324) (1 662 513)
Loan fee income – – 1 496 009 – 1 496 009
Loan fee expense – 12 716 (355 925) – (343 209)
Transaction fee income – – – 2 100 594 2 100 594
Transaction fee expense – – – (751 768) (751 768)
Dividend income 20 – 9 – – 9
Net impairment on loans and advancesto clients 21 – – (2 658 923) – (2 658 923)
Net movement in financial instruments held at fair value through profit or loss 22 – (298) – – (298)
2012Interest income 19 – 49 071 4 297 831 – 4 346 902
Interest expense 19 (17) – – (1 022 357) (1 022 374)
Loan fee income – – 1 657 018 – 1 657 018
Loan fee expense – 33 820 (220 180) – (186 360)
Transaction fee income – – – 1 360 308 1 360 308
Transaction fee expense – – – (524 202) (524 202)
Dividend income 20 – 1 532 – – 1 532
Net impairment on loans and advancesto clients 21 – – (1 604 190) – (1 604 190)
Net movement in financial instruments held at fair value through profit or loss 22 – 12 070 – – 12 070

Integrated Report 2013 149
28.9 Classificationoffinancialassetsandfinancialliabilities
R’000 Notes
Heldfor
tradingHeld at
fair value
Loansand
receiv-ables
Availablefor sale
Financial liabilities at
amortised cost Total
Fairvalue
2013Financial assets
Cash and cash
equivalents 5 – – 7 143 092 – – 7 143 092 7 143 092
Investments at fair value
through profit or loss(1) 6 – 2 022 906 – – – 2 022 906 2 022 906
Loans and advances
to clients 7 – – 27 934 854 – – 27 934 854 28 486 249
Other receivables 9 – 3 394 81 367 – – 84 761 84 347
Financial liabilities
Loans and deposits at
amortised cost 14 – – – – 29 000 191 29 000 191 29 244 981
Trade and other
payables(2) 15 – 25 637 – – 733 446 759 083 758 556
Provisions 16 – – – – 28 449 28 449 28 449
2012Financial assets
Cash and cash
equivalents 5 – – 4 551 203 – – 4 551 203 4 551 203
Investments at fair value
through profit or loss(1) 6 – 1 198 833 – – – 1 198 833 1 198 833
Loans and advances
to clients 7 – – 16 863 028 – – 16 863 028 17 016 644
Other receivables 9 263 – 30 626 – – 30 889 30 418
Financial liabilities
Loans and deposits at
amortised cost 14 – – – – 17 692 062 17 692 062 17 818 558
Trade and other
payables(2) 15 – 3 321 – – 715 228 718 549 718 107
Provisions 16 – – – – 24 998 24 998 24 998
(1) Designated at fair value through profit or loss(2) Cash flow hedge
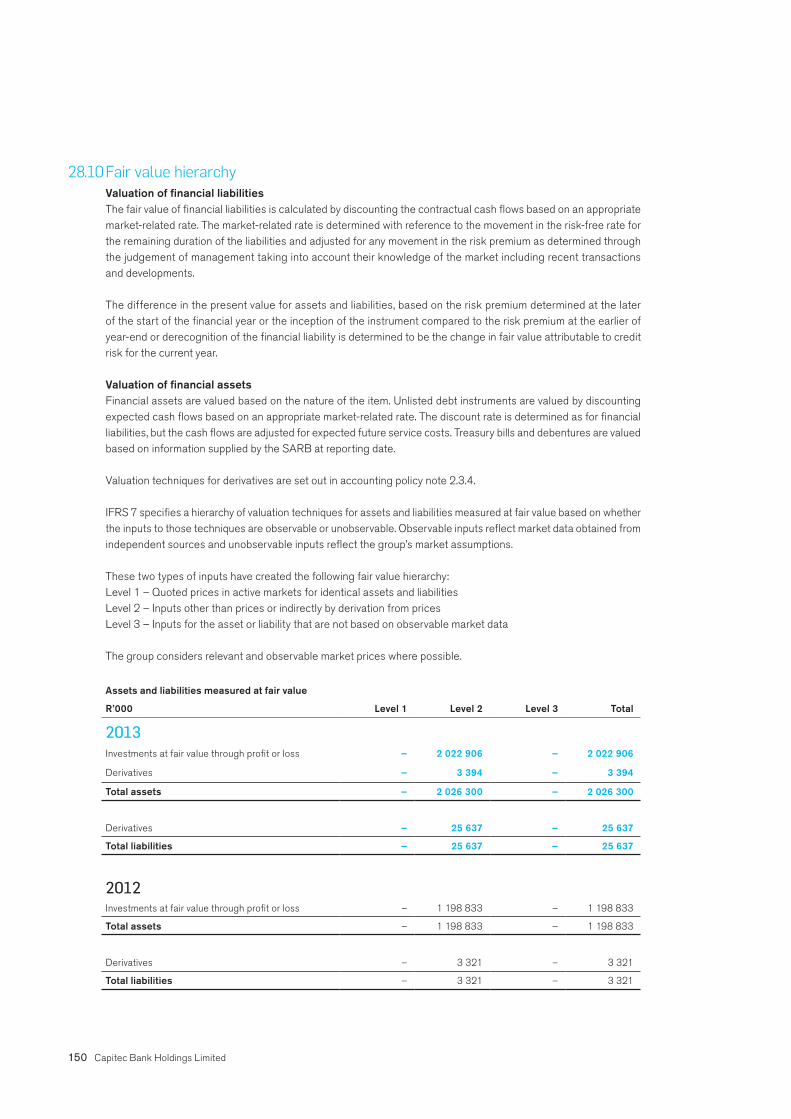
150 Capitec Bank Holdings Limited
28.10FairvaluehierarchyValuation of financial liabilitiesThe fair value of financial liabilities is calculated by discounting the contractual cash flows based on an appropriate market-related rate. The market-related rate is determined with reference to the movement in the risk-free rate for the remaining duration of the liabilities and adjusted for any movement in the risk premium as determined through the judgement of management taking into account their knowledge of the market including recent transactions and developments.
The difference in the present value for assets and liabilities, based on the risk premium determined at the later of the start of the financial year or the inception of the instrument compared to the risk premium at the earlier of year-end or derecognition of the financial liability is determined to be the change in fair value attributable to credit risk for the current year.
Valuation of financial assetsFinancial assets are valued based on the nature of the item. Unlisted debt instruments are valued by discounting expected cash flows based on an appropriate market-related rate. The discount rate is determined as for financial liabilities, but the cash flows are adjusted for expected future service costs. Treasury bills and debentures are valued based on information supplied by the SARB at reporting date.
Valuation techniques for derivatives are set out in accounting policy note 2.3.4.
IFRS 7 specifies a hierarchy of valuation techniques for assets and liabilities measured at fair value based on whether the inputs to those techniques are observable or unobservable. Observable inputs reflect market data obtained from independent sources and unobservable inputs reflect the group’s market assumptions.
These two types of inputs have created the following fair value hierarchy: Level 1 – Quoted prices in active markets for identical assets and liabilitiesLevel 2 – Inputs other than prices or indirectly by derivation from pricesLevel 3 – Inputs for the asset or liability that are not based on observable market data
The group considers relevant and observable market prices where possible.
Assets and liabilities measured at fair value
R’000 Level 1 Level 2 Level 3 Total
2013Investments at fair value through profit or loss – 2 022 906 – 2 022 906
Derivatives – 3 394 – 3 394
Total assets – 2 026 300 – 2 026 300
Derivatives – 25 637 – 25 637
Total liabilities – 25 637 – 25 637
2012Investments at fair value through profit or loss – 1 198 833 – 1 198 833
Total assets – 1 198 833 – 1 198 833
Derivatives – 3 321 – 3 321
Total liabilities – 3 321 – 3 321

Integrated Report 2013 151
GROUP COMPANY
R’000 2013 2012 2013 2012
29. Retirement benefitsThe group contributed on behalf of all employees
who elected to be members of the provident fund.
The provident fund, a defined-contribution fund, is
administered independently of the group and is subject
to the Pension Funds Act, 1956 (Act 24 of 1956). The
amount contributed is included in salaries and wages
as per note 23. 74 786 57 272 – –
Since 1 July 2001 it is compulsory for all new
appointments to be members of the provident fund. The
group will continue to contribute to the fund on behalf
of all members. The group has no exposure in respect
of any post-retirement benefits payable.
30. Related-party transactionsSubsidiaries
Dividends
Ordinary dividend received – – 467 460 317 939
Preference dividend received – – 20 783 19 419
Capitec Bank Limited – – 488 243 337 358
Management fees received – Capitec Bank
Limited – – 730 932
Investments in subsidiaries are disclosed in note 10.
Loans due (to)/from:
Capitec Bank Limited – – 1 572 16 351
Keymatrix (Pty) Limited – – (1) (1)
Guarantees(1)
Key Distributors (Pty) Limited received a guarantee
from fellow subsidiary, Capitec Bank Limited.
Amount of creditors guarantees 1 000 4 400
Guaranteed creditors balances outstanding(1) 1 000 2 363
Guarantee fee (market-related) 81 71
Suretyships
Suretyship in favour of a financial institution in respect
of operating facilities of Capitec Bank Limited with
a maximum exposure of 8 403 5 614 Suretyship in favour of a financial institution with which
Key Distributors (Pty) Limited has a mortgage bond – 600
Parties with significant influence
Brokers’ fees 45 46 – –
Sponsor fees 71 72 71 72
Commitment fees 27 418 – 27 418 –
PSG Group and subsidiaries(2) 27 534 118 27 489 72

152 Capitec Bank Holdings Limited
30. Related-party transactions(continued)Key management employee’s remuneration
Salaries and other short-term benefits 22 986 22 439 – –
Post-employment benefits 1 690 1 568 – –
Share-based payments 36 711 47 420 – –
Key management compensation paid by
subsidiaries(3) 61 387 71 427 – –
Loans and advances to directors and other key
management employees advanced by subsidiaries
and included in loans and advances to clients in
respect of the share option scheme
Loans outstanding at the beginning of the year 4 144 5 714 – –
Loans advanced during the year 1 264 3 431 – –
Interest charged on loans during the year 225 514 – –
Loan repayments during the year (3 383) (5 515) – –
Loans outstanding at the end of the year 2 250 4 144 – –
Retail deposits from directors and other key
management employees(4)
Deposits at the beginning of the year 4 960 3 174 – –
Interest earned during the year 334 231 – –
Deposits made during the year 6 282 1 555 – –
Deposits at the end of the year 11 576 4 960 – –
Directors’ interest in contractsAll directors of Capitec Bank Holdings Limited have given notice that they did not have a material interest in any significant contract with the company or any of its subsidiaries, which could have given rise to a conflict of interest during the year.
(1) Key Distributors’ creditors were included in the group balance sheet on consolidation in 2012. (2) PSG Capital is the corporate advisor and sponsor of the group. Transactions requiring the purchase of financial instruments on
the open market are conducted through a number of intermediaries.(3) Key management are considered to be the members of the executive management committee, excluding development members.
Key management compensation excludes directors’ remuneration.(4) Savings and deposits are unsecured, carry variable interest rates and are repayable on demand.
GROUP COMPANY
R’000 2013 2012 2013 2012

Integrated Report 2013 153
30. Related-party transactions (continued)Directors’ interest in share capitalAt year-end, the directors held, in aggregate, directly or indirectly, beneficially or non-beneficially, interests in 19 015 681 (2012: 18 499 242) Capitec Bank Holdings Limited shares, equivalent to 16.60% (2012: 18.63%) of the issued share capital. The individual interests of the directors were as follows:
Number of shares held
Beneficial Non-beneficial
Ordinary shares Direct Indirect** Direct Indirect** Total shares %
2013AP du Plessis* 30 608 1 259 392 – – 1 290 000 1.13
MS du P le Roux (Chairman) – – – 14 836 699 14 836 699 12.96
RJ Huntley – – – 28 292 28 292 0.02
MJ Jooste(2) – – – – – 0.00
JD McKenzie(3) – – – – – 0.00
MC Mehl(5) 28 284 – – – 28 284 0.02
NS Mjoli-Mncube 125 400 – – – 125 400 0.11
PJ Mouton – 12 540 – – 12 540 0.01
CA Otto 1 064 – – 594 400 595 464 0.52
G Pretorius(4) – 48 482 – – 48 482 0.04
R Stassen* 2 539 – – 2 025 181 2 027 720 1.77
JP van der Merwe 22 800 – – – 22 800 0.02
210 695 1 320 414 – 17 484 572 19 015 681 16.60
2012AP du Plessis* 55 202 1 173 151 – – 1 228 353 1.24
MS du P le Roux (Chairman) – – – 14 367 841 14 367 841 14.47
RJ Huntley(1) – – – 28 200 28 200 0.03
MJ Jooste(2) – – – – – 0.00
MC Mehl 40 784 – – – 40 784 0.04
NS Mjoli-Mncube 110 000 – – – 110 000 0.11
PJ Mouton – 11 000 – – 11 000 0.01
CA Otto 1 064 – – 506 500 507 564 0.51
R Stassen* 137 819 – – 2 047 681 2 185 500 2.20
JP van der Merwe 20 000 – – – 20 000 0.02
364 869 1 184 151 – 16 950 222 18 499 242 18.63
* Executive** Includes shareholding through associates as defined in terms of the JSE Listings Requirements.(1) Appointed on 14 April 2011.(2) Appointed on 28 January 2011. Resigned 2 August 2012.(3) Appointed on 1 March 2012.(4) Appointed on 19 November 2012.(5) Deceased 30 January 2013.
2013 2012Preference shares Number of shares % Number of shares %
R Stassen (non-beneficial) 21 000 0.73 21 000 0.73
21 000 0.73 21 000 0.73
There has been no change in directors’ shareholding until the date of approval of the annual financial statements.
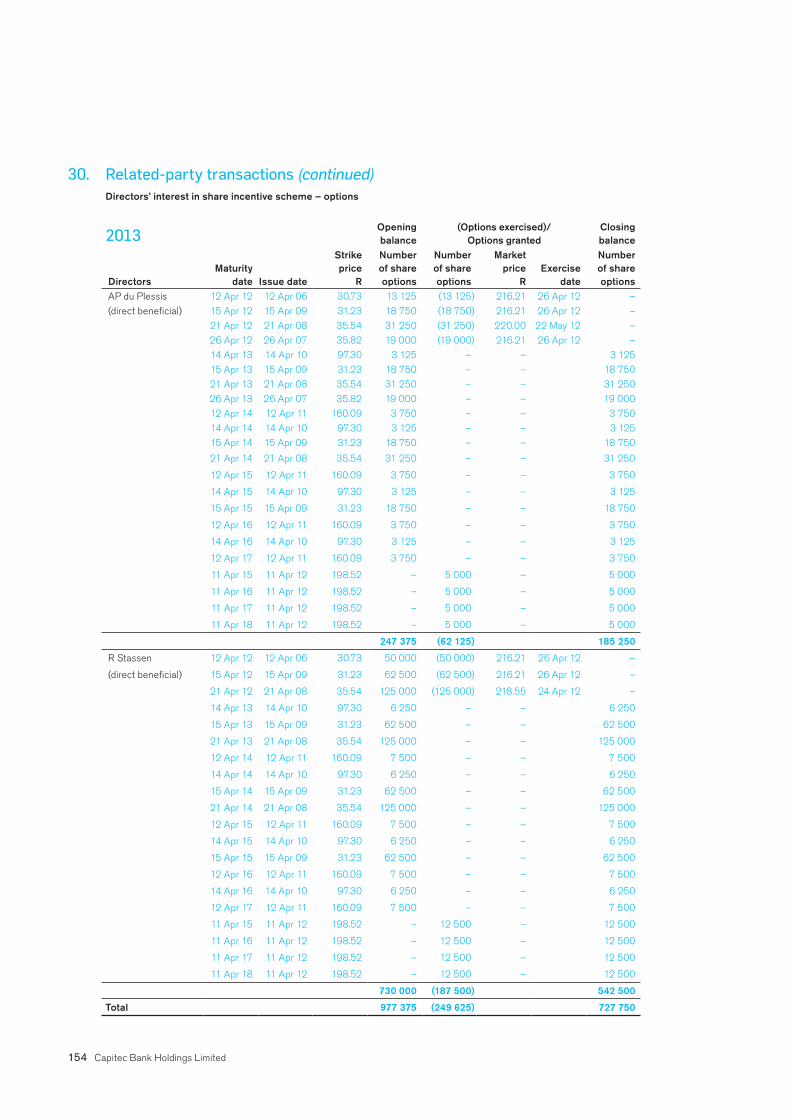
154 Capitec Bank Holdings Limited
30. Related-party transactions (continued)Directors’ interest in share incentive scheme – options
2013 Opening balance
(Options exercised)/Options granted
Closing balance
Directors Maturity
date Issue date
Strike price
R
Number of share options
Number of share options
Market price
RExercise
date
Number of share options
AP du Plessis 12 Apr 12 12 Apr 06 30.73 13 125 (13 125) 216.21 26 Apr 12 –
(direct beneficial) 15 Apr 12 15 Apr 09 31.23 18 750 (18 750) 216.21 26 Apr 12 –
21 Apr 12 21 Apr 08 35.54 31 250 (31 250) 220.00 22 May 12 –
26 Apr 12 26 Apr 07 35.82 19 000 (19 000) 216.21 26 Apr 12 –
14 Apr 13 14 Apr 10 97.30 3 125 – – 3 125
15 Apr 13 15 Apr 09 31.23 18 750 – – 18 750
21 Apr 13 21 Apr 08 35.54 31 250 – – 31 250
26 Apr 13 26 Apr 07 35.82 19 000 – – 19 000
12 Apr 14 12 Apr 11 160.09 3 750 – – 3 750
14 Apr 14 14 Apr 10 97.30 3 125 – – 3 125
15 Apr 14 15 Apr 09 31.23 18 750 – – 18 750
21 Apr 14 21 Apr 08 35.54 31 250 – – 31 250
12 Apr 15 12 Apr 11 160.09 3 750 – – 3 750
14 Apr 15 14 Apr 10 97.30 3 125 – – 3 125
15 Apr 15 15 Apr 09 31.23 18 750 – – 18 750
12 Apr 16 12 Apr 11 160.09 3 750 – – 3 750
14 Apr 16 14 Apr 10 97.30 3 125 – – 3 125
12 Apr 17 12 Apr 11 160.09 3 750 – – 3 750
11 Apr 15 11 Apr 12 198.52 – 5 000 – 5 000
11 Apr 16 11 Apr 12 198.52 – 5 000 – 5 000
11 Apr 17 11 Apr 12 198.52 – 5 000 – 5 000
11 Apr 18 11 Apr 12 198.52 – 5 000 – 5 000
247 375 (62 125) 185 250
R Stassen 12 Apr 12 12 Apr 06 30.73 50 000 (50 000) 216.21 26 Apr 12 –
(direct beneficial) 15 Apr 12 15 Apr 09 31.23 62 500 (62 500) 216.21 26 Apr 12 –
21 Apr 12 21 Apr 08 35.54 125 000 (125 000) 218.55 24 Apr 12 –
14 Apr 13 14 Apr 10 97.30 6 250 – – 6 250
15 Apr 13 15 Apr 09 31.23 62 500 – – 62 500
21 Apr 13 21 Apr 08 35.54 125 000 – – 125 000
12 Apr 14 12 Apr 11 160.09 7 500 – – 7 500
14 Apr 14 14 Apr 10 97.30 6 250 – – 6 250
15 Apr 14 15 Apr 09 31.23 62 500 – – 62 500
21 Apr 14 21 Apr 08 35.54 125 000 – – 125 000
12 Apr 15 12 Apr 11 160.09 7 500 – – 7 500
14 Apr 15 14 Apr 10 97.30 6 250 – – 6 250
15 Apr 15 15 Apr 09 31.23 62 500 – – 62 500
12 Apr 16 12 Apr 11 160.09 7 500 – – 7 500
14 Apr 16 14 Apr 10 97.30 6 250 – – 6 250
12 Apr 17 12 Apr 11 160.09 7 500 – – 7 500
11 Apr 15 11 Apr 12 198.52 – 12 500 – 12 500
11 Apr 16 11 Apr 12 198.52 – 12 500 – 12 500
11 Apr 17 11 Apr 12 198.52 – 12 500 – 12 500
11 Apr 18 11 Apr 12 198.52 – 12 500 – 12 500
730 000 (187 500) 542 500
Total 977 375 (249 625) 727 750

Integrated Report 2013 155
30. Related-party transactions (continued)Directors’ interest in share incentive scheme – share appreciation rights (SARs)
2013 Opening balance (SARs exercised)/SARs granted
Closing balance
Directors Maturity
dateIssue date
SARs exercise
price R
Number of SARs
Number of SARs
Market price
RExercise
dateNumber of SARs
AP du Plessis 15 Apr 12 15 Apr 09 31.23 18 750 (18 750) 232.00 23 Apr 12 –
(direct beneficial) 21 Apr 12 21 Apr 08 35.54 31 250 (31 250) 232.00 23 Apr 12 –
14 Apr 13 14 Apr 10 97.30 3 125 – – 3 125
15 Apr 13 15 Apr 09 31.23 18 750 – – 18 750
21 Apr 13 21 Apr 08 35.54 31 250 – – 31 250
12 Apr 14 12 Apr 11 160.09 3 750 – – 3 750
14 Apr 14 14 Apr 10 97.30 3 125 – – 3 125
15 Apr 14 15 Apr 09 31.23 18 750 – – 18 750
21 Apr 14 21 Apr 08 35.54 31 250 – – 31 250
12 Apr 15 12 Apr 11 160.09 3 750 – – 3 750
14 Apr 15 14 Apr 10 97.30 3 125 – – 3 125
15 Apr 15 15 Apr 09 31.23 18 750 – – 18 750
12 Apr 16 12 Apr 11 160.09 3 750 – – 3 750
14 Apr 16 14 Apr 10 97.30 3 125 – – 3 125
12 Apr 17 12 Apr 11 160.09 3 750 – – 3 750
11 Apr 15 11 Apr 12 198.52 – 5 000 – 5 000
11 Apr 16 11 Apr 12 198.52 – 5 000 – 5 000
11 Apr 17 11 Apr 12 198.52 – 5 000 – 5 000
11 Apr 18 11 Apr 12 198.52 – 5 000 – 5 000
196 250 (30 000) 166 250
R Stassen 15 Apr 12 15 Apr 09 31.23 62 500 (62 500) 218.85 19 Apr 12 –
(direct beneficial) 21 Apr 12 21 Apr 08 35.54 125 000 (125 000) 232.00 23 Apr 12 –
14 Apr 13 14 Apr 10 97.30 6 250 – – 6 250
15 Apr 13 15 Apr 09 31.23 62 500 – – 62 500
21 Apr 13 21 Apr 08 35.54 125 000 – – 125 000
12 Apr 14 12 Apr 11 160.09 7 500 – – 7 500
14 Apr 14 14 Apr 10 97.30 6 250 – – 6 250
15 Apr 14 15 Apr 09 31.23 62 500 – – 62 500
21 Apr 14 21 Apr 08 35.54 125 000 – – 125 000
12 Apr 15 12 Apr 11 160.09 7 500 – – 7 500
14 Apr 15 14 Apr 10 97.30 6 250 – – 6 250
15 Apr 15 15 Apr 09 31.23 62 500 – – 62 500
12 Apr 16 12 Apr 11 160.09 7 500 – – 7 500
14 Apr 16 14 Apr 10 97.30 6 250 – – 6 250
12 Apr 17 12 Apr 11 160.09 7 500 – – 7 500
11 Apr 15 11 Apr 12 198.52 – 12 500 – 12 500
11 Apr 16 11 Apr 12 198.52 – 12 500 – 12 500
11 Apr 17 11 Apr 12 198.52 – 12 500 – 12 500
11 Apr 18 11 Apr 12 198.52 – 12 500 – 12 500
680 000 (137 500) 542 500
Total 876 250 (167 500) 708 750

156 Capitec Bank Holdings Limited
30. Related-party transactions (continued)Directors’ remunerationThe total share option expense relating to directors amounted to R3 606 924 (2012: R4 482 281) and share appreciation rights expense amounted to R35 092 255 (2012: R46 288 285). This expense includes the movement on all tranches.
R’000 Salaries
Fringe
benefits Bonuses Fees Total
Fair value of options and
rights granted during the year
on reporting date
2013Executive(1)
AP du Plessis 4 542 54 383 – 4 979 250
R Stassen 9 605 338 856 – 10 799 624
Non-executive
MS du P le Roux (Chairman) – – – 1 040 1 040 –
RJ Huntley – – – 241 241 –
MJ Jooste(2) – – – 102 102 –
JD McKenzie – – – 281 281 –
MC Mehl(3) – – – 341 341 –
NS Mjoli-Mncube – – – 281 281 –
PJ Mouton – – – 446 446 –
CA Otto – – – 428 428 –
G Pretorius(4) – – – 60 60 –
JP van der Merwe – – – 428 428 –
14 147 392 1 239 3 648 19 426 874
2012Executive(1)
AP du Plessis 4 172 151 593 – 4 916 269
R Stassen 8 872 324 1 323 – 10 519 538
Non-executive
MS du P le Roux (Chairman) – – – 1 040 1 040
RJ Huntley – – – 116 116
MJ Jooste(2) – – – 150 150
MC Mehl – – – 348 348
NS Mjoli-Mncube – – – 202 202
PJ Mouton – – – 238 238
JG Solms – – – 63 63
CA Otto – – – 348 348
JP van der Merwe – – – 348 348
13 044 475 1 916 2 853 18 288 807
(1) The executive directors are the prescribed officers of the company.(2) Director’s fees paid to Steinhoff International Holdings Limited. Resigned 2 August 2012.(3) Deceased 30 January 2013.(4) Appointed 19 November 2012.

Integrated Report 2013 157
Net profit before tax 2 277 276 1 557 872 491 564 337 358
Adjusted for non-cash items:
Fair value adjustments on financial assets 298 (12 070) – –
Loan impairment charge 1 177 568 700 520 – –
Depreciation 196 108 145 598 – –
Amortisation 51 070 27 920 – –
Movements in provisions 3 451 10 595 – –
Share-based employee costs – options 9 037 11 778 – –
Share-based employee costs – share
appreciation rights (28 934) 62 627 – –
(Profit)/loss on disposal of assets (339) 3 644 – –
Receivables at fair value through profit or loss – 4 662 – –
Movements in current assets and liabilities:
Loans and advances to clients (12 249 394) (7 492 082) (2 267) –
Inventory(1) 12 049 (11 232) – –
Other receivables (83 073) (14 230) (586) (302)
Deposits 11 308 129 7 242 179 – –
Trade and other payables(2) 79 162 168 599 6 (18)
Cash flow from operations 2 752 408 2 406 380 488 717 337 038
(1) Net of R30.0 million on disposal of subsidiary.(2) Net of R25.0 million on disposal of subsidiary.
32. Income taxes paidBalance at the beginning of the year (61 446) 35 033 – –
Income statement charge 672 862 463 532 275 –
Movement in deferred tax 31 408 185 941 – –
Tax effect on settlement of share options taken to equity (18 571) (142 886) – –
Balance at the end of the year (46 007) 61 446 – –
Income tax paid 578 246 603 066 275 –
33. Dividends paidBalance at the beginning of the year 10 273 10 485 10 273 10 485
Dividend declared during the year:
Ordinary dividend 467 460 317 939 467 460 317 939
Preference dividend 20 783 19 419 20 783 19 419
Balance at the end of the year (11 259) (10 273) (11 259) (10 273)
Dividends paid 487 257 337 570 487 257 337 570
34. Realised loss on settlement of employee share options less participants’ contributions
1 112 685 (2012: 1 249 576) ordinary shares issued (244 422) (220 505) – –
Shares acquired – (702) – –
Fair value of shares utilised to settle share options (244 422) (221 207) – –
Proceeds on settlement of options 37 850 35 091 – –
(206 572) (186 116) – –
GROUP COMPANY
R’000 2013 2012 2013 201231. Cash flow from operations

158 Capitec Bank Holdings Limited
Property operating lease commitments
The future aggregate minimum lease payments under non-cancellable leases are as follows:
Within one year 206 681 167 995 – –
From one to five years 591 547 470 288 – –
After five years 170 639 99 694 – –
Total future cash flows 968 867 737 977 – –
Straight-lining accrued (46 432) (35 749) – –
Future expenses 922 435 702 228 – –
Other operating lease commitments
Within one year 2 207 2 253 – –
From one to five years 3 490 5 083 – –
5 697 7 336 – –
Capital commitments – approved by the board
Contracted for
Property and equipment 42 645 85 195 – –
Intangible assets 13 119 6 744 – –
Not contracted for
Property and equipment 524 971 458 247 – –
Intangible assets 169 438 122 329 – –
750 173 672 515 – –
Refer note 30 for details of guarantees and suretyships.
On 22 February 2013, a notice was received from the National Credit Regulator, alleging contraventions of the National Credit Act 34 of 2005, including in relation to initiation fees charged on one product. It is not practicable to estimate its financial effect or the amount of any possible outflow. The bank has investigated the allegations and has taken legal advice, and believes the matter will be satisfactorily resolved through due process.
36. Borrowing powersIn terms of the articles of association of Capitec Bank Holdings Limited, the directors may at their discretion raise or borrow money for the purpose of the business of the company without limitation. These borrowing powers are subject to the limitations of the Banks Act, 1990 (Act 94 of 1990) and section 45(3)(a)(ii) of the Companies Act, 2008. A special resolution was passed at the annual general meeting on 1 June 2012 authorising the board to approve that the company provides any financial assistance that it deems fit to any related or interrelated company, on the terms and conditions and for the amount that the board may determine.
The increase in borrowings from the previous year is for the purposes of funding the general banking business, including future expansion of the loan book and capital expenditure.
37. Share incentive schemeThe share incentive scheme is authorised and adopted by the shareholders of Capitec Bank Holdings Limited (CBHL). The trustees act in terms of the powers bestowed on them by the trust deed and receive instructions from time to time from the boards of CBHL and the bank. The bank provides the finance required from time to time by the trustees to perform their duties. Service costs of options issued to employees of subsidiaries of CBHL are financed by the relevant subsidiary.
GROUP COMPANY
R’000 2013 2012 2013 201235. Commitments and contingent liabilities

Integrated Report 2013 159
37. Share incentive scheme (continued)The bank allows its employees to purchase shares in Capitec Bank Holdings Limited up to a value not exceeding 20% (2012: 20%) of their monthly salary.
The purchase price includes a subsidy of 20% (2012: 20%) and the transaction costs are borne by the company.
The shares are held by the trustees on behalf of the participants for as long as required to save the holding expenses of a broker account for participants.
The bank offers share options in Capitec Bank Holdings Limited to members of management who are able to make significant contributions to the achievement of the bank’s objectives. Options are conditional on the employee completing the vesting period applicable to each group of options issued to that employee.
The share incentive scheme prescribes that European type options, with durations ranging from three to six years, should be allocated at the market value, determined as the weighted average price per share over a period of 30 trading days on the JSE Limited prior to the date of allocation.
Number 2013 2012Options issued to employees of Capitec Bank Limited
Balance at the beginning of the year 3 086 893 4 221 594
Options granted 204 853 138 000
Options cancelled and/or lapsed (6 250) (19 375)
Options exercised (1 108 671) (1 253 326)
Balance at the end of the year 2 176 825 3 086 893
2013 2012
Analysis of outstanding share options by year of maturity
Weighted average strike
priceR Number
Weighted average strike
priceR Number
Financial year
2012/2013 – – 34.14 1 088 671
2013/2014 38.11 860 290 44.93 869 352
2014/2015 44.71 696 146 69.35 708 020
2015/2016 77.23 353 612 98.14 306 151
2016/2017 153.91 130 153 130.59 80 193
2017/2018 182.81 85 408 160.09 34 506
2018/2019 197.98 51 216 – –
62.94 2 176 825 43.58 3 086 893
Number 2013 2012Shares purchased/issued during the year 1 112 685 1 253 326
Shares utilised for settlement of options (1 108 671) (1 253 326)
Shares available for settlement of options 4 014 –
Settled in shares (1 108 671) (1 253 326)
Options exercised (1 108 671) (1 253 326)
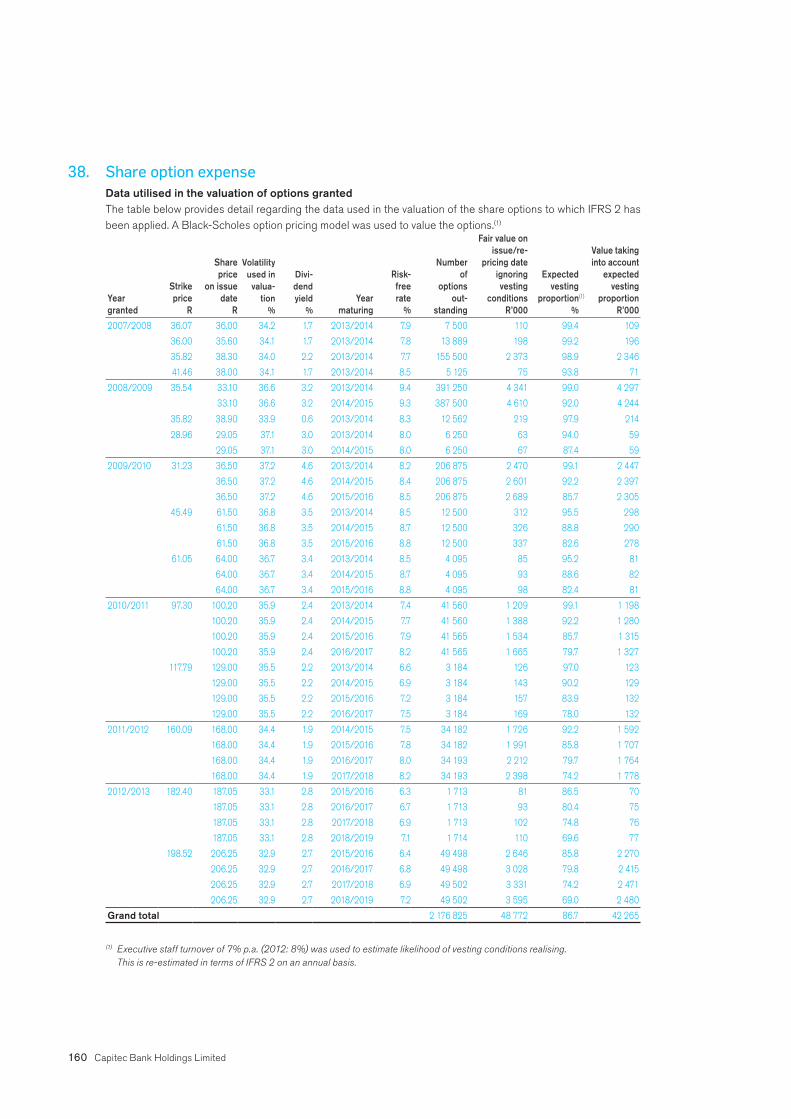
160 Capitec Bank Holdings Limited
38. Share option expenseData utilised in the valuation of options grantedThe table below provides detail regarding the data used in the valuation of the share options to which IFRS 2 has been applied. A Black-Scholes option pricing model was used to value the options.(1)
Year granted
Strike price
R
Share price
on issue date
R
Volatility used in valua-
tion %
Divi-dend yield
%Year
maturing
Risk-free rate
%
Numberof
optionsout-
standing
Fair value on issue/re-
pricing date ignoring vesting
conditions R’000
Expected vesting
proportion(1) %
Value taking into account
expected vesting
proportion R’000
2007/2008 36.07 36.00 34.2 1.7 2013/2014 7.9 7 500 110 99.4 109
36.00 35.60 34.1 1.7 2013/2014 7.8 13 889 198 99.2 196
35.82 38.30 34.0 2.2 2013/2014 7.7 155 500 2 373 98.9 2 346
41.46 38.00 34.1 1.7 2013/2014 8.5 5 125 75 93.8 71
2008/2009 35.54 33.10 36.6 3.2 2013/2014 9.4 391 250 4 341 99.0 4 297
33.10 36.6 3.2 2014/2015 9.3 387 500 4 610 92.0 4 244
35.82 38.90 33.9 0.6 2013/2014 8.3 12 562 219 97.9 214
28.96 29.05 37.1 3.0 2013/2014 8.0 6 250 63 94.0 59
29.05 37.1 3.0 2014/2015 8.0 6 250 67 87.4 59
2009/2010 31.23 36.50 37.2 4.6 2013/2014 8.2 206 875 2 470 99.1 2 447
36.50 37.2 4.6 2014/2015 8.4 206 875 2 601 92.2 2 397
36.50 37.2 4.6 2015/2016 8.5 206 875 2 689 85.7 2 305
45.49 61.50 36.8 3.5 2013/2014 8.5 12 500 312 95.5 298
61.50 36.8 3.5 2014/2015 8.7 12 500 326 88.8 290
61.50 36.8 3.5 2015/2016 8.8 12 500 337 82.6 278
61.05 64.00 36.7 3.4 2013/2014 8.5 4 095 85 95.2 81
64.00 36.7 3.4 2014/2015 8.7 4 095 93 88.6 82
64.00 36.7 3.4 2015/2016 8.8 4 095 98 82.4 81
2010/2011 97.30 100.20 35.9 2.4 2013/2014 7.4 41 560 1 209 99.1 1 198
100.20 35.9 2.4 2014/2015 7.7 41 560 1 388 92.2 1 280
100.20 35.9 2.4 2015/2016 7.9 41 565 1 534 85.7 1 315
100.20 35.9 2.4 2016/2017 8.2 41 565 1 665 79.7 1 327
117.79 129.00 35.5 2.2 2013/2014 6.6 3 184 126 97.0 123
129.00 35.5 2.2 2014/2015 6.9 3 184 143 90.2 129
129.00 35.5 2.2 2015/2016 7.2 3 184 157 83.9 132
129.00 35.5 2.2 2016/2017 7.5 3 184 169 78.0 132
2011/2012 160.09 168.00 34.4 1.9 2014/2015 7.5 34 182 1 726 92.2 1 592
168.00 34.4 1.9 2015/2016 7.8 34 182 1 991 85.8 1 707
168.00 34.4 1.9 2016/2017 8.0 34 193 2 212 79.7 1 764
168.00 34.4 1.9 2017/2018 8.2 34 193 2 398 74.2 1 778
2012/2013 182.40 187.05 33.1 2.8 2015/2016 6.3 1 713 81 86.5 70
187.05 33.1 2.8 2016/2017 6.7 1 713 93 80.4 75
187.05 33.1 2.8 2017/2018 6.9 1 713 102 74.8 76
187.05 33.1 2.8 2018/2019 7.1 1 714 110 69.6 77
198.52 206.25 32.9 2.7 2015/2016 6.4 49 498 2 646 85.8 2 270
206.25 32.9 2.7 2016/2017 6.8 49 498 3 028 79.8 2 415
206.25 32.9 2.7 2017/2018 6.9 49 502 3 331 74.2 2 471
206.25 32.9 2.7 2018/2019 7.2 49 502 3 595 69.0 2 480
Grand total 2 176 825 48 772 86.7 42 265
(1) Executive staff turnover of 7% p.a. (2012: 8%) was used to estimate likelihood of vesting conditions realising. This is re-estimated in terms of IFRS 2 on an annual basis.

Integrated Report 2013 161
39. Share appreciation rights Data utilised in the valuation of share appreciation rights granted The table below provides detail regarding the data used in the valuation of the share options to which IFRS 2
has been applied. Share appreciation rights are expected to vest and are re-estimated on an annual basis.(1)
Year granted
Strike price
Yearmaturing
Risk-freerate
%
Number of options
outstandingFair
valueR’000
Portion of term expired
%
Expected vesting
proportion(2)
%
Liabilityat year-end
R’000
2008/2009 28.96 2013/2014 5.0 6 250 966 83.0 94.0 753
2014/2015 5.1 6 250 935 69.1 87.4 565
35.54 2013/2014 5.1 391 250 59 373 97.2 99.0 57 089
2014/2015 5.0 387 500 56 906 81.0 92.0 42 412
2009/2010 31.23 2013/2014 5.1 206 875 32 297 96.9 99.1 30 995
2014/2015 5.0 206 875 31 240 77.5 92.2 22 310
2015/2016 5.2 206 875 30 238 64.6 85.7 16 738
45.49 2013/2014 5.0 12 500 1 746 84.1 95.5 1 401
2014/2015 5.1 12 500 1 692 67.3 88.8 1 010
2015/2016 5.3 12 500 1 642 56.0 82.6 760
61.05 2013/2014 5.0 4 095 510 83.2 95.2 404
2014/2015 5.1 4 095 495 66.5 88.6 292
2015/2016 5.3 4 095 483 55.5 82.4 221
2010/2011 97.30 2013/2014 5.1 41 560 3 760 95.9 99.1 3 573
2014/2015 5.0 41 560 3 695 71.9 92.2 2 450
2015/2016 5.2 41 565 3 684 57.6 85.7 1 818
2016/2017 5.5 41 565 3 697 47.9 79.7 1 413
117.79 2013/2014 5.1 3 184 223 85.9 97.0 186
2014/2015 5.1 3 184 227 64.5 90.2 132
2015/2016 5.3 3 184 235 51.6 83.9 102
2016/2017 5.5 3 184 242 43.0 78.0 81
2011/2012 160.09 2014/2015 5.0 34 182 1 363 62.8 92.2 789
2015/2016 5.2 34 182 1 610 47.1 85.8 650
2016/2017 5.5 34 193 1 798 37.7 79.7 540
2017/2018 5.7 34 193 1 949 31.4 74.2 454
2012/2013 182.40 2015/2016 5.2 1 713 62 33.2 86.5 18
2016/2017 5.5 1 713 73 24.9 80.4 15
2017/2018 5.7 1 713 82 19.9 74.8 12
2018/2019 6.0 1 714 90 16.6 69.6 10
198.52 2015/2016 5.2 49 498 1 519 29.5 85.8 384
2016/2017 5.5 49 498 1 862 22.1 79.8 328
2017/2018 5.7 49 502 2 141 17.7 74.2 281
2018/2019 6.0 49 502 2 375 14.7 69.0 242
Grand total 1 986 344 249 727 81.3 107.8 188 428
(1) All rights were valued using the Black-Scholes model and the following variables: Dividend yield 3.5% Volatility 32.2% Ex dividend share price (cents) 181.60 (2) Executive staff turnover of 7% p.a. (2012: 8%) was used to estimate likelihood of vesting conditions realising. A re-estimate in
terms of IFRS 2 will be done on an annual basis.

162 Capitec Bank Holdings Limited
40. Share appreciation rights: BEE consortiumThe Capitec Bank Group Employee Empowerment Trust is a 5% participant in the BEE consortium that purchased 10 million shares in the group in February 2007. Funding for the share purchase was mainly obtained from the Industrial Development Corporation.
During February 2008, a communication was sent out by Capitec Bank on behalf of the Trust to employees of the bank, informing them that each permanent employee, not participating in the share incentive scheme and employed at 29 February 2008, would benefit from cash disbursements, based on the cumulative increase in value of 200 Capitec Bank Holdings shares less funding costs, paid in increments of 25% over four years. The payments commenced in February 2010 and depended on continued employment by the group. The final payment to employ-ees was made in February 2013.
The agreement with employees constitutes a cash-settled equity-based compensation plan in terms of IFRS 2 and the trust is considered to be a subsidiary of the group.
41. Derivative financial instruments: economic hedgesNotional Fair values
R’000 amount Assets Liabilities
2013Forward foreign exchange contracts
NotionalamountsinZAR – – –
NotionalamountsinUSD – – –
2012Forward foreign exchange contracts
NotionalamountsinZAR 4 101 263 –
NotionalamountsinUSD 579 – –
Forward foreign exchange contracts represent commitments to purchase foreign currency, including undelivered spot transactions and were entered into to match corresponding expected future transactions to the amount of Nil (2012: R4.1 million).
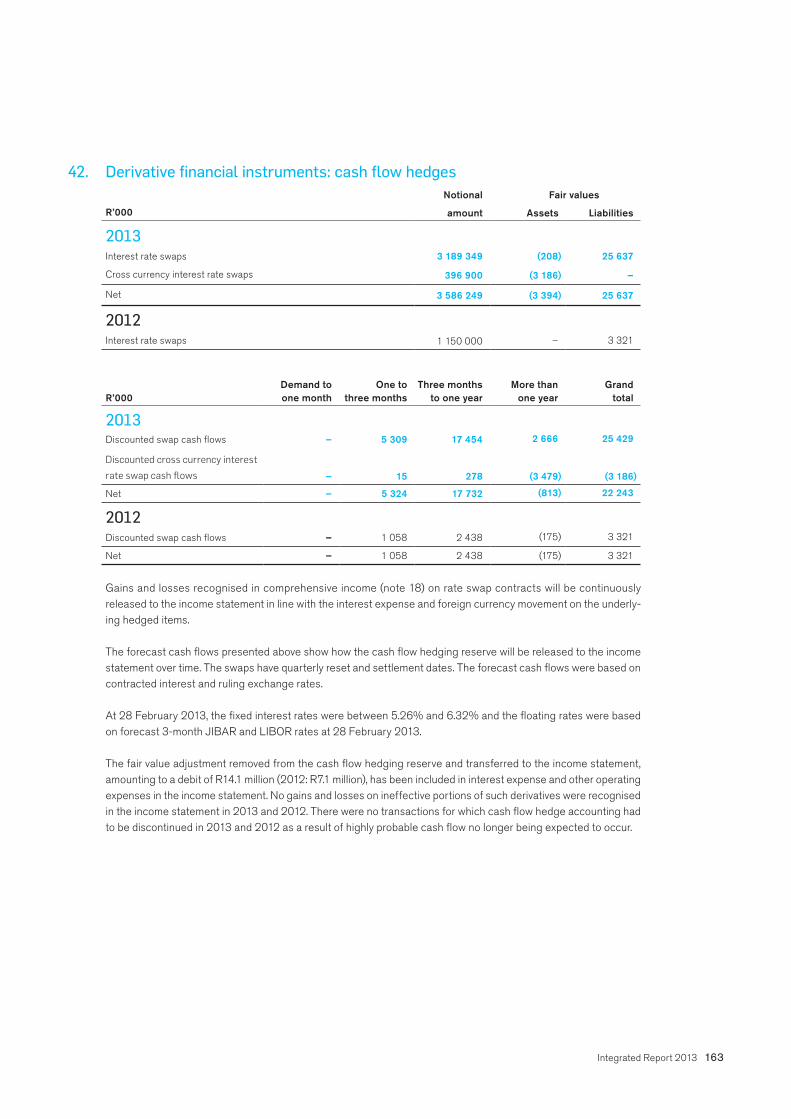
Integrated Report 2013 163
42. Derivative financial instruments: cash flow hedgesNotional Fair values
R’000 amount Assets(1) Liabilities
2013Interest rate swaps 3 189 349 (208) 25 637
Cross currency interest rate swaps 396 900 (3 186) –
Net 3 586 249 (3 394) 25 637
2012Interest rate swaps 1 150 000 – 3 321
R’000Demand toone month
One tothree months
Three monthsto one year
More thanone year
Grandtotal
2013Discounted swap cash flows – 5 309 17 454 2 666 25 429
Discountedcrosscurrencyinterest
rateswapcashflows – 15 278 (3 479) (3 186)
Net – 5 324 17 732 (813) 22 243
2012Discounted swap cash flows – 1 058 2 438 (175) 3 321
Net – 1 058 2 438 (175) 3 321
Gains and losses recognised in comprehensive income (note 18) on rate swap contracts will be continuously released to the income statement in line with the interest expense and foreign currency movement on the underly-ing hedged items.
The forecast cash flows presented above show how the cash flow hedging reserve will be released to the income statement over time. The swaps have quarterly reset and settlement dates. The forecast cash flows were based on contracted interest and ruling exchange rates.
At 28 February 2013, the fixed interest rates were between 5.26% and 6.32% and the floating rates were based on forecast 3-month JIBAR and LIBOR rates at 28 February 2013.
The fair value adjustment removed from the cash flow hedging reserve and transferred to the income statement, amounting to a debit of R14.1 million (2012: R7.1 million), has been included in interest expense and other operating expenses in the income statement. No gains and losses on ineffective portions of such derivatives were recognised in the income statement in 2013 and 2012. There were no transactions for which cash flow hedge accounting had to be discontinued in 2013 and 2012 as a result of highly probable cash flow no longer being expected to occur.

164 Capitec Bank Holdings Limited
43. Shareholders holding more than 5% of the company’s ordinary sharesShares held Shareholding
Year ended 28 February 2013 Number %
Shareholder
PSG Financial Services Limited 32 593 734 28.48
Limietberg Beleggings (Pty) Limited 9 000 000 7.86
Government Employee Pension Fund (excluding Isibaya Fund) 8 305 709 7.26
44. Black economic empowerment shareholdingShares held Shareholding
Year ended 28 February 2013 Number %
Shareholder
Isibaya Fund 5 284 735 4.62
Coral Lagoon Investments 194 (Pty) Limited 4 715 265 4.12
Thembeka Capital Limited 3 473 193 3.03
Nonhlanhla Mjoli-Mncube 125 400 0.11
13 598 593 11.88
45. Shareholding by executive management (1)
Shares held Shareholding
Year ended 28 February 2013 Number %
Shareholder
CG van Schalkwyk 862 530 0.75
CG Fischer 1 204 254 1.05
A Olivier 206 034 0.18
L Venter 403 339 0.35
C Oosthuizen 80 000 0.07
NST Motjuwadi – –
JE Carstens 23 958 0.02
GM Fourie 1 017 862 0.89
3 797 977 3.31
(1) Executive directors’ shareholdings are presented in the related parties note.
46. Material events after year-endNo event, which is material to the financial affairs of the group, has occurred between the reporting date and the date of approval of the financial statements.

Integrated Report 2013 165
Statutoryinformation
Analysis of shareholders holding ordinary shares Number of
shareholders
% of
total
Number
of shares
% of
interest
1 – 1 000 8 250 79.16 2 244 087 1.961 001 – 10 000 1 764 16.93 4 778 020 4.1810 001 – 100 000 317 3.04 9 765 466 8.53100 001 and over 91 0.87 97 654 146 85.33
10 422 100.00 114 441 719 100.00
Shareholder spreadPublic shareholders 10 399 99.78 62 832 304 54.90
Holdings less than 5% 10 398 99.77 54 526 595 47.64
Holdings of 5% or more 1 0.01 8 305 709 7.26Government Employee Pension Fund 1 0.01 8 305 709 7.26
Non-public shareholders excluding directors and their associates 1 0.01 32 593 734 28.48
There are no non-public shareholders (excluding directors and
their associates) holding less than 5% – – – –
Holdings of 5% or more 1 0.01 32 593 734 28.48PSG Financial Services Limited 1 0.01 32 593 734 28.48
Directors (refer page 153 for detail) 22 0.21 19 015 681 16.62
Directors of company or any subsidiaries 6 0.06 210 695 0.18Associates of directors of the company or any of its subsidiaries 16 0.15 18 804 986 16.44
10 422 100.00 114 441 719 100.00
Analysis of shareholders holding non-redeemable, non-cumulative, non-participating preference shares
Number of
shareholders
% of
total
Number
of shares
% of
interest
1 – 1 000 491 49.35 249 138 8.681 001 – 10 000 456 45.83 1 462 531 50.9810 001 – 100 000 47 4.72 1 037 038 36.15100 001 and over 1 0.10 120 307 4.19
995 100.00 2 869 014 100.00
Shareholder spreadPublic shareholders 994 99.90 2 848 014 99.27Holdings less than 5% 994 99.90 2 848 014 99.27There are no public shareholders holding more than 5%
Non-public shareholders excluding directors and/or
their associates – – – –There are no non-public shareholders other than the associate
of a director – – – –
Directors (refer page 153 for detail) 1 0.10 21 000 0.73None of the directors hold preference sharesAssociate of a director of the company or any of its subsidiaries 1 0.10 21 000 0.73
995 100.00 2 869 014 100.00

166 Capitec Bank Holdings Limited
Special resolutions ofa subsidiary
The following special resolutions were passed by Capitec Bank Limited (‘Capitec Bank’ or ‘the bank’) during the financial year under review:
1. Special resolution number 1 “Resolved, in terms of section 66(9) of the Act, and in accordance with special resolution 3.1 included in the 2012 notice
of the Capitec annual general meeting dealing with the directors’ fees proposed to the shareholders of Capitec, that subject to approval by the shareholders of Capitec, Capitec Bank pays the stated directors’ fees to the said boards of Capitec and Capitec Bank.”
2. Special resolution number 2 “Resolved that, in terms of section 36(2) of the Companies Act 2008 (Act 71 of 2008) and article 11.1.1 of the
memorandum of incorporation of the bank, the authorised share capital of the bank be and is hereby increased from R51 000 000 (fifty one million Rand) to R52 000 000 (fifty two million rand) by the creation of 100 000 000 (one hundred million) compulsorily convertible or written off non-redeemable, non-cumulative, non-participating preference shares of R0.01 (one cent) each, the terms and conditions of which are set out in Addendum I to the memorandum of incorporation of the bank, to be adopted in terms of special resolution number 4 below.”
3. Special resolution number 3 “Resolved that, in terms of section 36(2) of the Companies Act 2008 (Act 71 of 2008), section 56(1)(a) of the Banks
Act, 1990 (Act 94 of 1990) and subject to the passing of special resolution number 2, the memorandum of incorporation of the bank be and is hereby amended by the deletion of the entire paragraph 8(a) and the substitution thereof with the following new paragraph 8(a):
“8(a) Par value: The share capital of the bank is R52 000 000 (fifty two million rand) divided into:
1. 5 000 000 000 (five thousand million) ordinary shares with a par value of R0.01 (one cent) each; 2. 100 000 000 (one hundred million) non-redeemable, non-cumulative, non-participating preference shares of R0.01
(one cent) each; and 3. 100 000 000 (one hundred million) compulsorily convertible or written off non-redeemable non-cumulative non-
participating preference shares of R0.01 (one cent) each.”
4. Special resolution number 4 “Resolved that, subject to the passing and registration of special resolutions number 2 and 3 above, the bank’s memo-
randum of incorporation be and is hereby amended by inserting the following new Addendum I as follows:
Terms and conditions of the compulsorily convertible or written off non-redeemable non-cumulative non-participating preference shares the proceeds of which will rank as primary share capital under the Banks Act, 1990 and Additional Tier 1 Capital as contemplated in the Basel III Framework
1. General The following terms shall attach to the 100 000 000 compulsorily convertible or written off non-redeemable non-
cumulative non-participating preference shares of R0.01 each in the share capital of the bank: 1.1 For purposes of this Addendum 1 –
1.1.1 ‘Additional Tier 1 Capital’ has the meaning given to such expression in the Basel III Framework;
1.1.2 ‘Banks Act’ means the Banks Act, 1990
1.1.3 ‘Basel III Framework’ means the document entitled “Basel Committee on Banking Supervision – Basel III: A global regulatory framework for more resilient banks and banking systems – December 2010 (rev June 2011)” published by the Bank for International Settlements;
1.1.4 ‘Business day’ means any day other than a Saturday, Sunday or statutory public holiday in the Republic of South Africa;

Integrated Report 2013 167
1.1.5 ‘Capital Regulations’ means any legislation, regulations, requirements, guidelines and policies relating to capital adequacy in effect in South Africa in relation to banks registered under the Banks Act and licensed to conduct the business of a bank in South Africa (including, without limitation, any amendments made to the Banks Act pursuant to the Basel III Framework);
1.1.6 ‘Conversion’ means the conversion of the preference shares into Ordinary Conversion Shares in accordance with clause 3;
1.1.7 ‘Conversion Price’ means, in relation to each Ordinary Conversion Share, the volume weighted average price of one ordinary share of the bank for the 30 (thirty) Business Days ending on and including the Business Day preceding the Trigger Event Date, as published by the JSE.
1.1.8 ‘Deemed value’ means the deemed value of each preference share for purposes of calculating the preference dividend, being an amount determined by the directors at the time of allotment and issue of the first preference shares, notwithstanding the actual issue price of a preference share (that is the nominal value of the preference share plus a premium thereon) which may vary because of a difference in the premium at which the preference shares may be issued from time to time;
1.1.9 ‘Holder’ means the holder of preference share/s as recorded in the bank’s register of shareholders;
1.1.10 ‘Income Tax Act’ means the Income Tax Act, 1962 (Act 58 of 1962), as amended or substituted from time to time;
1.1.11 ‘Issue price’ means the actual issue price of each preference share, being the par value of a preference share plus the premium at which a preference share is allotted and issued;
1.1.12 ‘JSE’ means the JSE Limited (registration number 2005/022939/06), licensed as an exchange in terms of the Securities Services Act, 2004;
1.1.13 ‘Ordinary Conversion Shares’ means ordinary shares to be issued by the bank to a Holder pursuant to a Conversion and which ordinary shares will be fully paid up and will rank pari passu in all respects with the fully paid ordinary shares in issue on the Trigger Event Date;
1.1.14 ‘Preference dividend’ means a non-cumulative, non-participating, preference cash dividend calculated in accordance with this Addendum 1;
1.1.15 ‘Preference dividend calculation date’ means the last day of February and 31 August of each year;
1.1.16 ‘Preference dividend payment date’ means a date at least 5 (five) business days prior to the date on which the bank pays its ordinary dividend, if any, in respect of the same period, but in any event the preference dividend shall be payable not later than 120 (one hundred and twenty) business days after the last day of February and 31 August, respectively;
1.1.17 ‘Preference dividend rate’ means, subject to clause 1.2.7 below, a rate determined by the directors at the time of allotment and issue of the first preference shares, which will not exceed the prime rate;
1.1.18 ‘Preference shares’ means the compulsorily convertible or written off non-redeemable non-cumulative non-participating preference shares of R0.01 each in the share capital of the bank;
1.1.19 ‘Preference Share Amount’ means, in relation to one preference share, the issue price of that preference share;
1.1.20 ‘Primary Share Capital’ means “primary share capital” as defined in the Banks Act;

168 Capitec Bank Holdings Limited
1.1.21 ‘Prime rate’ means the publicly quoted basic rate of interest expressed as a percentage per year, compounded monthly in arrear and calculated on a 365 (three hundred and sixty five)-day year factor (irrespective of whether or not the year is a leap year) from time to time quoted by the corporate bankers of the Capitec group as being its prime overdraft rate as certified by any manager of such bank, whose appointment and/or designation need not be proved. A certificate from any manager of the bank concerned as to the prime rate at any time shall constitute prima facie proof thereof;
1.1.22 ‘Registrar of Banks’ means the Registrar of Banks contemplated in the Banks Act;
1.1.23 ‘Relevant Authority’ means the Registrar of Banks or such other governmental authority in South Africa as has (or will have) the responsibility, for purposes of and/or as contemplated in the Basel III Framework, of making decisions relating to the declaration of a bank as being non-viable, with the effect of triggering loss absorption within the relevant capital instruments (including compulsorily convertible non-redeemable non-cumulative preference shares) issued by that bank;
1.1.24 ‘Trigger Event’ means the earlier of: 1.1.24.1 a decision that a write-off of the preference shares, without which the bank would become
non-viable, is necessary, as determined by the Relevant Authority; and1.1.24.2 a decision to make a public sector injection of capital into the bank, or equivalent support,
without which the bank would become non-viable, as determined by the Relevant Authority;
1.1.25 ‘Trigger Event Date’ means the date on which the Relevant Authority notifies the bank (i) of the occurrence of a Trigger Event and (ii) that the preference shares must be converted into ordinary shares (as contemplated in clause 3) or that the preference shares must be written-off (as contemplated in clause 4), as the case may be;
1.2 The following are the rights, privileges, restrictions and conditions which attach to the preference shares:1.2.1 The issue price for each tranche of preference shares to be issued will be determined by the directors
at the time of allotment thereof.
1.2.2 Each preference share will rank as regards dividends and a repayment of capital on the winding-up of the bank prior to the ordinary shares, and any other class of shares in the capital of the bank not ranking prior to or pari passu with the preference shares. The preference shares shall confer on the Holders, on a per preference share and equal basis, the right to a return of capital on the winding-up of the bank of an amount equal to the aggregate of the par value and premium of the preference shares then in issue, divided by the total number of preference shares in issue in priority to any payment in respect of any other class of shares in the capital of the bank not ranking prior to or pari passu with the preference shares.
1.2.3 Each preference share will confer upon the Holder thereof the right to receive out of the profits of the bank which it shall determine to distribute, in priority to any payment of dividends to the Holders of any other class of shares in the capital of the bank not ranking prior to or pari passu with the preference shares, the preference dividend calculated in terms of clause 1.2.4 below.
1.2.4 The preference dividend shall be calculated:1.2.4.1 by multiplying the deemed value of the preference shares by the applicable preference
dividend rate applicable on the preference dividend calculation date (determined on a 365-day year factor, irrespective of whether the year is a leap year or not), on a daily basis, in arrear, but never compounded, for the appropriate period referred to in clause 1.2.4.2 below; and
1.2.4.2 from the date following a preference dividend calculation date until and including the preference dividend calculation date immediately following as if the shares have been in issue from the date following the previous preference dividend calculation date, regardless of the date of issue.

Integrated Report 2013 169
1.2.5 The preference dividend shall, if declared:1.2.5.1 accrue on the preference dividend calculation date, calculated in accordance with
clause 1.2.4.2 above;1.2.5.2 be payable on the preference dividend payment date; and1.2.5.3 failing payment by the relevant preference dividend payment date, considered to be in arrear.
1.2.6 If a preference dividend is not declared by the bank in respect of the period to which such preference dividend calculation date relates, the preference dividend will not accumulate and will accordingly never become due to the Holders of the preference shares and payable by the bank whether in preference to payments to any other class of shares in the bank or otherwise.
1.2.7 If, in terms of Part VIII of the Income Tax Act, or any amendment thereto, the dividends tax contemplated in that Part VIII is or become applicable to the preference dividends, resulting in the preference dividends becoming taxable in the hands of the Holder, the percentage of the prime rate referred to in clause 1.1.8 above will be increased by the bank. Such increase will be calculated to put that Holder, net after deduction of the dividends tax levied, at a deemed rate of 10%, in the position he/she would have been prior to the implementation of such dividends tax. The bank shall require its auditors to verify whether it is obliged to increase the percentage of the prime rate referred to in clause 1.1.8 above in accordance with this clause 1.2.7. The auditors in deciding whether such increase is required in terms of this clause 1.2.7 shall act as experts and not as arbitrators or quasi-arbitrators and their decision in the absence of manifest error shall be final and binding on the bank and all preference shareholders. The costs of such auditors shall be borne and paid by the bank. For the avoidance of doubt it is recorded that any increase in a tax rate previously imposed on preference dividends will not oblige the bank to take any action.
1.2.8 Save as set out in clauses 1.2.2, 1.2.3, 1.2.6 and 1.2.7 above, the preference shares shall not be entitled to any further participation in the profits or assets of the bank nor on a winding-up to any surplus assets of the bank.
1.2.9 The Holders of the preference shares shall be entitled to receive notice of and be present but not to vote, either in person or by proxy, at any meeting of the bank, by virtue of or in respect of the preference shares, unless either or both of the following circumstances prevail at the date of the meeting:1.2.9.1 the preference dividend or any part thereof remains in arrear and unpaid as determined in
accordance with clause 1.2.5.3 after 6 (six) months from the due date thereof; and1.2.9.2 a resolution of the bank is proposed which resolution directly affects the rights attached
to the preference shares or the interests of the Holders thereof, including a resolution for the winding-up of the bank or for the reduction of its capital, in which event the preference shareholders shall be entitled to vote only on such resolution.
1.2.10 At every general meeting of the bank, at which Holders of preference shares as well as other classes of shares are present and entitled to vote, a preference share Holder shall be entitled to that proportion of the total votes in the bank which the aggregate amount of the nominal value of the preference shares held by him bears to the aggregate amount of the nominal value of all shares issued by the bank.
1.2.11 Notwithstanding the provisions of clause 1.2.2, no shares in the capital of the bank ranking, as regards rights to dividends or, on a winding-up as regards return of capital, in priority to the preference shares, shall be created or issued, nor will the rights for the time being attached to the preference shares be modified, amended, added or abrogated, without:1.2.11.1 the prior sanction of a resolution passed at a separate class meeting of the Holders of the
preference shares in the same manner mutatis mutandis as a special resolution; or1.2.11.2 the consent in writing of the Holders of at least 75% (seventy five percent) of the preference
shares. At every meeting of the Holders of the preference shares, the provisions of these clauses relating to general meetings shall apply, mutatis mutandis, except that a quorum at any such general meeting shall be persons holding or representing by proxy at least one quarter

170 Capitec Bank Holdings Limited
of the issued preference shares provided that if at any adjournment of such meeting a quorum is not so present, the provisions of the clauses relating to adjourned general meetings shall apply, mutatis mutandis.
2. Occurrence of the Trigger Event The preference shares will, at the sole and absolute discretion of the Relevant Authority, either (i) be compulsorily
converted into Ordinary Shares (on the basis set out in clause 3) or (ii) be automatically written off (on the basis set out in clause 4), as the case may be, upon the occurrence of the Trigger Event.
3. Compulsory Conversion 3.1 If the Relevant Authority requires the preference shares to be converted into ordinary shares then, on and with
effect from the Trigger Event Date: (a) the preference shares shall be compulsorily converted into (and shall be deemed to have been compulsorily
converted into) Ordinary Conversion Shares; (b) the Ordinary Conversion Shares shall automatically be (and shall be deemed to have been) fully paid, without
further action on the part of the bank or any Holder.
3.2 The number of Ordinary Conversion Shares into which the Holders’ preference share/s shall be compulsorily converted shall be determined by dividing the aggregate Preference Share Amount in respect of such prefer-ence share/s by the Conversion Price and then rounding the resultant figure upward or downward to the nearest whole number.
3.3 The bank will at all times maintain all prior authorisations necessary to ensure the compulsory conversion of the preference shares into Ordinary Conversion Shares on and with effect from the Trigger Event Date.
4. Mandatory write-off If the Relevant Authority requires the preference shares to be written off then, on and with effect from the Trigger
Event Date, all of the rights and all of the obligations (in each case, whether actual, contingent, accrued or otherwise) of the bank and the Holders under the preference shares shall automatically terminate, and the preference shares shall be (and shall be deemed to have been) automatically written off (for purposes of and/or as contemplated in the Basel III Framework and the Capital Regulations), without further action on the part of the bank or any holder.
5. Notice and certificates 5.1 The bank will notify the Holders of the occurrence of a Trigger Event as soon as may be practicable after the
Trigger Event Date. 5.2 In the case of a Conversion, the bank will, if the Ordinary Conversion Shares are in certificated from, procure
that the certificate/s evidencing the Ordinary Conversion Shares are delivered to the Holders.”
5. Special resolution number 5 “Resolved that the bank be authorised, for a period up to 15 months from the date of this resolution, as a general approval,
to repurchase any of the ordinary shares issued by the bank upon such terms and conditions and in such amounts as the directors may from time to time decide, but subject to the provisions of sections 46 and 48 of the Act, the Banks Act, 1990 (Act 94 of 1990), as amended, the Listings Requirements of the JSE Limited (‘JSE’), as applicable and the memorandum of incorporation of the bank.”
6. Special resolution number 6 “Resolved that the bank be authorised, for a period up to 15 months from the date of this resolution, as a general
approval, to acquire shares issued by its holding company, upon such terms and conditions and in such amounts as the directors of the bank may from time to time decide, but subject to the provisions of sections 46 and 48 of the Act, the Banks Act, 1990 (Act 94 of 1990), as amended, the Listings Requirements of the JSE Limited and the memorandum of incorporation of the bank.”
7. Special resolution number 7 “Resolved in terms of section 45(3)(a)(ii) of the Act, as a general approval, that the board of the bank be authorised

Integrated Report 2013 171171 Capitec Bank Holdings Limited
to approve that the bank provides any direct or indirect financial assistance (‘financial assistance’ will herein have the meaning attributed to it in section 45(1) of the Act) that the board of the bank may deem fit to any company or corpora-tion that is related or inter-related (‘related’ and ‘inter-related’ will herein have the meaning attributed to it in section 2 of the Act) to the bank, on the terms and conditions and for amounts that the board of the bank may determine.”
8. Special resolution number 8 “Resolved that clause 83.2.4 of the terms and conditions attaching to the non-redeemable, non-cumulative, non-
participating preference shares (‘preference shares’) be deleted in its entirety and replaced by the following new clause 83.2.4:
83.2.4 The preference dividend shall be calculated: 83.2.4.1 by multiplying the deemed value of the preference shares by the applicable preference dividend
rate applicable on the preference dividend calculation date (determined on a 365-day year factor, irrespective of whether the year is a leap year or not), on a daily basis, in arrear, but never com-pounded, for the appropriate period referred to in clause 83.2.4.2 below; and
83.2.4.2 from the date following a preference dividend calculation date until and including the preference dividend calculation date immediately following as if the shares have been in issue from the date following the previous preference dividend calculation date, regardless of the date of issue.”
9. Special resolution number 9 “Resolved that clause 83.2.7 of the terms and conditions attaching to the non-redeemable, non-cumulative, non-
participating preference shares (‘preference shares’) be deleted in its entirety and replaced by the following new clause 83.2.7:
83.2.7 If there is an amendment or amendments to the Income Tax Act which result in the preference dividends being taxable in the hands of the preference shareholders, provided such amendment is uniformly applicable to all shareholders concerned and not only because of the particular circumstances of the bank or any preference shareholder, the percentage of the prime rate referred to in clause 83.1.8 above will be increased by the bank. Such increase will be calculated to put the shareholder concerned, net after deduction of dividend tax levied at a deemed rate of 10%, in the position he/she would have been prior to implementation of such tax. The bank shall require its auditors to verify whether it is obliged to increase the percentage of the prime rate referred to in clause 83.1.8 above in accordance with this clause 83.2.7. The auditors, in deciding whether such increase is required in terms of this clause 83.2.7, shall act as experts and not as arbitrators or quasi-arbitrators and their decision in the absence of manifest error shall be final and binding on the bank and all preference shareholders. The costs of such auditors shall be borne and paid by the bank. For the avoidance of doubt it is recorded that any increase in a tax rate previously imposed on preference dividends will not oblige the bank to take any action.”