
ANNUAL WATER QUALITY ASSESSMENT REPORT FOR MOGPOG...
28
ANNUAL WATER QUALITY ASSESSMENT REPORT FOR MOGPOG RIVER, MARINDUQUE CY 2006 I. INTRODUCTION Mogpog River is classified as “Class C” under fresh water as per DENR Administrative Order # 34 (Revised Water Usage and Classification/Water Quality Criteria Amending Sections Nos. 68 and 69, Chapter III of the 1978 NPCC rules and Regulations). Based on DAO # 34, Series of 1990, “Class C” water is for fishing, propagation and growth of fish and other aquatic resources; recreational Water Class II (boating, etc.); and industrial water supply Class I (for manufacturing processes after treatment). II. SAMPLING METHODOLOGIES Samples for water quality monitoring of Mogpog River for this year were taken for twelve (12) sampling periods under the Sagip Ilog program of the Water Quality Monitoring Section. They were taken at the following dates: 19 January 2006, 15 February 2006, 15 March 2006, 05 April 2006, 10 May 2006, 21 June 2006, 12 July 2006, 09 August 2006, 14 September 2006, 18 October 2006, 16 November 2006, and 13 December 2006. The samples were collected using grab sampling. Measurements for dissolved oxygen (DO) and pH were taken in-situ using YSI Multiparameter checker. Samples to be tested for dissolved metals were filtered. Concentrated nitric acid was then added as a preservative. Prior to transport, the samples were maintained to low temperature by submerging it on ice. III. LOCATION OF STATIONS There were a total of five (5) stations identified for the water quality monitoring of Mogpog River. These stations were described in the table below with the corresponding GPS coordinates. The relative location of these stations was shown in the succeeding map. STATION NUMBER STATION IDENTIFICATION NORTHINGS EASTINGS 1 Bocboc 1489784.5 384618.5 2 Manggamnan 1490828 382826 3 Mangyan-Mababad 1490204.5 378774 4 Sumangga 1489917.5 378085 5 Nangka II 1490762.5 374983 Page 1 of 28
Transcript of ANNUAL WATER QUALITY ASSESSMENT REPORT FOR MOGPOG...

ANNUAL WATER QUALITY ASSESSMENT REPORT FOR MOGPOG RIVER, MARINDUQUE
CY 2006
I. INTRODUCTION
Mogpog River is classified as “Class C” under fresh water as per DENR Administrative Order # 34 (Revised Water Usage and Classification/Water Quality Criteria Amending Sections Nos. 68 and 69, Chapter III of the 1978 NPCC rules and Regulations).
Based on DAO # 34, Series of 1990, “Class C” water is for fishing, propagation and growth of fish and other aquatic resources; recreational Water Class II (boating, etc.); and industrial water supply Class I (for manufacturing processes after treatment).
II. SAMPLING METHODOLOGIES
Samples for water quality monitoring of Mogpog River for this year were taken for twelve (12) sampling periods under the Sagip Ilog program of the Water Quality Monitoring Section. They were taken at the following dates: 19 January 2006, 15 February 2006, 15 March 2006, 05 April 2006, 10 May 2006, 21 June 2006, 12 July 2006, 09 August 2006, 14 September 2006, 18 October 2006, 16 November 2006, and 13 December 2006. The samples were collected using grab sampling. Measurements for dissolved oxygen (DO) and pH were taken in-situ using YSI Multiparameter checker. Samples to be tested for dissolved metals were filtered. Concentrated nitric acid was then added as a preservative. Prior to transport, the samples were maintained to low temperature by submerging it on ice.
III. LOCATION OF STATIONS
There were a total of five (5) stations identified for the water quality monitoring of Mogpog River. These stations were described in the table below with the corresponding GPS coordinates. The relative location of these stations was shown in the succeeding map.
STATION NUMBER
STATION IDENTIFICATION NORTHINGS EASTINGS
1 Bocboc 1489784.5 384618.52 Manggamnan 1490828 3828263 Mangyan-Mababad 1490204.5 3787744 Sumangga 1489917.5 3780855 Nangka II 1490762.5 374983
Page 1 of 28

Page 2 of 28
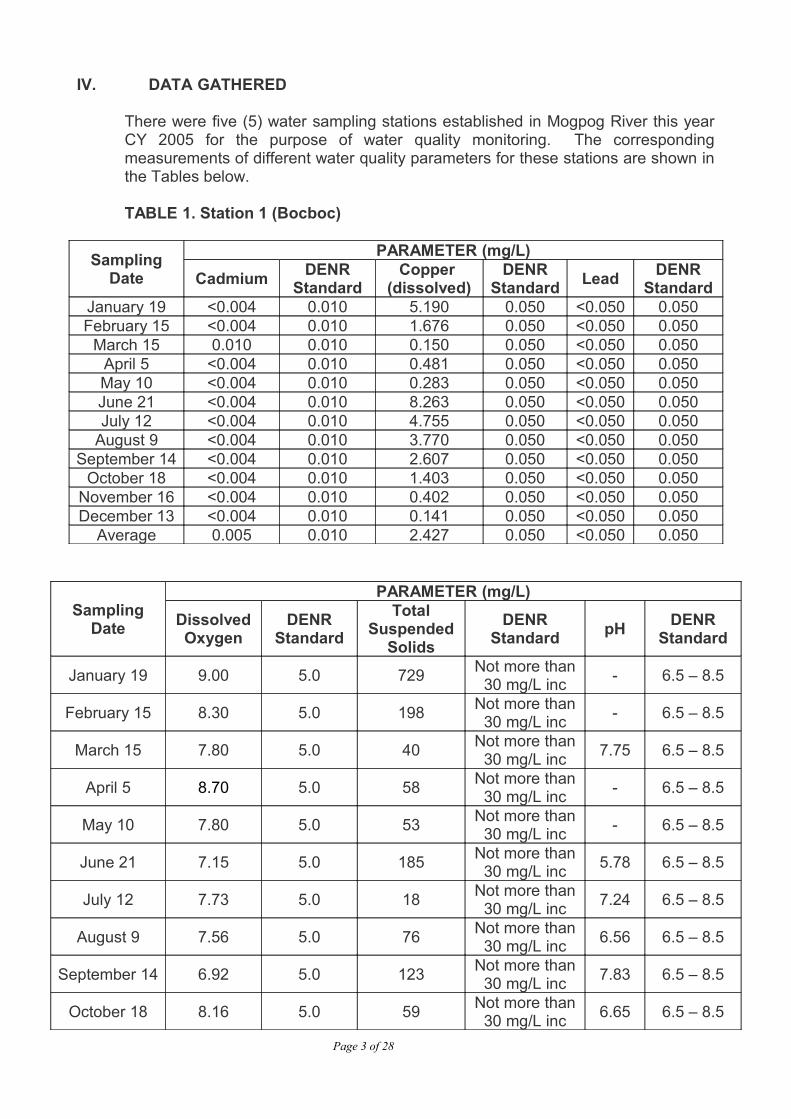
IV. DATA GATHERED
There were five (5) water sampling stations established in Mogpog River this year CY 2005 for the purpose of water quality monitoring. The corresponding measurements of different water quality parameters for these stations are shown in the Tables below.
TABLE 1. Station 1 (Bocboc)
Sampling Date
PARAMETER (mg/L)
Cadmium DENRStandard
Copper (dissolved)
DENR Standard Lead DENR
StandardJanuary 19 <0.004 0.010 5.190 0.050 <0.050 0.050February 15 <0.004 0.010 1.676 0.050 <0.050 0.050
March 15 0.010 0.010 0.150 0.050 <0.050 0.050April 5 <0.004 0.010 0.481 0.050 <0.050 0.050May 10 <0.004 0.010 0.283 0.050 <0.050 0.050June 21 <0.004 0.010 8.263 0.050 <0.050 0.050July 12 <0.004 0.010 4.755 0.050 <0.050 0.050
August 9 <0.004 0.010 3.770 0.050 <0.050 0.050September 14 <0.004 0.010 2.607 0.050 <0.050 0.050
October 18 <0.004 0.010 1.403 0.050 <0.050 0.050November 16 <0.004 0.010 0.402 0.050 <0.050 0.050December 13 <0.004 0.010 0.141 0.050 <0.050 0.050
Average 0.005 0.010 2.427 0.050 <0.050 0.050
Sampling Date
PARAMETER (mg/L)
Dissolved Oxygen
DENRStandard
Total Suspended
SolidsDENR
Standard pH DENR Standard
January 19 9.00 5.0 729 Not more than 30 mg/L inc - 6.5 – 8.5
February 15 8.30 5.0 198 Not more than 30 mg/L inc - 6.5 – 8.5
March 15 7.80 5.0 40 Not more than 30 mg/L inc 7.75 6.5 – 8.5
April 5 8.70 5.0 58 Not more than 30 mg/L inc - 6.5 – 8.5
May 10 7.80 5.0 53 Not more than 30 mg/L inc - 6.5 – 8.5
June 21 7.15 5.0 185 Not more than 30 mg/L inc 5.78 6.5 – 8.5
July 12 7.73 5.0 18 Not more than 30 mg/L inc 7.24 6.5 – 8.5
August 9 7.56 5.0 76 Not more than 30 mg/L inc 6.56 6.5 – 8.5
September 14 6.92 5.0 123 Not more than 30 mg/L inc 7.83 6.5 – 8.5
October 18 8.16 5.0 59 Not more than 30 mg/L inc 6.65 6.5 – 8.5
Page 3 of 28

November 16 8.91 5.0 42 Not more than 30 mg/L inc 8.87 6.5 – 8.5
December 13 9.57 5.0 364 Not more than 30 mg/L inc 9.28 6.5 – 8.5
Average 8.13 5.0 162.08 Not more than 30 mg/L inc 7.50 6.5 – 8.5
TABLE 2. Station 2 (Manggamnan)
Sampling Date
PARAMETER (mg/L)
Cadmium DENRStandard
Copper (dissolved)
DENR Standard Lead DENR
StandardJanuary 19 <0.004 0.010 2.092 0.050 <0.050 0.050February 15 <0.004 0.010 0.196 0.050 <0.050 0.050
March 15 0.004 0.010 0.071 0.050 0.108 0.050April 5 <0.004 0.010 0.188 0.050 <0.050 0.050May 10 <0.004 0.010 0.079 0.050 <0.050 0.050June 21 <0.004 0.010 0.062 0.050 <0.050 0.050July 12 <0.004 0.010 0.198 0.050 <0.050 0.050
August 9 <0.004 0.010 0.325 0.050 <0.050 0.050September 14 <0.004 0.010 0.552 0.050 <0.050 0.050
October 18 <0.004 0.010 0.196 0.050 <0.050 0.050November 16 <0.004 0.010 0.300 0.050 <0.050 0.050December 13 <0.004 0.010 0.131 0.050 <0.050 0.050
Average 0.004 0.010 0.366 0.050 0.055 0.050
Sampling Date
PARAMETER (mg/L)
Dissolved Oxygen
DENRStandard
Total Suspended
SolidsDENR
Standard pH DENR Standard
January 19 11.10 5.0 148 Not more than 30 mg/L inc - 6.5 – 8.5
February 15 8.00 5.0 90 Not more than 30 mg/L inc - 6.5 – 8.5
March 15 7.50 5.0 12 Not more than 30 mg/L inc 8.09 6.5 – 8.5
April 5 10.00 5.0 23 Not more than 30 mg/L inc - 6.5 – 8.5
May 10 7.50 5.0 8 Not more than 30 mg/L inc - 6.5 – 8.5
June 21 6.83 5.0 59 Not more than 30 mg/L inc 5.85 6.5 – 8.5
July 12 7.89 5.0 16 Not more than 30 mg/L inc 6.71 6.5 – 8.5
August 9 7.52 5.0 18 Not more than 30 mg/L inc 6.88 6.5 – 8.5
September 14 7.47 5.0 105 Not more than 30 mg/L inc 7.30 6.5 – 8.5
October 18 8.44 5.0 27 Not more than 30 mg/L inc 7.56 6.5 – 8.5
Page 4 of 28

November 16 8.35 5.0 27 Not more than 30 mg/L inc 7.73 6.5 – 8.5
December 13 7.34 5.0 60 Not more than 30 mg/L inc 7.93 6.5 – 8.5
Average 8.16 5.0 49.42 Not more than 30 mg/L inc 7.26 6.5 – 8.5
TABLE 3. Station 3 (Mangyan-Mababad)
Sampling Date
PARAMETER (mg/L)
Cadmium DENRStandard
Copper (dissolved)
DENR Standard Lead DENR
StandardJanuary 19 <0.004 0.010 0.804 0.050 <0.050 0.050February 15 <0.004 0.010 0.122 0.050 <0.050 0.050
March 15 0.007 0.010 0.037 0.050 0.082 0.050April 5 <0.004 0.010 0.044 0.050 <0.050 0.050May 10 <0.004 0.010 0.036 0.050 <0.050 0.050June 21 <0.004 0.010 0.071 0.050 <0.050 0.050July 12 <0.004 0.010 0.239 0.050 <0.050 0.050
August 9 <0.004 0.010 <0.020 0.050 <0.050 0.050September 14 <0.004 0.010 0.142 0.050 <0.050 0.050
October 18 <0.004 0.010 0.071 0.050 <0.050 0.050November 16 <0.004 0.010 0.047 0.050 <0.050 0.050December 13 <0.004 0.010 0.113 0.050 <0.050 0.050
Average 0.004 0.010 0.146 0.050 0.053 0.050
Sampling Date
PARAMETER (mg/L)
Dissolved Oxygen
DENRStandard
Total Suspended
SolidsDENR
Standard pH DENR Standard
January 19 8.40 5.0 32 Not more than 30 mg/L inc - 6.5 – 8.5
February 15 7.80 5.0 26 Not more than 30 mg/L inc - 6.5 – 8.5
March 15 6.30 5.0 2 Not more than 30 mg/L inc 8.32 6.5 – 8.5
April 5 9.80 5.0 3 Not more than 30 mg/L inc - 6.5 – 8.5
May 10 6.00 5.0 3 Not more than 30 mg/L inc - 6.5 – 8.5
June 21 7.28 5.0 5 Not more than 30 mg/L inc 6.61 6.5 – 8.5
July 12 6.71 5.0 7 Not more than 30 mg/L inc 7.05 6.5 – 8.5
August 9 6.12 5.0 2 Not more than 30 mg/L inc 7.19 6.5 – 8.5
September 14 8.05 5.0 19 Not more than 30 mg/L inc 7.19 6.5 – 8.5
October 18 6.65 5.0 2 Not more than 30 mg/L inc 7.39 6.5 – 8.5
November 16 8.46 5.0 8 Not more than 30 mg/L inc 7.16 6.5 – 8.5
Page 5 of 28

December 13 9.82 5.0 144 Not more than 30 mg/L inc 7.67 6.5 – 8.5
Average 7.62 5.0 21.08 Not more than 30 mg/L inc 7.32 6.5 – 8.5
TABLE 4. Station 4 (Sumangga)
Sampling Date
PARAMETER (mg/L)
Cadmium DENRStandard
Copper (dissolved)
DENR Standard Lead DENR
StandardJanuary 19 <0.004 0.010 0.521 0.050 <0.050 0.050February 15 <0.004 0.010 0.070 0.050 <0.050 0.050
March 15 0.004 0.010 0.036 0.050 <0.050 0.050April 5 <0.004 0.010 <0.020 0.050 <0.050 0.050May 10 <0.004 0.010 0.022 0.050 <0.050 0.050June 21 <0.004 0.010 0.090 0.050 <0.050 0.050July 12 <0.004 0.010 0.020 0.050 <0.050 0.050
August 9 <0.004 0.010 <0.020 0.050 <0.050 0.050September 14 <0.004 0.010 0.123 0.050 <0.050 0.050
October 18 <0.004 0.010 0.034 0.050 <0.050 0.050November 16 <0.004 0.010 0.057 0.050 <0.050 0.050December 13 <0.004 0.010 0.116 0.050 <0.050 0.050
Average 0.004 0.010 0.094 0.050 <0.050 0.050
Sampling Date
PARAMETER (mg/L)
Dissolved Oxygen
DENRStandard
Total Suspended
SolidsDENR
Standard pH DENR Standard
January 19 7.70 5.0 22 Not more than 30 mg/L inc - 6.5 – 8.5
February 15 7.80 5.0 25 Not more than 30 mg/L inc - 6.5 – 8.5
March 15 6.60 5.0 4 Not more than 30 mg/L inc 8.41 6.5 – 8.5
April 5 9.00 5.0 1 Not more than 30 mg/L inc - 6.5 – 8.5
May 10 7.90 5.0 3 Not more than 30 mg/L inc - 6.5 – 8.5
June 21 7.29 5.0 4 Not more than 30 mg/L inc 6.56 6.5 – 8.5
July 12 7.30 5.0 6 Not more than 30 mg/L inc 6.79 6.5 – 8.5
August 9 6.44 5.0 4 Not more than 30 mg/L inc 7.49 6.5 – 8.5
September 14 8.08 5.0 16 Not more than 30 mg/L inc 7.33 6.5 – 8.5
October 18 6.56 5.0 3 Not more than 30 mg/L inc 7.39 6.5 – 8.5
November 16 8.10 5.0 6 Not more than 30 mg/L inc 7.32 6.5 – 8.5
Page 6 of 28

December 13 9.59 5.0 149 Not more than 30 mg/L inc 7.56 6.5 – 8.5
Average 7.70 5.0 20.25 Not more than 30 mg/L inc 7.36 6.5 – 8.5
TABLE 5. Station 5 (Nangka II)
Sampling Date
PARAMETER (mg/L)
Cadmium DENRStandard
Copper (dissolved)
DENR Standard Lead DENR
StandardJanuary 19 <0.004 0.010 0.244 0.050 <0.050 0.050February 15 <0.004 0.010 0.060 0.050 <0.050 0.050
March 15 0.006 0.010 0.028 0.050 <0.050 0.050April 5 <0.004 0.010 <0.020 0.050 <0.050 0.050May 10 <0.004 0.010 <0.020 0.050 <0.050 0.050June 21 <0.004 0.010 0.031 0.050 <0.050 0.050July 12 <0.004 0.010 0.027 0.050 <0.050 0.050
August 9 <0.004 0.010 <0.020 0.050 <0.050 0.050September 14 <0.004 0.010 0.056 0.050 <0.050 0.050
October 18 <0.004 0.010 0.030 0.050 <0.050 0.050November 16 <0.004 0.010 0.033 0.050 <0.050 0.050December 13 <0.004 0.010 0.129 0.050 <0.050 0.050
Average 0.004 0.010 0.058 0.050 <0.050 0.050
Sampling Date
PARAMETER (mg/L)
Dissolved Oxygen
DENRStandard
Total Suspended
SolidsDENR
Standard pH DENR Standard
January 19 8.90 5.0 29 Not more than 30 mg/L inc - 6.5 – 8.5
February 15 7.50 5.0 25 Not more than 30 mg/L inc - 6.5 – 8.5
March 15 6.20 5.0 10 Not more than 30 mg/L inc 8.26 6.5 – 8.5
April 5 9.40 5.0 4 Not more than 30 mg/L inc - 6.5 – 8.5
May 10 8.00 5.0 35 Not more than 30 mg/L inc - 6.5 – 8.5
June 21 7.32 5.0 4 Not more than 30 mg/L inc 5.57 6.5 – 8.5
July 12 6.49 5.0 15 Not more than 30 mg/L inc 6.89 6.5 – 8.5
August 9 5.28 5.0 5 Not more than 30 mg/L inc 7.70 6.5 – 8.5
September 14 6.19 5.0 13 Not more than 30 mg/L inc 7.21 6.5 – 8.5
October 18 8.58 5.0 6 Not more than 30 mg/L inc 7.50 6.5 – 8.5
November 16 8.48 5.0 12 Not more than 30 mg/L inc 7.28 6.5 – 8.5
Page 7 of 28
December 13 9.91 5.0 109 Not more than 30 mg/L inc 7.63 6.5 – 8.5
Average 7.69 5.0 22.25 Not more than 30 mg/L inc 7.26 6.5 – 8.5
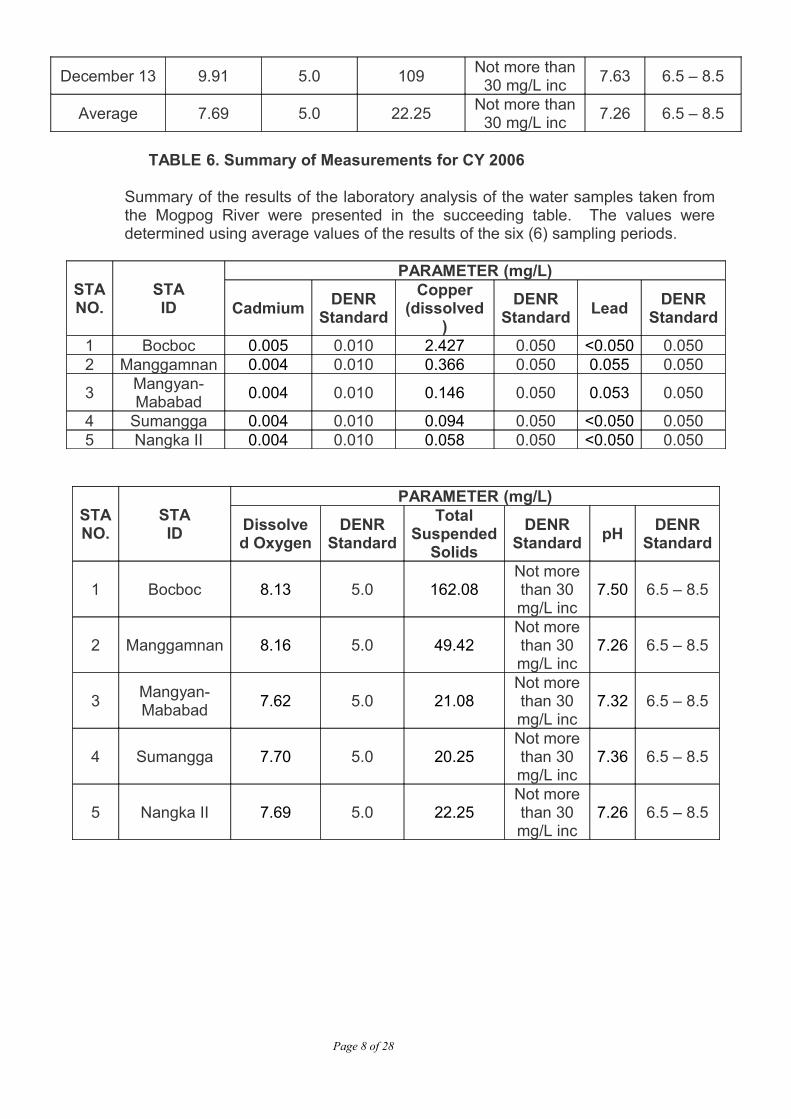
TABLE 6. Summary of Measurements for CY 2006
Summary of the results of the laboratory analysis of the water samples taken from the Mogpog River were presented in the succeeding table. The values were determined using average values of the results of the six (6) sampling periods.
STANO.
STAID
PARAMETER (mg/L)
Cadmium DENRStandard
Copper(dissolved
)DENR
Standard Lead DENR Standard
1 Bocboc 0.005 0.010 2.427 0.050 <0.050 0.0502 Manggamnan 0.004 0.010 0.366 0.050 0.055 0.050
3 Mangyan-Mababad 0.004 0.010 0.146 0.050 0.053 0.050
4 Sumangga 0.004 0.010 0.094 0.050 <0.050 0.0505 Nangka II 0.004 0.010 0.058 0.050 <0.050 0.050
STANO.
STAID
PARAMETER (mg/L)
Dissolved Oxygen
DENRStandard
Total Suspended
SolidsDENR
Standard pH DENR Standard
1 Bocboc 8.13 5.0 162.08Not more than 30 mg/L inc
7.50 6.5 – 8.5
2 Manggamnan 8.16 5.0 49.42Not more than 30 mg/L inc
7.26 6.5 – 8.5
3 Mangyan-Mababad 7.62 5.0 21.08
Not more than 30 mg/L inc
7.32 6.5 – 8.5
4 Sumangga 7.70 5.0 20.25Not more than 30 mg/L inc
7.36 6.5 – 8.5
5 Nangka II 7.69 5.0 22.25Not more than 30 mg/L inc
7.26 6.5 – 8.5
Page 8 of 28

Table 8. Levels of Cadmium from CY 2000 to CY 2006
StationNumber
DENR Standard
2001(mg/L)
2003(mg/L)
2004(mg/L)
2005(mg/L)
2006(mg/L)
1 0.010 0.007 0.013 0.009 <0.004 0.0052 0.010 0.004 0.011 0.008 <0.004 0.0043 0.010 0.007 0.006 0.006 <0.004 0.0044 0.010 <0.004 0.005 0.007 <0.004 0.0045 0.010 0.005 0.006 0.007 <0.004 0.004
Table 9. Levels of Lead from CY 2000 to CY 2006
StationNumber
DENR Standard
2001(mg/L)
2003(mg/L)
2004(mg/L)
2005(mg/L)
2006(mg/L)
1 0.050 0.056 <0.050 <0.050 <0.050 <0.0502 0.050 0.084 <0.050 <0.050 <0.050 0.0553 0.050 0.050 <0.050 <0.050 <0.050 0.0534 0.050 0.086 <0.050 <0.050 <0.050 <0.0505 0.050 0.041 <0.050 <0.050 <0.050 <0.050
Table 10. Levels of Copper(dissolved) from CY 2000 to CY 2006
StationNumber
DENR Standard
2001(mg/L)
2003(mg/L)
2004(mg/L)
2005(mg/L)
2006(mg/L)
1 0.050 2.703 10.837 10.198 5.545 2.4272 0.050 1.001 3.436 1.793 1.421 0.3663 0.050 0.728 0.403 0.128 0.382 0.1464 0.050 1.135 0.190 0.074 0.215 0.0945 0.050 2.350 0.090 0.036 0.110 0.058
Table 11. Levels of Dissolved Oxygen (D.O.) from CY 2000 to CY 2006
StationNumber
DENR Standard
(minimum)2001
(mg/L)2004
(mg/L)2005
(mg/L)2006
(mg/L)
1 5.0 6.48 8.1 8.2 8.132 5.0 5.91 8.2 6.9 8.163 5.0 6.12 8.2 8.9 7.624 5.0 5.71 8.8 6.8 7.705 5.0 5.66 8.2 8.2 7.69
Table 12. Levels of pH from CY 2000 to CY 2006
StationNumber
DENR Standard (range)
2001(mg/L)
2004(mg/L)
2005(mg/L)
2006(mg/L)
1 6.5 – 8.5 6.84 6.11 4.44 7.502 6.5 – 8.5 7.40 7.58 7.33 7.263 6.5 – 8.5 7.77 7.57 7.53 7.324 6.5 – 8.5 7.64 7.65 7.51 7.365 6.5 – 8.5 7.99 7.38 7.48 7.26
Page 9 of 28
V. ASSESSMENT/DISCUSSIONS
Cadmium, Copper (dissolved), Lead, Dissolved Oxygen (D.O.), pH, Dissolved Oxygen (D.O.), and Total Suspended Solids (T.S.S.) are the parameters for assessment. Comparative assessment of these parameters from CY 2001 to CY 2006 were also conducted. The graphs show the highest and lowest value of these parameters.
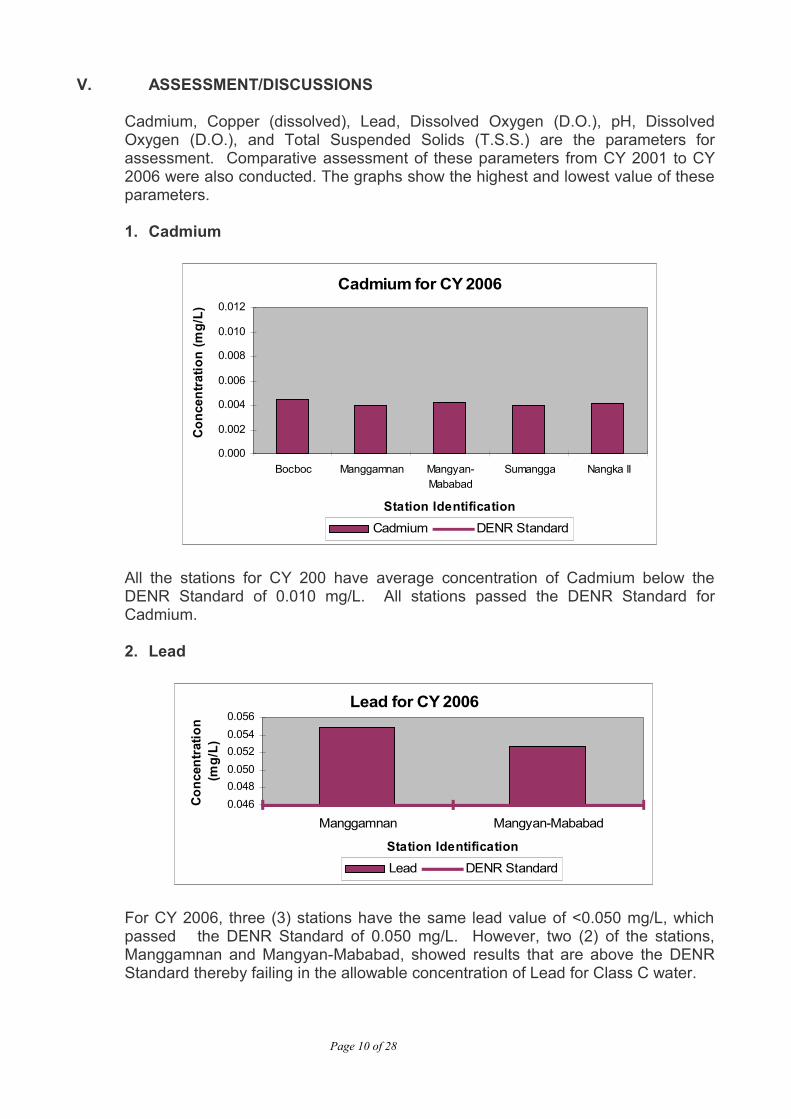
1. Cadmium
Cadmium for CY 2006
0.000
0.002
0.004
0.006
0.008
0.010
0.012
Bocboc Manggamnan Mangyan-Mababad
Sumangga Nangka II
Station Identification
Con
cent
ratio
n (m
g/L)
Cadmium DENR Standard
All the stations for CY 200 have average concentration of Cadmium below the DENR Standard of 0.010 mg/L. All stations passed the DENR Standard for Cadmium.
2. Lead
Lead for CY 2006
0.0460.0480.0500.0520.0540.056
Manggamnan Mangyan-Mababad
Station Identification
Conc
entr
atio
n (m
g/L)
Lead DENR Standard
For CY 2006, three (3) stations have the same lead value of <0.050 mg/L, which passed the DENR Standard of 0.050 mg/L. However, two (2) of the stations, Manggamnan and Mangyan-Mababad, showed results that are above the DENR Standard thereby failing in the allowable concentration of Lead for Class C water.
Page 10 of 28
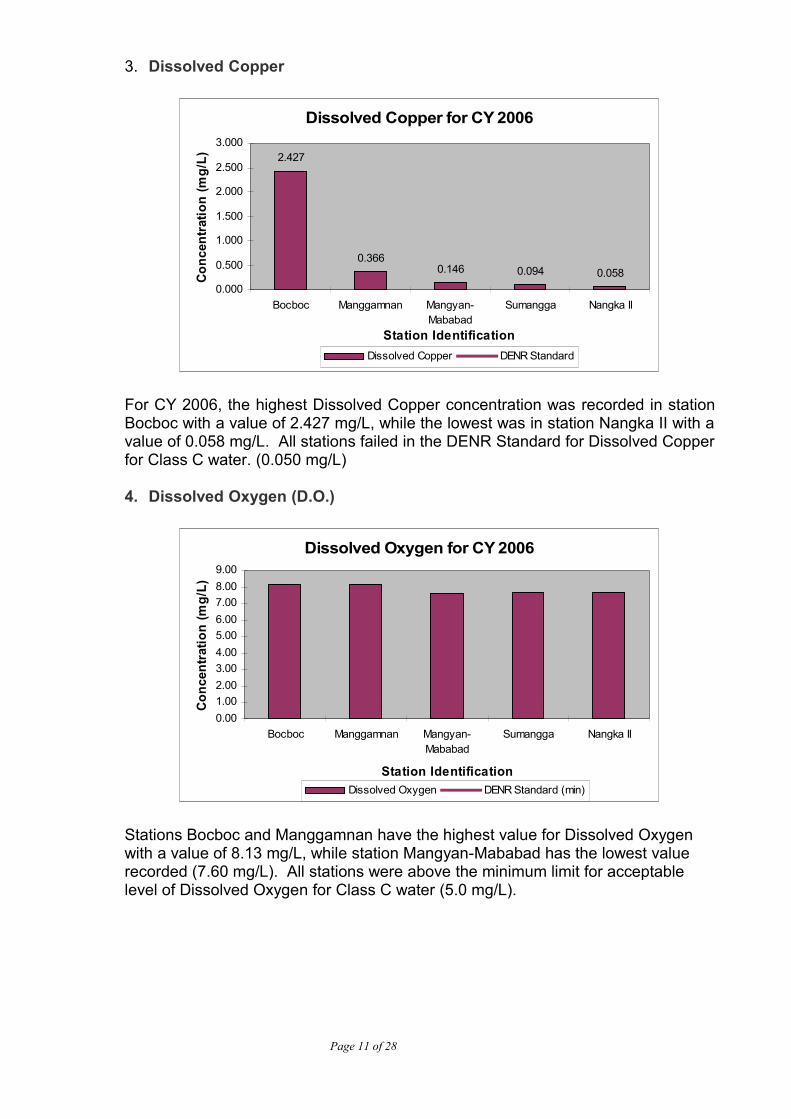
3. Dissolved Copper
Dissolved Copper for CY 2006
2.427
0.3660.146 0.094 0.058
0.000
0.500
1.000
1.500
2.000
2.500
3.000
Bocboc Manggamnan Mangyan-Mababad
Sumangga Nangka II
Station Identification
Conc
entr
atio
n (m
g/L)
Dissolved Copper DENR Standard
For CY 2006, the highest Dissolved Copper concentration was recorded in station Bocboc with a value of 2.427 mg/L, while the lowest was in station Nangka II with a value of 0.058 mg/L. All stations failed in the DENR Standard for Dissolved Copper for Class C water. (0.050 mg/L) 4. Dissolved Oxygen (D.O.)
Dissolved Oxygen for CY 2006
0.001.002.003.004.005.006.007.008.009.00
Bocboc Manggamnan Mangyan-Mababad
Sumangga Nangka II
Station Identification
Conc
entr
atio
n (m
g/L)
Dissolved Oxygen DENR Standard (min)
Stations Bocboc and Manggamnan have the highest value for Dissolved Oxygen with a value of 8.13 mg/L, while station Mangyan-Mababad has the lowest value recorded (7.60 mg/L). All stations were above the minimum limit for acceptable level of Dissolved Oxygen for Class C water (5.0 mg/L).
Page 11 of 28

5. pH
pH for CY 2006
0.001.002.003.004.005.006.007.008.009.00
Bocboc Manggamnan Mangyan-Mababad
Sumangga Nangka II
Station Identification
Res
ult
pH DENR Standard (high) DENR Standard (low)
For CY 2006, station Nangka II has the lowest value for pH (7.14) while station Sumangga has the highest value of pH (7.40). All stations passed the allowable range of pH for Class C water (6.5 – 8.5).
6. Total Suspended Solids (T.S.S.)
Total Suspended Solids for CY 2006
0.0020.0040.0060.0080.00
100.00120.00140.00160.00180.00
Bocboc Manggamnan Mangyan-Mababad
Sumangga Nangka II
Station Identification
Conc
entr
atio
n (m
g/L)
Total Suspended Solids DENR Standard
Station Bocboc has the highest value of Total Suspended Solids (162.08 mg/L), while station Sumangga has the lowest value (20.25 mg/L). The DENR Standard for this parameter was computed using the laboratory results of CY 2004. The results for CY 2006 should not exceed by 30 mg/L when compared with the results of CY 2004. Station Bocboc failed in the DENR Standard for Class C water.
Page 12 of 28

Comparative Analysis of the Parameters for Annual Monitoring
Part to form this report is the comparative analysis of the parameters measured on the samples taken from Mogpog River from CY 2001 to CY 2006. The trend line generated is then compared to the standard set by DENR for Class C waters. Further, the trend line will form basis for the development or decline of the water quality of Mogpog River.
a. Station No. 1 (Station Bocboc)
1. Cadmium
Cadmium (Station Bocboc)
0
0.002
0.004
0.006
0.008
0.01
0.012
0.014
2001 2003 2004 2005 2006
CY
Conc
entr
atio
n (m
g/L)
Cadmium DENR Standard
Station Bocboc failed in the Cadmium concentration on CY 2003 but passed in the rest of the years. There was an increase in the concentration of Cadmium from CY 2005 to CY 2006.
2. Copper (dissolved)
Dissolved Copper (Station Bocboc)
0
2
4
6
8
10
12
2001 2003 2004 2005 2006
CY
Conc
entr
atio
n (m
g/L)
Dissolved Copper DENR Standard
Station Bocboc failed in the concentration of dissolved copper from CY 2001 to CY 2006. There was a decrease in the concentration of Dissolved Copper from CY 2005 to CY 2006.
Page 13 of 28

3. Lead
Lead (Station Bocboc)
0.0470.0480.0490.05
0.0510.0520.0530.0540.0550.0560.057
2001 2003 2004 2005 2006
CY
Conc
entr
atio
n (m
g/L)
Lead DENR Standard
Laboratory results showed that station Bocboc failed in the concentration of dissolved copper on CY 2001, but passed throughout the rest of the years. Station Bocboc maintained its concentration of Lead from CY 2005 to CY 2006.
4. Dissolved Oxygen (D.O.)
Dissolved Oxygen (Station Bocboc)
0123456789
2001 2004 2005 2006
CY
Conc
entr
atio
n (m
g/L)
Dissolved Oxygen DENR Standard
Station Bocboc showed levels of Dissolved Oxygen that are above the minimum concentration allowed for Class C water from CY 2001 to 2006. Station Bocboc passed the DENR Standard for Class C water.
Page 14 of 28
5. pH
pH (Station Bocboc)
0123456789
2001 2004 2005 2006
CY
Resu
lt
pH DENR Standard (high) DENR Standard (low)
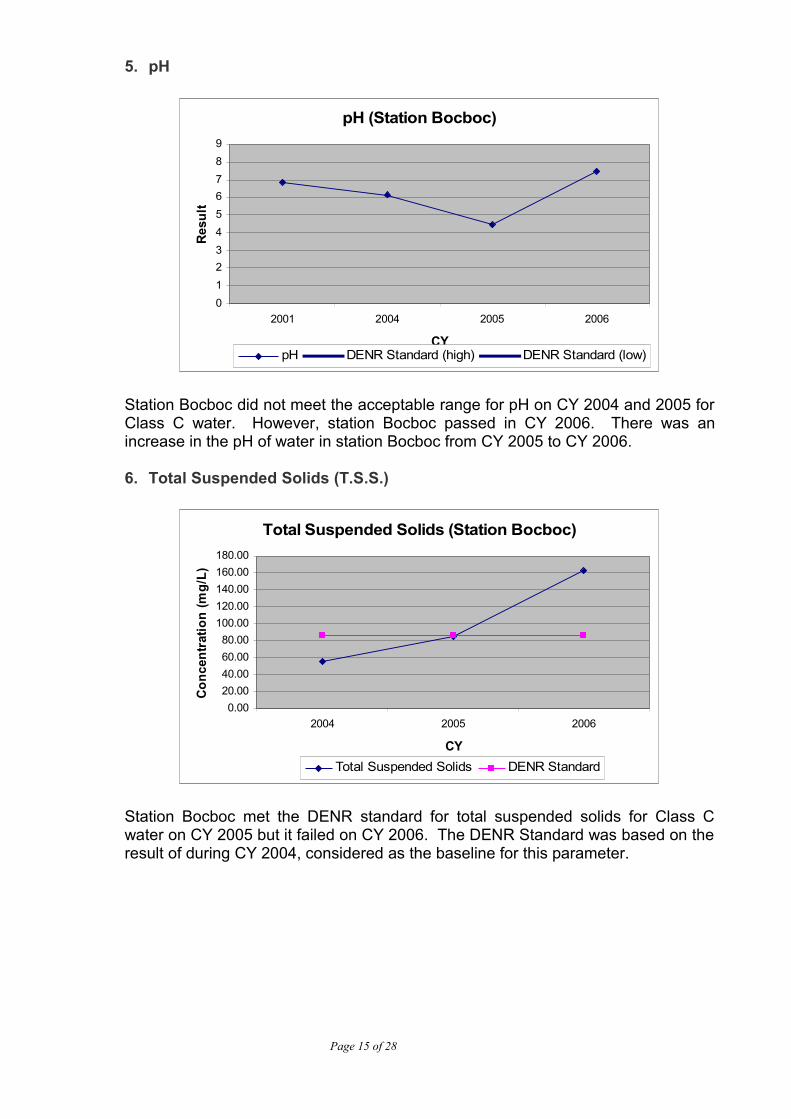
Station Bocboc did not meet the acceptable range for pH on CY 2004 and 2005 for Class C water. However, station Bocboc passed in CY 2006. There was an increase in the pH of water in station Bocboc from CY 2005 to CY 2006.
6. Total Suspended Solids (T.S.S.)
Total Suspended Solids (Station Bocboc)
0.0020.0040.0060.0080.00
100.00120.00140.00160.00180.00
2004 2005 2006
CY
Conc
entr
atio
n (m
g/L)
Total Suspended Solids DENR Standard
Station Bocboc met the DENR standard for total suspended solids for Class C water on CY 2005 but it failed on CY 2006. The DENR Standard was based on the result of during CY 2004, considered as the baseline for this parameter.
Page 15 of 28

b. Station No. 2 (Station Manggamnan)
1. Cadmium
Cadmium (Station Manggamanan)
0
0.002
0.004
0.006
0.008
0.01
0.012
2001 2003 2004 2005 2006
CY
Conc
entr
atio
n (m
g/L)
Cadmium DENR Standard
Station Manggamnan failed in the concentration for cadmium for Class C water on CY 2003 but passed during the rest of the years. Station Manggamanan maintained in its concentration of Cadmium in CY 2005 and CY 2006. 2. Copper (dissolved)
Dissolved Copper (Station Manggamnan)
0
0.5
1
1.5
2
2.5
3
3.5
4
2001 2003 2004 2005 2006
CY
Conc
entr
atio
n (m
g/L)
Dissolved Copper DENR Standard
Station Manggamnan failed in the allowable concentration of copper for Class C water. However, the concentration of Dissolved Copper decreased from CY 2005 to CY 2006.
Page 16 of 28

3. Lead
Lead (Station Manggamnan)
00.010.020.030.040.050.060.070.080.09
2001 2003 2004 2005 2006
CY
Conc
entr
atio
n (m
g/L)
Lead DENR Standard
Station Manggamnan failed on the allowable concentration of Lead on CY 2001 and CY 2006 but passed throughout the rest of the samplings conducted. There was an increase in the concentration of Lead from CY 2005 to CY 2006.
4. Dissolved Oxygen (D.O.)
Dissolved Oxygen (Station Manggamnan)
0123456789
2001 2004 2005 2006
CY
Conc
entr
atio
n (m
g/L)
Dissolved Oxygen DENR Standard
Station Manggamnan passed in the DENR standard for minimum Dissolved Oxygen for Class C water. There was an increase in the concentration of Dissolved Oxygen from CY 2005 to CY 2006.
Page 17 of 28
5. pH
pH (Station Manggamnan)
0123456789
2001 2004 2005 2006CY
Resu
lt
pH DENR Standard (high) DENR Standard (low)
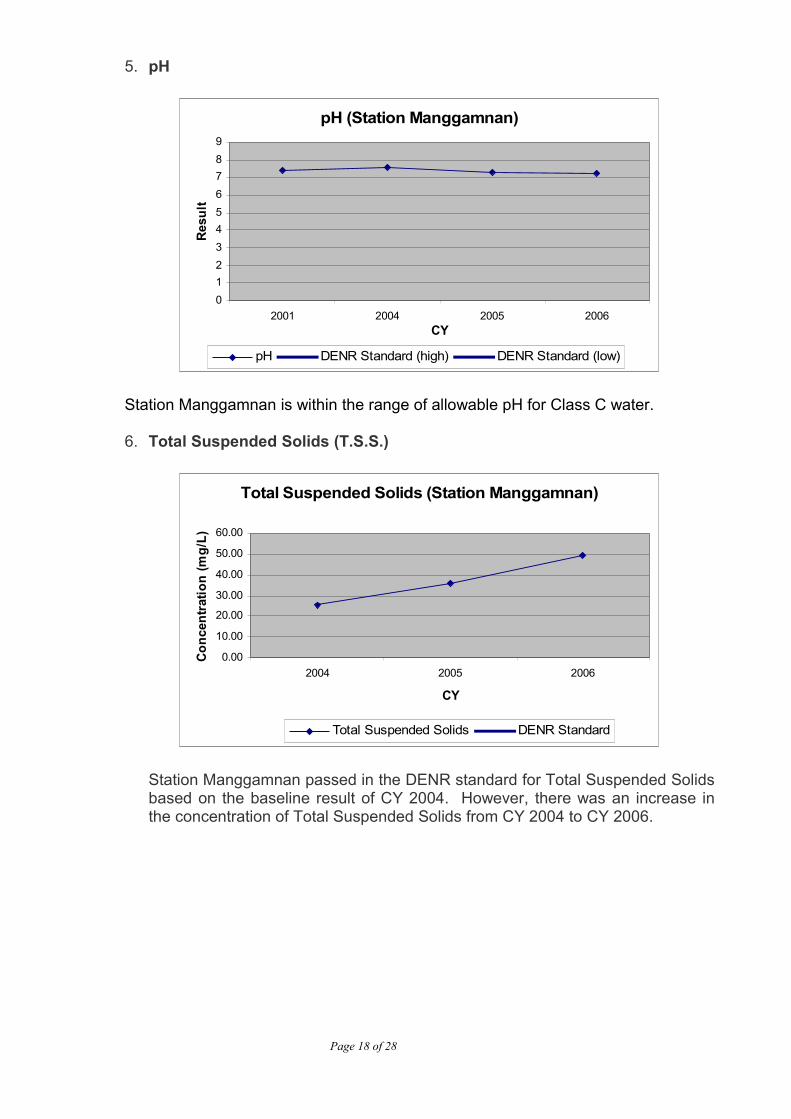
Station Manggamnan is within the range of allowable pH for Class C water.
6. Total Suspended Solids (T.S.S.)
Total Suspended Solids (Station Manggamnan)
0.00
10.00
20.00
30.00
40.00
50.00
60.00
2004 2005 2006
CY
Conc
entr
atio
n (m
g/L)
Total Suspended Solids DENR Standard
Station Manggamnan passed in the DENR standard for Total Suspended Solids based on the baseline result of CY 2004. However, there was an increase in the concentration of Total Suspended Solids from CY 2004 to CY 2006.
Page 18 of 28
c. Station No. 3 (Station Mangyan-Mababad)
1. Cadmium
Cadmium (Station Mangyan-Mababad)
0
0.002
0.004
0.006
0.008
0.01
0.012
2001 2003 2004 2005 2006
CY
Conc
entr
atio
n (m
g/L)
Cadmium DENR Standard
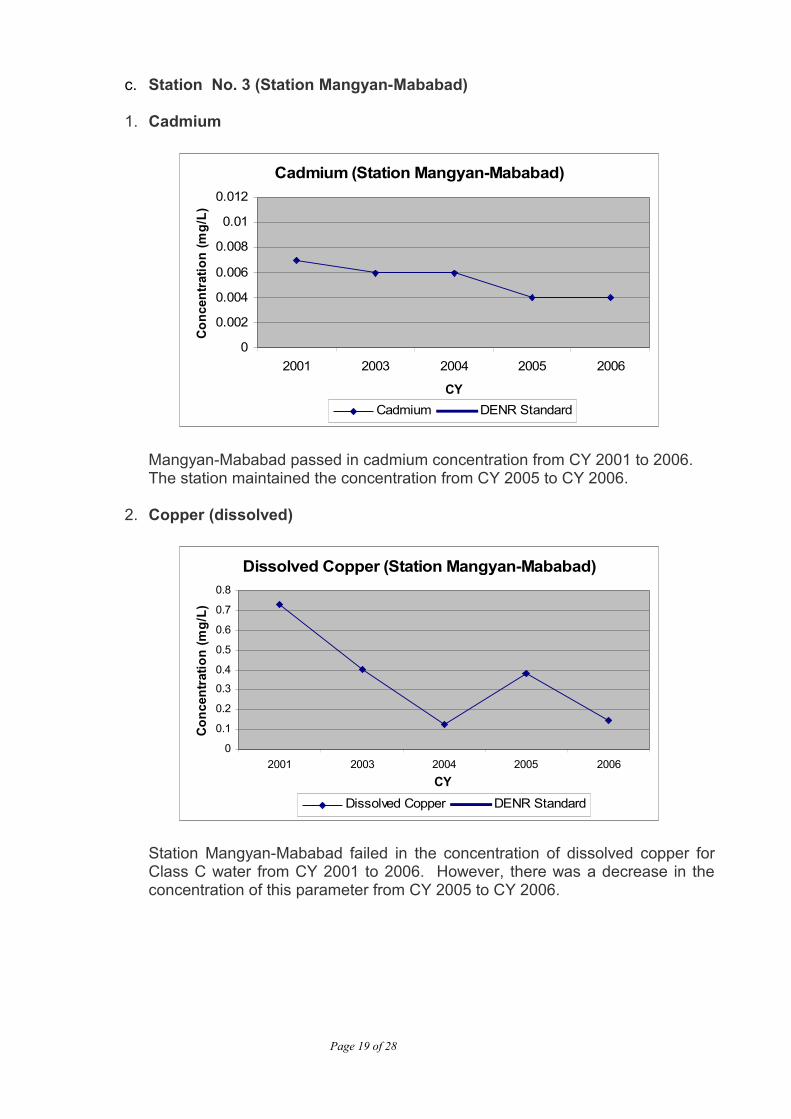
Mangyan-Mababad passed in cadmium concentration from CY 2001 to 2006. The station maintained the concentration from CY 2005 to CY 2006.
2. Copper (dissolved)
Dissolved Copper (Station Mangyan-Mababad)
0
0.1
0.2
0.3
0.4
0.5
0.6
0.7
0.8
2001 2003 2004 2005 2006CY
Conc
entr
atio
n (m
g/L)
Dissolved Copper DENR Standard
Station Mangyan-Mababad failed in the concentration of dissolved copper for Class C water from CY 2001 to 2006. However, there was a decrease in the concentration of this parameter from CY 2005 to CY 2006.
Page 19 of 28

3. Lead
Lead (Station Mangyan-Mababad)
0.04850.049
0.04950.05
0.05050.051
0.05150.052
0.05250.053
0.0535
2001 2003 2004 2005 2006
CY
Conc
entr
atio
n (m
g/L)
Lead DENR Standard
Station Mangyan-Mababad passed in the DENR standard for lead concentration from CY 2001 to 2005. The station failed in this parameter for CY 2006. The graph showed that there was an increase in the concentration from CY 2005 to CY 2006.
4. Dissolved Oxygen (D.O.)
Dissolved Oxygen (Station Mangyan-Mababad)
0123456789
10
2001 2004 2005 2006
CY
Con
cent
ratio
n (m
g/L)
Dissolved Oxygen DENR Standard
Laboratory results for Dissolved Oxygen of Mangyan-Mababad were above the minimum requirement for Class C water. The station passed the DENR Standard for this parameter. However, there is a relative decrease in the concentration of this parameter from CY 2005 to CY 2006.
Page 20 of 28

5. pH
pH (Station Mangyan-Mababad)
0123456789
2001 2004 2005 2006
CY
Resu
lt
pH DENR Standard (high) DENR Standard (low)
pH levels of station Mangyan-Mababad were within the allowable range for Class C water during CY 2001, CY 2004, CY 2005 and CY 2006. Results passed the DENR Standard for Class C water for this parameter.
6. Total Suspended Solids (T.S.S.)
Total Suspended Solids (Station Mangyan-Mababad)
0.005.00
10.0015.0020.0025.0030.0035.0040.00
2004 2005 2006CY
Con
cent
ratio
n (m
g/L)
Total Suspended Solids DENR Standard
Total suspended solids for station Mangyan-Mababad were within the DENR standard for Class C water. However, there was an increase in the concentration of Total Suspended Solids from CY 2005 to CY 2006.
Page 21 of 28

d. Station No. 4 (Station Sumangga)
1. Cadmium
Cadmium (Station Sumangga)
0
0.002
0.004
0.006
0.008
0.01
0.012
2001 2003 2004 2005 2006
CY
Conc
entr
atio
n (m
g/L)
Cadmium DENR Standard
Station Sumangga passed the DENR standard for concentration of cadmium for Class C water from CY 2001 to 2006. The station maintained its concentration of Cadmium from CY 2005 to CY 2006.
2. Copper (dissolved)
Dissolved Copper (Station Sumangga)
0
0.2
0.4
0.6
0.8
1
1.2
2001 2003 2004 2005 2006
CY
Conc
entr
atio
n (m
g/L)
Dissolved Copper DENR Standard
Station Sumangga failed the DENR Standard for level of Dissolved Copper for Class C water from CY 2001 to CY 2006. There was a relative decrease in the concentration of this parameter from CY 2005 to CY 2006.
Page 22 of 28

3. Lead
Lead (Station Sumangga)
00.010.020.030.040.050.060.070.080.090.1
2001 2003 2004 2005 2006
CY
Conc
entr
atio
n (m
g/L)
Lead DENR Standard
Station Sumangga passed the DENR standard for concentration of lead from CY 2003 to 2006, but failed on CY 2001. The station maintained its concentration of Lead from CY 2003 to CY 2006.
4. Dissolved Oxygen (D.O.)
Dissolved Oxygen (Station Sumangga)
0123456789
10
2001 2004 2005 2006CY
Conc
entr
atio
n (m
g/L)
Dissolved Oxygen DENR Standard
Station Sumangga met the DENR Standard for minimum requirement for Dissolved Oxygen for Class C water. There was an increase in the concentration of Dissolved Oxygen from CY 2005 to CY 2006.
Page 23 of 28

5. pH
pH (Station Sumangga)
0123456789
2001 2004 2005 2006
CY
Resu
lt
pH DENR Standard (high) DENR Standard (low)
Levels of pH of station Sumangga were within the acceptable range for Class C water from CY 2001 to CY 2006. There was a decrease in the level of pH from CY 2005 to CY 2006.
6. Total Suspended Solids (T.S.S.)
Total Suspended Solids (Station Sumangga)
0.00
10.00
20.00
30.00
40.00
50.00
60.00
2004 2005 2006
CY
Conc
entr
atio
n (m
g/L)
Total Suspended Solids DENR Standard
Total suspended solids for station Sumangga passed the DENR standard for Class C water. However, there was an increase in the concentration of this parameter from CY 2005 to CY 2006.
Page 24 of 28

e. Station No. 5 (Station Nangka II)
1. Cadmium
Cadmium (Station Nangka II)
0
0.002
0.004
0.006
0.008
0.01
0.012
2001 2003 2004 2005 2006
CY
Conc
entr
atio
n (m
g/L)
Cadmium DENR Standard
Station Nangka II passed the DENR standard for cadmium from CY 2001 to 2006 for Class C water. The station maintained the concentration of Cadmium from CY 2005 to CY 2006.
2. Copper (dissolved)
Dissolved Copper (Station Nangka II)
0
0.5
1
1.5
2
2.5
2001 2003 2004 2005 2006
CY
Conc
entr
atio
n (m
g/L)
Dissolved Copper DENR Standard
Station Nangka II failed the DENR standard for concentration of dissolved copper for Class C water on CYs 2001, 2003, 2005 and 2006. However there was a decrease in the concentration of Dissolved Copper from CY 2005 to CY 2006.
Page 25 of 28
3. Lead
Lead (Station Nangka II)
0
0.01
0.02
0.03
0.04
0.05
0.06
2001 2003 2004 2005 2006
CY
Conc
entr
atio
n (m
g/L)
Lead DENR Standard
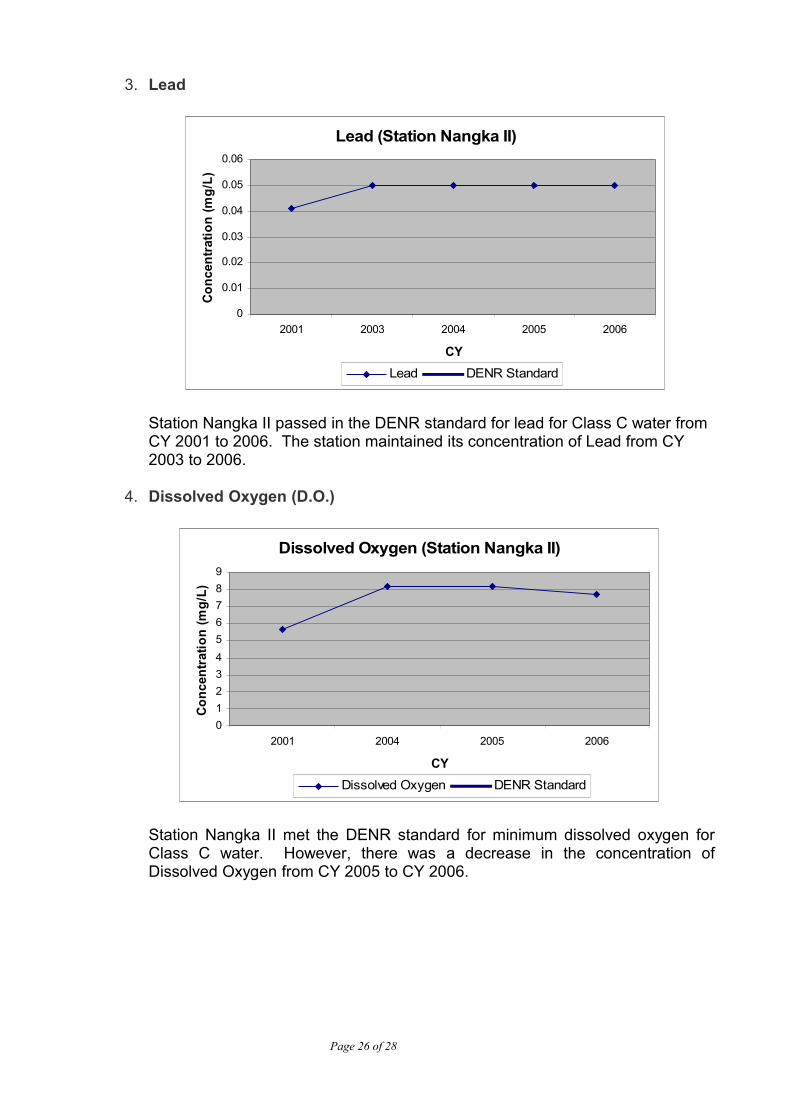
Station Nangka II passed in the DENR standard for lead for Class C water from CY 2001 to 2006. The station maintained its concentration of Lead from CY 2003 to 2006.
4. Dissolved Oxygen (D.O.)
Dissolved Oxygen (Station Nangka II)
0123456789
2001 2004 2005 2006
CY
Conc
entr
atio
n (m
g/L)
Dissolved Oxygen DENR Standard
Station Nangka II met the DENR standard for minimum dissolved oxygen for Class C water. However, there was a decrease in the concentration of Dissolved Oxygen from CY 2005 to CY 2006.
Page 26 of 28

5. pH
pH (Station Nangka II)
0123456789
2001 2004 2005 2006
CY
Resu
lt
pH DENR Standard (high) DENR Standard (low)
Levels of pH of Nangka II were within the acceptable range for Class C water. There was a decrease in the pH level of the water in station Nangka II from CY 2005 to CY 2006.
6. Total Suspended Solids (T.S.S.)
Total Suspended Solids (Station Nangka II)
0.00
10.00
20.00
30.00
40.00
50.00
60.00
2004 2005 2006
CY
Conc
entr
atio
n (m
g/L)
Total Suspended Solds DENR Standard
The levels of total suspended solids for station Nangka II passed the DENR standards for Class C water. However, there was an increase in the concentration of this parameter from CY 2005 to CY 2006.
Page 27 of 28
IV. RECOMMENDATIONS
Laboratory analysis of the samples taken at different stations established along the Mogpog River for CY 2006 indicated that the water of Mogpog River generally failed to meet the standard set by DENR for Dissolved Copper. Results showed that the copper content of the waters of Mogpog River failed to meet the acceptable limits set by DENR under Class C water. However, comparative analysis of the annual results showed that the level of Dissolved Copper is slowly decreasing from CY 2001 to CY 2006. Further, one (1) station, station Bocboc, failed in the parameter of Total Suspended Solids. The DENR Standard for this parameter was based in the the laboratory result of CY 2004 for that same parameter. Comparative analysis of the data gathered for the past years showed that the stations established along Mogpog River had a notable increase in the concentration of Total Suspended Solids. It is highly recommended that continuous water quality monitoring be sustained in Mogpog River with the continuous rehabilitation effort to reduce the concentration of Dissolved Copper in the waters of the said river. Moreover, the PENRO and CENRO Marinduque with the assistance from the Technical Staff of Environmental Management Bureau (EMB) – MIMAROPA should implement information, education and communication campaign (IEC), to disseminate the result of the sampling activities to the LGUs, NGOs and other concerned local communities. Through IEC, they will be informed about the activities conducted by the PENR Office within their area of jurisdiction. The results of the samplings made for this year were correlated to the rest of the samplings made during the previous years to establish trend in water quality for evaluation and development of measures to mitigate the high level of dissolved and total copper of Mogpog River.
Prepared by:
DAN GOODWIN S. BORJAPCD Technical Staff
Reviewed by:
RUHEL R. CACABELOSOIC, Water Quality Management Section
Recommending Approval:
EDNA P. QUINDOZAOIC, Pollution Control Division
Approved by:
REYNALDO R. VILLAFUERTERegional DirectorDENR-EMB- Region IVB
Page 28 of 28


