ANNUAL UGANDA REPORT - brac.netOur ultra poor graduation initiative comprises advocacy efforts and...
86
UGANDA 2016 ANNUAL REPORT
Transcript of ANNUAL UGANDA REPORT - brac.netOur ultra poor graduation initiative comprises advocacy efforts and...
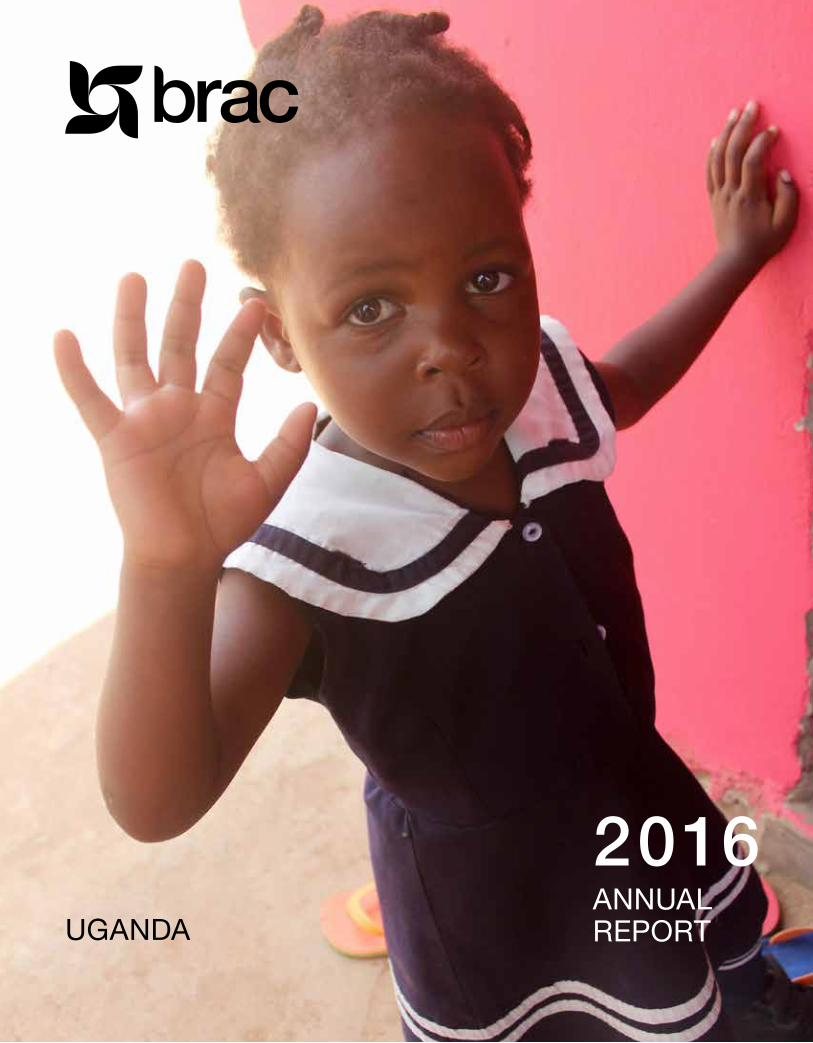
UGANDA
2016ANNUAL
REPORT
Integrity
Innovation
Inclusiveness
Effectiveness
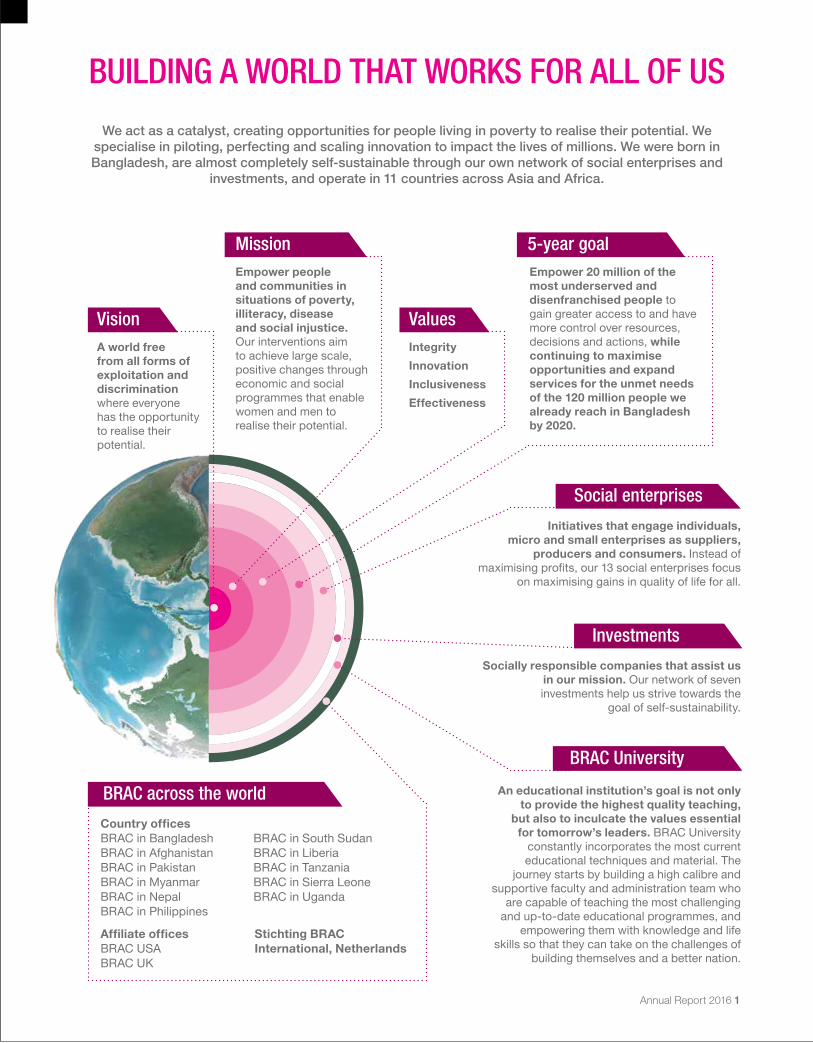
Country officesBRAC in Bangladesh BRAC in South Sudan
BRAC in Afghanistan BRAC in Liberia
BRAC in Pakistan BRAC in Tanzania
BRAC in Myanmar BRAC in Sierra Leone
BRAC in Nepal BRAC in Uganda
BRAC in Philippines
An educational institution’s goal is not only to provide the highest quality teaching,
but also to inculcate the values essential for tomorrow’s leaders. BRAC University
constantly incorporates the most current
educational techniques and material. The
journey starts by building a high calibre and
supportive faculty and administration team who
are capable of teaching the most challenging
and up-to-date educational programmes, and
empowering them with knowledge and life
skills so that they can take on the challenges of
building themselves and a better nation.
Vision
Mission
Values
5-year goal
Social enterprises
Investments
BRAC University
BRAC across the world
BUILDING A WORLD THAT WORKS FOR ALL OF US
We act as a catalyst, creating opportunities for people living in poverty to realise their potential. We specialise in piloting, perfecting and scaling innovation to impact the lives of millions. We were born in Bangladesh, are almost completely self-sustainable through our own network of social enterprises and
investments, and operate in 11 countries across Asia and Africa.
A world free from all forms of exploitation and discrimination where everyone
has the opportunity
to realise their
potential.
Empower people and communities in situations of poverty, illiteracy, disease and social injustice. Our interventions aim
to achieve large scale,
positive changes through
economic and social
programmes that enable
women and men to
realise their potential.
Empower 20 million of the most underserved and disenfranchised people to
gain greater access to and have
more control over resources,
decisions and actions, while
continuing to maximise opportunities and expand services for the unmet needs of the 120 million people we already reach in Bangladesh by 2020.
Initiatives that engage individuals,micro and small enterprises as suppliers,
producers and consumers. Instead of
maximising profits, our 13 social enterprises focus on maximising gains in quality of life for all.
Socially responsible companies that assist us in our mission. Our network of seven
investments help us strive towards the
goal of self-sustainability.
Affiliate officesBRAC USA
BRAC UK
Stichting BRAC International, Netherlands
Annual Report 2016 1

If you were to describe this world to a child,which one of the following would you pick?
Our world is our playground, a platform for the
creativity of all seven billion of us.
It is home to magic, art, beauty, and tens of thousands of years of human talent.
Or would you say, even though it may be true,
that our world is where we live, but it is a place that doesn’t work for everyone?
Sometimes it’s hard to believe that a world that works for all of us can be possible.
But the opportunities are all around us.
While we all hope for a better future for our world,
many of us are building it.
If you are a builder, we are betting on you.
The changemaker. The activist. The hero. The mentor.
45 years ago, we started building a world we all want to live in. We started in Bangladesh.
We listened and learnt, failed and got up again.
We never stopped trying. And we never will.
We trust in people, and we take on the impossible, every day.
Fighting poverty, building platforms for tolerance, equality and inclusion,
saying no to violence against women and children.
We pilot, perfect and scale. Our DNA is to build.
As the sun rose this morning, hundreds of thousands of builders rose with
it. Teachers across eight countries opened the colourful doors of the
world’s biggest secular private education system. 65,000 artisans picked
up their needles and started weaving traditional art into beautiful clothing.
Credit officers in one of the world’s largest microfinance institutions sat down with women in the remotest corners of seven countries.
doing good is everyone’s business.
We have never faced bigger challenges but we have never been more ready.
Whoever you are, wherever you are,
Annual Report 2016 2 Annual Report 2016 3
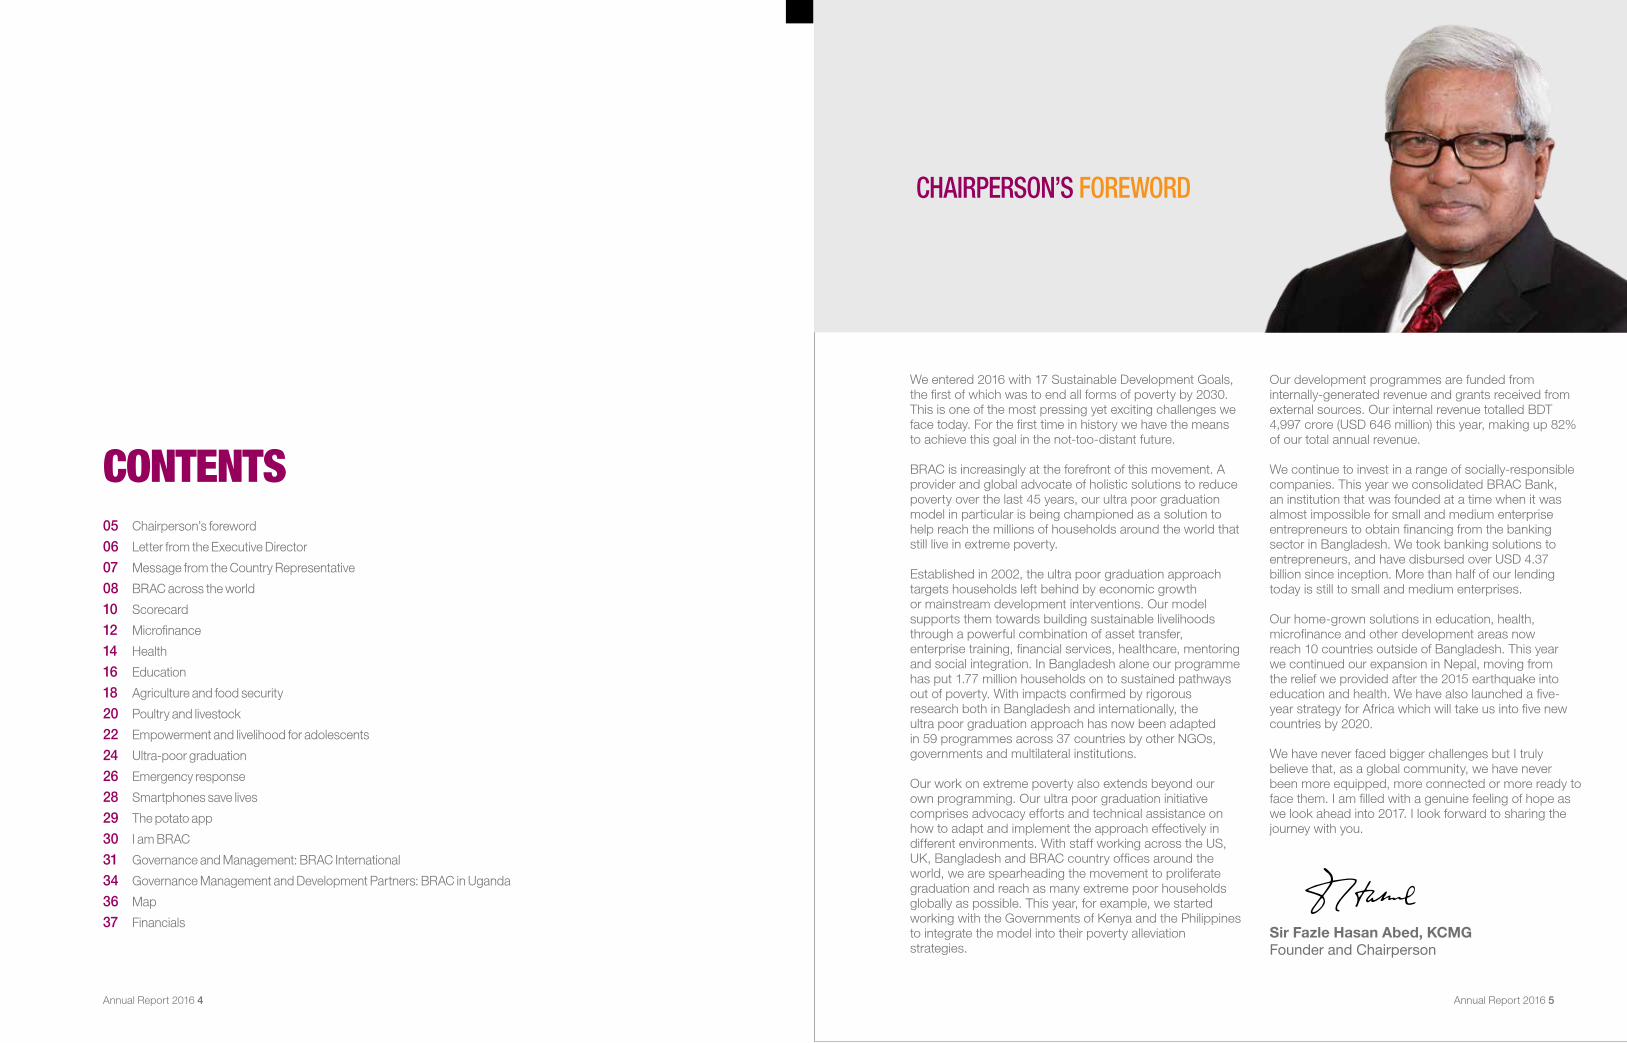
CHAIRPERSON’S FOREWORD
We entered 2016 with 17 Sustainable Development Goals,
the first of which was to end all forms of poverty by 2030. This is one of the most pressing yet exciting challenges we face today. For the first time in history we have the means to achieve this goal in the not-too-distant future.
BRAC is increasingly at the forefront of this movement. A provider and global advocate of holistic solutions to reduce poverty over the last 45 years, our ultra poor graduation model in particular is being championed as a solution to help reach the millions of households around the world that still live in extreme poverty.
Established in 2002, the ultra poor graduation approach targets households left behind by economic growth or mainstream development interventions. Our model supports them towards building sustainable livelihoods through a powerful combination of asset transfer, enterprise training, financial services, healthcare, mentoring and social integration. In Bangladesh alone our programme has put 1.77 million households on to sustained pathways out of poverty. With impacts confirmed by rigorous research both in Bangladesh and internationally, the ultra poor graduation approach has now been adapted in 59 programmes across 37 countries by other NGOs, governments and multilateral institutions.
Our work on extreme poverty also extends beyond our own programming. Our ultra poor graduation initiative comprises advocacy efforts and technical assistance on how to adapt and implement the approach effectively in different environments. With staff working across the US, UK, Bangladesh and BRAC country offices around the world, we are spearheading the movement to proliferate graduation and reach as many extreme poor households globally as possible. This year, for example, we started working with the Governments of Kenya and the Philippines to integrate the model into their poverty alleviation strategies.
Our development programmes are funded from internally-generated revenue and grants received from external sources. Our internal revenue totalled BDT 4,997 crore (USD 646 million) this year, making up 82% of our total annual revenue.
We continue to invest in a range of socially-responsible companies. This year we consolidated BRAC Bank, an institution that was founded at a time when it was almost impossible for small and medium enterprise entrepreneurs to obtain financing from the banking sector in Bangladesh. We took banking solutions to entrepreneurs, and have disbursed over USD 4.37 billion since inception. More than half of our lending today is still to small and medium enterprises.
Our home-grown solutions in education, health, microfinance and other development areas now reach 10 countries outside of Bangladesh. This year we continued our expansion in Nepal, moving from the relief we provided after the 2015 earthquake into education and health. We have also launched a five-year strategy for Africa which will take us into five new countries by 2020.
We have never faced bigger challenges but I truly believe that, as a global community, we have never been more equipped, more connected or more ready to face them. I am filled with a genuine feeling of hope as we look ahead into 2017. I look forward to sharing the journey with you.
Sir Fazle Hasan Abed, KCMGFounder and Chairperson
CONTENTS 05 Chairperson’s foreword
06 Letter from the Executive Director
07 Message from the Country Representative
08 BRAC across the world
10 Scorecard
12 Microfinance
14 Health
16 Education
18 Agriculture and food security
20 Poultry and livestock
22 Empowerment and livelihood for adolescents
24 Ultra-poor graduation
26 Emergency response
28 Smartphones save lives
29 The potato app
30 I am BRAC
31 Governance and Management: BRAC International
34 Governance Management and Development Partners: BRAC in Uganda
36 Map
37 Financials
Annual Report 2016 4 Annual Report 2016 5
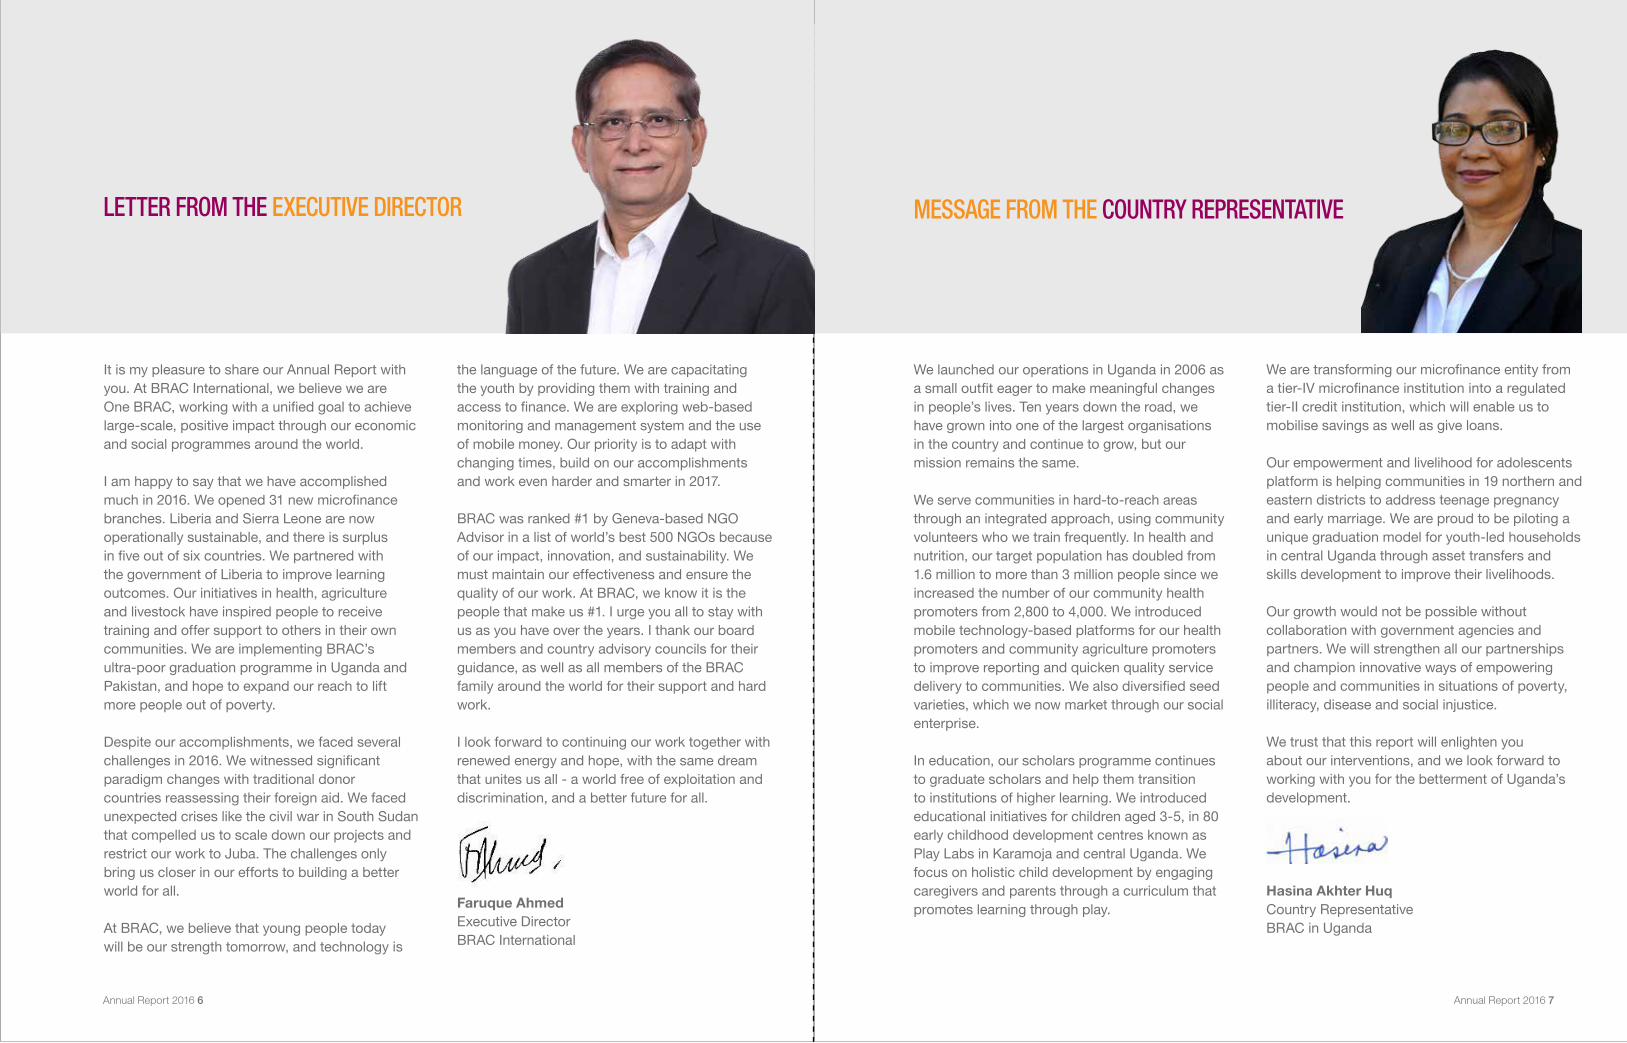
It is my pleasure to share our Annual Report with you. At BRAC International, we believe we are One BRAC, working with a unified goal to achieve large-scale, positive impact through our economic and social programmes around the world.
I am happy to say that we have accomplished much in 2016. We opened 31 new microfinance branches. Liberia and Sierra Leone are now operationally sustainable, and there is surplus in five out of six countries. We partnered with the government of Liberia to improve learning outcomes. Our initiatives in health, agriculture and livestock have inspired people to receive training and offer support to others in their own communities. We are implementing BRAC’s ultra-poor graduation programme in Uganda and Pakistan, and hope to expand our reach to lift more people out of poverty.
Despite our accomplishments, we faced several challenges in 2016. We witnessed significant paradigm changes with traditional donor countries reassessing their foreign aid. We faced unexpected crises like the civil war in South Sudan that compelled us to scale down our projects and restrict our work to Juba. The challenges only bring us closer in our efforts to building a better world for all.
At BRAC, we believe that young people today will be our strength tomorrow, and technology is
the language of the future. We are capacitating the youth by providing them with training and access to finance. We are exploring web-based monitoring and management system and the use of mobile money. Our priority is to adapt with changing times, build on our accomplishments and work even harder and smarter in 2017.
BRAC was ranked #1 by Geneva-based NGO Advisor in a list of world’s best 500 NGOs because of our impact, innovation, and sustainability. We must maintain our effectiveness and ensure the quality of our work. At BRAC, we know it is the people that make us #1. I urge you all to stay with us as you have over the years. I thank our board members and country advisory councils for their guidance, as well as all members of the BRAC family around the world for their support and hard work.
I look forward to continuing our work together with renewed energy and hope, with the same dream that unites us all - a world free of exploitation and discrimination, and a better future for all.
Faruque AhmedExecutive DirectorBRAC International
LETTER FROM THE EXECUTIVE DIRECTOR MESSAGE FROM THE COUNTRY REPRESENTATIVE
We launched our operations in Uganda in 2006 as a small outfit eager to make meaningful changes in people’s lives. Ten years down the road, we have grown into one of the largest organisations in the country and continue to grow, but our mission remains the same.
We serve communities in hard-to-reach areas through an integrated approach, using community volunteers who we train frequently. In health and nutrition, our target population has doubled from 1.6 million to more than 3 million people since we increased the number of our community health promoters from 2,800 to 4,000. We introduced mobile technology-based platforms for our health promoters and community agriculture promoters to improve reporting and quicken quality service delivery to communities. We also diversified seed varieties, which we now market through our social enterprise.
In education, our scholars programme continues to graduate scholars and help them transition to institutions of higher learning. We introduced educational initiatives for children aged 3-5, in 80 early childhood development centres known as Play Labs in Karamoja and central Uganda. We focus on holistic child development by engaging caregivers and parents through a curriculum that promotes learning through play.
We are transforming our microfinance entity from a tier-IV microfinance institution into a regulated tier-II credit institution, which will enable us to mobilise savings as well as give loans.
Our empowerment and livelihood for adolescents platform is helping communities in 19 northern and eastern districts to address teenage pregnancy and early marriage. We are proud to be piloting a unique graduation model for youth-led households in central Uganda through asset transfers and skills development to improve their livelihoods.
Our growth would not be possible without collaboration with government agencies and partners. We will strengthen all our partnerships and champion innovative ways of empowering people and communities in situations of poverty, illiteracy, disease and social injustice.
We trust that this report will enlighten you about our interventions, and we look forward to working with you for the betterment of Uganda’s development.
Hasina Akhter HuqCountry RepresentativeBRAC in Uganda
Annual Report 2016 6 Annual Report 2016 7

Annual Report 2016 8 Annual Report 2016 9
BRAC ACROSS THE WORLD
AFSP: Agriculture and Food Security ProgrammeBEP: BRAC Education ProgrammeCDP: Capacity Development ProgrammeCEP: Community Empowerment Programme
DMCC: Disaster, Management and Climate ChangeELA: Empowerment and Livelihood for Adolescents ERP: Emergency Response ProgrammeGJD: Gender Justice and Diversity
HNPP: Health, Nutrition and Population ProgrammeHRLS: Human Rights and Legal Aid ServicesIDP: Integrated Development ProgrammeMF: MicrofinanceMG: Migration
SDP: Skills Development ProgrammeTUP: Targeting the Ultra PoorUDP: Urban Development Programme WASH: Water, Sanitation and Hygiene
USAInitiated: 2007
An independent charity to raise profile and funds for BRAC globally
UKInitiated: 2006
An independent charity to raise profile and funds for BRAC globally
NETHERLANDSInitiated: 2009
Stichting BRAC International registered as a foundation
UGANDAInitiated: 2006
AFSP, Education, ELA, ERP, Health, MF, TUP
TANZANIAInitiated: 2006
AFSP, Education, ELA, ERP, MF
SIERRA LEONEInitiated: 2008
AFSP, ELA, ERP, Health, MF
SOUTH SUDANInitiated: 2007
AFSP, Education, ELA, ERP, Health
LIBERIAInitiated: 2008
AFSP, Education, ELA, ERP, Health, MF
AFGHANISTAN
Initiated: 2002
AFSP, Education, CDP, ERP, Health, NSP
PAKISTANInitiated: 2007
Education, ERP, MF, Health, TUP
NEPALInitiated: 2015
ERP, ELA, Health, WASH
MYANMARInitiated: 2013
ERP, MF
BANGLADESH
Initiated: 1972
AFSP, BEP, CEP, DMCC, GJD, HNPP, HRLS, IDP, MF, MG, SDP, TUP, UDP, WASH
PHILIPPINESInitiated: 2012
Education
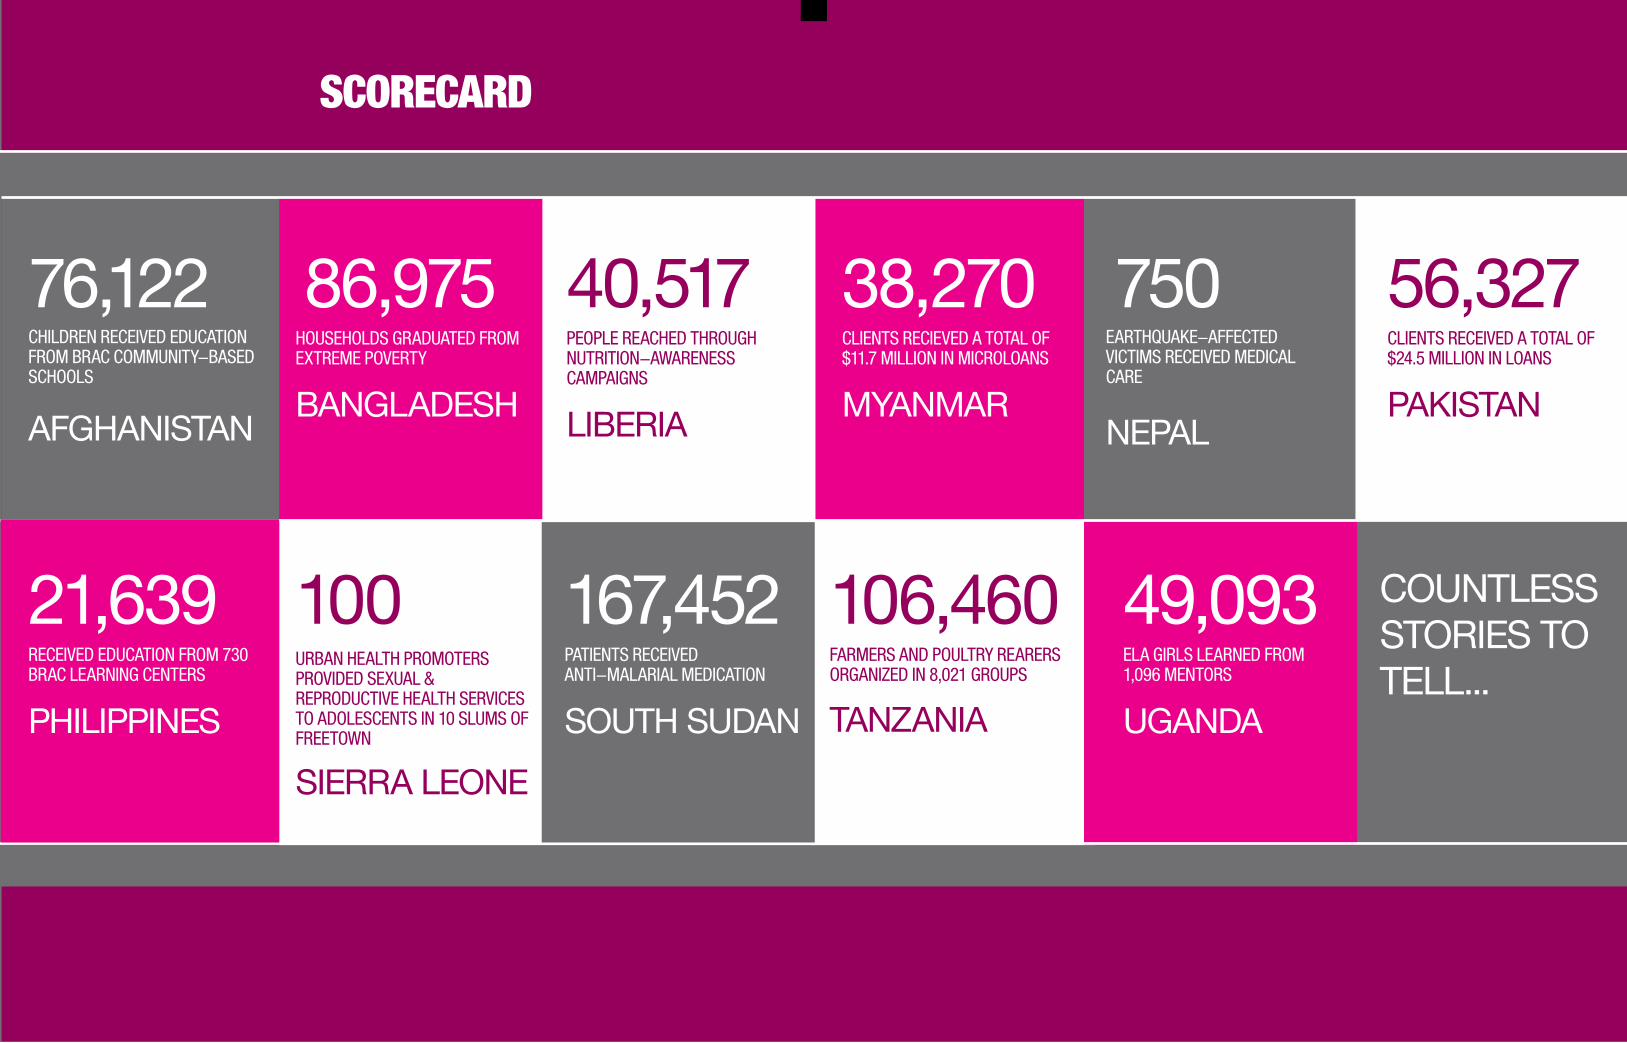
750 EARTHQUAKE-AFFECTED VICTIMS RECEIVED MEDICAL CARE
NEPAL
100 URBAN HEALTH PROMOTERS PROVIDED SEXUAL & REPRODUCTIVE HEALTH SERVICES TO ADOLESCENTS IN 10 SLUMS OF FREETOWN
SIERRA LEONE
76,122CHILDREN RECEIVED EDUCATION FROM BRAC COMMUNITY-BASED SCHOOLS
AFGHANISTAN
106,460FARMERS AND POULTRY REARERS ORGANIZED IN 8,021 GROUPS
TANZANIA
40,517PEOPLE REACHED THROUGH NUTRITION-AWARENESS CAMPAIGNS
LIBERIA
49,093ELA GIRLS LEARNED FROM 1,096 MENTORS
UGANDA
86,975 HOUSEHOLDS GRADUATED FROM EXTREME POVERTY
BANGLADESH
38,270 CLIENTS RECIEVED A TOTAL OF $11.7 MILLION IN MICROLOANS
MYANMAR
56,327CLIENTS RECEIVED A TOTAL OF $24.5 MILLION IN LOANS
PAKISTAN
COUNTLESS STORIES TO TELL...
SCORECARD
167,452PATIENTS RECEIVEDANTI-MALARIAL MEDICATION
SOUTH SUDAN
21,639RECEIVED EDUCATION FROM 730 BRAC LEARNING CENTERS
PHILIPPINES
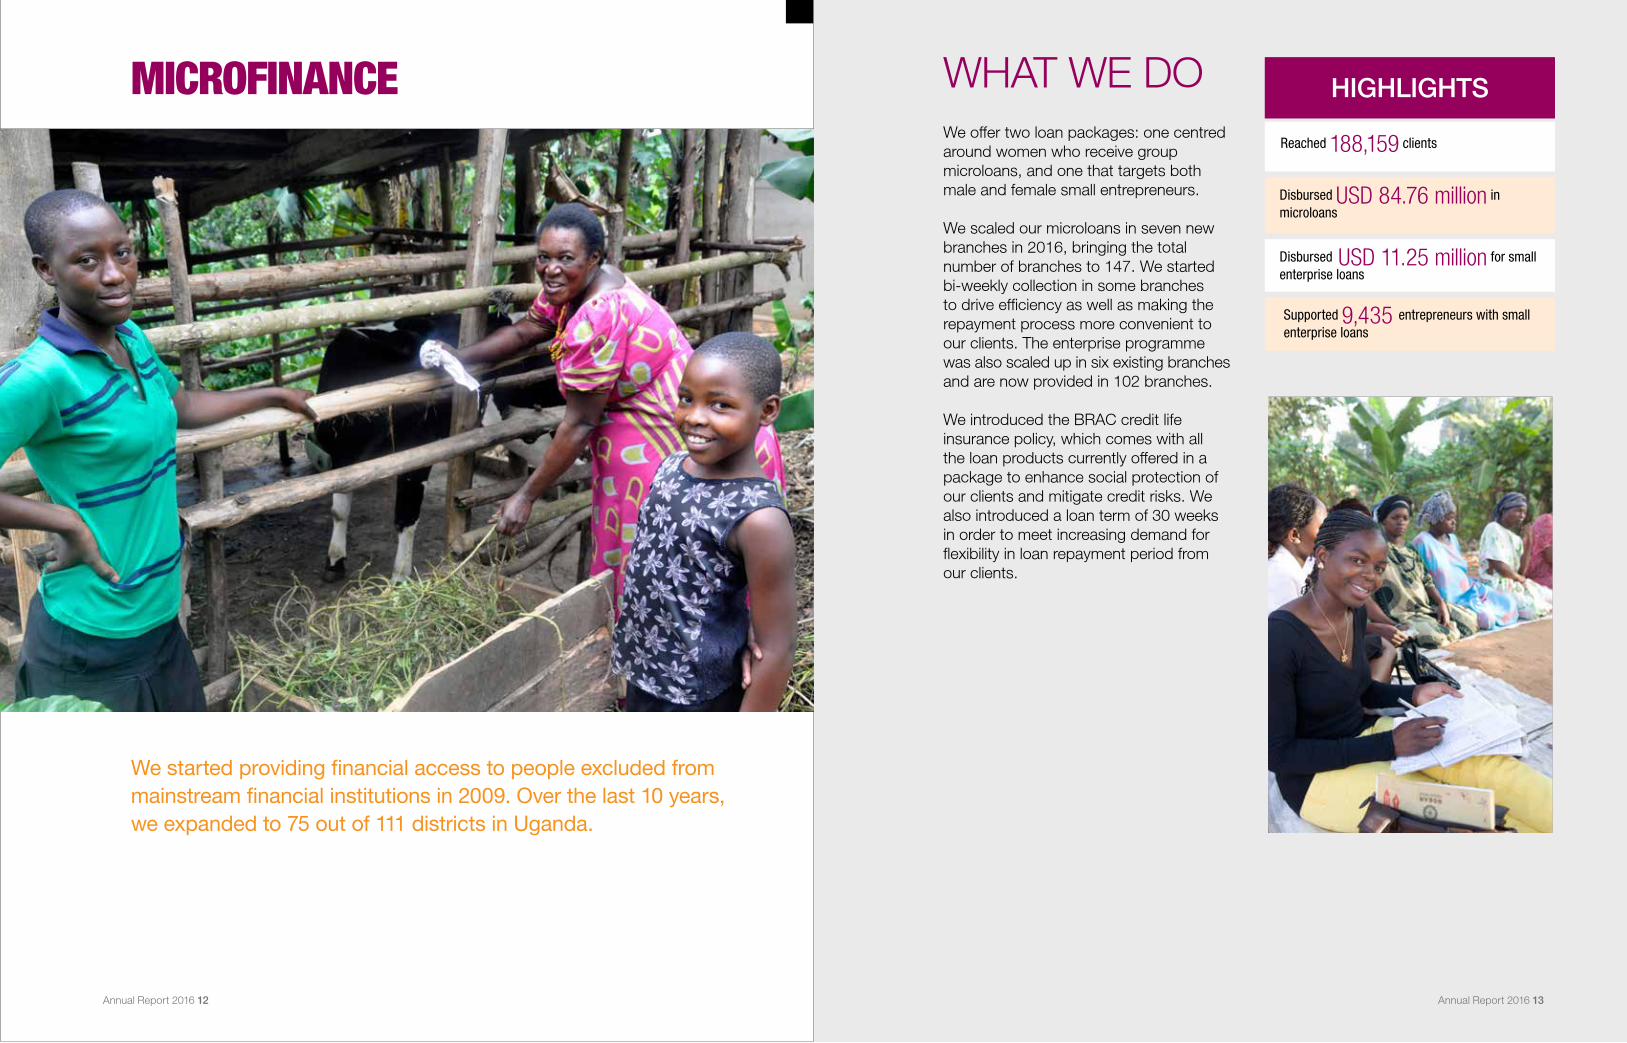
MICROFINANCE
We started providing financial access to people excluded from mainstream financial institutions in 2009. Over the last 10 years, we expanded to 75 out of 111 districts in Uganda.
Reached 188,159 clients
Disbursed USD 84.76 million in microloans
HIGHLIGHTS
Disbursed USD 11.25 million for small enterprise loans
Supported 9,435 entrepreneurs with small enterprise loans
WHAT WE DOWe offer two loan packages: one centred around women who receive group microloans, and one that targets both male and female small entrepreneurs.
We scaled our microloans in seven new branches in 2016, bringing the total number of branches to 147. We started bi-weekly collection in some branches to drive efficiency as well as making the repayment process more convenient to our clients. The enterprise programme was also scaled up in six existing branches and are now provided in 102 branches.
We introduced the BRAC credit life insurance policy, which comes with all the loan products currently offered in a package to enhance social protection of our clients and mitigate credit risks. We also introduced a loan term of 30 weeks in order to meet increasing demand for flexibility in loan repayment period from our clients.
Annual Report 2016 12 Annual Report 2016 13
HEALTH
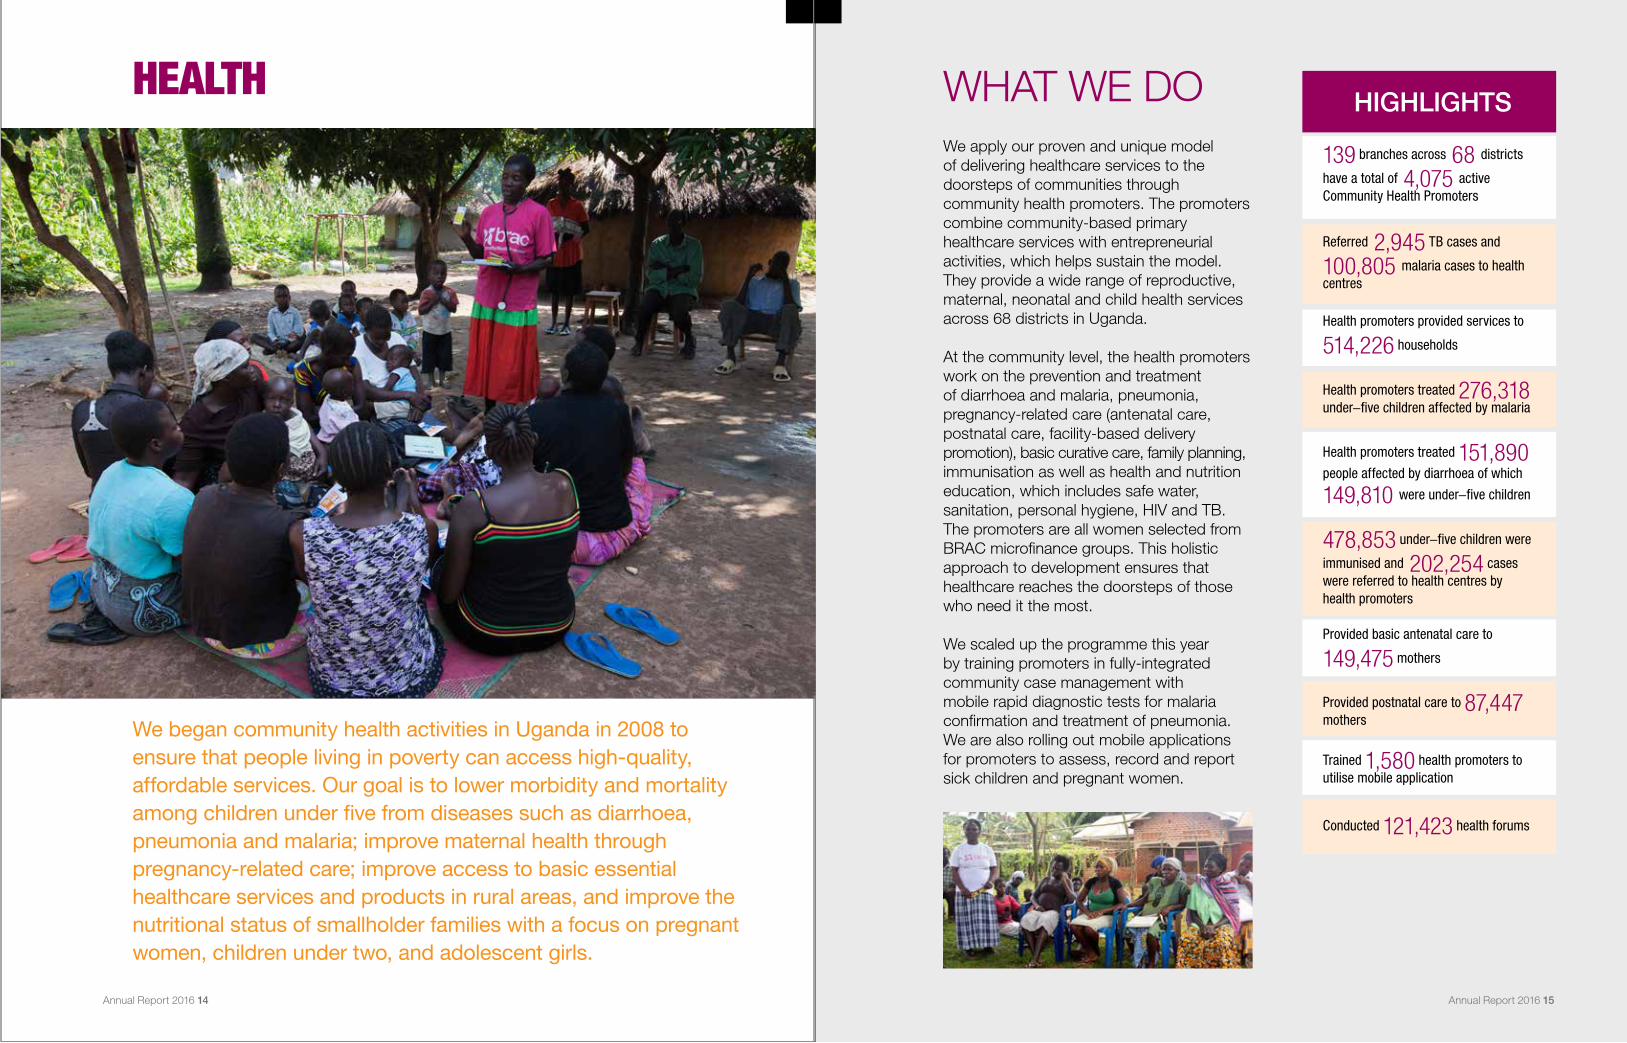
We began community health activities in Uganda in 2008 to ensure that people living in poverty can access high-quality, affordable services. Our goal is to lower morbidity and mortality among children under five from diseases such as diarrhoea, pneumonia and malaria; improve maternal health through pregnancy-related care; improve access to basic essential healthcare services and products in rural areas, and improve the nutritional status of smallholder families with a focus on pregnant women, children under two, and adolescent girls.
Health promoters provided services to
514,226 households
Health promoters treated 276,318 under-five children affected by malaria
HIGHLIGHTS139 branches across 68 districts
have a total of 4,075 active Community Health Promoters
Referred 2,945 TB cases and 100,805 malaria cases to health centres
WHAT WE DOWe apply our proven and unique model of delivering healthcare services to the doorsteps of communities through community health promoters. The promoters combine community-based primary healthcare services with entrepreneurial activities, which helps sustain the model. They provide a wide range of reproductive, maternal, neonatal and child health services across 68 districts in Uganda.
At the community level, the health promoters work on the prevention and treatment of diarrhoea and malaria, pneumonia, pregnancy-related care (antenatal care, postnatal care, facility-based delivery promotion), basic curative care, family planning, immunisation as well as health and nutrition
education, which includes safe water, sanitation, personal hygiene, HIV and TB. The promoters are all women selected from BRAC microfinance groups. This holistic approach to development ensures that healthcare reaches the doorsteps of those who need it the most.
We scaled up the programme this year by training promoters in fully-integrated community case management with mobile rapid diagnostic tests for malaria confirmation and treatment of pneumonia. We are also rolling out mobile applications for promoters to assess, record and report sick children and pregnant women.
Health promoters treated 151,890
people affected by diarrhoea of which
149,810 were under-five children
478,853 under-five children were
immunised and 202,254 cases were referred to health centres by health promoters
Provided basic antenatal care to
149,475 mothers
Provided postnatal care to 87,447 mothers
Trained 1,580 health promoters to utilise mobile application
Conducted 121,423 health forums
HIGHLIGHTS
Annual Report 2016 14 Annual Report 2016 15
EDUCATION
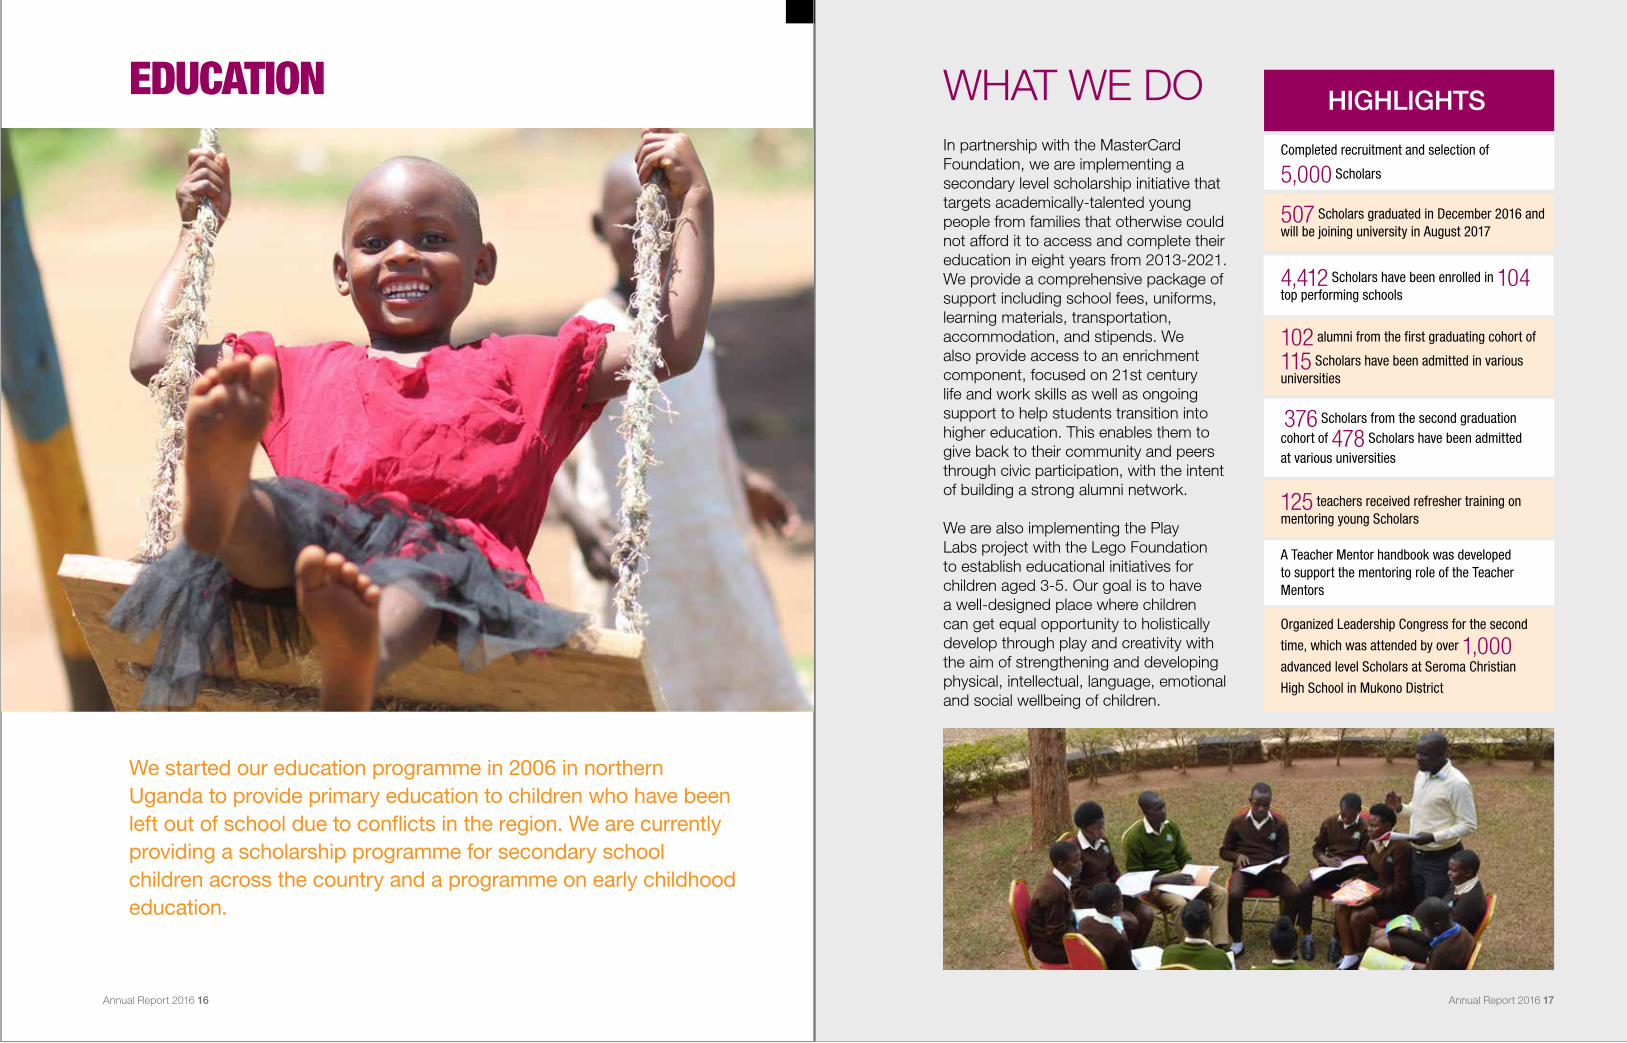
We started our education programme in 2006 in northern Uganda to provide primary education to children who have been left out of school due to conflicts in the region. We are currently providing a scholarship programme for secondary school children across the country and a programme on early childhood education.
HIGHLIGHTS
Completed recruitment and selection of
5,000 Scholars
WHAT WE DOIn partnership with the MasterCard Foundation, we are implementing a secondary level scholarship initiative that targets academically-talented young people from families that otherwise could not afford it to access and complete their education in eight years from 2013-2021. We provide a comprehensive package of support including school fees, uniforms, learning materials, transportation, accommodation, and stipends. We also provide access to an enrichment component, focused on 21st century life and work skills as well as ongoing support to help students transition into
higher education. This enables them to give back to their community and peers through civic participation, with the intent of building a strong alumni network.
We are also implementing the Play Labs project with the Lego Foundation to establish educational initiatives for children aged 3-5. Our goal is to have a well-designed place where children can get equal opportunity to holistically develop through play and creativity with the aim of strengthening and developing physical, intellectual, language, emotional and social wellbeing of children.
507 Scholars graduated in December 2016 and will be joining university in August 2017
4,412 Scholars have been enrolled in 104 top performing schools
102 alumni from the first graduating cohort of
115 Scholars have been admitted in various universities
376 Scholars from the second graduation cohort of 478 Scholars have been admitted at various universities
125 teachers received refresher training on mentoring young Scholars
A Teacher Mentor handbook was developed to support the mentoring role of the Teacher Mentors
Organized Leadership Congress for the second
time, which was attended by over 1,000
advanced level Scholars at Seroma Christian
High School in Mukono District
Annual Report 2016 16 Annual Report 2016 17
AGRICULTURE AND FOOD SECURITY
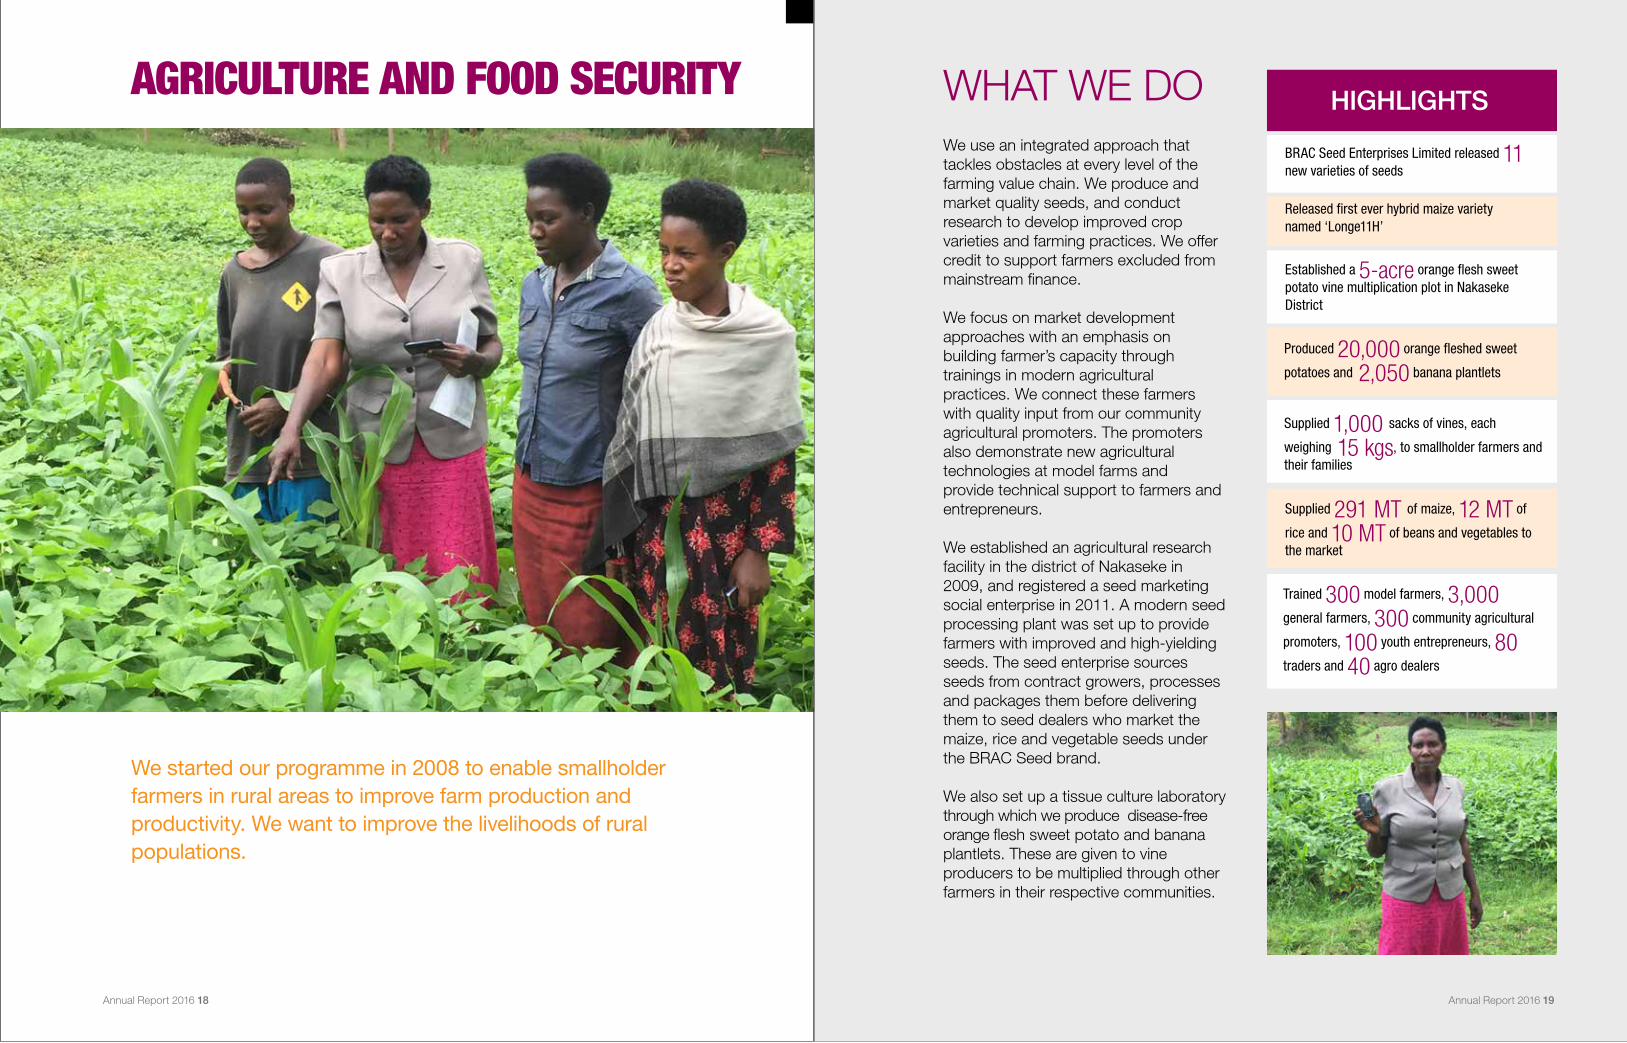
We started our programme in 2008 to enable smallholder farmers in rural areas to improve farm production and productivity. We want to improve the livelihoods of rural populations.
HIGHLIGHTSWHAT WE DOWe use an integrated approach that tackles obstacles at every level of the farming value chain. We produce and market quality seeds, and conduct research to develop improved crop varieties and farming practices. We offer credit to support farmers excluded from mainstream finance.
We focus on market development approaches with an emphasis on building farmer’s capacity through trainings in modern agricultural practices. We connect these farmers with quality input from our community agricultural promoters. The promoters also demonstrate new agricultural technologies at model farms and provide technical support to farmers and entrepreneurs.
We established an agricultural research facility in the district of Nakaseke in 2009, and registered a seed marketing social enterprise in 2011. A modern seed processing plant was set up to provide farmers with improved and high-yielding seeds. The seed enterprise sources seeds from contract growers, processes and packages them before delivering them to seed dealers who market the maize, rice and vegetable seeds under the BRAC Seed brand.
We also set up a tissue culture laboratory through which we produce disease-free orange flesh sweet potato and banana plantlets. These are given to vine producers to be multiplied through other farmers in their respective communities.
BRAC Seed Enterprises Limited released 11 new varieties of seeds
Produced 20,000 orange fleshed sweet
potatoes and 2,050 banana plantlets
Released first ever hybrid maize variety named ‘Longe11H’
Established a 5-acre orange flesh sweet potato vine multiplication plot in Nakaseke District
Supplied 1,000 sacks of vines, each
weighing 15 kgs, to smallholder farmers and their families
Supplied 291 MT of maize, 12 MT of
rice and 10 MT of beans and vegetables to the market
Trained 300 model farmers, 3,000
general farmers, 300 community agricultural
promoters, 100 youth entrepreneurs, 80
traders and 40 agro dealers
Annual Report 2016 18 Annual Report 2016 19
POULTRY AND LIVESTOCK
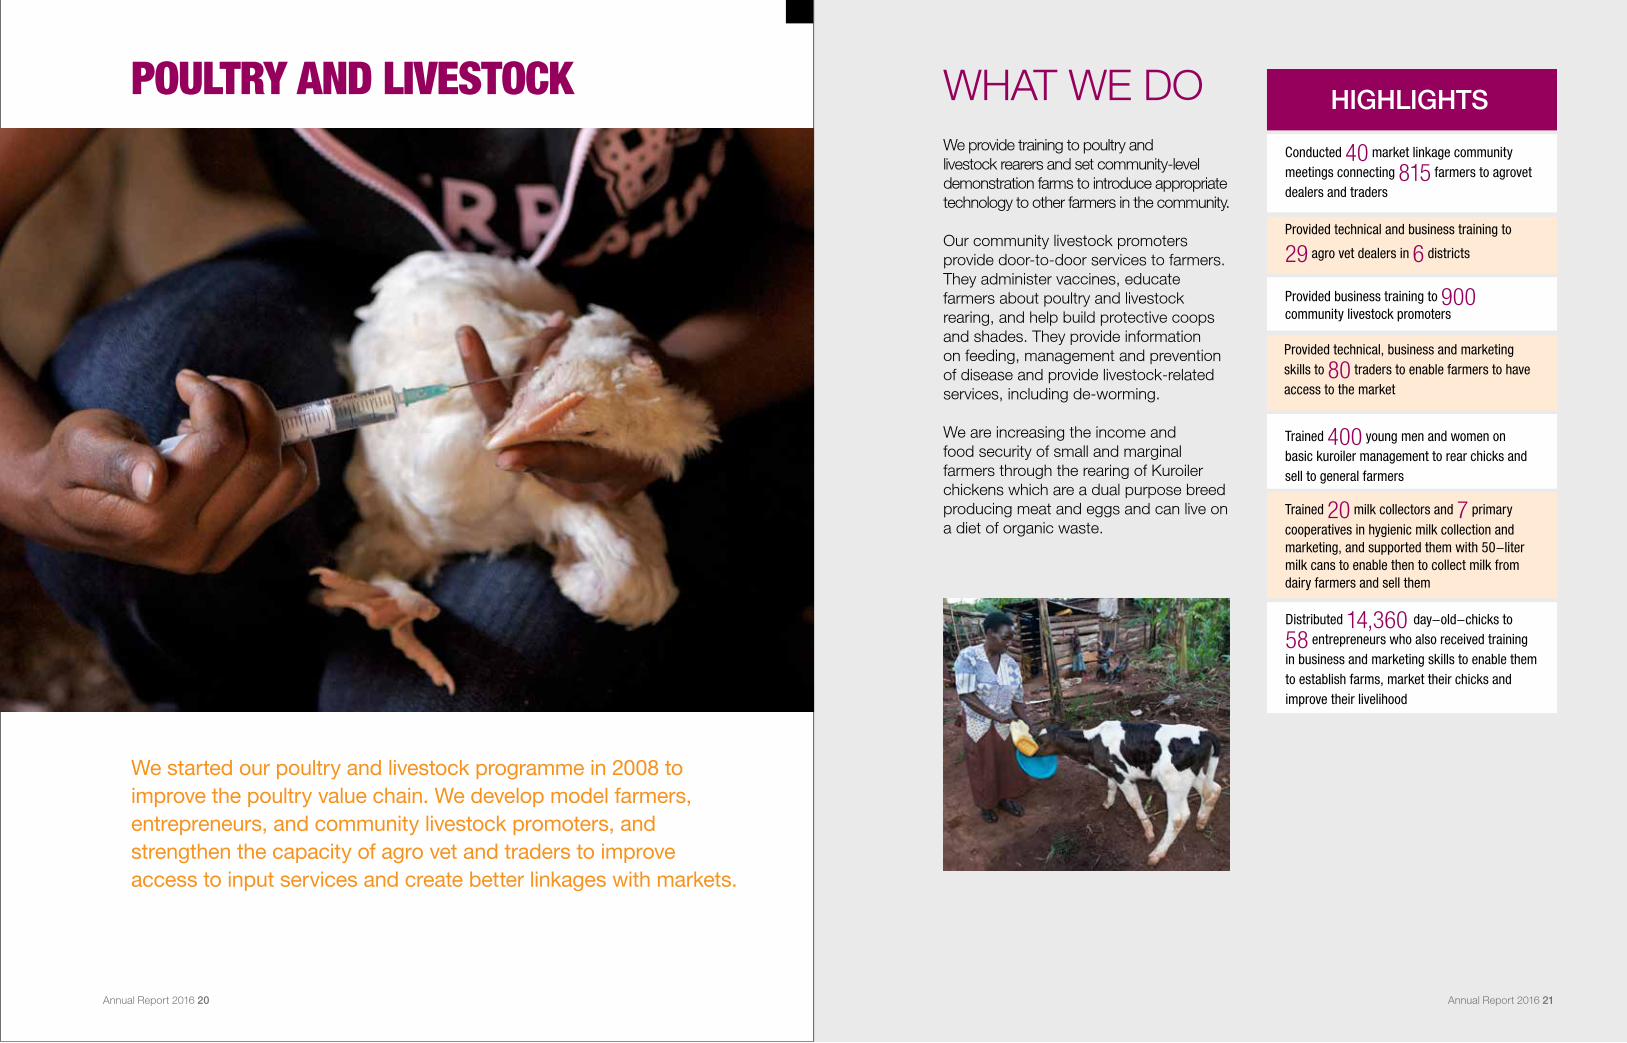
We started our poultry and livestock programme in 2008 to improve the poultry value chain. We develop model farmers, entrepreneurs, and community livestock promoters, and strengthen the capacity of agro vet and traders to improve access to input services and create better linkages with markets.
HIGHLIGHTSWHAT WE DOWe provide training to poultry and livestock rearers and set community-level demonstration farms to introduce appropriate technology to other farmers in the community.
Our community livestock promoters provide door-to-door services to farmers. They administer vaccines, educate farmers about poultry and livestock rearing, and help build protective coops and shades. They provide information on feeding, management and prevention of disease and provide livestock-related services, including de-worming.
We are increasing the income and food security of small and marginal farmers through the rearing of Kuroiler chickens which are a dual purpose breed producing meat and eggs and can live on a diet of organic waste.
Conducted 40 market linkage community meetings connecting 815 farmers to agrovet dealers and traders
Provided technical, business and marketing skills to 80 traders to enable farmers to have access to the market
Provided technical and business training to
29 agro vet dealers in 6 districts
Trained 400 young men and women on basic kuroiler management to rear chicks and sell to general farmers
Trained 20 milk collectors and 7 primary cooperatives in hygienic milk collection and marketing, and supported them with 50-liter milk cans to enable then to collect milk from dairy farmers and sell them
Provided business training to 900 community livestock promoters
Distributed 14,360 day-old-chicks to
58 entrepreneurs who also received training in business and marketing skills to enable them to establish farms, market their chicks and improve their livelihood
Annual Report 2016 20 Annual Report 2016 21
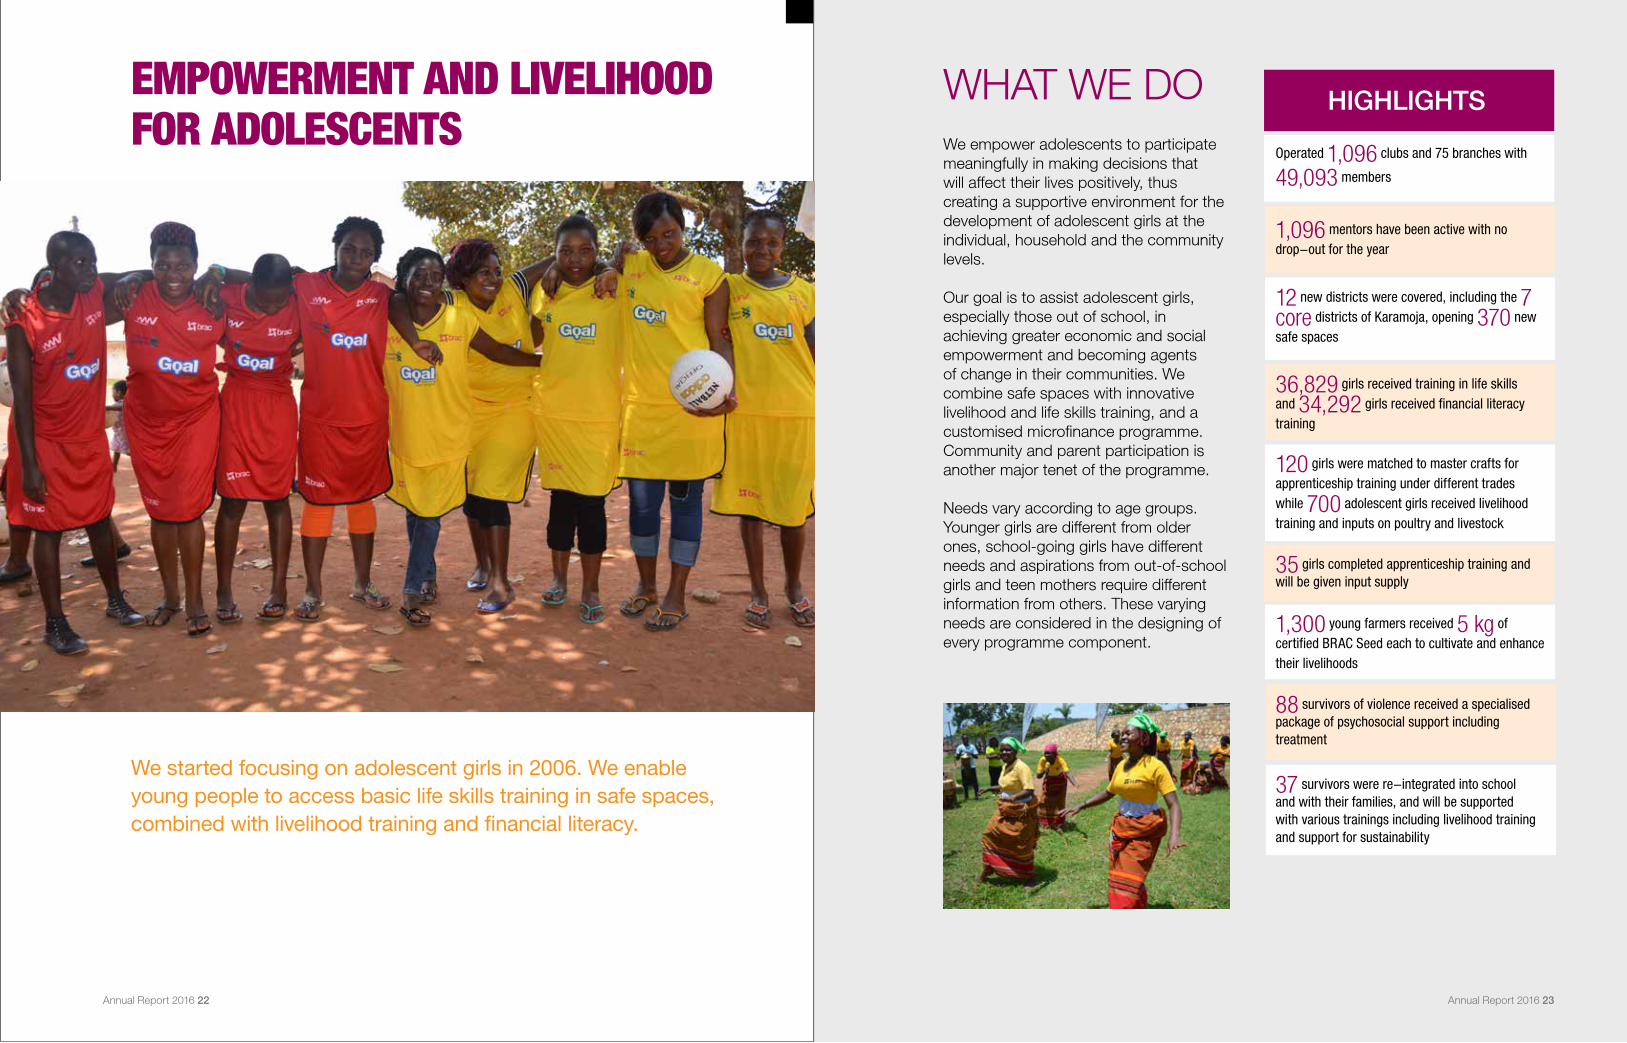
EMPOWERMENT AND LIVELIHOOD FOR ADOLESCENTS
HIGHLIGHTSWHAT WE DOWe empower adolescents to participate meaningfully in making decisions that will affect their lives positively, thus creating a supportive environment for the development of adolescent girls at the individual, household and the community levels.
Our goal is to assist adolescent girls, especially those out of school, in achieving greater economic and social empowerment and becoming agents of change in their communities. We combine safe spaces with innovative livelihood and life skills training, and a customised microfinance programme. Community and parent participation is another major tenet of the programme.
Needs vary according to age groups. Younger girls are different from older ones, school-going girls have different needs and aspirations from out-of-school girls and teen mothers require different information from others. These varying needs are considered in the designing of every programme component.
Operated 1,096 clubs and 75 branches with
49,093 members
1,096 mentors have been active with no drop-out for the year
12 new districts were covered, including the 7
core districts of Karamoja, opening 370 new safe spaces
We started focusing on adolescent girls in 2006. We enable young people to access basic life skills training in safe spaces, combined with livelihood training and financial literacy.
36,829 girls received training in life skills and 34,292 girls received financial literacy training
120 girls were matched to master crafts for apprenticeship training under different trades while 700 adolescent girls received livelihood training and inputs on poultry and livestock
35 girls completed apprenticeship training and will be given input supply
1,300 young farmers received 5 kg of certified BRAC Seed each to cultivate and enhance their livelihoods
88 survivors of violence received a specialised package of psychosocial support including treatment
37 survivors were re-integrated into school and with their families, and will be supported with various trainings including livelihood training and support for sustainability
Annual Report 2016 22 Annual Report 2016 23
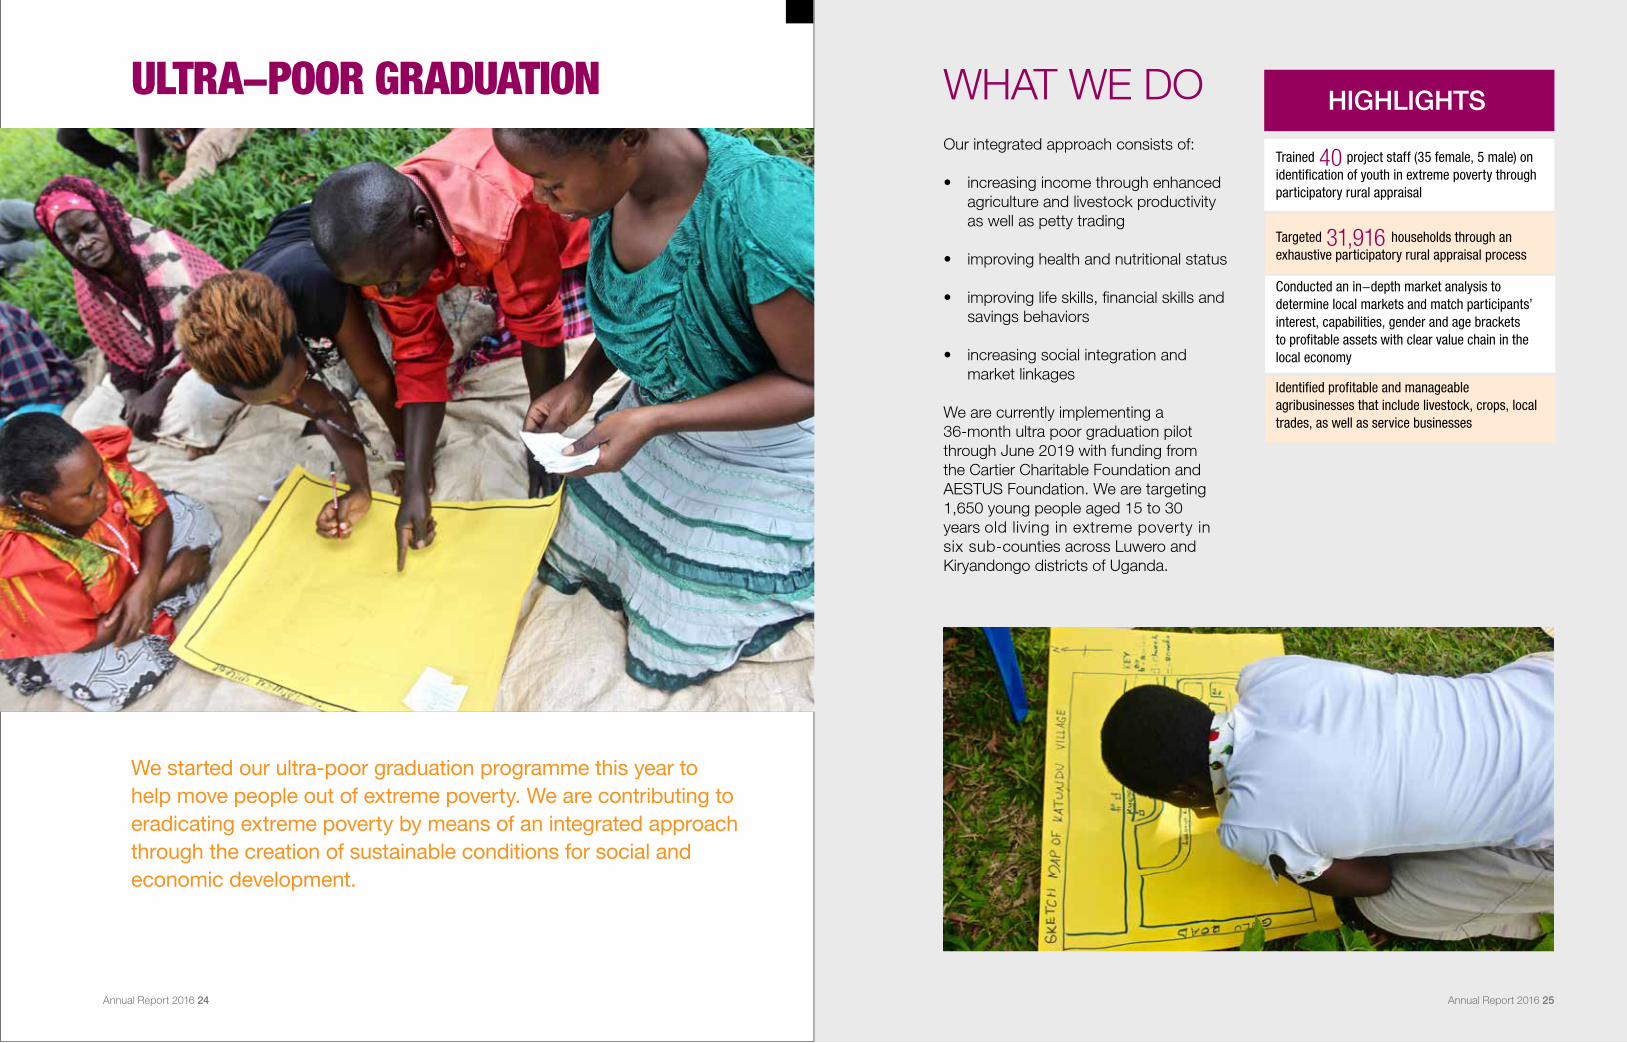
ULTRA-POOR GRADUATIONHIGHLIGHTSWHAT WE DO
Our integrated approach consists of:
• increasing income through enhanced agriculture and livestock productivity as well as petty trading
• improving health and nutritional status
• improving life skills, financial skills and savings behaviors
• increasing social integration and market linkages
We are currently implementing a 36-month ultra poor graduation pilot through June 2019 with funding from the Cartier Charitable Foundation and AESTUS Foundation. We are targeting 1,650 young people aged 15 to 30 years old living in extreme poverty in six sub-counties across Luwero and Kiryandongo districts of Uganda.
We started our ultra-poor graduation programme this year to help move people out of extreme poverty. We are contributing to eradicating extreme poverty by means of an integrated approach through the creation of sustainable conditions for social and economic development.
Trained 40 project staff (35 female, 5 male) on identification of youth in extreme poverty through participatory rural appraisal
Targeted 31,916 households through an exhaustive participatory rural appraisal process
Conducted an in-depth market analysis to determine local markets and match participants’ interest, capabilities, gender and age brackets to profitable assets with clear value chain in the local economy
Identified profitable and manageable agribusinesses that include livestock, crops, local trades, as well as service businesses
Annual Report 2016 24 Annual Report 2016 25
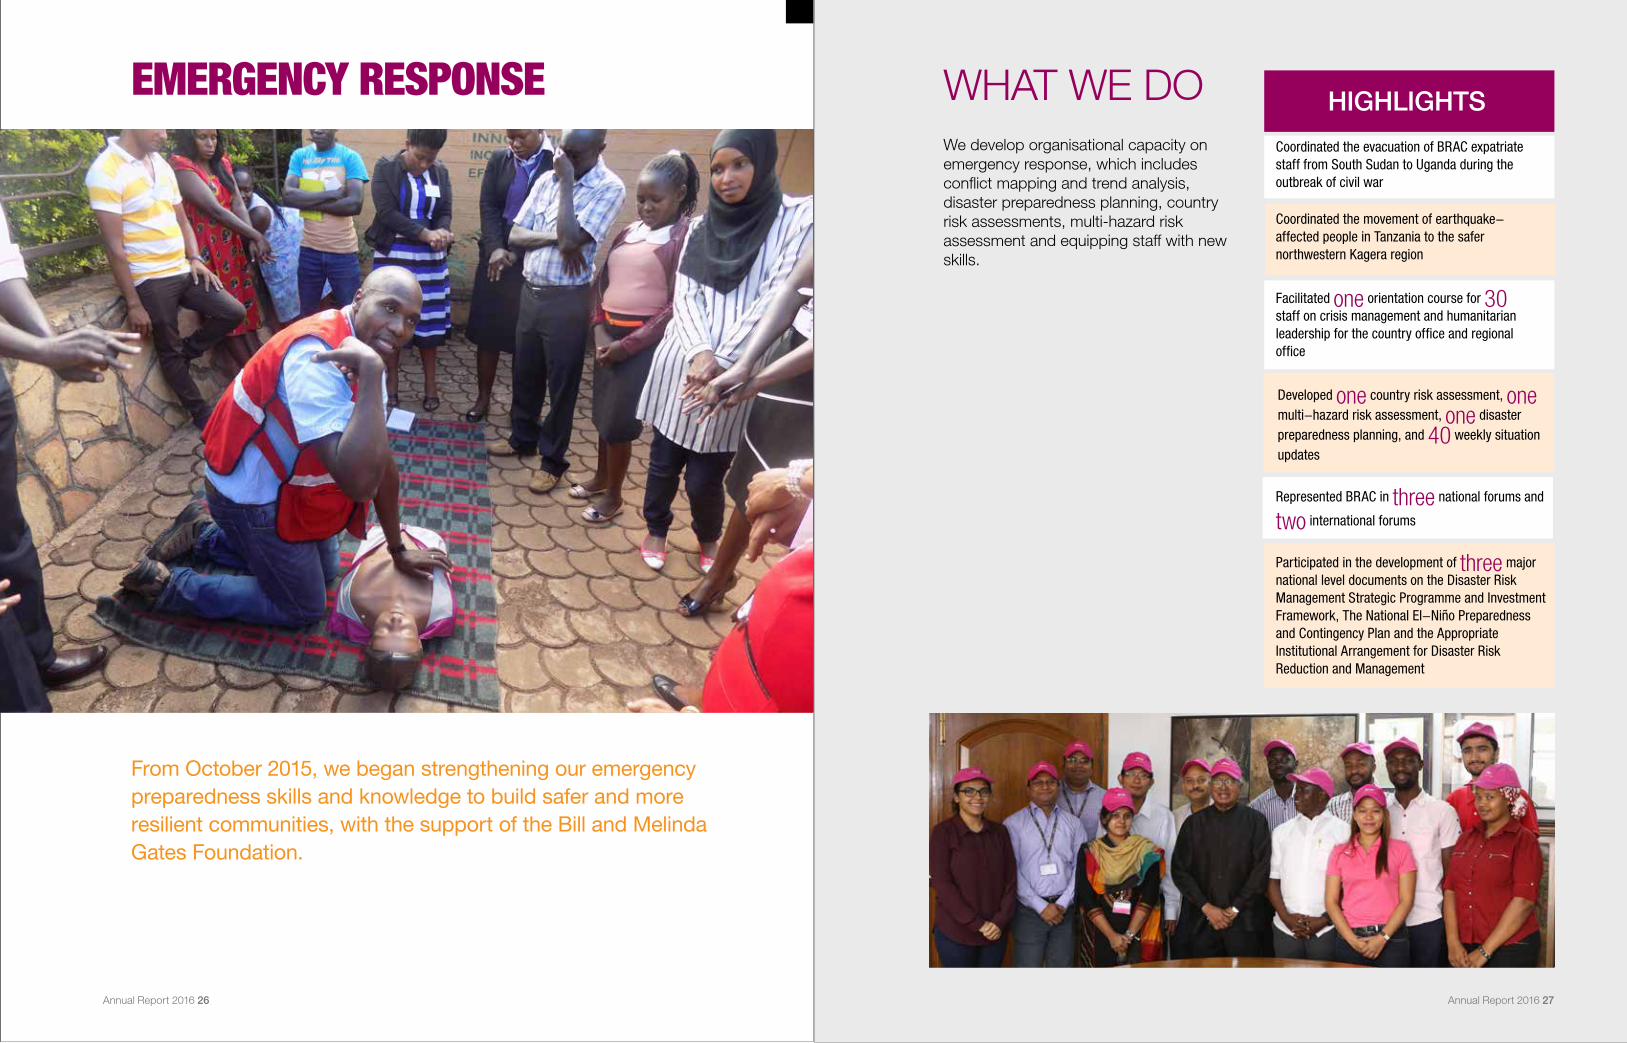
EMERGENCY RESPONSEHIGHLIGHTSWHAT WE DO
We develop organisational capacity on emergency response, which includes conflict mapping and trend analysis, disaster preparedness planning, country risk assessments, multi-hazard risk assessment and equipping staff with new skills.
Coordinated the evacuation of BRAC expatriate staff from South Sudan to Uganda during the outbreak of civil war
Coordinated the movement of earthquake-affected people in Tanzania to the safer northwestern Kagera region
Facilitated one orientation course for 30 staff on crisis management and humanitarian leadership for the country office and regional office
From October 2015, we began strengthening our emergency preparedness skills and knowledge to build safer and more resilient communities, with the support of the Bill and Melinda Gates Foundation.
Developed one country risk assessment, one multi-hazard risk assessment, one disaster preparedness planning, and 40 weekly situation updates
Represented BRAC in three national forums and
two international forums
Participated in the development of three major national level documents on the Disaster Risk Management Strategic Programme and Investment Framework, The National El-Niño Preparedness and Contingency Plan and the Appropriate Institutional Arrangement for Disaster Risk Reduction and Management
Annual Report 2016 26 Annual Report 2016 27
We pride ourself on bringing innovative solutions wherever we work, and this year, we introduced a mobile health (m-Health) component. The customised Android application platform enables our health promoters to capture maternal child health and household information via smartphones. The platform also features decision support tools to assist health promoters in registering, screening, treating, counselling and referring sick under-5 children and pregnant women.
This m-Health platform will improve:
Service quality - all sick child assessments are conducted by the promoters through the same app/tool, as are treatment follow up, danger sign identification, referrals and referral follow up. Similarly, pregnancy registration, referrals, dates of antenatal care, other reminders, key messages, and household information are available and accessible.
Reporting - use of the m-Health platform has enabled us to move from paper-based reports to near-instantaneous reporting of data. Real time reporting allows the entire health team to save time during data collection.
Supervision - real-time reporting will enable efficient and effective supervision and monitoring, allowing our health team to ensure effective and accurate monitoring of children’s health and women pregnancy status.
The use of these mobile phones has also elevated the confidence and status of health promoters in the community.
The app helps maintain the accuracy and quality of the work and data collected by the promoters. It builds trust among promoters by creating very clear and achievable expectations.
SMARTPHONES SAVE LIVES
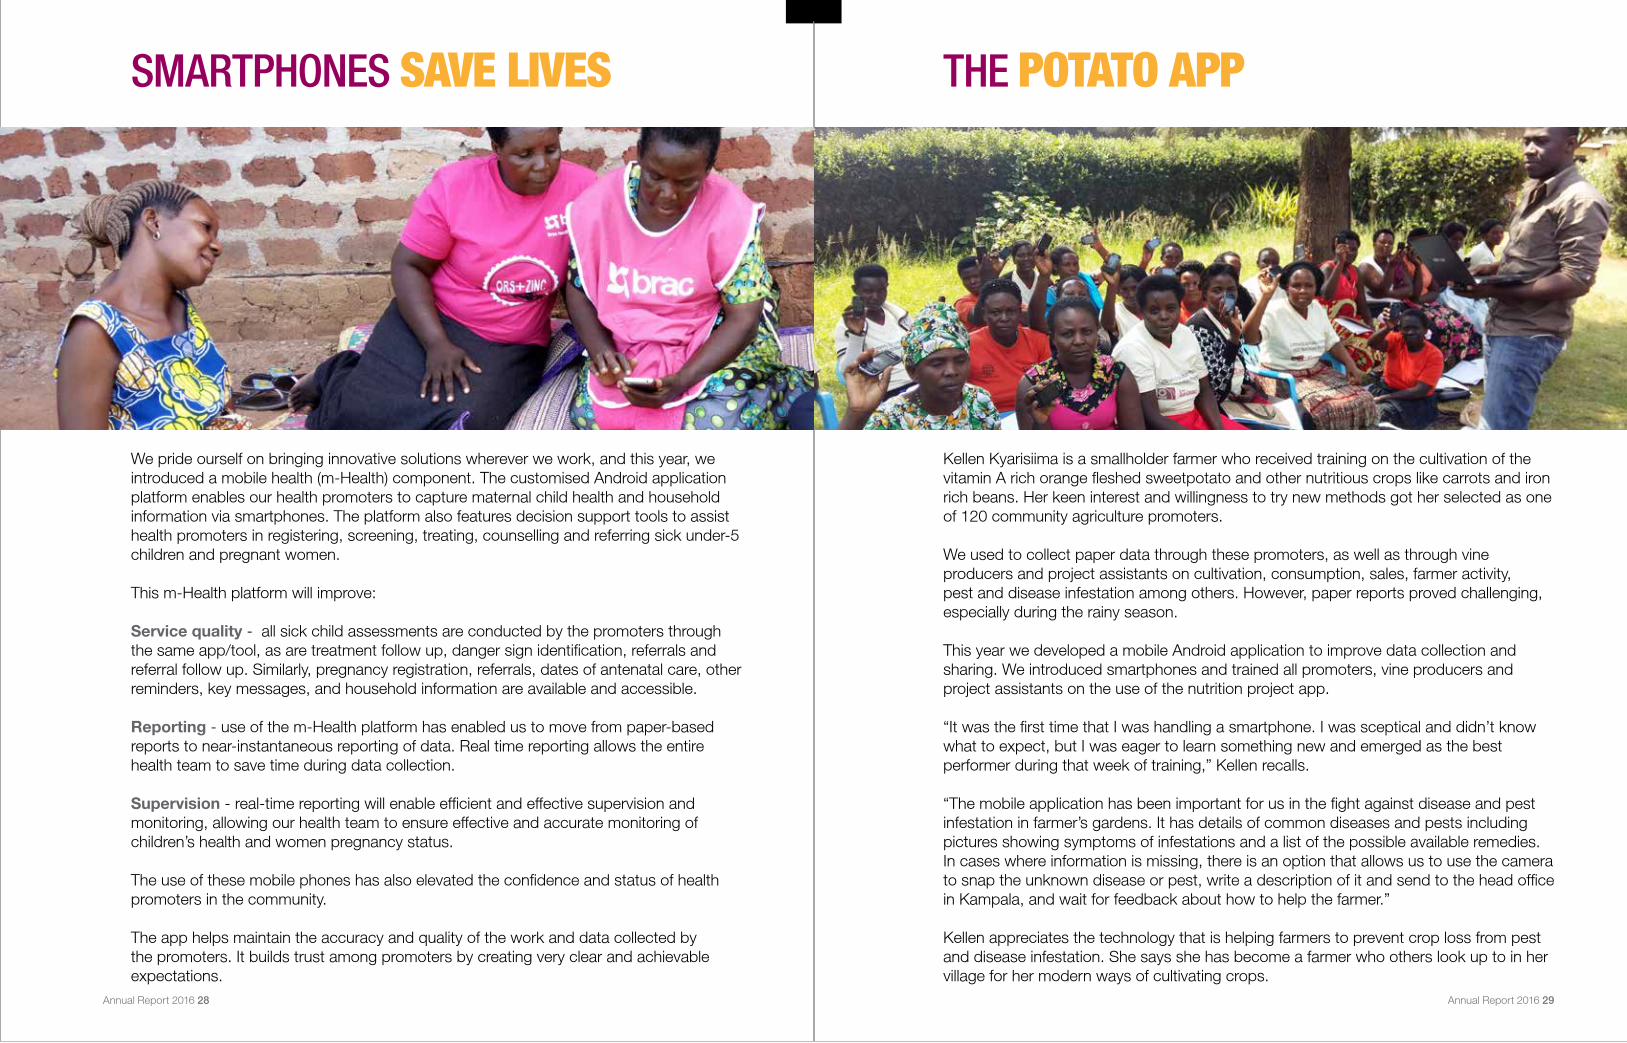
Kellen Kyarisiima is a smallholder farmer who received training on the cultivation of the vitamin A rich orange fleshed sweetpotato and other nutritious crops like carrots and iron rich beans. Her keen interest and willingness to try new methods got her selected as one of 120 community agriculture promoters.
We used to collect paper data through these promoters, as well as through vine producers and project assistants on cultivation, consumption, sales, farmer activity, pest and disease infestation among others. However, paper reports proved challenging, especially during the rainy season.
This year we developed a mobile Android application to improve data collection and sharing. We introduced smartphones and trained all promoters, vine producers and project assistants on the use of the nutrition project app.
“It was the first time that I was handling a smartphone. I was sceptical and didn’t know what to expect, but I was eager to learn something new and emerged as the best performer during that week of training,” Kellen recalls.
“The mobile application has been important for us in the fight against disease and pest infestation in farmer’s gardens. It has details of common diseases and pests including pictures showing symptoms of infestations and a list of the possible available remedies. In cases where information is missing, there is an option that allows us to use the camera to snap the unknown disease or pest, write a description of it and send to the head office in Kampala, and wait for feedback about how to help the farmer.”
Kellen appreciates the technology that is helping farmers to prevent crop loss from pest and disease infestation. She says she has become a farmer who others look up to in her village for her modern ways of cultivating crops.
THE POTATO APP
Annual Report 2016 28 Annual Report 2016 29
BRAC INTERNATIONAL BRAC International is registered as Stichting BRAC International in the Netherlands.
GOVERNING BODY
Stichting BRAC International has a constitution under the laws of the Netherlands and was governed by a 10-member board of directors. In line with the rising fiscal requirements and public expectations in the Netherlands, the board decided to adopt a two-tier governance structure, with a management board and a supervisory board.
On 8 December 2016, on its 31st meeting, the Stichting BRAC International governing board adopted the following amendments to the Constitution of Stichting BRAC International which came into effect from 28 December 2016:The present governing board becomes the supervisory board of Stichting BRAC International.
The supervisory board appointed the management board of Stichting BRAC International comprising 1) Executive Director, BRAC International, 2) Director Finance, BRAC International and 3) a maximum of three BRAC International programme directors.
The composition of the supervisory board of Stichting BRAC International is as follows:
Chairperson: Sir Fazle Hasan Abed, KCMG
Members: Ahmed Mushtaque Raza Chowdhury Dr Muhammad Musa Sylvia Borren Dr Debapriyo Bhattacharya Shabana Azmi
Shafiqul Hassan (Quais) Parveen Mahmud Irene Zubaida Khan Fawzia Rashid
BRAC INTERNATIONAL HOLDINGS BV
BRAC International Holdings BV is a wholly owned subsidiary of Stichting BRAC International and was incorporated in 2010. BRAC International’s microfinance programmes, social enterprises and investment companies are consolidated under this wing. The social programmes currently supporting the enterprises include seed production and training centres.
BRAC International Holdings BV has the role to consolidate the financial results of all country operations in six countries. The consolidated financial statements include the financial data of the stand-alone parent organisation, its group companies and other legal entities over which the foundation has control.
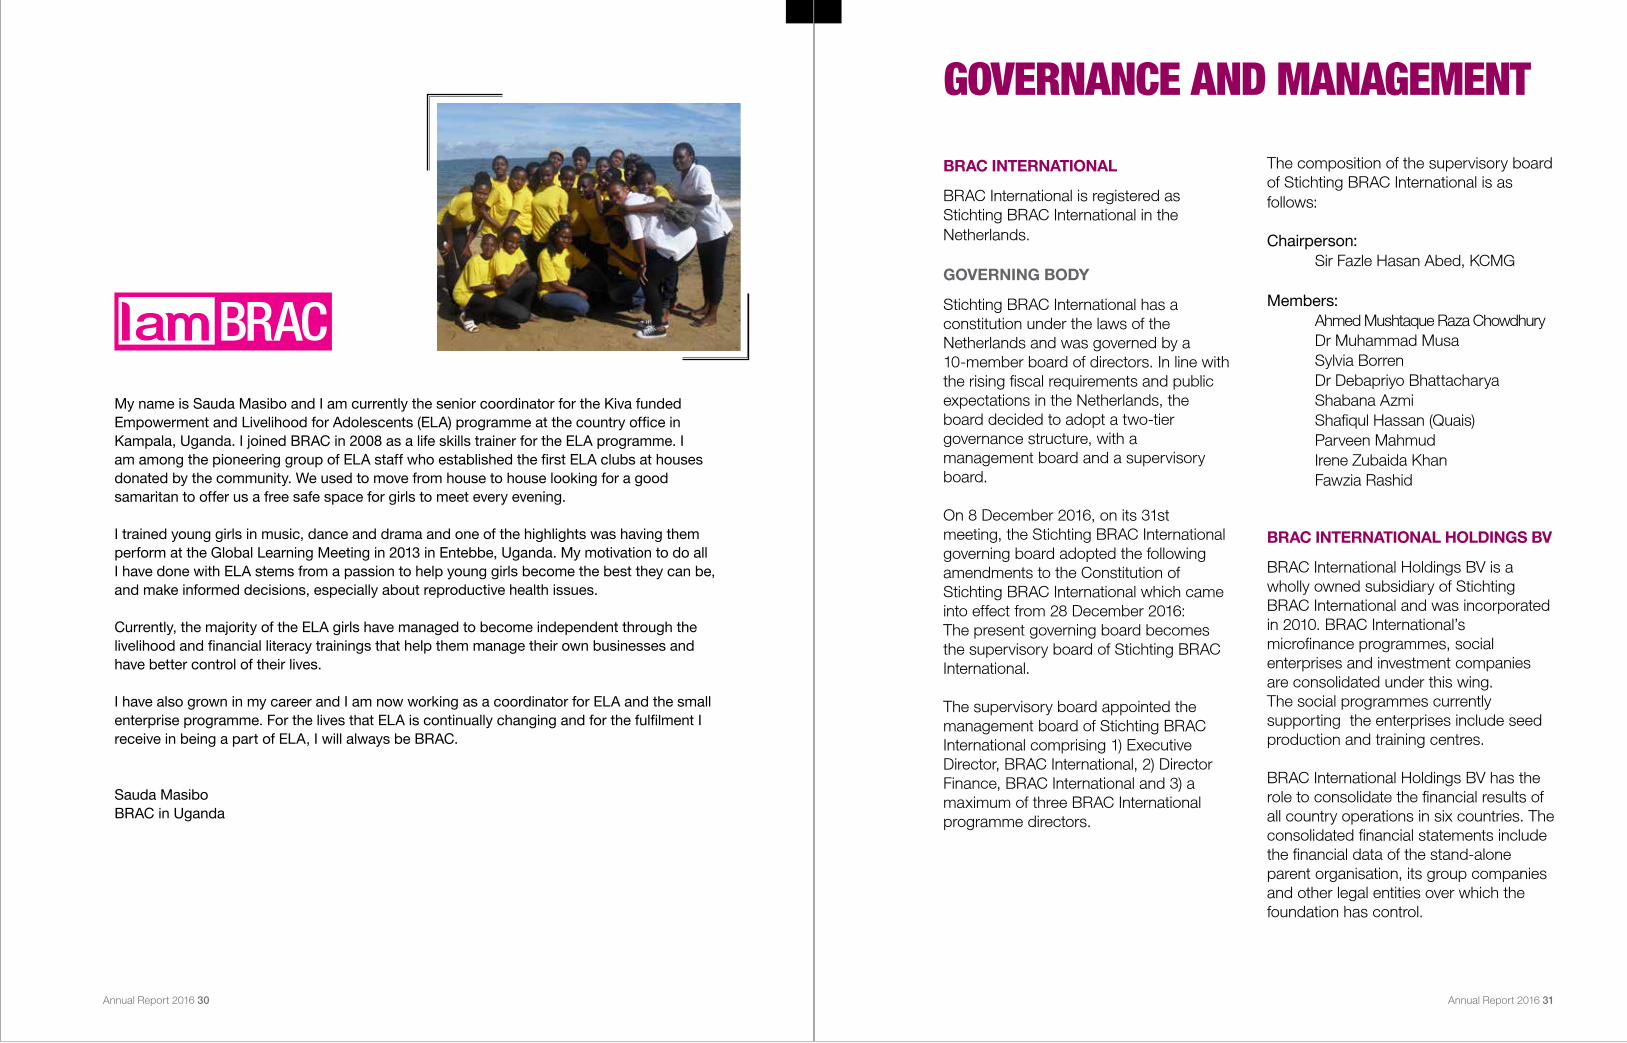
My name is Sauda Masibo and I am currently the senior coordinator for the Kiva funded
Empowerment and Livelihood for Adolescents (ELA) programme at the country office in Kampala, Uganda. I joined BRAC in 2008 as a life skills trainer for the ELA programme. I
am among the pioneering group of ELA staff who established the first ELA clubs at houses donated by the community. We used to move from house to house looking for a good
samaritan to offer us a free safe space for girls to meet every evening.
I trained young girls in music, dance and drama and one of the highlights was having them
perform at the Global Learning Meeting in 2013 in Entebbe, Uganda. My motivation to do all I have done with ELA stems from a passion to help young girls become the best they can be,
and make informed decisions, especially about reproductive health issues.
Currently, the majority of the ELA girls have managed to become independent through the
livelihood and financial literacy trainings that help them manage their own businesses and have better control of their lives.
I have also grown in my career and I am now working as a coordinator for ELA and the small
enterprise programme. For the lives that ELA is continually changing and for the fulfilment I receive in being a part of ELA, I will always be BRAC.
Sauda Masibo
BRAC in Uganda
GOVERNANCE AND MANAGEMENT
Annual Report 2016 30 Annual Report 2016 31
On 8 December 2016, on the 31st general meeting of the shareholder of BRAC International Holdings BV, the Stichting BRAC International Governing Board adopted the amendments to the Articles of Association of BRAC International Holdings BV.
The following came into effect from 28 December 2016:
The present board of directors, with the exception of Hans Eskes becomes the supervisory board of BRAC International Holdings BV.
A two-member management board is formed with one Bangladeshi and one Dutch national.
The composition of the present supervisory board of BRAC International Holdings BV is as follows:
Chairperson: Sir Fazle Hasan Abed, KCMG
Members: Sylvia Borren Dr Muhammad Musa Parveen Mahmud
The composition of the management board of BRAC International Holdings BV is as follows:
Managing Director: Faruque Ahmed
Director: Hans Eskes
Details about the roles of the supervisory board and management board are available in the Deed of Incorporation of Stichting BRAC International and BRAC International Holdings BV.
FINANCE AND AUDIT COMMITTEE
Composition of the present finance and audit committee is as follows:
Parveen Mahmud, Chair Dr Muhammad Musa, Member Sylvia Borren, Member Faruque Ahmed, Member Hans Eskes, Member SN Kairy, Secretary of the Committee
The primary function of the finance and audit committee is to assist the governing board in fulfilling its responsibilities on the:
• Financial reporting and budgeting processes• System of internal controls and risk assessment
• Compliance with legal and regulatory requirements• Qualifications, independence, and performance of the external auditors
• Qualifications, independence, and performance of the internal audit function
LOCAL BOARDS
Each country entity has a local board. We pursue microfinance and development activities through separate entities in countries where it is required. The local board members are appointed by Stichting BRAC International’s board. The business of the local entities is managed by these local boards. Further details of the roles of the local board are available in the respective incorporation documents of these entities.
ADVISORY COUNCIL
In 2015, BI decided to form advisory councils to strengthen governance, support advocacy at the national level and enhance credibility.
The council members, who are country nationals, provide the country leadership with advice and support on standards and policies, and the development and implementation of programmes. They advise on key external developments and trends nationally, and promote BRAC’s mission through effective and strategic working relationships with key stakeholders and civil society partners in the countries. They also support information sharing and relevant advocacy on behalf of BRAC.
ACCOUNTABILITY AND TRANSPARENCY
The internal audit department conducts periodical audits at all our cost centres on a sample basis. Audits take place at least once a year and twice or more in locations and on programmes where a closer watch is warranted. In addition, special investigations are conducted in case of fraud or irregularities that may be detected. A ‘whistle blower’ policy is in place and HR takes actions as and when required.
External audit of Stichting BRAC International, BRAC International Holdings BV and all of our legal entities are undertaken annually. Financial transparency is ensured by BRAC International’s finance and accounts division, which prepares financial
statements following the International Financial Reporting Standards and the laws of relevant countries.
The summary of all audits and investigations are submitted to the audit and finance committee on a half yearly basis.
Annual Report 2016 32 Annual Report 2016 33
Hasina Akhter Country Representative Jimmy Adiga Chief Executive Officer Tabu Francis Project Manager, Scholarship & ECD Mugerwa Namulondo Sarah Country Head of Accounts Hannan Ali Project Manager, Agriculture Anne Kazungu Manager, HR & Training A B M Monimul Islam ERO & CB Lead Peter Mukisa General Manager, BSBBE Odong Lawrence Project Manager, TUP Sharmin Sharif Project Manager, Health Jeniffer Kemigisha Project Manager, ELA & ECM
BRAC UGANDA MICROFINANCE LIMITEDDirectors
Dr AMR Chowdhury (Chair)Faruque Ahmed Shib Narayan KairyShameran Abed
BRAC UGANDA NGOLocal Board Members
Dr AMR Chowdhury (Chair)Faruque Ahmed Shib Narayan KairyShameran Abed
BRAC SOCIAL BUSINESS ENTERPRISESDirectors
Dr AMR Chowdhury (Chair)Faruque Ahmed Shib Narayan Kairy
COUNTRY ADVISORY COUNCIL
MembersJoyce R MpangaHon Justice Augustus Kania Okaasai S OpolotDavid T BagumaDr Sabrina Bakeera Kitaka
GOVERNANCE MANAGEMENT
BRAC IN UGANDA
Annual Report 2016 34 Annual Report 2016 35
Annual Report 2016 36
Moyo
Ad
jum
ani
Yum
bei
Ko
bo
ko
Mara
cha A
rua B
Aru
a
Kig
um
ba
Bw
eyale
Kasam
bya
Nam
wend
a
Siro
nko
Pallis
a
Ng
ora
Kum
i
Bw
era
Isho
ng
oro
ro
Buyanja
Muhang
a
Targ
eting
Ultra
Po
or
Kab
ale
Isin
giro
Buw
am
a
Nsang
i
Muko
no
B
Mag
anjo
B
Nat
eete
B
Naj
jeer
a
Bui
ykw
eN
ko
ko
nje
ru
Buyala
Nko
ko
nje
ruB
usunju
Mayug
e
Igang
a B
Nam
utu
mb
a Bud
aka
To
roro
Bud
ud
aM
bale
Bud
ud
aId
ud
i
Mus
ita
Rukung
iri
Kis
ang
a
Rub
iriz
iKib
ito
Ap
ac
Ad
uku
Do
ko
lo
Kitg
um
Kam
din
i
Od
ia
Kig
and
a
Kyeg
eg
wa
Ziro
bw
e
Kang
ulu
mira

FINANCIALS

38 Annual Report 2016 Annual Report 2016 39
Programme2016 2015
USD USD
Health 3,621,6667,258,1691,271,5941,378,6632,217,412
1,680,5705,976,3252,599,1611,910,1191,844,127
Education
ELA
Agriculture and livestock
Others-
Total 15,747,504 14,010,302
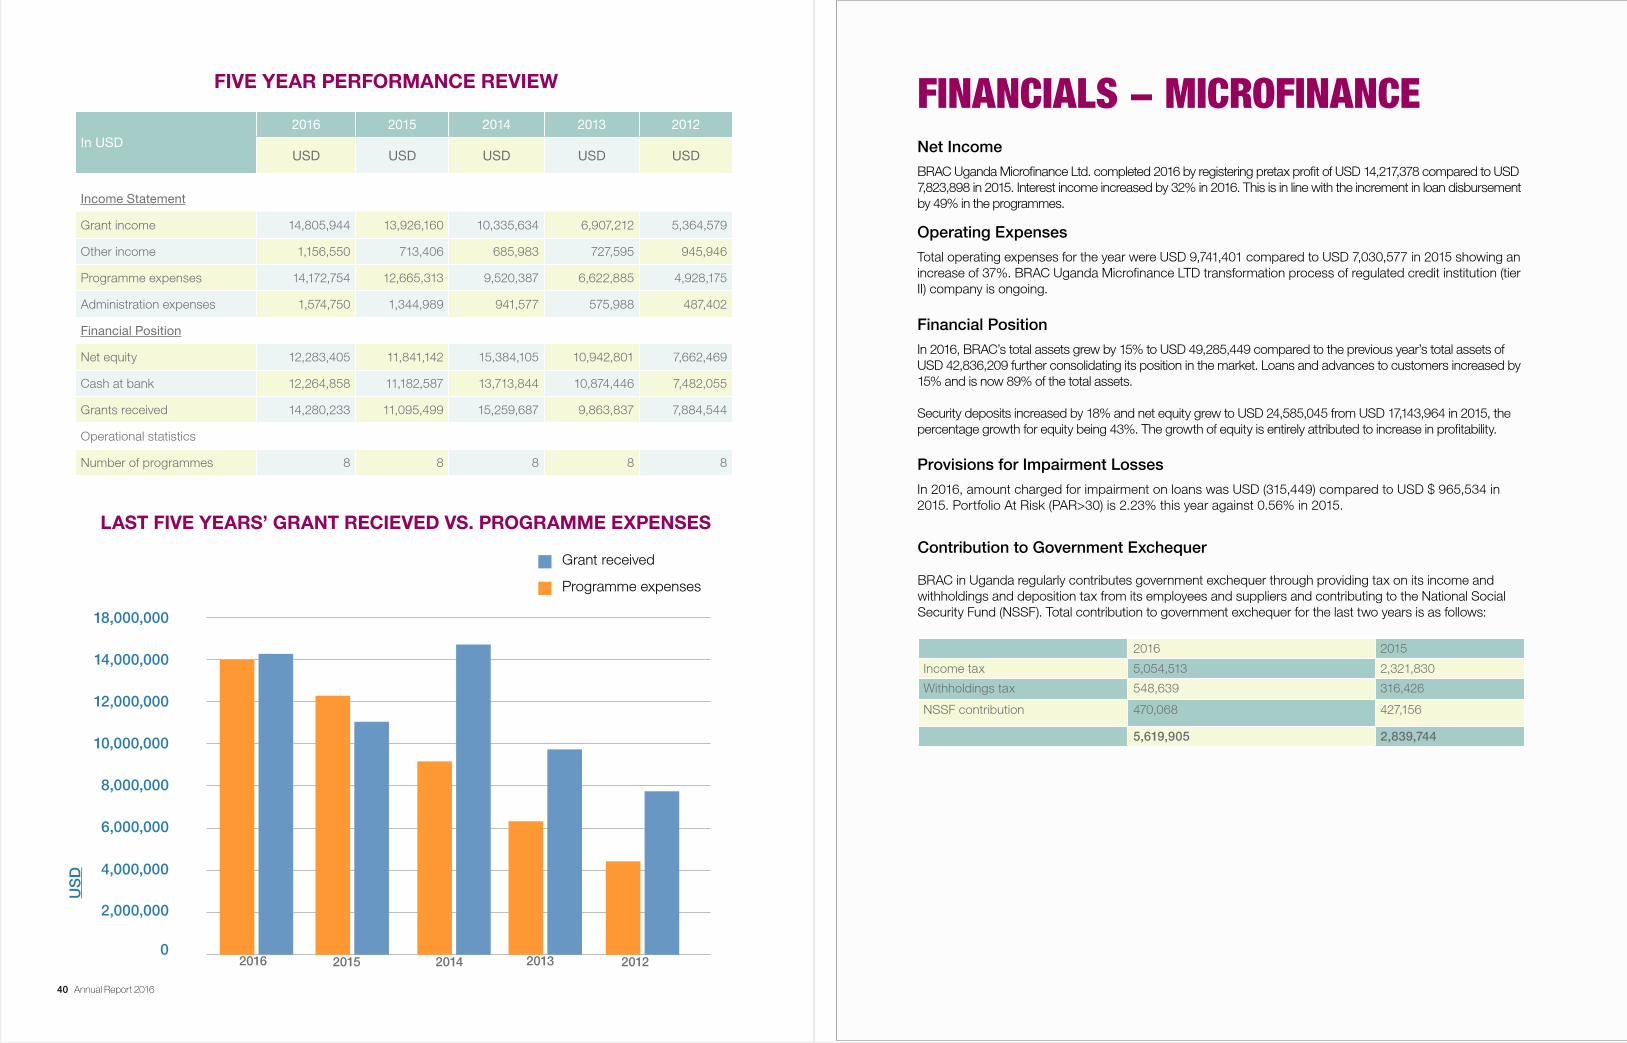
BRAC in Uganda received grants amounting to USD 14,280,233 in 2016 compared to USD 11,095,499 in 2015. Total project expenses utilized for the year were USD 15,747,504 (USD 14,010,302 in 2015) which represents an increase of 12%. Out of the total expenses, majority are expensed in The Scholarship Programme supported by MasterCard Foundation. The expenses incurred for the major development programs are as shown below. Almost 90% of the total expenditure is being used for direct program service with only 10% as administration expenses.
Total equity as at 31 December 2016 stands at USD 12,283,405 compared to USD 11,841,142 in 2015, showing an increase of 4%.
20152016
Contribution to Government Exchequer
BRAC in Uganda regularly contributes government exchequer through providing tax on its income and withholdings and deposition tax from its employees and suppliers and contributing to The National Social Security Fund (NSSF). Total contribution to government exchequer for the last two years is as follows:
2016 2015
Withholdings tax 83,742 7,898
NSSF contribution 229,638 225,921
313,380 233,819
Expenses2016 2015
USD USD
Programme expenses 14,172,754 12,665,313
Administration expenses 1,574,750 1,344,989-
Total 15,747,504 14,010,302
2016 2015
FINANCIALS - NGO
PROGRAMME COST
PROGRAMME COST
AWARDS AND RECOGNITION IN 2016
BRAC in Uganda received two awards in the annual Financial Reporting (FiRe) Award held in 2016, organized by the Institute of Certified Public Accountants of Uganda (ICPAU). BRAC in Uganda received a Certificate of Recognition for Outstanding Achievement in the General Sub-Category (NGOs). BRAC in Uganda was also announced as the winner in the Non-Governmental Organisations category, out-reporting 21 other NGOs.
This is the sixth consecutive year that BRAC in Uganda has been recognized at the awards, setting up a standard that has never been achieved by any other NGO in Uganda.
Annual Report 2016 4140 Annual Report 2016
Grant received
Programme expenses
In USD
2016 2015 2014 2013 2012
USD USD USD USD USD
Income Statement
Grant income 14,805,944 13,926,160 10,335,634 6,907,212 5,364,579
Other income 1,156,550 713,406 685,983 727,595 945,946
Programme expenses 14,172,754 12,665,313 9,520,387 6,622,885 4,928,175
Administration expenses 1,574,750 1,344,989 941,577 575,988 487,402
Financial Position
Net equity 12,283,405 11,841,142 15,384,105 10,942,801 7,662,469
Cash at bank 12,264,858 11,182,587 13,713,844 10,874,446 7,482,055
Grants received 14,280,233 11,095,499 15,259,687 9,863,837 7,884,544
Operational statistics
Number of programmes 8 8 8 8 8
2012
4,000,000
6,000,000
2,000,000
02013201420152016
12,000,000
14,000,000
18,000,000
US
D
8,000,000
10,000,000
LAST FIVE YEARS’ GRANT RECIEVED VS. PROGRAMME EXPENSES
FIVE YEAR PERFORMANCE REVIEW
FINANCIALS - MICROFINANCE
Net Income
BRAC Uganda Microfinance Ltd. completed 2016 by registering pretax profit of USD 14,217,378 compared to USD 7,823,898 in 2015. Interest income increased by 32% in 2016. This is in line with the increment in loan disbursement by 49% in the programmes.
Operating Expenses
Total operating expenses for the year were USD 9,741,401 compared to USD 7,030,577 in 2015 showing an increase of 37%. BRAC Uganda Microfinance LTD transformation process of regulated credit institution (tier II) company is ongoing.
Provisions for Impairment Losses
In 2016, amount charged for impairment on loans was USD (315,449) compared to USD $ 965,534 in 2015. Portfolio At Risk (PAR>30) is 2.23% this year against 0.56% in 2015.
Financial Position
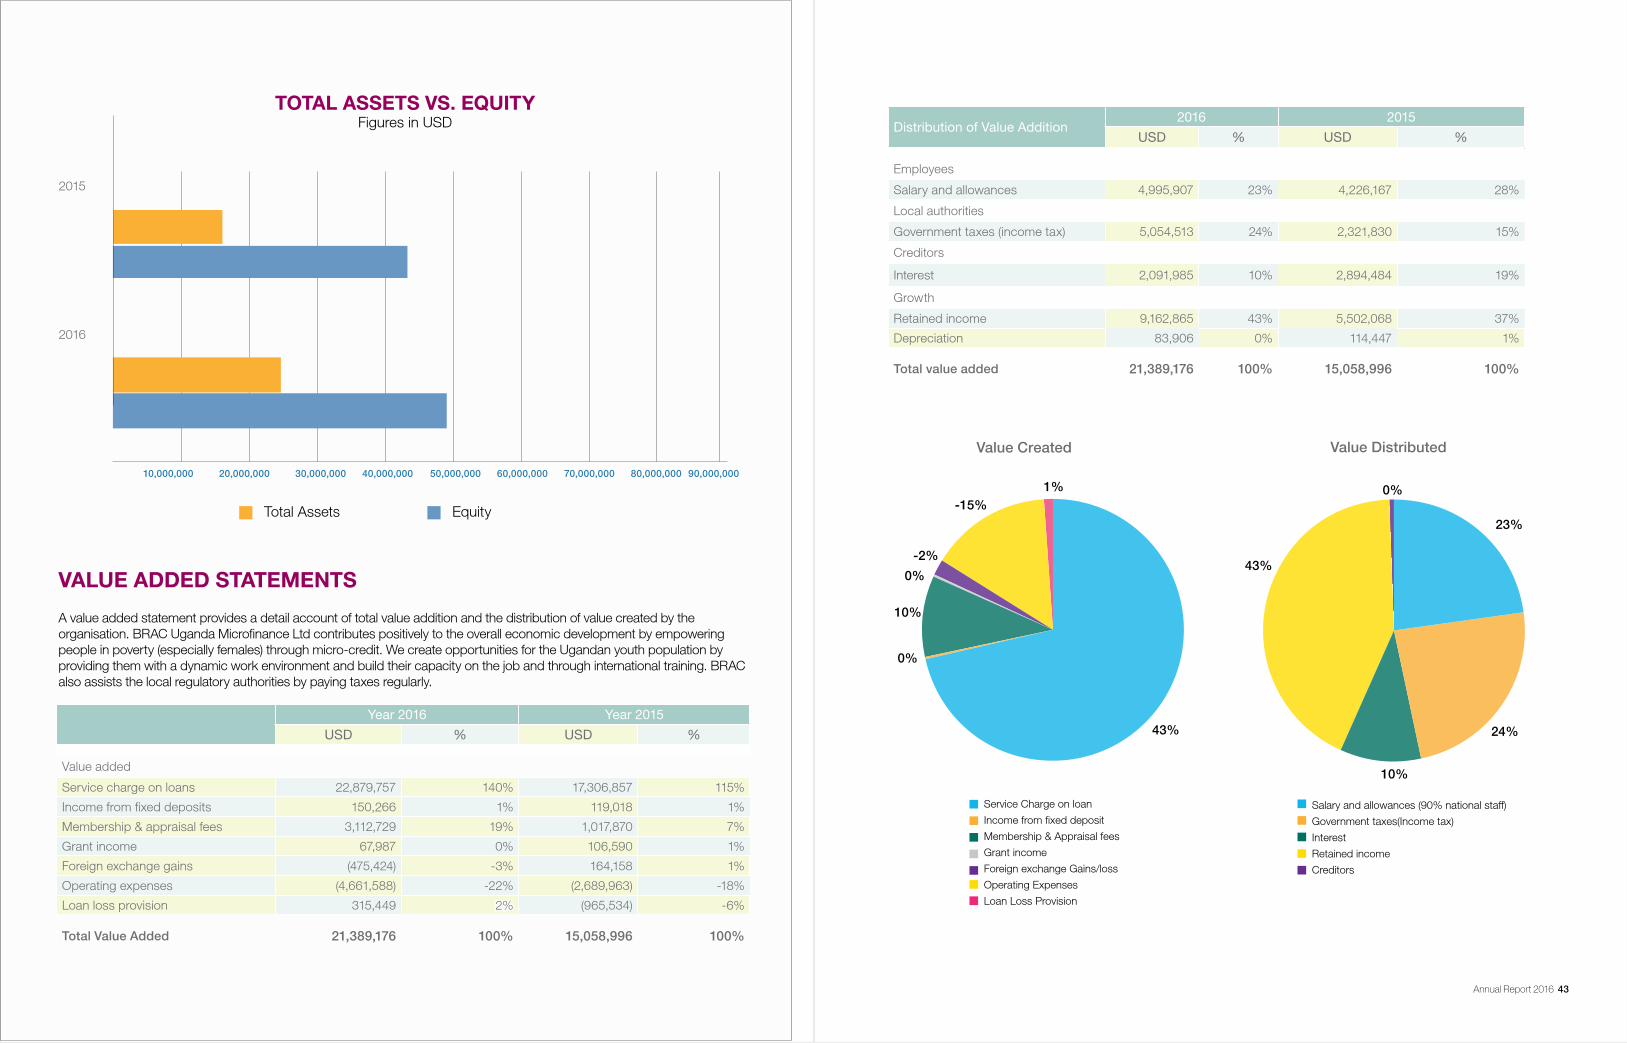
In 2016, BRAC’s total assets grew by 15% to USD 49,285,449 compared to the previous year’s total assets of USD 42,836,209 further consolidating its position in the market. Loans and advances to customers increased by 15% and is now 89% of the total assets.
Security deposits increased by 18% and net equity grew to USD 24,585,045 from USD 17,143,964 in 2015, the percentage growth for equity being 43%. The growth of equity is entirely attributed to increase in profitability.
Contribution to Government Exchequer
BRAC in Uganda regularly contributes government exchequer through providing tax on its income and withholdings and deposition tax from its employees and suppliers and contributing to the National Social Security Fund (NSSF). Total contribution to government exchequer for the last two years is as follows:
2016 2015
Income tax 5,054,513 2,321,830
Withholdings tax 548,639 316,426
NSSF contribution 470,068 427,156
5,619,905 2,839,744
Annual Report 2016 4342 Annual Report 2016
BRAC UGANDA
REPORT AND FINANCIAL STATEMENTS FOR YEAR ENDED 31 DECEMBER 2016
VALUE ADDED STATEMENTS
A value added statement provides a detail account of total value addition and the distribution of value created by the organisation. BRAC Uganda Microfinance Ltd contributes positively to the overall economic development by empowering people in poverty (especially females) through micro-credit. We create opportunities for the Ugandan youth population by providing them with a dynamic work environment and build their capacity on the job and through international training. BRAC also assists the local regulatory authorities by paying taxes regularly.
Year 2016 Year 2015
USD % USD %
Value added
Service charge on loans 22,879,757 140% 17,306,857 115%
Income from fixed deposits 150,266 1% 119,018 1%
Membership & appraisal fees 3,112,729 19% 1,017,870 7%
Grant income 67,987 0% 106,590 1%
Foreign exchange gains (475,424) -3% 164,158 1%
Operating expenses (4,661,588) -22% (2,689,963) -18%
Loan loss provision 315,449 2% (965,534) -6%21,389,176 100% 15,058,996 100%
Total Value Added 21,389,176 100% 15,058,996 100%
Total Assets Equity
2015
10,000,000 20,000,000 30,000,000 40,000,000 50,000,000 60,000,000 70,000,000 80,000,000 90,000,000
2016
Value DistributedValue Created
Distribution of Value Addition 2016 2015
USD % USD %
Employees
Salary and allowances 4,995,907 23% 4,226,167 28%
Local authorities
Government taxes (income tax) 5,054,513 24% 2,321,830 15%
Creditors
Interest 2,091,985 10% 2,894,484 19%
Growth
Retained income 9,162,865 43% 5,502,068 37%
Depreciation 83,906 0% 114,447 1%21,389,176 100% 15,058,996 100%
Total value added 21,389,176 100% 15,058,996 100%
TOTAL ASSETS VS. EQUITYFigures in USD
44 Annual Report 2016 Annual Report 2016 45
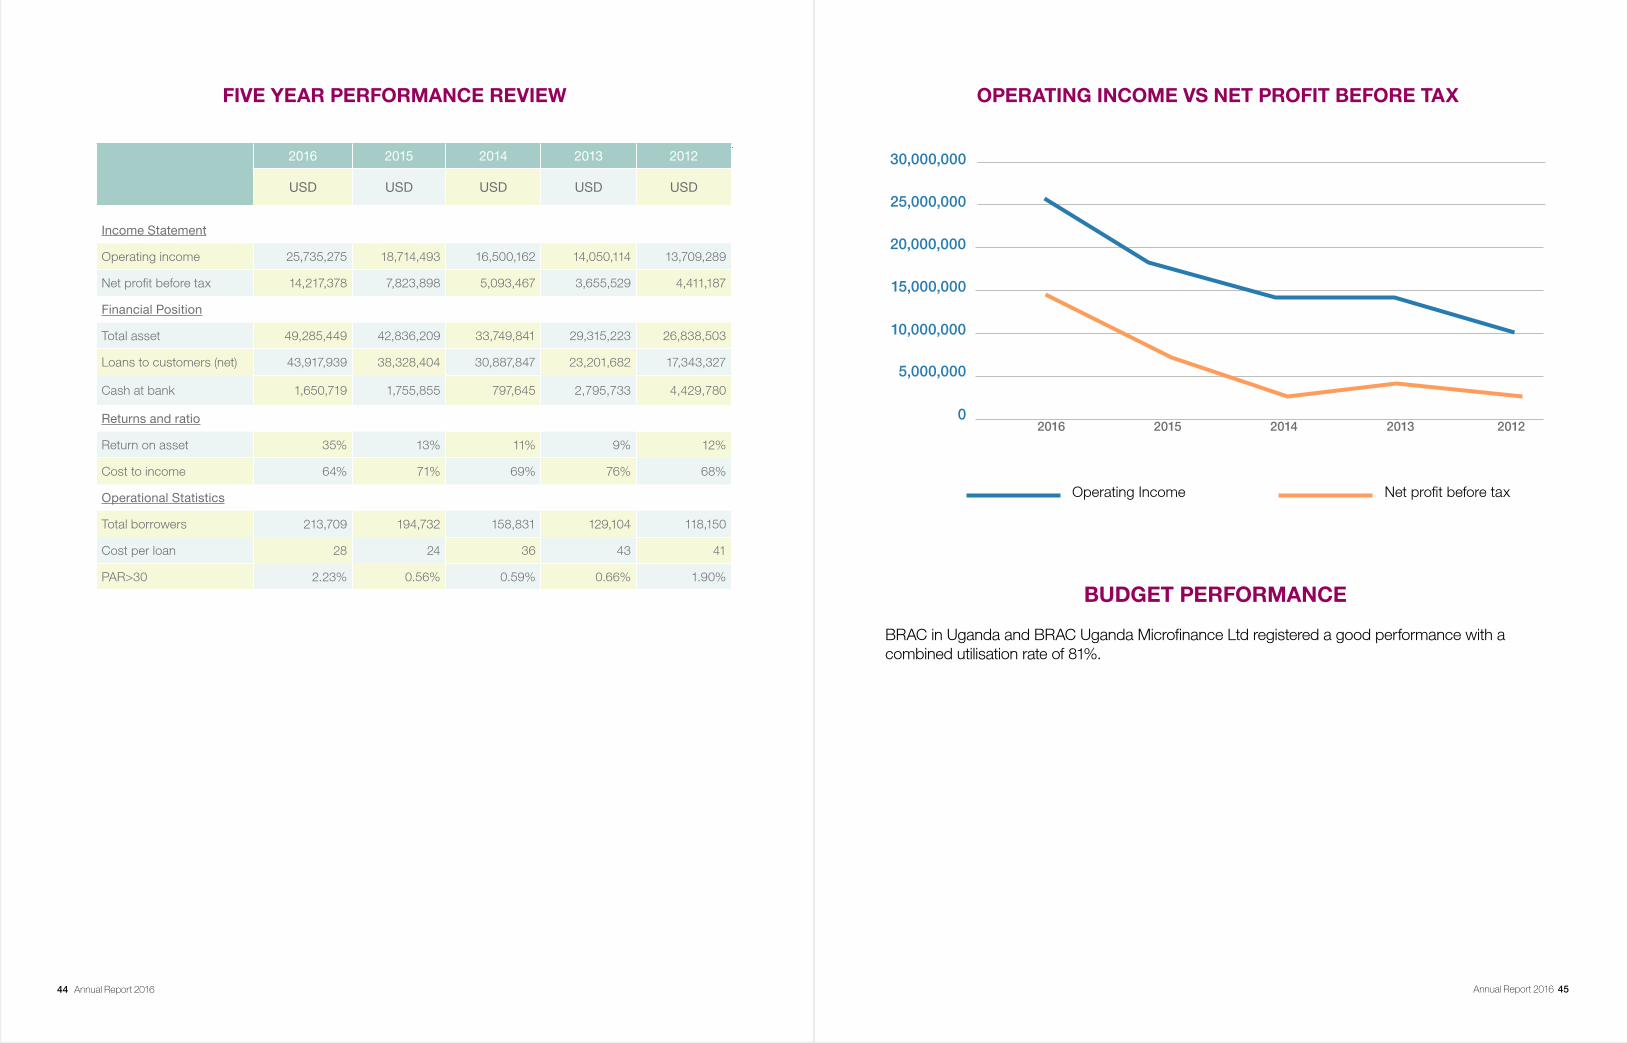
2016 2015 2014 2013 2012
USD USD USD USD USD
Income Statement
Operating income 25,735,275 18,714,493 16,500,162 14,050,114 13,709,289
Net profit before tax 14,217,378 7,823,898 5,093,467 3,655,529 4,411,187
Financial Position
Total asset 49,285,449 42,836,209 33,749,841 29,315,223 26,838,503
Loans to customers (net) 43,917,939 38,328,404 30,887,847 23,201,682 17,343,327
Cash at bank 1,650,719 1,755,855 797,645 2,795,733 4,429,780
Returns and ratio
Return on asset 35% 13% 11% 9% 12%
Cost to income 64% 71% 69% 76% 68%
Operational Statistics
Total borrowers 213,709 194,732 158,831 129,104 118,150
Cost per loan 28 24 36 43 41
PAR>30 2.23% 0.56% 0.59% 0.66% 1.90%
FIVE YEAR PERFORMANCE REVIEW OPERATING INCOME VS NET PROFIT BEFORE TAX
BUDGET PERFORMANCE
BRAC in Uganda and BRAC Uganda Microfinance Ltd registered a good performance with a combined utilisation rate of 81%.
Operating Income Net profit before tax
0
20,000,000
10,000,000
15,000,000
5,000,000
25,000,000
30,000,000
2016 2015 2014 2013 2012
Annual Report 2016 47Annual Report 2016 47
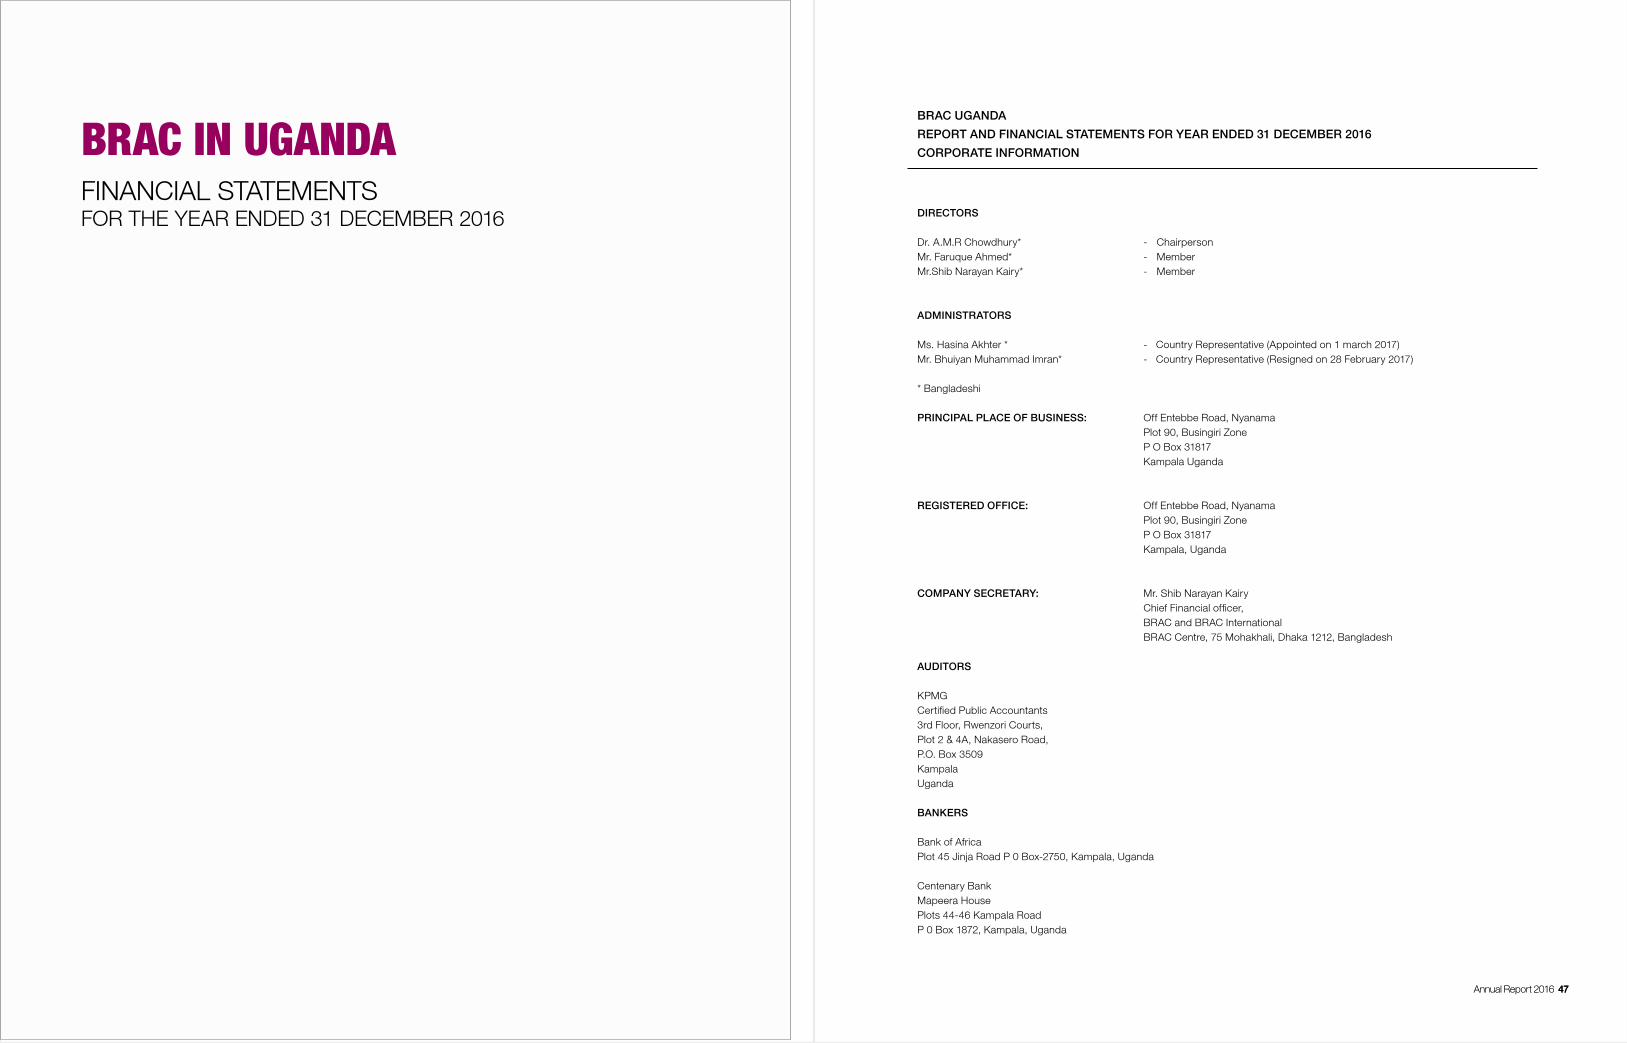
DIRECTORS
Dr. A.M.R Chowdhury* - Chairperson Mr. Faruque Ahmed* - MemberMr.Shib Narayan Kairy* - Member
ADMINISTRATORS
Ms. Hasina Akhter * - Country Representative (Appointed on 1 march 2017)Mr. Bhuiyan Muhammad Imran* - Country Representative (Resigned on 28 February 2017)
* Bangladeshi
PRINCIPAL PLACE OF BUSINESS: Off Entebbe Road, Nyanama Plot 90, Busingiri Zone P O Box 31817 Kampala Uganda
REGISTERED OFFICE: Off Entebbe Road, Nyanama Plot 90, Busingiri Zone P O Box 31817 Kampala, Uganda
COMPANY SECRETARY: Mr. Shib Narayan Kairy Chief Financial officer, BRAC and BRAC International BRAC Centre, 75 Mohakhali, Dhaka 1212, Bangladesh
AUDITORS
KPMGCertified Public Accountants3rd Floor, Rwenzori Courts,Plot 2 & 4A, Nakasero Road,P.O. Box 3509KampalaUganda BANKERS
Bank of AfricaPlot 45 Jinja Road P 0 Box-2750, Kampala, Uganda
Centenary BankMapeera HousePlots 44-46 Kampala RoadP 0 Box 1872, Kampala, Uganda
BRAC IN UGANDA
FINANCIAL STATEMENTSFOR THE YEAR ENDED 31 DECEMBER 2016
BRAC UGANDA
REPORT AND FINANCIAL STATEMENTS FOR YEAR ENDED 31 DECEMBER 2016
CORPORATE INFORMATION
48 Annual Report 2016
48 Annual Report 2014 Annual Report 2014 49
DFCU BankPlot 26, Kyadondo Road. P 0 Box 70,Kampala, Uganda
Equity Bank Uganda LimitedPlot 390 Muteesa l RoadP.O Box 10184Kampala, Uganda
Orient Bank LtdPlot 6/6A Kampala RoadP 0 Box 3072,Kampala, Uganda
Pride Microfinance Limited (MDI) Victoria Office Park, Block B, Bukoto, Plot 6-9, Ben Kiwanuka Okot CloseP 0 Box 7566 Kampala, Uganda
Stanbic Bank Ltd.17 Hannington Road, Crested Tower Building, P 0 Box 7131Kampala, Uganda
Tropical Bank LtdPlot 27 Kampala Road P 0 Box 9487, Kampala, Uganda
The directors have pleasure in submitting their report and the audited financial statements of the company for the year ended 31 December 2016, which disclose the state of affairs of the company.
(a) Registration
BRAC Uganda limited got incorporated as a company limited by guarantee on 18th September 2009 as an independent company. The Organization prior to incorporation was a component of BRAC Uganda which was first incorporated as BRAC foundation in January 2006 and it commenced Business in June 2006. In March 2007 the name was changed to BRAC through the registry of companies. Later Microfinance and Non Microfinance programs got incorporated as independent companies in August 2008 and September 2009 respectively. The Organization was duly registered under the nongovernmental organization registration statute (1989) on 19th March 2010 as BRAC Uganda.
The two entities effectively commenced trading separately on 01 January 2010 and therefore have separate financial statements for BRAC Uganda and BRAC Uganda Microfinance Ltd. BRAC Uganda registered with the registrar of companies on 18th March 2010 a company limited by guarantee under the names of BRAC Uganda (“the Company”).
(b) Vision A world free from all forms of exploitation and discrimination where everyone has the opportunity to realize their potential.
(c) Mission
The Company’s mission is to empower people and communities in situations of poverty, illiteracy, disease and social injustice. Our interventions aim to achieve large-scale, positive changes through economic and social programmes that enable men and women to realize their potential.
(d) Our Values
Innovation-the Company has been an innovator in the creation of opportunities for the poor to lift themselves out of poverty. We value creativity in programme design and strive to display global leadership in ground breaking development initiatives.
Integrity- the Company values transparency and accountability in all our professional work, with clear policies and procedures, while displaying the utmost level of honesty in our financial dealings. The Company holds these to be the most essential elements of our work ethic.
Inclusiveness-the Company is committed to engaging, supporting and recognizing the value of all members of society, regardless of race, religion, gender, nationality, ethnicity, age, physical or mental ability, socioeconomic status and geography.
Effectiveness-the Company values efficiency and excellence in all our work, constantly challenging Ourselves to perform better, to meet and exceed programme targets, and to improve and deepen the impact of our interventions.
(e) Principal activities
The organization provides charitable and welfare activities on non-profit basis, engages in poverty eradication, promotes women empowerment in rural areas, and provides sanitation and clean water and provides basic education for school dropouts in rural areas in over 64 districts in Uganda.
(f) Results from operations The results for the entity for the year ended 31 December 2016 are set out on page 56.
(g) Composition of Directors The directors who served during the year are set out on page 47.
BRAC UGANDA
REPORT AND FINANCIAL STATEMENTS FOR YEAR ENDED 31 DECEMBER 2016
CORPORATE INFORMATION
BRAC UGANDA
DIRECTOS’ REPORT FOR YEAR ENDED 31 DECEMBER 2016
50 Annual Report 2016 Annual Report 2016 51
(h) Directorsbenefits No director has received or become entitled to receive any benefits during the financial year.
(i) Corporate Governance The directors are committed to the principles of good corporate governance and recognize the need to conduct the business in
accordance with generally accepted best practices. In so doing the Directors therefore confirm that: • The board of directors met regularly throughout the year; • They retain full and effective control over the company; • The board accepts and exercises responsibility for strategic and policy decisions, the approval of budgets and the monitoring of performance; and • They bring skills and experience from their own spheres of business to complement the professional experience and skills of the management team.
In 2016 the board of directors had three directors. The board continued to carry out its role of formulating policies and strategies of the company, reviewing the business plan, ensure that the accounting system is maintained in accordance with acceptable standards, the books of the company are kept properly, and that accounts are checked by authorized auditors, as well as recruitment and development of key personnel.
(j) Risk management The board accepts final responsibility for the risk management and internal control system of the Company The management ensures that adequate internal financial and operational control systems are developed and maintained on an
ongoing basis in order to provide reasonable assurance regarding:
• The effectiveness and efficiency of operations; • The safeguarding of the company’s assets; • Compliance with applicable laws and regulations; • The reliability of accounting records; • Business sustainability under normal as well as adverse conditions; and • Responsible behaviour towards all stakeholders.
The efficiency of any internal control system is dependent on the strict observance of prescribed measures.There is always a risk of non-compliance of such measures by staff. Whilst no system of internal control can provide absolute assurance against misstatement or losses, the risk Company’s system is designed to provide the Board with reasonable assurance that the procedures in place are operating effectively.
(k) Management Structure The Company is under the supervision of the board of directors and the day to day management is entrusted to the Country
Representative who is assisted by the heads of divisions, departments and units. The organization structure of the Company comprises of the following divisions:
• Agriculture and Poultry • Education • Health • Empowerment and Livelihood for Adolescents (ELA) • Research and Evaluation • Training • Emergency Response Program • Accounts and Finance • Internal Audit • Monitoring • Branch Review • IT and MIS • Human resources • Communication and Public Relations
• Proposal Development• Procurement, Logistics and Transportation
(l) Related Party Transactions Related party transactions are disclosed in note 14 and note 17 to the financial statements.
(m) Corporate Social Responsibility BRAC Uganda is a development company dedicated to alleviating poverty by empowering the poor to bring about change in their own
lives.
(n) Key Achievement in 2016
The following are the key achievements for the year: • Three year pilot Play lab project implemented in Karamoja region and Luwero District. 40 play labs opened and are successfully
operating. The Play labs are for 3 to 5 year old children to support their social and emotional learning through play. The Pedagogical principles of the play based learning approach are play, think make and share. • Under the MasterCard Foundation Scholars Program, the Program held its second Leadership congress which was attended by over 1000 scholars at Advanced level at Seroma Christian High School in Mukono District. The theme was nurturing ethical
Leaders for sustainable development. • 507 Advanced level scholars graduated from the Programme in 2016 at a ceremony which was held in December and presided
over by the Minister of State for Higher Education Hon. Dr. J. C Muyingo. This is the third cohort of scholars graduating from the programme. • ELA BRAC Uganda Programme secured two new projects (End child marriage with funds from UNFPA and Emergency Child
Protection response with funds from World Bank.) • ELA Programme under the End child marriage project has been expanded to Karamoja . • Opened 405 new clubs with 10,125 new Adolescent girls. • Expansion/growth from 2,808 to 4,075 CHPs. The year 2016 marks successful completion of CHP expansion that included
mapping, recruitment, training and deployment of the new 1,273 (1276 new CHPs plus 6 replacements of drop outs) CHPs as planned.
• Trained and equipped all CHPs to diagnose and treat ARI with amoxicillin and administer the rapid test for malaria. • Margin contribution grew from 6% to 12% - by adding top selling products, increasing margins and improving business training. • Funding for a new project (The Utra Poor (TUP) project), was received and operations are in the districts of Luwero, and
Kiryandongo. • BRAC scooped a winner’s award in the NGO category for the Financial Reporting Awards held in 2016. These awards are
organized every year by the Institute of Chartered Public Accountants of Uganda.
(o) Expectations for the year ending 31 December 2017
• Under the Play lab project an additional 40 play labs shall be opened in Luwero and operationalised with a strong community engagement.
• Under the scholarship Program the first cohort of the UCE scholars selected in 2013 will transition into Advanced level in 2017 and an additional 515 scholars will graduate from the programme in December 2017. 507 scholars Advanced level scholars
who graduated in 2016 will be supported to transition into University and other tertiary institutions. • The Mid-term Evaluation of the Scholarship Programme is being undertaken in 2017 and report of findings shall be shared with
different stakeholders and will inform areas of improvement for the next four years of the Programme. • Open 400 new clubs in 19 districts; in 13 new districts and 6 old districts • Admission of 12000 new members into the ELA Clubs • Implement and expand nutrition and family planning package to reduce stunting as well as child and maternal mortality – pilot
design and implementation • Train and equip remaining 2,590 CHPs on android application. • Transfer of livelihood assets, give consumption support and financial literacy& life skills to 1,650 ultra-poor youths
BRAC UGANDA
DIRECTOS’ REPORT FOR YEAR ENDED 31 DECEMBER 2016
BRAC UGANDA
DIRECTOS’ REPORT FOR YEAR ENDED 31 DECEMBER 2016
52 Annual Report 2016 Annual Report 2016 53
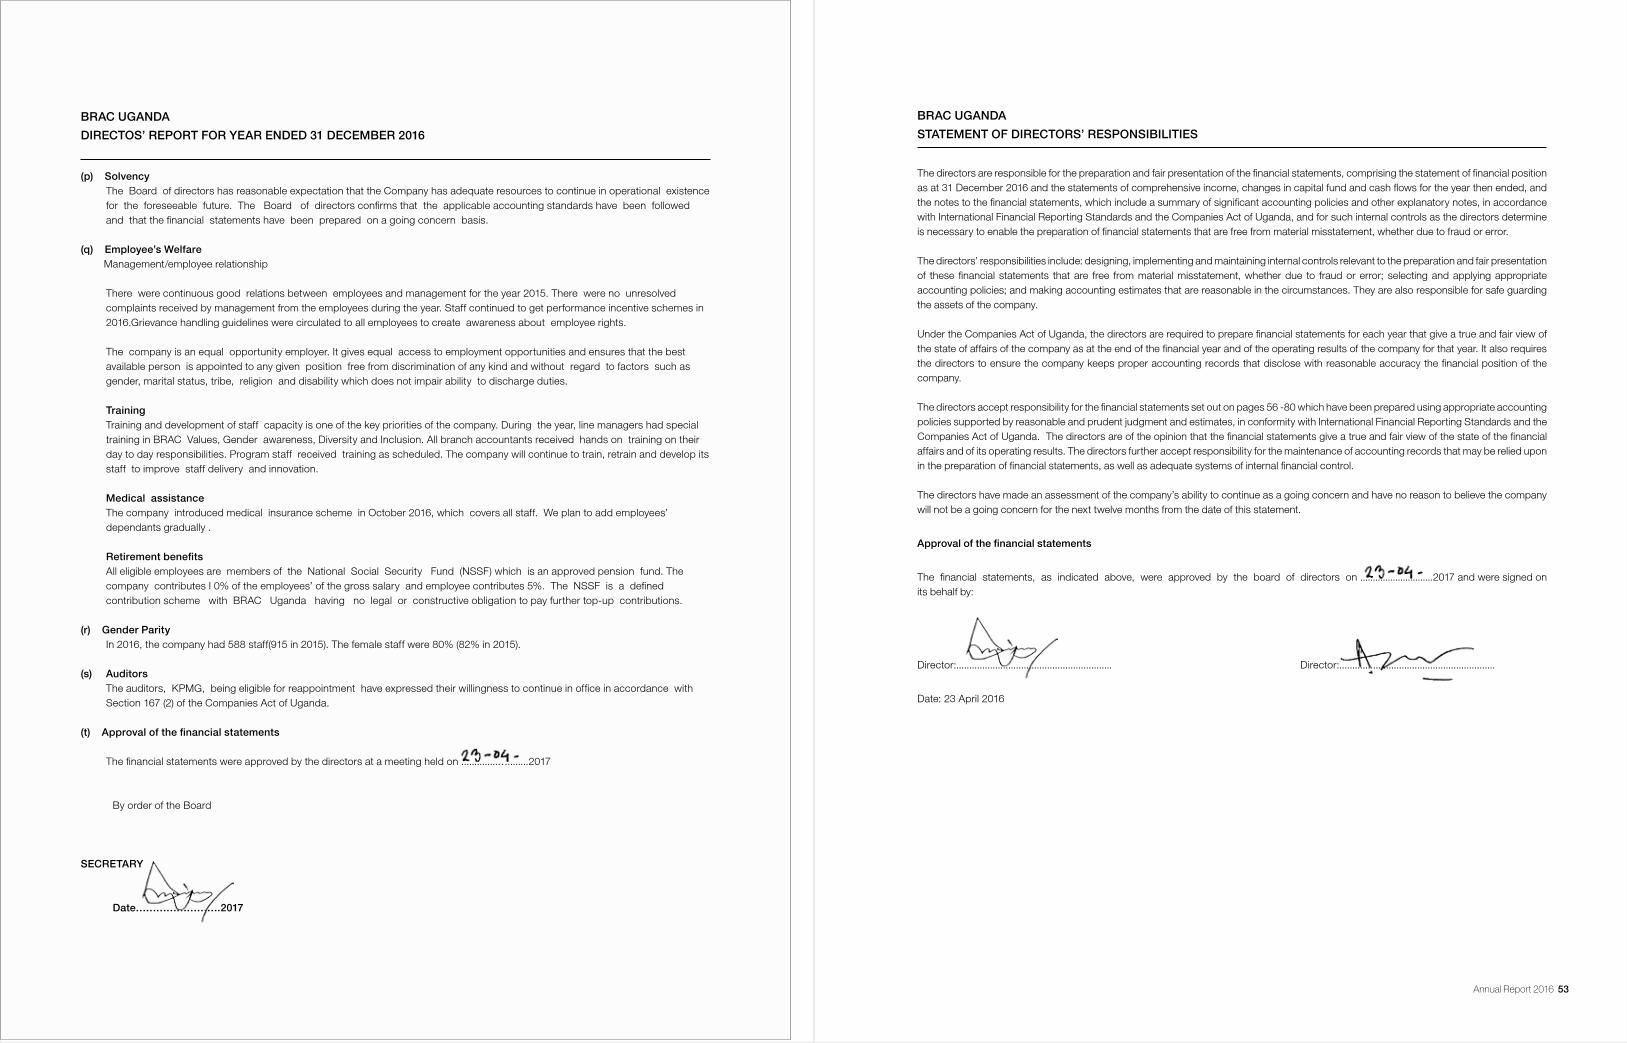
(p) Solvency The Board of directors has reasonable expectation that the Company has adequate resources to continue in operational existence
for the foreseeable future. The Board of directors confirms that the applicable accounting standards have been followed and that the financial statements have been prepared on a going concern basis.
(q) Employee’s Welfare Management/employee relationship
There were continuous good relations between employees and management for the year 2015. There were no unresolved complaints received by management from the employees during the year. Staff continued to get performance incentive schemes in 2016.Grievance handling guidelines were circulated to all employees to create awareness about employee rights.
The company is an equal opportunity employer. It gives equal access to employment opportunities and ensures that the best available person is appointed to any given position free from discrimination of any kind and without regard to factors such as gender, marital status, tribe, religion and disability which does not impair ability to discharge duties.
Training Training and development of staff capacity is one of the key priorities of the company. During the year, line managers had special
training in BRAC Values, Gender awareness, Diversity and Inclusion. All branch accountants received hands on training on their day to day responsibilities. Program staff received training as scheduled. The company will continue to train, retrain and develop its staff to improve staff delivery and innovation.
Medical assistance The company introduced medical insurance scheme in October 2016, which covers all staff. We plan to add employees’
dependants gradually .
Retirementbenefits All eligible employees are members of the National Social Security Fund (NSSF) which is an approved pension fund. The
company contributes I 0% of the employees’ of the gross salary and employee contributes 5%. The NSSF is a defined contribution scheme with BRAC Uganda having no legal or constructive obligation to pay further top-up contributions.
(r) Gender Parity In 2016, the company had 588 staff(915 in 2015). The female staff were 80% (82% in 2015).
(s) Auditors The auditors, KPMG, being eligible for reappointment have expressed their willingness to continue in office in accordance with
Section 167 (2) of the Companies Act of Uganda.
(t)Approvalofthefinancialstatements
The financial statements were approved by the directors at a meeting held on ..............…........2017
By order of the Board
SECRETARY
Date…………………….2017
BRAC UGANDA
STATEMENT OF DIRECTORS’ RESPONSIBILITIES
The directors are responsible for the preparation and fair presentation of the financial statements, comprising the statement of financial position as at 31 December 2016 and the statements of comprehensive income, changes in capital fund and cash flows for the year then ended, and the notes to the financial statements, which include a summary of significant accounting policies and other explanatory notes, in accordance with International Financial Reporting Standards and the Companies Act of Uganda, and for such internal controls as the directors determine is necessary to enable the preparation of financial statements that are free from material misstatement, whether due to fraud or error.
The directors’ responsibilities include: designing, implementing and maintaining internal controls relevant to the preparation and fair presentation of these financial statements that are free from material misstatement, whether due to fraud or error; selecting and applying appropriate accounting policies; and making accounting estimates that are reasonable in the circumstances. They are also responsible for safe guarding the assets of the company.
Under the Companies Act of Uganda, the directors are required to prepare financial statements for each year that give a true and fair view of the state of affairs of the company as at the end of the financial year and of the operating results of the company for that year. It also requires the directors to ensure the company keeps proper accounting records that disclose with reasonable accuracy the financial position of the company.
The directors accept responsibility for the financial statements set out on pages 56 -80 which have been prepared using appropriate accounting policies supported by reasonable and prudent judgment and estimates, in conformity with International Financial Reporting Standards and the Companies Act of Uganda. The directors are of the opinion that the financial statements give a true and fair view of the state of the financial affairs and of its operating results. The directors further accept responsibility for the maintenance of accounting records that may be relied upon in the preparation of financial statements, as well as adequate systems of internal financial control.
The directors have made an assessment of the company’s ability to continue as a going concern and have no reason to believe the company will not be a going concern for the next twelve months from the date of this statement.
Approvalofthefinancialstatements
The financial statements, as indicated above, were approved by the board of directors on .............................2017 and were signed on its behalf by:
Director:............................................................ Director:............................................................
Date: 23 April 2016
BRAC UGANDA
DIRECTOS’ REPORT FOR YEAR ENDED 31 DECEMBER 2016
54 Annual Report 2016
BRAC UGANDA
REPORT AND FINANCIAL STATEMENTS FOR YEAR ENDED 31 DECEMBER 2016
BRAC UGANDA
REPORT AND FINANCIAL STATEMENTS FOR YEAR ENDED 31 DECEMBER 2016
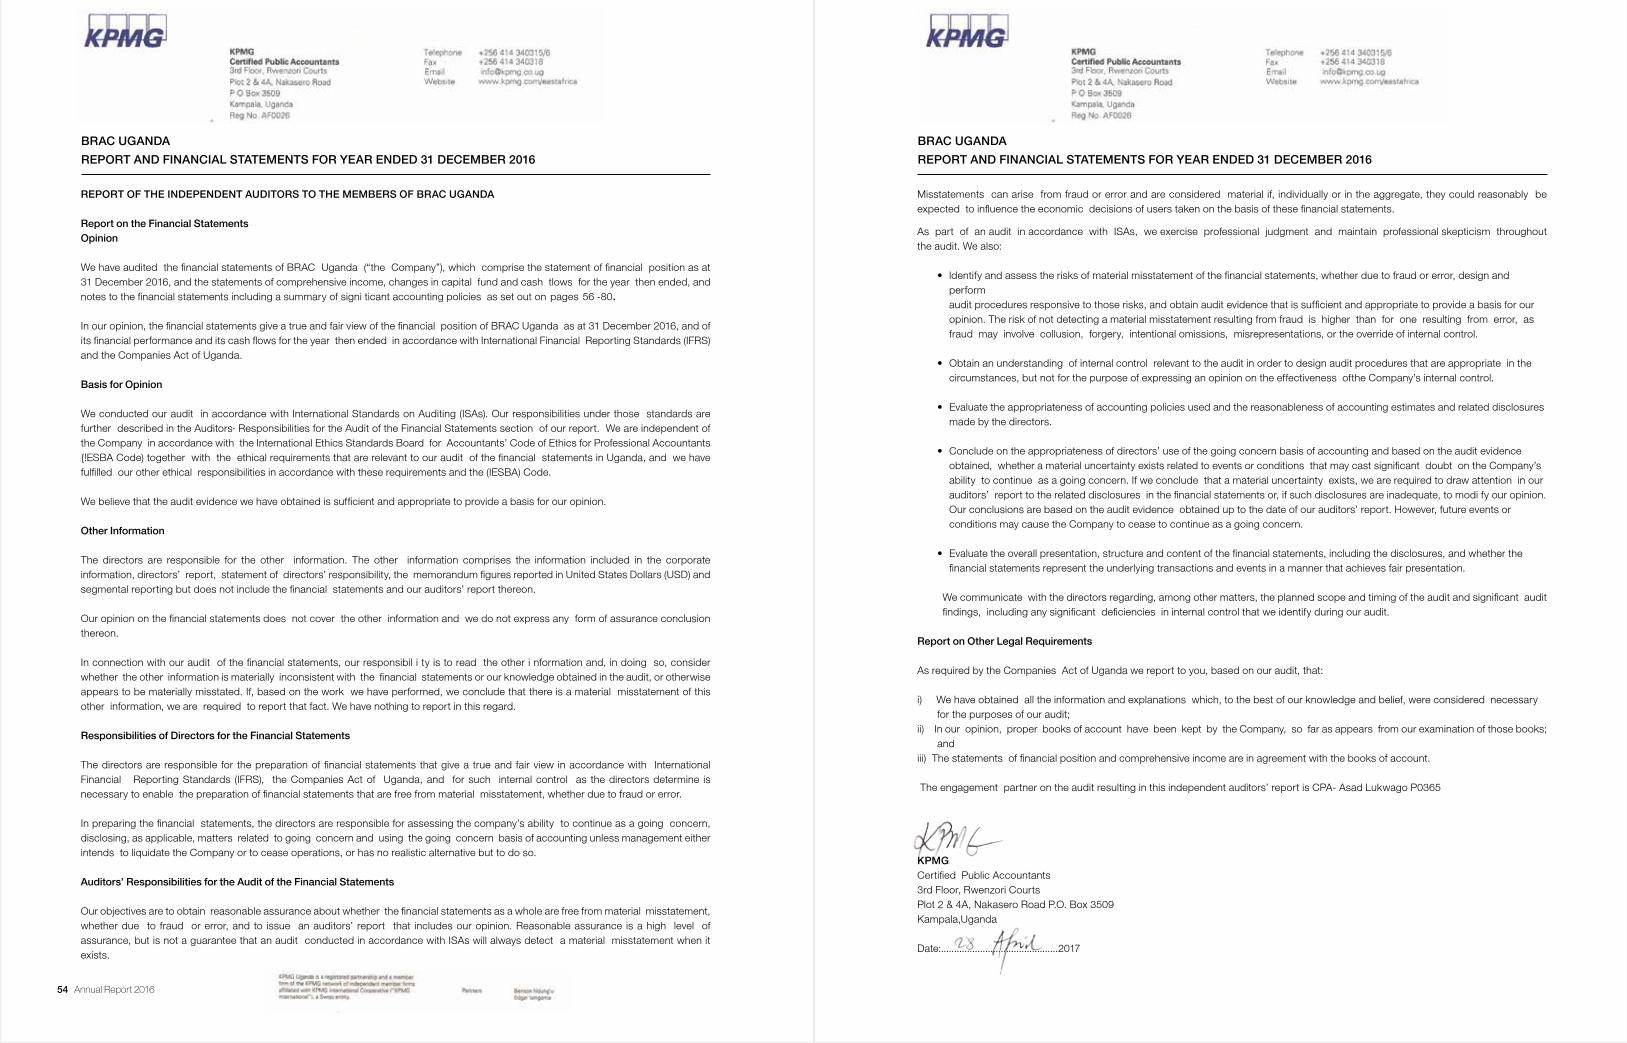
REPORT OF THE INDEPENDENT AUDITORS TO THE MEMBERS OF BRAC UGANDA
Report on the Financial StatementsOpinion
We have audited the financial statements of BRAC Uganda (“the Company”), which comprise the statement of financial position as at 31 December 2016, and the statements of comprehensive income, changes in capital fund and cash tlows for the year then ended, and notes to the financial statements including a summary of signi ticant accounting policies as set out on pages 56 -80.
In our opinion, the financial statements give a true and fair view of the financial position of BRAC Uganda as at 31 December 2016, and of its financial performance and its cash flows for the year then ended in accordance with International Financial Reporting Standards (IFRS) and the Companies Act of Uganda.
Basis for Opinion
We conducted our audit in accordance with International Standards on Auditing (ISAs). Our responsibilities under those standards are further described in the Auditors· Responsibilities for the Audit of the Financial Statements section of our report. We are independent of the Company in accordance with the International Ethics Standards Board for Accountants’ Code of Ethics for Professional Accountants {!ESBA Code) together with the ethical requirements that are relevant to our audit of the financial statements in Uganda, and we have fulfilled our other ethical responsibilities in accordance with these requirements and the (IESBA) Code.
We believe that the audit evidence we have obtained is sufficient and appropriate to provide a basis for our opinion.
Other Information
The directors are responsible for the other information. The other information comprises the information included in the corporate information, directors’ report, statement of directors’ responsibility, the memorandum figures reported in United States Dollars (USD) and segmental reporting but does not include the financial statements and our auditors’ report thereon.
Our opinion on the financial statements does not cover the other information and we do not express any form of assurance conclusion thereon.
In connection with our audit of the financial statements, our responsibil i ty is to read the other i nformation and, in doing so, consider whether the other information is materially inconsistent with the financial statements or our knowledge obtained in the audit, or otherwise appears to be materially misstated. If, based on the work we have performed, we conclude that there is a material misstatement of this other information, we are required to report that fact. We have nothing to report in this regard.
Responsibilities of Directors for the Financial Statements
The directors are responsible for the preparation of financial statements that give a true and fair view in accordance with International Financial Reporting Standards (IFRS), the Companies Act of Uganda, and for such internal control as the directors determine is necessary to enable the preparation of financial statements that are free from material misstatement, whether due to fraud or error.
In preparing the financial statements, the directors are responsible for assessing the company’s ability to continue as a going concern, disclosing, as applicable, matters related to going concern and using the going concern basis of accounting unless management either intends to liquidate the Company or to cease operations, or has no realistic alternative but to do so.
Auditors’ Responsibilities for the Audit of the Financial Statements
Our objectives are to obtain reasonable assurance about whether the financial statements as a whole are free from material misstatement, whether due to fraud or error, and to issue an auditors’ report that includes our opinion. Reasonable assurance is a high level of assurance, but is not a guarantee that an audit conducted in accordance with ISAs will always detect a material misstatement when it exists.
Misstatements can arise from fraud or error and are considered material if, individually or in the aggregate, they could reasonably be expected to influence the economic decisions of users taken on the basis of these financial statements.
As part of an audit in accordance with ISAs, we exercise professional judgment and maintain professional skepticism throughout the audit. We also:
• ldentify and assess the risks of material misstatement of the financial statements, whether due to fraud or error, design and perform audit procedures responsive to those risks, and obtain audit evidence that is sufficient and appropriate to provide a basis for our opinion. The risk of not detecting a material misstatement resulting from fraud is higher than for one resulting from error, as fraud may involve collusion, forgery, intentional omissions, misrepresentations, or the override of internal control.
• Obtain an understanding of internal control relevant to the audit in order to design audit procedures that are appropriate in the circumstances, but not for the purpose of expressing an opinion on the effectiveness ofthe Company’s internal control.
• Evaluate the appropriateness of accounting policies used and the reasonableness of accounting estimates and related disclosures made by the directors.
• Conclude on the appropriateness of directors’ use of the going concern basis of accounting and based on the audit evidence obtained, whether a material uncertainty exists related to events or conditions that may cast significant doubt on the Company’s ability to continue as a going concern. If we conclude that a material uncertainty exists, we are required to draw attention in our auditors’ report to the related disclosures in the financial statements or, if such disclosures are inadequate, to modi fy our opinion. Our conclusions are based on the audit evidence obtained up to the date of our auditors’ report. However, future events or conditions may cause the Company to cease to continue as a going concern.
• Evaluate the overall presentation, structure and content of the financial statements, including the disclosures, and whether the financial statements represent the underlying transactions and events in a manner that achieves fair presentation.
We communicate with the directors regarding, among other matters, the planned scope and timing of the audit and significant audit findings, including any significant deficiencies in internal control that we identify during our audit.
Report on Other Legal Requirements
As required by the Companies Act of Uganda we report to you, based on our audit, that:
i) We have obtained all the information and explanations which, to the best of our knowledge and belief, were considered necessary for the purposes of our audit;ii) In our opinion, proper books of account have been kept by the Company, so far as appears from our examination of those books; andiii) The statements of financial position and comprehensive income are in agreement with the books of account.
The engagement partner on the audit resulting in this independent auditors’ report is CPA- Asad Lukwago P0365
KPMGCertified Public Accountants3rd Floor, Rwenzori CourtsPlot 2 & 4A, Nakasero Road P.O. Box 3509Kampala,Uganda
Date:.............................................2017
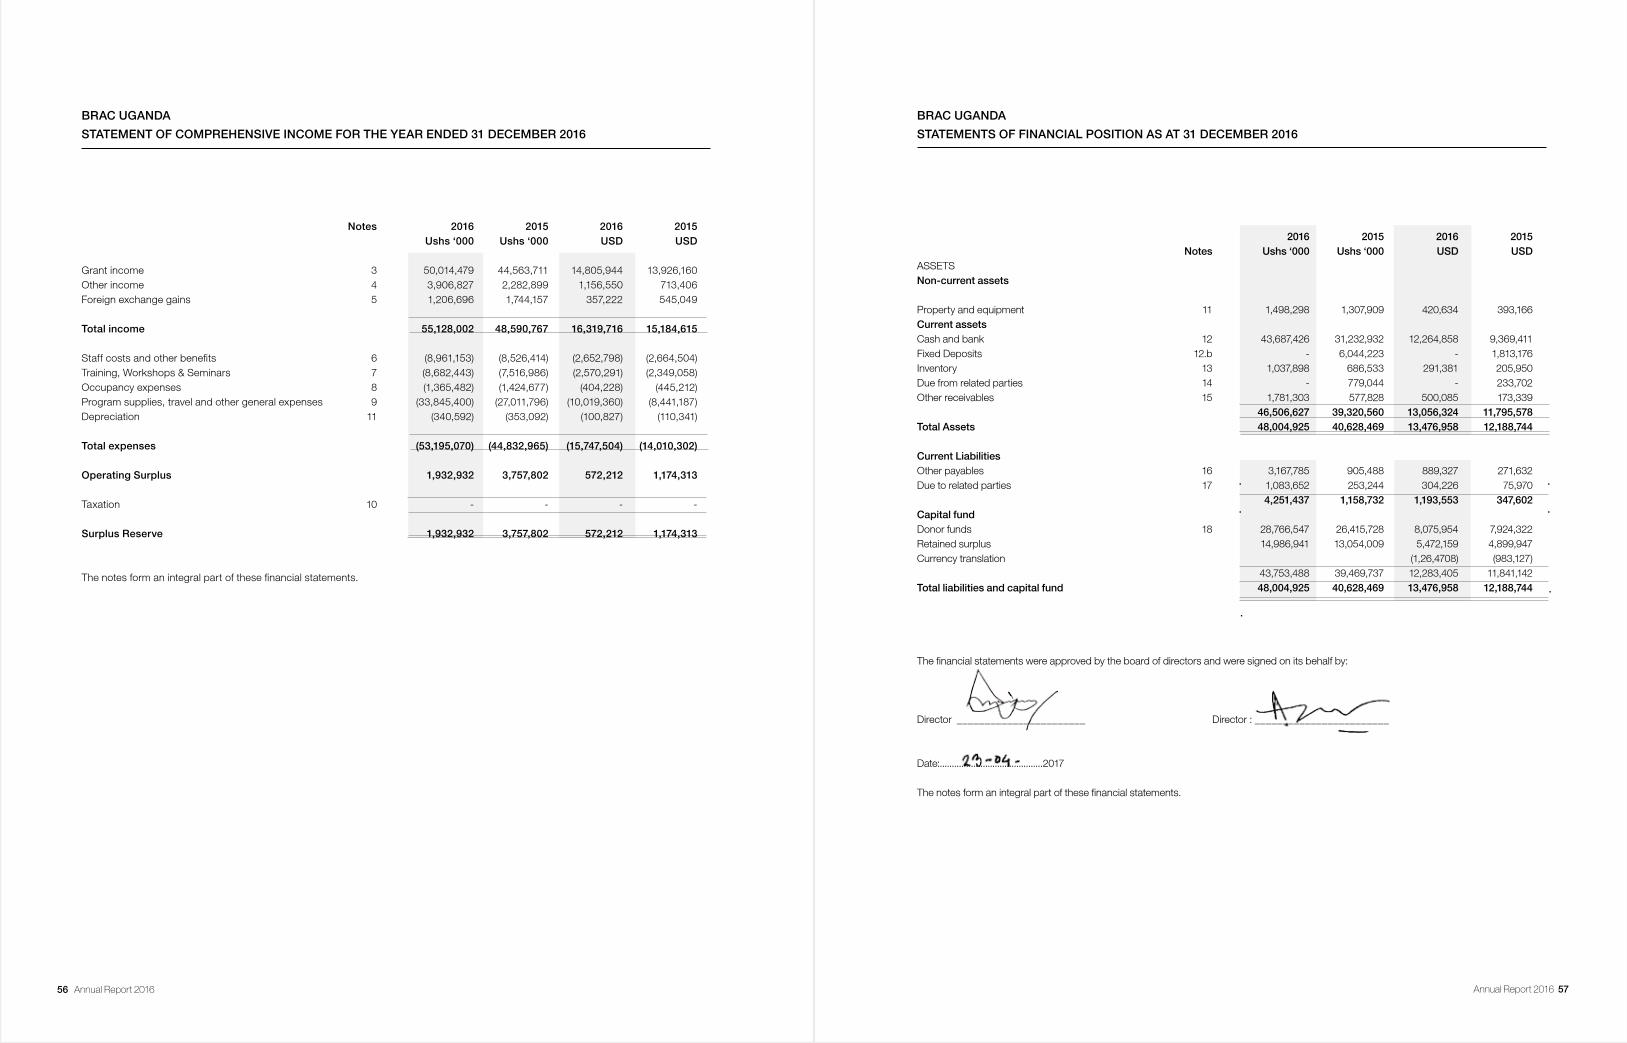
56 Annual Report 2016 Annual Report 2016 57
BRAC UGANDA
STATEMENT OF COMPREHENSIVE INCOME FOR THE YEAR ENDED 31 DECEMBER 2016
Notes 2016 2015 2016 2015 Ushs ‘000 Ushs ‘000 USD USD Grant income 3 50,014,479 44,563,711 14,805,944 13,926,160Other income 4 3,906,827 2,282,899 1,156,550 713,406Foreign exchange gains 5 1,206,696 1,744,157 357,222 545,049
Total income 55,128,002 48,590,767 16,319,716 15,184,615
Staff costs and other benefits 6 (8,961,153) (8,526,414) (2,652,798) (2,664,504)Training, Workshops & Seminars 7 (8,682,443) (7,516,986) (2,570,291) (2,349,058)Occupancy expenses 8 (1,365,482) (1,424,677) (404,228) (445,212)Program supplies, travel and other general expenses 9 (33,845,400) (27,011,796) (10,019,360) (8,441,187)Depreciation 11 (340,592) (353,092) (100,827) (110,341)
Total expenses (53,195,070) (44,832,965) (15,747,504) (14,010,302)
Operating Surplus 1,932,932 3,757,802 572,212 1,174,313
Taxation 10 - - - -
Surplus Reserve 1,932,932 3,757,802 572,212 1,174,313
The notes form an integral part of these financial statements.
BRAC UGANDA
STATEMENTS OF FINANCIAL POSITION AS AT 31 DECEMBER 2016
2016 2015 2016 2015 Notes Ushs ‘000 Ushs ‘000 USD USD ASSETS Non-current assets Property and equipment 11 1,498,298 1,307,909 420,634 393,166Current assets Cash and bank 12 43,687,426 31,232,932 12,264,858 9,369,411Fixed Deposits 12.b - 6,044,223 - 1,813,176Inventory 13 1,037,898 686,533 291,381 205,950Due from related parties 14 - 779,044 - 233,702Other receivables 15 1,781,303 577,828 500,085 173,339 46,506,627 39,320,560 13,056,324 11,795,578Total Assets 48,004,925 40,628,469 13,476,958 12,188,744 Current Liabilities Other payables 16 3,167,785 905,488 889,327 271,632Due to related parties 17 1,083,652 253,244 304,226 75,970 4,251,437 1,158,732 1,193,553 347,602Capital fund Donor funds 18 28,766,547 26,415,728 8,075,954 7,924,322Retained surplus 14,986,941 13,054,009 5,472,159 4,899,947Currency translation (1,26,4708) (983,127) 43,753,488 39,469,737 12,283,405 11,841,142Total liabilities and capital fund 48,004,925 40,628,469 13,476,958 12,188,744
The financial statements were approved by the board of directors and were signed on its behalf by:
Director _______________________ Director : ________________________
Date:...........................................2017
The notes form an integral part of these financial statements.
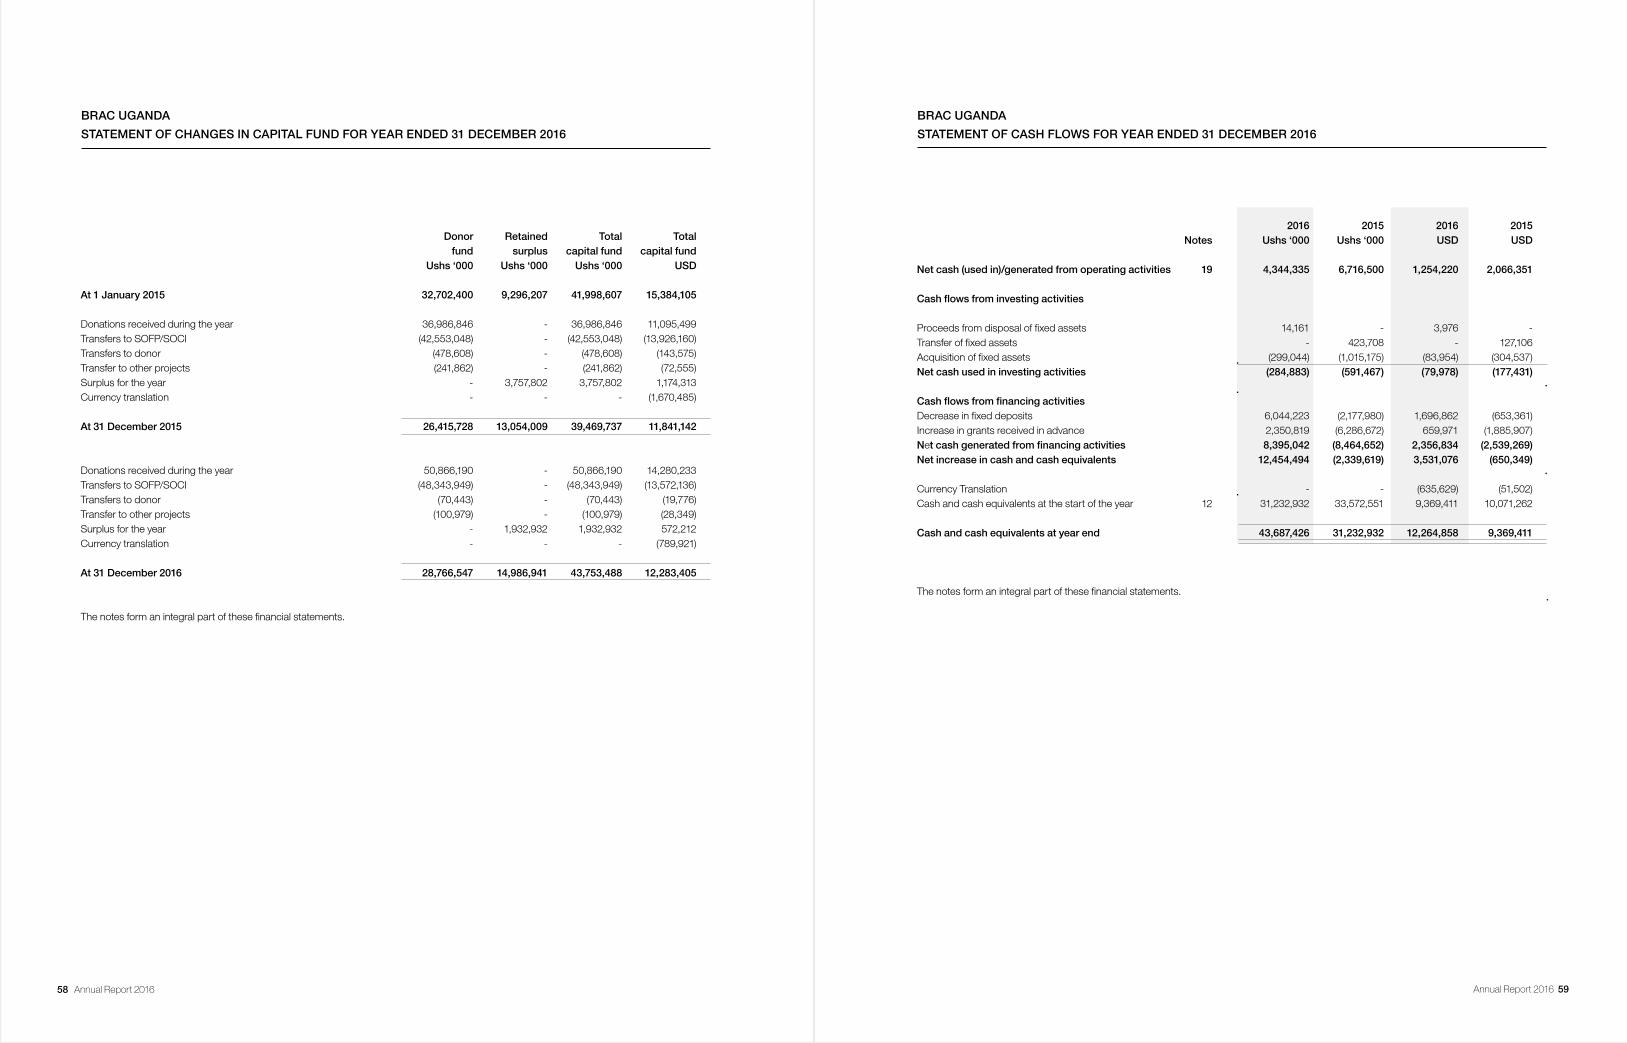
58 Annual Report 2016 Annual Report 2016 59
BRAC UGANDA
STATEMENT OF CHANGES IN CAPITAL FUND FOR YEAR ENDED 31 DECEMBER 2016
Donor Retained Total Total fund surplus capital fund capital fund Ushs ‘000 Ushs ‘000 Ushs ‘000 USD
At 1 January 2015 32,702,400 9,296,207 41,998,607 15,384,105
Donations received during the year 36,986,846 - 36,986,846 11,095,499Transfers to SOFP/SOCI (42,553,048) - (42,553,048) (13,926,160)Transfers to donor (478,608) - (478,608) (143,575)Transfer to other projects (241,862) - (241,862) (72,555)Surplus for the year - 3,757,802 3,757,802 1,174,313Currency translation - - - (1,670,485)
At 31 December 2015 26,415,728 13,054,009 39,469,737 11,841,142
Donations received during the year 50,866,190 - 50,866,190 14,280,233Transfers to SOFP/SOCI (48,343,949) - (48,343,949) (13,572,136)Transfers to donor (70,443) - (70,443) (19,776)Transfer to other projects (100,979) - (100,979) (28,349)Surplus for the year - 1,932,932 1,932,932 572,212Currency translation - - - (789,921)
At 31 December 2016 28,766,547 14,986,941 43,753,488 12,283,405
The notes form an integral part of these financial statements.
BRAC UGANDA
STATEMENT OF CASH FLOWS FOR YEAR ENDED 31 DECEMBER 2016
2016 2015 2016 2015 Notes Ushs ‘000 Ushs ‘000 USD USD
Net cash (used in)/generated from operating activities 19 4,344,335 6,716,500 1,254,220 2,066,351
Cashflowsfrominvestingactivities
Proceeds from disposal of fixed assets 14,161 - 3,976 -Transfer of fixed assets - 423,708 - 127,106Acquisition of fixed assets (299,044) (1,015,175) (83,954) (304,537)Net cash used in investing activities (284,883) (591,467) (79,978) (177,431) Cashflowsfromfinancingactivities Decrease in fixed deposits 6,044,223 (2,177,980) 1,696,862 (653,361)Increase in grants received in advance 2,350,819 (6,286,672) 659,971 (1,885,907)Netcashgeneratedfromfinancingactivities 8,395,042 (8,464,652) 2,356,834 (2,539,269)Net increase in cash and cash equivalents 12,454,494 (2,339,619) 3,531,076 (650,349) Currency Translation - - (635,629) (51,502)Cash and cash equivalents at the start of the year 12 31,232,932 33,572,551 9,369,411 10,071,262 Cash and cash equivalents at year end 43,687,426 31,232,932 12,264,858 9,369,411
The notes form an integral part of these financial statements.
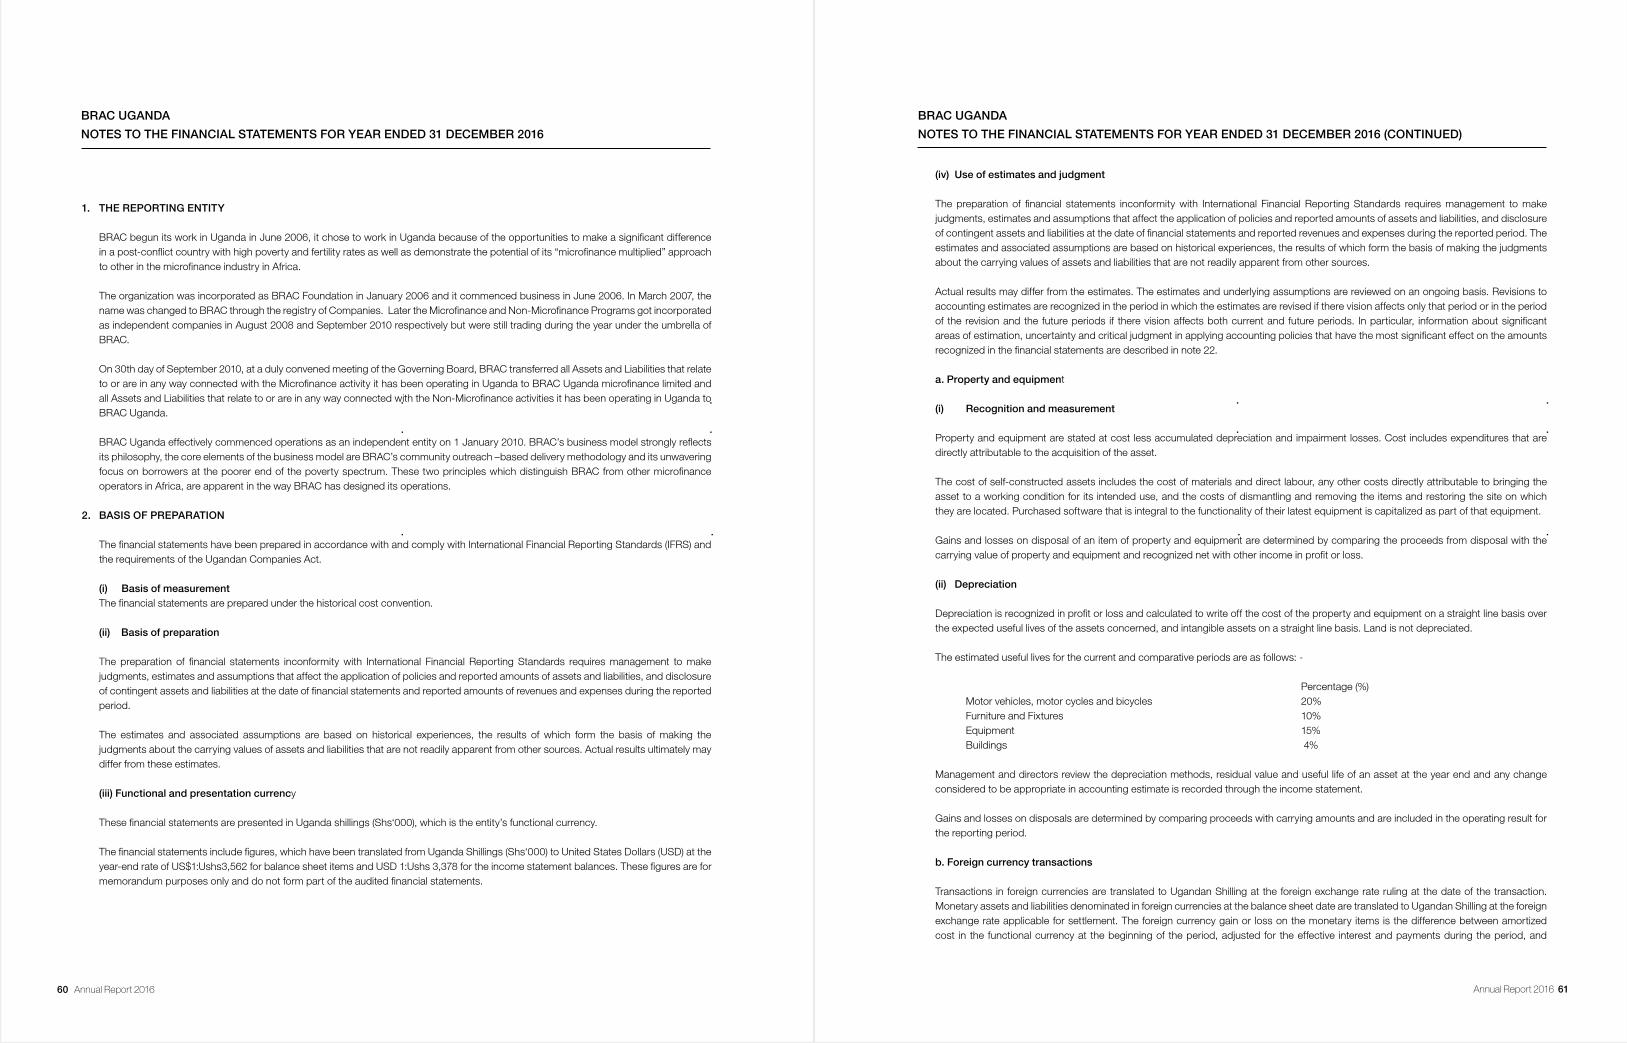
60 Annual Report 2016 Annual Report 2016 61
BRAC UGANDA
NOTES TO THE FINANCIAL STATEMENTS FOR YEAR ENDED 31 DECEMBER 2016
1. THE REPORTING ENTITY
BRAC begun its work in Uganda in June 2006, it chose to work in Uganda because of the opportunities to make a significant difference in a post-conflict country with high poverty and fertility rates as well as demonstrate the potential of its “microfinance multiplied” approach to other in the microfinance industry in Africa.
The organization was incorporated as BRAC Foundation in January 2006 and it commenced business in June 2006. In March 2007, the name was changed to BRAC through the registry of Companies. Later the Microfinance and Non-Microfinance Programs got incorporated as independent companies in August 2008 and September 2010 respectively but were still trading during the year under the umbrella of BRAC.
On 30th day of September 2010, at a duly convened meeting of the Governing Board, BRAC transferred all Assets and Liabilities that relate to or are in any way connected with the Microfinance activity it has been operating in Uganda to BRAC Uganda microfinance limited and all Assets and Liabilities that relate to or are in any way connected with the Non-Microfinance activities it has been operating in Uganda to BRAC Uganda.
BRAC Uganda effectively commenced operations as an independent entity on 1 January 2010. BRAC’s business model strongly reflects its philosophy, the core elements of the business model are BRAC’s community outreach –based delivery methodology and its unwavering focus on borrowers at the poorer end of the poverty spectrum. These two principles which distinguish BRAC from other microfinance operators in Africa, are apparent in the way BRAC has designed its operations.
2. BASIS OF PREPARATION
The financial statements have been prepared in accordance with and comply with International Financial Reporting Standards (IFRS) and the requirements of the Ugandan Companies Act.
(i) Basis of measurementThe financial statements are prepared under the historical cost convention.
(ii) Basis of preparation
The preparation of financial statements inconformity with International Financial Reporting Standards requires management to make judgments, estimates and assumptions that affect the application of policies and reported amounts of assets and liabilities, and disclosure of contingent assets and liabilities at the date of financial statements and reported amounts of revenues and expenses during the reported period.
The estimates and associated assumptions are based on historical experiences, the results of which form the basis of making the judgments about the carrying values of assets and liabilities that are not readily apparent from other sources. Actual results ultimately may differ from these estimates.
(iii) Functional and presentation currency
These financial statements are presented in Uganda shillings (Shs‘000), which is the entity’s functional currency.
The financial statements include figures, which have been translated from Uganda Shillings (Shs‘000) to United States Dollars (USD) at the year-end rate of US$1:Ushs3,562 for balance sheet items and USD 1:Ushs 3,378 for the income statement balances. These figures are for memorandum purposes only and do not form part of the audited financial statements.
BRAC UGANDA
NOTES TO THE FINANCIAL STATEMENTS FOR YEAR ENDED 31 DECEMBER 2016 (CONTINUED)
(iv) Use of estimates and judgment
The preparation of financial statements inconformity with International Financial Reporting Standards requires management to make judgments, estimates and assumptions that affect the application of policies and reported amounts of assets and liabilities, and disclosure of contingent assets and liabilities at the date of financial statements and reported revenues and expenses during the reported period. The estimates and associated assumptions are based on historical experiences, the results of which form the basis of making the judgments about the carrying values of assets and liabilities that are not readily apparent from other sources.
Actual results may differ from the estimates. The estimates and underlying assumptions are reviewed on an ongoing basis. Revisions to accounting estimates are recognized in the period in which the estimates are revised if there vision affects only that period or in the period of the revision and the future periods if there vision affects both current and future periods. In particular, information about significant areas of estimation, uncertainty and critical judgment in applying accounting policies that have the most significant effect on the amounts recognized in the financial statements are described in note 22.
a. Property and equipment
(i) Recognition and measurement
Property and equipment are stated at cost less accumulated depreciation and impairment losses. Cost includes expenditures that are directly attributable to the acquisition of the asset.
The cost of self-constructed assets includes the cost of materials and direct labour, any other costs directly attributable to bringing the asset to a working condition for its intended use, and the costs of dismantling and removing the items and restoring the site on which they are located. Purchased software that is integral to the functionality of their latest equipment is capitalized as part of that equipment.
Gains and losses on disposal of an item of property and equipment are determined by comparing the proceeds from disposal with the carrying value of property and equipment and recognized net with other income in profit or loss.
(ii) Depreciation
Depreciation is recognized in profit or loss and calculated to write off the cost of the property and equipment on a straight line basis over the expected useful lives of the assets concerned, and intangible assets on a straight line basis. Land is not depreciated.
The estimated useful lives for the current and comparative periods are as follows: -
Percentage (%) Motor vehicles, motor cycles and bicycles 20% Furniture and Fixtures 10% Equipment 15% Buildings 4%
Management and directors review the depreciation methods, residual value and useful life of an asset at the year end and any change considered to be appropriate in accounting estimate is recorded through the income statement.
Gains and losses on disposals are determined by comparing proceeds with carrying amounts and are included in the operating result for the reporting period.
b. Foreign currency transactions
Transactions in foreign currencies are translated to Ugandan Shilling at the foreign exchange rate ruling at the date of the transaction. Monetary assets and liabilities denominated in foreign currencies at the balance sheet date are translated to Ugandan Shilling at the foreign exchange rate applicable for settlement. The foreign currency gain or loss on the monetary items is the difference between amortized cost in the functional currency at the beginning of the period, adjusted for the effective interest and payments during the period, and
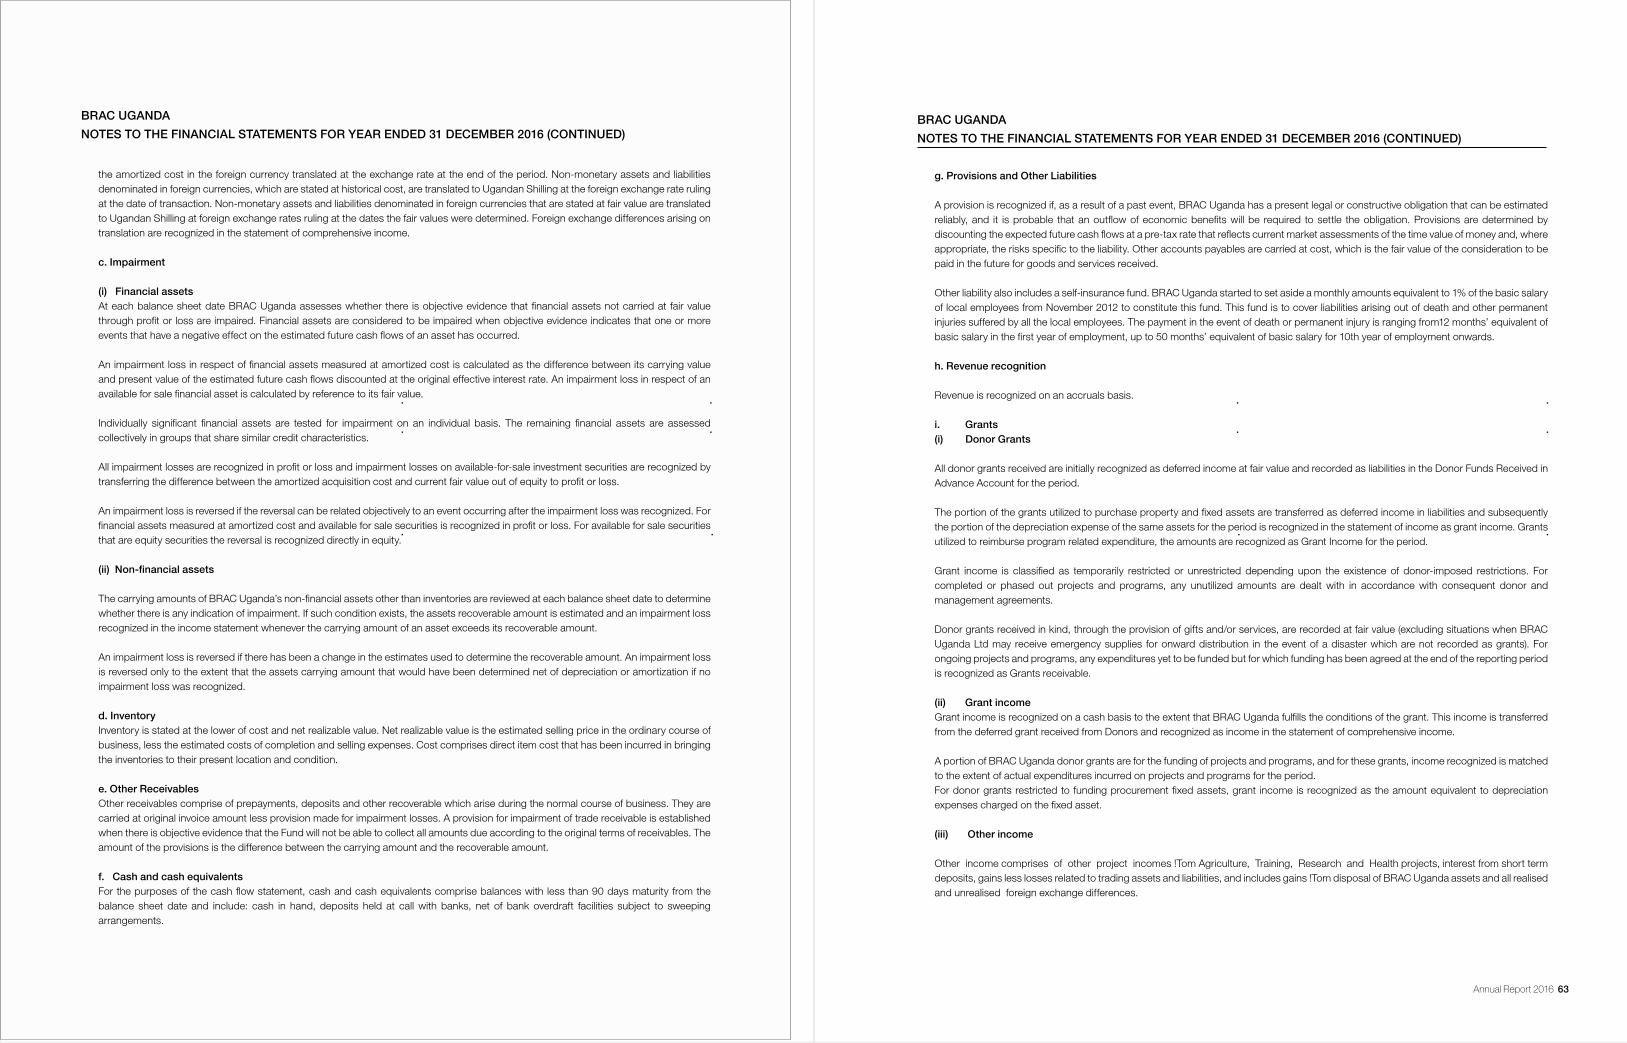
62 Annual Report 2016 Annual Report 2016 63
the amortized cost in the foreign currency translated at the exchange rate at the end of the period. Non-monetary assets and liabilities denominated in foreign currencies, which are stated at historical cost, are translated to Ugandan Shilling at the foreign exchange rate ruling at the date of transaction. Non-monetary assets and liabilities denominated in foreign currencies that are stated at fair value are translated to Ugandan Shilling at foreign exchange rates ruling at the dates the fair values were determined. Foreign exchange differences arising on translation are recognized in the statement of comprehensive income.
c. Impairment
(i) Financial assetsAt each balance sheet date BRAC Uganda assesses whether there is objective evidence that financial assets not carried at fair value through profit or loss are impaired. Financial assets are considered to be impaired when objective evidence indicates that one or more events that have a negative effect on the estimated future cash flows of an asset has occurred.
An impairment loss in respect of financial assets measured at amortized cost is calculated as the difference between its carrying value and present value of the estimated future cash flows discounted at the original effective interest rate. An impairment loss in respect of an available for sale financial asset is calculated by reference to its fair value.
Individually significant financial assets are tested for impairment on an individual basis. The remaining financial assets are assessed collectively in groups that share similar credit characteristics.
All impairment losses are recognized in profit or loss and impairment losses on available-for-sale investment securities are recognized by transferring the difference between the amortized acquisition cost and current fair value out of equity to profit or loss.
An impairment loss is reversed if the reversal can be related objectively to an event occurring after the impairment loss was recognized. For financial assets measured at amortized cost and available for sale securities is recognized in profit or loss. For available for sale securities that are equity securities the reversal is recognized directly in equity.
(ii)Non-financialassets
The carrying amounts of BRAC Uganda’s non-financial assets other than inventories are reviewed at each balance sheet date to determine whether there is any indication of impairment. If such condition exists, the assets recoverable amount is estimated and an impairment loss recognized in the income statement whenever the carrying amount of an asset exceeds its recoverable amount.
An impairment loss is reversed if there has been a change in the estimates used to determine the recoverable amount. An impairment loss is reversed only to the extent that the assets carrying amount that would have been determined net of depreciation or amortization if no impairment loss was recognized.
d. InventoryInventory is stated at the lower of cost and net realizable value. Net realizable value is the estimated selling price in the ordinary course of business, less the estimated costs of completion and selling expenses. Cost comprises direct item cost that has been incurred in bringing the inventories to their present location and condition.
e. Other ReceivablesOther receivables comprise of prepayments, deposits and other recoverable which arise during the normal course of business. They are carried at original invoice amount less provision made for impairment losses. A provision for impairment of trade receivable is established when there is objective evidence that the Fund will not be able to collect all amounts due according to the original terms of receivables. The amount of the provisions is the difference between the carrying amount and the recoverable amount.
f. Cash and cash equivalentsFor the purposes of the cash flow statement, cash and cash equivalents comprise balances with less than 90 days maturity from the balance sheet date and include: cash in hand, deposits held at call with banks, net of bank overdraft facilities subject to sweeping arrangements.
BRAC UGANDA
NOTES TO THE FINANCIAL STATEMENTS FOR YEAR ENDED 31 DECEMBER 2016 (CONTINUED)BRAC UGANDA
NOTES TO THE FINANCIAL STATEMENTS FOR YEAR ENDED 31 DECEMBER 2016 (CONTINUED)
g. Provisions and Other Liabilities
A provision is recognized if, as a result of a past event, BRAC Uganda has a present legal or constructive obligation that can be estimated reliably, and it is probable that an outflow of economic benefits will be required to settle the obligation. Provisions are determined by discounting the expected future cash flows at a pre-tax rate that reflects current market assessments of the time value of money and, where appropriate, the risks specific to the liability. Other accounts payables are carried at cost, which is the fair value of the consideration to be paid in the future for goods and services received.
Other liability also includes a self-insurance fund. BRAC Uganda started to set aside a monthly amounts equivalent to 1% of the basic salary of local employees from November 2012 to constitute this fund. This fund is to cover liabilities arising out of death and other permanent injuries suffered by all the local employees. The payment in the event of death or permanent injury is ranging from12 months’ equivalent of basic salary in the first year of employment, up to 50 months’ equivalent of basic salary for 10th year of employment onwards.
h. Revenue recognition
Revenue is recognized on an accruals basis.
i. Grants(i) Donor Grants
All donor grants received are initially recognized as deferred income at fair value and recorded as liabilities in the Donor Funds Received in Advance Account for the period.
The portion of the grants utilized to purchase property and fixed assets are transferred as deferred income in liabilities and subsequently the portion of the depreciation expense of the same assets for the period is recognized in the statement of income as grant income. Grants utilized to reimburse program related expenditure, the amounts are recognized as Grant Income for the period.
Grant income is classified as temporarily restricted or unrestricted depending upon the existence of donor-imposed restrictions. For completed or phased out projects and programs, any unutilized amounts are dealt with in accordance with consequent donor and management agreements.
Donor grants received in kind, through the provision of gifts and/or services, are recorded at fair value (excluding situations when BRAC Uganda Ltd may receive emergency supplies for onward distribution in the event of a disaster which are not recorded as grants). For ongoing projects and programs, any expenditures yet to be funded but for which funding has been agreed at the end of the reporting period is recognized as Grants receivable.
(ii) Grant incomeGrant income is recognized on a cash basis to the extent that BRAC Uganda fulfills the conditions of the grant. This income is transferred from the deferred grant received from Donors and recognized as income in the statement of comprehensive income.
A portion of BRAC Uganda donor grants are for the funding of projects and programs, and for these grants, income recognized is matched to the extent of actual expenditures incurred on projects and programs for the period.For donor grants restricted to funding procurement fixed assets, grant income is recognized as the amount equivalent to depreciation expenses charged on the fixed asset.
(iii) Other income
Other income comprises of other project incomes !Tom Agriculture, Training, Research and Health projects, interest from short term deposits, gains less losses related to trading assets and liabilities, and includes gains !Tom disposal of BRAC Uganda assets and all realised and unrealised foreign exchange differences.
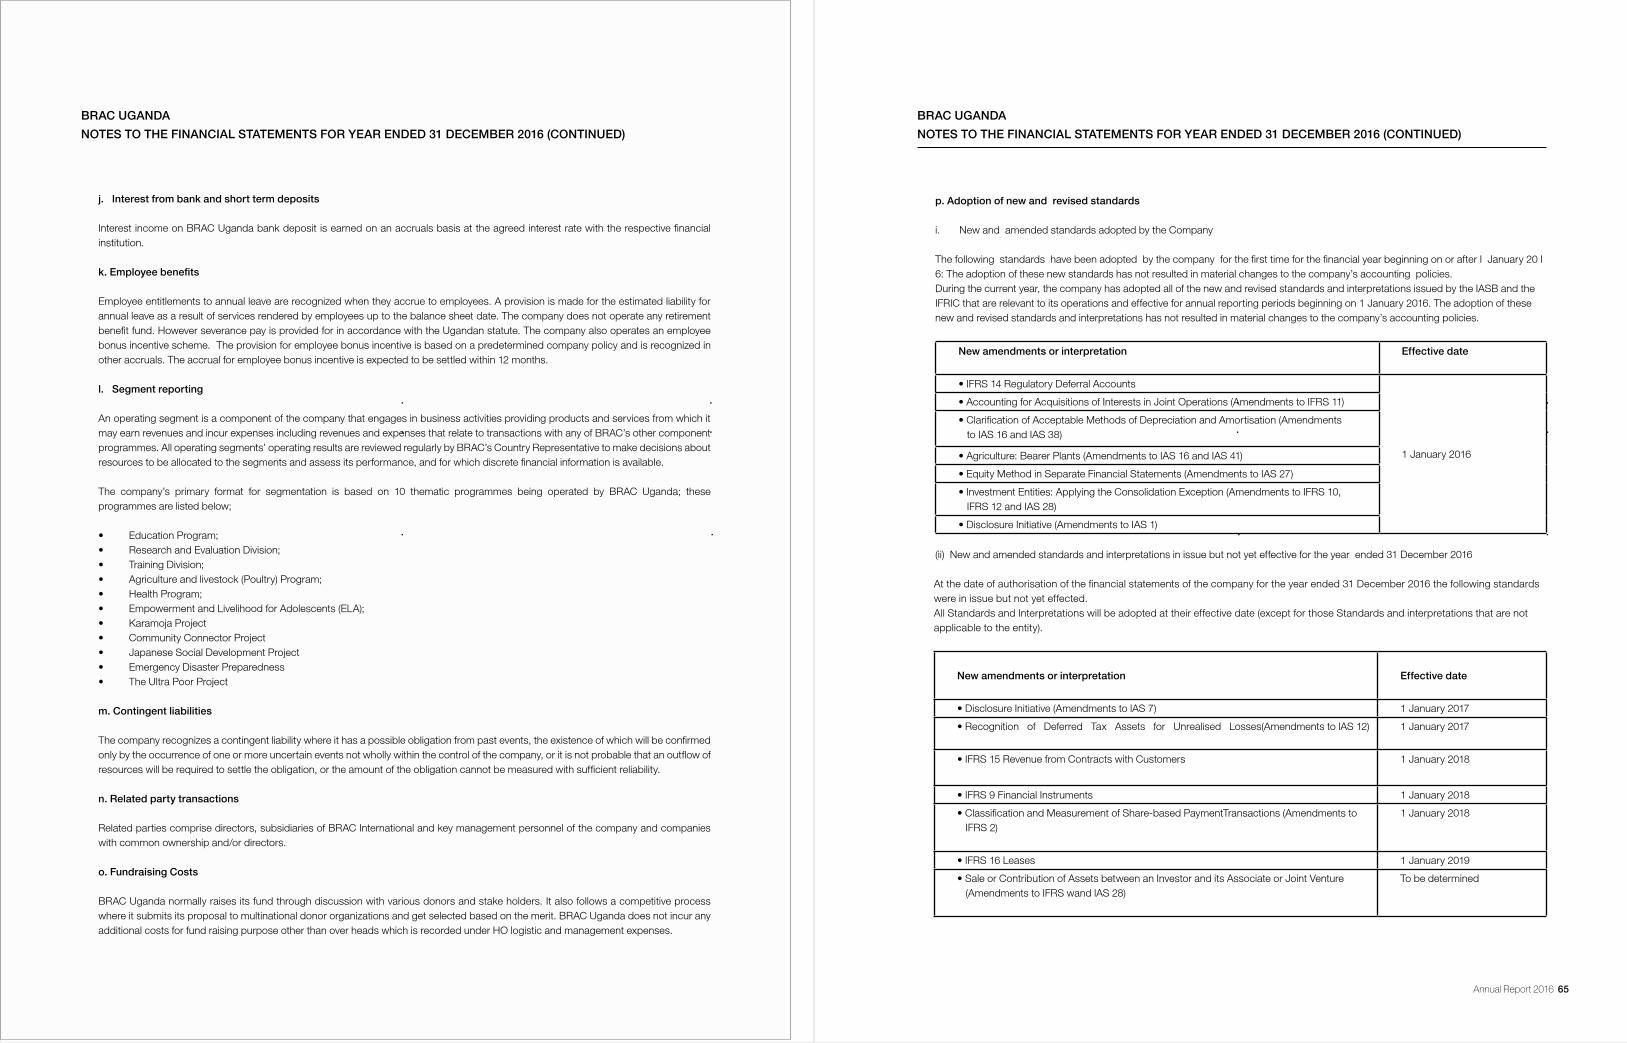
64 Annual Report 2016 Annual Report 2016 65
BRAC UGANDA
NOTES TO THE FINANCIAL STATEMENTS FOR YEAR ENDED 31 DECEMBER 2016 (CONTINUED)
j. Interest from bank and short term deposits
Interest income on BRAC Uganda bank deposit is earned on an accruals basis at the agreed interest rate with the respective financial institution.
k.Employeebenefits
Employee entitlements to annual leave are recognized when they accrue to employees. A provision is made for the estimated liability for annual leave as a result of services rendered by employees up to the balance sheet date. The company does not operate any retirement benefit fund. However severance pay is provided for in accordance with the Ugandan statute. The company also operates an employee bonus incentive scheme. The provision for employee bonus incentive is based on a predetermined company policy and is recognized in other accruals. The accrual for employee bonus incentive is expected to be settled within 12 months.
l. Segment reporting
An operating segment is a component of the company that engages in business activities providing products and services from which it may earn revenues and incur expenses including revenues and expenses that relate to transactions with any of BRAC’s other component programmes. All operating segments’ operating results are reviewed regularly by BRAC’s Country Representative to make decisions about resources to be allocated to the segments and assess its performance, and for which discrete financial information is available.
The company’s primary format for segmentation is based on 10 thematic programmes being operated by BRAC Uganda; these programmes are listed below;
• Education Program;• Research and Evaluation Division; • Training Division; • Agriculture and livestock (Poultry) Program;• Health Program;• Empowerment and Livelihood for Adolescents (ELA);• Karamoja Project• Community Connector Project• Japanese Social Development Project• Emergency Disaster Preparedness• The Ultra Poor Project
m. Contingent liabilities
The company recognizes a contingent liability where it has a possible obligation from past events, the existence of which will be confirmed only by the occurrence of one or more uncertain events not wholly within the control of the company, or it is not probable that an outflow of resources will be required to settle the obligation, or the amount of the obligation cannot be measured with sufficient reliability.
n. Related party transactions
Related parties comprise directors, subsidiaries of BRAC International and key management personnel of the company and companies with common ownership and/or directors.
o. Fundraising Costs
BRAC Uganda normally raises its fund through discussion with various donors and stake holders. It also follows a competitive process where it submits its proposal to multinational donor organizations and get selected based on the merit. BRAC Uganda does not incur any additional costs for fund raising purpose other than over heads which is recorded under HO logistic and management expenses.
BRAC UGANDA
NOTES TO THE FINANCIAL STATEMENTS FOR YEAR ENDED 31 DECEMBER 2016 (CONTINUED)
p.Adoptionofnewandrevisedstandards
i. New and amended standards adopted by the Company
The following standards have been adopted by the company for the first time for the financial year beginning on or after I January 20 I 6: The adoption of these new standards has not resulted in material changes to the company’s accounting policies.During the current year, the company has adopted all of the new and revised standards and interpretations issued by the IASB and the IFRIC that are relevant to its operations and effective for annual reporting periods beginning on 1 January 2016. The adoption of these new and revised standards and interpretations has not resulted in material changes to the company’s accounting policies.
Newamendmentsorinterpretation Effective date
• IFRS 14 Regulatory Deferral Accounts
1 January 2016
• Accounting for Acquisitions of Interests in Joint Operations (Amendments to IFRS 11)
• Clarification of Acceptable Methods of Depreciation and Amortisation (Amendments to IAS 16 and IAS 38)
• Agriculture: Bearer Plants (Amendments to IAS 16 and IAS 41)
• Equity Method in Separate Financial Statements (Amendments to IAS 27)
• Investment Entities: Applying the Consolidation Exception (Amendments to IFRS 10, IFRS 12 and IAS 28)
• Disclosure Initiative (Amendments to IAS 1)
(ii) New and amended standards and interpretations in issue but not yet effective for the year ended 31 December 2016
At the date of authorisation of the financial statements of the company for the year ended 31 December 2016 the following standards were in issue but not yet effected.All Standards and Interpretations will be adopted at their effective date (except for those Standards and interpretations that are not applicable to the entity).
Newamendmentsorinterpretation Effective date
• Disclosure Initiative (Amendments to lAS 7) 1 January 2017
• Recognition of Deferred Tax Assets for Unrealised Losses(Amendments to lAS 12) 1 January 2017
• IFRS 15 Revenue from Contracts with Customers 1 January 2018
• IFRS 9 Financial Instruments 1 January 2018
• Classification and Measurement of Share-based PaymentTransactions (Amendments to IFRS 2)
1 January 2018
• IFRS 16 Leases 1 January 2019
• Sale or Contribution of Assets between an Investor and its Associate or Joint Venture (Amendments to IFRS wand lAS 28)
To be determined
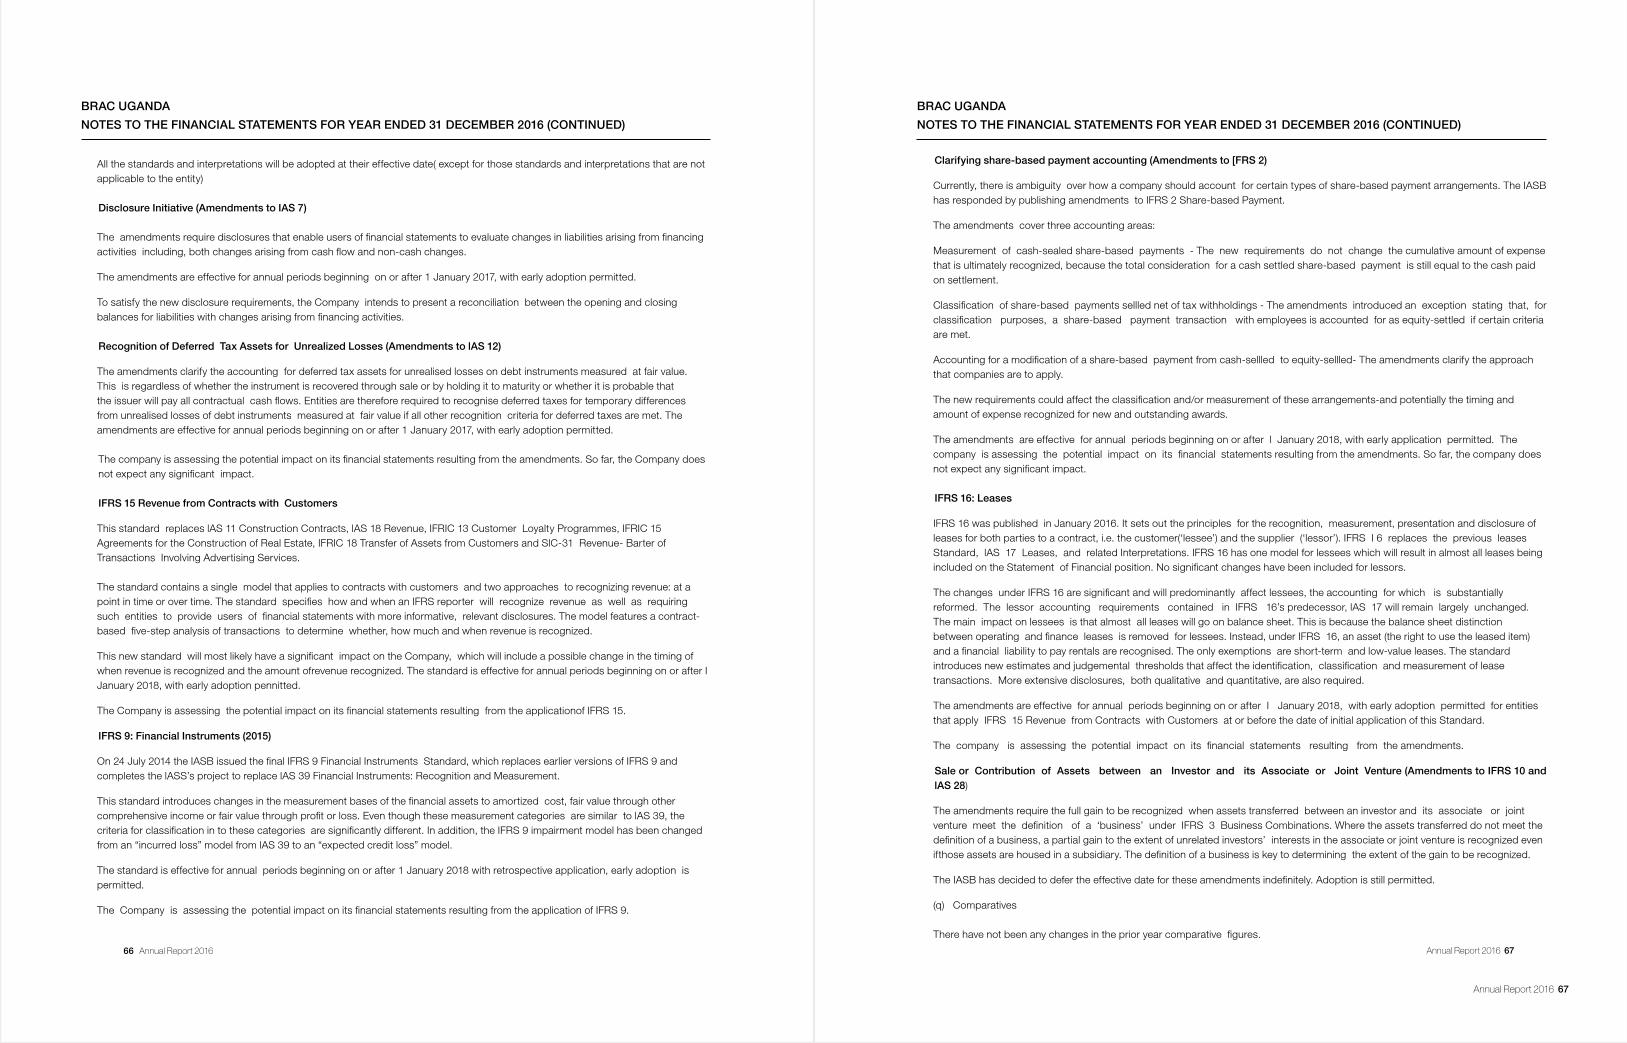
Annual Report 2016 67
66 Annual Report 2016 Annual Report 2016 67
All the standards and interpretations will be adopted at their effective date( except for those standards and interpretations that are not applicable to the entity)
Disclosure Initiative (Amendments to IAS 7)
The amendments require disclosures that enable users of financial statements to evaluate changes in liabilities arising from financing activities including, both changes arising from cash flow and non-cash changes.
The amendments are effective for annual periods beginning on or after 1 January 2017, with early adoption permitted.
To satisfy the new disclosure requirements, the Company intends to present a reconciliation between the opening and closing balances for liabilities with changes arising from financing activities.
Recognition of Deferred Tax Assets for Unrealized Losses (Amendments to lAS 12)
The amendments clarify the accounting for deferred tax assets for unrealised losses on debt instruments measured at fair value. This is regardless of whether the instrument is recovered through sale or by holding it to maturity or whether it is probable that the issuer will pay all contractual cash flows. Entities are therefore required to recognise deferred taxes for temporary differences from unrealised losses of debt instruments measured at fair value if all other recognition criteria for deferred taxes are met. The amendments are effective for annual periods beginning on or after 1 January 2017, with early adoption permitted.
The company is assessing the potential impact on its financial statements resulting from the amendments. So far, the Company does not expect any significant impact.
IFRS15RevenuefromContractswithCustomers
This standard replaces lAS 11 Construction Contracts, lAS 18 Revenue, IFRIC 13 Customer Loyalty Programmes, IFRIC 15 Agreements for the Construction of Real Estate, IFRIC 18 Transfer of Assets from Customers and SlC-31 Revenue- Barter of Transactions Involving Advertising Services. The standard contains a single model that applies to contracts with customers and two approaches to recognizing revenue: at a point in time or over time. The standard specifies how and when an IFRS reporter will recognize revenue as well as requiring such entities to provide users of financial statements with more informative, relevant disclosures. The model features a contract-based five-step analysis of transactions to determine whether, how much and when revenue is recognized.
This new standard will most likely have a significant impact on the Company, which will include a possible change in the timing of when revenue is recognized and the amount ofrevenue recognized. The standard is effective for annual periods beginning on or after I January 2018, with early adoption pennitted.
The Company is assessing the potential impact on its financial statements resulting from the applicationof IFRS 15.
IFRS 9: Financial Instruments (2015)
On 24 July 2014 the IASB issued the final IFRS 9 Financial Instruments Standard, which replaces earlier versions of IFRS 9 and completes the lASS’s project to replace lAS 39 Financial Instruments: Recognition and Measurement.
This standard introduces changes in the measurement bases of the financial assets to amortized cost, fair value through other comprehensive income or fair value through profit or loss. Even though these measurement categories are similar to lAS 39, the criteria for classification in to these categories are significantly different. In addition, the IFRS 9 impairment model has been changed from an “incurred loss” model from lAS 39 to an “expected credit loss” model.
The standard is effective for annual periods beginning on or after 1 January 2018 with retrospective application, early adoption is permitted.
The Company is assessing the potential impact on its financial statements resulting from the application of IFRS 9.
BRAC UGANDA
NOTES TO THE FINANCIAL STATEMENTS FOR YEAR ENDED 31 DECEMBER 2016 (CONTINUED)
BRAC UGANDA
NOTES TO THE FINANCIAL STATEMENTS FOR YEAR ENDED 31 DECEMBER 2016 (CONTINUED)
Clarifying share-based payment accounting (Amendments to [FRS 2)
Currently, there is ambiguity over how a company should account for certain types of share-based payment arrangements. The IASB has responded by publishing amendments to IFRS 2 Share-based Payment.
The amendments cover three accounting areas:
Measurement of cash-sealed share-based payments - The new requirements do not change the cumulative amount of expense that is ultimately recognized, because the total consideration for a cash settled share-based payment is still equal to the cash paid on settlement.
Classification of share-based payments sellled net of tax withholdings - The amendments introduced an exception stating that, for classification purposes, a share-based payment transaction with employees is accounted for as equity-settled if certain criteria are met.
Accounting for a modification of a share-based payment from cash-sellled to equity-sellled- The amendments clarify the approach that companies are to apply.
The new requirements could affect the classification and/or measurement of these arrangements-and potentially the timing and amount of expense recognized for new and outstanding awards.
The amendments are effective for annual periods beginning on or after l January 2018, with early application permitted. The company is assessing the potential impact on its financial statements resulting from the amendments. So far, the company does not expect any significant impact. IFRS 16: Leases
IFRS 16 was published in January 2016. It sets out the principles for the recognition, measurement, presentation and disclosure of leases for both parties to a contract, i.e. the customer(‘lessee’) and the supplier (‘lessor’). IFRS I 6 replaces the previous leases Standard, lAS 17 Leases, and related Interpretations. IFRS 16 has one model for lessees which will result in almost all leases being included on the Statement of Financial position. No significant changes have been included for lessors.
The changes under IFRS 16 are significant and will predominantly affect lessees, the accounting for which is substantially reformed. The lessor accounting requirements contained in IFRS 16’s predecessor, lAS 17 will remain largely unchanged. The main impact on lessees is that almost all leases will go on balance sheet. This is because the balance sheet distinction between operating and finance leases is removed for lessees. Instead, under IFRS 16, an asset (the right to use the leased item) and a financial liability to pay rentals are recognised. The only exemptions are short-term and low-value leases. The standard introduces new estimates and judgemental thresholds that affect the identification, classification and measurement of lease transactions. More extensive disclosures, both qualitative and quantitative, are also required.
The amendments are effective for annual periods beginning on or after I January 2018, with early adoption permitted for entities that apply IFRS 15 Revenue from Contracts with Customers at or before the date of initial application of this Standard.
The company is assessing the potential impact on its financial statements resulting from the amendments.
SaleorContributionofAssetsbetweenanInvestoranditsAssociateorJointVenture(AmendmentstoIFRS10andlAS 28)
The amendments require the full gain to be recognized when assets transferred between an investor and its associate or joint venture meet the definition of a ‘business’ under IFRS 3 Business Combinations. Where the assets transferred do not meet the definition of a business, a partial gain to the extent of unrelated investors’ interests in the associate or joint venture is recognized even ifthose assets are housed in a subsidiary. The definition of a business is key to determining the extent of the gain to be recognized.
The IASB has decided to defer the effective date for these amendments indefinitely. Adoption is still permitted.
(q) Comparatives
There have not been any changes in the prior year comparative figures.
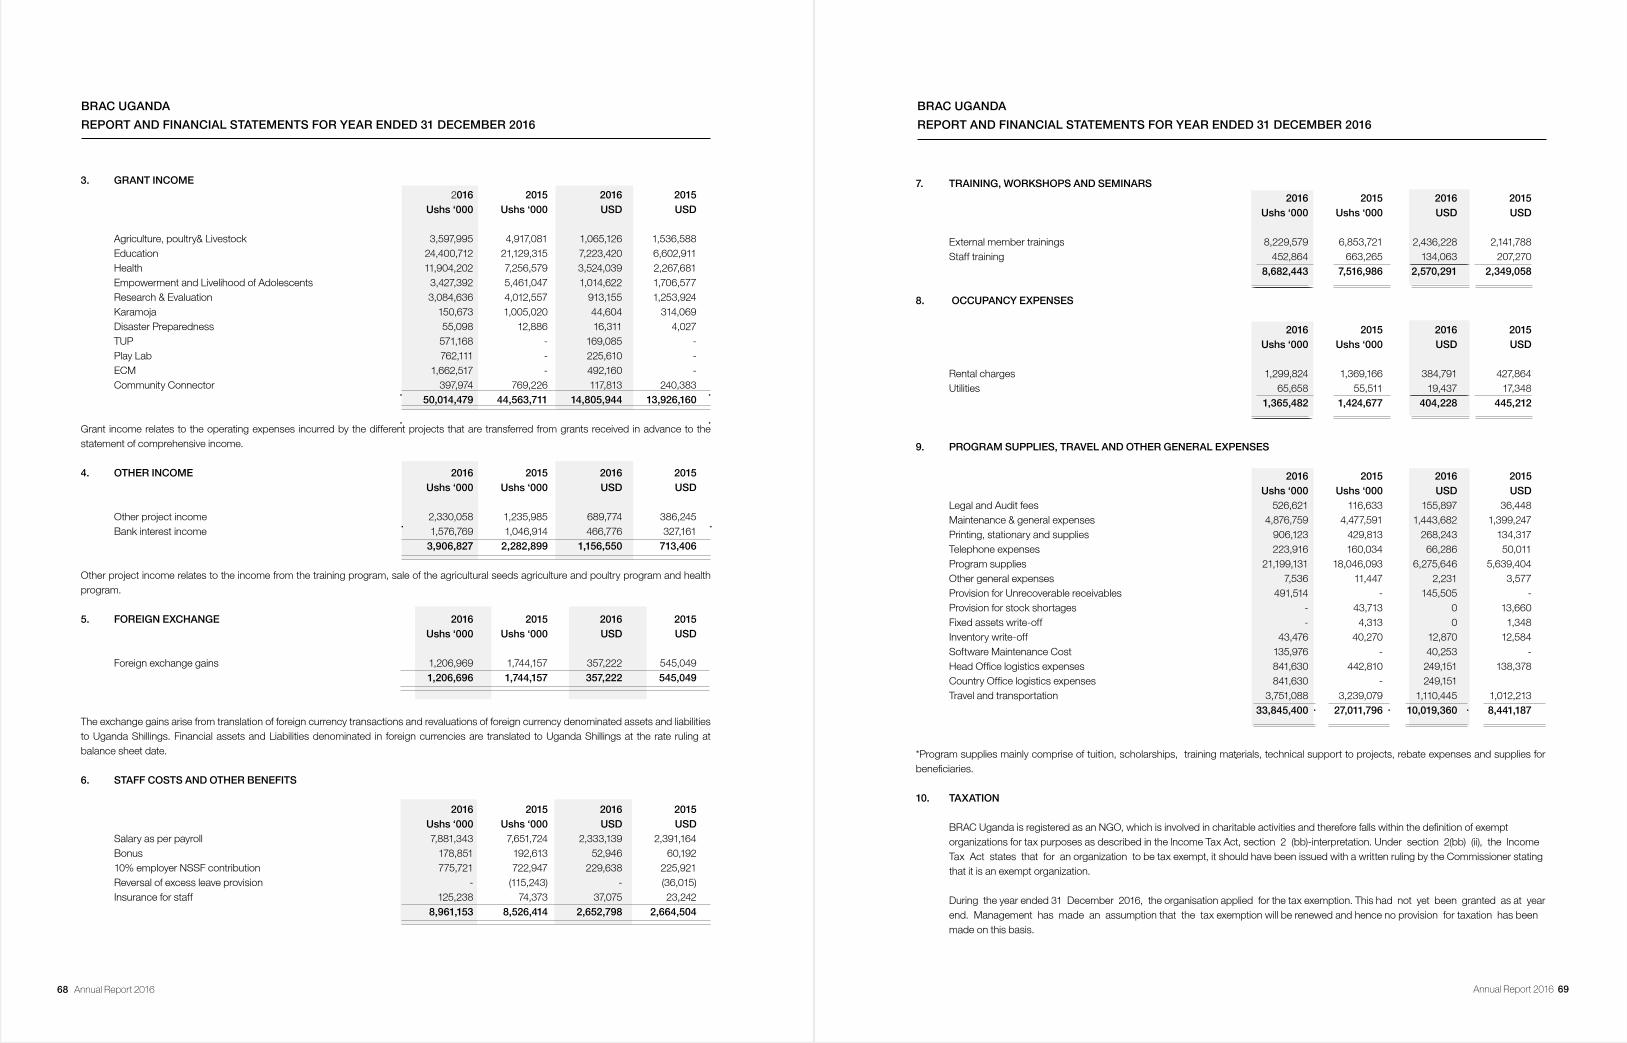
68 Annual Report 2016 Annual Report 2016 69
BRAC UGANDA
REPORT AND FINANCIAL STATEMENTS FOR YEAR ENDED 31 DECEMBER 2016
3. GRANT INCOME 2016 2015 2016 2015 Ushs ‘000 Ushs ‘000 USD USD Agriculture, poultry& Livestock 3,597,995 4,917,081 1,065,126 1,536,588 Education 24,400,712 21,129,315 7,223,420 6,602,911 Health 11,904,202 7,256,579 3,524,039 2,267,681 Empowerment and Livelihood of Adolescents 3,427,392 5,461,047 1,014,622 1,706,577 Research & Evaluation 3,084,636 4,012,557 913,155 1,253,924 Karamoja 150,673 1,005,020 44,604 314,069 Disaster Preparedness 55,098 12,886 16,311 4,027 TUP 571,168 - 169,085 - Play Lab 762,111 - 225,610 - ECM 1,662,517 - 492,160 - Community Connector 397,974 769,226 117,813 240,383 50,014,479 44,563,711 14,805,944 13,926,160
Grant income relates to the operating expenses incurred by the different projects that are transferred from grants received in advance to the statement of comprehensive income.
4. OTHER INCOME 2016 2015 2016 2015 Ushs ‘000 Ushs ‘000 USD USD
Other project income 2,330,058 1,235,985 689,774 386,245 Bank interest income 1,576,769 1,046,914 466,776 327,161 3,906,827 2,282,899 1,156,550 713,406
Other project income relates to the income from the training program, sale of the agricultural seeds agriculture and poultry program and health program.
5. FOREIGN EXCHANGE 2016 2015 2016 2015 Ushs ‘000 Ushs ‘000 USD USD
Foreign exchange gains 1,206,969 1,744,157 357,222 545,049 1,206,696 1,744,157 357,222 545,049
The exchange gains arise from translation of foreign currency transactions and revaluations of foreign currency denominated assets and liabilities to Uganda Shillings. Financial assets and Liabilities denominated in foreign currencies are translated to Uganda Shillings at the rate ruling at balance sheet date.
6. STAFF COSTS AND OTHER BENEFITS
2016 2015 2016 2015 Ushs ‘000 Ushs ‘000 USD USD Salary as per payroll 7,881,343 7,651,724 2,333,139 2,391,164 Bonus 178,851 192,613 52,946 60,192 10% employer NSSF contribution 775,721 722,947 229,638 225,921 Reversal of excess leave provision - (115,243) - (36,015) Insurance for staff 125,238 74,373 37,075 23,242 8,961,153 8,526,414 2,652,798 2,664,504
BRAC UGANDA
REPORT AND FINANCIAL STATEMENTS FOR YEAR ENDED 31 DECEMBER 2016
7. TRAINING, WORKSHOPS AND SEMINARS 2016 2015 2016 2015 Ushs ‘000 Ushs ‘000 USD USD
External member trainings 8,229,579 6,853,721 2,436,228 2,141,788 Staff training 452,864 663,265 134,063 207,270 8,682,443 7,516,986 2,570,291 2,349,058 8. OCCUPANCY EXPENSES
2016 2015 2016 2015 Ushs ‘000 Ushs ‘000 USD USD
Rental charges 1,299,824 1,369,166 384,791 427,864 Utilities 65,658 55,511 19,437 17,348 1,365,482 1,424,677 404,228 445,212
9. PROGRAM SUPPLIES, TRAVEL AND OTHER GENERAL EXPENSES
2016 2015 2016 2015 Ushs ‘000 Ushs ‘000 USD USD Legal and Audit fees 526,621 116,633 155,897 36,448 Maintenance & general expenses 4,876,759 4,477,591 1,443,682 1,399,247 Printing, stationary and supplies 906,123 429,813 268,243 134,317 Telephone expenses 223,916 160,034 66,286 50,011 Program supplies 21,199,131 18,046,093 6,275,646 5,639,404 Other general expenses 7,536 11,447 2,231 3,577 Provision for Unrecoverable receivables 491,514 - 145,505 - Provision for stock shortages - 43,713 0 13,660 Fixed assets write-off - 4,313 0 1,348 Inventory write-off 43,476 40,270 12,870 12,584 Software Maintenance Cost 135,976 - 40,253 - Head Office logistics expenses 841,630 442,810 249,151 138,378 Country Office logistics expenses 841,630 - 249,151 Travel and transportation 3,751,088 3,239,079 1,110,445 1,012,213 33,845,400 27,011,796 10,019,360 8,441,187
*Program supplies mainly comprise of tuition, scholarships, training materials, technical support to projects, rebate expenses and supplies for beneficiaries.
10. TAXATION
BRAC Uganda is registered as an NGO, which is involved in charitable activities and therefore falls within the definition of exempt organizations for tax purposes as described in the lncome Tax Act, section 2 (bb)-interpretation. Under section 2(bb) (ii), the lncome Tax Act states that for an organization to be tax exempt, it should have been issued with a written ruling by the Commissioner stating that it is an exempt organization.
During the year ended 31 December 2016, the organisation applied for the tax exemption. This had not yet been granted as at year end. Management has made an assumption that the tax exemption will be renewed and hence no provision for taxation has been made on this basis.
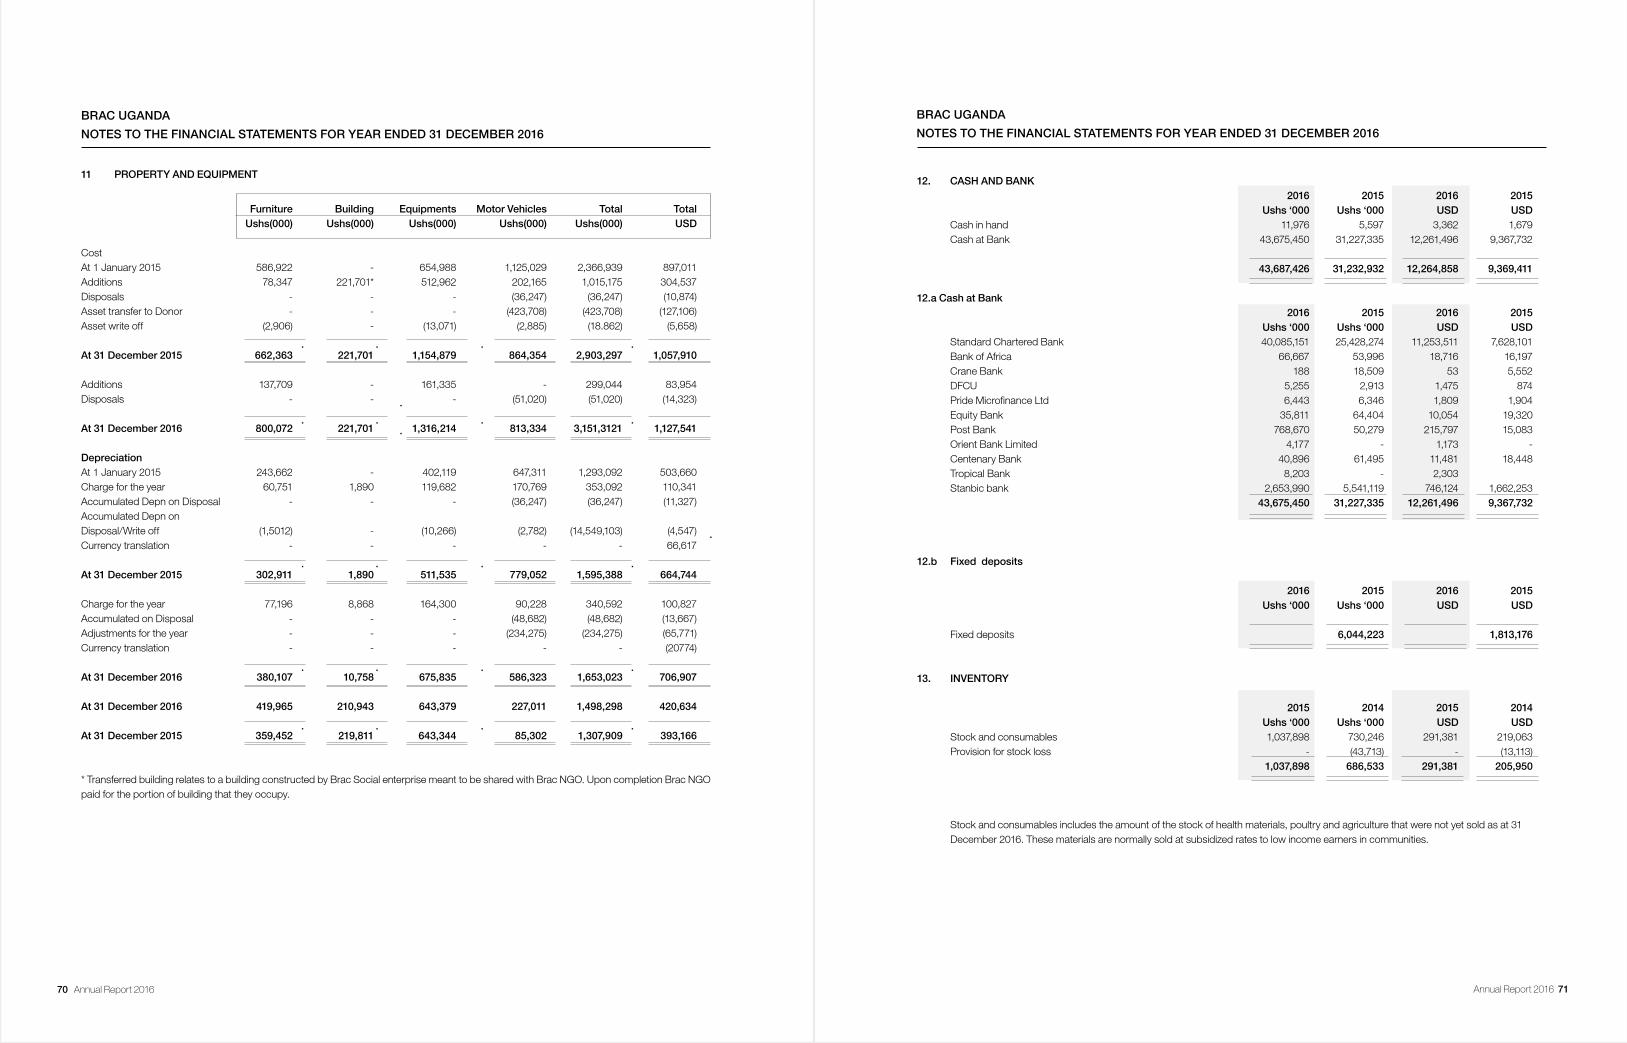
70 Annual Report 2016 Annual Report 2016 71
BRAC UGANDA
NOTES TO THE FINANCIAL STATEMENTS FOR YEAR ENDED 31 DECEMBER 2016
11 PROPERTY AND EQUIPMENT
Furniture Building Equipments Motor Vehicles Total Total Ushs(000) Ushs(000) Ushs(000) Ushs(000) Ushs(000) USD
Cost At 1 January 2015 586,922 - 654,988 1,125,029 2,366,939 897,011Additions 78,347 221,701* 512,962 202,165 1,015,175 304,537Disposals - - - (36,247) (36,247) (10,874)Asset transfer to Donor - - - (423,708) (423,708) (127,106)Asset write off (2,906) - (13,071) (2,885) (18.862) (5,658) At 31 December 2015 662,363 221,701 1,154,879 864,354 2,903,297 1,057,910
Additions 137,709 - 161,335 - 299,044 83,954Disposals - - - (51,020) (51,020) (14,323) At 31 December 2016 800,072 221,701 1,316,214 813,334 3,151,3121 1,127,541 Depreciation At 1 January 2015 243,662 - 402,119 647,311 1,293,092 503,660Charge for the year 60,751 1,890 119,682 170,769 353,092 110,341Accumulated Depn on Disposal - - - (36,247) (36,247) (11,327)Accumulated Depn on Disposal/Write off (1,5012) - (10,266) (2,782) (14,549,103) (4,547)Currency translation - - - - - 66,617
At 31 December 2015 302,911 1,890 511,535 779,052 1,595,388 664,744
Charge for the year 77,196 8,868 164,300 90,228 340,592 100,827Accumulated on Disposal - - - (48,682) (48,682) (13,667)Adjustments for the year - - - (234,275) (234,275) (65,771)Currency translation - - - - - (20774)
At 31 December 2016 380,107 10,758 675,835 586,323 1,653,023 706,907 At 31 December 2016 419,965 210,943 643,379 227,011 1,498,298 420,634
At 31 December 2015 359,452 219,811 643,344 85,302 1,307,909 393,166
* Transferred building relates to a building constructed by Brac Social enterprise meant to be shared with Brac NGO. Upon completion Brac NGO paid for the portion of building that they occupy.
BRAC UGANDA
NOTES TO THE FINANCIAL STATEMENTS FOR YEAR ENDED 31 DECEMBER 2016
12. CASH AND BANK 2016 2015 2016 2015 Ushs ‘000 Ushs ‘000 USD USD Cash in hand 11,976 5,597 3,362 1,679 Cash at Bank 43,675,450 31,227,335 12,261,496 9,367,732
43,687,426 31,232,932 12,264,858 9,369,411
12.a Cash at Bank 2016 2015 2016 2015 Ushs ‘000 Ushs ‘000 USD USD Standard Chartered Bank 40,085,151 25,428,274 11,253,511 7,628,101 Bank of Africa 66,667 53,996 18,716 16,197 Crane Bank 188 18,509 53 5,552 DFCU 5,255 2,913 1,475 874 Pride Microfinance Ltd 6,443 6,346 1,809 1,904 Equity Bank 35,811 64,404 10,054 19,320 Post Bank 768,670 50,279 215,797 15,083 Orient Bank Limited 4,177 - 1,173 - Centenary Bank 40,896 61,495 11,481 18,448 Tropical Bank 8,203 - 2,303 Stanbic bank 2,653,990 5,541,119 746,124 1,662,253 43,675,450 31,227,335 12,261,496 9,367,732
12.b Fixed deposits 2016 2015 2016 2015 Ushs ‘000 Ushs ‘000 USD USD Fixed deposits 6,044,223 1,813,176
13. INVENTORY
2015 2014 2015 2014 Ushs ‘000 Ushs ‘000 USD USD Stock and consumables 1,037,898 730,246 291,381 219,063 Provision for stock loss - (43,713) - (13,113) 1,037,898 686,533 291,381 205,950
Stock and consumables includes the amount of the stock of health materials, poultry and agriculture that were not yet sold as at 31 December 2016. These materials are normally sold at subsidized rates to low income earners in communities.
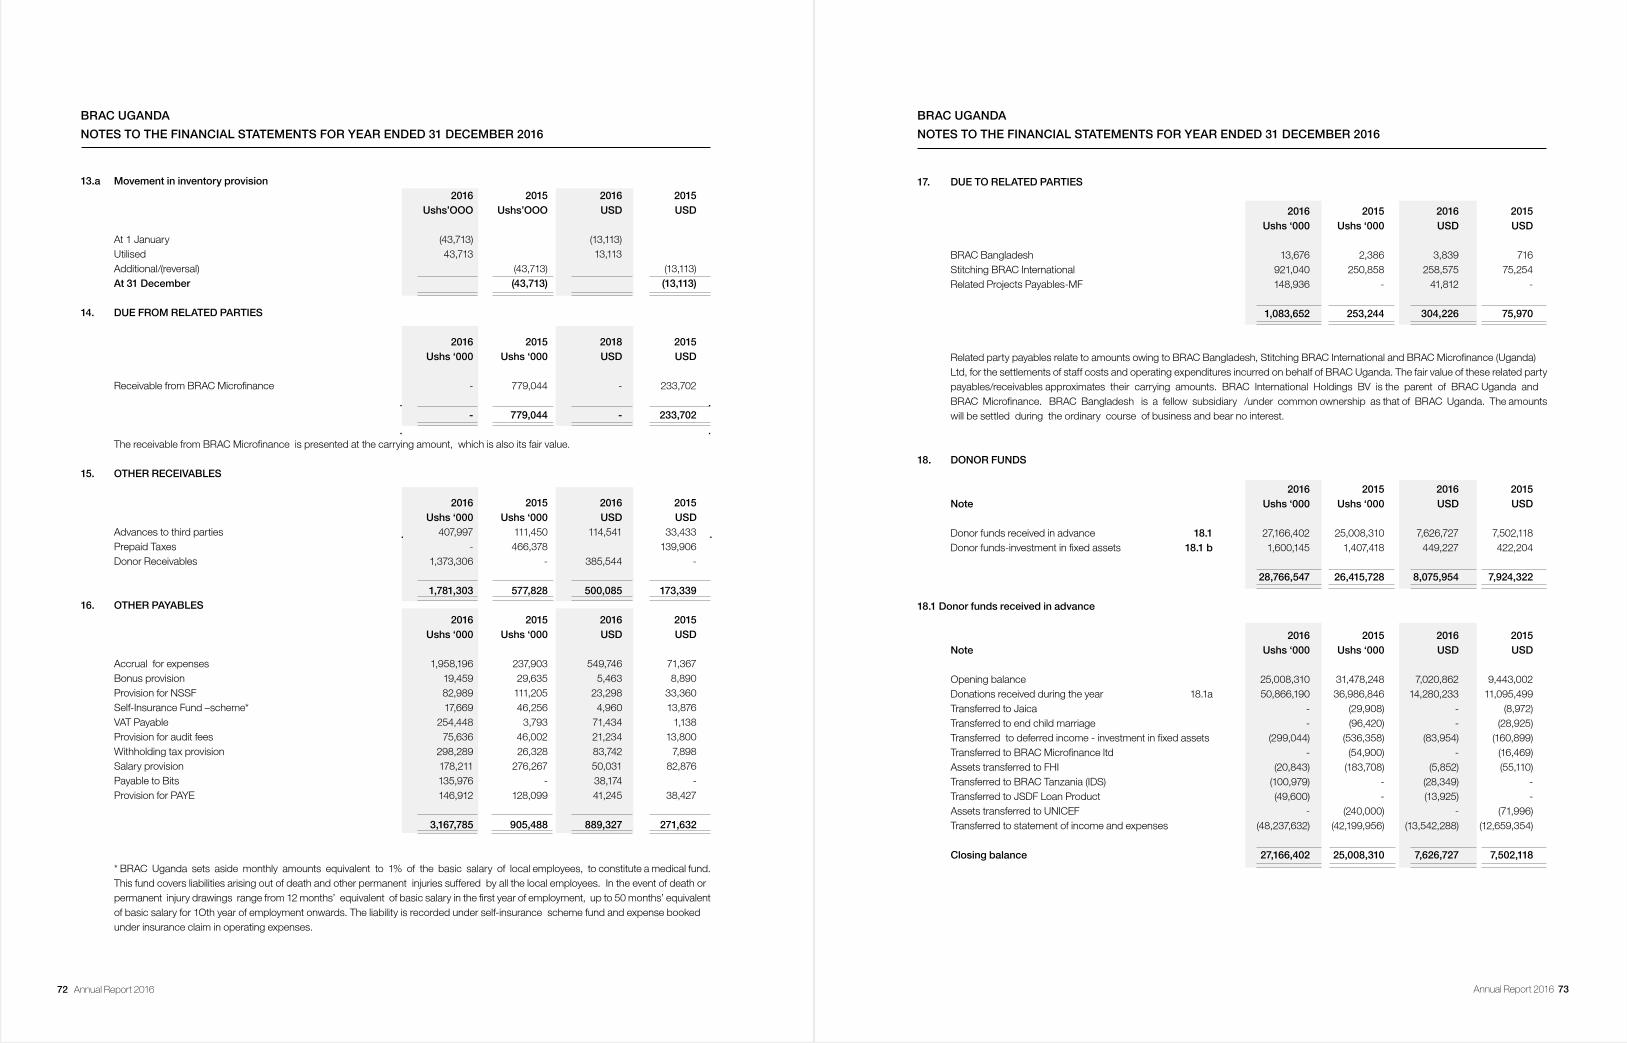
72 Annual Report 2016 Annual Report 2016 73
BRAC UGANDA
NOTES TO THE FINANCIAL STATEMENTS FOR YEAR ENDED 31 DECEMBER 2016
13.a Movement in inventory provision 2016 2015 2016 2015 Ushs’OOO Ushs’OOO USD USD At 1 January (43,713) (13,113) Utilised 43,713 13,113 Additional/(reversal) (43,713) (13,113) At 31 December (43,713) (13,113)
14. DUE FROM RELATED PARTIES
2016 2015 2018 2015 Ushs ‘000 Ushs ‘000 USD USD
Receivable from BRAC Microfinance - 779,044 - 233,702
- 779,044 - 233,702
The receivable from BRAC Microfinance is presented at the carrying amount, which is also its fair value.
15. OTHER RECEIVABLES
2016 2015 2016 2015 Ushs ‘000 Ushs ‘000 USD USD Advances to third parties 407,997 111,450 114,541 33,433 Prepaid Taxes - 466,378 139,906 Donor Receivables 1,373,306 - 385,544 -
1,781,303 577,828 500,085 173,33916. OTHER PAYABLES 2016 2015 2016 2015 Ushs ‘000 Ushs ‘000 USD USD
Accrual for expenses 1,958,196 237,903 549,746 71,367 Bonus provision 19,459 29,635 5,463 8,890 Provision for NSSF 82,989 111,205 23,298 33,360 Self-Insurance Fund –scheme* 17,669 46,256 4,960 13,876 VAT Payable 254,448 3,793 71,434 1,138 Provision for audit fees 75,636 46,002 21,234 13,800 Withholding tax provision 298,289 26,328 83,742 7,898 Salary provision 178,211 276,267 50,031 82,876 Payable to Bits 135,976 - 38,174 - Provision for PAYE 146,912 128,099 41,245 38,427 3,167,785 905,488 889,327 271,632
* BRAC Uganda sets aside monthly amounts equivalent to 1% of the basic salary of local employees, to constitute a medical fund. This fund covers liabilities arising out of death and other permanent injuries suffered by all the local employees. In the event of death or permanent injury drawings range from 12 months’ equivalent of basic salary in the first year of employment, up to 50 months’ equivalent of basic salary for 1Oth year of employment onwards. The liability is recorded under self-insurance scheme fund and expense booked under insurance claim in operating expenses.
17. DUE TO RELATED PARTIES
2016 2015 2016 2015 Ushs ‘000 Ushs ‘000 USD USD
BRAC Bangladesh 13,676 2,386 3,839 716 Stitching BRAC International 921,040 250,858 258,575 75,254 Related Projects Payables-MF 148,936 - 41,812 - 1,083,652 253,244 304,226 75,970
Related party payables relate to amounts owing to BRAC Bangladesh, Stitching BRAC International and BRAC Microfinance (Uganda) Ltd, for the settlements of staff costs and operating expenditures incurred on behalf of BRAC Uganda. The fair value of these related party payables/receivables approximates their carrying amounts. BRAC International Holdings BV is the parent of BRAC Uganda and BRAC Microfinance. BRAC Bangladesh is a fellow subsidiary /under common ownership as that of BRAC Uganda. The amounts will be settled during the ordinary course of business and bear no interest.
18. DONOR FUNDS
2016 2015 2016 2015 Note Ushs ‘000 Ushs ‘000 USD USD Donor funds received in advance 18.1 27,166,402 25,008,310 7,626,727 7,502,118 Donor funds-investment in fixed assets 18.1 b 1,600,145 1,407,418 449,227 422,204
28,766,547 26,415,728 8,075,954 7,924,322
18.1 Donor funds received in advance
2016 2015 2016 2015 Note Ushs ‘000 Ushs ‘000 USD USD Opening balance 25,008,310 31,478,248 7,020,862 9,443,002 Donations received during the year 18.1a 50,866,190 36,986,846 14,280,233 11,095,499 Transferred to Jaica - (29,908) - (8,972) Transferred to end child marriage - (96,420) - (28,925) Transferred to deferred income - investment in fixed assets (299,044) (536,358) (83,954) (160,899) Transferred to BRAC Microfinance ltd - (54,900) - (16,469) Assets transferred to FHI (20,843) (183,708) (5,852) (55,110) Transferred to BRAC Tanzania (IDS) (100,979) - (28,349) - Transferred to JSDF Loan Product (49,600) - (13,925) - Assets transferred to UNICEF - (240,000) - (71,996) Transferred to statement of income and expenses (48,237,632) (42,199,956) (13,542,288) (12,659,354)
Closing balance 27,166,402 25,008,310 7,626,727 7,502,118
BRAC UGANDA
NOTES TO THE FINANCIAL STATEMENTS FOR YEAR ENDED 31 DECEMBER 2016
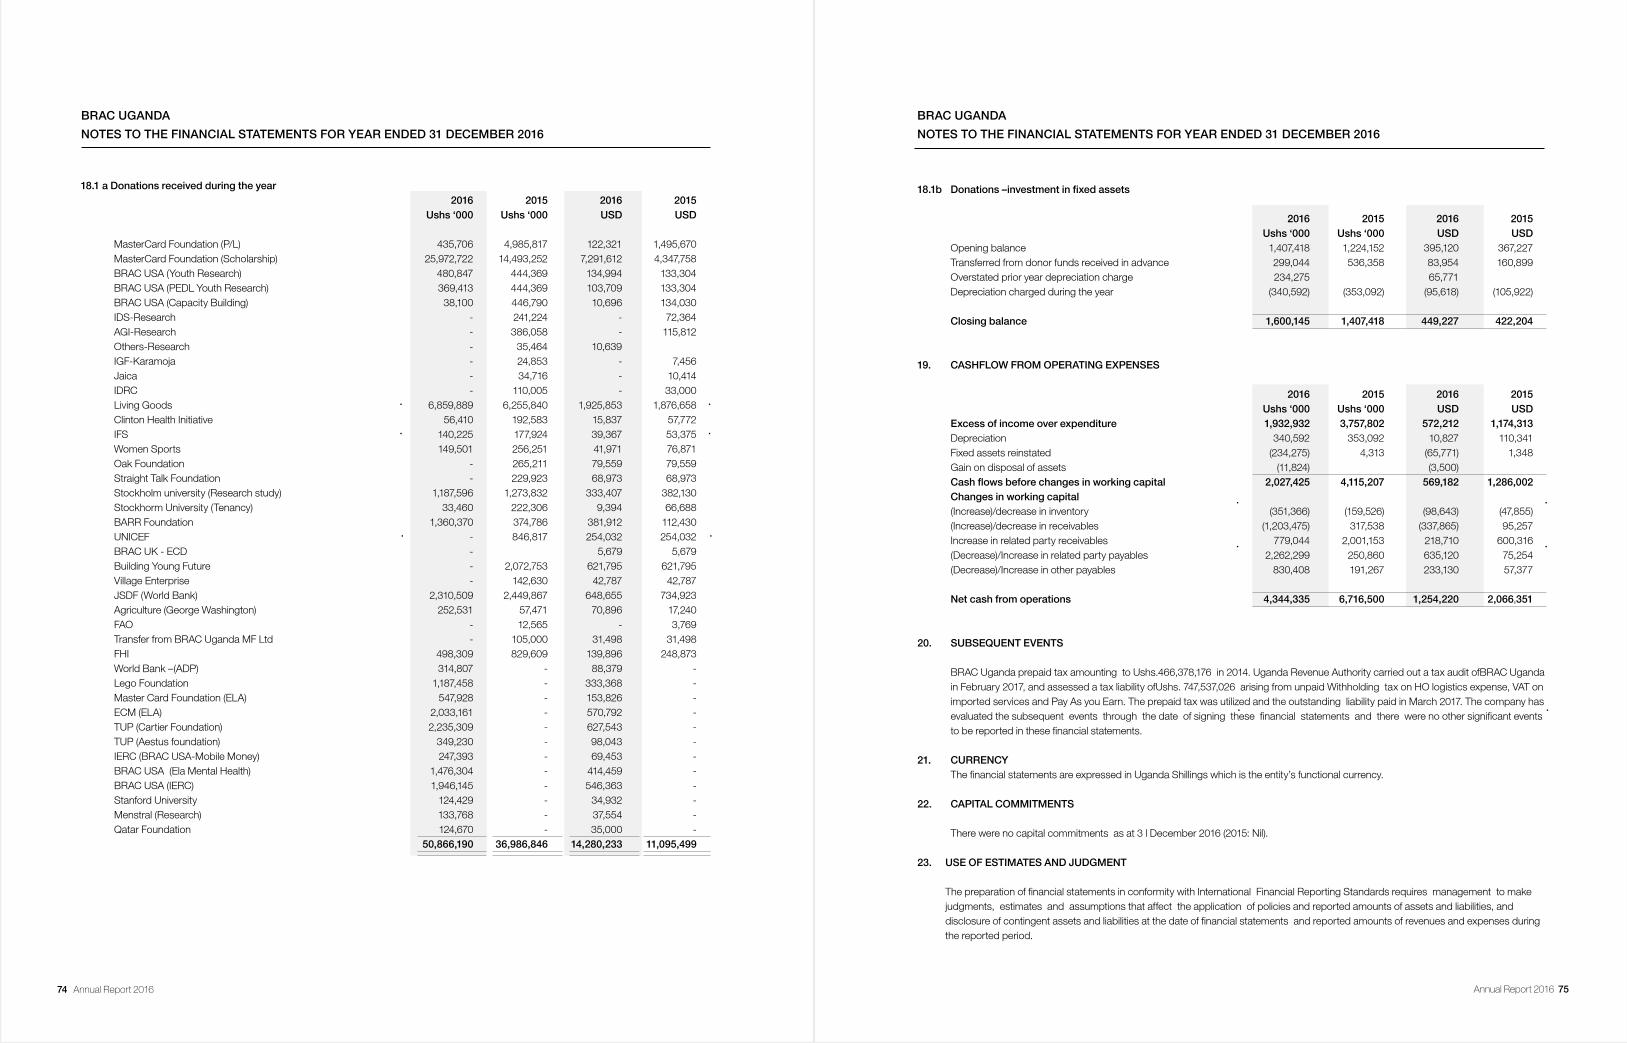
74 Annual Report 2016 Annual Report 2016 75
18.1 a Donations received during the year 2016 2015 2016 2015 Ushs ‘000 Ushs ‘000 USD USD
MasterCard Foundation (P/L) 435,706 4,985,817 122,321 1,495,670 MasterCard Foundation (Scholarship) 25,972,722 14,493,252 7,291,612 4,347,758 BRAC USA (Youth Research) 480,847 444,369 134,994 133,304 BRAC USA (PEDL Youth Research) 369,413 444,369 103,709 133,304 BRAC USA (Capacity Building) 38,100 446,790 10,696 134,030 IDS-Research - 241,224 - 72,364 AGI-Research - 386,058 - 115,812 Others-Research - 35,464 10,639 IGF-Karamoja - 24,853 - 7,456 Jaica - 34,716 - 10,414 IDRC - 110,005 - 33,000 Living Goods 6,859,889 6,255,840 1,925,853 1,876,658 Clinton Health Initiative 56,410 192,583 15,837 57,772 IFS 140,225 177,924 39,367 53,375 Women Sports 149,501 256,251 41,971 76,871 Oak Foundation - 265,211 79,559 79,559 Straight Talk Foundation - 229,923 68,973 68,973 Stockholm university (Research study) 1,187,596 1,273,832 333,407 382,130 Stockhorm University (Tenancy) 33,460 222,306 9,394 66,688 BARR Foundation 1,360,370 374,786 381,912 112,430 UNICEF - 846,817 254,032 254,032 BRAC UK - ECD - 5,679 5,679 Building Young Future - 2,072,753 621,795 621,795 Village Enterprise - 142,630 42,787 42,787 JSDF (World Bank) 2,310,509 2,449,867 648,655 734,923 Agriculture (George Washington) 252,531 57,471 70,896 17,240 FAO - 12,565 - 3,769 Transfer from BRAC Uganda MF Ltd - 105,000 31,498 31,498 FHI 498,309 829,609 139,896 248,873 World Bank –(ADP) 314,807 - 88,379 - Lego Foundation 1,187,458 - 333,368 - Master Card Foundation (ELA) 547,928 - 153,826 - ECM (ELA) 2,033,161 - 570,792 - TUP (Cartier Foundation) 2,235,309 - 627,543 - TUP (Aestus foundation) 349,230 - 98,043 - IERC (BRAC USA-Mobile Money) 247,393 - 69,453 - BRAC USA (Ela Mental Health) 1,476,304 - 414,459 - BRAC USA (IERC) 1,946,145 - 546,363 - Stanford University 124,429 - 34,932 - Menstral (Research) 133,768 - 37,554 - Qatar Foundation 124,670 - 35,000 - 50,866,190 36,986,846 14,280,233 11,095,499
BRAC UGANDA
NOTES TO THE FINANCIAL STATEMENTS FOR YEAR ENDED 31 DECEMBER 2016
18.1b Donations–investmentinfixedassets
2016 2015 2016 2015 Ushs ‘000 Ushs ‘000 USD USD Opening balance 1,407,418 1,224,152 395,120 367,227 Transferred from donor funds received in advance 299,044 536,358 83,954 160,899 Overstated prior year depreciation charge 234,275 65,771 Depreciation charged during the year (340,592) (353,092) (95,618) (105,922) Closing balance 1,600,145 1,407,418 449,227 422,204
19. CASHFLOW FROM OPERATING EXPENSES
2016 2015 2016 2015 Ushs ‘000 Ushs ‘000 USD USD Excess of income over expenditure 1,932,932 3,757,802 572,212 1,174,313 Depreciation 340,592 353,092 10,827 110,341 Fixed assets reinstated (234,275) 4,313 (65,771) 1,348 Gain on disposal of assets (11,824) (3,500) Cashflowsbeforechangesinworkingcapital 2,027,425 4,115,207 569,182 1,286,002 Changesinworkingcapital (Increase)/decrease in inventory (351,366) (159,526) (98,643) (47,855) (Increase)/decrease in receivables (1,203,475) 317,538 (337,865) 95,257 Increase in related party receivables 779,044 2,001,153 218,710 600,316 (Decrease)/Increase in related party payables 2,262,299 250,860 635,120 75,254 (Decrease)/Increase in other payables 830,408 191,267 233,130 57,377 Net cash from operations 4,344,335 6,716,500 1,254,220 2,066,351
20. SUBSEQUENT EVENTS
BRAC Uganda prepaid tax amounting to Ushs.466,378,176 in 2014. Uganda Revenue Authority carried out a tax audit ofBRAC Uganda in February 2017, and assessed a tax liability ofUshs. 747,537,026 arising from unpaid Withholding tax on HO logistics expense, VAT on imported services and Pay As you Earn. The prepaid tax was utilized and the outstanding liability paid in March 2017. The company has evaluated the subsequent events through the date of signing these financial statements and there were no other significant events to be reported in these financial statements.
21. CURRENCY The financial statements are expressed in Uganda Shillings which is the entity’s functional currency.
22. CAPITAL COMMITMENTS
There were no capital commitments as at 3 l December 2016 (2015: Nil).
23. USE OF ESTIMATES AND JUDGMENT
The preparation of financial statements in conformity with International Financial Reporting Standards requires management to make judgments, estimates and assumptions that affect the application of policies and reported amounts of assets and liabilities, and disclosure of contingent assets and liabilities at the date of financial statements and reported amounts of revenues and expenses during the reported period.
BRAC UGANDA
NOTES TO THE FINANCIAL STATEMENTS FOR YEAR ENDED 31 DECEMBER 2016

76 Annual Report 2016 Annual Report 2016 77
The estimates and underlying assumptions are reviewed on an ongoing basis. Revisions to accounting estimates are recognized in the period in which the estimates are revised and in any future periods affected. The estimates and associated assumptions are based on historical experiences, the results of which form the basis of making the judgments about the carrying values and l iabilities that are not readily apparent from other sources. Actual results ult imately may differ from these estimates.
BRAC Uganda makes estimates and assumptions that affect the reported amounts of assets and liabil ities within the next financial year. Estimates and judgments are continually evaluated and are based on historical experience and other factors, including expectations of future events that are believed to be reasonable under the circumstances. Management identifies all significant accounting policies and those that involve high judgment and in particular the significant areas of estimation and un-certainty in applying accounting policies that have the most significant effect on the amounts recognized in the financial statements. These are: (i) Impairment The company makes estimates and assumptions that affect the reported amounts of assets and liabilities within the next financial year. Estimates and judgments are continually evaluated and are based on historical experience and other factors, including expectations of future events that are believed to be reasonable under the circumstances.
The company regularly reviews its assets and makes judgments in determining whether an impairment loss should be recognized in respect of observable data that may impact on future estimated cash flows. The methodology and assumptions used for estimating both the amount and timing of future cash flows are reviewed regularly to reduce any differences between loss estimates and actual loss experience.
(ii) Provisions and contingencies
A provision is recognized if as a result of past events, the company has a present legal or constructive obligation that can be estimated reliably, and it is probable that an outflow of economic benefits will be required to settle the obligation. For provisions included in the financial statements see note I 6.
During the year ended 3 I December 2016, the organisation applied for a tax exemption. This had not yet been granted as at year end. Management has made an assumption that the tax exemption will be renewed and hence no provision for taxation has been made on this basis. (Note / 0)
24. FINANCIAL RISK MANAGEMENT
Introduction and overview
The Company has exposure to the following risks from financial instruments:
i) Credit risk ii) Liquidity risk iii) Market risk iv) Operational risk
This note presents information about the company’s exposure to each of the above risks and the company’s objectives, policies and processes for measuring and managing risk.
Riskmanagementframework
The Board of Directors has overall responsibility for the establishment and oversight of the Company’s risk management framework.
The Board of BRAC Bangladesh International, the parent company, has established the Group Audit and Risk Committee, Remuneration Committee, Investment Committee, Group Executive Committee and Subsidiary Companies Executive Committee which are responsible for developing and monitoring Group risk management policies in their respective areas. All Board committees have both executive and
BRAC UGANDA
NOTES TO THE FINANCIAL STATEMENTS FOR YEAR ENDED 31 DECEMBER 2016
BRAC UGANDA
NOTES TO THE FINANCIAL STATEMENTS FOR YEAR ENDED 31 DECEMBER 2016
non-executive members, apart from the Group Executive Committee which comprises of executive directors and senior management and report regularly to the Board of Directors on their activities.
BRAC financial risk management policy seeks to identify, appraise and monitor the risks facing BRAC whilst taking specific measures to manage its interest rate, foreign exchange, liquidity and credit risks. BRAC does not however, engage in speculative transactions or take speculative positions, and where affected by adverse movements, BRAC has sought the assistance of donors.
(a) Credit risk
Credit risk is the risk of financial loss to the Company if a customer or counterparty to a financial instrument fails to meet its contractual obligations, and principally from trade and other receivable balances and investment in cash and cash equivalents. The Credit policy of BRAC Uganda requires all credit exposures to be measured, monitored and managed proactively. All cash and cash equivalents are held with reputable banks that are regulated by the Central bank of Uganda and as a result the risk is low. The Board has delegated the responsibility of the oversight role of credit risk to the Country Representative and Monitoring department.
Management of the risk The Board of Directors has delegated responsibility for the oversight of credit risk to the Country Representative and the Monitoring department.
Exposure to credit risk The aging of receivables as at the reporting date was: The carrying amount of financial assets represents the maximum credit exposure. The maximum exposure to credit risk at the reporting date was; 2016 2015 2016 2015 Shs ‘000 Shs ‘000 USD USD Cash and Cash equivalents 43,687,426 37,277,155 12,264,858 11,182,587 Receivables and other assets 1,781,303 1,356,872 500,085 407,041 45,468,729 38,634,027 12,764,943 11,589,628
The aging of trade receivables and other assets as at the reporting date was:
2016 2015 2016 2015 Shs ‘000 Shs ‘000 USD USD Between 0-30 days 958,147 111,450 268,991 33,433 Between 31-60 days 823,156 1,245,422 231,094 373,608
1,781,303 1,356,872 500,085 407,041 (b) Liquidity risk
Liquidity risk is the risk that operations cannot be funded and financial commitments cannot be met timeously and cost effectively. The risk arises from both the difference between the magnitude of assets and liabilities and the disproportion in their maturities. Liquidity risk management deals with the overall profile of the balance sheet, the funding requirements of the Company and cash flows. In quantifying the liquidity risk, future cash flow projections are simulated and necessary arrangements are put in place in order to ensure that all future cash flow commitments are met from the working capital generated by the Company and also from available financial institutions facilities.
BRAC Uganda manages its debt maturity profile, operating cash flows and the availability of funding so as to meet all refinancing, repayment and funding needs. As part of its overall liquidity management, BRAC Uganda maintains sufficient levels of cash or fixed deposits to meet its working capital requirements. In addition, BRAC Uganda maintains banking facilities of a reasonable level. The company’s approach to managing liquidity is to ensure, as far as possible, that it will always have sufficient resources to meet its liabilities when due, under both normal and stressed conditions, without incurring unacceptable losses or risking damage to the company’s reputation.
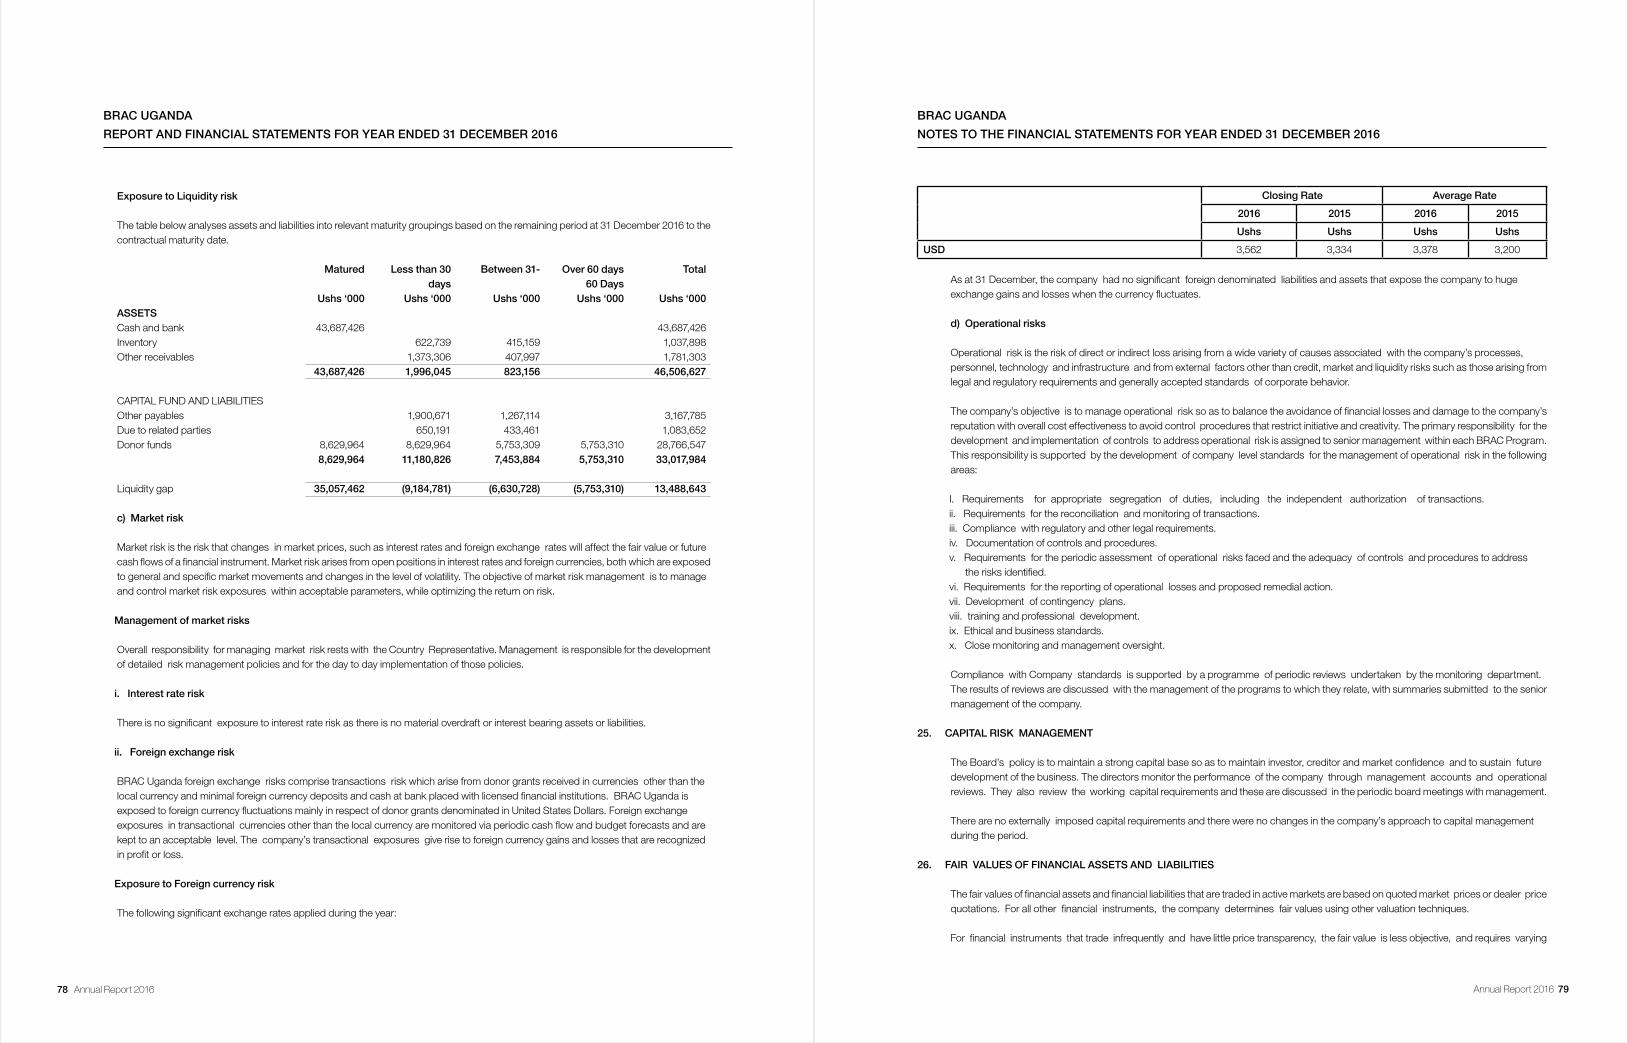
78 Annual Report 2016 Annual Report 2016 79
BRAC UGANDA
REPORT AND FINANCIAL STATEMENTS FOR YEAR ENDED 31 DECEMBER 2016
Exposure to Liquidity risk
The table below analyses assets and liabilities into relevant maturity groupings based on the remaining period at 31 December 2016 to the contractual maturity date. Matured Lessthan30 Between31- Over60days Total days 60 Days Ushs ‘000 Ushs ‘000 Ushs ‘000 Ushs ‘000 Ushs ‘000 ASSETS Cash and bank 43,687,426 43,687,426 Inventory 622,739 415,159 1,037,898 Other receivables 1,373,306 407,997 1,781,303 43,687,426 1,996,045 823,156 46,506,627
CAPITAL FUND AND LIABILITIES Other payables 1,900,671 1,267,114 3,167,785 Due to related parties 650,191 433,461 1,083,652 Donor funds 8,629,964 8,629,964 5,753,309 5,753,310 28,766,547 8,629,964 11,180,826 7,453,884 5,753,310 33,017,984
Liquidity gap 35,057,462 (9,184,781) (6,630,728) (5,753,310) 13,488,643
c) Market risk
Market risk is the risk that changes in market prices, such as interest rates and foreign exchange rates will affect the fair value or future cash flows of a financial instrument. Market risk arises from open positions in interest rates and foreign currencies, both which are exposed to general and specific market movements and changes in the level of volatility. The objective of market risk management is to manage and control market risk exposures within acceptable parameters, while optimizing the return on risk.
Management of market risks
Overall responsibility for managing market risk rests with the Country Representative. Management is responsible for the development of detailed risk management policies and for the day to day implementation of those policies. i. Interest rate risk
There is no significant exposure to interest rate risk as there is no material overdraft or interest bearing assets or liabilities.
ii. Foreign exchange risk
BRAC Uganda foreign exchange risks comprise transactions risk which arise from donor grants received in currencies other than the local currency and minimal foreign currency deposits and cash at bank placed with licensed financial institutions. BRAC Uganda is exposed to foreign currency fluctuations mainly in respect of donor grants denominated in United States Dollars. Foreign exchange exposures in transactional currencies other than the local currency are monitored via periodic cash flow and budget forecasts and are kept to an acceptable level. The company’s transactional exposures give rise to foreign currency gains and losses that are recognized in profit or loss.
Exposure to Foreign currency risk
The following significant exchange rates applied during the year:
BRAC UGANDA
NOTES TO THE FINANCIAL STATEMENTS FOR YEAR ENDED 31 DECEMBER 2016
Closing Rate Average Rate
2016 2015 2016 2015
Ushs Ushs Ushs Ushs
USD 3,562 3,334 3,378 3,200
As at 31 December, the company had no significant foreign denominated liabilities and assets that expose the company to huge exchange gains and losses when the currency fluctuates.
d) Operational risks
Operational risk is the risk of direct or indirect loss arising from a wide variety of causes associated with the company’s processes, personnel, technology and infrastructure and from external factors other than credit, market and liquidity risks such as those arising from legal and regulatory requirements and generally accepted standards of corporate behavior.
The company’s objective is to manage operational risk so as to balance the avoidance of financial losses and damage to the company’s reputation with overall cost effectiveness to avoid control procedures that restrict initiative and creativity. The primary responsibility for the development and implementation of controls to address operational risk is assigned to senior management within each BRAC Program. This responsibility is supported by the development of company level standards for the management of operational risk in the following areas:
I. Requirements for appropriate segregation of duties, including the independent authorization of transactions. ii. Requirements for the reconciliation and monitoring of transactions. iii. Compliance with regulatory and other legal requirements. iv. Documentation of controls and procedures. v. Requirements for the periodic assessment of operational risks faced and the adequacy of controls and procedures to address the risks identified. vi. Requirements for the reporting of operational losses and proposed remedial action. vii. Development of contingency plans. viii. training and professional development. ix. Ethical and business standards. x. Close monitoring and management oversight. Compliance with Company standards is supported by a programme of periodic reviews undertaken by the monitoring department. The results of reviews are discussed with the management of the programs to which they relate, with summaries submitted to the senior management of the company.
25. CAPITAL RISK MANAGEMENT
The Board’s policy is to maintain a strong capital base so as to maintain investor, creditor and market confidence and to sustain future development of the business. The directors monitor the performance of the company through management accounts and operational reviews. They also review the working capital requirements and these are discussed in the periodic board meetings with management.
There are no externally imposed capital requirements and there were no changes in the company’s approach to capital management during the period.
26. FAIR VALUES OF FINANCIAL ASSETS AND LIABILITIES
The fair values of financial assets and financial liabilities that are traded in active markets are based on quoted market prices or dealer price quotations. For all other financial instruments, the company determines fair values using other valuation techniques.
For financial instruments that trade infrequently and have little price transparency, the fair value is less objective, and requires varying
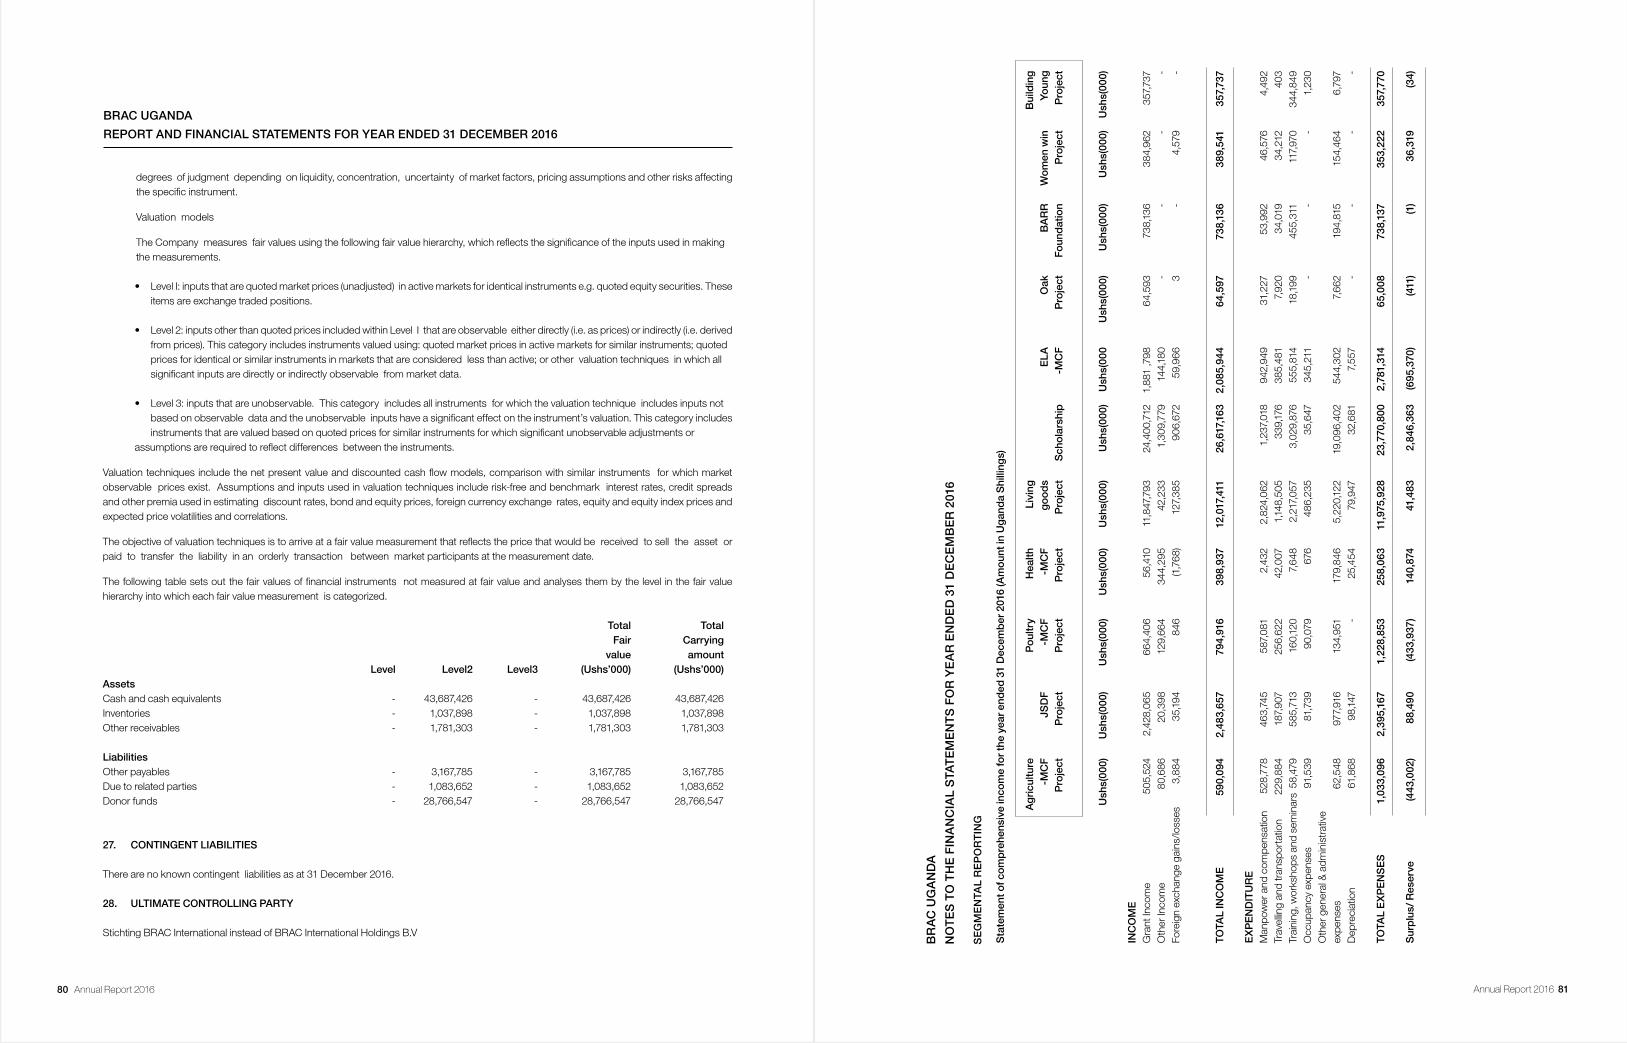
80 Annual Report 2016 Annual Report 2016 81
BRAC UGANDA
REPORT AND FINANCIAL STATEMENTS FOR YEAR ENDED 31 DECEMBER 2016
degrees of judgment depending on liquidity, concentration, uncertainty of market factors, pricing assumptions and other risks affecting the specific instrument.
Valuation models
The Company measures fair values using the following fair value hierarchy, which reflects the significance of the inputs used in making the measurements.
• Level I: inputs that are quoted market prices (unadjusted) in active markets for identical instruments e.g. quoted equity securities. These items are exchange traded positions.
• Level 2: inputs other than quoted prices included within Level I that are observable either directly (i.e. as prices) or indirectly (i.e. derived from prices). This category includes instruments valued using: quoted market prices in active markets for similar instruments; quoted prices for identical or similar instruments in markets that are considered less than active; or other valuation techniques in which all significant inputs are directly or indirectly observable from market data.
• Level 3: inputs that are unobservable. This category includes all instruments for which the valuation technique includes inputs not based on observable data and the unobservable inputs have a significant effect on the instrument’s valuation. This category includes instruments that are valued based on quoted prices for similar instruments for which significant unobservable adjustments or assumptions are required to reflect differences between the instruments.
Valuation techniques include the net present value and discounted cash flow models, comparison with similar instruments for which market observable prices exist. Assumptions and inputs used in valuation techniques include risk-free and benchmark interest rates, credit spreads and other premia used in estimating discount rates, bond and equity prices, foreign currency exchange rates, equity and equity index prices and expected price volatilities and correlations.
The objective of valuation techniques is to arrive at a fair value measurement that reflects the price that would be received to sell the asset or paid to transfer the liability in an orderly transaction between market participants at the measurement date.
The following table sets out the fair values of financial instruments not measured at fair value and analyses them by the level in the fair value hierarchy into which each fair value measurement is categorized.
Total Total Fair Carrying value amount Level Level2 Level3 (Ushs’000) (Ushs’000)Assets Cash and cash equivalents - 43,687,426 - 43,687,426 43,687,426Inventories - 1,037,898 - 1,037,898 1,037,898Other receivables - 1,781,303 - 1,781,303 1,781,303
Liabilities Other payables - 3,167,785 - 3,167,785 3,167,785Due to related parties - 1,083,652 - 1,083,652 1,083,652Donor funds - 28,766,547 - 28,766,547 28,766,547
27. CONTINGENT LIABILITIES
There are no known contingent liabilities as at 31 December 2016.
28. ULTIMATE CONTROLLING PARTY
Stichting BRAC International instead of BRAC International Holdings B.V
S
EG
ME
NTA
L R
EP
OR
TIN
G
Sta
tem
ent o
f co
mp
rehe
nsiv
e in
com
e fo
r th
e ye
ar e
nded
31
Dec
emb
er 2
016
(Am
oun
t in
Ug
and
a S
hilli
ngs)
A
gri
cultu
re
P
oul
try
H
ealth
Li
ving
Bui
ldin
g
-MCF
JSDF
-MCF
-MCF
goods
ELA
Oak
BARR
Womenwin
Young
P
roje
ct
Pro
ject
P
roje
ct
Pro
ject
P
roje
ct
Sch
ola
rshi
p
-MC
F P
roje
ct
Foun
dat
ion
Pro
ject
P
roje
ct
Ush
s(00
0)
Ush
s(00
0)
Ush
s(00
0)
Ush
s(00
0)
Ush
s(00
0)
Ush
s(00
0)
Ush
s(00
0 U
shs(
000)
U
shs(
000)
U
shs(
000)
U
shs(
000)
INC
OM
E
G
rant
Inco
me
505,
524
2,42
8,06
5 66
4,40
6 56
,410
11
,847
,793
24
,400
,712
1,
881
,798
64
,593
73
8,13
6 38
4,96
2 35
7,73
7O
ther
Inco
me
80,6
86
20,3
98
129,
664
344,
295
42,2
33
1,30
9,77
9 14
4,18
0 -
- -
-Fo
reig
n ex
chan
ge g
ains
/loss
es
3,88
4 35
,194
84
6 (1
,768
) 12
7,38
5 90
6,67
2 59
,966
3
- 4,
579
- TO
TAL
INC
OM
E
590,
094
2,48
3,65
7 79
4,91
6 39
8,93
7 12
,017
,411
26
,617
,163
2,
085,
944
64,5
97
738,
136
389,
541
357,
737
EX
PE
ND
ITU
RE
Man
pow
er a
nd c
ompe
nsat
ion
528,
778
463,
745
587,
081
2,43
2 2,
824,
062
1,23
7,01
8 94
2,94
9 31
,227
53
,992
46
,576
4,
492
Trav
ellin
g an
d tr
ansp
orta
tion
229,
884
187,
907
256,
622
42,0
07
1,14
8,50
5 33
9,17
6 38
5,48
1 7,
920
34,0
19
34,2
12
403
Trai
ning
, wor
ksho
ps a
nd s
emin
ars
58,4
79
585,
713
160,
120
7,64
8 2,
217,
057
3,02
9,87
6 55
5,81
4 18
,199
45
5,31
1 11
7,97
0 34
4,84
9O
ccup
ancy
exp
ense
s 91
,539
81
,739
90
,079
67
6 48
6,23
5 35
,647
34
5,21
1 -
- -
1,23
0O
ther
gen
eral
& a
dmin
istr
ativ
e ex
pens
es
62,5
48
977,
916
134,
951
179,
846
5,22
0,12
2 19
,096
,402
54
4,30
2 7,
662
194,
815
154,
464
6,79
7D
epre
ciat
ion
61,8
68
98,1
47
- 25
,454
79
,947
32
,681
7,
557
- -
- -
TOTA
L E
XP
EN
SE
S
1,03
3,09
6 2,
395,
167
1,22
8,85
3 25
8,06
3 11
,975
,928
23
,770
,800
2,
781,
314
65,0
08
738,
137
353,
222
357,
770
Sur
plu
s/ R
eser
ve
(443
,002
) 88
,490
(4
33,9
37)
140,
874
41,4
83
2,84
6,36
3 (6
95,3
70)
(411
) (1
) 36
,319
(3
4)
BR
AC
UG
AN
DA
NO
TE
S T
O T
HE
FIN
AN
CIA
L S
TAT
EM
EN
TS
FO
R Y
EA
R E
ND
ED
31
DE
CE
MB
ER
201
6
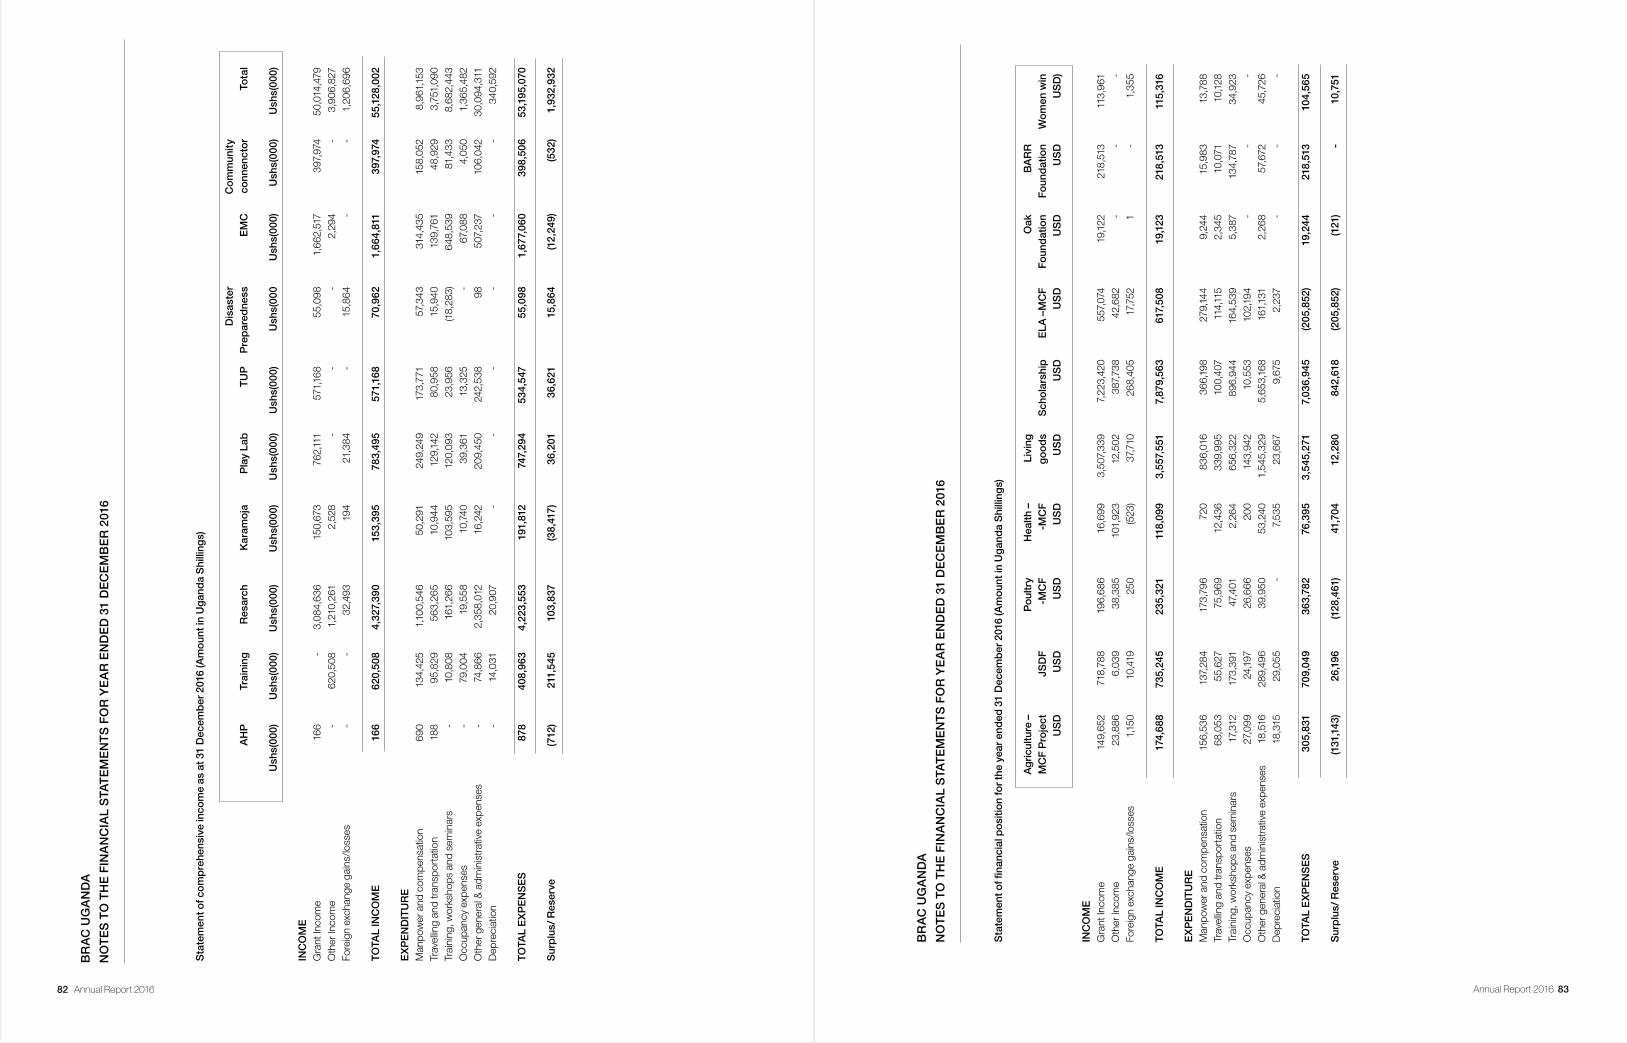
82 Annual Report 2016 Annual Report 2016 83
Sta
tem
ent o
f co
mp
rehe
nsiv
e in
com
e as
at 3
1 D
ecem
ber
201
6 (A
mo
unt i
n U
gan
da
Shi
lling
s)
D
isas
ter
C
om
mun
ity
A
HP
Tr
aini
ng
Res
arch
K
aram
oja
Pla
y La
b
TU
P
Pre
par
edne
ss
EM
C
conn
enct
or
Tota
l
U
shs(
000)
U
shs(
000)
U
shs(
000)
U
shs(
000)
U
shs(
000)
U
shs(
000)
U
shs(
000
Ush
s(00
0)
Ush
s(00
0)
Ush
s(00
0)
INC
OM
E
G
rant
Inco
me
166
- 3,
084,
636
150,
673
762,
111
571,
168
55,0
98
1,66
2,51
7 39
7,97
4 50
,014
,479
Oth
er In
com
e -
620,
508
1,21
0,26
1 2,
528
- -
- 2,
294
- 3,
906,
827
Fore
ign
exch
ange
gai
ns/lo
sses
-
- 32
,493
19
4 21
,384
-
15,8
64
- -
1,20
6,69
6
TOTA
L IN
CO
ME
16
6 62
0,50
8 4,
327,
390
153,
395
783,
495
571,
168
70,9
62
1,66
4,81
1 39
7,97
4 55
,128
,002
EX
PE
ND
ITU
RE
M
anpo
wer
and
com
pens
atio
n 69
0 13
4,42
5 1,
100,
546
50,2
91
249,
249
173,
771
57,3
43
314,
435
158,
052
8,96
1,15
3Tr
avel
ling
and
tran
spor
tatio
n 18
8 95
,829
56
3,26
5 10
,944
12
9,14
2 80
,958
15
,940
13
9,76
1 48
,929
3,
751,
090
Trai
ning
, wor
ksho
ps a
nd s
emin
ars
- 10
,808
16
1,26
6 10
3,59
5 12
0,09
3 23
,956
(1
8,28
3)
648,
539
81,4
33
8,68
2,44
3O
ccup
ancy
exp
ense
s -
79,0
04
19,5
58
10,7
40
39,3
61
13,3
25
- 67
,088
4,
050
1,36
5,48
2O
ther
gen
eral
& a
dmin
istr
ativ
e ex
pens
es
- 74
,866
2,
358,
012
16,2
42
209,
450
242,
538
98
507,
237
106,
042
30,0
94,3
11D
epre
ciat
ion
- 14
,031
20
,907
-
- -
- -
- 34
0,59
2
TOTA
L E
XP
EN
SE
S
878
408,
963
4,22
3,55
3 19
1,81
2 74
7,29
4 53
4,54
7 55
,098
1,
677,
060
398,
506
53,1
95,0
70
Sur
plu
s/ R
eser
ve
(712
) 21
1,54
5 10
3,83
7 (3
8,41
7)
36,2
01
36,6
21
15,8
64
(12,
249)
(5
32)
1,93
2,93
2
BR
AC
UG
AN
DA
NO
TE
S T
O T
HE
FIN
AN
CIA
L S
TAT
EM
EN
TS
FO
R Y
EA
R E
ND
ED
31
DE
CE
MB
ER
201
6
Statementoffinancialpositionfortheyearended31Decem
ber2016(AmountinUgandaShillings)
A
gri
cultu
re –
Po
ultr
y
Hea
lth –
Li
ving
O
ak
BA
RR
MCFProject
JSDF
-MCF
-MCF
goods
Scholarship
ELA–MCF
Foundation
Foundation
Womenwin
U
SD
U
SD
U
SD
U
SD
U
SD
U
SD
U
SD
U
SD
U
SD
U
SD
)
INC
OM
E
G
rant
Inco
me
149,
652
718,
788
196,
686
16,6
99
3,50
7,33
9 7,
223,
420
557,
074
19,1
22
218,
513
113,
961
Oth
er In
com
e 23
,886
6,
039
38,3
85
101,
923
12,5
02
387,
738
42,6
82
- -
- Fo
reig
n ex
chan
ge g
ains
/loss
es
1,15
0 10
,419
25
0 (5
23)
37,7
10
268,
405
17,7
52
1 -
1,35
5
TOTA
L IN
CO
ME
17
4,68
8 73
5,24
5 23
5,32
1 11
8,09
9 3,
557,
551
7,87
9,56
3 61
7,50
8 19
,123
21
8,51
3 11
5,31
6
EX
PE
ND
ITU
RE
M
anpo
wer
and
com
pens
atio
n 15
6,53
6 13
7,28
4 17
3,79
6 72
0 83
6,01
6 36
6,19
8 27
9,14
4 9,
244
15,9
83
13,7
88Tr
avel
ling
and
tran
spor
tatio
n 68
,053
55
,627
75
,969
12
,436
33
9,99
5 10
0,40
7 11
4,11
5 2,
345
10,0
71
10,1
28Tr
aini
ng, w
orks
hops
and
sem
inar
s 17
,312
17
3,39
1 47
,401
2,
264
656,
322
896,
944
164,
539
5,38
7 13
4,78
7 34
,923
Occ
upan
cy e
xpen
ses
27,0
99
24,1
97
26,6
66
200
143,
942
10,5
53
102,
194
- -
-O
ther
gen
eral
& a
dmin
istr
ativ
e ex
pens
es
18,5
16
289,
496
39,9
50
53,2
40
1,54
5,32
9 5,
653,
168
161,
131
2,26
8 57
,672
45
,726
Dep
reci
atio
n 18
,315
29
,055
-
7,53
5 23
,667
9,
675
2,23
7 -
- -
TOTA
L E
XP
EN
SE
S
305,
831
709,
049
363,
782
76,3
95
3,54
5,27
1 7,
036,
945
(205
,852
) 19
,244
21
8,51
3 10
4,56
5
Sur
plu
s/ R
eser
ve
(131
,143
) 26
,196
(1
28,4
61)
41,7
04
12,2
80
842,
618
(205
,852
) (1
21)
- 10
,751
BR
AC
UG
AN
DA
NO
TE
S T
O T
HE
FIN
AN
CIA
L S
TAT
EM
EN
TS
FO
R Y
EA
R E
ND
ED
31
DE
CE
MB
ER
201
6
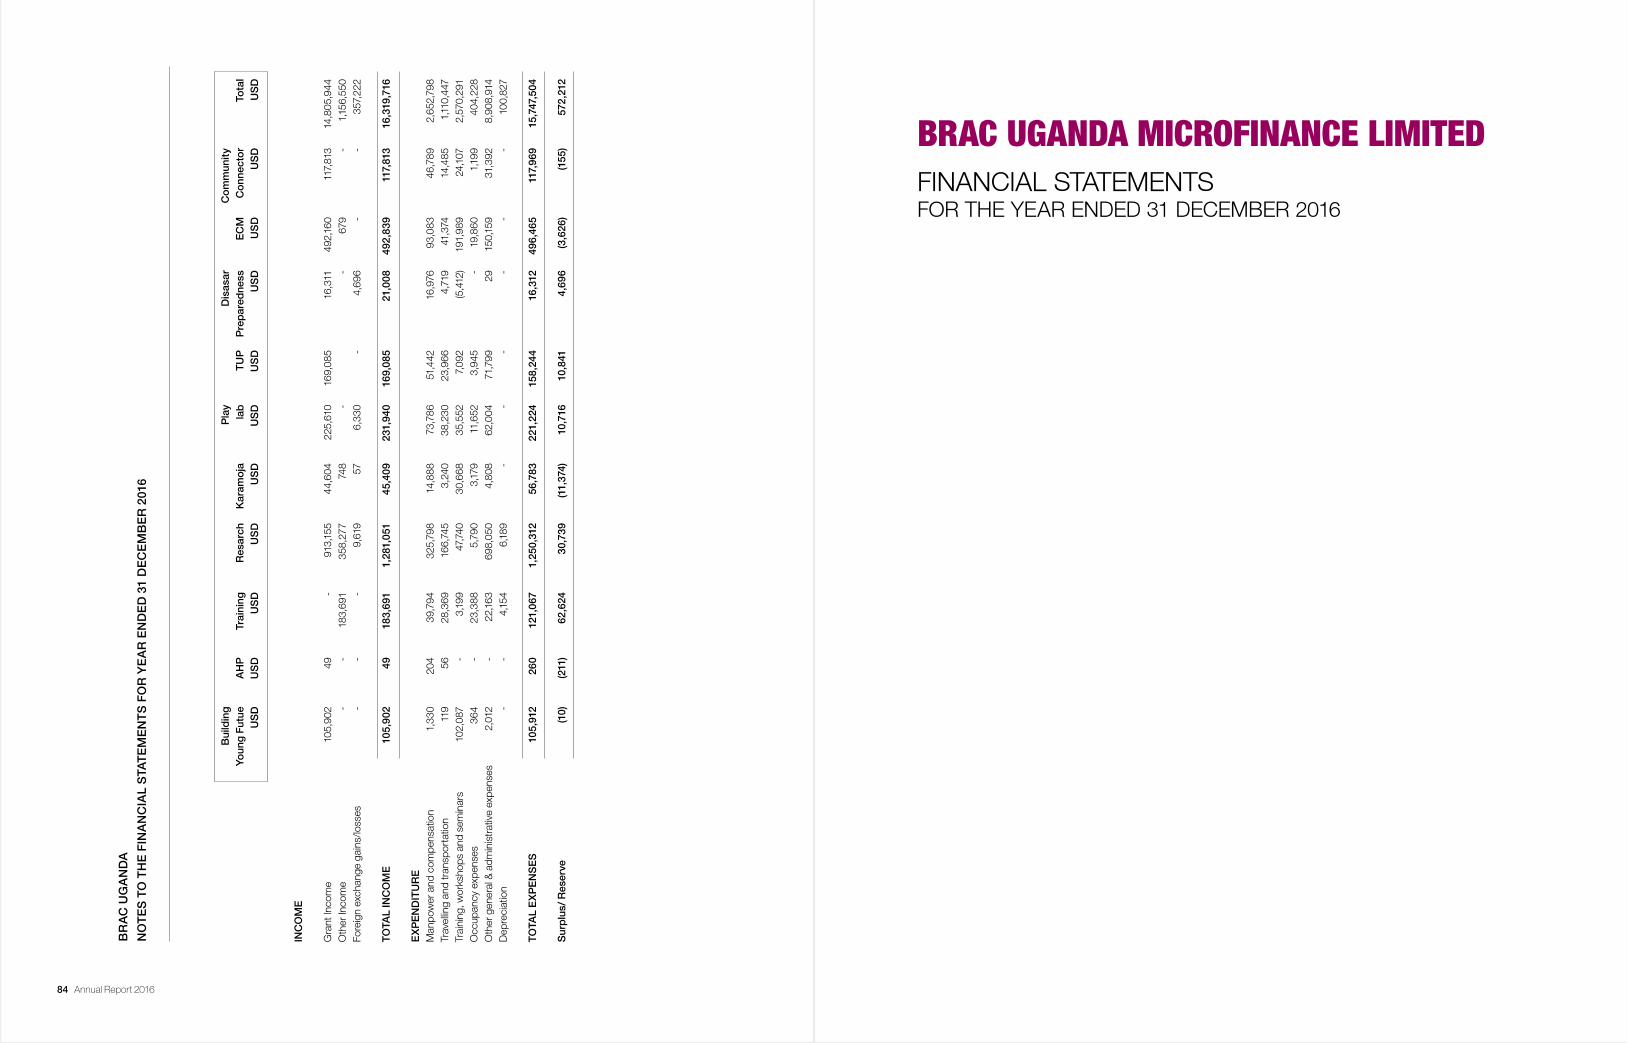
84 Annual Report 2016
BR
AC
UG
AN
DA
NO
TE
S T
O T
HE
FIN
AN
CIA
L S
TAT
EM
EN
TS
FO
R Y
EA
R E
ND
ED
31
DE
CE
MB
ER
201
6
B
uild
ing
Pla
y
Dis
asar
Co
mm
unit
y
Youn
g Fu
tue
AH
P
Trai
ning
R
esar
ch
Kar
amoj
a la
b
TU
P
Pre
par
edne
ss
EC
M
Co
nnec
tor
Tota
l
US
D
US
D
US
D
US
D
US
D
US
D
US
D
US
D
US
D
US
D
US
D
INC
OM
E
G
rant
Inco
me
105,
902
49
- 91
3,15
5 44
,604
22
5,61
0 16
9,08
5 16
,311
49
2,16
0 11
7,81
3 14
,805
,944
Oth
er In
com
e -
- 18
3,69
1 35
8,27
7 74
8 -
-
679
- 1,
156,
550
Fore
ign
exch
ange
gai
ns/lo
sses
-
- -
9,61
9 57
6,
330
- 4,
696
- -
357,
222
TOTA
L IN
CO
ME
10
5,90
2 49
18
3,69
1 1,
281,
051
45,4
09
231,
940
169,
085
21,0
08
492,
839
117,
813
16,3
19,7
16
EX
PE
ND
ITU
RE
Man
pow
er a
nd c
ompe
nsat
ion
1,33
0 20
4 39
,794
32
5,79
8 14
,888
73
,786
51
,442
16
,976
93
,083
46
,789
2,
652,
798
Trav
ellin
g an
d tr
ansp
orta
tion
119
56
28,3
69
166,
745
3,24
0 38
,230
23
,966
4,
719
41,3
74
14,4
85
1,11
0,44
7Tr
aini
ng, w
orks
hops
and
sem
inar
s 10
2,08
7 -
3,19
9 47
,740
30
,668
35
,552
7,
092
(5,4
12)
191,
989
24,1
07
2,57
0,29
1O
ccup
ancy
exp
ense
s 36
4 -
23,3
88
5,79
0 3,
179
11,6
52
3,94
5 -
19,8
60
1,19
9 40
4,22
8O
ther
gen
eral
& a
dmin
istr
ativ
e ex
pens
es
2,01
2 -
22,1
63
698,
050
4,80
8 62
,004
71
,799
29
15
0,15
9 31
,392
8,
908,
914
Dep
reci
atio
n -
- 4,
154
6,18
9 -
- -
- -
- 10
0,82
7
TOTA
L E
XP
EN
SE
S
105,
912
260
121,
067
1,25
0,31
2 56
,783
22
1,22
4 15
8,24
4 16
,312
49
6,46
5 11
7,96
9 15
,747
,504
Sur
plu
s/ R
eser
ve
(10)
(2
11)
62,6
24
30,7
39
(11,
374)
10
,716
10
,841
4,
696
(3,6
26)
(155
) 57
2,21
2
BRAC UGANDA MICROFINANCE LIMITED
FINANCIAL STATEMENTSFOR THE YEAR ENDED 31 DECEMBER 2016
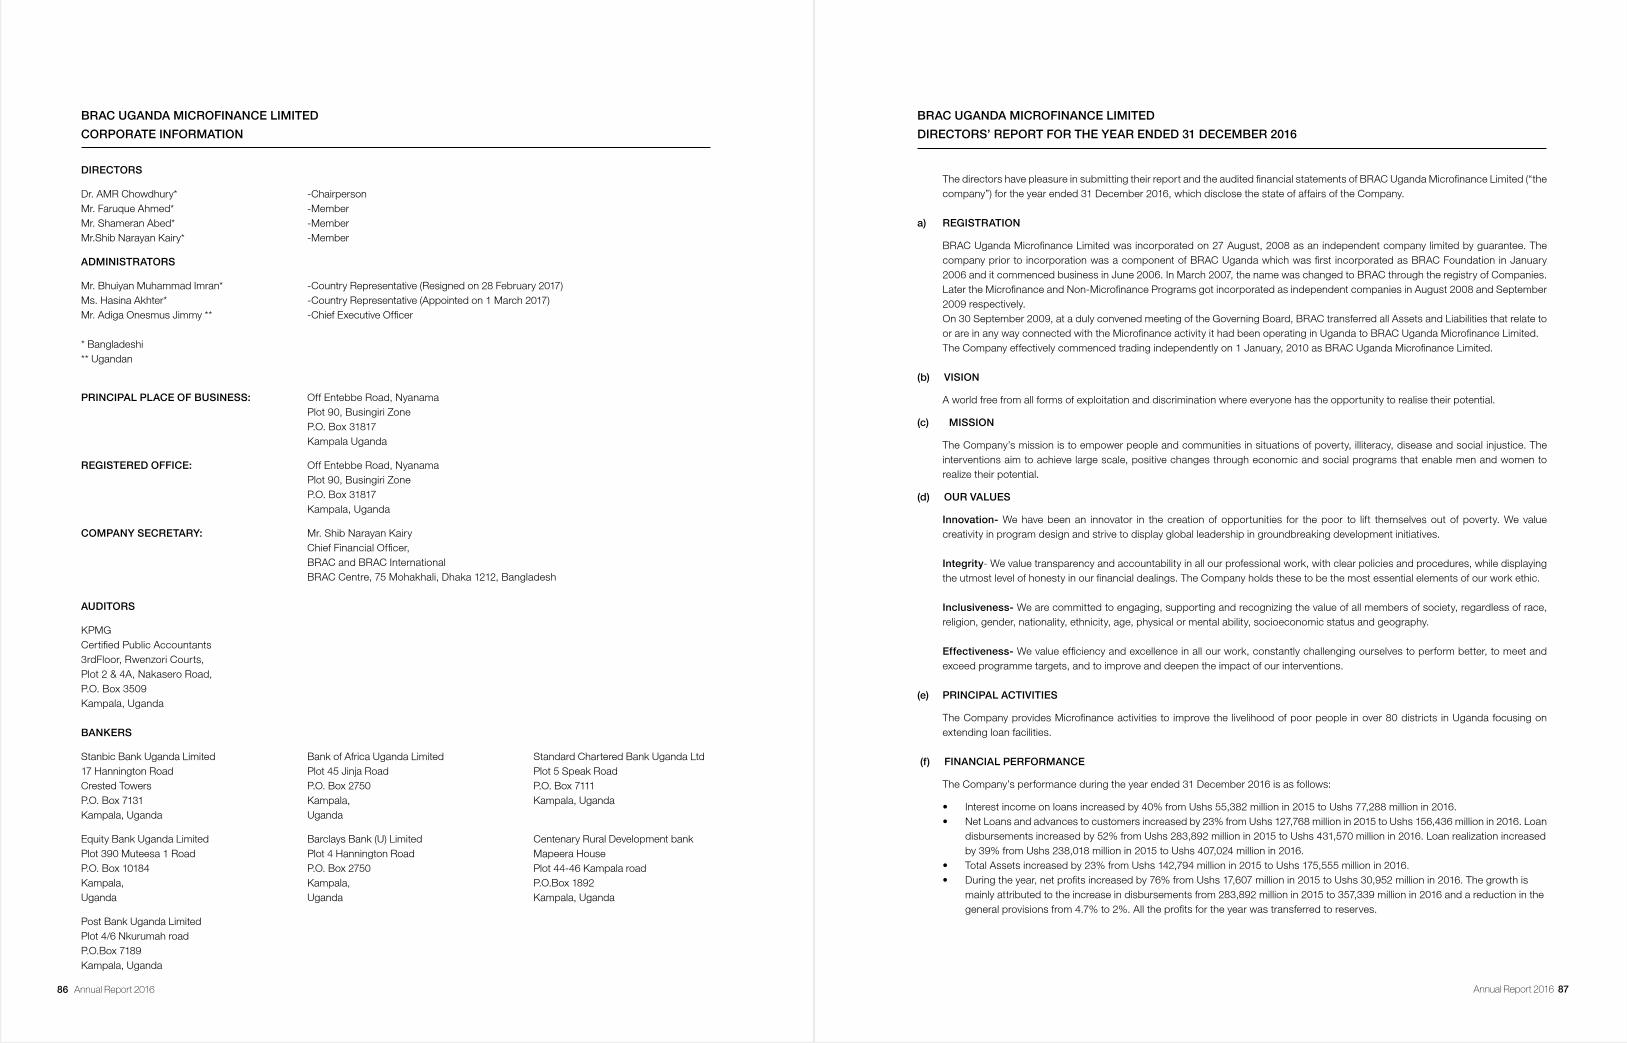
86 Annual Report 2016 Annual Report 2016 87
BRAC UGANDA MICROFINANCE LIMITED
CORPORATE INFORMATION
DIRECTORS
Dr. AMR Chowdhury* -ChairpersonMr. Faruque Ahmed* -MemberMr. Shameran Abed* -Member Mr.Shib Narayan Kairy* -Member
ADMINISTRATORS
Mr. Bhuiyan Muhammad Imran* -Country Representative (Resigned on 28 February 2017)Ms. Hasina Akhter* -Country Representative (Appointed on 1 March 2017)Mr. Adiga Onesmus Jimmy ** -Chief Executive Officer
* Bangladeshi** Ugandan
PRINCIPAL PLACE OF BUSINESS: Off Entebbe Road, Nyanama Plot 90, Busingiri Zone P.O. Box 31817 Kampala Uganda
REGISTERED OFFICE: Off Entebbe Road, Nyanama Plot 90, Busingiri Zone P.O. Box 31817 Kampala, Uganda
COMPANY SECRETARY: Mr. Shib Narayan Kairy Chief Financial Officer, BRAC and BRAC International BRAC Centre, 75 Mohakhali, Dhaka 1212, Bangladesh
AUDITORS
KPMGCertified Public Accountants3rdFloor, Rwenzori Courts,Plot 2 & 4A, Nakasero Road,P.O. Box 3509Kampala, Uganda BANKERS
Stanbic Bank Uganda Limited Bank of Africa Uganda Limited Standard Chartered Bank Uganda Ltd17 Hannington Road Plot 45 Jinja Road Plot 5 Speak RoadCrested Towers P.O. Box 2750 P.O. Box 7111P.O. Box 7131 Kampala, Kampala, UgandaKampala, Uganda Uganda
Equity Bank Uganda Limited Barclays Bank (U) Limited Centenary Rural Development bankPlot 390 Muteesa 1 Road Plot 4 Hannington Road Mapeera HouseP.O. Box 10184 P.O. Box 2750 Plot 44-46 Kampala roadKampala, Kampala, P.O.Box 1892Uganda Uganda Kampala, Uganda
Post Bank Uganda Limited Plot 4/6 Nkurumah road P.O.Box 7189 Kampala, Uganda
BRAC UGANDA MICROFINANCE LIMITED
DIRECTORS’ REPORT FOR THE YEAR ENDED 31 DECEMBER 2016
The directors have pleasure in submitting their report and the audited financial statements of BRAC Uganda Microfinance Limited (“the company”) for the year ended 31 December 2016, which disclose the state of affairs of the Company.
a) REGISTRATION
BRAC Uganda Microfinance Limited was incorporated on 27 August, 2008 as an independent company limited by guarantee. The company prior to incorporation was a component of BRAC Uganda which was first incorporated as BRAC Foundation in January 2006 and it commenced business in June 2006. In March 2007, the name was changed to BRAC through the registry of Companies. Later the Microfinance and Non-Microfinance Programs got incorporated as independent companies in August 2008 and September 2009 respectively.
On 30 September 2009, at a duly convened meeting of the Governing Board, BRAC transferred all Assets and Liabilities that relate to or are in any way connected with the Microfinance activity it had been operating in Uganda to BRAC Uganda Microfinance Limited.
The Company effectively commenced trading independently on 1 January, 2010 as BRAC Uganda Microfinance Limited. (b) VISION
A world free from all forms of exploitation and discrimination where everyone has the opportunity to realise their potential.
(c) MISSION
The Company’s mission is to empower people and communities in situations of poverty, illiteracy, disease and social injustice. The interventions aim to achieve large scale, positive changes through economic and social programs that enable men and women to realize their potential.
(d) OUR VALUES
Innovation- We have been an innovator in the creation of opportunities for the poor to lift themselves out of poverty. We value creativity in program design and strive to display global leadership in groundbreaking development initiatives.
Integrity- We value transparency and accountability in all our professional work, with clear policies and procedures, while displaying the utmost level of honesty in our financial dealings. The Company holds these to be the most essential elements of our work ethic.
Inclusiveness- We are committed to engaging, supporting and recognizing the value of all members of society, regardless of race, religion, gender, nationality, ethnicity, age, physical or mental ability, socioeconomic status and geography.
Effectiveness- We value efficiency and excellence in all our work, constantly challenging ourselves to perform better, to meet and
exceed programme targets, and to improve and deepen the impact of our interventions.
(e) PRINCIPAL ACTIVITIES
The Company provides Microfinance activities to improve the livelihood of poor people in over 80 districts in Uganda focusing on extending loan facilities.
(f) FINANCIAL PERFORMANCE
The Company’s performance during the year ended 31 December 2016 is as follows:
• Interest income on loans increased by 40% from Ushs 55,382 million in 2015 to Ushs 77,288 million in 2016. • Net Loans and advances to customers increased by 23% from Ushs 127,768 million in 2015 to Ushs 156,436 million in 2016. Loan disbursements increased by 52% from Ushs 283,892 million in 2015 to Ushs 431,570 million in 2016. Loan realization increased by 39% from Ushs 238,018 million in 2015 to Ushs 407,024 million in 2016. • Total Assets increased by 23% from Ushs 142,794 million in 2015 to Ushs 175,555 million in 2016. • During the year, net profits increased by 76% from Ushs 17,607 million in 2015 to Ushs 30,952 million in 2016. The growth is mainly attributed to the increase in disbursements from 283,892 million in 2015 to 357,339 million in 2016 and a reduction in the
general provisions from 4.7% to 2%. All the profits for the year was transferred to reserves.
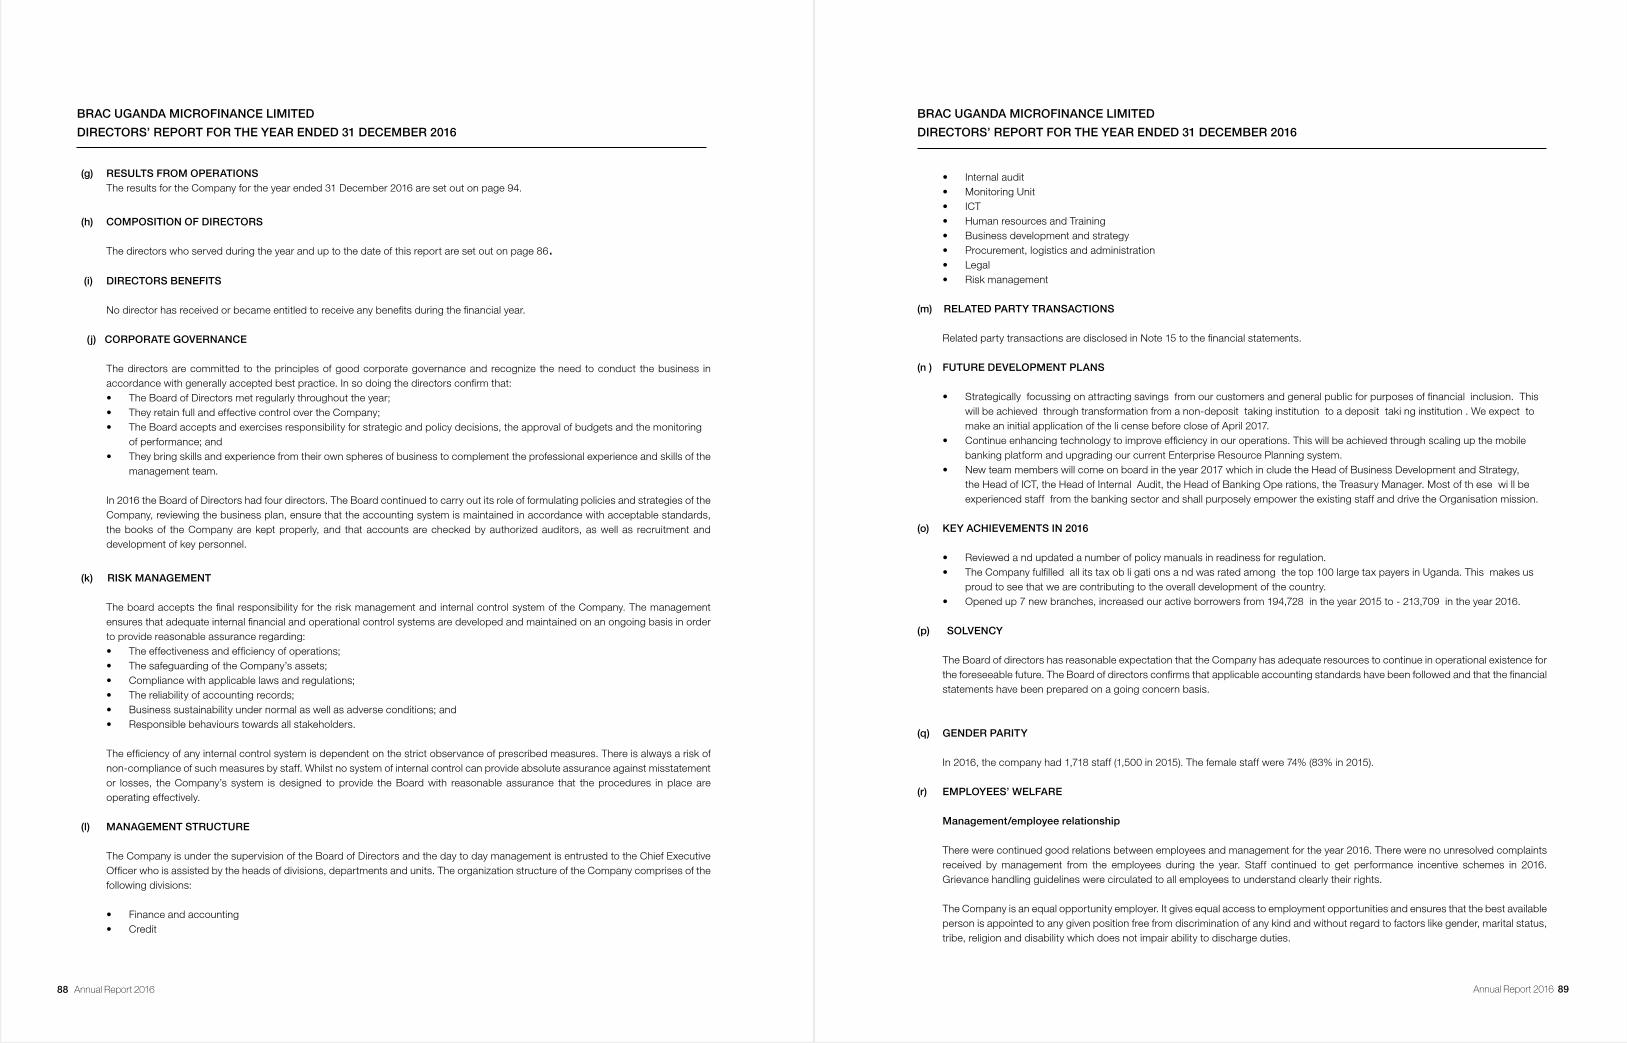
88 Annual Report 2016 Annual Report 2016 89
BRAC UGANDA MICROFINANCE LIMITED
DIRECTORS’ REPORT FOR THE YEAR ENDED 31 DECEMBER 2016
(g) RESULTS FROM OPERATIONS The results for the Company for the year ended 31 December 2016 are set out on page 94.
(h) COMPOSITION OF DIRECTORS
The directors who served during the year and up to the date of this report are set out on page 86.
(i) DIRECTORS BENEFITS
No director has received or became entitled to receive any benefits during the financial year.
(j) CORPORATE GOVERNANCE
The directors are committed to the principles of good corporate governance and recognize the need to conduct the business in accordance with generally accepted best practice. In so doing the directors confirm that:
• The Board of Directors met regularly throughout the year; • They retain full and effective control over the Company; • The Board accepts and exercises responsibility for strategic and policy decisions, the approval of budgets and the monitoring
of performance; and • They bring skills and experience from their own spheres of business to complement the professional experience and skills of the management team. In 2016 the Board of Directors had four directors. The Board continued to carry out its role of formulating policies and strategies of the
Company, reviewing the business plan, ensure that the accounting system is maintained in accordance with acceptable standards, the books of the Company are kept properly, and that accounts are checked by authorized auditors, as well as recruitment and development of key personnel.
(k) RISK MANAGEMENT
The board accepts the final responsibility for the risk management and internal control system of the Company. The management ensures that adequate internal financial and operational control systems are developed and maintained on an ongoing basis in order to provide reasonable assurance regarding:
• The effectiveness and efficiency of operations; • The safeguarding of the Company’s assets; • Compliance with applicable laws and regulations; • The reliability of accounting records; • Business sustainability under normal as well as adverse conditions; and • Responsible behaviours towards all stakeholders.
The efficiency of any internal control system is dependent on the strict observance of prescribed measures. There is always a risk of non-compliance of such measures by staff. Whilst no system of internal control can provide absolute assurance against misstatement or losses, the Company’s system is designed to provide the Board with reasonable assurance that the procedures in place are operating effectively.
(l) MANAGEMENT STRUCTURE
The Company is under the supervision of the Board of Directors and the day to day management is entrusted to the Chief Executive Officer who is assisted by the heads of divisions, departments and units. The organization structure of the Company comprises of the following divisions:
• Finance and accounting • Credit
• Internal audit • Monitoring Unit • ICT • Human resources and Training • Business development and strategy • Procurement, logistics and administration • Legal • Risk management
(m) RELATED PARTY TRANSACTIONS
Related party transactions are disclosed in Note 15 to the financial statements.
(n ) FUTURE DEVELOPMENT PLANS
• Strategically focussing on attracting savings from our customers and general pubIic for purposes of financial inclusion. This will be achieved through transformation from a non-deposit taking institution to a deposit taki ng institution . We expect to make an initial application of the li cense before close of April 2017.
• Continue enhancing technology to improve efficiency in our operations. This will be achieved through scaling up the mobile banking platform and upgrading our current Enterprise Resource Planning system.
• New team members will come on board in the year 2017 which in clude the Head of Business Development and Strategy, the Head of ICT, the Head of Internal Audit, the Head of Banking Ope rations, the Treasury Manager. Most of th ese wi ll be experienced staff from the banking sector and shall purposely empower the existing staff and drive the Organisation mission.
(o) KEY ACHIEVEMENTS IN 2016
• Reviewed a nd updated a number of policy manuals in readiness for regulation. • The Company fulfilled all its tax ob li gati ons a nd was rated among the top 100 large tax payers in Uganda. This makes us
proud to see that we are contributing to the overall development of the country. • Opened up 7 new branches, increased our active borrowers from 194,728 in the year 2015 to - 213,709 in the year 2016.
(p) SOLVENCY
The Board of directors has reasonable expectation that the Company has adequate resources to continue in operational existence for the foreseeable future. The Board of directors confirms that applicable accounting standards have been followed and that the financial statements have been prepared on a going concern basis.
(q) GENDER PARITY
In 2016, the company had 1,718 staff (1,500 in 2015). The female staff were 74% (83% in 2015).
(r) EMPLOYEES’ WELFARE
Management/employee relationship
There were continued good relations between employees and management for the year 2016. There were no unresolved complaints received by management from the employees during the year. Staff continued to get performance incentive schemes in 2016. Grievance handling guidelines were circulated to all employees to understand clearly their rights.
The Company is an equal opportunity employer. It gives equal access to employment opportunities and ensures that the best available person is appointed to any given position free from discrimination of any kind and without regard to factors like gender, marital status, tribe, religion and disability which does not impair ability to discharge duties.
BRAC UGANDA MICROFINANCE LIMITED
DIRECTORS’ REPORT FOR THE YEAR ENDED 31 DECEMBER 2016
90 Annual Report 2016 Annual Report 2016 91
BRAC UGANDA
REPORT AND FINANCIAL STATEMENTS FOR YEAR ENDED 31 DECEMBER 2016
Training
Training and development of staff capacity is one of the key priorities of the Company. This year all the Branch Accountants received hands-on training on their day to day responsibilities. Selected staffs from other programs received training as prescheduled. The Company will continue to train, re-train and develop its staff in order to improve service delivery and innovation.
Medical assistance
The Company introduced a medical insurance scheme in October 2016, which covers all staff. We plan to add employees’ dependants gradually.
Retirementbenefits
All eligible employees are members of the National Social Security Fund (NSSF) which is an approved pension fund. The Company contributes 10% of the employees’ gross salary and the employee contributes 5%.
The NSSF is a defined contribution scheme with BRAC Uganda Microfinance Limited having no legal or constructive obligation to pay further top-up contributions
(s) Auditors
The auditors, KPMG, being eligible for reappointment have expressed their willingness to continue in office in accordance with the terms of Section 167(2) of the Companies Act of Uganda.
(t)Approvalofthefinancialstatements
The financial statements were approved by the directors at a meeting held on 13 April 2017.
By order of the Board
Signed………………………………… Date: ……………………………
SECRETARY
BRAC UGANDA MICROFINANCE LIMITED
STATEMENT OF DIRECTORS’ RESPONSIBILITIES 2016
The Company’s directors are responsible for the preparation and fair presentation of the financial statements, comprising the statement of financial position as at 31 December 2016 and the statements of comprehensive income, changes in equity and cash flows for the year then ended, and the notes to the financial statements, which include a summary of significant accounting policies and other explanatory notes, in accordance with International Financial Reporting Standards and the Companies Act of Uganda and for such internal controls as the directors determine are necessary to enable the preparation of financial statements that are free from material misstatement, whether due to fraud or error. The directors’ responsibilities include: designing, implementing and maintaining internal controls relevant to the preparation and fair presentation of these financial statements that are free from material misstatement, whether due to fraud or error; selecting and applying appropriate accounting policies; and making accounting estimates that are reasonable in the circumstances. They are also responsible for safe guarding the assets of the Company.
Under the Companies Act of Uganda, the directors are required to prepare financial statements for each year that give a true and fair view of the state of affairs of the Company as at the end of the financial year and of the operating results of the Company for that year. It also requires the directors to ensure the company keeps proper accounting records that disclose with reasonable accuracy the financial position of the Company.
The directors accept responsibility for the financial statements set out on pages 12 to 53 which have been prepared using appropriate accounting policies supported by reasonable and prudent judgment and estimates, in conformity with International Financial Reporting Standards and the Companies Act of Uganda. The directors are of the opinion that the financial statements give a true and fair view of the state of the financial affairs and the profit and cash flow for the year ended 31 December 2016. The directors further accept responsibility for the maintenance of accounting records that may be relied upon in the preparation of financial statements, as well as adequate systems of internal financial control.
The directors have made an assessment of the Company’s ability to continue as a going concern and have no reason to believe the Company will not be a going concern for the next twelve months from the date of this statement.
Approvalofthefinancialstatements
The financial statements, as indicated above, were approved by the board of directors on 13 April 2017 and were signed on its behalf by:
Director: ………………………
Director: ……………………….
Date:……………………….2017
92 Annual Report 2016 Annual Report 2016 93
REPORT OF THE INDEPENDENT AUDITORS TO THE MEMBERS OF
BRAC MICROFINANCE UGANDA LIMITED
Report on the Audit of the Financial Statements
Opinion
We have audited the financial statements of BRAC Microfinance Uganda Limited, which comprise the statement of financial position as at 31 December 2016, and the statements of comprehensive income, changes in equity and cash flows for the year then ended, and notes to the financial statements, including a summary of significant accounting policies set out on pages 94-128. We have not audited the memorandum figures reported in United States Dollars (USD$) and accordingly we do not express an opinion on them.In our opinion, the financial statements give a true and fair view of the financial position of BRAC Microfinance Uganda Limited as at 31 December 2016, and of its financial performance and its cash flows for the year then ended in accordance with International Financial Reporting Standards (IFRSs) and the Companies Act of Uganda.
Basis for Opinion
We conducted our audit in accordance with International Standards on Auditing (ISAs). Our responsibilities under those standards are further described in the Auditor’s Responsibilities for the Audit of the Financial Statements section of our report. We are independent of the company in accordance with the International Ethics Standards Board for Accountants’ Code of Ethics for Professional Accountants (IESBA Code) together with the ethical requirements that are relevant to our audit of the financial statements in Uganda, and we have fulfilled our other ethical responsibilities in accordance with these requirements and the IESBA Code. We believe that the audit evidence we have obtained is sufficient and appropriate to provide a basis for our opinion.
Other Information
The directors are responsible for the other information. The other information comprises the information included in the Corporate Information, in the Directors’ Report and the Statement of Directors’ Responsibilities, but does not include the financial statements and our auditor’s report thereon.
Our opinion on the financial statements does not cover the other information and we do not express any form of assurance conclusion thereon. In connection with our audit of the financial statements, our responsibility is to read the other information and, in doing so, consider whether the other information is materially inconsistent with the financial statements or our knowledge obtained in the audit, or otherwise appears to be materially misstated. If, based on the work we have performed, we conclude that there is a material misstatement of this other information, we are required to report that fact. We have nothing to report in this regard.
Responsibilities of Directors for the Financial Statements
The directors are responsible for the preparation of financial statements that give a true and fair view in accordance with International Financial Reporting Standards and the Companies Act of Uganda, and for such internal control as the directors determine is necessary to enable the preparation of the financial statements that are free from material misstatement, whether due to fraud or error. In preparing the financial statements, the directors are responsible for assessing the company’s ability to continue as a going concern, disclosing, as applicable, matters related to going concern and using the going concern basis of accounting unless the directors either intend to liquidate the company or to cease operations, or have no realistic alternative but to do so.
Auditor’s Responsibilities for the Audit of the Financial Statements
Our objectives are to obtain reasonable assurance about whether the financial statements as a whole are free from material misstatement, whether due to fraud or error, and to issue an auditor’s report that includes our opinion. Reasonable assurance is a high level of assurance, but is not a guarantee that an audit conducted in accordance with ISAs will always detect a material misstatement when it exists. Misstatements can arise from fraud or error and are considered material if, individually or in the aggregate, they could reasonably be expected to influence the economic decisions of users taken on the basis of these financial statements.
As part of an audit in accordance with ISAs, we exercise professional judgment and maintain professional skepticism throughout the audit. We also:
• Identify and assess the risks of material misstatement of the financial statements, whether due to fraud or error, design and perform audit procedures responsive to those risks, and obtain audit evidence that is sufficient and appropriate to provide a basis for our opinion. The risk of not detecting a material misstatement resulting from fraud is higher than for one resulting from error, as fraud may involve collusion, forgery, intentional omissions, misrepresentations, or the override of internal control. • Obtain an understanding of internal control relevant to the audit in order to design audit procedures that are appropriate in the circumstances, but not for the purpose of expressing an opinion on the effectiveness of the Company’s internal control. • Evaluate the appropriateness of accounting policies used and the reasonableness of accounting estimates and related disclosures made by the directors. • Conclude on the appropriateness of the directors’ use of the going concern basis of accounting and based on the audit evidence obtained, whether a material uncertainty exists related to events or conditions that may cast significant doubt on the Company’s ability to continue as a going concern. If we conclude that a material uncertainty exists, we are required to draw attention in our auditor’s report to the related disclosures in the financial statements or, if such disclosures are inadequate, to modify our opinion. Our conclusions are based on the audit evidence obtained up to the date of our auditor’s report. However, future events or conditions may cause the Company to cease to continue as a going concern. • Evaluate the overall presentation, structure and content of the financial statements, including the disclosures, and whether the financial statements represent the underlying transactions and events in a manner that achieves fair presentation.
We communicate with the directors regarding, among other matters, the planned scope and timing of the audit and significant audit findings, including any significant deficiencies in internal control that we identify during our audit.
Report on Other Legal and Regulatory Requirements
As required by the Companies Act of Uganda we report to you, based on our audit, that:
i. We have obtained all the information and explanations, which to the best of our knowledge and belief were necessary for the purpose of our audit; ii. In our opinion, proper books of account have been kept by the Company, so far as appears from our examination of those books; and iii. The statements of financial position and comprehensive income are in agreement with the books of account.
The engagement partner on the audit resulting in this independent auditors’ report is CPA - Asad Lukwago-P0365
KPMG Certified Public Accountants3rd Floor, Rwenzori Courts Plot 2 & 4A, Nakasero RoadP.O. Box 3509Kampala, Uganda
Date: ………………………....2017
REPORT OF THE INDEPENDENT AUDITORS TO THE MEMBERS OF
BRAC MICROFINANCE UGANDA LIMITED
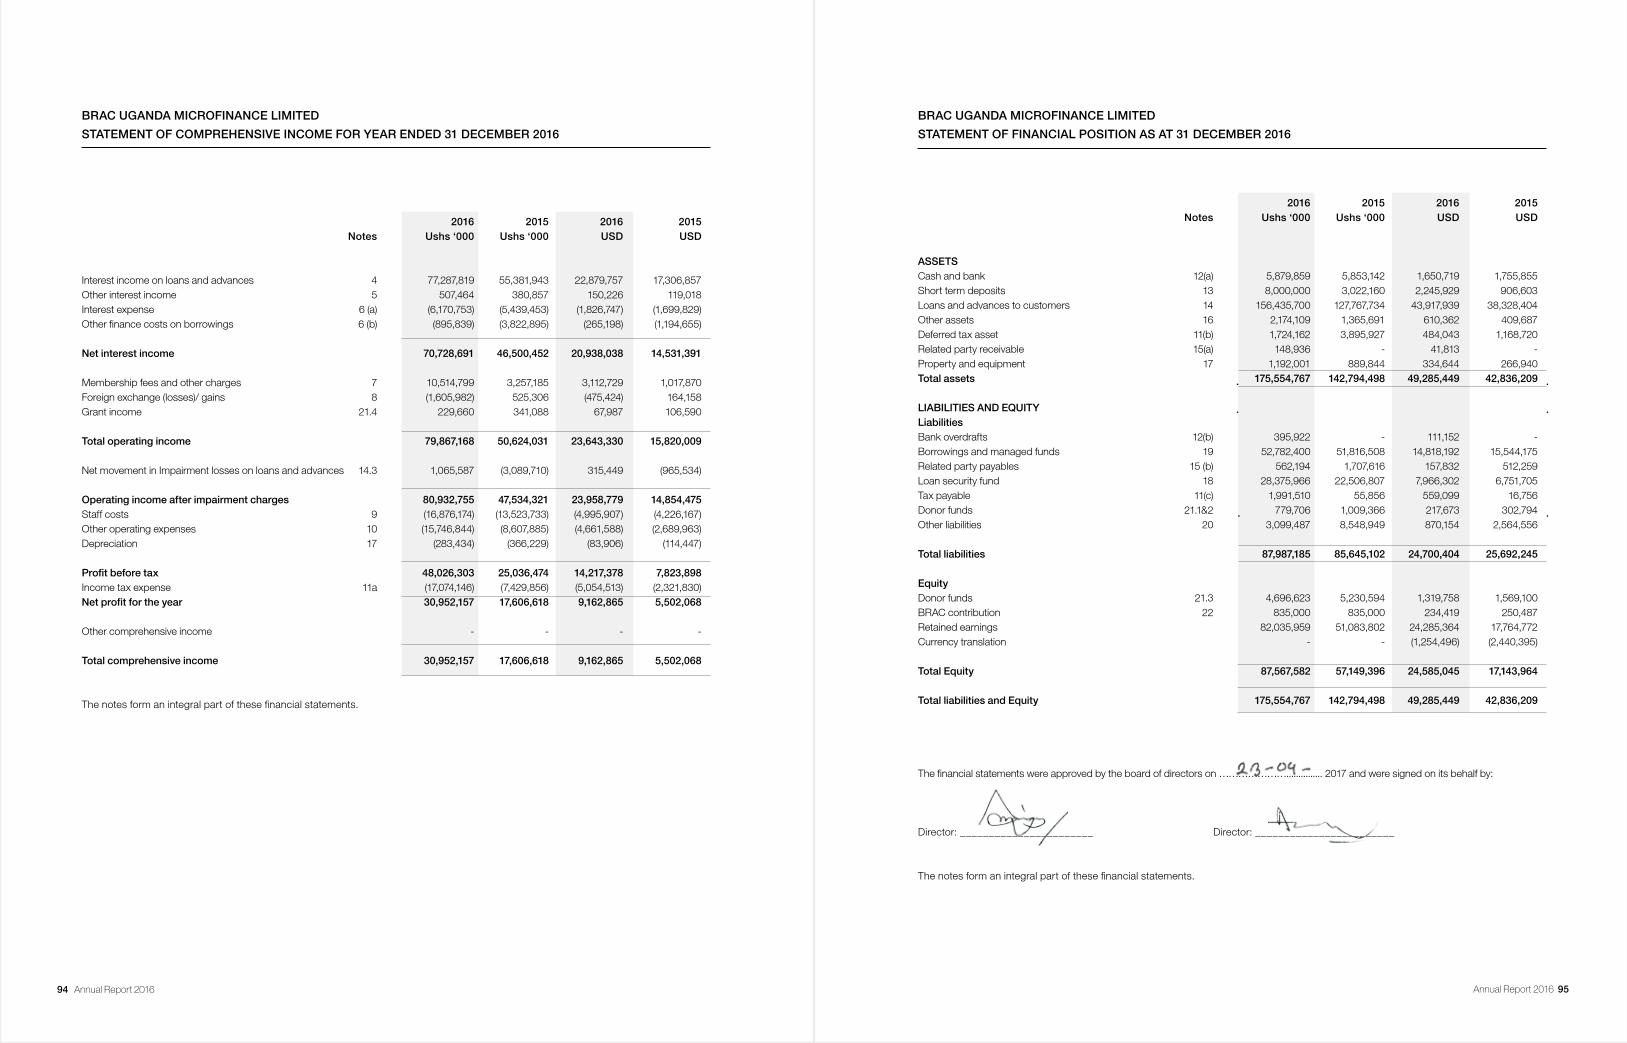
94 Annual Report 2016 Annual Report 2016 95
BRAC UGANDA MICROFINANCE LIMITED
STATEMENT OF COMPREHENSIVE INCOME FOR YEAR ENDED 31 DECEMBER 2016
2016 2015 2016 2015 Notes Ushs ‘000 Ushs ‘000 USD USD
Interest income on loans and advances 4 77,287,819 55,381,943 22,879,757 17,306,857Other interest income 5 507,464 380,857 150,226 119,018Interest expense 6 (a) (6,170,753) (5,439,453) (1,826,747) (1,699,829)Other finance costs on borrowings 6 (b) (895,839) (3,822,895) (265,198) (1,194,655)
Net interest income 70,728,691 46,500,452 20,938,038 14,531,391
Membership fees and other charges 7 10,514,799 3,257,185 3,112,729 1,017,870Foreign exchange (losses)/ gains 8 (1,605,982) 525,306 (475,424) 164,158Grant income 21.4 229,660 341,088 67,987 106,590
Total operating income 79,867,168 50,624,031 23,643,330 15,820,009
Net movement in Impairment losses on loans and advances 14.3 1,065,587 (3,089,710) 315,449 (965,534)
Operating income after impairment charges 80,932,755 47,534,321 23,958,779 14,854,475Staff costs 9 (16,876,174) (13,523,733) (4,995,907) (4,226,167)Other operating expenses 10 (15,746,844) (8,607,885) (4,661,588) (2,689,963)Depreciation 17 (283,434) (366,229) (83,906) (114,447)
Profitbeforetax 48,026,303 25,036,474 14,217,378 7,823,898Income tax expense 11a (17,074,146) (7,429,856) (5,054,513) (2,321,830)Netprofitfortheyear 30,952,157 17,606,618 9,162,865 5,502,068
Other comprehensive income - - - -
Total comprehensive income 30,952,157 17,606,618 9,162,865 5,502,068
The notes form an integral part of these financial statements.
2016 2015 2016 2015 Notes Ushs ‘000 Ushs ‘000 USD USD
ASSETS Cash and bank 12(a) 5,879,859 5,853,142 1,650,719 1,755,855Short term deposits 13 8,000,000 3,022,160 2,245,929 906,603Loans and advances to customers 14 156,435,700 127,767,734 43,917,939 38,328,404Other assets 16 2,174,109 1,365,691 610,362 409,687Deferred tax asset 11(b) 1,724,162 3,895,927 484,043 1,168,720Related party receivable 15(a) 148,936 - 41,813 -Property and equipment 17 1,192,001 889,844 334,644 266,940Total assets 175,554,767 142,794,498 49,285,449 42,836,209 LIABILITIES AND EQUITY Liabilities Bank overdrafts 12(b) 395,922 - 111,152 -Borrowings and managed funds 19 52,782,400 51,816,508 14,818,192 15,544,175Related party payables 15 (b) 562,194 1,707,616 157,832 512,259Loan security fund 18 28,375,966 22,506,807 7,966,302 6,751,705Tax payable 11(c) 1,991,510 55,856 559,099 16,756Donor funds 21.1&2 779,706 1,009,366 217,673 302,794Other liabilities 20 3,099,487 8,548,949 870,154 2,564,556 Total liabilities 87,987,185 85,645,102 24,700,404 25,692,245 Equity Donor funds 21.3 4,696,623 5,230,594 1,319,758 1,569,100BRAC contribution 22 835,000 835,000 234,419 250,487Retained earnings 82,035,959 51,083,802 24,285,364 17,764,772Currency translation - - (1,254,496) (2,440,395)
Total Equity 87,567,582 57,149,396 24,585,045 17,143,964
Total liabilities and Equity 175,554,767 142,794,498 49,285,449 42,836,209
The financial statements were approved by the board of directors on …………………............... 2017 and were signed on its behalf by:
Director: _______________________ Director: ________________________
The notes form an integral part of these financial statements.
BRAC UGANDA MICROFINANCE LIMITED
STATEMENT OF FINANCIAL POSITION AS AT 31 DECEMBER 2016
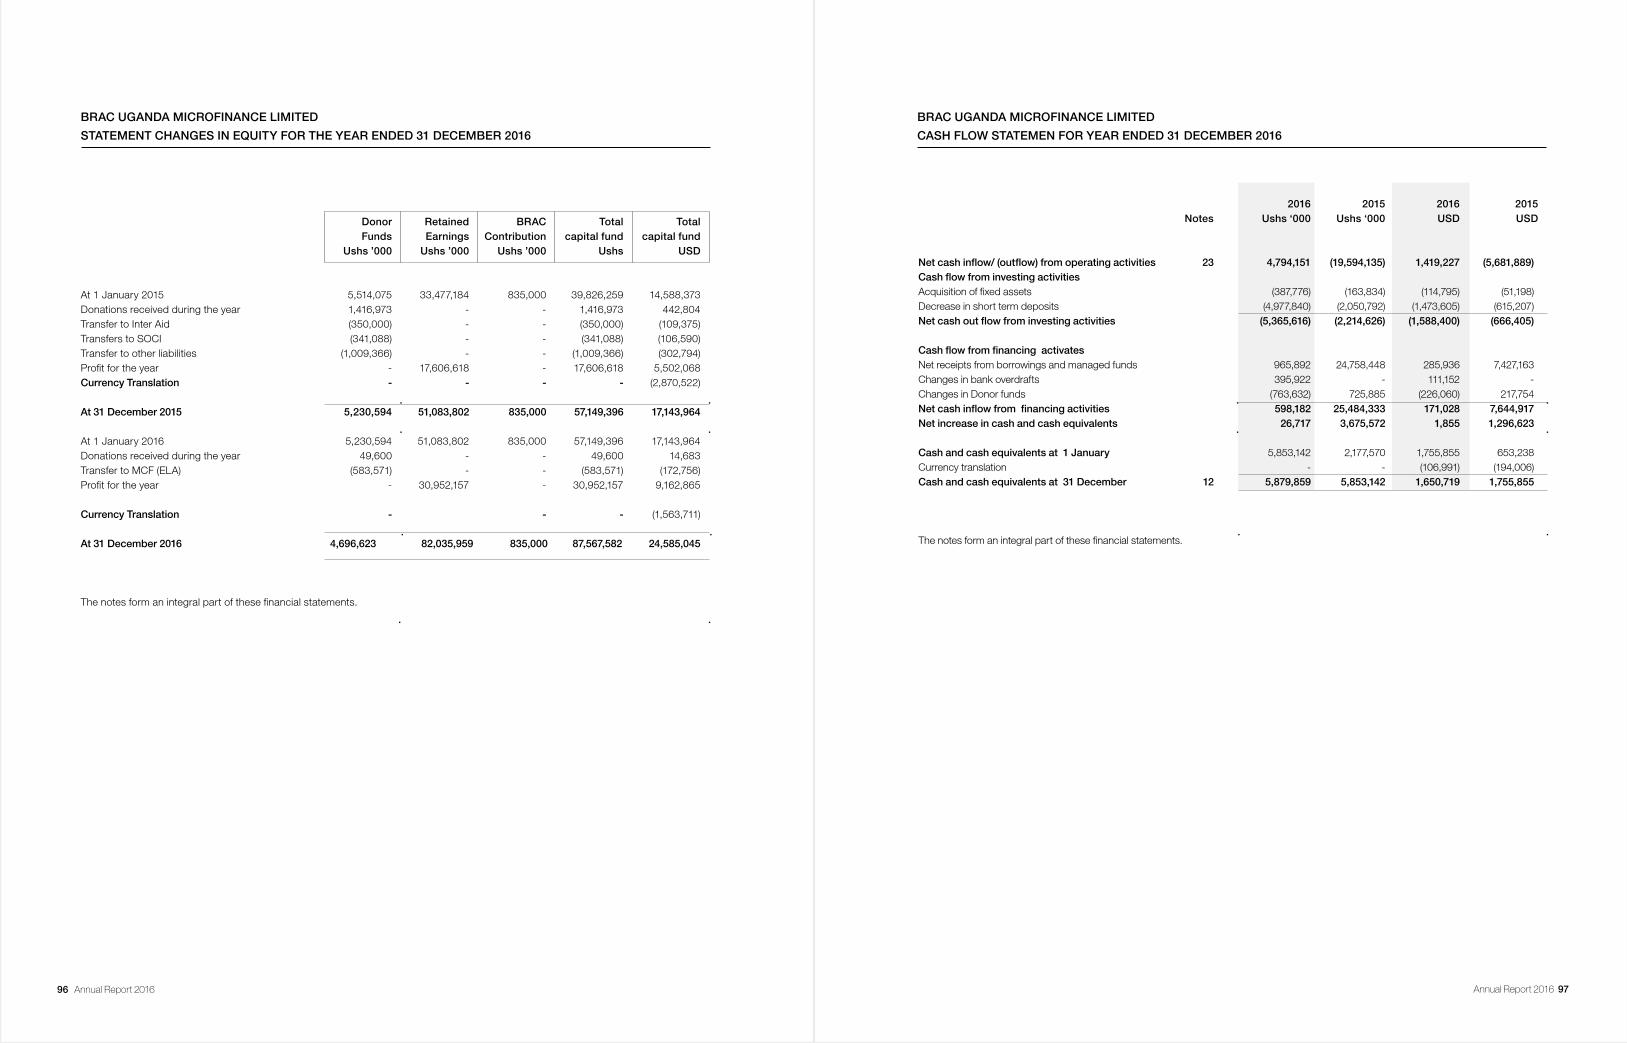
96 Annual Report 2016 Annual Report 2016 97
Donor Retained BRAC Total Total Funds Earnings Contribution capital fund capital fund Ushs ’000 Ushs ’000 Ushs ’000 Ushs USD
At 1 January 2015 5,514,075 33,477,184 835,000 39,826,259 14,588,373Donations received during the year 1,416,973 - - 1,416,973 442,804Transfer to Inter Aid (350,000) - - (350,000) (109,375)Transfers to SOCI (341,088) - - (341,088) (106,590)Transfer to other liabilities (1,009,366) - - (1,009,366) (302,794)Profit for the year - 17,606,618 - 17,606,618 5,502,068Currency Translation - - - - (2,870,522)
At 31 December 2015 5,230,594 51,083,802 835,000 57,149,396 17,143,964 At 1 January 2016 5,230,594 51,083,802 835,000 57,149,396 17,143,964Donations received during the year 49,600 - - 49,600 14,683Transfer to MCF (ELA) (583,571) - - (583,571) (172,756)Profit for the year - 30,952,157 - 30,952,157 9,162,865
Currency Translation - - - (1,563,711)
At 31 December 2016 4,696,623 82,035,959 835,000 87,567,582 24,585,045
The notes form an integral part of these financial statements.
BRAC UGANDA MICROFINANCE LIMITED
STATEMENT CHANGES IN EQUITY FOR THE YEAR ENDED 31 DECEMBER 2016
BRAC UGANDA MICROFINANCE LIMITED
CASH FLOW STATEMEN FOR YEAR ENDED 31 DECEMBER 2016
2016 2015 2016 2015 Notes Ushs ‘000 Ushs ‘000 USD USD
Netcashinflow/(outflow)fromoperatingactivities 23 4,794,151 (19,594,135) 1,419,227 (5,681,889)Cashflowfrominvestingactivities Acquisition of fixed assets (387,776) (163,834) (114,795) (51,198)Decrease in short term deposits (4,977,840) (2,050,792) (1,473,605) (615,207)Netcashoutflowfrominvestingactivities (5,365,616) (2,214,626) (1,588,400) (666,405)
Cashflowfromfinancingactivates Net receipts from borrowings and managed funds 965,892 24,758,448 285,936 7,427,163Changes in bank overdrafts 395,922 - 111,152 -Changes in Donor funds (763,632) 725,885 (226,060) 217,754Netcashinflowfromfinancingactivities 598,182 25,484,333 171,028 7,644,917Net increase in cash and cash equivalents 26,717 3,675,572 1,855 1,296,623 Cash and cash equivalents at 1 January 5,853,142 2,177,570 1,755,855 653,238Currency translation - - (106,991) (194,006)Cash and cash equivalents at 31 December 12 5,879,859 5,853,142 1,650,719 1,755,855
The notes form an integral part of these financial statements.
98 Annual Report 2016 Annual Report 2016 99
BRAC UGANDA MICROFINANCE LIMITED
NOTES TO THR FINANCIAL STATEMENTS REPORT FOR YEAR ENDED 31 DECEMBER 2016
1. THE REPORTING ENTITY
BRAC Uganda Microfinance Limited got incorporated as a company limited by guarantee on 27th August 2008 as an independent company. The company prior to incorporation was a component of BRAC Uganda which was first incorporated as BRAC Foundation in January 2006 and it commenced business in June 2006. In March 2007, the name was changed to BRAC through the registry of Companies. Later the Microfinance and Non Microfinance Programs got incorporated as independent companies in August 2008 and September 2010 respectively.
BRAC begun its work in Uganda in June 2006, it chose to work in Uganda because of the opportunities to make a significant difference in a post-conflict country with high poverty and fertility rates as well as demonstrate the potential of its “microfinance multiplied” approach to other in the microfinance industry in Africa.
On 30th September 2010, at a duly convened meeting of the Governing Board, BRAC transferred all Assets and Liabilities that relate to or are in any way connected with the Microfinance activity it has been operating in Uganda to BRAC Uganda microfinance limited.
BRAC Uganda Microfinance Limited’s vision is in line with the vision for BRAC Bangladesh that they develop into a just, enlightened, healthy and democratic society free from hunger, poverty, environmental degradation and all forms of exploitation based on age, sex and ethnicity. In order to achieve this vision, BRAC uses a comprehensive approach to poverty reduction which strategically links programs in Economic Development (Microfinance), Health, Education and social Development, Human Rights and Services to create and protect the livelihoods of poor people.
BRAC’s business model strongly reflects its philosophy, the core elements of the business model are BRAC’s community outreach –based delivery methodology and its unwavering focus on borrowers at the poorer end of the poverty spectrum. These two principles – which distinguish BRAC Uganda Microfinance Limited from other microfinance operators in Africa, are apparent in the way BRAC has designed its operations.
2. BASIS OF PREPARATION
The financial statements have been prepared in accordance with and comply with International Financial Reporting Standards (IFRS) and the requirements of the Ugandan Companies Act.
(i) Basis of measurement The financial statements are prepared under the historical cost convention, except for the fair valuation of certain financial instruments.
(ii) Basis of preparation
The Financial statements have been prepared in accordance with and comply with International Financial reporting Standards (IFRS).
(ii) Functional and presentation currency These financial statements are presented in thousands of Uganda shillings (Ushs ‘000), which is the entity’s functional currency.
The financial statements include figures, which have been translated from Uganda Shillings (Ushs) to United States Dollars (US $) at the year-end rate of US $1 = Ushs 3,562 for balance sheet items and US $ = Ushs 3,378 for income statements balances. Foreign exchange differences are transferred to equity. These figures are for memorandum purposes only and do not form part of the audited financial statements.
3. SIGNIFICANT ACCOUNTING POLICIES
(i) Use of estimates and judgment The preparation of the financial statements is in conformity with IFRS which requires management to make judgments, estimates and
assumptions that affect the application of policies and the reported amounts of assets and liabilities, income and expenses. The estimates and associated assumptions are based on historical experience and various other factors that are believed to be reasonable under the circumstances, the results of which form the basis of making judgments about carrying values of assets and liabilities that are not apparent from other sources.
Actual results may differ from these estimates. The estimates and underlying assumptions are reviewed on an ongoing basis. Revisions to
BRAC UGANDA MICROFINANCE LIMITED
NOTES TO THR FINANCIAL STATEMENTS REPORT FOR YEAR ENDED 31 DECEMBER 2016 CONTINUED
accounting estimates are recognized in the period in which the estimates are revised if the revision affects only that period or in the period of the revision and the future periods if the revision affects both current and future periods. In particular, information about significant areas of estimation, uncertainty and critical judgment in applying accounting policies that have the most significant effect on the amounts recognized in the financial statements are described in note 27.
a) Property and equipment
(i) Recognition and Measurement Property and equipment are stated at cost less accumulated depreciation and impairment losses. Cost includes expenditures that are directly
attributable to the acquisition of the asset.
The cost of self-constructed assets includes the cost of materials and direct labour, any other costs directly attributable to bringing the asset to a working condition for its intended use, and the costs of dismantling and removing the items and restoring the site on which they are located. Purchased software that is integral to the functionality of the related equipment is capitalised as part of that equipment.
Gains and losses on disposal of an item of property and equipment are determined by comparing the proceeds from disposal with the carrying value of property and equipment and recognized net with other income in profit or loss.
(ii) Depreciation
Depreciation is recognized in profit or loss and calculated to write off the cost of the property and equipment on a straight basis over the expected useful lives of the assets concerned, and intangible assets on a straight line basis. Land is not depreciated
The estimated depreciation rates for the current and comparative periods are as follows: - Percentage Motor vehicles, motor cycles and bicycles 20% Furniture and Fixtures 10% Equipment 15%
Management and directors review the depreciation methods, residual value and useful life of an asset at the year end and any change considered to be appropriate in accounting estimate is recorded through the income statement.
Gains and losses on disposals are determined by comparing proceeds with carrying amounts and are included in the operating result for the reporting period.
b) Foreign currency transactions
Transactions in foreign currencies are translated to Ugandan Shilling at the foreign exchange rate ruling at the date of the transaction. Monetary assets and liabilities denominated in foreign currencies at the balance sheet date are translated to Ugandan Shilling at the foreign exchange rate applicable for settlement. The foreign currency gain or loss on the monetary items is the difference between amortized cost in the functional currency at the beginning of the period, adjusted for the effective interest and payments during the period, and the amortized cost in the foreign currency translated at the exchange rate at the end of the period. Non-monetary assets and liabilities denominated in foreign currencies, which are stated at historical cost, are translated to Ugandan Shilling at the foreign exchange rate ruling at the date of transaction. Non-monetary assets and liabilities denominated in foreign currencies that are stated at fair value are translated to Ugandan Shilling at foreign exchange rates ruling at the dates the fair values were determined. Foreign exchange differences arising on translation are recognized in the income statement.
c) Advances to customers
Loans and advances are non-derivative financial assets with fixed or determinable payments that are not quoted in an active market and that the company does not intend to sell immediately or in the near term. Loans and advances are shown at the gross amount adjusted for any provision for impairment losses.
Loans originated by the company by providing finance directly to borrowers is categorized as loans to group members and is carried at
100 Annual Report 2016 Annual Report 2016 101
BRAC UGANDA MICROFINANCE LIMITED
NOTES TO THR FINANCIAL STATEMENTS REPORT FOR YEAR ENDED 31 DECEMBER 2016 CONTINUED
amortized cost, which is defined as fair value of the cash consideration given to originate those loans as is determinable by reference to market prices at origination date and subsequently measured at the original effective interest rate at reporting date. All loans and advances are recognized when cash is advanced to borrowers.
Loans and advances are initially measured at fair value plus incremental direct transaction costs, and subsequently measured at their amortized cost using the effective interest method.
d) Impairment
(i) Financial assets At each statement of financial position date BRAC Uganda Microfinance Limited assesses whether there is objective evidence that financial
assets not carried at fair value through profit or loss are impaired. Financial assets are impaired when objective evidence demonstrates that a loss event has occurred after the initial recognition of the asset, and that the loss event has an impact on the future cash flows of the asset that can be estimated reliably.
Objective evidence that financial assets are impaired can include default or delinquency by a borrower, restructuring of a loan or advance by the company on terms that the company would not otherwise consider, indications that a borrower or issuer will enter bankruptcy, or other observable data relating to a group of assets such as adverse changes in the payment status of borrowers or issuers in the Company, or economic conditions that correlate with defaults in the company.
Management regularly assesses the adequacy of allowance for impairment based on the age of the loan portfolio.
The Company considers evidence of impairment for loans and advances at both a specific asset and collective level. All individually significant loans and advances are assessed for specific impairment. All individually significant loans and advances found not to be specifically impaired are then collectively assessed for any impairment that has been incurred but not yet identified. Loans and advances that are not individually significant are collectively assessed for impairment by grouping together loans and advances with similar risk characteristics.
The Company estimates losses on loans and advances as follows:
1. Given the volume and value of individual loans and advances and the fact that they are unsecured, it is not practical to estimate the future cash flows in order to derive the net present value for purpose of impairment. For this reason therefore, industry practice is used to estimate the specific provision for loans and advances. Specific provision for the loans and advances considered to be non-performing(impaired) based on the criteria below, and classification of such loans and advances, as follows:
1-30 days 2% 31-90 days 20% 91-180 days 20% 181-365days 50% 366 days and above past due 100%
In addition to the specific loan provisions, a general provision of 2% on current loans has been provided which was derived based on the company’s historic loss ratio. Loans within the maturity period are considered “Current Loans”. Loans which remain outstanding after the expiry of their maturity period are considered as “Late Loans”. Late loans which remain unpaid after one year of being classified as “Late Loans” are considered as “Non – Interest bearing loans (NIBL)” and are referred to the Board for write-off. Apart from that, any loans can be written off subject to the approval of the board where the board thinks that they are not realizable due to death, dislocation of the borrower or any other natural or humanitarian disaster that affects the livelihood of the borrowers. Subsequently recoveries are credited as income in the statement of comprehensive income.
When a loan is deemed uncollectible, it is written off against the related provision for impairment. Subsequent recoveries are credited to other income in the statement of comprehensive income.
2. Portfolio provision is derived based on the company’s historical loss ratio. The Loss ratio is determined as an average for the past 3 years. In assessing collective impairment the company uses statistical modeling of historical trends of the probability of default, timing of recoveries
and the amount of loss incurred, adjusted for management’s judgment as to whether current economic and credit conditions are such that the
BRAC UGANDA MICROFINANCE LIMITED
NOTES TO THR FINANCIAL STATEMENTS REPORT FOR YEAR ENDED 31 DECEMBER 2016 CONTINUED
actual losses are likely to be greater or less than suggested by historical modeling. Default rates, loss rates and the expected timing of future recoveries are regularly benchmarked against actual outcomes to ensure that they remain appropriate.
Impairment losses on financial assets carried at amortized cost are measured as the difference between the carrying amount of the financial asset and the present value of estimated future cash flows discounted at the asset’s original effective interest rate. Losses are recognized in profit or loss and reflected in an allowance account against loans and advances. When a subsequent event causes the amount of impairment loss to decrease, the decrease in impairment loss is reversed through profit or loss.
(ii) Non-financialassets The carrying amounts of BRAC Uganda Microfinance Limited’s non-financial assets are reviewed at each balance sheet date to determine
whether there is any indication of impairment. If such condition exists, the assets’ recoverable amount is estimated and an impairment loss recognized in the income statement whenever the carrying amount of an asset exceeds its recoverable amount.
An impairment loss is reversed if there has been a change in the estimates used to determine the recoverable amount. An impairment loss is reversed only to the extent that the assets carrying amount that would have been determined net of depreciation or amortization if no impairment loss was recognized.
(e) Other Assets
Other assets comprise of prepayments, deposits and other recoverable which arise during the normal course of business; they are carried at original invoice amount less provision made for impairment losses. A provision for impairment of trade receivable is established when there is objective evidence that the Fund will not be able to collect all amounts due according to the original terms of receivables. The amount of the provisions is the difference between the carrying amount and the recoverable amount.
(f) Cash and cash equivalents
For the purposes of the cash flow statement, cash and cash equivalents comprise balances with less than 90 days maturity from the balance sheet date and include: cash in hand, deposits held at call with bank’s, net of bank overdraft facilities subject to sweeping arrangements
Investments with a longer maturity at acquisition do not become cash equivalents once their remaining maturity period falls to three months.
(g) Provisions and Other liabilities
A provision is recognized if, as a result of a past event, BRAC Uganda Microfinance Limited has a present legal or constructive obligation that can be estimated reliably, and it is probable that an outflow of economic benefits will be required to settle the obligation.
Other accounts payable are carried at cost, which is the fair value of the consideration to be paid in the future for goods and services received.
(h) Income tax
Current income tax is the expected tax payable on taxable income for the year, using tax rates enacted at the balance sheet date. Management periodically evaluates positions taken in tax returns with respect to situations in which applicable tax regulations are subject to interpretation and establishes provisions where appropriate on the basis of amounts expected to be paid to the tax authorities.
(i) Revenue recognition Revenue is recognized on an accruals basis.
(i) Interest income on Loans and Advances
Interest income on Loans and advances (Service charges) on regular loans that is, loans where no amounts are overdue as at the end of the reporting period are recognized on an accrual basis as income. The recognition of service charges ceases when the loan is transferred to non-interest bearing loan. These loans are referred to as “non-performing” loans.
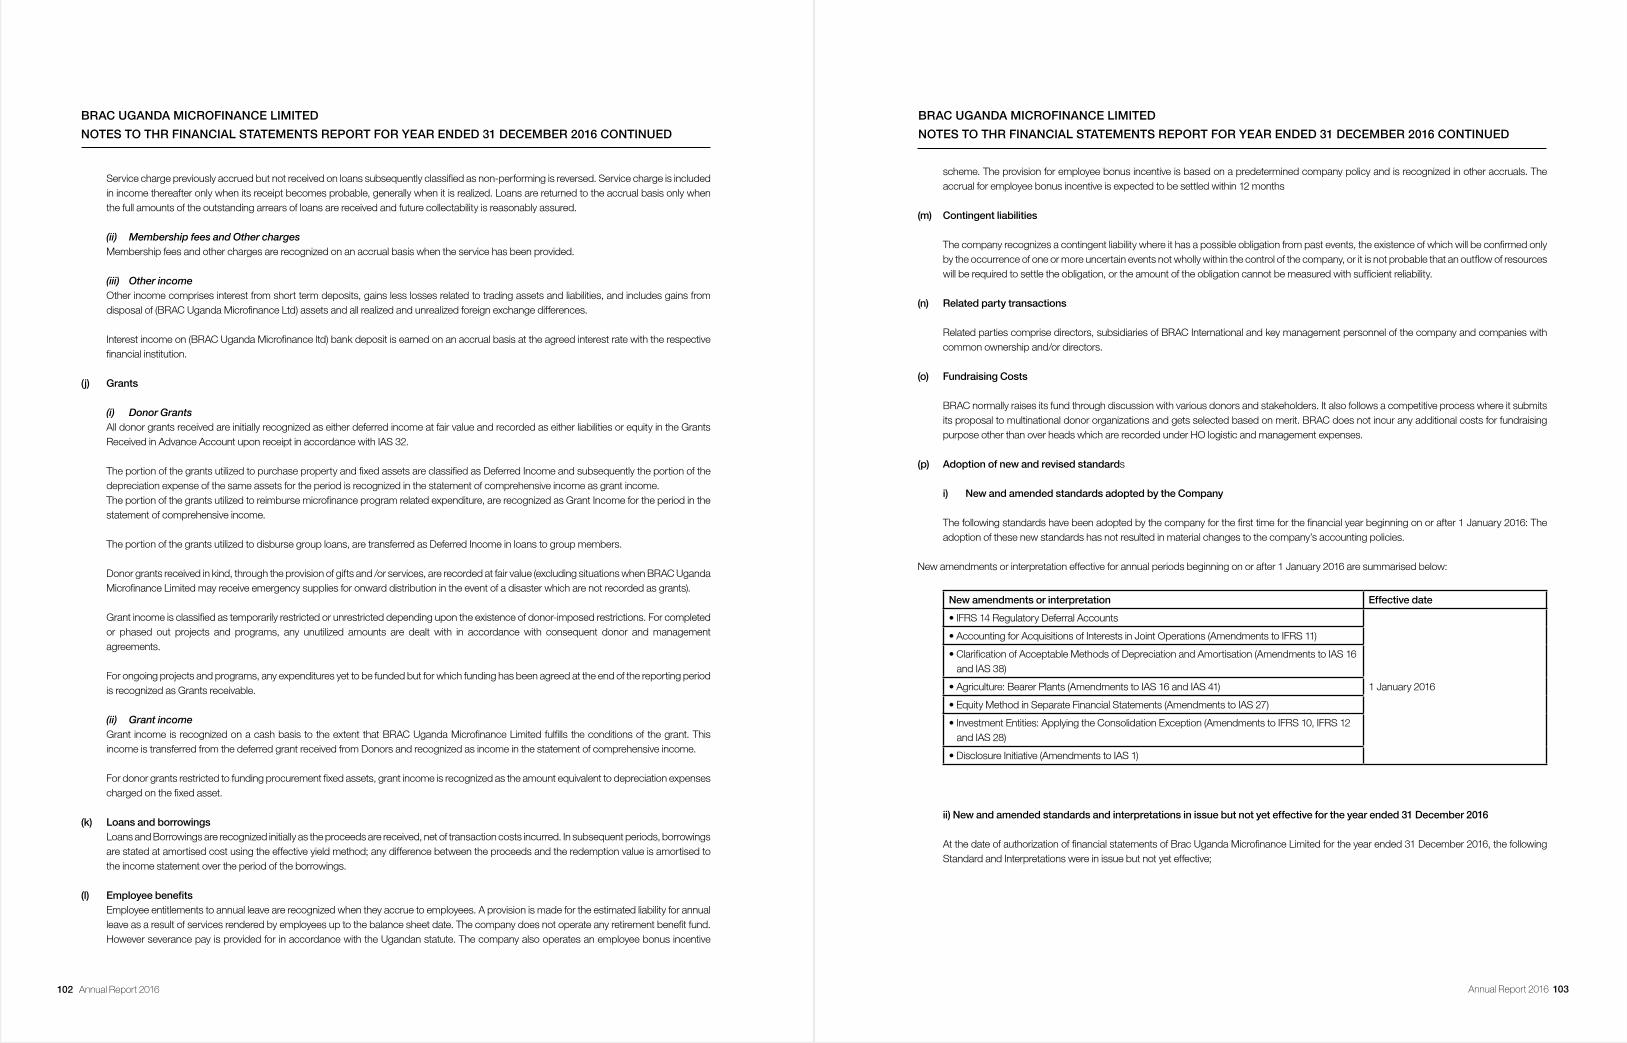
102 Annual Report 2016 Annual Report 2016 103
BRAC UGANDA MICROFINANCE LIMITED
NOTES TO THR FINANCIAL STATEMENTS REPORT FOR YEAR ENDED 31 DECEMBER 2016 CONTINUED
Service charge previously accrued but not received on loans subsequently classified as non-performing is reversed. Service charge is included in income thereafter only when its receipt becomes probable, generally when it is realized. Loans are returned to the accrual basis only when the full amounts of the outstanding arrears of loans are received and future collectability is reasonably assured.
(ii) Membership fees and Other charges
Membership fees and other charges are recognized on an accrual basis when the service has been provided.
(iii) Other income
Other income comprises interest from short term deposits, gains less losses related to trading assets and liabilities, and includes gains from disposal of (BRAC Uganda Microfinance Ltd) assets and all realized and unrealized foreign exchange differences.
Interest income on (BRAC Uganda Microfinance ltd) bank deposit is earned on an accrual basis at the agreed interest rate with the respective financial institution.
(j) Grants
(i) Donor Grants
All donor grants received are initially recognized as either deferred income at fair value and recorded as either liabilities or equity in the Grants Received in Advance Account upon receipt in accordance with IAS 32.
The portion of the grants utilized to purchase property and fixed assets are classified as Deferred Income and subsequently the portion of the depreciation expense of the same assets for the period is recognized in the statement of comprehensive income as grant income.
The portion of the grants utilized to reimburse microfinance program related expenditure, are recognized as Grant Income for the period in the statement of comprehensive income.
The portion of the grants utilized to disburse group loans, are transferred as Deferred Income in loans to group members.
Donor grants received in kind, through the provision of gifts and /or services, are recorded at fair value (excluding situations when BRAC Uganda Microfinance Limited may receive emergency supplies for onward distribution in the event of a disaster which are not recorded as grants).
Grant income is classified as temporarily restricted or unrestricted depending upon the existence of donor-imposed restrictions. For completed or phased out projects and programs, any unutilized amounts are dealt with in accordance with consequent donor and management agreements.
For ongoing projects and programs, any expenditures yet to be funded but for which funding has been agreed at the end of the reporting period is recognized as Grants receivable.
(ii) Grant income
Grant income is recognized on a cash basis to the extent that BRAC Uganda Microfinance Limited fulfills the conditions of the grant. This income is transferred from the deferred grant received from Donors and recognized as income in the statement of comprehensive income.
For donor grants restricted to funding procurement fixed assets, grant income is recognized as the amount equivalent to depreciation expenses charged on the fixed asset.
(k) Loansandborrowings Loans and Borrowings are recognized initially as the proceeds are received, net of transaction costs incurred. In subsequent periods, borrowings
are stated at amortised cost using the effective yield method; any difference between the proceeds and the redemption value is amortised to the income statement over the period of the borrowings.
(l) Employeebenefits Employee entitlements to annual leave are recognized when they accrue to employees. A provision is made for the estimated liability for annual
leave as a result of services rendered by employees up to the balance sheet date. The company does not operate any retirement benefit fund. However severance pay is provided for in accordance with the Ugandan statute. The company also operates an employee bonus incentive
scheme. The provision for employee bonus incentive is based on a predetermined company policy and is recognized in other accruals. The accrual for employee bonus incentive is expected to be settled within 12 months
(m) Contingent liabilities
The company recognizes a contingent liability where it has a possible obligation from past events, the existence of which will be confirmed only by the occurrence of one or more uncertain events not wholly within the control of the company, or it is not probable that an outflow of resources will be required to settle the obligation, or the amount of the obligation cannot be measured with sufficient reliability.
(n) Related party transactions Related parties comprise directors, subsidiaries of BRAC International and key management personnel of the company and companies with
common ownership and/or directors.
(o) Fundraising Costs
BRAC normally raises its fund through discussion with various donors and stakeholders. It also follows a competitive process where it submits its proposal to multinational donor organizations and gets selected based on merit. BRAC does not incur any additional costs for fundraising purpose other than over heads which are recorded under HO logistic and management expenses.
(p) Adoptionofnewandrevisedstandards
i) NewandamendedstandardsadoptedbytheCompany
The following standards have been adopted by the company for the first time for the financial year beginning on or after 1 January 2016: The adoption of these new standards has not resulted in material changes to the company’s accounting policies.
New amendments or interpretation effective for annual periods beginning on or after 1 January 2016 are summarised below:
Newamendmentsorinterpretation Effective date
• IFRS 14 Regulatory Deferral Accounts
1 January 2016
• Accounting for Acquisitions of Interests in Joint Operations (Amendments to IFRS 11)
• Clarification of Acceptable Methods of Depreciation and Amortisation (Amendments to IAS 16 and IAS 38)
• Agriculture: Bearer Plants (Amendments to IAS 16 and IAS 41)
• Equity Method in Separate Financial Statements (Amendments to IAS 27)
• Investment Entities: Applying the Consolidation Exception (Amendments to IFRS 10, IFRS 12 and IAS 28)
• Disclosure Initiative (Amendments to IAS 1)
ii)Newandamendedstandardsandinterpretationsinissuebutnotyeteffectivefortheyearended31December2016
At the date of authorization of financial statements of Brac Uganda Microfinance Limited for the year ended 31 December 2016, the following Standard and Interpretations were in issue but not yet effective;
BRAC UGANDA MICROFINANCE LIMITED
NOTES TO THR FINANCIAL STATEMENTS REPORT FOR YEAR ENDED 31 DECEMBER 2016 CONTINUED
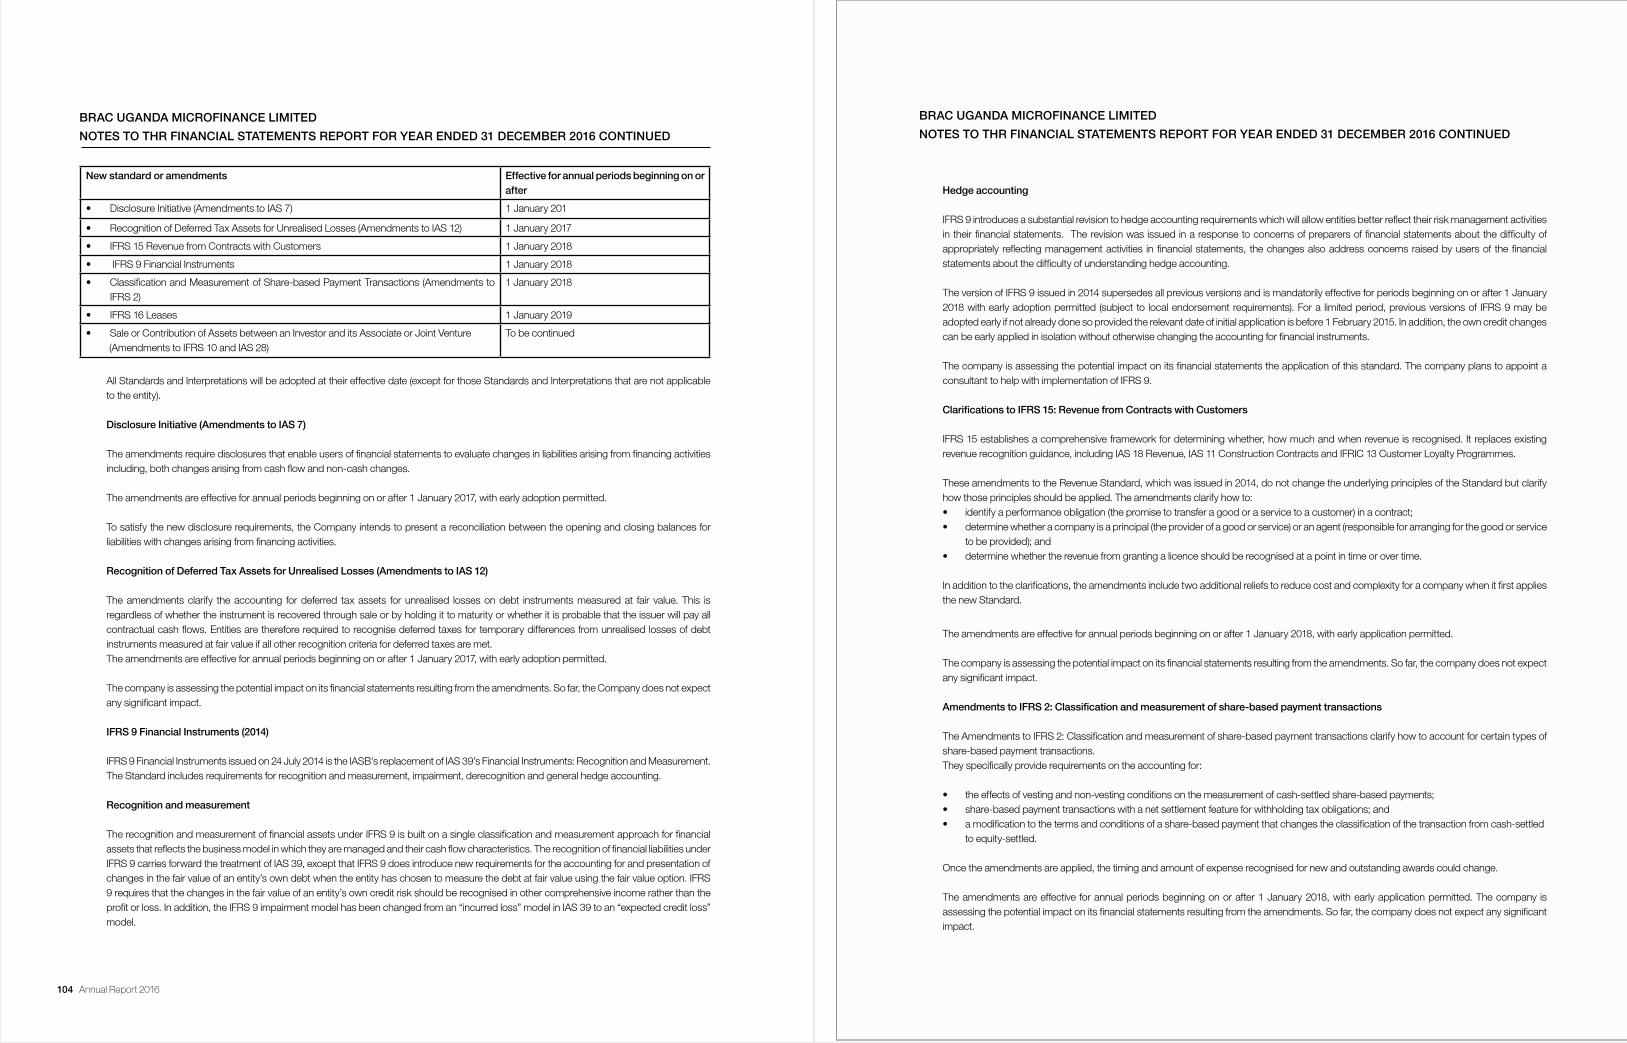
104 Annual Report 2016 Annual Report 2016 105
BRAC UGANDA MICROFINANCE LIMITED
NOTES TO THR FINANCIAL STATEMENTS REPORT FOR YEAR ENDED 31 DECEMBER 2016 CONTINUED
Newstandardoramendments Effective for annual periods beginning on orafter
• Disclosure Initiative (Amendments to IAS 7) 1 January 201
• Recognition of Deferred Tax Assets for Unrealised Losses (Amendments to IAS 12) 1 January 2017
• IFRS 15 Revenue from Contracts with Customers 1 January 2018
• IFRS 9 Financial Instruments 1 January 2018
• Classification and Measurement of Share-based Payment Transactions (Amendments to IFRS 2)
1 January 2018
• IFRS 16 Leases 1 January 2019
• Sale or Contribution of Assets between an Investor and its Associate or Joint Venture (Amendments to IFRS 10 and IAS 28)
To be continued
All Standards and Interpretations will be adopted at their effective date (except for those Standards and Interpretations that are not applicable to the entity).
Disclosure Initiative (Amendments to IAS 7)
The amendments require disclosures that enable users of financial statements to evaluate changes in liabilities arising from financing activities including, both changes arising from cash flow and non-cash changes.
The amendments are effective for annual periods beginning on or after 1 January 2017, with early adoption permitted.
To satisfy the new disclosure requirements, the Company intends to present a reconciliation between the opening and closing balances for liabilities with changes arising from financing activities.
Recognition of Deferred Tax Assets for Unrealised Losses (Amendments to IAS 12)
The amendments clarify the accounting for deferred tax assets for unrealised losses on debt instruments measured at fair value. This is regardless of whether the instrument is recovered through sale or by holding it to maturity or whether it is probable that the issuer will pay all contractual cash flows. Entities are therefore required to recognise deferred taxes for temporary differences from unrealised losses of debt instruments measured at fair value if all other recognition criteria for deferred taxes are met.
The amendments are effective for annual periods beginning on or after 1 January 2017, with early adoption permitted.
The company is assessing the potential impact on its financial statements resulting from the amendments. So far, the Company does not expect any significant impact.
IFRS 9 Financial Instruments (2014)
IFRS 9 Financial Instruments issued on 24 July 2014 is the IASB's replacement of IAS 39’s Financial Instruments: Recognition and Measurement. The Standard includes requirements for recognition and measurement, impairment, derecognition and general hedge accounting.
Recognition and measurement
The recognition and measurement of financial assets under IFRS 9 is built on a single classification and measurement approach for financial assets that reflects the business model in which they are managed and their cash flow characteristics. The recognition of financial liabilities under IFRS 9 carries forward the treatment of IAS 39, except that IFRS 9 does introduce new requirements for the accounting for and presentation of changes in the fair value of an entity’s own debt when the entity has chosen to measure the debt at fair value using the fair value option. IFRS 9 requires that the changes in the fair value of an entity’s own credit risk should be recognised in other comprehensive income rather than the profit or loss. In addition, the IFRS 9 impairment model has been changed from an “incurred loss” model in IAS 39 to an “expected credit loss” model.
BRAC UGANDA MICROFINANCE LIMITED
NOTES TO THR FINANCIAL STATEMENTS REPORT FOR YEAR ENDED 31 DECEMBER 2016 CONTINUED
Hedge accounting
IFRS 9 introduces a substantial revision to hedge accounting requirements which will allow entities better reflect their risk management activities in their financial statements. The revision was issued in a response to concerns of preparers of financial statements about the difficulty of appropriately reflecting management activities in financial statements, the changes also address concerns raised by users of the financial statements about the difficulty of understanding hedge accounting.
The version of IFRS 9 issued in 2014 supersedes all previous versions and is mandatorily effective for periods beginning on or after 1 January 2018 with early adoption permitted (subject to local endorsement requirements). For a limited period, previous versions of IFRS 9 may be adopted early if not already done so provided the relevant date of initial application is before 1 February 2015. In addition, the own credit changes can be early applied in isolation without otherwise changing the accounting for financial instruments.
The company is assessing the potential impact on its financial statements the application of this standard. The company plans to appoint a consultant to help with implementation of IFRS 9.
ClarificationstoIFRS15:RevenuefromContractswithCustomers
IFRS 15 establishes a comprehensive framework for determining whether, how much and when revenue is recognised. It replaces existing revenue recognition guidance, including IAS 18 Revenue, IAS 11 Construction Contracts and IFRIC 13 Customer Loyalty Programmes.
These amendments to the Revenue Standard, which was issued in 2014, do not change the underlying principles of the Standard but clarify how those principles should be applied. The amendments clarify how to:
• identify a performance obligation (the promise to transfer a good or a service to a customer) in a contract; • determine whether a company is a principal (the provider of a good or service) or an agent (responsible for arranging for the good or service to be provided); and • determine whether the revenue from granting a licence should be recognised at a point in time or over time.
In addition to the clarifications, the amendments include two additional reliefs to reduce cost and complexity for a company when it first applies the new Standard.
The amendments are effective for annual periods beginning on or after 1 January 2018, with early application permitted.
The company is assessing the potential impact on its financial statements resulting from the amendments. So far, the company does not expect any significant impact.
AmendmentstoIFRS2:Classificationandmeasurementofshare-basedpaymenttransactions
The Amendments to IFRS 2: Classification and measurement of share-based payment transactions clarify how to account for certain types of share-based payment transactions.
They specifically provide requirements on the accounting for:
• the effects of vesting and non-vesting conditions on the measurement of cash-settled share-based payments; • share-based payment transactions with a net settlement feature for withholding tax obligations; and • a modification to the terms and conditions of a share-based payment that changes the classification of the transaction from cash-settled
to equity-settled.
Once the amendments are applied, the timing and amount of expense recognised for new and outstanding awards could change.
The amendments are effective for annual periods beginning on or after 1 January 2018, with early application permitted. The company is assessing the potential impact on its financial statements resulting from the amendments. So far, the company does not expect any significant impact.
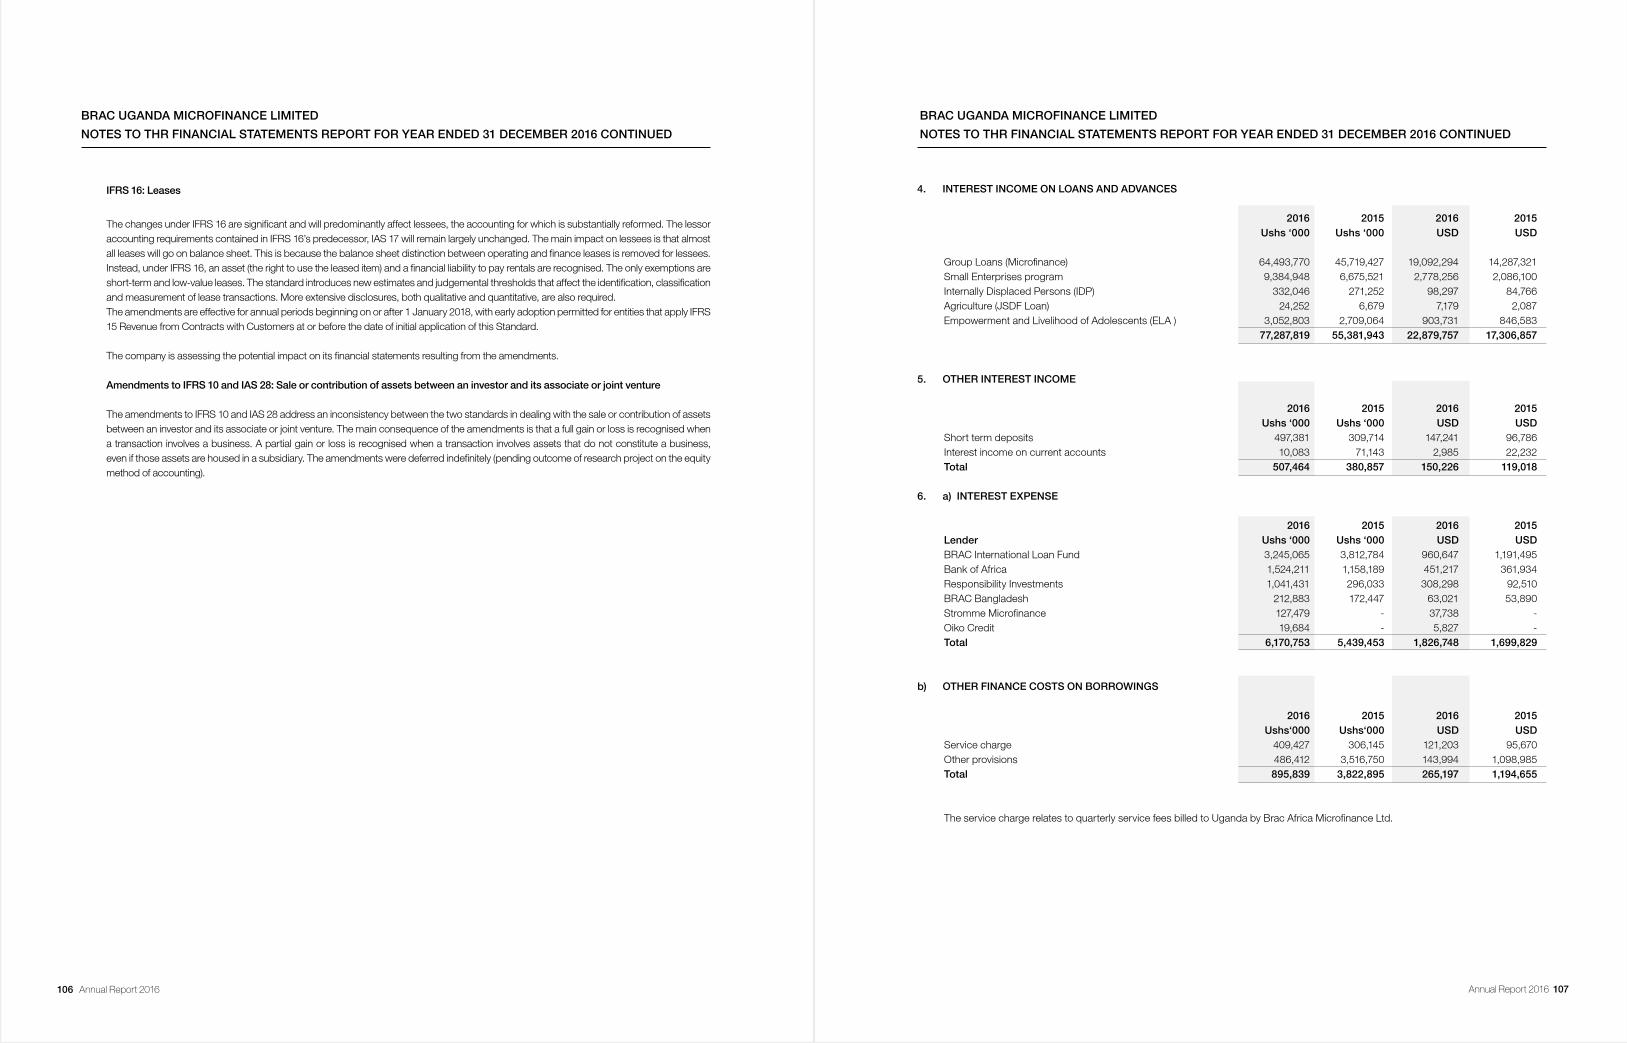
106 Annual Report 2016 Annual Report 2016 107
BRAC UGANDA MICROFINANCE LIMITED
NOTES TO THR FINANCIAL STATEMENTS REPORT FOR YEAR ENDED 31 DECEMBER 2016 CONTINUED
IFRS 16: Leases
The changes under IFRS 16 are significant and will predominantly affect lessees, the accounting for which is substantially reformed. The lessor accounting requirements contained in IFRS 16’s predecessor, IAS 17 will remain largely unchanged. The main impact on lessees is that almost all leases will go on balance sheet. This is because the balance sheet distinction between operating and finance leases is removed for lessees. Instead, under IFRS 16, an asset (the right to use the leased item) and a financial liability to pay rentals are recognised. The only exemptions are short-term and low-value leases. The standard introduces new estimates and judgemental thresholds that affect the identification, classification and measurement of lease transactions. More extensive disclosures, both qualitative and quantitative, are also required.
The amendments are effective for annual periods beginning on or after 1 January 2018, with early adoption permitted for entities that apply IFRS 15 Revenue from Contracts with Customers at or before the date of initial application of this Standard.
The company is assessing the potential impact on its financial statements resulting from the amendments.
AmendmentstoIFRS10andIAS28:Saleorcontributionofassetsbetweenaninvestoranditsassociateorjointventure
The amendments to IFRS 10 and IAS 28 address an inconsistency between the two standards in dealing with the sale or contribution of assets between an investor and its associate or joint venture. The main consequence of the amendments is that a full gain or loss is recognised when a transaction involves a business. A partial gain or loss is recognised when a transaction involves assets that do not constitute a business, even if those assets are housed in a subsidiary. The amendments were deferred indefinitely (pending outcome of research project on the equity method of accounting).
4. INTEREST INCOME ON LOANS AND ADVANCES
2016 2015 2016 2015 Ushs ‘000 Ushs ‘000 USD USD
Group Loans (Microfinance) 64,493,770 45,719,427 19,092,294 14,287,321 Small Enterprises program 9,384,948 6,675,521 2,778,256 2,086,100 Internally Displaced Persons (IDP) 332,046 271,252 98,297 84,766 Agriculture (JSDF Loan) 24,252 6,679 7,179 2,087 Empowerment and Livelihood of Adolescents (ELA ) 3,052,803 2,709,064 903,731 846,583 77,287,819 55,381,943 22,879,757 17,306,857
5. OTHER INTEREST INCOME 2016 2015 2016 2015 Ushs ‘000 Ushs ‘000 USD USD Short term deposits 497,381 309,714 147,241 96,786 Interest income on current accounts 10,083 71,143 2,985 22,232 Total 507,464 380,857 150,226 119,018
6. a) INTEREST EXPENSE 2016 2015 2016 2015 Lender Ushs ‘000 Ushs ‘000 USD USD BRAC International Loan Fund 3,245,065 3,812,784 960,647 1,191,495 Bank of Africa 1,524,211 1,158,189 451,217 361,934 Responsibility Investments 1,041,431 296,033 308,298 92,510 BRAC Bangladesh 212,883 172,447 63,021 53,890 Stromme Microfinance 127,479 - 37,738 - Oiko Credit 19,684 - 5,827 - Total 6,170,753 5,439,453 1,826,748 1,699,829
b) OTHER FINANCE COSTS ON BORROWINGS
2016 2015 2016 2015 Ushs‘000 Ushs‘000 USD USD Service charge 409,427 306,145 121,203 95,670 Other provisions 486,412 3,516,750 143,994 1,098,985 Total 895,839 3,822,895 265,197 1,194,655
The service charge relates to quarterly service fees billed to Uganda by Brac Africa Microfinance Ltd.
BRAC UGANDA MICROFINANCE LIMITED
NOTES TO THR FINANCIAL STATEMENTS REPORT FOR YEAR ENDED 31 DECEMBER 2016 CONTINUED
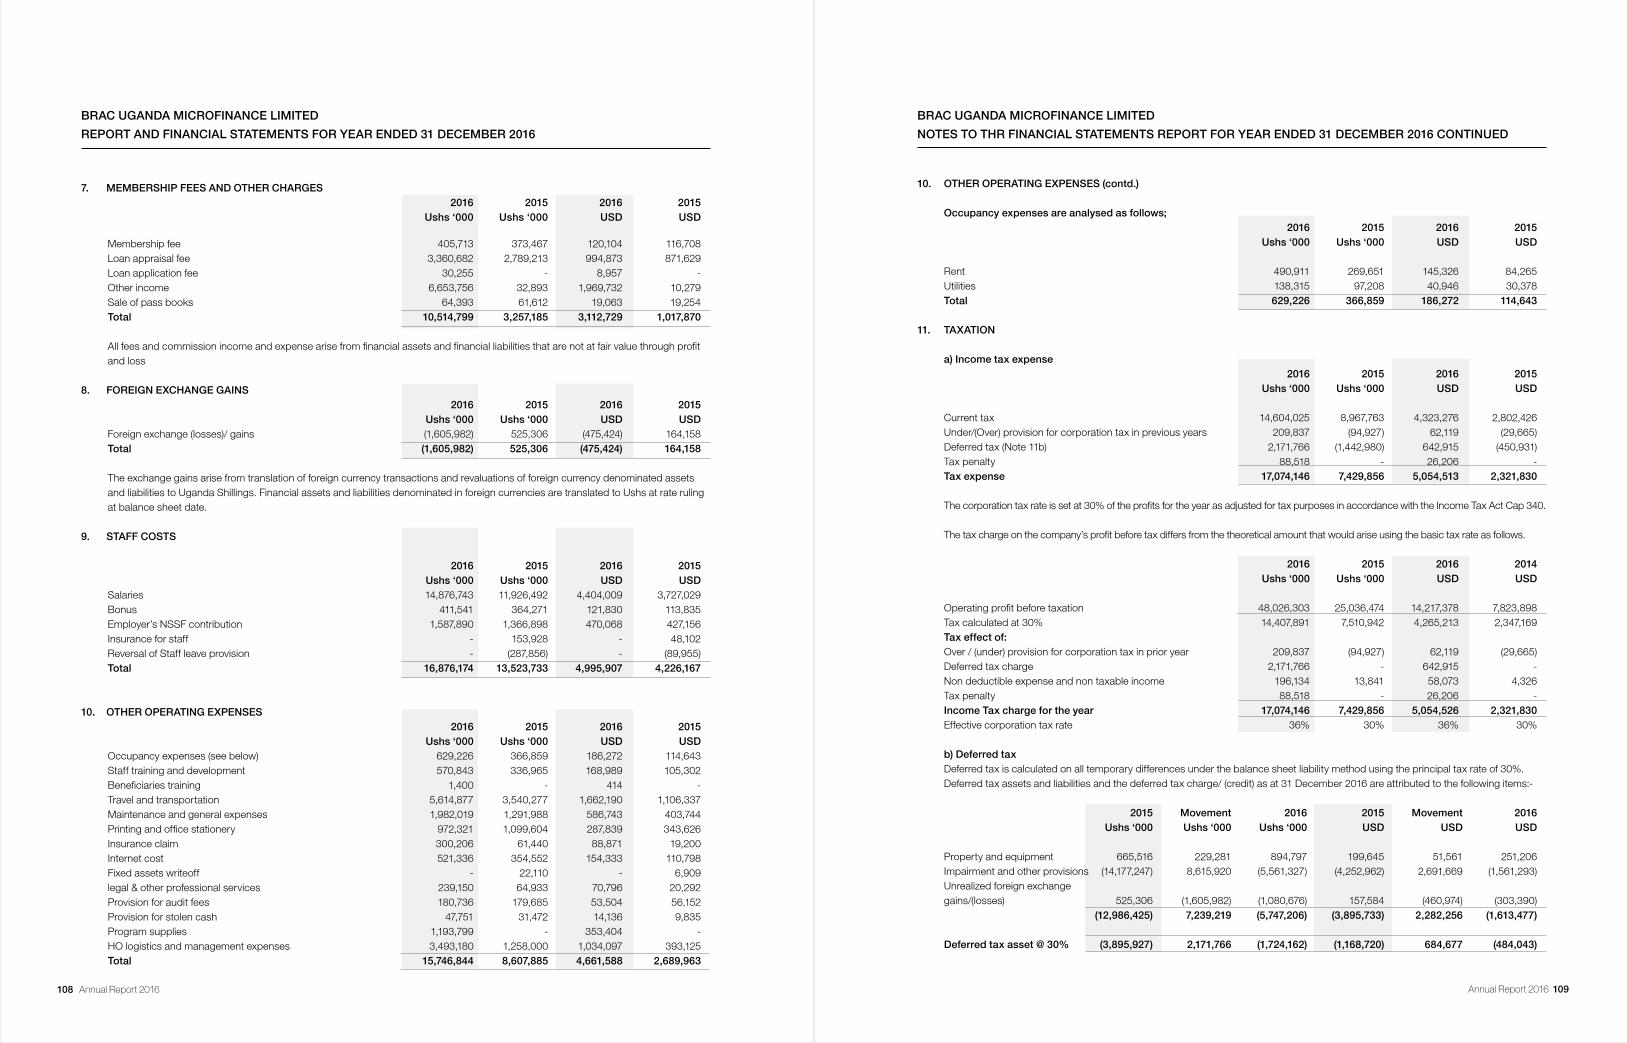
108 Annual Report 2016 Annual Report 2016 109
BRAC UGANDA MICROFINANCE LIMITED
REPORT AND FINANCIAL STATEMENTS FOR YEAR ENDED 31 DECEMBER 2016
7. MEMBERSHIP FEES AND OTHER CHARGES 2016 2015 2016 2015 Ushs ‘000 Ushs ‘000 USD USD
Membership fee 405,713 373,467 120,104 116,708 Loan appraisal fee 3,360,682 2,789,213 994,873 871,629 Loan application fee 30,255 - 8,957 - Other income 6,653,756 32,893 1,969,732 10,279 Sale of pass books 64,393 61,612 19,063 19,254 Total 10,514,799 3,257,185 3,112,729 1,017,870 All fees and commission income and expense arise from financial assets and financial liabilities that are not at fair value through profit
and loss
8. FOREIGN EXCHANGE GAINS 2016 2015 2016 2015 Ushs ‘000 Ushs ‘000 USD USD Foreign exchange (losses)/ gains (1,605,982) 525,306 (475,424) 164,158 Total (1,605,982) 525,306 (475,424) 164,158
The exchange gains arise from translation of foreign currency transactions and revaluations of foreign currency denominated assets and liabilities to Uganda Shillings. Financial assets and liabilities denominated in foreign currencies are translated to Ushs at rate ruling at balance sheet date.
9. STAFF COSTS
2016 2015 2016 2015 Ushs ‘000 Ushs ‘000 USD USD Salaries 14,876,743 11,926,492 4,404,009 3,727,029 Bonus 411,541 364,271 121,830 113,835 Employer’s NSSF contribution 1,587,890 1,366,898 470,068 427,156 Insurance for staff - 153,928 - 48,102 Reversal of Staff leave provision - (287,856) - (89,955) Total 16,876,174 13,523,733 4,995,907 4,226,167
10. OTHER OPERATING EXPENSES 2016 2015 2016 2015 Ushs ‘000 Ushs ‘000 USD USD Occupancy expenses (see below) 629,226 366,859 186,272 114,643 Staff training and development 570,843 336,965 168,989 105,302 Beneficiaries training 1,400 - 414 - Travel and transportation 5,614,877 3,540,277 1,662,190 1,106,337 Maintenance and general expenses 1,982,019 1,291,988 586,743 403,744 Printing and office stationery 972,321 1,099,604 287,839 343,626 Insurance claim 300,206 61,440 88,871 19,200 Internet cost 521,336 354,552 154,333 110,798 Fixed assets writeoff - 22,110 - 6,909 legal & other professional services 239,150 64,933 70,796 20,292 Provision for audit fees 180,736 179,685 53,504 56,152 Provision for stolen cash 47,751 31,472 14,136 9,835 Program supplies 1,193,799 - 353,404 - HO logistics and management expenses 3,493,180 1,258,000 1,034,097 393,125 Total 15,746,844 8,607,885 4,661,588 2,689,963
10. OTHER OPERATING EXPENSES (contd.) Occupancyexpensesareanalysedasfollows; 2016 2015 2016 2015 Ushs ‘000 Ushs ‘000 USD USD Rent 490,911 269,651 145,326 84,265 Utilities 138,315 97,208 40,946 30,378 Total 629,226 366,859 186,272 114,643 11. TAXATION
a) Income tax expense 2016 2015 2016 2015 Ushs ‘000 Ushs ‘000 USD USD
Current tax 14,604,025 8,967,763 4,323,276 2,802,426Under/(Over) provision for corporation tax in previous years 209,837 (94,927) 62,119 (29,665)Deferred tax (Note 11b) 2,171,766 (1,442,980) 642,915 (450,931)Tax penalty 88,518 - 26,206 -Tax expense 17,074,146 7,429,856 5,054,513 2,321,830
The corporation tax rate is set at 30% of the profits for the year as adjusted for tax purposes in accordance with the Income Tax Act Cap 340.
The tax charge on the company’s profit before tax differs from the theoretical amount that would arise using the basic tax rate as follows.
2016 2015 2016 2014 Ushs ‘000 Ushs ‘000 USD USD
Operating profit before taxation 48,026,303 25,036,474 14,217,378 7,823,898Tax calculated at 30% 14,407,891 7,510,942 4,265,213 2,347,169Tax effect of: Over / (under) provision for corporation tax in prior year 209,837 (94,927) 62,119 (29,665)Deferred tax charge 2,171,766 - 642,915 -Non deductible expense and non taxable income 196,134 13,841 58,073 4,326Tax penalty 88,518 - 26,206 -
Income Tax charge for the year 17,074,146 7,429,856 5,054,526 2,321,830Effective corporation tax rate 36% 30% 36% 30%
b) Deferred tax Deferred tax is calculated on all temporary differences under the balance sheet liability method using the principal tax rate of 30%.Deferred tax assets and liabilities and the deferred tax charge/ (credit) as at 31 December 2016 are attributed to the following items:-
2015 Movement 2016 2015 Movement 2016 Ushs ‘000 Ushs ‘000 Ushs ‘000 USD USD USD
Property and equipment 665,516 229,281 894,797 199,645 51,561 251,206Impairment and other provisions (14,177,247) 8,615,920 (5,561,327) (4,252,962) 2,691,669 (1,561,293)Unrealized foreign exchange gains/(losses) 525,306 (1,605,982) (1,080,676) 157,584 (460,974) (303,390) (12,986,425) 7,239,219 (5,747,206) (3,895,733) 2,282,256 (1,613,477) Deferred tax asset @ 30% (3,895,927) 2,171,766 (1,724,162) (1,168,720) 684,677 (484,043)
BRAC UGANDA MICROFINANCE LIMITED
NOTES TO THR FINANCIAL STATEMENTS REPORT FOR YEAR ENDED 31 DECEMBER 2016 CONTINUED
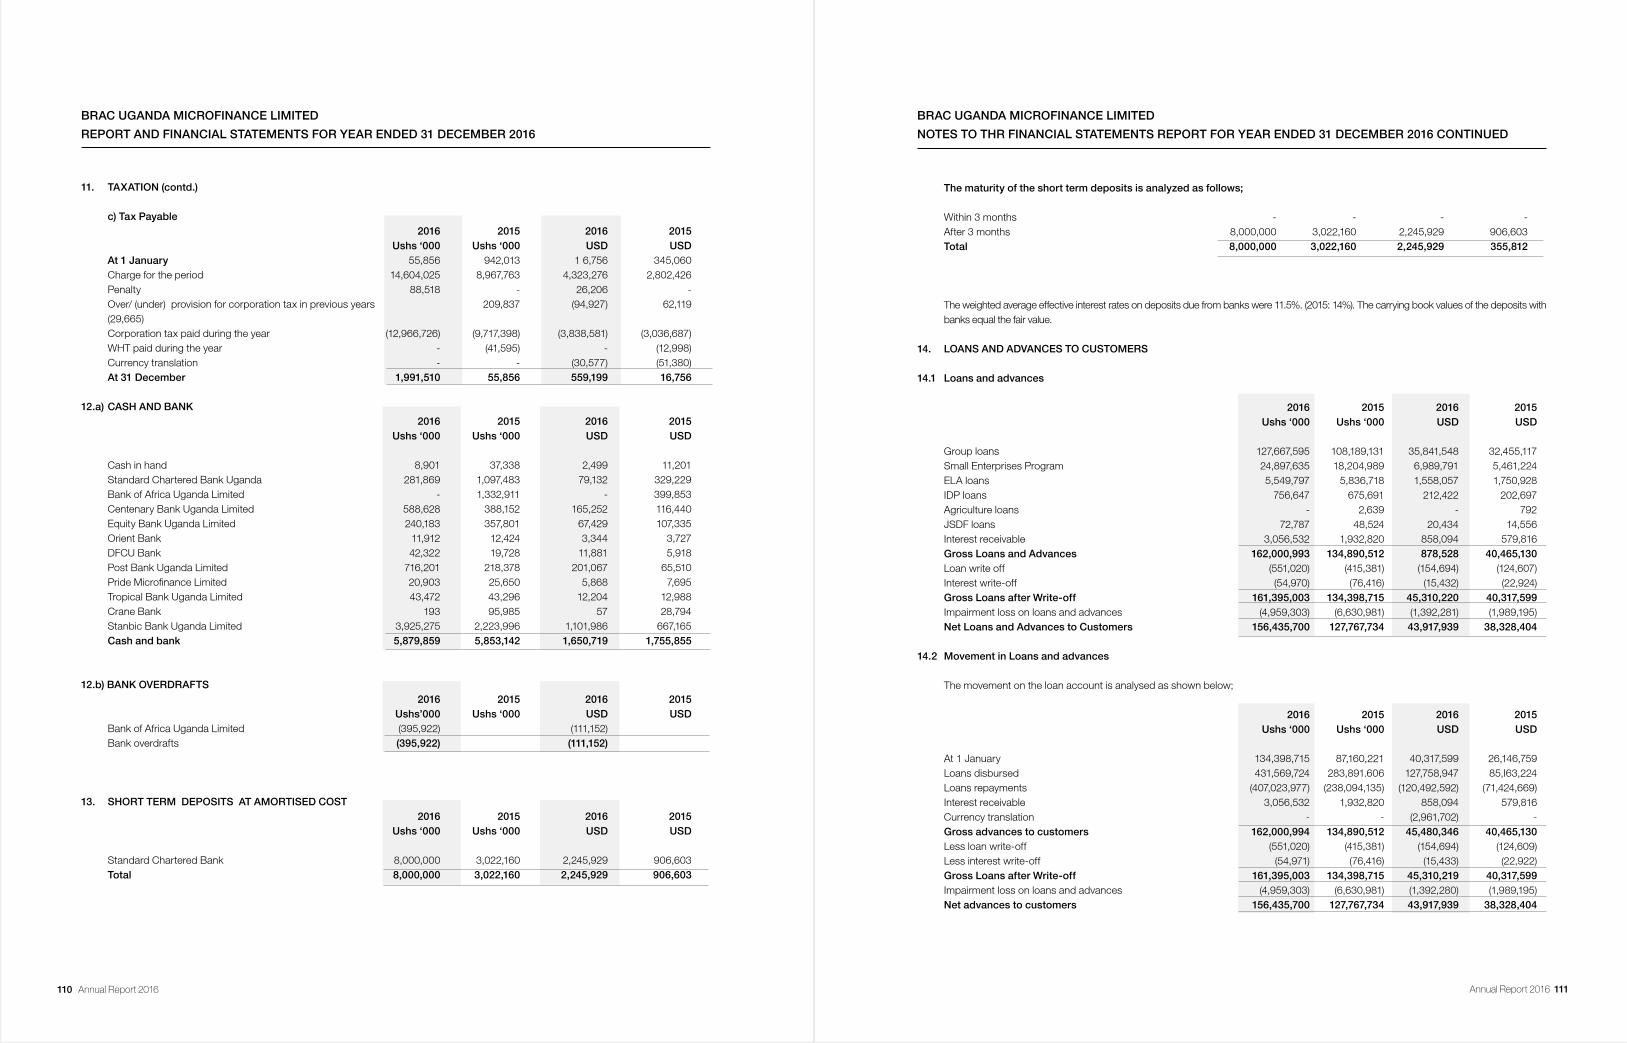
110 Annual Report 2016 Annual Report 2016 111
11. TAXATION (contd.)
c) Tax Payable 2016 2015 2016 2015 Ushs ‘000 Ushs ‘000 USD USD
At 1 January 55,856 942,013 1 6,756 345,060Charge for the period 14,604,025 8,967,763 4,323,276 2,802,426
Penalty 88,518 - 26,206 - Over/ (under) provision for corporation tax in previous years 209,837 (94,927) 62,119
(29,665) Corporation tax paid during the year (12,966,726) (9,717,398) (3,838,581) (3,036,687) WHT paid during the year - (41,595) - (12,998) Currency translation - - (30,577) (51,380) At 31 December 1,991,510 55,856 559,199 16,756
12.a) CASH AND BANK 2016 2015 2016 2015 Ushs ‘000 Ushs ‘000 USD USD
Cash in hand 8,901 37,338 2,499 11,201Standard Chartered Bank Uganda 281,869 1,097,483 79,132 329,229Bank of Africa Uganda Limited - 1,332,911 - 399,853Centenary Bank Uganda Limited 588,628 388,152 165,252 116,440Equity Bank Uganda Limited 240,183 357,801 67,429 107,335Orient Bank 11,912 12,424 3,344 3,727DFCU Bank 42,322 19,728 11,881 5,918Post Bank Uganda Limited 716,201 218,378 201,067 65,510Pride Microfinance Limited 20,903 25,650 5,868 7,695Tropical Bank Uganda Limited 43,472 43,296 12,204 12,988Crane Bank 193 95,985 57 28,794Stanbic Bank Uganda Limited 3,925,275 2,223,996 1,101,986 667,165
Cash and bank 5,879,859 5,853,142 1,650,719 1,755,855
12.b) BANK OVERDRAFTS 2016 2015 2016 2015
Ushs’000 Ushs ‘000 USD USDBank of Africa Uganda Limited (395,922) (111,152)
Bank overdrafts (395,922) (111,152)
13. SHORT TERM DEPOSITS AT AMORTISED COST 2016 2015 2016 2015 Ushs ‘000 Ushs ‘000 USD USD
Standard Chartered Bank 8,000,000 3,022,160 2,245,929 906,603Total 8,000,000 3,022,160 2,245,929 906,603
BRAC UGANDA MICROFINANCE LIMITED
REPORT AND FINANCIAL STATEMENTS FOR YEAR ENDED 31 DECEMBER 2016
Thematurityoftheshorttermdepositsisanalyzedasfollows;
Within 3 months - - - -After 3 months 8,000,000 3,022,160 2,245,929 906,603Total 8,000,000 3,022,160 2,245,929 355,812
The weighted average effective interest rates on deposits due from banks were 11.5%. (2015: 14%). The carrying book values of the deposits with banks equal the fair value.
14. LOANS AND ADVANCES TO CUSTOMERS
14.1 Loans and advances
2016 2015 2016 2015 Ushs ‘000 Ushs ‘000 USD USD
Group loans 127,667,595 108,189,131 35,841,548 32,455,117Small Enterprises Program 24,897,635 18,204,989 6,989,791 5,461,224ELA loans 5,549,797 5,836,718 1,558,057 1,750,928IDP loans 756,647 675,691 212,422 202,697Agriculture loans - 2,639 - 792JSDF loans 72,787 48,524 20,434 14,556Interest receivable 3,056,532 1,932,820 858,094 579,816Gross Loans and Advances 162,000,993 134,890,512 878,528 40,465,130Loan write off (551,020) (415,381) (154,694) (124,607)Interest write-off (54,970) (76,416) (15,432) (22,924)Gross Loans after Write-off 161,395,003 134,398,715 45,310,220 40,317,599Impairment loss on loans and advances (4,959,303) (6,630,981) (1,392,281) (1,989,195)Net Loans and Advances to Customers 156,435,700 127,767,734 43,917,939 38,328,404
14.2 Movement in Loans and advances The movement on the loan account is analysed as shown below;
2016 2015 2016 2015 Ushs ‘000 Ushs ‘000 USD USD
At 1 January 134,398,715 87,160,221 40,317,599 26,146,759Loans disbursed 431,569,724 283,891.606 127,758,947 85,I63,224Loans repayments (407,023,977) (238,094,135) (120,492,592) (71,424,669)Interest receivable 3,056,532 1,932,820 858,094 579,816Currency translation - - (2,961,702) -Gross advances to customers 162,000,994 134,890,512 45,480,346 40,465,130Less loan write-off (551,020) (415,381) (154,694) (124,609)Less interest write-off (54,971) (76,416) (15,433) (22,922)Gross Loans after Write-off 161,395,003 134,398,715 45,310,219 40,317,599Impairment loss on loans and advances (4,959,303) (6,630,981) (1,392,280) (1,989,195)Net advances to customers 156,435,700 127,767,734 43,917,939 38,328,404
BRAC UGANDA MICROFINANCE LIMITED
NOTES TO THR FINANCIAL STATEMENTS REPORT FOR YEAR ENDED 31 DECEMBER 2016 CONTINUED
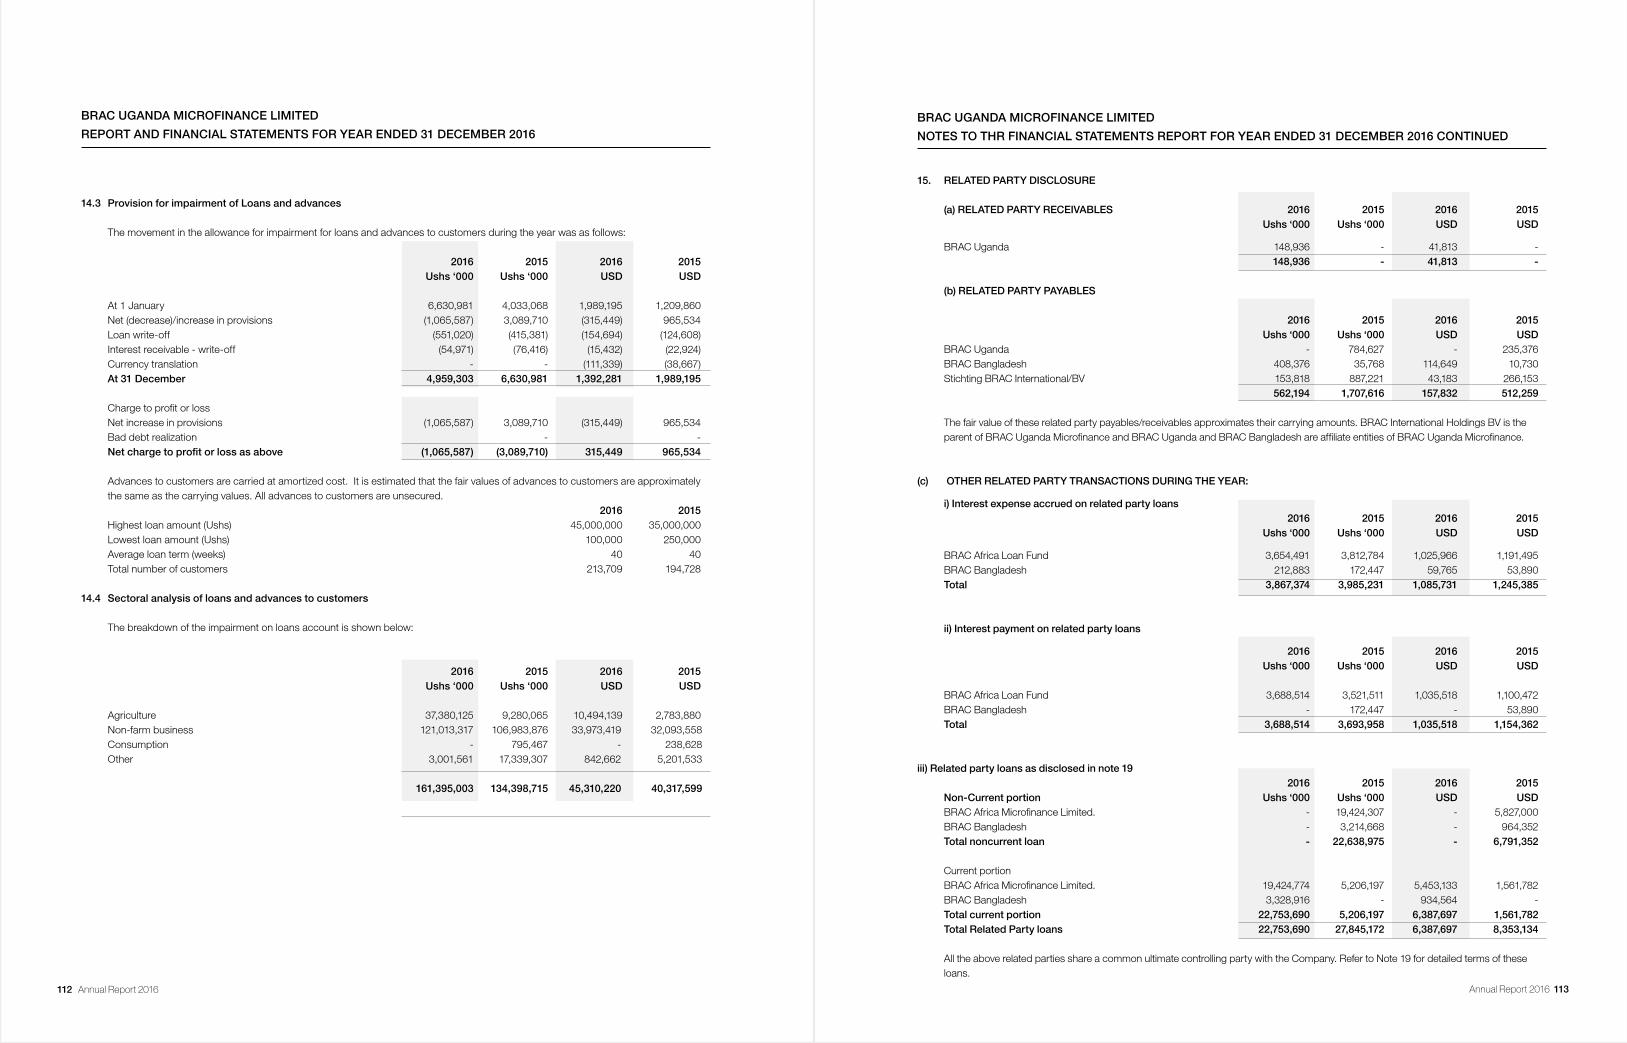
112 Annual Report 2016 Annual Report 2016 113
BRAC UGANDA MICROFINANCE LIMITED
REPORT AND FINANCIAL STATEMENTS FOR YEAR ENDED 31 DECEMBER 2016
14.3 Provision for impairment of Loans and advances The movement in the allowance for impairment for loans and advances to customers during the year was as follows: 2016 2015 2016 2015 Ushs ‘000 Ushs ‘000 USD USD
At 1 January 6,630,981 4,033,068 1,989,195 1,209,860Net (decrease)/increase in provisions (1,065,587) 3,089,710 (315,449) 965,534Loan write-off (551,020) (415,381) (154,694) (124,608)Interest receivable - write-off (54,971) (76,416) (15,432) (22,924)Currency translation - - (111,339) (38,667)At 31 December 4,959,303 6,630,981 1,392,281 1,989,195
Charge to profit or loss Net increase in provisions (1,065,587) 3,089,710 (315,449) 965,534Bad debt realization - -Netchargetoprofitorlossasabove (1,065,587) (3,089,710) 315,449 965,534
Advances to customers are carried at amortized cost. It is estimated that the fair values of advances to customers are approximately the same as the carrying values. All advances to customers are unsecured. 2016 2015
Highest loan amount (Ushs) 45,000,000 35,000,000 Lowest loan amount (Ushs) 100,000 250,000 Average loan term (weeks) 40 40 Total number of customers 213,709 194,728
14.4 Sectoral analysis of loans and advances to customers The breakdown of the impairment on loans account is shown below:
2016 2015 2016 2015 Ushs ‘000 Ushs ‘000 USD USD
Agriculture 37,380,125 9,280,065 10,494,139 2,783,880 Non-farm business 121,013,317 106,983,876 33,973,419 32,093,558 Consumption - 795,467 - 238,628 Other 3,001,561 17,339,307 842,662 5,201,533 161,395,003 134,398,715 45,310,220 40,317,599
15. RELATED PARTY DISCLOSURE
(a) RELATED PARTY RECEIVABLES 2016 2015 2016 2015 Ushs ‘000 Ushs ‘000 USD USD
BRAC Uganda 148,936 - 41,813 - 148,936 - 41,813 -
(b) RELATED PARTY PAYABLES
2016 2015 2016 2015 Ushs ‘000 Ushs ‘000 USD USD BRAC Uganda - 784,627 - 235,376BRAC Bangladesh 408,376 35,768 114,649 10,730Stichting BRAC International/BV 153,818 887,221 43,183 266,153 562,194 1,707,616 157,832 512,259 The fair value of these related party payables/receivables approximates their carrying amounts. BRAC International Holdings BV is the parent of BRAC Uganda Microfinance and BRAC Uganda and BRAC Bangladesh are affiliate entities of BRAC Uganda Microfinance.
(c) OTHER RELATED PARTY TRANSACTIONS DURING THE YEAR:
i) Interest expense accrued on related party loans 2016 2015 2016 2015 Ushs ‘000 Ushs ‘000 USD USD
BRAC Africa Loan Fund 3,654,491 3,812,784 1,025,966 1,191,495BRAC Bangladesh 212,883 172,447 59,765 53,890Total 3,867,374 3,985,231 1,085,731 1,245,385
ii) Interest payment on related party loans
2016 2015 2016 2015 Ushs ‘000 Ushs ‘000 USD USD
BRAC Africa Loan Fund 3,688,514 3,521,511 1,035,518 1,100,472BRAC Bangladesh - 172,447 - 53,890Total 3,688,514 3,693,958 1,035,518 1,154,362
iii) Related party loans as disclosed in note 19 2016 2015 2016 2015 Non-Current portion Ushs ‘000 Ushs ‘000 USD USD BRAC Africa Microfinance Limited. - 19,424,307 - 5,827,000 BRAC Bangladesh - 3,214,668 - 964,352
Total noncurrent loan - 22,638,975 - 6,791,352 Current portion BRAC Africa Microfinance Limited. 19,424,774 5,206,197 5,453,133 1,561,782 BRAC Bangladesh 3,328,916 - 934,564 - Total current portion 22,753,690 5,206,197 6,387,697 1,561,782 Total Related Party loans 22,753,690 27,845,172 6,387,697 8,353,134
All the above related parties share a common ultimate controlling party with the Company. Refer to Note 19 for detailed terms of these loans.
BRAC UGANDA MICROFINANCE LIMITED
NOTES TO THR FINANCIAL STATEMENTS REPORT FOR YEAR ENDED 31 DECEMBER 2016 CONTINUED
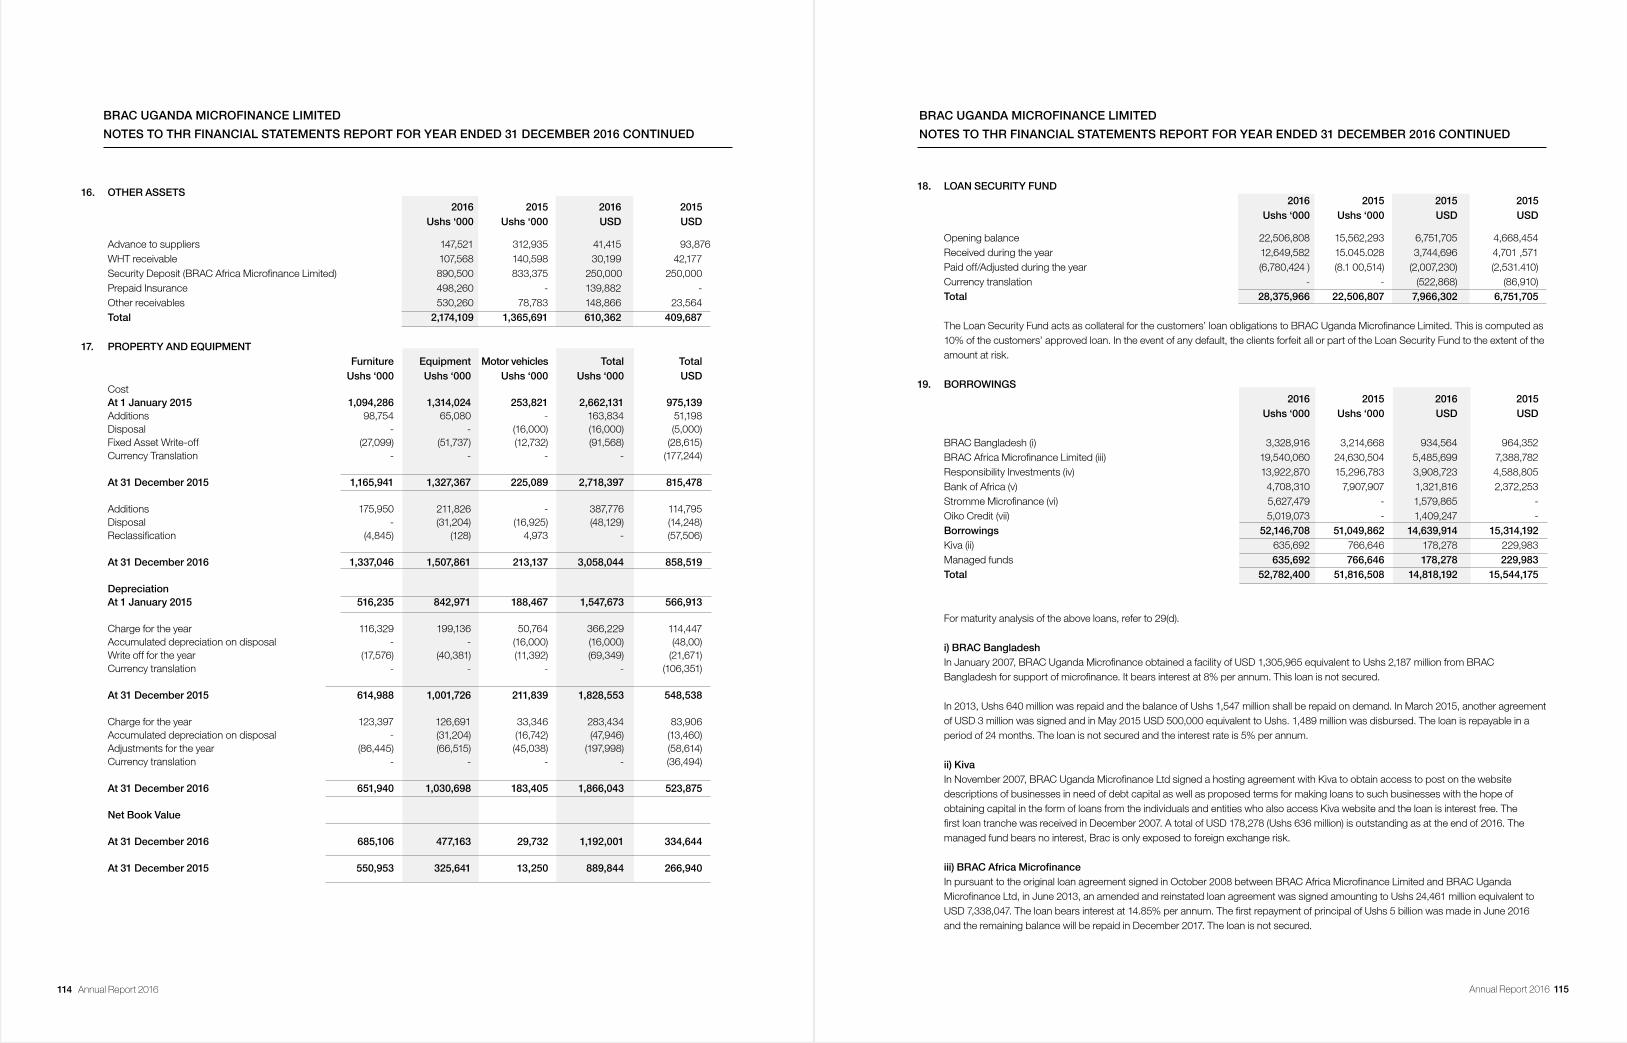
114 Annual Report 2016 Annual Report 2016 115
16. OTHER ASSETS 2016 2015 2016 2015
Ushs ‘000 Ushs ‘000 USD USD
Advance to suppliers 147,521 312,935 41,415 93,876WHT receivable 107,568 140,598 30,199 42,177Security Deposit (BRAC Africa Microfinance Limited) 890,500 833,375 250,000 250,000Prepaid Insurance 498,260 - 139,882 -Other receivables 530,260 78,783 148,866 23,564Total 2,174,109 1,365,691 610,362 409,687
17. PROPERTY AND EQUIPMENT Furniture Equipment Motor vehicles Total Total Ushs ‘000 Ushs ‘000 Ushs ‘000 Ushs ‘000 USD
Cost At 1 January 2015 1,094,286 1,314,024 253,821 2,662,131 975,139 Additions 98,754 65,080 - 163,834 51,198Disposal - - (16,000) (16,000) (5,000)Fixed Asset Write-off (27,099) (51,737) (12,732) (91,568) (28,615)Currency Translation - - - - (177,244)
At 31 December 2015 1,165,941 1,327,367 225,089 2,718,397 815,478
Additions 175,950 211,826 - 387,776 114,795Disposal - (31,204) (16,925) (48,129) (14,248)Reclassification (4,845) (128) 4,973 - (57,506)
At 31 December 2016 1,337,046 1,507,861 213,137 3,058,044 858,519
Depreciation At 1 January 2015 516,235 842,971 188,467 1,547,673 566,913
Charge for the year 116,329 199,136 50,764 366,229 114,447Accumulated depreciation on disposal - - (16,000) (16,000) (48,00)Write off for the year (17,576) (40,381) (11,392) (69,349) (21,671)Currency translation - - - - (106,351)
At 31 December 2015 614,988 1,001,726 211,839 1,828,553 548,538
Charge for the year 123,397 126,691 33,346 283,434 83,906Accumulated depreciation on disposal - (31,204) (16,742) (47,946) (13,460)Adjustments for the year (86,445) (66,515) (45,038) (197,998) (58,614)Currency translation - - - - (36,494)
At 31 December 2016 651,940 1,030,698 183,405 1,866,043 523,875
Net Book Value
At 31 December 2016 685,106 477,163 29,732 1,192,001 334,644
At 31 December 2015 550,953 325,641 13,250 889,844 266,940
BRAC UGANDA MICROFINANCE LIMITED
NOTES TO THR FINANCIAL STATEMENTS REPORT FOR YEAR ENDED 31 DECEMBER 2016 CONTINUED
18. LOAN SECURITY FUND 2016 2015 2015 2015
Ushs ‘000 Ushs ‘000 USD USD
Opening balance 22,506,808 15,562,293 6,751,705 4,668,454Received during the year 12,649,582 15.045.028 3,744,696 4,701 ,571Paid off/Adjusted during the year (6,780,424 ) (8.1 00,514) (2,007,230) (2,531.410)Currency translation - - (522,868) (86,910)Total 28,375,966 22,506,807 7,966,302 6,751,705
The Loan Security Fund acts as collateral for the customers’ loan obligations to BRAC Uganda Microfinance Limited. This is computed as 10% of the customers’ approved loan. In the event of any default, the clients forfeit all or part of the Loan Security Fund to the extent of the amount at risk.
19. BORROWINGS 2016 2015 2016 2015
Ushs ‘000 Ushs ‘000 USD USD
BRAC Bangladesh (i) 3,328,916 3,214,668 934,564 964,352BRAC Africa Microfinance Limited (iii) 19,540,060 24,630,504 5,485,699 7,388,782Responsibility Investments (iv) 13,922,870 15,296,783 3,908,723 4,588,805Bank of Africa (v) 4,708,310 7,907,907 1,321,816 2,372,253Stromme Microfinance (vi) 5,627,479 - 1,579,865 -Oiko Credit (vii) 5,019,073 - 1,409,247 -Borrowings 52,146,708 51,049,862 14,639,914 15,314,192Kiva (ii) 635,692 766,646 178,278 229,983Managed funds 635,692 766,646 178,278 229,983Total 52,782,400 51,816,508 14,818,192 15,544,175
For maturity analysis of the above loans, refer to 29(d).
i) BRAC BangladeshIn January 2007, BRAC Uganda Microfinance obtained a facility of USD 1,305,965 equivalent to Ushs 2,187 million from BRAC Bangladesh for support of microfinance. It bears interest at 8% per annum. This loan is not secured.
In 2013, Ushs 640 million was repaid and the balance of Ushs 1,547 million shall be repaid on demand. In March 2015, another agreement of USD 3 million was signed and in May 2015 USD 500,000 equivalent to Ushs. 1,489 million was disbursed. The loan is repayable in a period of 24 months. The loan is not secured and the interest rate is 5% per annum.
ii) KivaIn November 2007, BRAC Uganda Microfinance Ltd signed a hosting agreement with Kiva to obtain access to post on the website descriptions of businesses in need of debt capital as well as proposed terms for making loans to such businesses with the hope of obtaining capital in the form of loans from the individuals and entities who also access Kiva website and the loan is interest free. The first loan tranche was received in December 2007. A total of USD 178,278 (Ushs 636 million) is outstanding as at the end of 2016. The managed fund bears no interest, Brac is only exposed to foreign exchange risk.
iii)BRACAfricaMicrofinanceIn pursuant to the original loan agreement signed in October 2008 between BRAC Africa Microfinance Limited and BRAC Uganda Microfinance Ltd, in June 2013, an amended and reinstated loan agreement was signed amounting to Ushs 24,461 million equivalent to USD 7,338,047. The loan bears interest at 14.85% per annum. The first repayment of principal of Ushs 5 billion was made in June 2016 and the remaining balance will be repaid in December 2017. The loan is not secured.
BRAC UGANDA MICROFINANCE LIMITED
NOTES TO THR FINANCIAL STATEMENTS REPORT FOR YEAR ENDED 31 DECEMBER 2016 CONTINUED
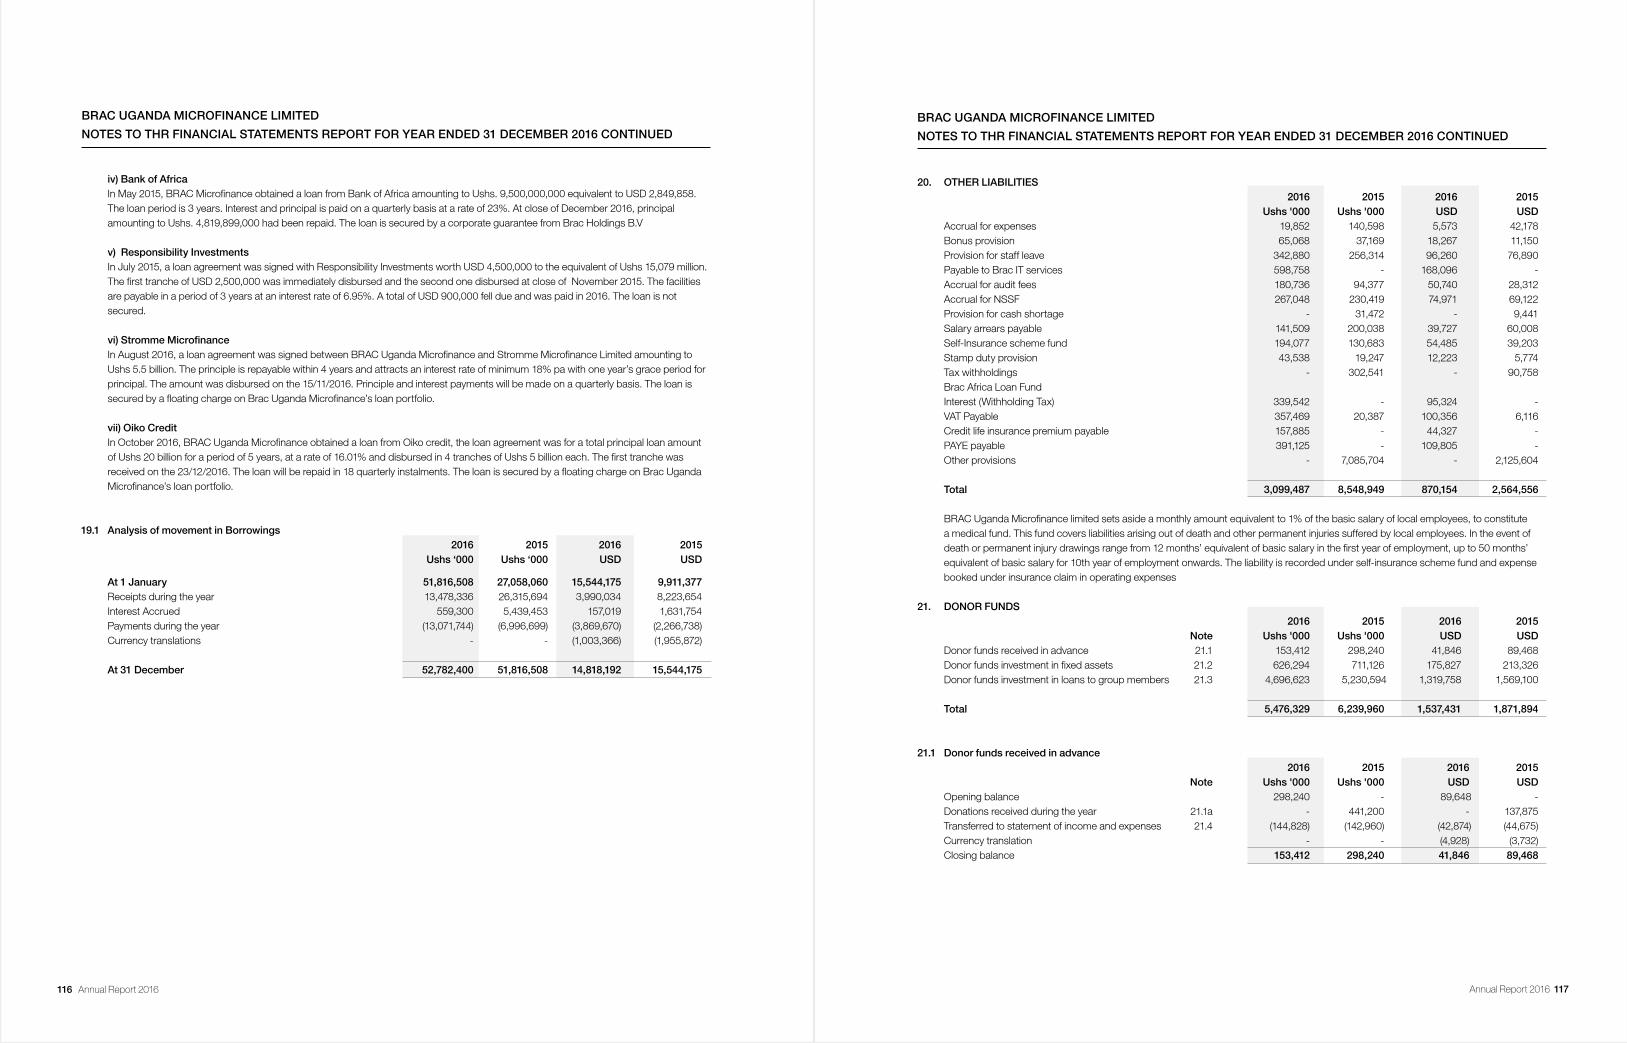
116 Annual Report 2016 Annual Report 2016 117
BRAC UGANDA MICROFINANCE LIMITED
NOTES TO THR FINANCIAL STATEMENTS REPORT FOR YEAR ENDED 31 DECEMBER 2016 CONTINUED
iv) Bank of AfricaIn May 2015, BRAC Microfinance obtained a loan from Bank of Africa amounting to Ushs. 9,500,000,000 equivalent to USD 2,849,858. The loan period is 3 years. Interest and principal is paid on a quarterly basis at a rate of 23%. At close of December 2016, principal amounting to Ushs. 4,819,899,000 had been repaid. The loan is secured by a corporate guarantee from Brac Holdings B.V
v) Responsibility InvestmentsIn July 2015, a loan agreement was signed with Responsibility Investments worth USD 4,500,000 to the equivalent of Ushs 15,079 million. The first tranche of USD 2,500,000 was immediately disbursed and the second one disbursed at close of November 2015. The facilities are payable in a period of 3 years at an interest rate of 6.95%. A total of USD 900,000 fell due and was paid in 2016. The loan is not secured.
vi)StrommeMicrofinanceIn August 2016, a loan agreement was signed between BRAC Uganda Microfinance and Stromme Microfinance Limited amounting to Ushs 5.5 billion. The principle is repayable within 4 years and attracts an interest rate of minimum 18% pa with one year’s grace period for principal. The amount was disbursed on the 15/11/2016. Principle and interest payments will be made on a quarterly basis. The loan is secured by a floating charge on Brac Uganda Microfinance’s loan portfolio.
vii) Oiko CreditIn October 2016, BRAC Uganda Microfinance obtained a loan from Oiko credit, the loan agreement was for a total principal loan amount of Ushs 20 billion for a period of 5 years, at a rate of 16.01% and disbursed in 4 tranches of Ushs 5 billion each. The first tranche was received on the 23/12/2016. The loan will be repaid in 18 quarterly instalments. The loan is secured by a floating charge on Brac Uganda Microfinance’s loan portfolio.
19.1 AnalysisofmovementinBorrowings 2016 2015 2016 2015
Ushs ‘000 Ushs ‘000 USD USD
At 1 January 51,816,508 27,058,060 15,544,175 9,911,377Receipts during the year 13,478,336 26,315,694 3,990,034 8,223,654Interest Accrued 559,300 5,439,453 157,019 1,631,754Payments during the year (13,071,744) (6,996,699) (3,869,670) (2,266,738)Currency translations - - (1,003,366) (1,955,872)
At 31 December 52,782,400 51,816,508 14,818,192 15,544,175
BRAC UGANDA MICROFINANCE LIMITED
NOTES TO THR FINANCIAL STATEMENTS REPORT FOR YEAR ENDED 31 DECEMBER 2016 CONTINUED
20. OTHER LIABILITIES 2016 2015 2016 2015 Ushs '000 Ushs '000 USD USD Accrual for expenses 19,852 140,598 5,573 42,178Bonus provision 65,068 37,169 18,267 11,150Provision for staff leave 342,880 256,314 96,260 76,890Payable to Brac IT services 598,758 - 168,096 -Accrual for audit fees 180,736 94,377 50,740 28,312Accrual for NSSF 267,048 230,419 74,971 69,122Provision for cash shortage - 31,472 - 9,441Salary arrears payable 141,509 200,038 39,727 60,008Self-Insurance scheme fund 194,077 130,683 54,485 39,203Stamp duty provision 43,538 19,247 12,223 5,774Tax withholdings - 302,541 - 90,758Brac Africa Loan Fund Interest (Withholding Tax) 339,542 - 95,324 -VAT Payable 357,469 20,387 100,356 6,116Credit life insurance premium payable 157,885 - 44,327 -PAYE payable 391,125 - 109,805 -Other provisions - 7,085,704 - 2,125,604
Total 3,099,487 8,548,949 870,154 2,564,556
BRAC Uganda Microfinance limited sets aside a monthly amount equivalent to 1% of the basic salary of local employees, to constitute a medical fund. This fund covers liabilities arising out of death and other permanent injuries suffered by local employees. In the event of death or permanent injury drawings range from 12 months’ equivalent of basic salary in the first year of employment, up to 50 months’ equivalent of basic salary for 10th year of employment onwards. The liability is recorded under self-insurance scheme fund and expense booked under insurance claim in operating expenses
21. DONOR FUNDS 2016 2015 2016 2015 Note Ushs '000 Ushs '000 USD USDDonor funds received in advance 21.1 153,412 298,240 41,846 89,468 Donor funds investment in fixed assets 21.2 626,294 711,126 175,827 213,326Donor funds investment in loans to group members 21.3 4,696,623 5,230,594 1,319,758 1,569,100
Total 5,476,329 6,239,960 1,537,431 1,871,894
21.1 Donor funds received in advance 2016 2015 2016 2015 Note Ushs '000 Ushs '000 USD USDOpening balance 298,240 - 89,648 -Donations received during the year 21.1a - 441,200 - 137,875Transferred to statement of income and expenses 21.4 (144,828) (142,960) (42,874) (44,675)Currency translation - - (4,928) (3,732)Closing balance 153,412 298,240 41,846 89,468
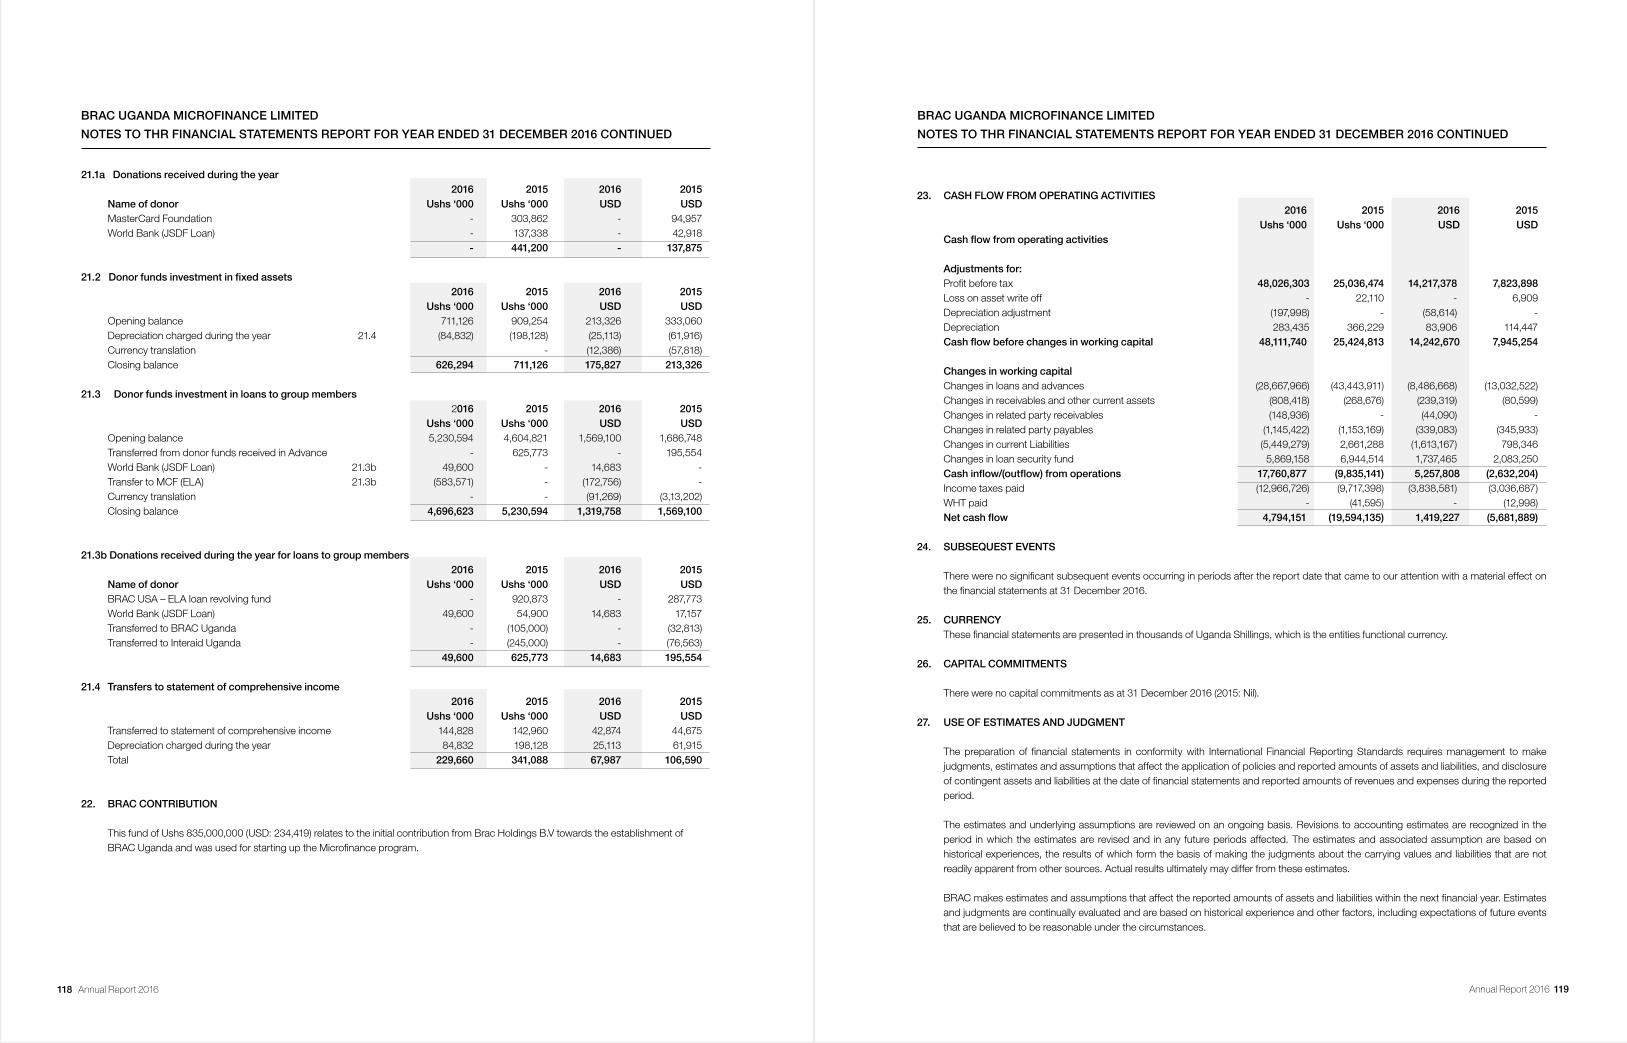
118 Annual Report 2016 Annual Report 2016 119
BRAC UGANDA MICROFINANCE LIMITED
NOTES TO THR FINANCIAL STATEMENTS REPORT FOR YEAR ENDED 31 DECEMBER 2016 CONTINUED
21.1a Donations received during the year 2016 2015 2016 2015Name of donor Ushs ‘000 Ushs ‘000 USD USDMasterCard Foundation - 303,862 - 94,957World Bank (JSDF Loan) - 137,338 - 42,918 - 441,200 - 137,875
21.2Donorfundsinvestmentinfixedassets 2016 2015 2016 2015 Ushs ‘000 Ushs ‘000 USD USDOpening balance 711,126 909,254 213,326 333,060Depreciation charged during the year 21.4 (84,832) (198,128) (25,113) (61,916)Currency translation - (12,386) (57,818)Closing balance 626,294 711,126 175,827 213,326
21.3 Donor funds investment in loans to group members 2016 2015 2016 2015 Ushs ‘000 Ushs ‘000 USD USDOpening balance 5,230,594 4,604,821 1,569,100 1,686,748Transferred from donor funds received in Advance - 625,773 - 195,554World Bank (JSDF Loan) 21.3b 49,600 - 14,683 -Transfer to MCF (ELA) 21.3b (583,571) - (172,756) -Currency translation - - (91,269) (3,13,202)Closing balance 4,696,623 5,230,594 1,319,758 1,569,100
21.3b Donations received during the year for loans to group members 2016 2015 2016 2015Name of donor Ushs ‘000 Ushs ‘000 USD USDBRAC USA – ELA loan revolving fund - 920,873 - 287,773World Bank (JSDF Loan) 49,600 54,900 14,683 17,157Transferred to BRAC Uganda - (105,000) - (32,813)Transferred to Interaid Uganda - (245,000) - (76,563) 49,600 625,773 14,683 195,554
21.4 Transfers to statement of comprehensive income 2016 2015 2016 2015 Ushs ‘000 Ushs ‘000 USD USDTransferred to statement of comprehensive income 144,828 142,960 42,874 44,675Depreciation charged during the year 84,832 198,128 25,113 61,915Total 229,660 341,088 67,987 106,590
22. BRAC CONTRIBUTION
This fund of Ushs 835,000,000 (USD: 234,419) relates to the initial contribution from Brac Holdings B.V towards the establishment of BRAC Uganda and was used for starting up the Microfinance program.
23. CASH FLOW FROM OPERATING ACTIVITIES 2016 2015 2016 2015 Ushs ‘000 Ushs ‘000 USD USD
Cashflowfromoperatingactivities Adjustments for: Profit before tax 48,026,303 25,036,474 14,217,378 7,823,898Loss on asset write off - 22,110 - 6,909Depreciation adjustment (197,998) - (58,614) -Depreciation 283,435 366,229 83,906 114,447Cashflowbeforechangesinworkingcapital 48,111,740 25,424,813 14,242,670 7,945,254 Changesinworkingcapital Changes in loans and advances (28,667,966) (43,443,911) (8,486,668) (13,032,522)Changes in receivables and other current assets (808,418) (268,676) (239,319) (80,599)Changes in related party receivables (148,936) - (44,090) -Changes in related party payables (1,145,422) (1,153,169) (339,083) (345,933)Changes in current Liabilities (5,449,279) 2,661,288 (1,613,167) 798,346Changes in loan security fund 5,869,158 6,944,514 1,737,465 2,083,250Cashinflow/(outflow)fromoperations 17,760,877 (9,835,141) 5,257,808 (2,632,204)Income taxes paid (12,966,726) (9,717,398) (3,838,581) (3,036,687)WHT paid - (41,595) - (12,998)Netcashflow 4,794,151 (19,594,135) 1,419,227 (5,681,889)
24. SUBSEQUEST EVENTS
There were no significant subsequent events occurring in periods after the report date that came to our attention with a material effect on the financial statements at 31 December 2016.
25. CURRENCYThese financial statements are presented in thousands of Uganda Shillings, which is the entities functional currency.
26. CAPITAL COMMITMENTS
There were no capital commitments as at 31 December 2016 (2015: Nil).
27. USE OF ESTIMATES AND JUDGMENT
The preparation of financial statements in conformity with International Financial Reporting Standards requires management to make judgments, estimates and assumptions that affect the application of policies and reported amounts of assets and liabilities, and disclosure of contingent assets and liabilities at the date of financial statements and reported amounts of revenues and expenses during the reported period.
The estimates and underlying assumptions are reviewed on an ongoing basis. Revisions to accounting estimates are recognized in the period in which the estimates are revised and in any future periods affected. The estimates and associated assumption are based on historical experiences, the results of which form the basis of making the judgments about the carrying values and liabilities that are not readily apparent from other sources. Actual results ultimately may differ from these estimates.
BRAC makes estimates and assumptions that affect the reported amounts of assets and liabilities within the next financial year. Estimates and judgments are continually evaluated and are based on historical experience and other factors, including expectations of future events that are believed to be reasonable under the circumstances.
BRAC UGANDA MICROFINANCE LIMITED
NOTES TO THR FINANCIAL STATEMENTS REPORT FOR YEAR ENDED 31 DECEMBER 2016 CONTINUED

120 Annual Report 2016 Annual Report 2016 121
BRAC UGANDA MICROFINANCE LIMITED
NOTES TO THR FINANCIAL STATEMENTS REPORT FOR YEAR ENDED 31 DECEMBER 2016 CONTINUED
Management identifies all significant accounting policies and those that involve high judgment and in particular the significant areas of estimation and un-certainty in applying accounting policies that have the most significant effect on the amounts recognized in the financial statements are:
(i) Impairment
The company makes estimates and assumptions that affect the reported amounts of assets and liabilities within the next financial year. Estimates and judgments are continually evaluated and are based on historical experience and other factors, including expectations of future events that are believed to be reasonable under the circumstances.
The company regularly reviews its loan portfolio and other assets and makes judgments in determining whether an impairment loss should be recognized in respect of observable data that may impact on future estimated cash flows. The methodology and assumptions used for estimating both the amount and timing of future cash flows are reviewed regularly to reduce any differences between loss estimates and actual loss experience.
(ii) Provisions A provision is recognized for an obligation as a result of past events, the company has a present legal or constructive obligation that can be estimated reliably, and it is probable that an outflow of economic benefits will be required to settle the obligation. For provisions included in the financial statements see note 20.
28. CONTINGENT LIABILITIES
There are no known contingent liabilities as at 31 December 2016.
29. FINANCIAL RISK MANAGEMENT
a) Introduction and overview The Company has exposure to the following risks from financial instruments:i) Credit risk ii) Interest rate risk iii) Liquidity risk iv) Market risk v) Operational risk
This note presents information about the Company’s exposure to each of the above risks and the Company’s objectives, policies and processes for measuring and managing risk. Riskmanagementframework The Board of Directors has overall responsibility for the establishment and oversight of the Company’s risk management framework. The Board of BRAC Bangladesh International, the parent company, has established the Group Audit and Risk Committee, Remuneration Committee, Investment Committee, Group Executive Committee and Subsidiary Companies Executive Committee which are responsible for developing and monitoring Group risk management policies in their respective areas. All Board committees have both executive and non-executive members, apart from the Group Executive Committee which comprises of executive directors and senior management and report regularly to the Board of Directors on their activities. BRAC financial risk management policy seeks to identify, appraise and monitor the risks facing BRAC whilst taking specific measures to manage its interest rate, foreign exchange, liquidity and credit risks. BRAC does not however, engage in speculative transactions or take speculative positions, and where affected by adverse movements, BRAC has sought the assistance of donors.
BRAC UGANDA MICROFINANCE LIMITED
NOTES TO THR FINANCIAL STATEMENTS REPORT FOR YEAR ENDED 31 DECEMBER 2016 CONTINUED
(b) Credit risk Credit risk is the risk of financial loss to the Company if a customer or counterparty to a financial instrument fails to meet its contractual obligations, and arises principally from the Company’s loans and advances to customers. The credit policy of BRAC Uganda Microfinance Limited requires all credit exposures to be measured, monitored and managed proactively.
Exposure to credit risk is monitored on an ongoing basis by the commercial ventures respective management teams. For risk management reporting purposes, the Company considers and consolidates all elements of credit risk exposure. BRAC Uganda Microfinance Limited does not have any significant exposure to any individual customer or counterparty. The greatest portion of Brac Uganda Microfinance loan book is unsecured group guaranteed and as such, exposure to credit risk and the management of this risk is a key consideration for the board. The model that the Company uses to mitigate this risk is arrangements with the respective Group members of BRAC Uganda Microfinance Limited customers to contribute for a group member who has defaulted the weekly loan repayment. This model is used exclusively by the Company.
Management of credit riskAs set out above, the main activity of the Company is the provision of unsecured loans to group members. The Board of Directors has delegated responsibility for the oversight of credit risk to the Chief Executive Officer and the Monitoring Department. However, this must be viewed in light of the overall framework of the exclusive use of “group guaranteed” loan repayment mechanism. Loan application process a) Group guaranteed loanThe group loans are appraised by the Credit Officer (CO) in the field and these Loan application forms are brought before the Branch Managers for appraisals. The Branch Managers will visit the house of the potential borrower/ applicant before recommendation of the loan to the area manager for approval. A survey form containing 10 important points is filled.
The Branch Manager (BM) confirms that the CO was properly and appropriately trained and have assessed the feasibility of all member loan applications.
The Loan appraisal work is done by the credit officer (CO) and reviewed by the BM who confirms that the applicant has provided all necessary information and that is complete, the loan application has been endorsed, verifies that the net income from the business is sufficient to allow for loan repayment, all guarantors have fully signed the loan application and also confirms that all borrowers in respective groups do not have past due repayment obligations or arrears.
After completion of the verification and other formal processes, the Area Manager will approve the loan or recommend i.e. to the final authority for approval.All loans are repayable in equal weekly installments that are collected by the credit officers during the weekly group meetings through direct cash payments. The collections by the credit officers are subsequently paid directly to Branch Managers on a weekly basis. Loan proceeds are manually transferred to the employee’s company accounts to eliminate the risk of keeping cash.The main criteria considered by the Company are the loan applicant’s ability and willingness to meet his/her financial commitments and to remain with sufficient funds to fund household needs. The company applies these criteria for all customers and this is complimentary to regulatory requirements.
b) Small Enterprise Product (Individual Loans)Small Enterprise loans are identified by the Credit Officer who visits the customer, assesses the business working capital and profitability. A second visit is done by the Area manager if the loan is below Ushs 5 million and above Ushs 5 million, the Regional manager will visit the client. A guarantor and a family nominee will be identified by the borrower and shall sign the guarantor and nominee form to ensure that they will be liable to repay the loan in case the customer defaults.
There are different forms of security which includes land titles, land agreements and other forms of collateral. The security is verified at local council level to confirm authenticity.
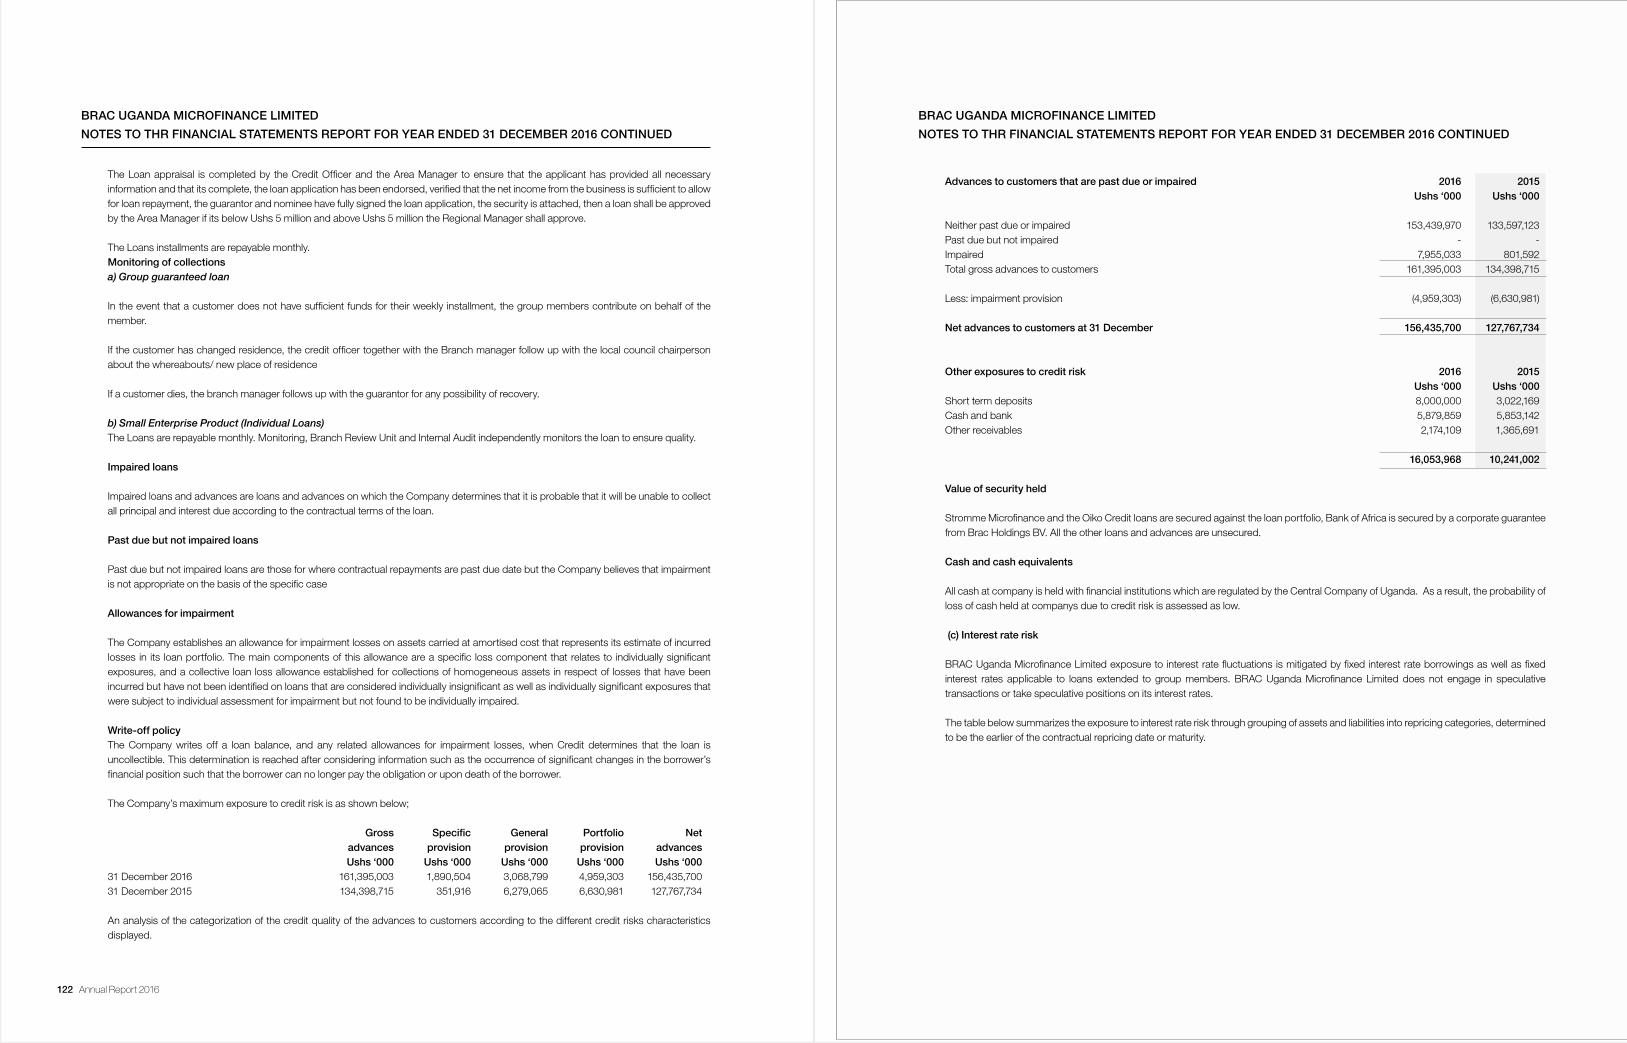
122 Annual Report 2016 Annual Report 2016 123
BRAC UGANDA MICROFINANCE LIMITED
NOTES TO THR FINANCIAL STATEMENTS REPORT FOR YEAR ENDED 31 DECEMBER 2016 CONTINUED
The Loan appraisal is completed by the Credit Officer and the Area Manager to ensure that the applicant has provided all necessary information and that its complete, the loan application has been endorsed, verified that the net income from the business is sufficient to allow for loan repayment, the guarantor and nominee have fully signed the loan application, the security is attached, then a loan shall be approved by the Area Manager if its below Ushs 5 million and above Ushs 5 million the Regional Manager shall approve.
The Loans installments are repayable monthly.Monitoring of collections a) Group guaranteed loan
In the event that a customer does not have sufficient funds for their weekly installment, the group members contribute on behalf of the member.
If the customer has changed residence, the credit officer together with the Branch manager follow up with the local council chairperson about the whereabouts/ new place of residence
If a customer dies, the branch manager follows up with the guarantor for any possibility of recovery.
b) Small Enterprise Product (Individual Loans)
The Loans are repayable monthly. Monitoring, Branch Review Unit and Internal Audit independently monitors the loan to ensure quality.
Impaired loans Impaired loans and advances are loans and advances on which the Company determines that it is probable that it will be unable to collect all principal and interest due according to the contractual terms of the loan.
Past due but not impaired loans
Past due but not impaired loans are those for where contractual repayments are past due date but the Company believes that impairment is not appropriate on the basis of the specific case
Allowancesforimpairment The Company establishes an allowance for impairment losses on assets carried at amortised cost that represents its estimate of incurred losses in its loan portfolio. The main components of this allowance are a specific loss component that relates to individually significant exposures, and a collective loan loss allowance established for collections of homogeneous assets in respect of losses that have been incurred but have not been identified on loans that are considered individually insignificant as well as individually significant exposures that were subject to individual assessment for impairment but not found to be individually impaired.
Write-off policy The Company writes off a loan balance, and any related allowances for impairment losses, when Credit determines that the loan is uncollectible. This determination is reached after considering information such as the occurrence of significant changes in the borrower’s financial position such that the borrower can no longer pay the obligation or upon death of the borrower.
The Company’s maximum exposure to credit risk is as shown below;
Gross Specific General Portfolio Net advances provision provision provision advances Ushs ‘000 Ushs ‘000 Ushs ‘000 Ushs ‘000 Ushs ‘00031 December 2016 161,395,003 1,890,504 3,068,799 4,959,303 156,435,70031 December 2015 134,398,715 351,916 6,279,065 6,630,981 127,767,734
An analysis of the categorization of the credit quality of the advances to customers according to the different credit risks characteristics displayed.
Advances to customers that are past due or impaired 2016 2015 Ushs ‘000 Ushs ‘000
Neither past due or impaired 153,439,970 133,597,123Past due but not impaired - -Impaired 7,955,033 801,592Total gross advances to customers 161,395,003 134,398,715 Less: impairment provision (4,959,303) (6,630,981)
Net advances to customers at 31 December 156,435,700 127,767,734
Other exposures to credit risk 2016 2015 Ushs ‘000 Ushs ‘000Short term deposits 8,000,000 3,022,169Cash and bank 5,879,859 5,853,142Other receivables 2,174,109 1,365,691 16,053,968 10,241,002
Value of security held
Stromme Microfinance and the Oiko Credit loans are secured against the loan portfolio, Bank of Africa is secured by a corporate guarantee from Brac Holdings BV. All the other loans and advances are unsecured.
Cash and cash equivalents
All cash at company is held with financial institutions which are regulated by the Central Company of Uganda. As a result, the probability of loss of cash held at companys due to credit risk is assessed as low.
(c) Interest rate risk
BRAC Uganda Microfinance Limited exposure to interest rate fluctuations is mitigated by fixed interest rate borrowings as well as fixed interest rates applicable to loans extended to group members. BRAC Uganda Microfinance Limited does not engage in speculative transactions or take speculative positions on its interest rates.
The table below summarizes the exposure to interest rate risk through grouping of assets and liabilities into repricing categories, determined to be the earlier of the contractual repricing date or maturity.
BRAC UGANDA MICROFINANCE LIMITED
NOTES TO THR FINANCIAL STATEMENTS REPORT FOR YEAR ENDED 31 DECEMBER 2016 CONTINUED
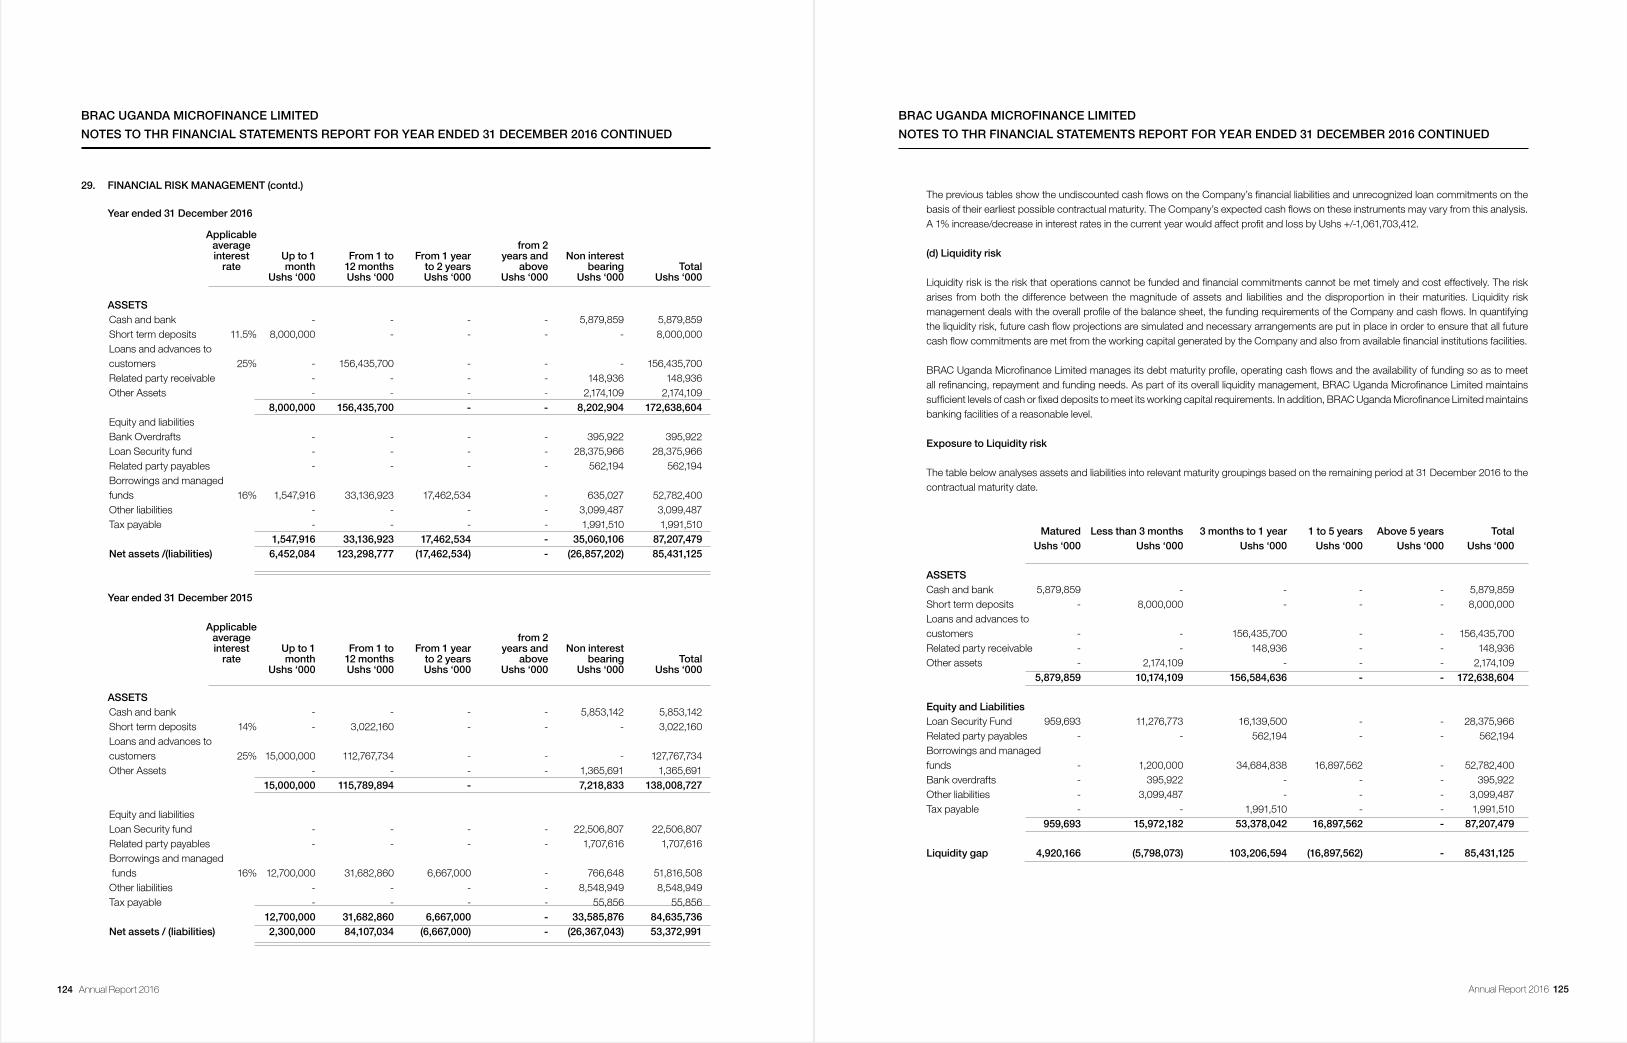
124 Annual Report 2016 Annual Report 2016 125
BRAC UGANDA MICROFINANCE LIMITED
NOTES TO THR FINANCIAL STATEMENTS REPORT FOR YEAR ENDED 31 DECEMBER 2016 CONTINUED
29. FINANCIAL RISK MANAGEMENT (contd.)
Year ended 31 December 2016 Applicable average from 2 interest Up to 1 From 1 to From 1 year years and Non interest rate month 12 months to 2 years above bearing Total Ushs ‘000 Ushs ‘000 Ushs ‘000 Ushs ‘000 Ushs ‘000 Ushs ‘000
ASSETS Cash and bank - - - - 5,879,859 5,879,859Short term deposits 11.5% 8,000,000 - - - - 8,000,000Loans and advances to customers 25% - 156,435,700 - - - 156,435,700Related party receivable - - - - 148,936 148,936Other Assets - - - - 2,174,109 2,174,109 8,000,000 156,435,700 - - 8,202,904 172,638,604Equity and liabilities Bank Overdrafts - - - - 395,922 395,922Loan Security fund - - - - 28,375,966 28,375,966Related party payables - - - - 562,194 562,194Borrowings and managedfunds 16% 1,547,916 33,136,923 17,462,534 - 635,027 52,782,400Other liabilities - - - - 3,099,487 3,099,487Tax payable - - - - 1,991,510 1,991,510 1,547,916 33,136,923 17,462,534 - 35,060,106 87,207,479Net assets /(liabilities) 6,452,084 123,298,777 (17,462,534) - (26,857,202) 85,431,125
Year ended 31 December 2015
Applicable average from 2 interest Up to 1 From 1 to From 1 year years and Non interest rate month 12 months to 2 years above bearing Total Ushs ‘000 Ushs ‘000 Ushs ‘000 Ushs ‘000 Ushs ‘000 Ushs ‘000
ASSETS Cash and bank - - - - 5,853,142 5,853,142Short term deposits 14% - 3,022,160 - - - 3,022,160Loans and advances tocustomers 25% 15,000,000 112,767,734 - - - 127,767,734Other Assets - - - - 1,365,691 1,365,691 15,000,000 115,789,894 - 7,218,833 138,008,727 Equity and liabilities Loan Security fund - - - - 22,506,807 22,506,807Related party payables - - - - 1,707,616 1,707,616Borrowings and managed funds 16% 12,700,000 31,682,860 6,667,000 - 766,648 51,816,508Other liabilities - - - - 8,548,949 8,548,949Tax payable - - - - 55,856 55,856 12,700,000 31,682,860 6,667,000 - 33,585,876 84,635,736Net assets / (liabilities) 2,300,000 84,107,034 (6,667,000) - (26,367,043) 53,372,991
The previous tables show the undiscounted cash flows on the Company’s financial liabilities and unrecognized loan commitments on the basis of their earliest possible contractual maturity. The Company’s expected cash flows on these instruments may vary from this analysis. A 1% increase/decrease in interest rates in the current year would affect profit and loss by Ushs +/-1,061,703,412.
(d) Liquidity risk
Liquidity risk is the risk that operations cannot be funded and financial commitments cannot be met timely and cost effectively. The risk arises from both the difference between the magnitude of assets and liabilities and the disproportion in their maturities. Liquidity risk management deals with the overall profile of the balance sheet, the funding requirements of the Company and cash flows. In quantifying the liquidity risk, future cash flow projections are simulated and necessary arrangements are put in place in order to ensure that all future cash flow commitments are met from the working capital generated by the Company and also from available financial institutions facilities.
BRAC Uganda Microfinance Limited manages its debt maturity profile, operating cash flows and the availability of funding so as to meet all refinancing, repayment and funding needs. As part of its overall liquidity management, BRAC Uganda Microfinance Limited maintains sufficient levels of cash or fixed deposits to meet its working capital requirements. In addition, BRAC Uganda Microfinance Limited maintains banking facilities of a reasonable level.
Exposure to Liquidity risk
The table below analyses assets and liabilities into relevant maturity groupings based on the remaining period at 31 December 2016 to the contractual maturity date.
Matured Less than 3 months 3 months to 1 year 1 to 5 years Above 5 years Total Ushs ‘000 Ushs ‘000 Ushs ‘000 Ushs ‘000 Ushs ‘000 Ushs ‘000
ASSETS Cash and bank 5,879,859 - - - - 5,879,859Short term deposits - 8,000,000 - - - 8,000,000Loans and advances to customers - - 156,435,700 - - 156,435,700Related party receivable - - 148,936 - - 148,936Other assets - 2,174,109 - - - 2,174,109 5,879,859 10,174,109 156,584,636 - - 172,638,604
Equity and Liabilities Loan Security Fund 959,693 11,276,773 16,139,500 - - 28,375,966Related party payables - - 562,194 - - 562,194Borrowings and managed funds - 1,200,000 34,684,838 16,897,562 - 52,782,400Bank overdrafts - 395,922 - - - 395,922Other liabilities - 3,099,487 - - - 3,099,487Tax payable - - 1,991,510 - - 1,991,510 959,693 15,972,182 53,378,042 16,897,562 - 87,207,479 Liquidity gap 4,920,166 (5,798,073) 103,206,594 (16,897,562) - 85,431,125
BRAC UGANDA MICROFINANCE LIMITED
NOTES TO THR FINANCIAL STATEMENTS REPORT FOR YEAR ENDED 31 DECEMBER 2016 CONTINUED
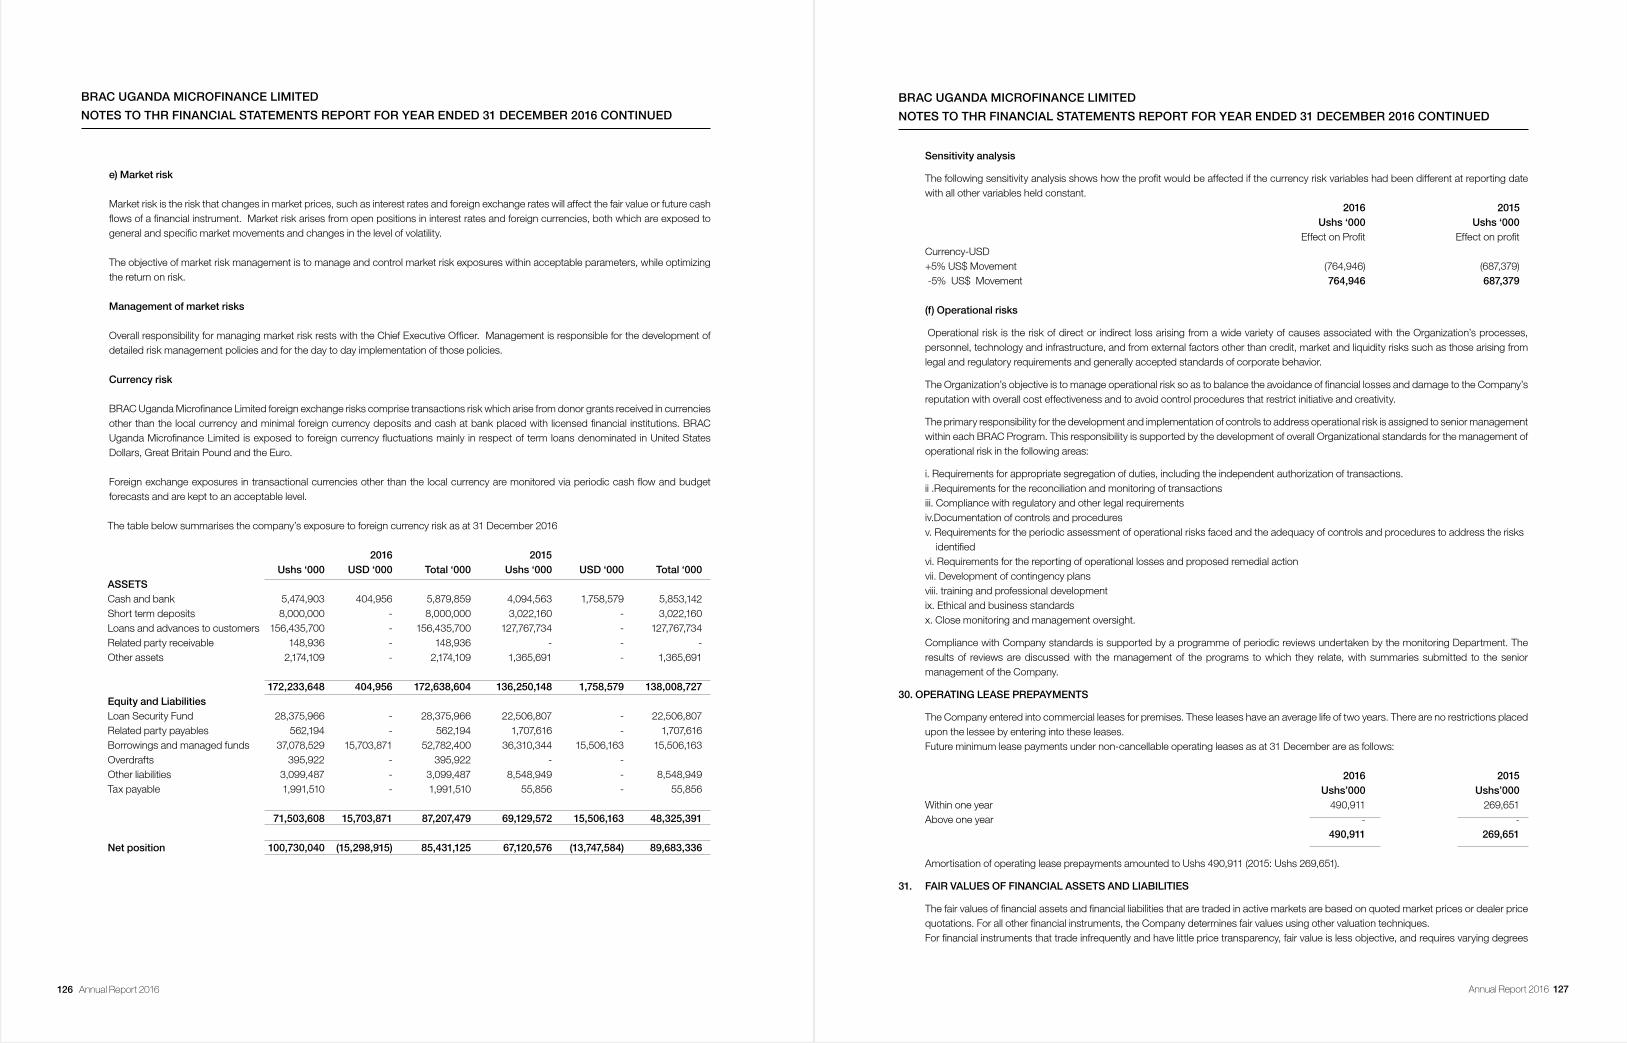
126 Annual Report 2016 Annual Report 2016 127
e) Market risk
Market risk is the risk that changes in market prices, such as interest rates and foreign exchange rates will affect the fair value or future cash flows of a financial instrument. Market risk arises from open positions in interest rates and foreign currencies, both which are exposed to general and specific market movements and changes in the level of volatility.
The objective of market risk management is to manage and control market risk exposures within acceptable parameters, while optimizing the return on risk.
Management of market risks
Overall responsibility for managing market risk rests with the Chief Executive Officer. Management is responsible for the development of detailed risk management policies and for the day to day implementation of those policies.
Currency risk
BRAC Uganda Microfinance Limited foreign exchange risks comprise transactions risk which arise from donor grants received in currencies other than the local currency and minimal foreign currency deposits and cash at bank placed with licensed financial institutions. BRAC Uganda Microfinance Limited is exposed to foreign currency fluctuations mainly in respect of term loans denominated in United States Dollars, Great Britain Pound and the Euro.
Foreign exchange exposures in transactional currencies other than the local currency are monitored via periodic cash flow and budget forecasts and are kept to an acceptable level.
The table below summarises the company’s exposure to foreign currency risk as at 31 December 2016
2016 2015 Ushs ‘000 USD ‘000 Total ‘000 Ushs ‘000 USD ‘000 Total ‘000ASSETS Cash and bank 5,474,903 404,956 5,879,859 4,094,563 1,758,579 5,853,142Short term deposits 8,000,000 - 8,000,000 3,022,160 - 3,022,160Loans and advances to customers 156,435,700 - 156,435,700 127,767,734 - 127,767,734Related party receivable 148,936 - 148,936 - - -Other assets 2,174,109 - 2,174,109 1,365,691 - 1,365,691 172,233,648 404,956 172,638,604 136,250,148 1,758,579 138,008,727Equity and Liabilities Loan Security Fund 28,375,966 - 28,375,966 22,506,807 - 22,506,807Related party payables 562,194 - 562,194 1,707,616 - 1,707,616Borrowings and managed funds 37,078,529 15,703,871 52,782,400 36,310,344 15,506,163 15,506,163Overdrafts 395,922 - 395,922 - - Other liabilities 3,099,487 - 3,099,487 8,548,949 - 8,548,949Tax payable 1,991,510 - 1,991,510 55,856 - 55,856 71,503,608 15,703,871 87,207,479 69,129,572 15,506,163 48,325,391 Net position 100,730,040 (15,298,915) 85,431,125 67,120,576 (13,747,584) 89,683,336
BRAC UGANDA MICROFINANCE LIMITED
NOTES TO THR FINANCIAL STATEMENTS REPORT FOR YEAR ENDED 31 DECEMBER 2016 CONTINUED
Sensitivity analysis
The following sensitivity analysis shows how the profit would be affected if the currency risk variables had been different at reporting date with all other variables held constant. 2016 2015 Ushs ‘000 Ushs ‘000 Effect on Profit Effect on profitCurrency-USD +5% US$ Movement (764,946) (687,379) -5% US$ Movement 764,946 687,379 (f) Operational risks
Operational risk is the risk of direct or indirect loss arising from a wide variety of causes associated with the Organization’s processes, personnel, technology and infrastructure, and from external factors other than credit, market and liquidity risks such as those arising from legal and regulatory requirements and generally accepted standards of corporate behavior.
The Organization’s objective is to manage operational risk so as to balance the avoidance of financial losses and damage to the Company’s reputation with overall cost effectiveness and to avoid control procedures that restrict initiative and creativity.
The primary responsibility for the development and implementation of controls to address operational risk is assigned to senior management within each BRAC Program. This responsibility is supported by the development of overall Organizational standards for the management of operational risk in the following areas:
i. Requirements for appropriate segregation of duties, including the independent authorization of transactions.ii . Requirements for the reconciliation and monitoring of transactionsiii. Compliance with regulatory and other legal requirements iv.Documentation of controls and proceduresv. Requirements for the periodic assessment of operational risks faced and the adequacy of controls and procedures to address the risks identifiedvi. Requirements for the reporting of operational losses and proposed remedial actionvii. Development of contingency plansviii. training and professional developmentix. Ethical and business standardsx. Close monitoring and management oversight.
Compliance with Company standards is supported by a programme of periodic reviews undertaken by the monitoring Department. The results of reviews are discussed with the management of the programs to which they relate, with summaries submitted to the senior management of the Company.
30. OPERATING LEASE PREPAYMENTS
The Company entered into commercial leases for premises. These leases have an average life of two years. There are no restrictions placed upon the lessee by entering into these leases.Future minimum lease payments under non-cancellable operating leases as at 31 December are as follows:
2016 2015 Ushs’000 Ushs’000Within one year 490,911 269,651Above one year - - 490,911 269,651
Amortisation of operating lease prepayments amounted to Ushs 490,911 (2015: Ushs 269,651).
31. FAIR VALUES OF FINANCIAL ASSETS AND LIABILITIES
The fair values of financial assets and financial liabilities that are traded in active markets are based on quoted market prices or dealer price quotations. For all other financial instruments, the Company determines fair values using other valuation techniques.For financial instruments that trade infrequently and have little price transparency, fair value is less objective, and requires varying degrees
BRAC UGANDA MICROFINANCE LIMITED
NOTES TO THR FINANCIAL STATEMENTS REPORT FOR YEAR ENDED 31 DECEMBER 2016 CONTINUED
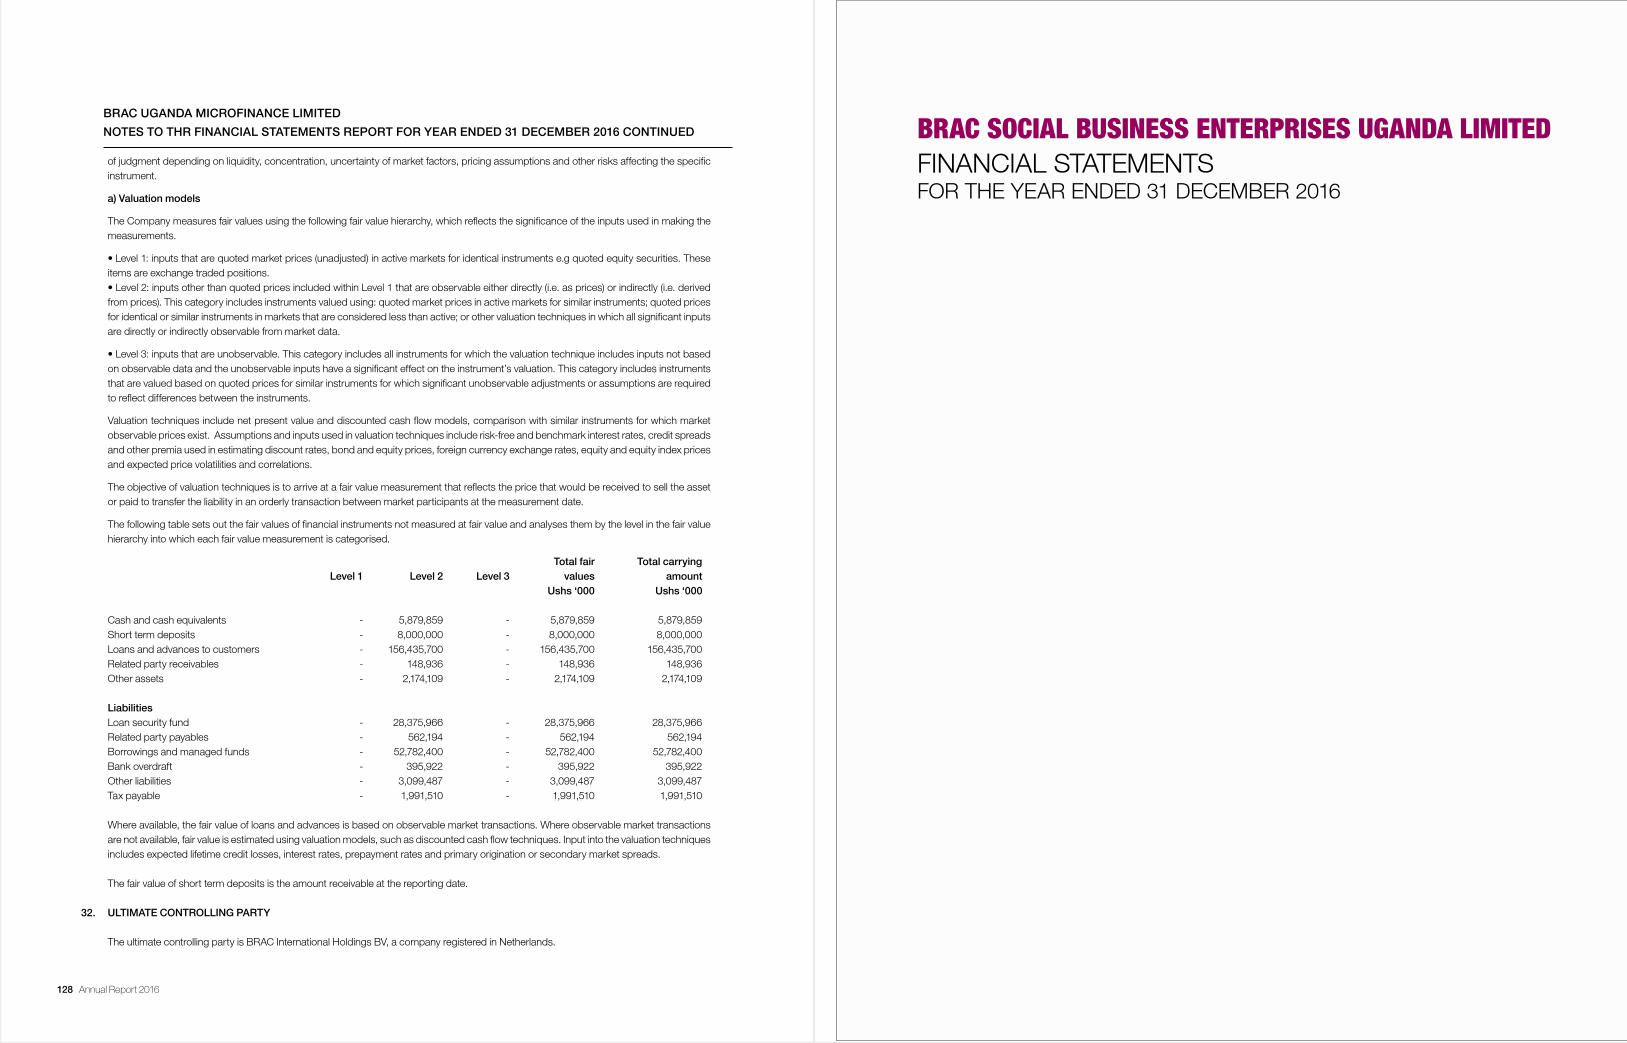
128 Annual Report 2016
BRAC UGANDA MICROFINANCE LIMITED
NOTES TO THR FINANCIAL STATEMENTS REPORT FOR YEAR ENDED 31 DECEMBER 2016 CONTINUED
of judgment depending on liquidity, concentration, uncertainty of market factors, pricing assumptions and other risks affecting the specific instrument.
a) Valuation models
The Company measures fair values using the following fair value hierarchy, which reflects the significance of the inputs used in making the measurements.
• Level 1: inputs that are quoted market prices (unadjusted) in active markets for identical instruments e.g quoted equity securities. These items are exchange traded positions. • Level 2: inputs other than quoted prices included within Level 1 that are observable either directly (i.e. as prices) or indirectly (i.e. derived from prices). This category includes instruments valued using: quoted market prices in active markets for similar instruments; quoted prices for identical or similar instruments in markets that are considered less than active; or other valuation techniques in which all significant inputs are directly or indirectly observable from market data.
• Level 3: inputs that are unobservable. This category includes all instruments for which the valuation technique includes inputs not based on observable data and the unobservable inputs have a significant effect on the instrument’s valuation. This category includes instruments that are valued based on quoted prices for similar instruments for which significant unobservable adjustments or assumptions are required to reflect differences between the instruments.
Valuation techniques include net present value and discounted cash flow models, comparison with similar instruments for which market observable prices exist. Assumptions and inputs used in valuation techniques include risk-free and benchmark interest rates, credit spreads and other premia used in estimating discount rates, bond and equity prices, foreign currency exchange rates, equity and equity index prices and expected price volatilities and correlations.
The objective of valuation techniques is to arrive at a fair value measurement that reflects the price that would be received to sell the asset or paid to transfer the liability in an orderly transaction between market participants at the measurement date.
The following table sets out the fair values of financial instruments not measured at fair value and analyses them by the level in the fair value hierarchy into which each fair value measurement is categorised.
Total fair Total carrying Level 1 Level 2 Level 3 values amount Ushs ‘000 Ushs ‘000 Cash and cash equivalents - 5,879,859 - 5,879,859 5,879,859Short term deposits - 8,000,000 - 8,000,000 8,000,000Loans and advances to customers - 156,435,700 - 156,435,700 156,435,700Related party receivables - 148,936 - 148,936 148,936Other assets - 2,174,109 - 2,174,109 2,174,109
Liabilities Loan security fund - 28,375,966 - 28,375,966 28,375,966Related party payables - 562,194 - 562,194 562,194Borrowings and managed funds - 52,782,400 - 52,782,400 52,782,400Bank overdraft - 395,922 - 395,922 395,922Other liabilities - 3,099,487 - 3,099,487 3,099,487Tax payable - 1,991,510 - 1,991,510 1,991,510
Where available, the fair value of loans and advances is based on observable market transactions. Where observable market transactions are not available, fair value is estimated using valuation models, such as discounted cash flow techniques. Input into the valuation techniques includes expected lifetime credit losses, interest rates, prepayment rates and primary origination or secondary market spreads.
The fair value of short term deposits is the amount receivable at the reporting date.
32. ULTIMATE CONTROLLING PARTY
The ultimate controlling party is BRAC International Holdings BV, a company registered in Netherlands.
BRAC SOCIAL BUSINESS ENTERPRISES UGANDA LIMITED
FINANCIAL STATEMENTSFOR THE YEAR ENDED 31 DECEMBER 2016
130 Annual Report 2016 Annual Report 2016 131
BRAC SOCIAL BUSINESS ENTERPRISES UGANDA LIMITED
REPORT AND FINANCIAL STATEMENTS FOR YEAR ENDED 31 DECEMBER 2016
DIRECTORS
Dr. A M R Chowdhury - Chairperson Mr. Faruque Ahmed - Member Mr. Shib Narayan Kairy - Member
ADMINISTRATORS
Ms. Hasina Akhter - Country Representative (Appointed on 1 march 2017)Mr. Bhuiyan Muhammad Imran - Country Representative (Resigned on 28 February 2017)
PRINCIPAL PLACE OF BUSINESS: Off Entebbe Road, Nyanama Plot 90, Busingiri Zone P O Box 31817 Kampala Uganda
REGISTERED OFFICE: Off Entebbe Road, Nyanama Plot 90, Busingiri Zone P O Box 31817 Kampala, Uganda
COMPANY SECRETARY: Mr. Shib Narayan Kairy Chief Financial Officer, BRAC and BRAC International BRAC Centre, 75 Mohakhali, Dhaka 1212, Bangladesh
AUDITORS
KPMGCertified Public Accountants 3rd Floor, Rwenzori Courts, Plot 2 & 4A, Nakasero Road, P.O. Box 3509 Kampala, Uganda
BANKERS
Standard Chartered Bank Uganda Ltd Stanbic Bank Uganda LtdPlot 5 Speak Road Plot 17 Hannington Road, Crested Towers P.O Box 7111 P O Box 7131 Kampala, Uganda Kampala, Uganda
BRAC SOCIAL BUSINESS ENTERPRISES UGANDA LIMITED
DIRECTORS’ REPORT FOR YEAR ENDED 31 DECEMBER 2016 CONTINUED
The directors have pleasure in submitting their report and the audited financial statements of the company for the year ended 31 December 2016, which disclose the state of affairs of the company.
(a) Registration
BRAC is the largest non-governmental development organization in the world, measured by the number of employees and number of people it has helped. BRAC was ranked the number one NGO in the world for the second consecutive year in 2017 by the Geneva based NGO Advisor, an independent organization committed to highlighting innovation, impact and governance in the non profit sector. BRAC retained the top spot as part of the 2017 top 500 NGOs World rankings.
BRAC begun its work in Uganda in June 2006, it chose to work in Uganda because of the opportunities to make a significant difference in a post-conflict country with high poverty and fertility rates as well as demonstrate the potential of its “microfinance multiplied” approach to other in the microfinance industry in Africa
BRAC Social Business Enterprises Uganda limited was incorporated as a limited liability company on 9 April 2010 as an independent Company. Its vision is to develop a just, enlightened, healthy and democratic society free from hunger, poverty, environmental degradation and all forms of based on age, sex and ethnicity. In order to achieve this vision, BRAC Social Business Enterprises Uganda limited uses sustainable social businesses to create and protect the livelihoods of poor.
The Company effectively commenced trading on 1 January 2012 as BRAC Social Business Enterprises Uganda limited.
(b) VISION
A world free from all forms of exploitation and discrimination where everyone has the opportunity to realise their potential.
(c) MISSION
The Company’s mission is to empower people and communities in situations of poverty, illiteracy, disease and social injustice. The interventions aim to achieve large scale, positive changes through economic and social programmes that enable men and women to realise their potential.
(d) OUR VALUES
Innovation- We have been an innovator in the creation of opportunities for the poor to lift themselves out of poverty. We value creativity in programme design and strive to display global leadership in groundbreaking development initiatives.
Integrity- We value transparency and accountability in all our professional work, with clear policies and procedures, while displaying the utmost level of honesty in our financial dealings. The Company holds these to be the most essential elements of our work ethic.
Inclusiveness- We are committed to engaging, supporting and recognising the value of all members of society, regardless of race, religion, gender, nationality, ethnicity, age, physical or mental ability, socioeconomic status and geography.
Effectiveness- We value efficiency and excellence in all our work, constantly challenging ourselves to perform better, to meet and exceed programme targets, and to improve and deepen the impact of our interventions.
(e) Principal activities
The Company packs and sells seeds of Agricultural and Horticultural crops.
(f) Results from operations
The results for the Company for the year ended 31 December 2016 are set out on page 137.
(g) Composition of Directors
The directors who served during the year and up to the date of this report are set out on page 130.
132 Annual Report 2016 Annual Report 2016 133
BRAC SOCIAL BUSINESS ENTERPRISES UGANDA LIMITED
DIRECTORS’ REPORT FOR YEAR ENDED 31 DECEMBER 2016 CONTINUED
(h) Directorsbenefits
No director has received or become entitled to receive any benefits during the financial year.
(i) CORPORATE GOVERNANCE
The directors are committed to the principles of good corporate governance and recognize the need to conduct the business in accordance with generally accepted best practice. In so doing the directors therefore confirm that: • The Board of Directors met regularly throughout the year; • They retain full and effective control over the Company; • The Board accepts and exercises responsibility for strategic and policy decisions, the approval of budgets and the monitoring of performance; and • They bring skills and experience from their own spheres of business to complement the professional experience and skills of the management team.
In 2016 the Board of Directors had three directors. The Board continued to carry out its role of formulating policies and strategies of the Company, reviewing the business plan, ensuring that the accounting system is maintained in accordance with acceptable standards, the books of the Company are kept properly, and that accounts are checked by authorised auditors, as well as recruitment and development of key personnel.
(j) RISK MANAGEMENT
The board accepts the final responsibility for the risk management and internal control system of the Company. The management ensures that adequate internal financial and operational control systems are developed and maintained on an ongoing basis in order to provide reasonable assurance regarding; • The effectiveness and efficiency of operations; • Safeguarding of the Company’s assets; • Compliance with applicable laws and regulations; • The reliability of accounting records; • Business sustainability under normal as well as adverse conditions; and • Responsible behaviors towards all stakeholders.
The efficiency of any internal control system is dependent on the strict observance of prescribed measures. There is always a risk of non- compliance of such measures by staff. Whilst no system of internal control can provide absolute assurance against misstatement or losses, the Company’s system is designed to provide the Board with reasonable assurance that the procedures in place are operating effectively.
(k) MANAGEMENT STRUCTURE
The Company is under the supervision of the Board of Directors and the day to day management is entrusted to the Country Representative who is assisted by the heads of divisions, departments and units. The organisation structure of the Company comprises of the following divisions: • Accounts and finance; • Public relations • Internal audit; • Monitoring unit; • Branch review unit; • Agriculture • IT and MIS; • Human resources; • BRAC Learning Centre; • Communications and • Procurement, logistics and transportation
(l) RELATED PARTY TRANSACTIONS
BRAC SOCIAL BUSINESS ENTERPRISES UGANDA LIMITED
DIRECTORS’ REPORT FOR YEAR ENDED 31 DECEMBER 2016 CONTINUED
Related party transactions are disclosed in Note 13 to the financial statements.
(m) DEVELOPMENT PLANS BRAC International Holdings BV purchased all 99 shares held by BRAC Industries Limited in BRAC Social Business Enterprises Uganda Limited. The transaction was completed on 06 January 2016. Authorized share capital was also increased from UGX 1 million to UGX 10.5 billion and the company issued 243,300 new shares to BRAC BV.
(n) KEY ACHIEVEMENTS IN 2016
The Seed Processing Plant was fully operational and this enhanced the quality of seeds and germination rate. Ten new varieties for vegetables and maize were introduced which boosted the production rate up to 370MT.
(o) SOLVENCY
The Board of Directors has reasonable expectation that the Company has adequate resources to continue in operational existence for the foreseeable future. The Board of Directors confirms that applicable accounting standards have been followed and that the financial statements have been prepared on a going concern basis.
(p) EMPLOYEES’ WELFARE
Management/employee relationship There were continued good relation between employees and management for the year ended 31 December 2016. There were no unresolved complaints received by management from the employees during the year. The Company is an equal opportunity employer. It gives equal access to employment opportunities and ensures that the best available person is appointed to any given position free from discrimination of any kind and without regard to factors like gender, marital status, tribes, religion and disability which does not impair ability to discharge duties.
Training Training and development of staff capacity is one of the key priorities of the company. During the year, line managers had special training in BRAC Values, Gender awareness, and Diversity and Inclusion.. Medical assistance The Company has in place a medical insurance policy for all its staff.
Retirementbenefit All eligible employees are members of the National Social Security Fund (NSSF) which is an approved pension fund. The Company contributes 10% of the employees’ gross salary.
The NSSF is a defined contribution scheme with BRAC Social Business Enterprises Uganda limited having no legal or constructive obligation to pay further top-up contributions
(q) GENDER PARITY In 2016, the company had a total staff of 24 staff (21 in 2015), female being 50% of the total staff. (r) Auditors
The auditors, KPMG, being eligible for re-appointment have expressed their willingness to continue in office in accordance with the terms of Section 167(2) of the Companies Act of Uganda.
(s) Approvalofthefinancialstatements
The financial statements were approved by the directors at a meeting held on 13 April 2017.
By order of the Board
………………………………… Date: ……………………………SECRETARY
134 Annual Report 2016 Annual Report 2016 135
BRAC SOCIAL BUSINESS ENTERPRISES UGANDA LIMITED
STATEMENTS OF DIRECTORS’ FOR YEAR ENDED 31 DECEMBER 2016
The Company’s directors are responsible for the preparation and fair presentation of the financial statements, comprising the statement of financial position as at 31 December 2016 and the statements of comprehensive income, changes in equity and cash flows for the year then ended, and the notes to the financial statements, which include a summary of significant accounting policies and other explanatory notes, in accordance with International Financial Reporting Standards and the Companies Act of Uganda, and for such internal controls as the directors determine is necessary to enable the preparation of financial statements that are free from material misstatement, whether due to fraud or error. The directors’ responsibilities include: designing, implementing and maintaining internal controls relevant to the preparation and fair presentation of these financial statements that are free from material misstatement, whether due to fraud or error; selecting and applying appropriate accounting policies; and making accounting estimates that are reasonable in the circumstances. They are also responsible for safe guarding the assets of the company.
Under the Companies Act of Uganda, the directors are required to prepare financial statements for each year that give a true and fair view of the state of affairs of the Company as at the end of the financial year and of the operating results of the Company for that year. It also requires the directors to ensure the Company keeps proper accounting records that disclose with reasonable accuracy the financial position of the Company.
The directors are required to prepare financial statements for each year that give a true and fair view of the state of affairs of the Company as at the end of the financial year and of the operating results of the Company for that year. It also requires the directors to ensure the Company keeps proper accounting records that disclose with reasonable accuracy the financial position of the Company.
The directors accept responsibility for the financial statements set out on pages 9 to 35 which have been prepared using appropriate accounting policies supported by reasonable and prudent judgment and estimates, in conformity with International Financial Reporting Standards and the Companies Act of Uganda. The directors are of the opinion that the financial statements give a true and fair view of the state of the financial affairs and of its operating results for the year ended 31 December 2016.
The directors further accept responsibility for the maintenance of accounting records that may be relied upon in the preparation of financial statements, as well as adequate systems of internal financial control.
The directors have made an assessment of the Company’s ability to continue as a going concern and have no reason to believe the Company will not be a going concern for the next twelve months from the date of this statement.
Approvalofthefinancialstatements
The financial statements were approved by the board of directors on 13 April 2017 and were signed on its behalf by:
Director Director
Date: .................................2016
REPORT OF THE INDEPENDENT AUDITORS TO THE MEMBERS OF BRAC SOCIAL
BUSINESS ENTERPRISES LIMITED
Report on the Financial Statements
Opinion
We have audited the financial statements of BRAC Social Business Enterprises Uganda Limited (“the Company”), which comprise the statement of financial position as at 31 December 2016, and the statements of comprehensive income, changes in equity and cash flows for the year then ended, and notes to the financial statements including a summary of significant accounting policies and other explanatory information as set out on pages 137 to 158.
In our opinion, the financial statements give a true and fair view of the financial position of BRAC Social Business Enterprises Uganda Limited as at 31 December 2016, and of its financial performance and its cash flows for the year then ended in accordance with International Financial Reporting Standards (IFRS) and the Companies Act of Uganda.
Basis for Opinion
We conducted our audit in accordance with International Standards on Auditing (ISAs). Our responsibilities under those standards are further described in the Auditors’ Responsibilities for the Audit of the Financial Statements section of our report. We are independent of the Company in accordance with the International Ethics Standards Board for Accountants’ Code of Ethics for Professional Accountants (IESBA Code) together with the ethical requirements that are relevant to our audit of the financial statements in Uganda and we have fulfilled our other ethical responsibilities in accordance with these requirements and the IESBA Code.We believe that the audit evidence we have obtained is sufficient and appropriate to provide a basis for our opinion.
Other Information
The directors are responsible for the other information. The other information comprises the information included in the General Information, Directors’ Report, Statement of Directors’ Responsibility, the memorandum figures reported in United States Dollars (USD$) and the segment information in Note 27 but does not include the financial statements and our auditors’ report thereon.
Our opinion on the financial statements does not cover the other information and we do not express any form of assurance conclusion thereon.
In connection with our audit of the financial statements, our responsibility is to read the other information and, in doing so, consider whether the other information is materially inconsistent with the financial statements or our knowledge obtained in the audit, or otherwise appears to be materially misstated. If, based on the work we have performed, we conclude that there is a material misstatement of this other information, we are required to report that fact. We have nothing to report in this regard.
Responsibilities of Directors for the Financial Statements
The directors are responsible for the preparation and fair presentation of the financial statements in accordance with International Financial Reporting Standards (IFRS), the Companies Act of Uganda and for such internal control as the directors determine is necessary to enable the preparation of financial statements that are free from material misstatement, whether due to fraud or error.In preparing the financial statements, the directors are responsible for assessing the Company’s ability to continue as a going concern, disclosing, as applicable, matters related to going concern and using the going concern basis of accounting unless management either intends to liquidate the Company or to cease operations, or has no realistic alternative but to do so.
Auditors’ Responsibilities for the Audit of the Financial Statements
Our objectives are to obtain reasonable assurance about whether the financial statements as a whole are free from material misstatement, whether due to fraud or error, and to issue an auditors’ report that includes our opinion. Reasonable assurance is a high level of assurance, but is not a guarantee that an audit conducted in accordance with ISAs will always detect a material misstatement when it exists. Misstatements can arise from fraud or error and are considered material if, individually or in the aggregate, they could reasonably be expected to influence the economic decisions of users taken on the basis of these financial statements.
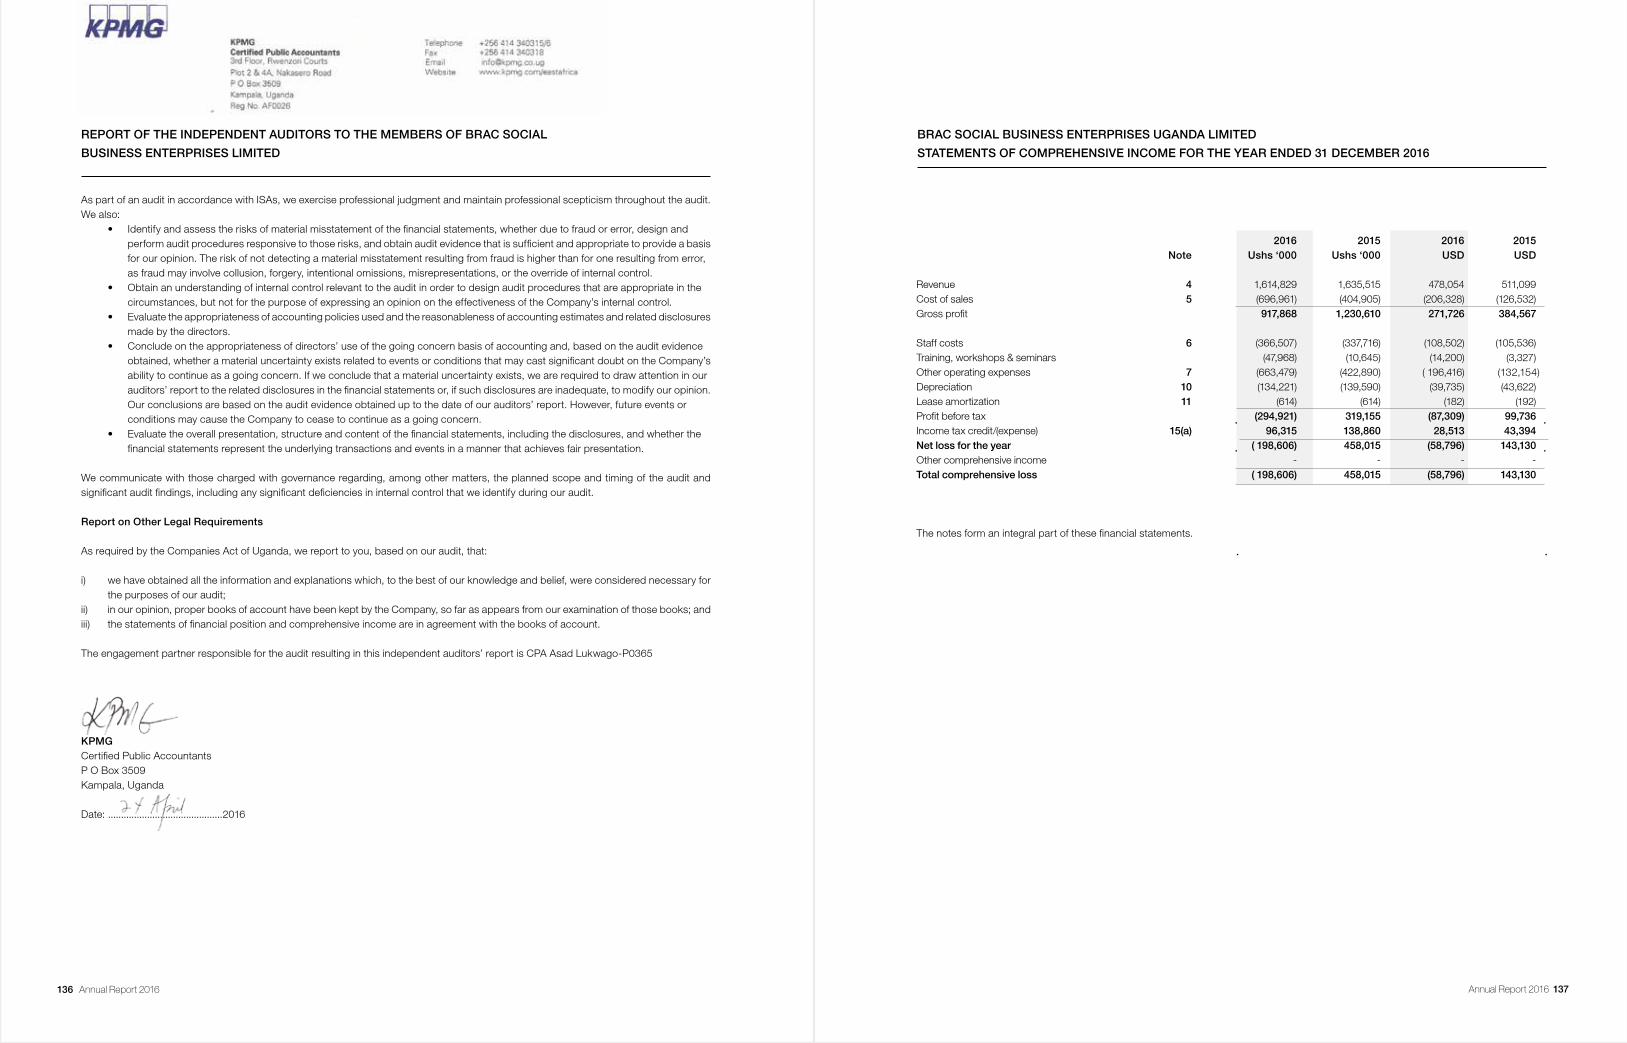
136 Annual Report 2016 Annual Report 2016 137
REPORT OF THE INDEPENDENT AUDITORS TO THE MEMBERS OF BRAC SOCIAL
BUSINESS ENTERPRISES LIMITED
As part of an audit in accordance with ISAs, we exercise professional judgment and maintain professional scepticism throughout the audit. We also: • Identify and assess the risks of material misstatement of the financial statements, whether due to fraud or error, design and perform audit procedures responsive to those risks, and obtain audit evidence that is sufficient and appropriate to provide a basis for our opinion. The risk of not detecting a material misstatement resulting from fraud is higher than for one resulting from error, as fraud may involve collusion, forgery, intentional omissions, misrepresentations, or the override of internal control. • Obtain an understanding of internal control relevant to the audit in order to design audit procedures that are appropriate in the circumstances, but not for the purpose of expressing an opinion on the effectiveness of the Company’s internal control. • Evaluate the appropriateness of accounting policies used and the reasonableness of accounting estimates and related disclosures made by the directors. • Conclude on the appropriateness of directors’ use of the going concern basis of accounting and, based on the audit evidence obtained, whether a material uncertainty exists related to events or conditions that may cast significant doubt on the Company’s ability to continue as a going concern. If we conclude that a material uncertainty exists, we are required to draw attention in our auditors’ report to the related disclosures in the financial statements or, if such disclosures are inadequate, to modify our opinion. Our conclusions are based on the audit evidence obtained up to the date of our auditors’ report. However, future events or conditions may cause the Company to cease to continue as a going concern. • Evaluate the overall presentation, structure and content of the financial statements, including the disclosures, and whether the financial statements represent the underlying transactions and events in a manner that achieves fair presentation.
We communicate with those charged with governance regarding, among other matters, the planned scope and timing of the audit and significant audit findings, including any significant deficiencies in internal control that we identify during our audit.
Report on Other Legal Requirements
As required by the Companies Act of Uganda, we report to you, based on our audit, that:
i) we have obtained all the information and explanations which, to the best of our knowledge and belief, were considered necessary for the purposes of our audit;ii) in our opinion, proper books of account have been kept by the Company, so far as appears from our examination of those books; andiii) the statements of financial position and comprehensive income are in agreement with the books of account.
The engagement partner responsible for the audit resulting in this independent auditors’ report is CPA Asad Lukwago-P0365
KPMGCertified Public AccountantsP O Box 3509Kampala, Uganda
Date: ............................................2016
BRAC SOCIAL BUSINESS ENTERPRISES UGANDA LIMITED
STATEMENTS OF COMPREHENSIVE INCOME FOR THE YEAR ENDED 31 DECEMBER 2016
2016 2015 2016 2015 Note Ushs ‘000 Ushs ‘000 USD USD
Revenue 4 1,614,829 1,635,515 478,054 511,099Cost of sales 5 (696,961) (404,905) (206,328) (126,532)Gross profit 917,868 1,230,610 271,726 384,567 Staff costs 6 (366,507) (337,716) (108,502) (105,536)Training, workshops & seminars (47,968) (10,645) (14,200) (3,327)Other operating expenses 7 (663,479) (422,890) ( 196,416) (132,154)Depreciation 10 (134,221) (139,590) (39,735) (43,622)Lease amortization 11 (614) (614) (182) (192)Profit before tax (294,921) 319,155 (87,309) 99,736Income tax credit/(expense) 15(a) 96,315 138,860 28,513 43,394Net loss for the year ( 198,606) 458,015 (58,796) 143,130Other comprehensive income - - - -Total comprehensive loss ( 198,606) 458,015 (58,796) 143,130
The notes form an integral part of these financial statements.
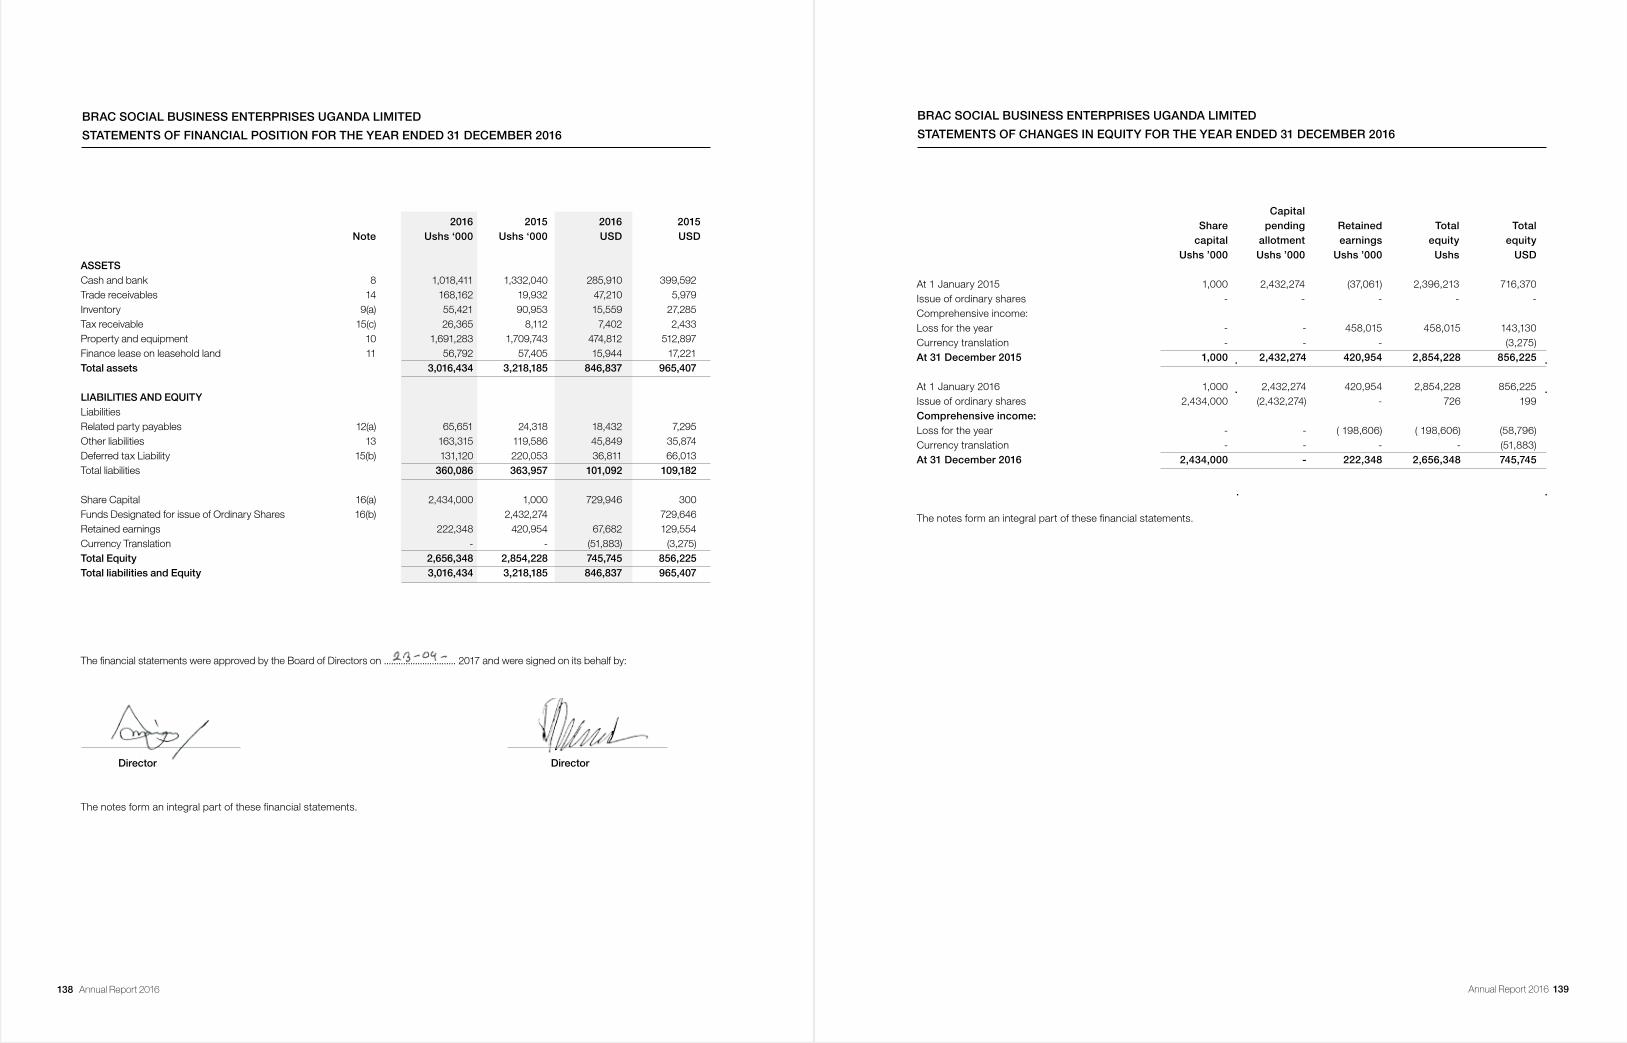
138 Annual Report 2016 Annual Report 2016 139
BRAC SOCIAL BUSINESS ENTERPRISES UGANDA LIMITED
STATEMENTS OF FINANCIAL POSITION FOR THE YEAR ENDED 31 DECEMBER 2016
2016 2015 2016 2015 Note Ushs ‘000 Ushs ‘000 USD USD
ASSETS Cash and bank 8 1,018,411 1,332,040 285,910 399,592Trade receivables 14 168,162 19,932 47,210 5,979Inventory 9(a) 55,421 90,953 15,559 27,285Tax receivable 15(c) 26,365 8,112 7,402 2,433Property and equipment 10 1,691,283 1,709,743 474,812 512,897Finance lease on leasehold land 11 56,792 57,405 15,944 17,221Total assets 3,016,434 3,218,185 846,837 965,407
LIABILITIES AND EQUITY Liabilities Related party payables 12(a) 65,651 24,318 18,432 7,295Other liabilities 13 163,315 119,586 45,849 35,874Deferred tax Liability 15(b) 131,120 220,053 36,811 66,013Total liabilities 360,086 363,957 101,092 109,182 Share Capital 16(a) 2,434,000 1,000 729,946 300Funds Designated for issue of Ordinary Shares 16(b) 2,432,274 729,646Retained earnings 222,348 420,954 67,682 129,554Currency Translation - - (51,883) (3,275)Total Equity 2,656,348 2,854,228 745,745 856,225Total liabilities and Equity 3,016,434 3,218,185 846,837 965,407
The financial statements were approved by the Board of Directors on .............................. 2017 and were signed on its behalf by:
Director Director
The notes form an integral part of these financial statements.
Capital Share pending Retained Total Total capital allotment earnings equity equity Ushs ’000 Ushs ’000 Ushs ’000 Ushs USD
At 1 January 2015 1,000 2,432,274 (37,061) 2,396,213 716,370Issue of ordinary shares - - - - -Comprehensive income: Loss for the year - - 458,015 458,015 143,130Currency translation - - - (3,275)At 31 December 2015 1,000 2,432,274 420,954 2,854,228 856,225 At 1 January 2016 1,000 2,432,274 420,954 2,854,228 856,225Issue of ordinary shares 2,434,000 (2,432,274) - 726 199Comprehensive income: Loss for the year - - ( 198,606) ( 198,606) (58,796)Currency translation - - - - (51,883)At 31 December 2016 2,434,000 - 222,348 2,656,348 745,745
The notes form an integral part of these financial statements.
BRAC SOCIAL BUSINESS ENTERPRISES UGANDA LIMITED
STATEMENTS OF CHANGES IN EQUITY FOR THE YEAR ENDED 31 DECEMBER 2016
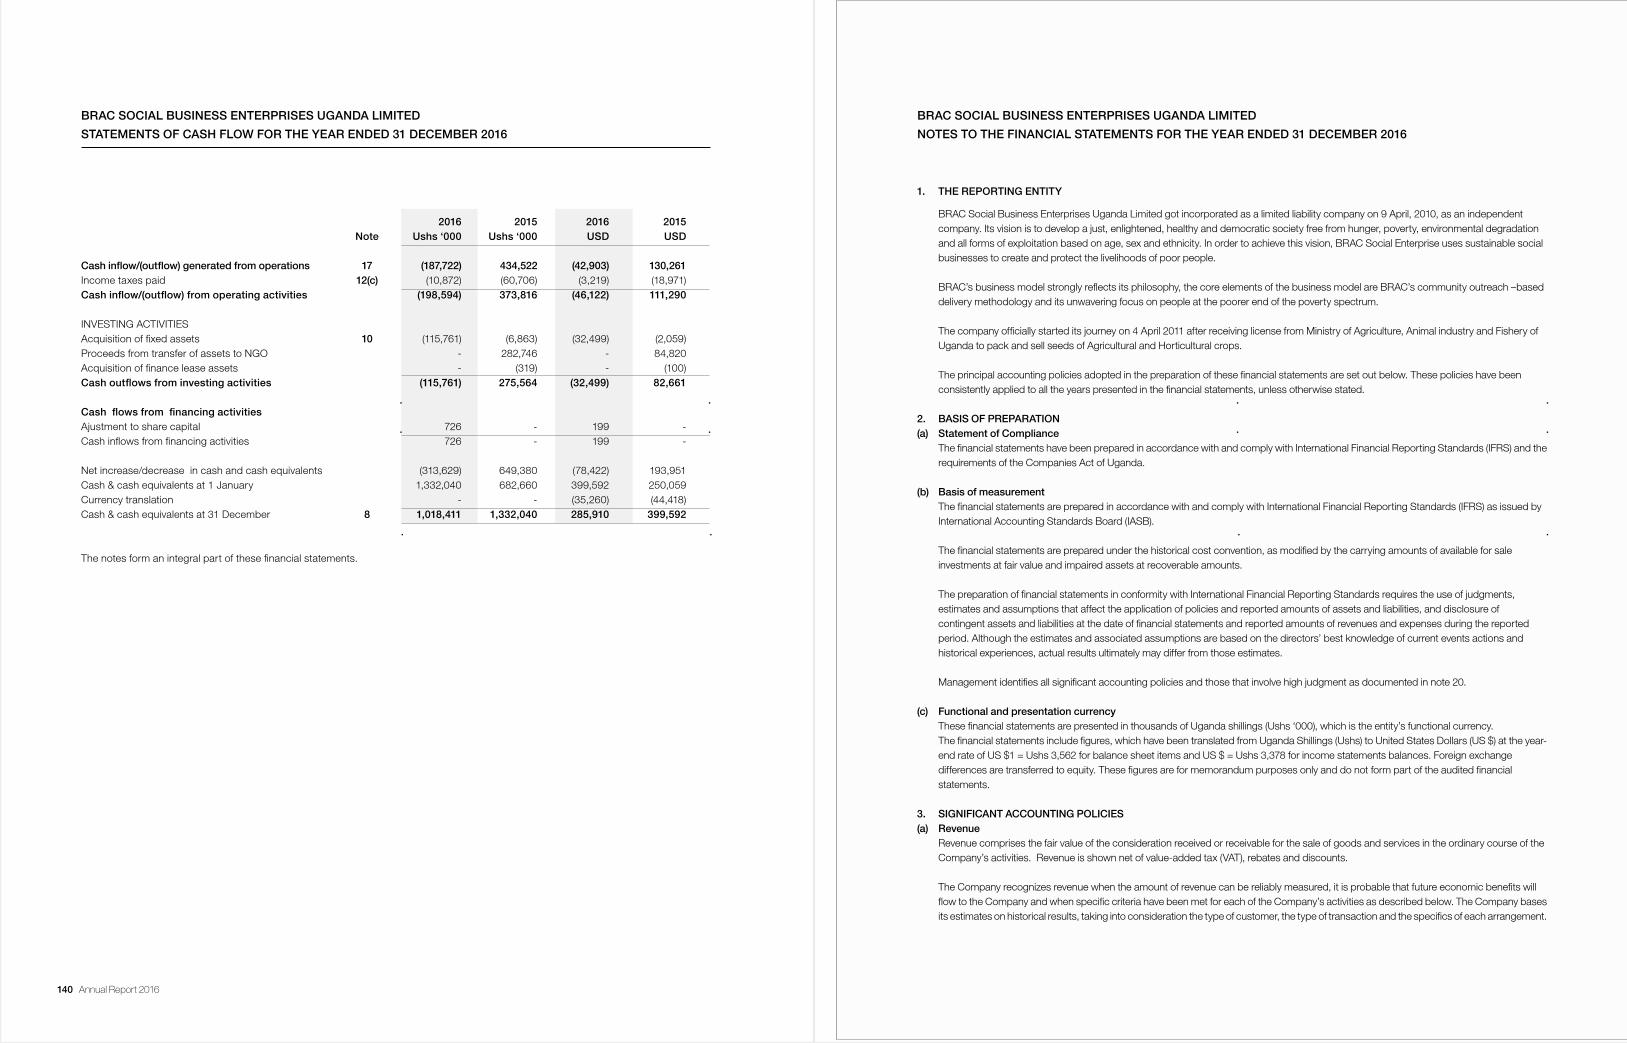
140 Annual Report 2016 Annual Report 2016 141
2016 2015 2016 2015 Note Ushs ‘000 Ushs ‘000 USD USD
Cashinflow/(outflow)generatedfromoperations 17 (187,722) 434,522 (42,903) 130,261Income taxes paid 12(c) (10,872) (60,706) (3,219) (18,971)Cashinflow/(outflow)fromoperatingactivities (198,594) 373,816 (46,122) 111,290 INVESTING ACTIVITIES Acquisition of fixed assets 10 (115,761) (6,863) (32,499) (2,059)Proceeds from transfer of assets to NGO - 282,746 - 84,820Acquisition of finance lease assets - (319) - (100)Cashoutflowsfrominvestingactivities (115,761) 275,564 (32,499) 82,661 Cashflowsfromfinancingactivities Ajustment to share capital 726 - 199 -Cash inflows from financing activities 726 - 199 - Net increase/decrease in cash and cash equivalents (313,629) 649,380 (78,422) 193,951Cash & cash equivalents at 1 January 1,332,040 682,660 399,592 250,059Currency translation - - (35,260) (44,418)Cash & cash equivalents at 31 December 8 1,018,411 1,332,040 285,910 399,592
The notes form an integral part of these financial statements.
BRAC SOCIAL BUSINESS ENTERPRISES UGANDA LIMITED
STATEMENTS OF CASH FLOW FOR THE YEAR ENDED 31 DECEMBER 2016
1. THE REPORTING ENTITY
BRAC Social Business Enterprises Uganda Limited got incorporated as a limited liability company on 9 April, 2010, as an independent company. Its vision is to develop a just, enlightened, healthy and democratic society free from hunger, poverty, environmental degradation and all forms of exploitation based on age, sex and ethnicity. In order to achieve this vision, BRAC Social Enterprise uses sustainable social businesses to create and protect the livelihoods of poor people.
BRAC’s business model strongly reflects its philosophy, the core elements of the business model are BRAC’s community outreach –based delivery methodology and its unwavering focus on people at the poorer end of the poverty spectrum.
The company officially started its journey on 4 April 2011 after receiving license from Ministry of Agriculture, Animal industry and Fishery of Uganda to pack and sell seeds of Agricultural and Horticultural crops.
The principal accounting policies adopted in the preparation of these financial statements are set out below. These policies have been consistently applied to all the years presented in the financial statements, unless otherwise stated. 2. BASIS OF PREPARATION(a) Statement of Compliance The financial statements have been prepared in accordance with and comply with International Financial Reporting Standards (IFRS) and the requirements of the Companies Act of Uganda.
(b) Basis of measurement The financial statements are prepared in accordance with and comply with International Financial Reporting Standards (IFRS) as issued by International Accounting Standards Board (IASB).
The financial statements are prepared under the historical cost convention, as modified by the carrying amounts of available for sale investments at fair value and impaired assets at recoverable amounts.
The preparation of financial statements in conformity with International Financial Reporting Standards requires the use of judgments, estimates and assumptions that affect the application of policies and reported amounts of assets and liabilities, and disclosure of contingent assets and liabilities at the date of financial statements and reported amounts of revenues and expenses during the reported period. Although the estimates and associated assumptions are based on the directors’ best knowledge of current events actions and historical experiences, actual results ultimately may differ from those estimates.
Management identifies all significant accounting policies and those that involve high judgment as documented in note 20.
(c) Functional and presentation currency These financial statements are presented in thousands of Uganda shillings (Ushs ‘000), which is the entity’s functional currency. The financial statements include figures, which have been translated from Uganda Shillings (Ushs) to United States Dollars (US $) at the year- end rate of US $1 = Ushs 3,562 for balance sheet items and US $ = Ushs 3,378 for income statements balances. Foreign exchange differences are transferred to equity. These figures are for memorandum purposes only and do not form part of the audited financial statements. 3. SIGNIFICANT ACCOUNTING POLICIES(a) Revenue Revenue comprises the fair value of the consideration received or receivable for the sale of goods and services in the ordinary course of the Company’s activities. Revenue is shown net of value-added tax (VAT), rebates and discounts.
The Company recognizes revenue when the amount of revenue can be reliably measured, it is probable that future economic benefits will flow to the Company and when specific criteria have been met for each of the Company’s activities as described below. The Company bases its estimates on historical results, taking into consideration the type of customer, the type of transaction and the specifics of each arrangement.
BRAC SOCIAL BUSINESS ENTERPRISES UGANDA LIMITED
NOTES TO THE FINANCIAL STATEMENTS FOR THE YEAR ENDED 31 DECEMBER 2016
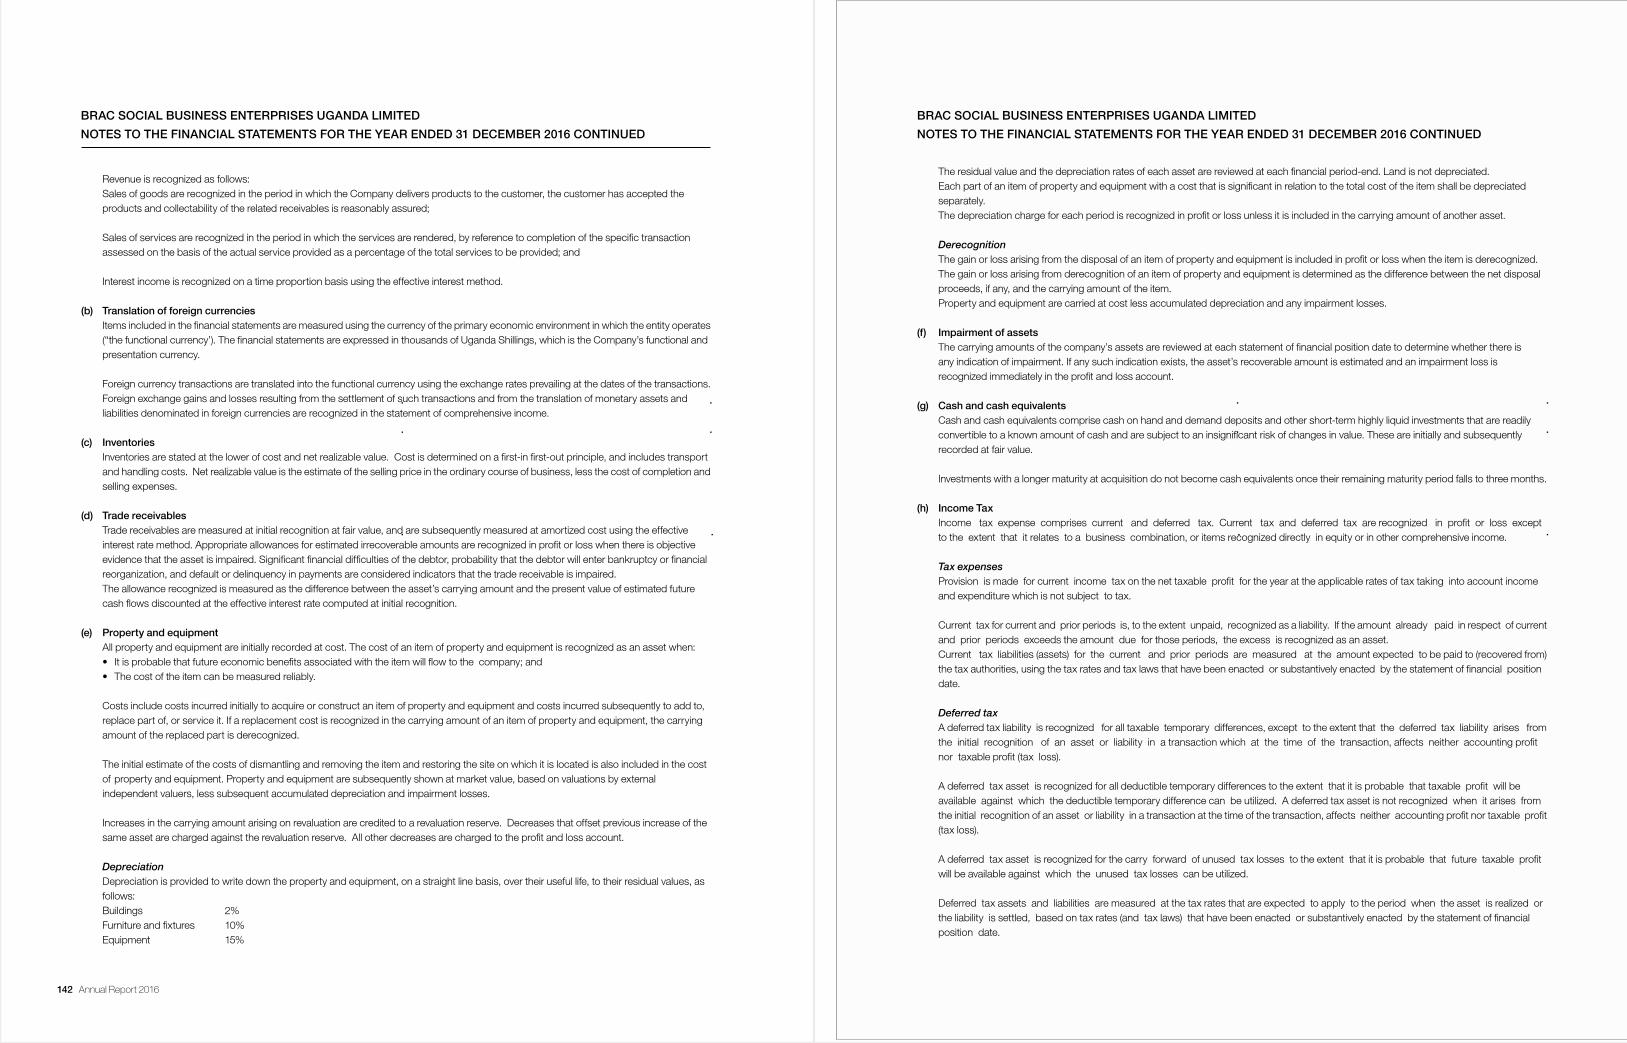
142 Annual Report 2016 Annual Report 2016 143
BRAC SOCIAL BUSINESS ENTERPRISES UGANDA LIMITED
NOTES TO THE FINANCIAL STATEMENTS FOR THE YEAR ENDED 31 DECEMBER 2016 CONTINUED
Revenue is recognized as follows: Sales of goods are recognized in the period in which the Company delivers products to the customer, the customer has accepted the products and collectability of the related receivables is reasonably assured;
Sales of services are recognized in the period in which the services are rendered, by reference to completion of the specific transaction assessed on the basis of the actual service provided as a percentage of the total services to be provided; and
Interest income is recognized on a time proportion basis using the effective interest method.
(b) Translation of foreign currencies Items included in the financial statements are measured using the currency of the primary economic environment in which the entity operates (“the functional currency’). The financial statements are expressed in thousands of Uganda Shillings, which is the Company’s functional and presentation currency.
Foreign currency transactions are translated into the functional currency using the exchange rates prevailing at the dates of the transactions. Foreign exchange gains and losses resulting from the settlement of such transactions and from the translation of monetary assets and liabilities denominated in foreign currencies are recognized in the statement of comprehensive income.
(c) Inventories Inventories are stated at the lower of cost and net realizable value. Cost is determined on a first-in first-out principle, and includes transport and handling costs. Net realizable value is the estimate of the selling price in the ordinary course of business, less the cost of completion and selling expenses.
(d) Trade receivables Trade receivables are measured at initial recognition at fair value, and are subsequently measured at amortized cost using the effective interest rate method. Appropriate allowances for estimated irrecoverable amounts are recognized in profit or loss when there is objective evidence that the asset is impaired. Significant financial difficulties of the debtor, probability that the debtor will enter bankruptcy or financial reorganization, and default or delinquency in payments are considered indicators that the trade receivable is impaired. The allowance recognized is measured as the difference between the asset’s carrying amount and the present value of estimated future cash flows discounted at the effective interest rate computed at initial recognition.
(e) Property and equipment All property and equipment are initially recorded at cost. The cost of an item of property and equipment is recognized as an asset when: • It is probable that future economic benefits associated with the item will flow to the company; and • The cost of the item can be measured reliably.
Costs include costs incurred initially to acquire or construct an item of property and equipment and costs incurred subsequently to add to, replace part of, or service it. If a replacement cost is recognized in the carrying amount of an item of property and equipment, the carrying amount of the replaced part is derecognized.
The initial estimate of the costs of dismantling and removing the item and restoring the site on which it is located is also included in the cost of property and equipment. Property and equipment are subsequently shown at market value, based on valuations by external independent valuers, less subsequent accumulated depreciation and impairment losses.
Increases in the carrying amount arising on revaluation are credited to a revaluation reserve. Decreases that offset previous increase of the same asset are charged against the revaluation reserve. All other decreases are charged to the profit and loss account.
Depreciation
Depreciation is provided to write down the property and equipment, on a straight line basis, over their useful life, to their residual values, as follows: Buildings 2% Furniture and fixtures 10% Equipment 15%
BRAC SOCIAL BUSINESS ENTERPRISES UGANDA LIMITED
NOTES TO THE FINANCIAL STATEMENTS FOR THE YEAR ENDED 31 DECEMBER 2016 CONTINUED
The residual value and the depreciation rates of each asset are reviewed at each financial period-end. Land is not depreciated. Each part of an item of property and equipment with a cost that is significant in relation to the total cost of the item shall be depreciated separately. The depreciation charge for each period is recognized in profit or loss unless it is included in the carrying amount of another asset. Derecognition
The gain or loss arising from the disposal of an item of property and equipment is included in profit or loss when the item is derecognized. The gain or loss arising from derecognition of an item of property and equipment is determined as the difference between the net disposal proceeds, if any, and the carrying amount of the item. Property and equipment are carried at cost less accumulated depreciation and any impairment losses.
(f) Impairment of assets The carrying amounts of the company’s assets are reviewed at each statement of financial position date to determine whether there is any indication of impairment. If any such indication exists, the asset’s recoverable amount is estimated and an impairment loss is recognized immediately in the profit and loss account. (g) Cash and cash equivalents Cash and cash equivalents comprise cash on hand and demand deposits and other short-term highly liquid investments that are readily convertible to a known amount of cash and are subject to an insignificant risk of changes in value. These are initially and subsequently recorded at fair value.
Investments with a longer maturity at acquisition do not become cash equivalents once their remaining maturity period falls to three months.
(h) Income Tax Income tax expense comprises current and deferred tax. Current tax and deferred tax are recognized in profit or loss except to the extent that it relates to a business combination, or items recognized directly in equity or in other comprehensive income.
Tax expenses
Provision is made for current income tax on the net taxable profit for the year at the applicable rates of tax taking into account income and expenditure which is not subject to tax.
Current tax for current and prior periods is, to the extent unpaid, recognized as a liability. If the amount already paid in respect of current and prior periods exceeds the amount due for those periods, the excess is recognized as an asset. Current tax liabilities (assets) for the current and prior periods are measured at the amount expected to be paid to (recovered from) the tax authorities, using the tax rates and tax laws that have been enacted or substantively enacted by the statement of financial position date.
Deferred tax
A deferred tax liability is recognized for all taxable temporary differences, except to the extent that the deferred tax liability arises from the initial recognition of an asset or liability in a transaction which at the time of the transaction, affects neither accounting profit nor taxable profit (tax loss).
A deferred tax asset is recognized for all deductible temporary differences to the extent that it is probable that taxable profit will be available against which the deductible temporary difference can be utilized. A deferred tax asset is not recognized when it arises from the initial recognition of an asset or liability in a transaction at the time of the transaction, affects neither accounting profit nor taxable profit (tax loss).
A deferred tax asset is recognized for the carry forward of unused tax losses to the extent that it is probable that future taxable profit will be available against which the unused tax losses can be utilized.
Deferred tax assets and liabilities are measured at the tax rates that are expected to apply to the period when the asset is realized or the liability is settled, based on tax rates (and tax laws) that have been enacted or substantively enacted by the statement of financial position date.
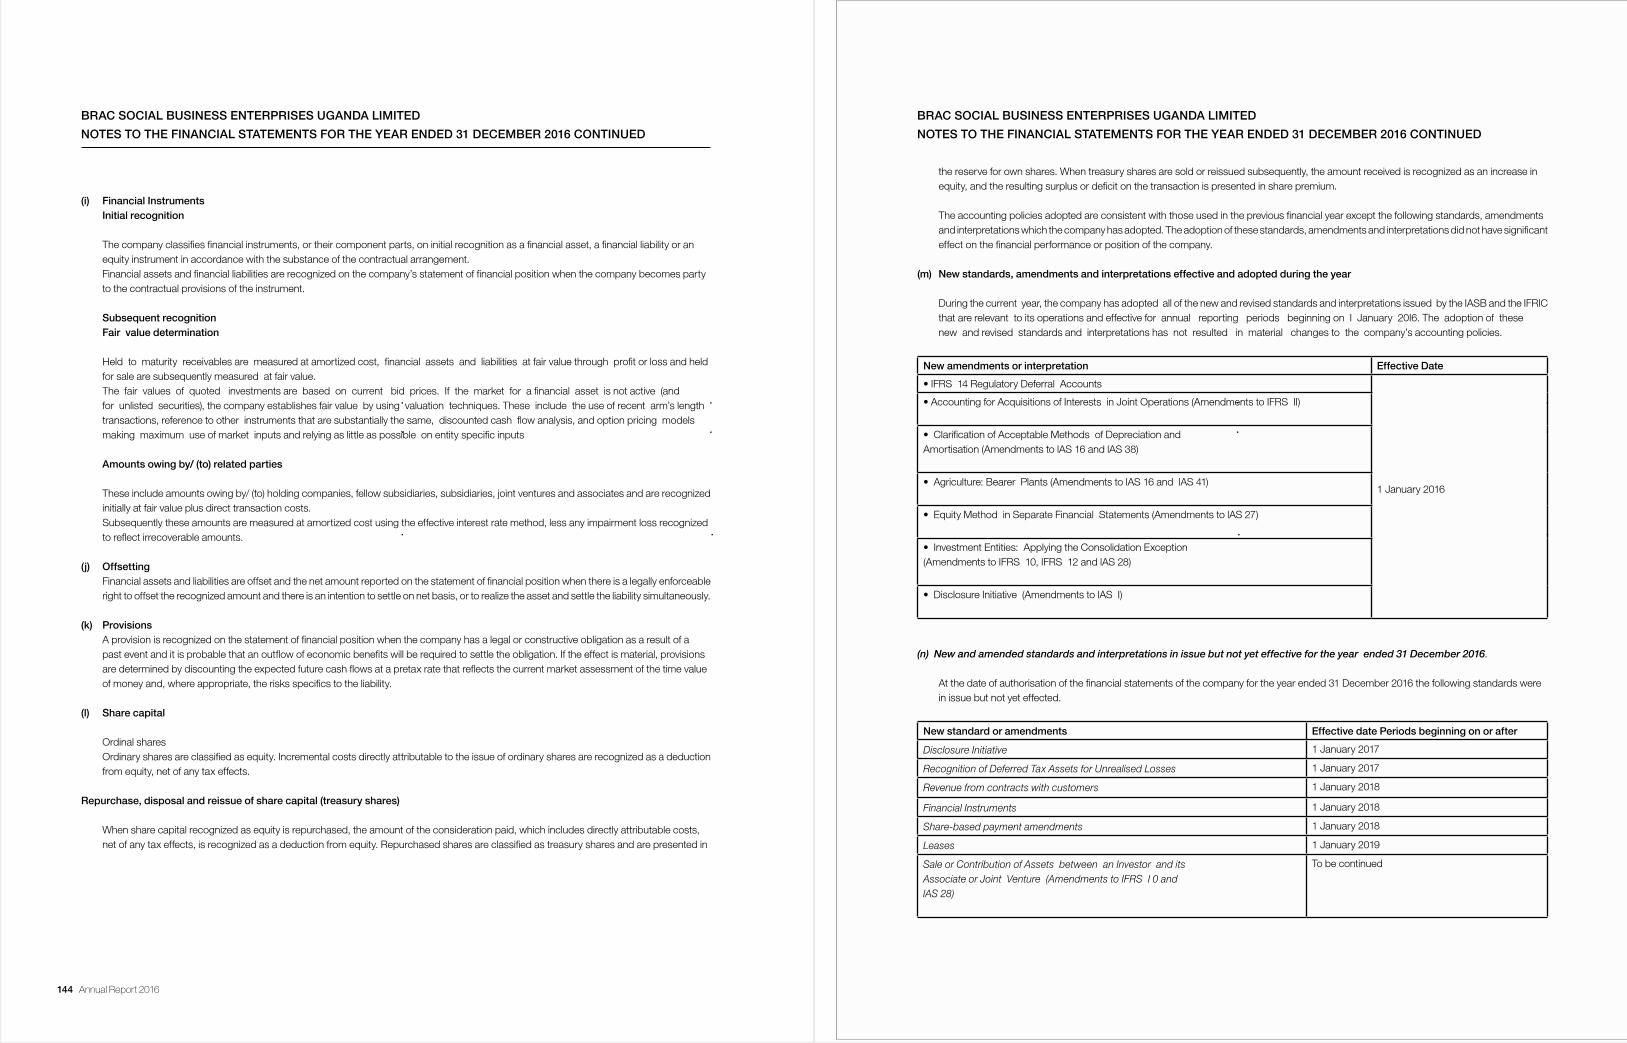
144 Annual Report 2016 Annual Report 2016 145
BRAC SOCIAL BUSINESS ENTERPRISES UGANDA LIMITED
NOTES TO THE FINANCIAL STATEMENTS FOR THE YEAR ENDED 31 DECEMBER 2016 CONTINUED
(i) Financial Instruments Initial recognition
The company classifies financial instruments, or their component parts, on initial recognition as a financial asset, a financial liability or an equity instrument in accordance with the substance of the contractual arrangement. Financial assets and financial liabilities are recognized on the company’s statement of financial position when the company becomes party to the contractual provisions of the instrument.
Subsequent recognition Fair value determination
Held to maturity receivables are measured at amortized cost, financial assets and liabilities at fair value through profit or loss and held for sale are subsequently measured at fair value. The fair values of quoted investments are based on current bid prices. If the market for a financial asset is not active (and for unlisted securities), the company establishes fair value by using valuation techniques. These include the use of recent arm’s length transactions, reference to other instruments that are substantially the same, discounted cash flow analysis, and option pricing models making maximum use of market inputs and relying as little as possible on entity specific inputs
Amountsowingby/(to)relatedparties
These include amounts owing by/ (to) holding companies, fellow subsidiaries, subsidiaries, joint ventures and associates and are recognized initially at fair value plus direct transaction costs. Subsequently these amounts are measured at amortized cost using the effective interest rate method, less any impairment loss recognized to reflect irrecoverable amounts.
(j) Offsetting Financial assets and liabilities are offset and the net amount reported on the statement of financial position when there is a legally enforceable right to offset the recognized amount and there is an intention to settle on net basis, or to realize the asset and settle the liability simultaneously.
(k) Provisions A provision is recognized on the statement of financial position when the company has a legal or constructive obligation as a result of a past event and it is probable that an outflow of economic benefits will be required to settle the obligation. If the effect is material, provisions are determined by discounting the expected future cash flows at a pretax rate that reflects the current market assessment of the time value of money and, where appropriate, the risks specifics to the liability.
(l) Share capital
Ordinal shares Ordinary shares are classified as equity. Incremental costs directly attributable to the issue of ordinary shares are recognized as a deduction from equity, net of any tax effects.
Repurchase, disposal and reissue of share capital (treasury shares)
When share capital recognized as equity is repurchased, the amount of the consideration paid, which includes directly attributable costs, net of any tax effects, is recognized as a deduction from equity. Repurchased shares are classified as treasury shares and are presented in
the reserve for own shares. When treasury shares are sold or reissued subsequently, the amount received is recognized as an increase in equity, and the resulting surplus or deficit on the transaction is presented in share premium.
The accounting policies adopted are consistent with those used in the previous financial year except the following standards, amendments and interpretations which the company has adopted. The adoption of these standards, amendments and interpretations did not have significant effect on the financial performance or position of the company.
(m)Newstandards,amendmentsandinterpretationseffectiveandadoptedduringtheyear
During the current year, the company has adopted all of the new and revised standards and interpretations issued by the IASB and the IFRIC that are relevant to its operations and effective for annual reporting periods beginning on I January 20I6. The adoption of these new and revised standards and interpretations has not resulted in material changes to the company’s accounting policies.
Newamendmentsorinterpretation Effective Date
• IFRS 14 Regulatory Deferral Accounts
1 January 2016
• Accounting for Acquisitions of Interests in Joint Operations (Amendments to IFRS II)
• Clarification of Acceptable Methods of Depreciation andAmortisation (Amendments to lAS 16 and lAS 38)
• Agriculture: Bearer Plants (Amendments to lAS 16 and lAS 41)
• Equity Method in Separate Financial Statements (Amendments to lAS 27)
• Investment Entities: Applying the Consolidation Exception(Amendments to IFRS 10, IFRS 12 and lAS 28)
• Disclosure Initiative (Amendments to lAS I)
(n) New and amended standards and interpretations in issue but not yet effective for the year ended 31 December 2016.
At the date of authorisation of the financial statements of the company for the year ended 31 December 2016 the following standards were in issue but not yet effected.
Newstandardoramendments Effective date Periods beginning on or after
Disclosure Initiative 1 January 2017
Recognition of Deferred Tax Assets for Unrealised Losses 1 January 2017
Revenue from contracts with customers 1 January 2018
Financial Instruments 1 January 2018
Share-based payment amendments 1 January 2018
Leases 1 January 2019
Sale or Contribution of Assets between an Investor and itsAssociate or Joint Venture (Amendments to IFRS I 0 andlAS 28)
To be continued
BRAC SOCIAL BUSINESS ENTERPRISES UGANDA LIMITED
NOTES TO THE FINANCIAL STATEMENTS FOR THE YEAR ENDED 31 DECEMBER 2016 CONTINUED
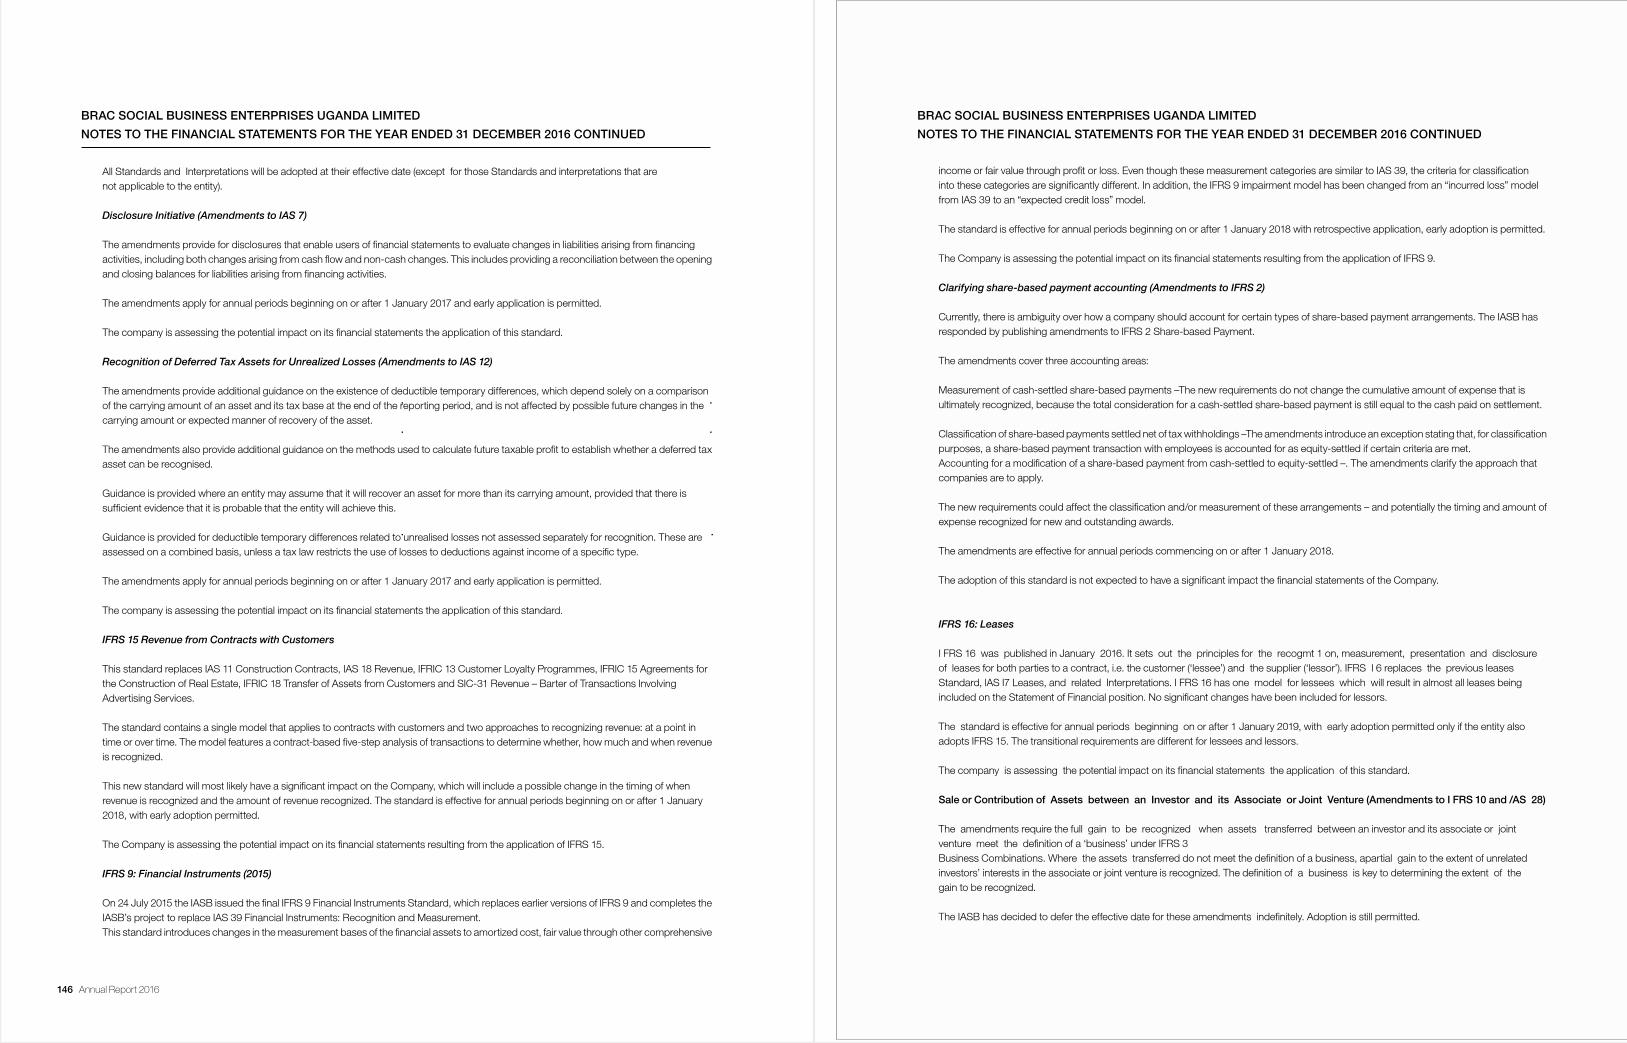
146 Annual Report 2016 Annual Report 2016 147
BRAC SOCIAL BUSINESS ENTERPRISES UGANDA LIMITED
NOTES TO THE FINANCIAL STATEMENTS FOR THE YEAR ENDED 31 DECEMBER 2016 CONTINUED
All Standards and Interpretations will be adopted at their effective date (except for those Standards and interpretations that are not applicable to the entity).
Disclosure Initiative (Amendments to IAS 7)
The amendments provide for disclosures that enable users of financial statements to evaluate changes in liabilities arising from financing activities, including both changes arising from cash flow and non-cash changes. This includes providing a reconciliation between the opening and closing balances for liabilities arising from financing activities.
The amendments apply for annual periods beginning on or after 1 January 2017 and early application is permitted.
The company is assessing the potential impact on its financial statements the application of this standard.
Recognition of Deferred Tax Assets for Unrealized Losses (Amendments to IAS 12)
The amendments provide additional guidance on the existence of deductible temporary differences, which depend solely on a comparison of the carrying amount of an asset and its tax base at the end of the reporting period, and is not affected by possible future changes in the carrying amount or expected manner of recovery of the asset.
The amendments also provide additional guidance on the methods used to calculate future taxable profit to establish whether a deferred tax asset can be recognised.
Guidance is provided where an entity may assume that it will recover an asset for more than its carrying amount, provided that there is sufficient evidence that it is probable that the entity will achieve this.
Guidance is provided for deductible temporary differences related to unrealised losses not assessed separately for recognition. These are assessed on a combined basis, unless a tax law restricts the use of losses to deductions against income of a specific type.
The amendments apply for annual periods beginning on or after 1 January 2017 and early application is permitted.
The company is assessing the potential impact on its financial statements the application of this standard.
IFRS 15 Revenue from Contracts with Customers
This standard replaces IAS 11 Construction Contracts, IAS 18 Revenue, IFRIC 13 Customer Loyalty Programmes, IFRIC 15 Agreements for the Construction of Real Estate, IFRIC 18 Transfer of Assets from Customers and SIC-31 Revenue – Barter of Transactions Involving Advertising Services.
The standard contains a single model that applies to contracts with customers and two approaches to recognizing revenue: at a point in time or over time. The model features a contract-based five-step analysis of transactions to determine whether, how much and when revenue is recognized.
This new standard will most likely have a significant impact on the Company, which will include a possible change in the timing of when revenue is recognized and the amount of revenue recognized. The standard is effective for annual periods beginning on or after 1 January 2018, with early adoption permitted.
The Company is assessing the potential impact on its financial statements resulting from the application of IFRS 15.
IFRS 9: Financial Instruments (2015)
On 24 July 2015 the IASB issued the final IFRS 9 Financial Instruments Standard, which replaces earlier versions of IFRS 9 and completes the IASB’s project to replace IAS 39 Financial Instruments: Recognition and Measurement. This standard introduces changes in the measurement bases of the financial assets to amortized cost, fair value through other comprehensive
BRAC SOCIAL BUSINESS ENTERPRISES UGANDA LIMITED
NOTES TO THE FINANCIAL STATEMENTS FOR THE YEAR ENDED 31 DECEMBER 2016 CONTINUED
income or fair value through profit or loss. Even though these measurement categories are similar to IAS 39, the criteria for classification into these categories are significantly different. In addition, the IFRS 9 impairment model has been changed from an “incurred loss” model from IAS 39 to an “expected credit loss” model. The standard is effective for annual periods beginning on or after 1 January 2018 with retrospective application, early adoption is permitted.
The Company is assessing the potential impact on its financial statements resulting from the application of IFRS 9.
Clarifying share-based payment accounting (Amendments to IFRS 2)
Currently, there is ambiguity over how a company should account for certain types of share-based payment arrangements. The IASB has responded by publishing amendments to IFRS 2 Share-based Payment.
The amendments cover three accounting areas:
Measurement of cash-settled share-based payments –The new requirements do not change the cumulative amount of expense that is ultimately recognized, because the total consideration for a cash-settled share-based payment is still equal to the cash paid on settlement.
Classification of share-based payments settled net of tax withholdings –The amendments introduce an exception stating that, for classification purposes, a share-based payment transaction with employees is accounted for as equity-settled if certain criteria are met. Accounting for a modification of a share-based payment from cash-settled to equity-settled –. The amendments clarify the approach that companies are to apply.
The new requirements could affect the classification and/or measurement of these arrangements – and potentially the timing and amount of expense recognized for new and outstanding awards.
The amendments are effective for annual periods commencing on or after 1 January 2018.
The adoption of this standard is not expected to have a significant impact the financial statements of the Company.
IFRS 16: Leases
I FRS 16 was published in January 2016. It sets out the principles for the recogmt 1 on, measurement, presentation and disclosure of leases for both parties to a contract, i.e. the customer (‘lessee’) and the supplier (‘lessor’). IFRS I 6 replaces the previous leases Standard, lAS I7 Leases, and related Interpretations. I FRS 16 has one model for lessees which will result in almost all leases being included on the Statement of Financial position. No significant changes have been included for lessors.
The standard is effective for annual periods beginning on or after 1 January 2019, with early adoption permitted only if the entity also adopts IFRS 15. The transitional requirements are different for lessees and lessors.
The company is assessing the potential impact on its financial statements the application of this standard.
SaleorContributionofAssetsbetweenanInvestoranditsAssociateorJointVenture(AmendmentstoIFRS10and/AS28)
The amendments require the full gain to be recognized when assets transferred between an investor and its associate or joint venture meet the definition of a ‘business’ under IFRS 3 Business Combinations. Where the assets transferred do not meet the definition of a business, apartial gain to the extent of unrelated investors’ interests in the associate or joint venture is recognized. The definition of a business is key to determining the extent of the gain to be recognized.
The IASB has decided to defer the effective date for these amendments indefinitely. Adoption is still permitted.
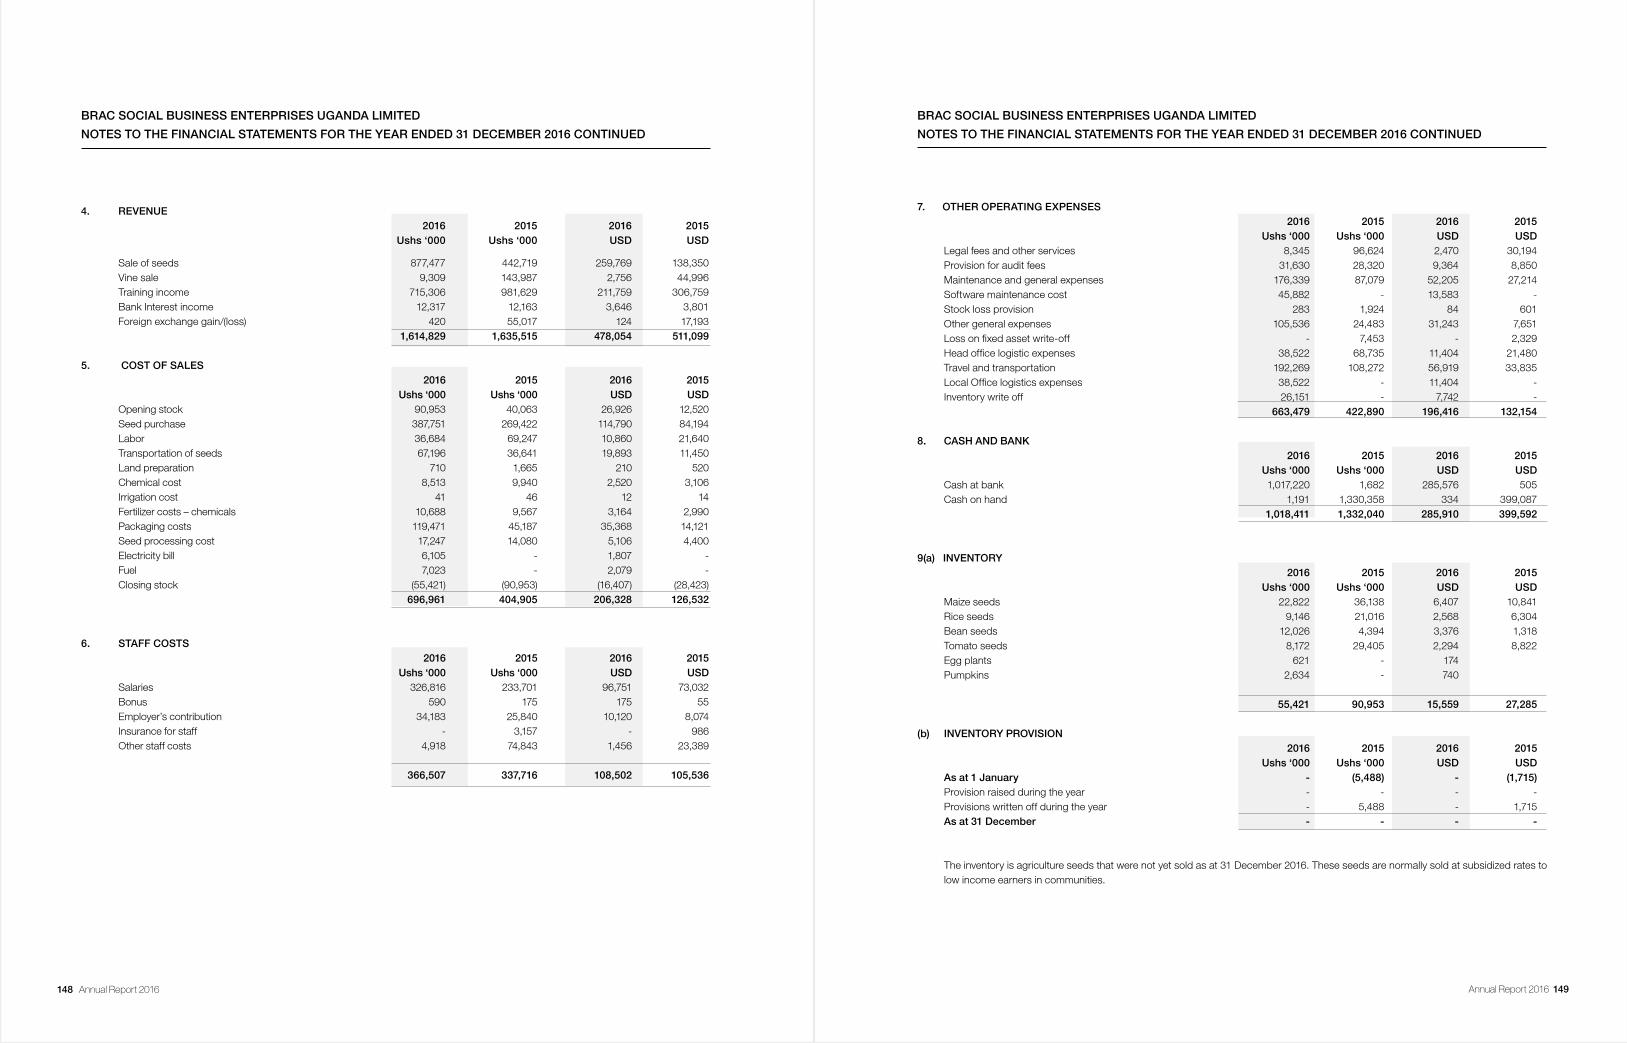
148 Annual Report 2016 Annual Report 2016 149
BRAC SOCIAL BUSINESS ENTERPRISES UGANDA LIMITED
NOTES TO THE FINANCIAL STATEMENTS FOR THE YEAR ENDED 31 DECEMBER 2016 CONTINUED
4. REVENUE 2016 2015 2016 2015 Ushs ‘000 Ushs ‘000 USD USD
Sale of seeds 877,477 442,719 259,769 138,350 Vine sale 9,309 143,987 2,756 44,996 Training income 715,306 981,629 211,759 306,759 Bank Interest income 12,317 12,163 3,646 3,801 Foreign exchange gain/(loss) 420 55,017 124 17,193 1,614,829 1,635,515 478,054 511,099
5. COST OF SALES 2016 2015 2016 2015 Ushs ‘000 Ushs ‘000 USD USD Opening stock 90,953 40,063 26,926 12,520 Seed purchase 387,751 269,422 114,790 84,194 Labor 36,684 69,247 10,860 21,640 Transportation of seeds 67,196 36,641 19,893 11,450 Land preparation 710 1,665 210 520 Chemical cost 8,513 9,940 2,520 3,106 Irrigation cost 41 46 12 14 Fertilizer costs – chemicals 10,688 9,567 3,164 2,990 Packaging costs 119,471 45,187 35,368 14,121 Seed processing cost 17,247 14,080 5,106 4,400 Electricity bill 6,105 - 1,807 - Fuel 7,023 - 2,079 - Closing stock (55,421) (90,953) (16,407) (28,423) 696,961 404,905 206,328 126,532
6. STAFF COSTS 2016 2015 2016 2015 Ushs ‘000 Ushs ‘000 USD USD Salaries 326,816 233,701 96,751 73,032 Bonus 590 175 175 55 Employer’s contribution 34,183 25,840 10,120 8,074 Insurance for staff - 3,157 - 986 Other staff costs 4,918 74,843 1,456 23,389
366,507 337,716 108,502 105,536
7. OTHER OPERATING EXPENSES 2016 2015 2016 2015 Ushs ‘000 Ushs ‘000 USD USD Legal fees and other services 8,345 96,624 2,470 30,194 Provision for audit fees 31,630 28,320 9,364 8,850 Maintenance and general expenses 176,339 87,079 52,205 27,214 Software maintenance cost 45,882 - 13,583 - Stock loss provision 283 1,924 84 601 Other general expenses 105,536 24,483 31,243 7,651 Loss on fixed asset write-off - 7,453 - 2,329 Head office logistic expenses 38,522 68,735 11,404 21,480 Travel and transportation 192,269 108,272 56,919 33,835 Local Office logistics expenses 38,522 - 11,404 - Inventory write off 26,151 - 7,742 - 663,479 422,890 196,416 132,154
8. CASH AND BANK 2016 2015 2016 2015 Ushs ‘000 Ushs ‘000 USD USD Cash at bank 1,017,220 1,682 285,576 505 Cash on hand 1,191 1,330,358 334 399,087 1,018,411 1,332,040 285,910 399,592
9(a) INVENTORY 2016 2015 2016 2015
Ushs ‘000 Ushs ‘000 USD USD Maize seeds 22,822 36,138 6,407 10,841 Rice seeds 9,146 21,016 2,568 6,304 Bean seeds 12,026 4,394 3,376 1,318 Tomato seeds 8,172 29,405 2,294 8,822 Egg plants 621 - 174 Pumpkins 2,634 - 740 55,421 90,953 15,559 27,285
(b) INVENTORY PROVISION 2016 2015 2016 2015
Ushs ‘000 Ushs ‘000 USD USD As at 1 January - (5,488) - (1,715) Provision raised during the year - - - - Provisions written off during the year - 5,488 - 1,715 As at 31 December - - - -
The inventory is agriculture seeds that were not yet sold as at 31 December 2016. These seeds are normally sold at subsidized rates to low income earners in communities.
BRAC SOCIAL BUSINESS ENTERPRISES UGANDA LIMITED
NOTES TO THE FINANCIAL STATEMENTS FOR THE YEAR ENDED 31 DECEMBER 2016 CONTINUED
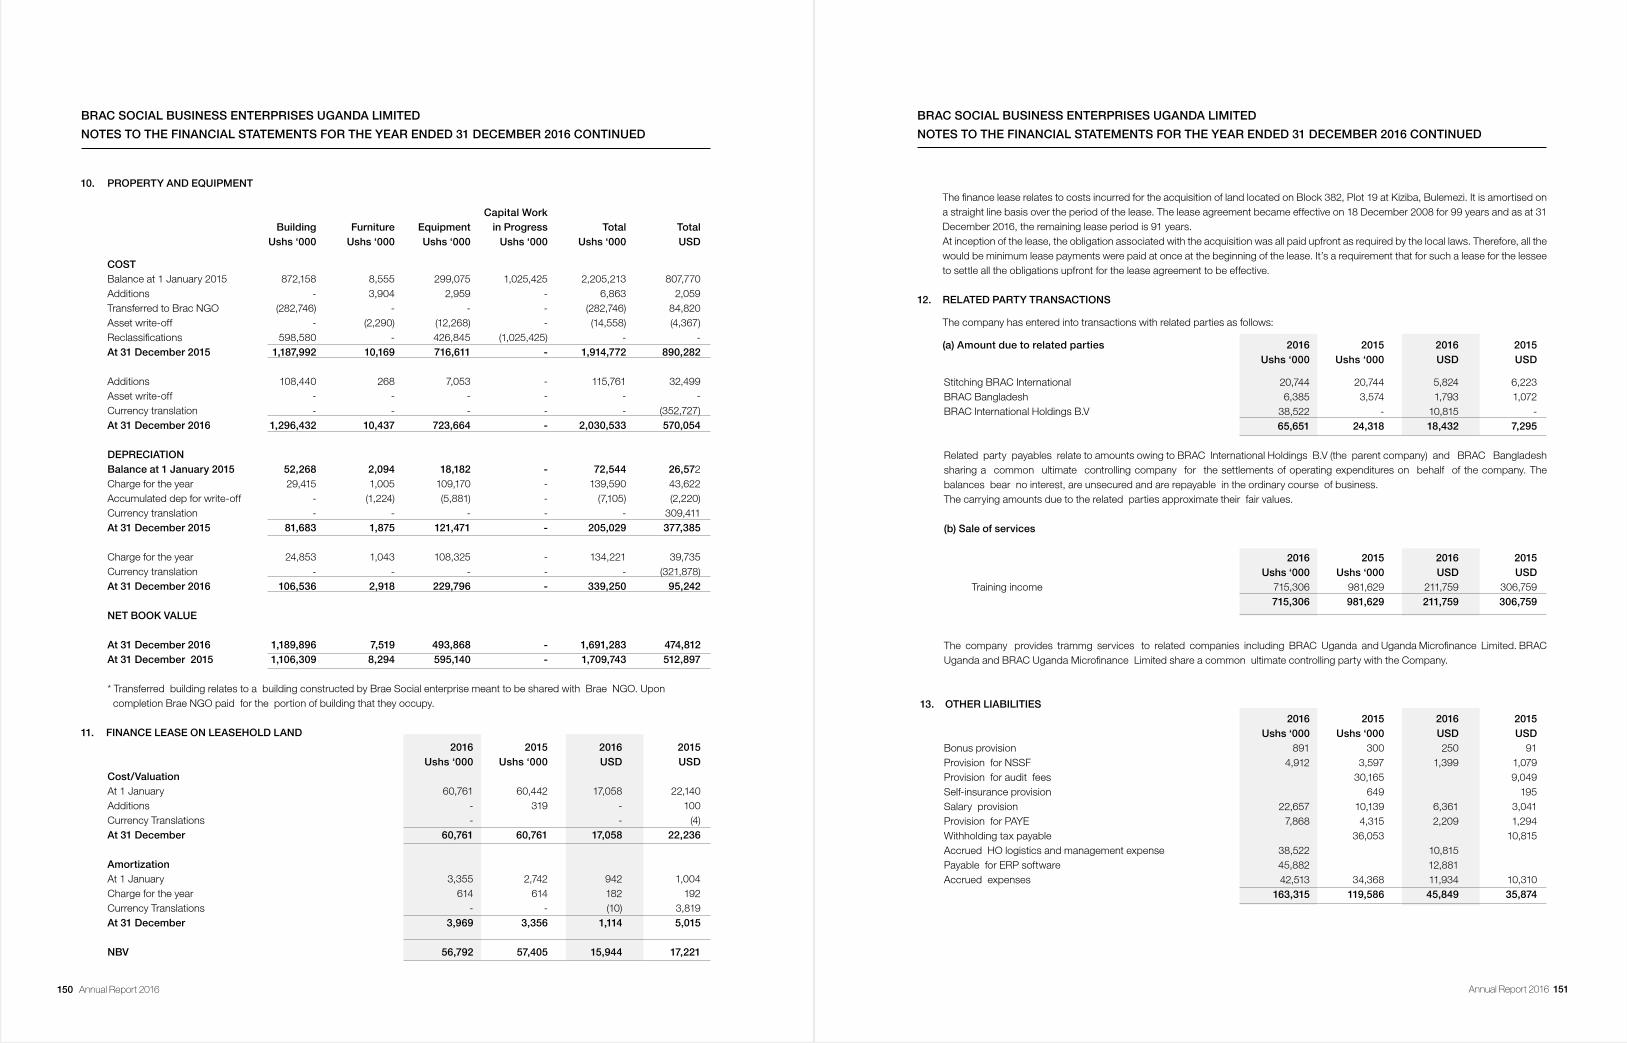
150 Annual Report 2016 Annual Report 2016 151
10. PROPERTY AND EQUIPMENT
Capital Work Building Furniture Equipment in Progress Total Total
Ushs ‘000 Ushs ‘000 Ushs ‘000 Ushs ‘000 Ushs ‘000 USD
COST Balance at 1 January 2015 872,158 8,555 299,075 1,025,425 2,205,213 807,770Additions - 3,904 2,959 - 6,863 2,059Transferred to Brac NGO (282,746) - - - (282,746) 84,820Asset write-off - (2,290) (12,268) - (14,558) (4,367)Reclassifications 598,580 - 426,845 (1,025,425) - -At 31 December 2015 1,187,992 10,169 716,611 - 1,914,772 890,282 Additions 108,440 268 7,053 - 115,761 32,499Asset write-off - - - - - -Currency translation - - - - - (352,727)At 31 December 2016 1,296,432 10,437 723,664 - 2,030,533 570,054
DEPRECIATION Balance at 1 January 2015 52,268 2,094 18,182 - 72,544 26,572Charge for the year 29,415 1,005 109,170 - 139,590 43,622Accumulated dep for write-off - (1,224) (5,881) - (7,105) (2,220)Currency translation - - - - - 309,411At 31 December 2015 81,683 1,875 121,471 - 205,029 377,385 Charge for the year 24,853 1,043 108,325 - 134,221 39,735Currency translation - - - - - (321,878)At 31 December 2016 106,536 2,918 229,796 - 339,250 95,242 NET BOOK VALUE
At 31 December 2016 1,189,896 7,519 493,868 - 1,691,283 474,812At 31 December 2015 1,106,309 8,294 595,140 - 1,709,743 512,897
* Transferred building relates to a building constructed by Brae Social enterprise meant to be shared with Brae NGO. Upon completion Brae NGO paid for the portion of building that they occupy.
11. FINANCE LEASE ON LEASEHOLD LAND 2016 2015 2016 2015 Ushs ‘000 Ushs ‘000 USD USD
Cost/Valuation At 1 January 60,761 60,442 17,058 22,140 Additions - 319 - 100 Currency Translations - - (4) At 31 December 60,761 60,761 17,058 22,236 Amortization At 1 January 3,355 2,742 942 1,004 Charge for the year 614 614 182 192 Currency Translations - - (10) 3,819 At 31 December 3,969 3,356 1,114 5,015
NBV 56,792 57,405 15,944 17,221
BRAC SOCIAL BUSINESS ENTERPRISES UGANDA LIMITED
NOTES TO THE FINANCIAL STATEMENTS FOR THE YEAR ENDED 31 DECEMBER 2016 CONTINUED
The finance lease relates to costs incurred for the acquisition of land located on Block 382, Plot 19 at Kiziba, Bulemezi. It is amortised on a straight line basis over the period of the lease. The lease agreement became effective on 18 December 2008 for 99 years and as at 31 December 2016, the remaining lease period is 91 years.
At inception of the lease, the obligation associated with the acquisition was all paid upfront as required by the local laws. Therefore, all the would be minimum lease payments were paid at once at the beginning of the lease. It’s a requirement that for such a lease for the lessee to settle all the obligations upfront for the lease agreement to be effective.
12. RELATED PARTY TRANSACTIONS
The company has entered into transactions with related parties as follows:
(a) Amount due to related parties 2016 2015 2016 2015 Ushs ‘000 Ushs ‘000 USD USD
Stitching BRAC International 20,744 20,744 5,824 6,223 BRAC Bangladesh 6,385 3,574 1,793 1,072 BRAC International Holdings B.V 38,522 - 10,815 - 65,651 24,318 18,432 7,295
Related party payables relate to amounts owing to BRAC International Holdings B.V (the parent company) and BRAC Bangladesh sharing a common ultimate controlling company for the settlements of operating expenditures on behalf of the company. The balances bear no interest, are unsecured and are repayable in the ordinary course of business.
The carrying amounts due to the related parties approximate their fair values. (b) Sale of services
2016 2015 2016 2015 Ushs ‘000 Ushs ‘000 USD USD Training income 715,306 981,629 211,759 306,759 715,306 981,629 211,759 306,759 The company provides trammg services to related companies including BRAC Uganda and Uganda Microfinance Limited. BRAC
Uganda and BRAC Uganda Microfinance Limited share a common ultimate controlling party with the Company.
13. OTHER LIABILITIES 2016 2015 2016 2015 Ushs ‘000 Ushs ‘000 USD USD Bonus provision 891 300 250 91 Provision for NSSF 4,912 3,597 1,399 1,079 Provision for audit fees 30,165 9,049 Self-insurance provision 649 195 Salary provision 22,657 10,139 6,361 3,041 Provision for PAYE 7,868 4,315 2,209 1,294 Withholding tax payable 36,053 10,815 Accrued HO logistics and management expense 38,522 10,815 Payable for ERP software 45,882 12,881 Accrued expenses 42,513 34,368 11,934 10,310 163,315 119,586 45,849 35,874
BRAC SOCIAL BUSINESS ENTERPRISES UGANDA LIMITED
NOTES TO THE FINANCIAL STATEMENTS FOR THE YEAR ENDED 31 DECEMBER 2016 CONTINUED
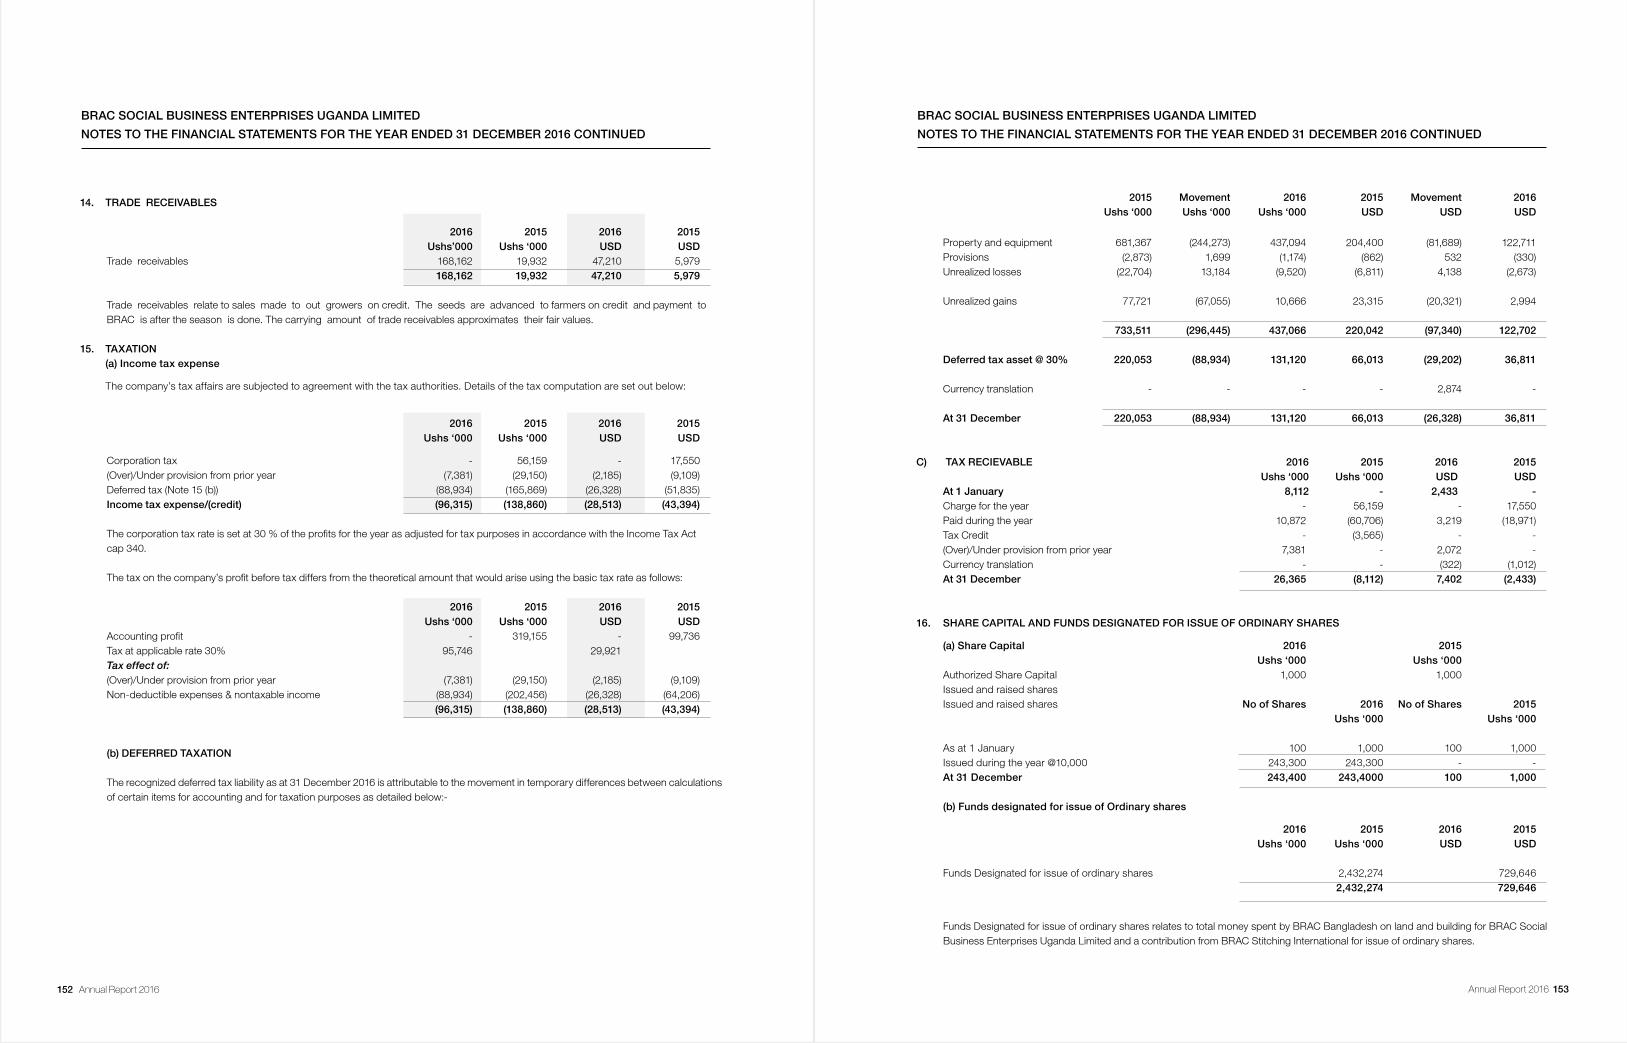
152 Annual Report 2016 Annual Report 2016 153
14. TRADE RECEIVABLES 2016 2015 2016 2015 Ushs’000 Ushs ‘000 USD USD Trade receivables 168,162 19,932 47,210 5,979 168,162 19,932 47,210 5,979
Trade receivables relate to sales made to out growers on credit. The seeds are advanced to farmers on credit and payment to BRAC is after the season is done. The carrying amount of trade receivables approximates their fair values.
15. TAXATION (a) Income tax expense
The company’s tax affairs are subjected to agreement with the tax authorities. Details of the tax computation are set out below:
2016 2015 2016 2015 Ushs ‘000 Ushs ‘000 USD USD
Corporation tax - 56,159 - 17,550 (Over)/Under provision from prior year (7,381) (29,150) (2,185) (9,109) Deferred tax (Note 15 (b)) (88,934) (165,869) (26,328) (51,835) Income tax expense/(credit) (96,315) (138,860) (28,513) (43,394)
The corporation tax rate is set at 30 % of the profits for the year as adjusted for tax purposes in accordance with the Income Tax Act cap 340.
The tax on the company’s profit before tax differs from the theoretical amount that would arise using the basic tax rate as follows:
2016 2015 2016 2015 Ushs ‘000 Ushs ‘000 USD USD Accounting profit - 319,155 - 99,736 Tax at applicable rate 30% 95,746 29,921 Tax effect of: (Over)/Under provision from prior year (7,381) (29,150) (2,185) (9,109) Non-deductible expenses & nontaxable income (88,934) (202,456) (26,328) (64,206) (96,315) (138,860) (28,513) (43,394)
(b) DEFERRED TAXATION
The recognized deferred tax liability as at 31 December 2016 is attributable to the movement in temporary differences between calculations of certain items for accounting and for taxation purposes as detailed below:-
BRAC SOCIAL BUSINESS ENTERPRISES UGANDA LIMITED
NOTES TO THE FINANCIAL STATEMENTS FOR THE YEAR ENDED 31 DECEMBER 2016 CONTINUED
2015 Movement 2016 2015 Movement 2016 Ushs ‘000 Ushs ‘000 Ushs ‘000 USD USD USD
Property and equipment 681,367 (244,273) 437,094 204,400 (81,689) 122,711Provisions (2,873) 1,699 (1,174) (862) 532 (330)Unrealized losses (22,704) 13,184 (9,520) (6,811) 4,138 (2,673)
Unrealized gains 77,721 (67,055) 10,666 23,315 (20,321) 2,994
733,511 (296,445) 437,066 220,042 (97,340) 122,702 Deferred tax asset @ 30% 220,053 (88,934) 131,120 66,013 (29,202) 36,811
Currency translation - - - - 2,874 -
At 31 December 220,053 (88,934) 131,120 66,013 (26,328) 36,811
C) TAX RECIEVABLE 2016 2015 2016 2015 Ushs ‘000 Ushs ‘000 USD USD At 1 January 8,112 - 2,433 -
Charge for the year - 56,159 - 17,550Paid during the year 10,872 (60,706) 3,219 (18,971)Tax Credit - (3,565) - -(Over)/Under provision from prior year 7,381 - 2,072 -Currency translation - - (322) (1,012)At 31 December 26,365 (8,112) 7,402 (2,433)
16. SHARE CAPITAL AND FUNDS DESIGNATED FOR ISSUE OF ORDINARY SHARES
(a) Share Capital 2016 2015 Ushs ‘000 Ushs ‘000 Authorized Share Capital 1,000 1,000 Issued and raised shares Issued and raised shares No of Shares 2016 No of Shares 2015 Ushs ‘000 Ushs ‘000 As at 1 January 100 1,000 100 1,000 Issued during the year @10,000 243,300 243,300 - - At 31 December 243,400 243,4000 100 1,000 (b) Funds designated for issue of Ordinary shares 2016 2015 2016 2015 Ushs ‘000 Ushs ‘000 USD USD
Funds Designated for issue of ordinary shares 2,432,274 729,646 2,432,274 729,646 Funds Designated for issue of ordinary shares relates to total money spent by BRAC Bangladesh on land and building for BRAC Social
Business Enterprises Uganda Limited and a contribution from BRAC Stitching International for issue of ordinary shares.
BRAC SOCIAL BUSINESS ENTERPRISES UGANDA LIMITED
NOTES TO THE FINANCIAL STATEMENTS FOR THE YEAR ENDED 31 DECEMBER 2016 CONTINUED
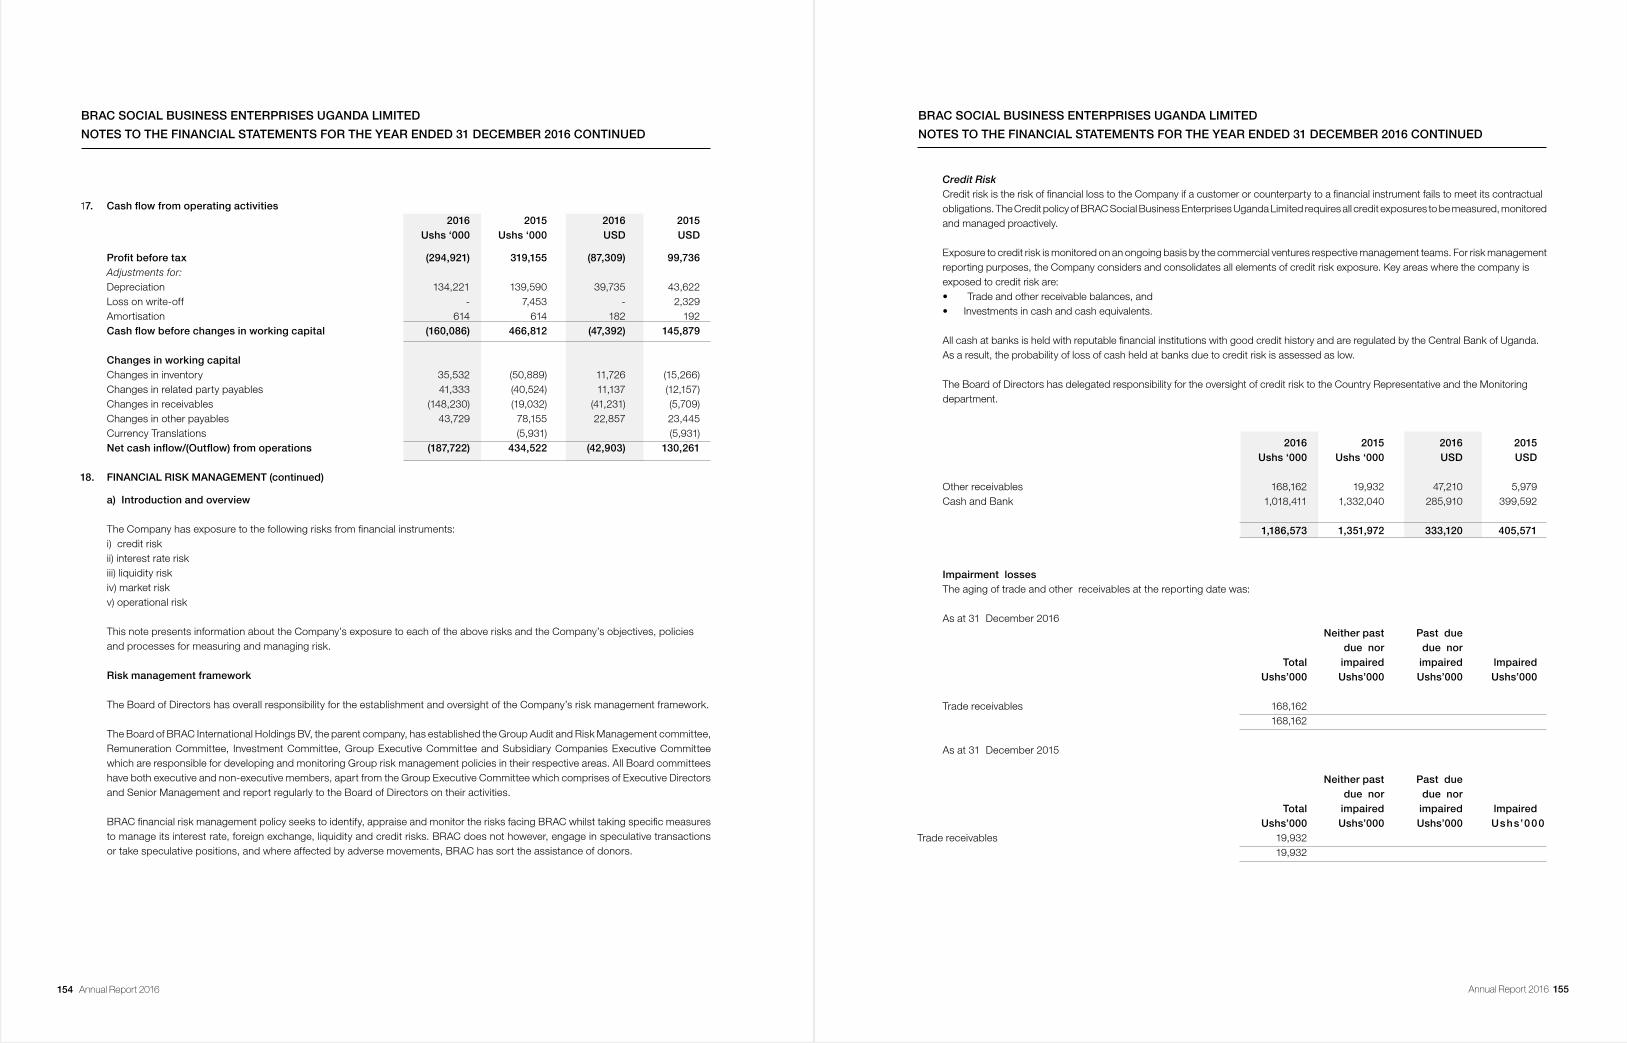
154 Annual Report 2016 Annual Report 2016 155
17. Cashflowfromoperatingactivities 2016 2015 2016 2015 Ushs ‘000 Ushs ‘000 USD USD
Profitbeforetax (294,921) 319,155 (87,309) 99,736 Adjustments for: Depreciation 134,221 139,590 39,735 43,622 Loss on write-off - 7,453 - 2,329 Amortisation 614 614 182 192 Cashflowbeforechangesinworkingcapital (160,086) 466,812 (47,392) 145,879 Changesinworkingcapital Changes in inventory 35,532 (50,889) 11,726 (15,266) Changes in related party payables 41,333 (40,524) 11,137 (12,157) Changes in receivables (148,230) (19,032) (41,231) (5,709) Changes in other payables 43,729 78,155 22,857 23,445 Currency Translations (5,931) (5,931) Netcashinflow/(Outflow)fromoperations (187,722) 434,522 (42,903) 130,261 18. FINANCIAL RISK MANAGEMENT (continued)
a)Introductionandoverview The Company has exposure to the following risks from financial instruments: i) credit risk ii) interest rate risk iii) liquidity risk iv) market risk v) operational risk
This note presents information about the Company’s exposure to each of the above risks and the Company’s objectives, policies and processes for measuring and managing risk.
Riskmanagementframework The Board of Directors has overall responsibility for the establishment and oversight of the Company’s risk management framework.
The Board of BRAC International Holdings BV, the parent company, has established the Group Audit and Risk Management committee, Remuneration Committee, Investment Committee, Group Executive Committee and Subsidiary Companies Executive Committee which are responsible for developing and monitoring Group risk management policies in their respective areas. All Board committees have both executive and non-executive members, apart from the Group Executive Committee which comprises of Executive Directors and Senior Management and report regularly to the Board of Directors on their activities.
BRAC financial risk management policy seeks to identify, appraise and monitor the risks facing BRAC whilst taking specific measures to manage its interest rate, foreign exchange, liquidity and credit risks. BRAC does not however, engage in speculative transactions or take speculative positions, and where affected by adverse movements, BRAC has sort the assistance of donors.
BRAC SOCIAL BUSINESS ENTERPRISES UGANDA LIMITED
NOTES TO THE FINANCIAL STATEMENTS FOR THE YEAR ENDED 31 DECEMBER 2016 CONTINUED
Credit Risk
Credit risk is the risk of financial loss to the Company if a customer or counterparty to a financial instrument fails to meet its contractual obligations. The Credit policy of BRAC Social Business Enterprises Uganda Limited requires all credit exposures to be measured, monitored and managed proactively.
Exposure to credit risk is monitored on an ongoing basis by the commercial ventures respective management teams. For risk management reporting purposes, the Company considers and consolidates all elements of credit risk exposure. Key areas where the company is exposed to credit risk are: • Trade and other receivable balances, and • Investments in cash and cash equivalents.
All cash at banks is held with reputable financial institutions with good credit history and are regulated by the Central Bank of Uganda. As a result, the probability of loss of cash held at banks due to credit risk is assessed as low.
The Board of Directors has delegated responsibility for the oversight of credit risk to the Country Representative and the Monitoring department.
2016 2015 2016 2015 Ushs ‘000 Ushs ‘000 USD USD
Other receivables 168,162 19,932 47,210 5,979 Cash and Bank 1,018,411 1,332,040 285,910 399,592 1,186,573 1,351,972 333,120 405,571
Impairment losses The aging of trade and other receivables at the reporting date was:
As at 31 December 2016 Neither past Past due due nor due nor Total impaired impaired lmpaired Ushs’000 Ushs’000 Ushs’000 Ushs’000 Trade receivables 168,162 168,162
As at 31 December 2015 Neither past Past due due nor due nor Total impaired impaired lmpaired Ushs’000 Ushs’000 Ushs’000 Ushs’000 Trade receivables 19,932 19,932
BRAC SOCIAL BUSINESS ENTERPRISES UGANDA LIMITED
NOTES TO THE FINANCIAL STATEMENTS FOR THE YEAR ENDED 31 DECEMBER 2016 CONTINUED
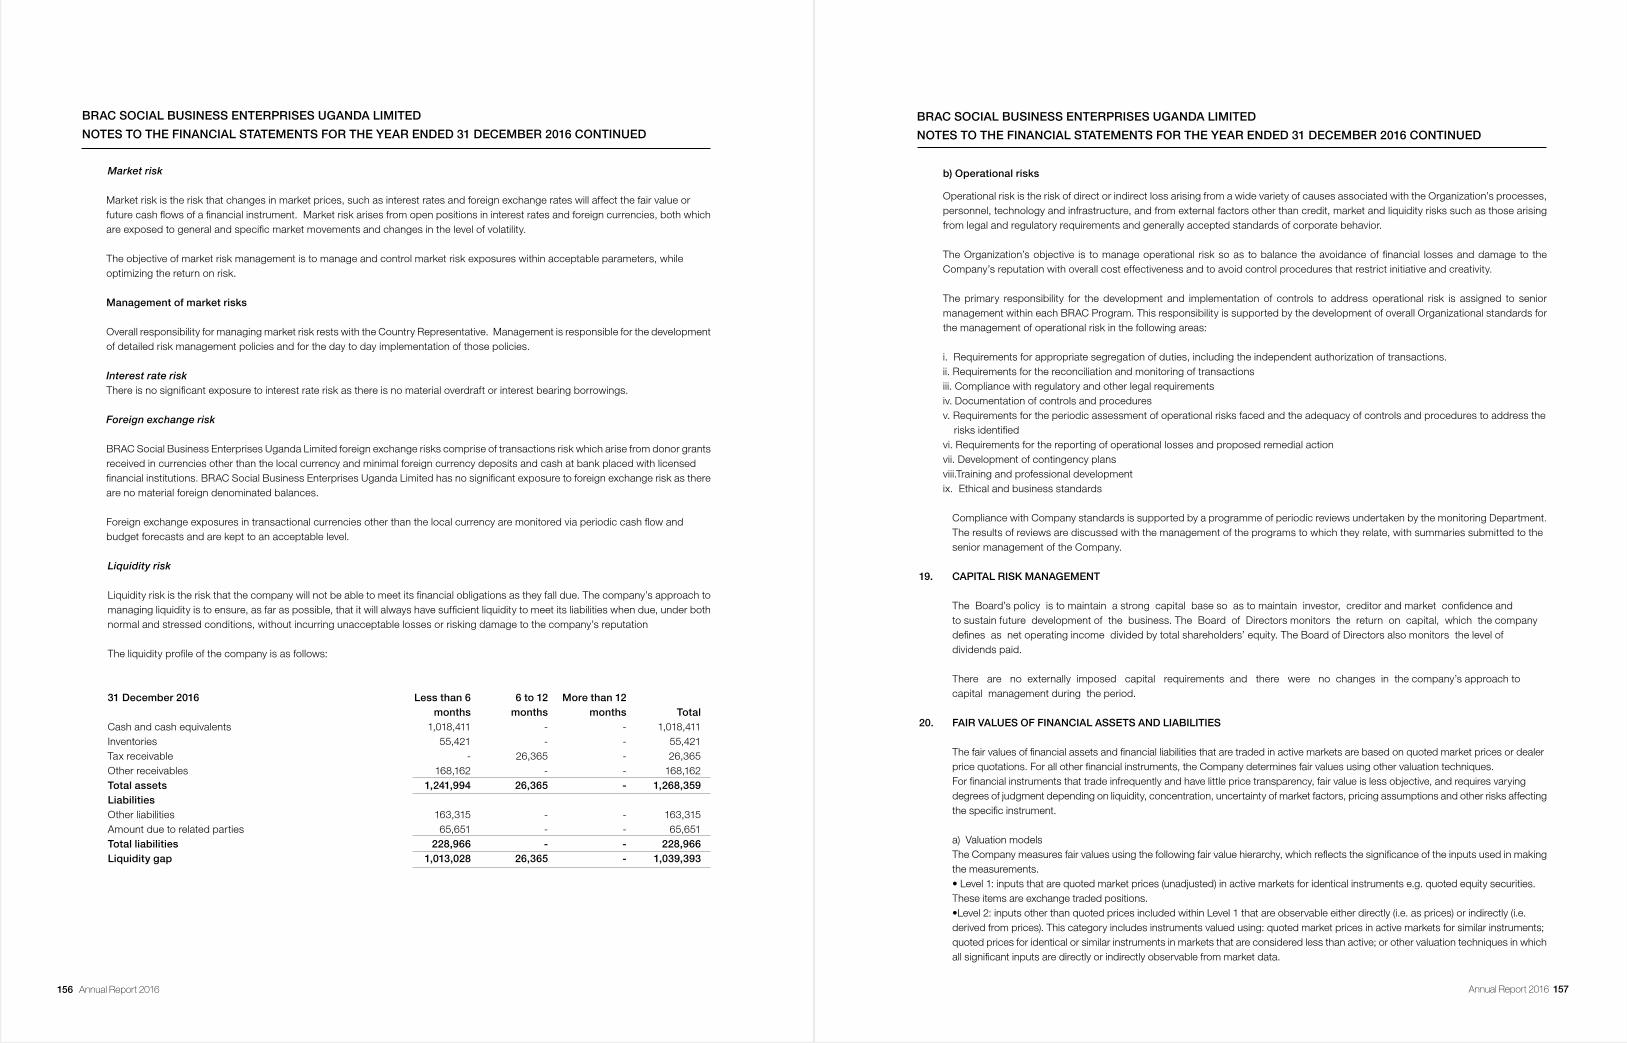
156 Annual Report 2016 Annual Report 2016 157
Market risk
Market risk is the risk that changes in market prices, such as interest rates and foreign exchange rates will affect the fair value or future cash flows of a financial instrument. Market risk arises from open positions in interest rates and foreign currencies, both which are exposed to general and specific market movements and changes in the level of volatility.
The objective of market risk management is to manage and control market risk exposures within acceptable parameters, while optimizing the return on risk.
Management of market risks
Overall responsibility for managing market risk rests with the Country Representative. Management is responsible for the development of detailed risk management policies and for the day to day implementation of those policies.
Interest rate risk
There is no significant exposure to interest rate risk as there is no material overdraft or interest bearing borrowings.
Foreign exchange risk
BRAC Social Business Enterprises Uganda Limited foreign exchange risks comprise of transactions risk which arise from donor grants received in currencies other than the local currency and minimal foreign currency deposits and cash at bank placed with licensed financial institutions. BRAC Social Business Enterprises Uganda Limited has no significant exposure to foreign exchange risk as there are no material foreign denominated balances.
Foreign exchange exposures in transactional currencies other than the local currency are monitored via periodic cash flow and budget forecasts and are kept to an acceptable level.
Liquidity risk
Liquidity risk is the risk that the company will not be able to meet its financial obligations as they fall due. The company’s approach to
managing liquidity is to ensure, as far as possible, that it will always have sufficient liquidity to meet its liabilities when due, under both normal and stressed conditions, without incurring unacceptable losses or risking damage to the company’s reputation
The liquidity profile of the company is as follows:
31 December 2016 Less than 6 6 to 12 More than 12 months months months Total Cash and cash equivalents 1,018,411 - - 1,018,411 Inventories 55,421 - - 55,421 Tax receivable - 26,365 - 26,365 Other receivables 168,162 - - 168,162 Total assets 1,241,994 26,365 - 1,268,359 Liabilities Other liabilities 163,315 - - 163,315 Amount due to related parties 65,651 - - 65,651 Total liabilities 228,966 - - 228,966 Liquidity gap 1,013,028 26,365 - 1,039,393
BRAC SOCIAL BUSINESS ENTERPRISES UGANDA LIMITED
NOTES TO THE FINANCIAL STATEMENTS FOR THE YEAR ENDED 31 DECEMBER 2016 CONTINUED
b) Operational risks
Operational risk is the risk of direct or indirect loss arising from a wide variety of causes associated with the Organization’s processes, personnel, technology and infrastructure, and from external factors other than credit, market and liquidity risks such as those arising from legal and regulatory requirements and generally accepted standards of corporate behavior.
The Organization’s objective is to manage operational risk so as to balance the avoidance of financial losses and damage to the Company’s reputation with overall cost effectiveness and to avoid control procedures that restrict initiative and creativity.
The primary responsibility for the development and implementation of controls to address operational risk is assigned to senior management within each BRAC Program. This responsibility is supported by the development of overall Organizational standards for the management of operational risk in the following areas:
i. Requirements for appropriate segregation of duties, including the independent authorization of transactions. ii. Requirements for the reconciliation and monitoring of transactions iii. Compliance with regulatory and other legal requirements iv. Documentation of controls and procedures v. Requirements for the periodic assessment of operational risks faced and the adequacy of controls and procedures to address the risks identified vi. Requirements for the reporting of operational losses and proposed remedial action vii. Development of contingency plans viii.Training and professional development ix. Ethical and business standards
Compliance with Company standards is supported by a programme of periodic reviews undertaken by the monitoring Department. The results of reviews are discussed with the management of the programs to which they relate, with summaries submitted to the senior management of the Company.
19. CAPITAL RISK MANAGEMENT The Board’s policy is to maintain a strong capital base so as to maintain investor, creditor and market confidence and to sustain future development of the business. The Board of Directors monitors the return on capital, which the company defines as net operating income divided by total shareholders’ equity. The Board of Directors also monitors the level of dividends paid.
There are no externally imposed capital requirements and there were no changes in the company’s approach to capital management during the period. 20. FAIR VALUES OF FINANCIAL ASSETS AND LIABILITIES The fair values of financial assets and financial liabilities that are traded in active markets are based on quoted market prices or dealer price quotations. For all other financial instruments, the Company determines fair values using other valuation techniques. For financial instruments that trade infrequently and have little price transparency, fair value is less objective, and requires varying degrees of judgment depending on liquidity, concentration, uncertainty of market factors, pricing assumptions and other risks affecting the specific instrument.
a) Valuation models The Company measures fair values using the following fair value hierarchy, which reflects the significance of the inputs used in making the measurements. • Level 1: inputs that are quoted market prices (unadjusted) in active markets for identical instruments e.g. quoted equity securities. These items are exchange traded positions. • Level 2: inputs other than quoted prices included within Level 1 that are observable either directly (i.e. as prices) or indirectly (i.e. derived from prices). This category includes instruments valued using: quoted market prices in active markets for similar instruments; quoted prices for identical or similar instruments in markets that are considered less than active; or other valuation techniques in which all significant inputs are directly or indirectly observable from market data.
BRAC SOCIAL BUSINESS ENTERPRISES UGANDA LIMITED
NOTES TO THE FINANCIAL STATEMENTS FOR THE YEAR ENDED 31 DECEMBER 2016 CONTINUED
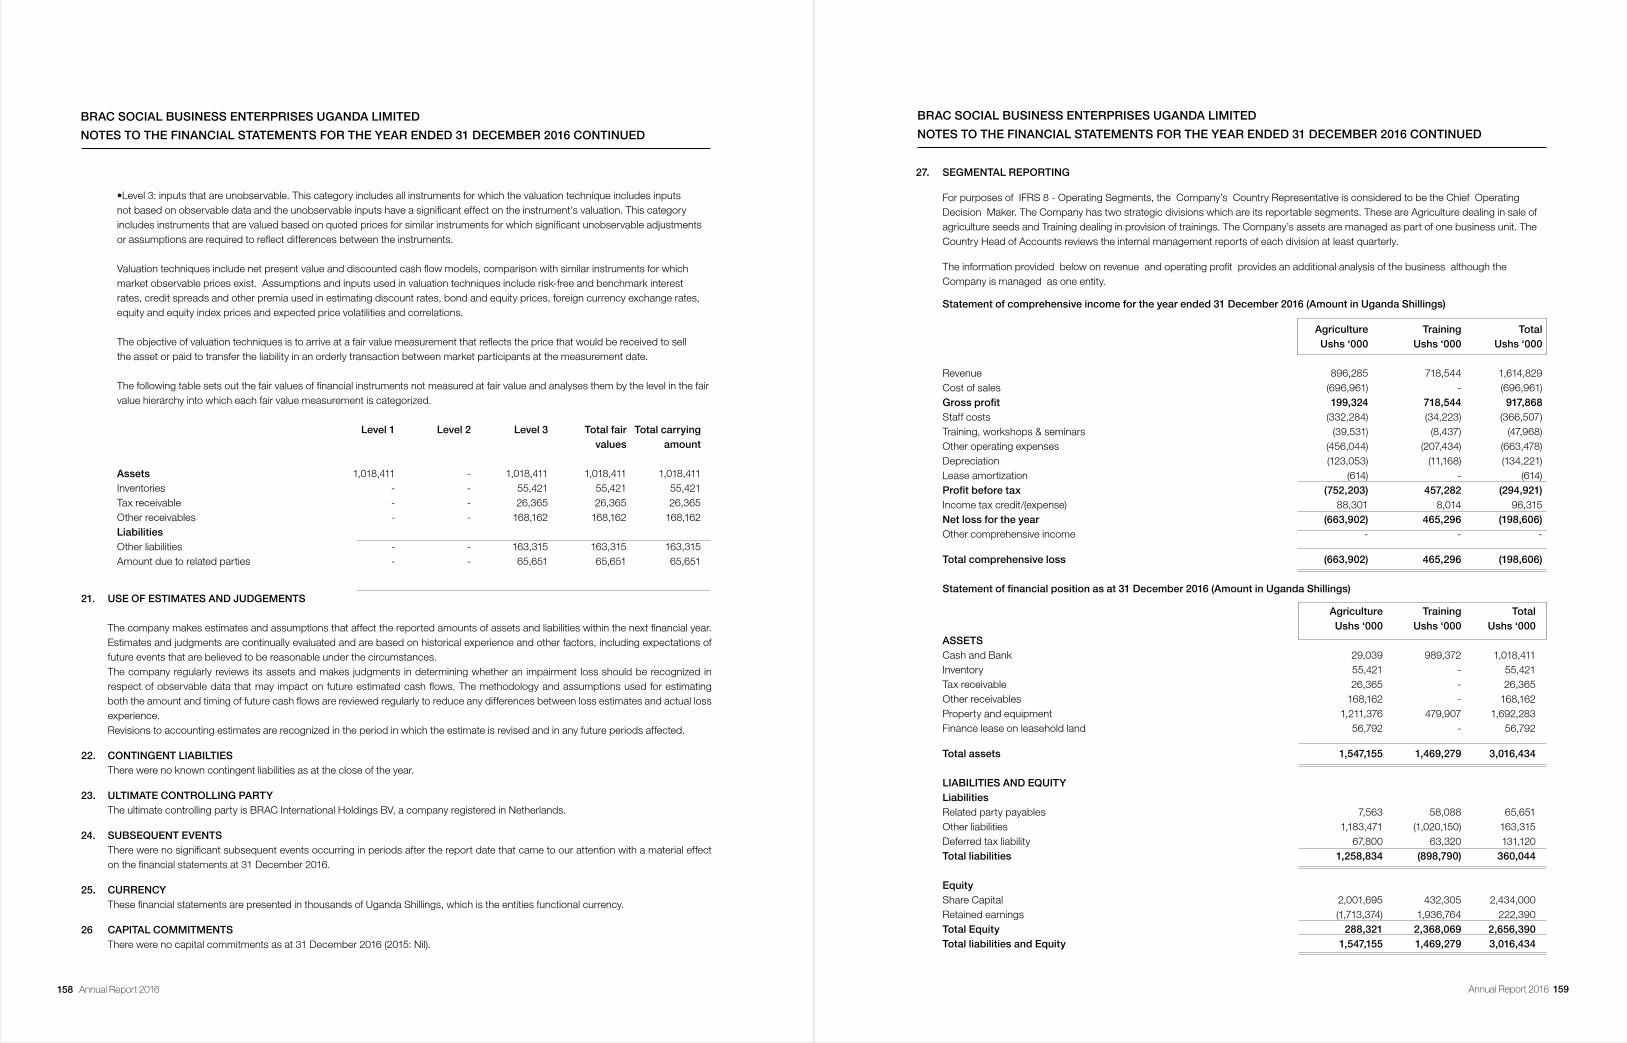
158 Annual Report 2016 Annual Report 2016 159
• Level 3: inputs that are unobservable. This category includes all instruments for which the valuation technique includes inputs not based on observable data and the unobservable inputs have a significant effect on the instrument’s valuation. This category includes instruments that are valued based on quoted prices for similar instruments for which significant unobservable adjustments or assumptions are required to reflect differences between the instruments.
Valuation techniques include net present value and discounted cash flow models, comparison with similar instruments for which market observable prices exist. Assumptions and inputs used in valuation techniques include risk-free and benchmark interest rates, credit spreads and other premia used in estimating discount rates, bond and equity prices, foreign currency exchange rates, equity and equity index prices and expected price volatilities and correlations.
The objective of valuation techniques is to arrive at a fair value measurement that reflects the price that would be received to sell the asset or paid to transfer the liability in an orderly transaction between market participants at the measurement date.
The following table sets out the fair values of financial instruments not measured at fair value and analyses them by the level in the fair value hierarchy into which each fair value measurement is categorized.
Level 1 Level 2 Level 3 Total fair Total carrying values amount
Assets 1,018,411 - 1,018,411 1,018,411 1,018,411 Inventories - - 55,421 55,421 55,421 Tax receivable - - 26,365 26,365 26,365 Other receivables - - 168,162 168,162 168,162 Liabilities Other liabilities - - 163,315 163,315 163,315 Amount due to related parties - - 65,651 65,651 65,651
21. USE OF ESTIMATES AND JUDGEMENTS
The company makes estimates and assumptions that affect the reported amounts of assets and liabilities within the next financial year. Estimates and judgments are continually evaluated and are based on historical experience and other factors, including expectations of future events that are believed to be reasonable under the circumstances. The company regularly reviews its assets and makes judgments in determining whether an impairment loss should be recognized in respect of observable data that may impact on future estimated cash flows. The methodology and assumptions used for estimating both the amount and timing of future cash flows are reviewed regularly to reduce any differences between loss estimates and actual loss experience.Revisions to accounting estimates are recognized in the period in which the estimate is revised and in any future periods affected.
22. CONTINGENT LIABILTIESThere were no known contingent liabilities as at the close of the year.
23. ULTIMATE CONTROLLING PARTYThe ultimate controlling party is BRAC International Holdings BV, a company registered in Netherlands.
24. SUBSEQUENT EVENTSThere were no significant subsequent events occurring in periods after the report date that came to our attention with a material effect on the financial statements at 31 December 2016.
25. CURRENCYThese financial statements are presented in thousands of Uganda Shillings, which is the entities functional currency.
26 CAPITAL COMMITMENTSThere were no capital commitments as at 31 December 2016 (2015: Nil).
BRAC SOCIAL BUSINESS ENTERPRISES UGANDA LIMITED
NOTES TO THE FINANCIAL STATEMENTS FOR THE YEAR ENDED 31 DECEMBER 2016 CONTINUED
27. SEGMENTAL REPORTING
For purposes of IFRS 8 - Operating Segments, the Company’s Country Representative is considered to be the Chief Operating Decision Maker. The Company has two strategic divisions which are its reportable segments. These are Agriculture dealing in sale of agriculture seeds and Training dealing in provision of trainings. The Company’s assets are managed as part of one business unit. The Country Head of Accounts reviews the internal management reports of each division at least quarterly.
The information provided below on revenue and operating profit provides an additional analysis of the business although the Company is managed as one entity.
Statement of comprehensive income for the year ended 31 December 2016 (Amount in Uganda Shillings)
Agriculture Training Total Ushs ‘000 Ushs ‘000 Ushs ‘000
Revenue 896,285 718,544 1,614,829 Cost of sales (696,961) - (696,961) Grossprofit 199,324 718,544 917,868
Staff costs (332,284) (34,223) (366,507) Training, workshops & seminars (39,531) (8,437) (47,968) Other operating expenses (456,044) (207,434) (663,478) Depreciation (123,053) (11,168) (134,221) Lease amortization (614) - (614) Profitbeforetax (752,203) 457,282 (294,921) Income tax credit/(expense) 88,301 8,014 96,315 Net loss for the year (663,902) 465,296 (198,606) Other comprehensive income - - - Total comprehensive loss (663,902) 465,296 (198,606)
Statementoffinancialpositionasat31December2016(AmountinUgandaShillings)
Agriculture Training Total Ushs ‘000 Ushs ‘000 Ushs ‘000 ASSETS Cash and Bank 29,039 989,372 1,018,411 Inventory 55,421 - 55,421 Tax receivable 26,365 - 26,365 Other receivables 168,162 - 168,162 Property and equipment 1,211,376 479,907 1,692,283 Finance lease on leasehold land 56,792 - 56,792
Total assets 1,547,155 1,469,279 3,016,434 LIABILITIES AND EQUITY Liabilities Related party payables 7,563 58,088 65,651 Other liabilities 1,183,471 (1,020,150) 163,315 Deferred tax liability 67,800 63,320 131,120 Total liabilities 1,258,834 (898,790) 360,044 Equity Share Capital 2,001,695 432,305 2,434,000 Retained earnings (1,713,374) 1,936,764 222,390 Total Equity 288,321 2,368,069 2,656,390 Total liabilities and Equity 1,547,155 1,469,279 3,016,434
BRAC SOCIAL BUSINESS ENTERPRISES UGANDA LIMITED
NOTES TO THE FINANCIAL STATEMENTS FOR THE YEAR ENDED 31 DECEMBER 2016 CONTINUED
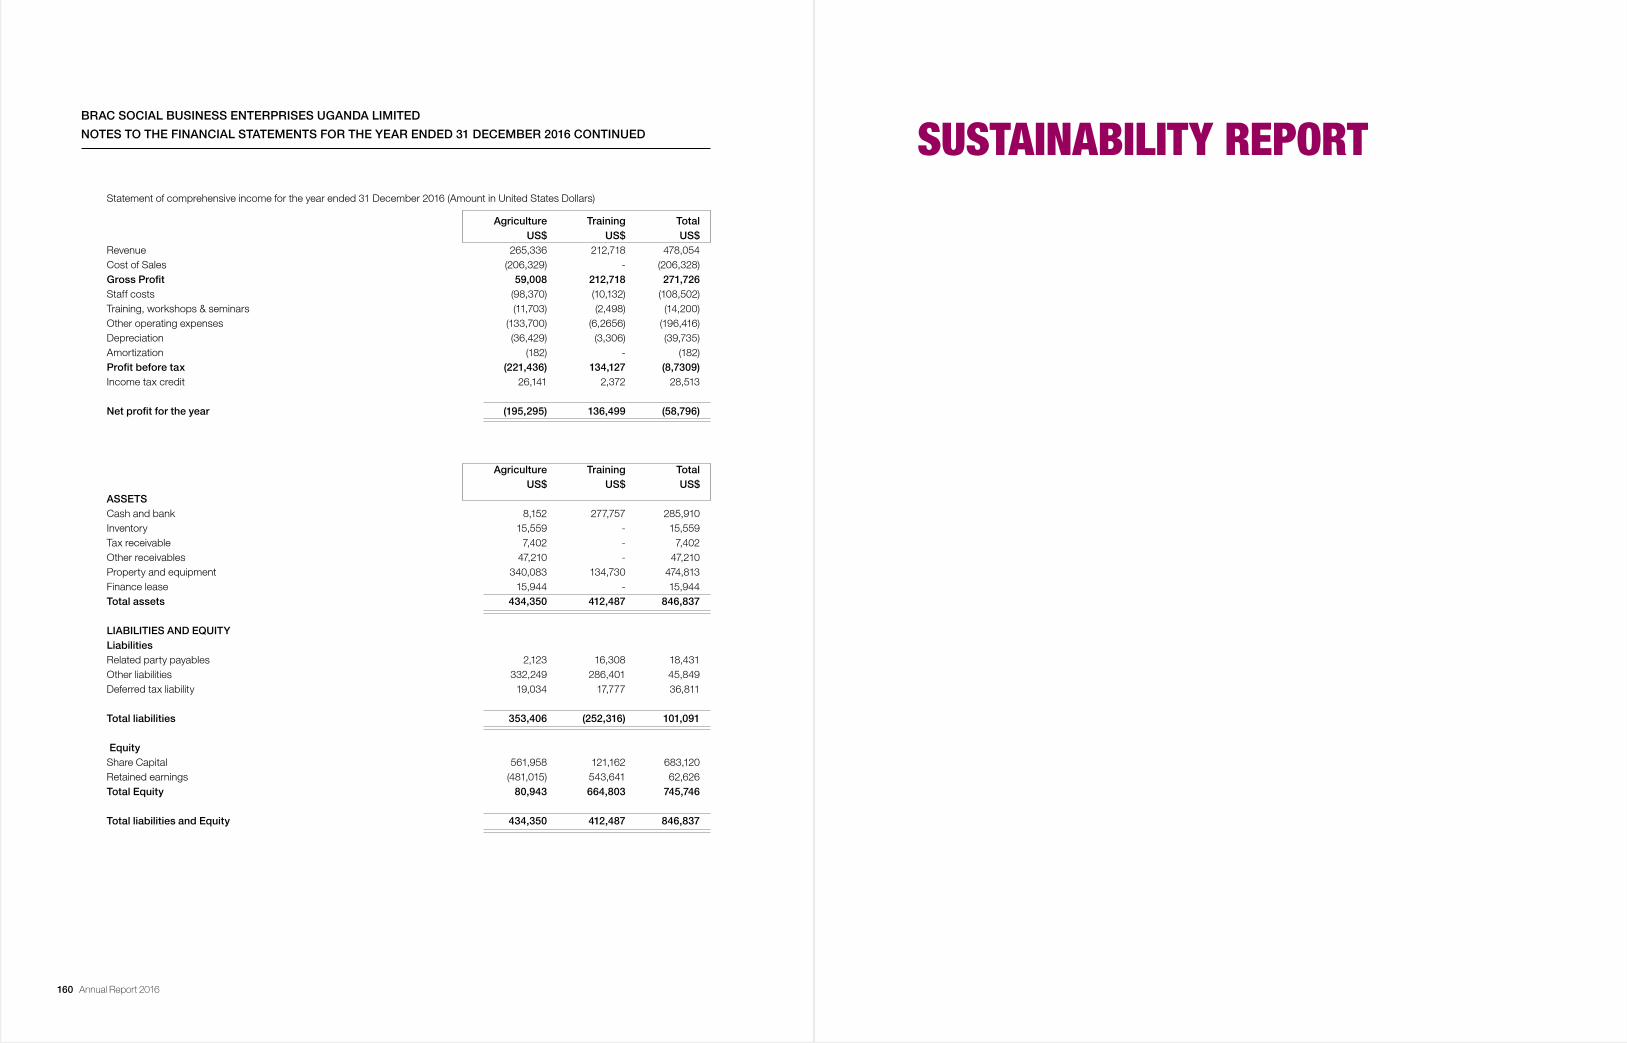
160 Annual Report 2016
Statement of comprehensive income for the year ended 31 December 2016 (Amount in United States Dollars)
Agriculture Training Total US$ US$ US$Revenue 265,336 212,718 478,054Cost of Sales (206,329) - (206,328)GrossProfit 59,008 212,718 271,726Staff costs (98,370) (10,132) (108,502) Training, workshops & seminars (11,703) (2,498) (14,200) Other operating expenses (133,700) (6,2656) (196,416) Depreciation (36,429) (3,306) (39,735) Amortization (182) - (182) Profitbeforetax (221,436) 134,127 (8,7309)Income tax credit 26,141 2,372 28,513
Netprofitfortheyear (195,295) 136,499 (58,796)
Agriculture Training Total US$ US$ US$
ASSETS Cash and bank 8,152 277,757 285,910 Inventory 15,559 - 15,559 Tax receivable 7,402 - 7,402 Other receivables 47,210 - 47,210 Property and equipment 340,083 134,730 474,813 Finance lease 15,944 - 15,944 Total assets 434,350 412,487 846,837 LIABILITIES AND EQUITY Liabilities Related party payables 2,123 16,308 18,431 Other liabilities 332,249 286,401 45,849 Deferred tax liability 19,034 17,777 36,811
Total liabilities 353,406 (252,316) 101,091 Equity Share Capital 561,958 121,162 683,120 Retained earnings (481,015) 543,641 62,626 Total Equity 80,943 664,803 745,746
Total liabilities and Equity 434,350 412,487 846,837
BRAC SOCIAL BUSINESS ENTERPRISES UGANDA LIMITED
NOTES TO THE FINANCIAL STATEMENTS FOR THE YEAR ENDED 31 DECEMBER 2016 CONTINUEDSUSTAINABILITY REPORT
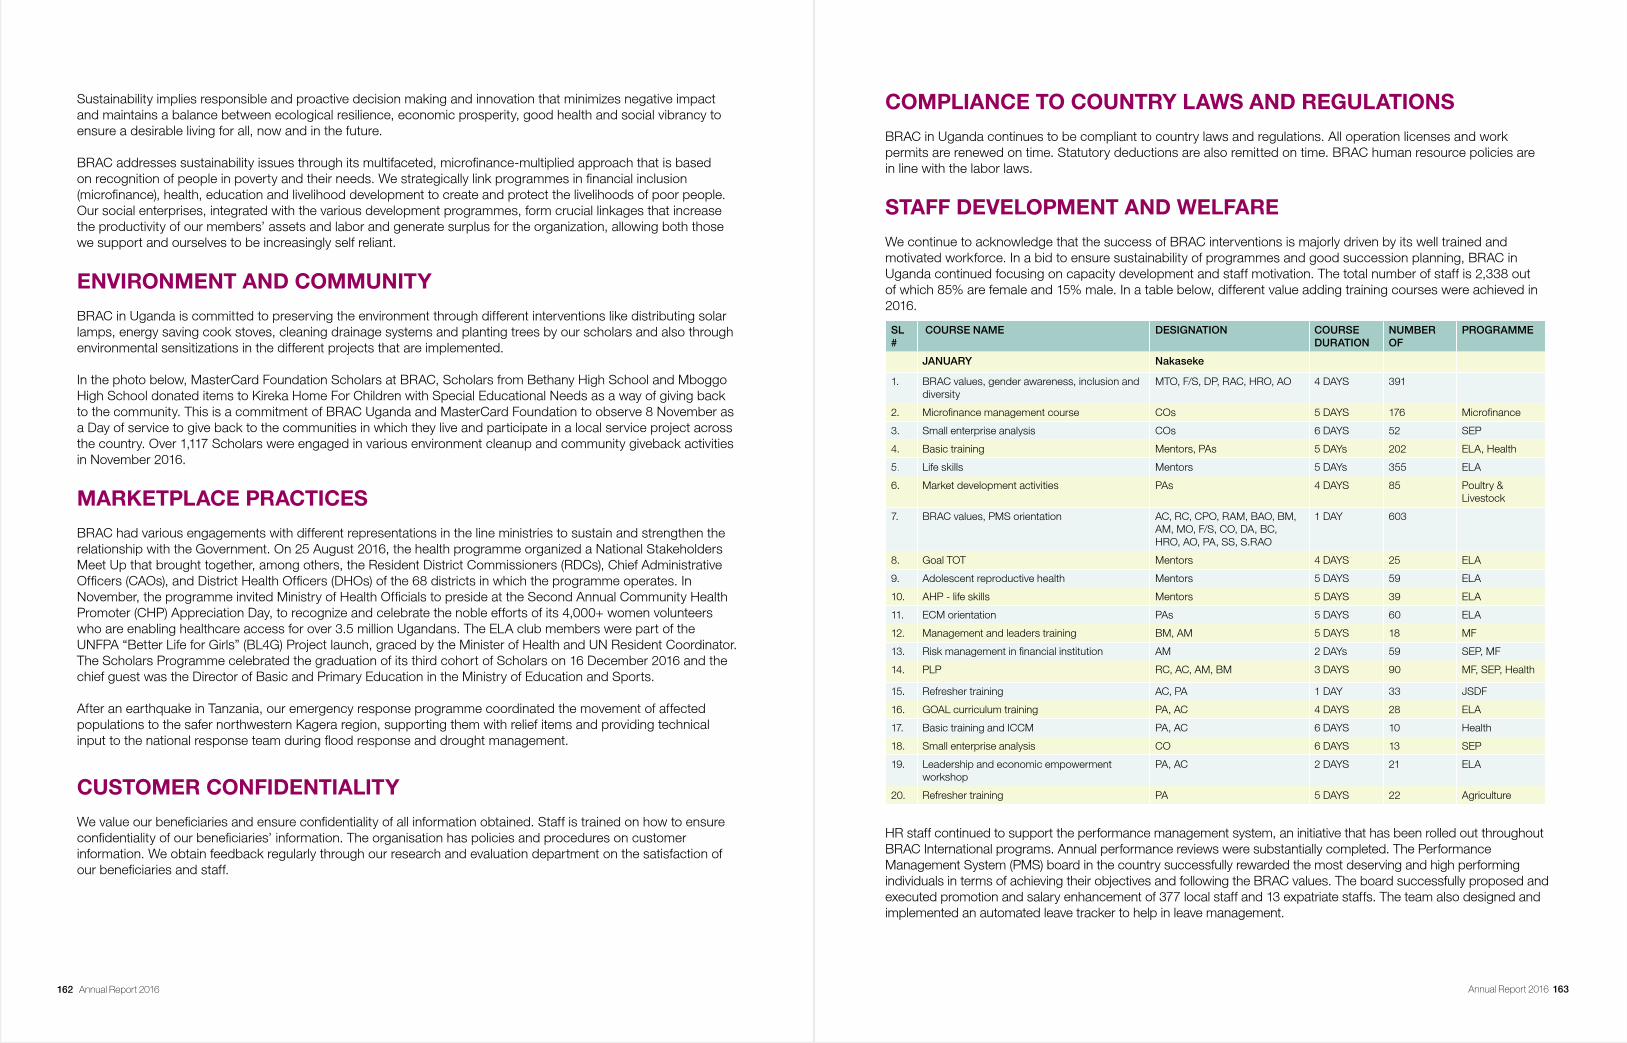
162 Annual Report 2016 Annual Report 2016 163
Sustainability implies responsible and proactive decision making and innovation that minimizes negative impact and maintains a balance between ecological resilience, economic prosperity, good health and social vibrancy to ensure a desirable living for all, now and in the future.
BRAC addresses sustainability issues through its multifaceted, microfinance-multiplied approach that is based on recognition of people in poverty and their needs. We strategically link programmes in financial inclusion (microfinance), health, education and livelihood development to create and protect the livelihoods of poor people. Our social enterprises, integrated with the various development programmes, form crucial linkages that increase the productivity of our members’ assets and labor and generate surplus for the organization, allowing both those we support and ourselves to be increasingly self reliant.
ENVIRONMENT AND COMMUNITY
BRAC in Uganda is committed to preserving the environment through different interventions like distributing solar lamps, energy saving cook stoves, cleaning drainage systems and planting trees by our scholars and also through environmental sensitizations in the different projects that are implemented.
In the photo below, MasterCard Foundation Scholars at BRAC, Scholars from Bethany High School and Mboggo High School donated items to Kireka Home For Children with Special Educational Needs as a way of giving back to the community. This is a commitment of BRAC Uganda and MasterCard Foundation to observe 8 November as a Day of service to give back to the communities in which they live and participate in a local service project across the country. Over 1,117 Scholars were engaged in various environment cleanup and community giveback activities in November 2016.
MARKETPLACE PRACTICES
BRAC had various engagements with different representations in the line ministries to sustain and strengthen the relationship with the Government. On 25 August 2016, the health programme organized a National Stakeholders Meet Up that brought together, among others, the Resident District Commissioners (RDCs), Chief Administrative Officers (CAOs), and District Health Officers (DHOs) of the 68 districts in which the programme operates. In November, the programme invited Ministry of Health Officials to preside at the Second Annual Community Health Promoter (CHP) Appreciation Day, to recognize and celebrate the noble efforts of its 4,000+ women volunteers who are enabling healthcare access for over 3.5 million Ugandans. The ELA club members were part of the UNFPA “Better Life for Girls” (BL4G) Project launch, graced by the Minister of Health and UN Resident Coordinator. The Scholars Programme celebrated the graduation of its third cohort of Scholars on 16 December 2016 and the chief guest was the Director of Basic and Primary Education in the Ministry of Education and Sports.
After an earthquake in Tanzania, our emergency response programme coordinated the movement of affected populations to the safer northwestern Kagera region, supporting them with relief items and providing technical input to the national response team during flood response and drought management.
CUSTOMER CONFIDENTIALITY
We value our beneficiaries and ensure confidentiality of all information obtained. Staff is trained on how to ensure confidentiality of our beneficiaries’ information. The organisation has policies and procedures on customer information. We obtain feedback regularly through our research and evaluation department on the satisfaction of our beneficiaries and staff.
COMPLIANCE TO COUNTRY LAWS AND REGULATIONS
BRAC in Uganda continues to be compliant to country laws and regulations. All operation licenses and work permits are renewed on time. Statutory deductions are also remitted on time. BRAC human resource policies are in line with the labor laws.
STAFF DEVELOPMENT AND WELFARE
We continue to acknowledge that the success of BRAC interventions is majorly driven by its well trained and motivated workforce. In a bid to ensure sustainability of programmes and good succession planning, BRAC in Uganda continued focusing on capacity development and staff motivation. The total number of staff is 2,338 out of which 85% are female and 15% male. In a table below, different value adding training courses were achieved in 2016.
SL #
COURSE NAME DESIGNATION COURSE DURATION
NUMBER OF
PROGRAMME
JANUARY Nakaseke
1. BRAC values, gender awareness, inclusion and diversity
MTO, F/S, DP, RAC, HRO, AO 4 DAYS 391
2. Microfinance management course COs 5 DAYS 176 Microfinance
3. Small enterprise analysis COs 6 DAYS 52 SEP
4. Basic training Mentors, PAs 5 DAYs 202 ELA, Health
5. Life skills Mentors 5 DAYs 355 ELA
6. Market development activities PAs 4 DAYS 85 Poultry & Livestock
7. BRAC values, PMS orientation AC, RC, CPO, RAM, BAO, BM, AM, MO, F/S, CO, DA, BC, HRO, AO, PA, SS, S.RAO
1 DAY 603
8. Goal TOT Mentors 4 DAYS 25 ELA
9. Adolescent reproductive health Mentors 5 DAYS 59 ELA
10. AHP - life skills Mentors 5 DAYS 39 ELA
11. ECM orientation PAs 5 DAYS 60 ELA
12. Management and leaders training BM, AM 5 DAYS 18 MF
13. Risk management in financial institution AM 2 DAYs 59 SEP, MF
14. PLP RC, AC, AM, BM 3 DAYS 90 MF, SEP, Health
15. Refresher training AC, PA 1 DAY 33 JSDF
16. GOAL curriculum training PA, AC 4 DAYS 28 ELA
17. Basic training and ICCM PA, AC 6 DAYS 10 Health
18. Small enterprise analysis CO 6 DAYS 13 SEP
19. Leadership and economic empowerment workshop
PA, AC 2 DAYS 21 ELA
20. Refresher training PA 5 DAYS 22 Agriculture
HR staff continued to support the performance management system, an initiative that has been rolled out throughout BRAC International programs. Annual performance reviews were substantially completed. The Performance Management System (PMS) board in the country successfully rewarded the most deserving and high performing individuals in terms of achieving their objectives and following the BRAC values. The board successfully proposed and executed promotion and salary enhancement of 377 local staff and 13 expatriate staffs. The team also designed and implemented an automated leave tracker to help in leave management.
164 Annual Report 2016
INCLUSIVE AND DIVERSITY MANAGEMENT CAMPAIGN (IDMC)
On 21 May 2016, all branch offices celebrated IDMC Day under the theme Unifying Uniqueness and Us, through cross-cultural skits, quizzes and game activities. IDMC is an initiative to make our workforce more aware and open to inclusion of differences. Its main objective is to enhance knowledge and sensitivity on diversity and inclusiveness in general and empathy of other cultures in particular and to increase opportunity to interact and socialise with different communities/cultures and races.
STAFF REMUNERATION POLICIES
Staffs at all levels are remunerated in accordance with their employment contracts or appointment letters. The salaries are fixed according to the salary structure. Staffs are paid salaries within the last two working days of the month. Full time staffs are eligible for an annual salary review based on performance, fund availability and organizational policies. In 2016, HR reviewed and replaced the salary structure with a competitive market based new salary structure; medical insurance for all staff of BRAC in Uganda was approved and implemented along with the enhancement of the lunch allowance of all staff.
BRAC in Uganda
Plot 90, Busingiri ZoneOff Entebbe Road, Nyanama Kampala, Uganda
T : +256 (0) 714 274201E : [email protected]
Photo credit:
BRAC/Nasir Ali MamunBRAC/Kamrul HasanBRAC/Alison WrightBRAC/Jake LyellBRAC/Shehzad NooraniBRAC/Shehzeen Choudhury
Cover photo:
BRAC/Shehzeen Choudhury
BR
AC
Com
mun
icat
ions
/BR
AC
Inte
rnat
iona
l/AR
16/J
uly
17
BRAC
BRAC Centre75 MohakhaliDhaka 1212Bangladesh
T : +88 02 9881265F : +88 02 8823542E : [email protected] : www.brac.net
BRAC International
Bezuidenhoutseweg 2 2594 AV The Hague The Netherlands