ANNUAL - Tweedy, Browne MARCH 31, 2003 ... As we never owned these “TMT” stocks, ... difference...
76
TWEEDY, BROWNE GLOBAL VALUE FUND TWEEDY, BROWNE AMERICAN VALUE FUND ANNUAL MARCH 31, 2003
-
Upload
truongphuc -
Category
Documents
-
view
216 -
download
0
Transcript of ANNUAL - Tweedy, Browne MARCH 31, 2003 ... As we never owned these “TMT” stocks, ... difference...
TWEEDY, BROWNEGLOBAL VALUE FUND
TWEEDY, BROWNEAMERICAN VALUE FUND
ANNUALMARCH 31, 2003
59509_Tweedy AR 3 5/21/03 11:30 AM Page 1

This report is for the information of the shareholders of Tweedy, BrowneFund Inc. Its use in connection with any offering of the Company’s shares isauthorized only in a case of a concurrent or prior delivery of the Company’scurrent prospectus. Investors should refer to the accompanying prospectusfor description of risk factors associated with investments in securities heldby both Funds. Additionally, investing in foreign securities involves eco-nomic and political considerations not typically found in U.S. markets,including currency fluctuations, political uncertainty and differences infinancial standards. Tweedy, Browne Company LLC is a member of theNASD and is the Distributor of the Company.
Tweedy, Browne Fund Inc.Investment Adviser’s Report. . . . . . . . . . . . . . . . . . . . . . . . . . . . . . . . . . 1Tweedy, Browne Global Value Fund:
Portfolio Highlights . . . . . . . . . . . . . . . . . . . . . . . . . . . . . . . . . . . . . . . 19Perspective on Assessing Investment Results . . . . . . . . . . . . . . . . . . . 20Portfolio of Investments . . . . . . . . . . . . . . . . . . . . . . . . . . . . . . . . . . . 22Schedule of Forward Exchange Contracts. . . . . . . . . . . . . . . . . . . . . . 30Statement of Assets and Liabilities . . . . . . . . . . . . . . . . . . . . . . . . . . . 34Statement of Operations . . . . . . . . . . . . . . . . . . . . . . . . . . . . . . . . . . . 35Statements of Changes in Net Assets . . . . . . . . . . . . . . . . . . . . . . . . . 36Financial Highlights . . . . . . . . . . . . . . . . . . . . . . . . . . . . . . . . . . . . . . 37Notes to Financial Statements . . . . . . . . . . . . . . . . . . . . . . . . . . . . . . 38
Investment in the Fund by the Investment Adviser and Related Parties . . . . . . . . . . . . . . . . . . . . . . . . . . . . . . . . . . . . 41
Report of Ernst & Young LLP, Independent Auditors . . . . . . . . . . . . 45Other Information . . . . . . . . . . . . . . . . . . . . . . . . . . . . . . . . . . . . . . . . 46
Tweedy, Browne American Value Fund:Portfolio Highlights . . . . . . . . . . . . . . . . . . . . . . . . . . . . . . . . . . . . . . . 49Perspective on Assessing Investment Results . . . . . . . . . . . . . . . . . . . 50Portfolio of Investments . . . . . . . . . . . . . . . . . . . . . . . . . . . . . . . . . . . 52Schedule of Forward Exchange Contracts. . . . . . . . . . . . . . . . . . . . . . 56Statement of Assets and Liabilities . . . . . . . . . . . . . . . . . . . . . . . . . . . 57Statement of Operations . . . . . . . . . . . . . . . . . . . . . . . . . . . . . . . . . . . 58Statements of Changes in Net Assets . . . . . . . . . . . . . . . . . . . . . . . . . 59Financial Highlights . . . . . . . . . . . . . . . . . . . . . . . . . . . . . . . . . . . . . . 60Notes to Financial Statements . . . . . . . . . . . . . . . . . . . . . . . . . . . . . . 61
Investment in the Fund by the Investment Adviser and Related Parties . . . . . . . . . . . . . . . . . . . . . . . . . . . . . . . . . . . . 65
Report of Ernst & Young LLP, Independent Auditors . . . . . . . . . . . . 69Other Information . . . . . . . . . . . . . . . . . . . . . . . . . . . . . . . . . . . . . . . . 70
59509_Tweedy AR 3 5/21/03 11:30 AM Page 2

1
Investment Adviser’s ReportTWEEDY, BROWNE FUND INC.
Left to right: John Spears, Tom Shrager, Chris Browne, Bob Wyckoff and Will Browne.
To Our Shareholders:We are pleased to present the 10th annual report of the Tweedy,
Browne Global Value Fund and Tweedy, Browne American Value Fund forthe year ended March 31, 2003. Investment results* of both Funds forvarious time periods ending March 31, 2003 are presented in the tablesbelow.
Tweedy, BrowneGlobal Value MSCI EAFE(1)(2)
Fund US $ Hedged 6 Months (4.49)% (2.29)% (8.37)%
1 Year (24.86) (23.59) (35.71)
3 Years (6.27) (19.55) (20.09)
5 Years 0.64 (7.13) (6.90)Since Inception (3) 9.15 0.84 2.65
59509_Tweedy AR 3 5/21/03 11:30 AM Page 1

Tweedy, BrowneAmerican Value S&P
Fund 500(1)(4)
6 Months 0.87% 5.01%
1 Year (21.16) (24.75)
3 Years (1.76) (16.09)
5 Years (1.03) (3.76)
Since Inception (3) 9.72 8.68
* Past performance is not a guarantee of future results, and total return andprincipal value of investments will fluctuate with market changes. Shares, whenredeemed, may be worth more or less than their original cost. See page 17 forfootnotes 1 through 5, which describe the indexes and inception dates of theFunds. Results are annualized for all periods except the 6 months period.
Since our September 30, 2002 semi-annual report, stock marketsaround the world have had either modest gains or modest losses. Ourexperience has been similar. Given the interim market volatility of globalequity markets caused by political uncertainty, the modest change in thetotal returns of the global equity markets over the last 6 months comes as asurprise. Moreover, following the news on a day-to-day basis, we could onlyarrive at a state of utter confusion about the effect war would have on thestock markets. We can remember one week when the US stock marketseemed to lose a percent a day because war seemed unavoidable. The nextweek the market rallied sharply because war was inevitable. We have towonder whether the stock market is reacting to events on the geopoliticalfront, or if the market’s activity is being interpreted in reaction togeopolitical events. Ben Graham once said, “In the short run, the market isa voting machine, but in the long run, it is a weighing machine.” Today, wemight paraphrase his statement by saying, “In the short run, the market isbipolar. In the long run, it is rational.”
Short-term results aside, over the past three years, we have experienceda bear market of classic proportions. The cumulative loss for the S&P 500from March 31, 2000 through March 31, 2003 is -40.9%. The peak-to-trough decline is -49.2%. For the NASDAQ(5), the three year loss numberis -70.4%, and its peak-to-trough number is -77.9%. Internationally, theMSCI EAFE in US$ lost 47.9% while the MSCI EAFE Hedged Index isdown 49.0%, both for the three years ended March 31, 2003. For the samethree years, the Tweedy, Browne American Value Fund shows a cumulativeloss of -5.2%, and the Tweedy, Browne Global Value Fund has lost 17.6%.The primary reason for our better relative performance over this three yearperiod is attributable to missing the first two years of the bear market. FromMarch 31, 2000 to March 31, 2002, the decline in stocks, both domesticallyand internationally, was caused by the bursting of the technology, media and
2
59509_Tweedy AR 3 5/21/03 11:30 AM Page 2
telecom bubble. As we never owned these “TMT” stocks, our performancedid not suffer when their prices came back to earth. In fact, we actuallyexperienced gains in both Funds in both fiscal years, 2001 and 2002.
Unfortunately, in the latest year the carnage spread. This sequence ofevents is reminiscent of the bear market of the 1970s. In both periods, thebear market for a time was mostly confined to a narrow segment of themarket, the Nifty-Fifty in the ’70s, and the TMT stocks in the 2000 to 2002period. These were the segments that for the most part experienced the 80%plus price declines. The same stocks that were the beneficiaries of the bubbleinflating were also the principal victims of the bubble bursting. Again, as inthe 1970s, even isolated stock price declines of this magnitude eventuallyaffected the market as a whole. According to Morgan Stanley, 75% of allstocks in the US declined in 2002. Moreover, macroeconomic andgeopolitical events in both periods had a further negative effect on stockprices. In the 1970s, we experienced the first oil price shocks and theresignation of a president. This time around, it was a recession and theeconomic uncertainty resulting from the September 11, 2001 terroristattacks. Although the events of the ’70s and the ’00s occurred thirty yearsapart, the circumstances are strikingly similar.
All of the above is now history. Whether you avoided the worst of theravages of the most recent bear market (which we believe we did), or youcaught more of the bursting of the bubble than the inflating of the bubble(which a lot of unfortunate folks did), the question on everyone’s mind is,“What’s next?” If we could answer this question with complete accuracy andspecificity, we would mortgage our houses, lever to the gills and place ourbets. Having a realistic opinion of our prognosticating powers, we willinstead strive to analyze where we think we are, and what we can reasonablyexpect in the future over the long term.
There is no paucity of predictions about the future of equity returns;there never is. We recently heard the Honorable Martin Indyk, former USambassador to Israel, speak on the war in Iraq. Commenting on politicalpundits, he said, “Pundits see the future with 20/20 vision and recall the pastwith selective amnesia.” The same could be said about stock market pundits.We have read predictions about a further 40% decline in the popular stockmarket averages before a new bull market can begin. We have read articlesby both Warren Buffett and Dr. Jeremy Siegel of the Wharton Schoolpredicting returns over the next ten years in the range of 7% to 9% for thebroad stock market indices. And there are still dreamers who think thetechnology sector can rise again as soon as the economy gets back on its feet.We tend to weigh in on the side of the Buffett/Siegel scenario but with acaveat. They are speaking about stocks in general as measured by a broadindex, like the S&P 500 or the MSCI EAFE. The indices are an average of
3
59509_Tweedy AR 3 5/21/03 11:30 AM Page 3
stock returns, and a pretty good barometer of how the overall economy isdoing. However, within the universe of approximately 10,000 stocksdomestically and another 10,000 internationally, there will be opportunitiesto find issues that can perform better than the overall market. Not all stocksperform in lock step with their index.
The now deflated bubble of the turn of the millennium provides theclearest example of this phenomenon that we have ever seen. According toa research piece written in mid-April 2003 by Steve Galbraith and MaryViviano of Morgan Stanley, entitled “Fat Cats Thinning,” the differencebetween the highest priced and lowest priced stocks, and their relativeperformance, reached unprecedented proportions in 2000. Using the stockuniverse of the Russell 1000, the authors found that in 2000, theperformance spread between the median of the best performing quintile ofstocks and the worst performing quintile was greater than 50%, versus anhistorical twenty-year average of approximately 22%. As of April 15, 2003,the difference in the median performance between the highest and lowestquintiles was below the historical average. The authors go on to note thatan old Ben Graham measurement of value, price-to-book value, also reachedabsurd levels at the apex of the bubble. At that time, the most highly valuedquintile in the Russell 1000 traded at a median price/book value ratio of21.1X the median price/book value ratio of the lowest quintile. Thedifference between the highest and lowest quintiles in the twenty-yearaverage price/book value ratio is 4X. As of the writing of their report, themultiple was near historical spreads at 4.9X.
Galbraith and Viviano, who we regard as excellent writers and analysts,go on to cite additional evidence of a market gone amok. At the height ofthe market in 2000, margin debt as a percentage of total consumer debtreached a peak of 20% versus a fifty-year average of just under 6%. Theyreason that just when stocks were the most overvalued, investors weretaking the greatest risk by borrowing at unprecedented levels. Becauseinvestors could trade over a faceless Internet and not under the watchful eyeof a broker who might question the wisdom of gambling one’s retirementmoney on stocks like Webvan, they would not face the “rite of semi-publichumiliation” if their bet went wrong. Today, margin debt as a percentage oftotal consumer debt has returned to historical levels, which may partlyaccount for why we see fewer on-line broker ads on television. Lastly,Galbraith and Viviano cite data showing the spread between the estimatedmedian earnings growth rates between the top and bottom quintiles of thesame Russell 1000 index. Again, in 2000 the spread reached its highest levelin twenty years with the highest quintile estimated to grow earnings at eighttimes nominal Gross Domestic Product despite 100 years of history thatsuggested such an outcome was a virtual impossibility. Today, the spreadbetween the highest and lowest quintiles is below the twenty-year average.
4
59509_Tweedy AR 3 5/21/03 11:30 AM Page 4
The conclusion from all this data is that markets have become morerational, that expectations of “irrational exuberance” have been reducedand that the volatility of stocks should be far lower going forward. Thispresents a dilemma for day traders and hedge funds. Speculators thrive onvolatility and grossly disparate returns among different types of stocks.Instead, we are experiencing a “compression” in stock values and returns.The implications from such an environment are lower future returns basedupon momentum and long/short investment strategies. We may finally beback to basics.
We can deal with basics. Stock prices track earnings and earningsgrowth rates. Some stocks trade at valuations akin to modest growth bondswith anticipated dividends being the ultimate arbiter of value. Other stockstrade at values based on growth rates above the average. All stock prices aresubject to excesses above and below their long-term prospects. Sometimes,the excesses reach extraordinary proportions. For example, JuniperNetworks reached a high of $243 in October 2000. That year it reportedearnings of $0.53 per share for a price/earnings multiple of 459X. Investorswho bought Juniper Networks at $243 per share obviously had someexpectations that the stock would continue to rise from that level. If weassume a more modest rate of stock price appreciation of 15% per annum,the price of Juniper would be $983 per share in ten years. If we furtherassume that as the company grew, its price/earnings ratio would have tocome down to a more reasonable growth stock multiple of perhaps 35Xearnings, this would equate to earnings per share of $28.09 in 2010. To reachthat level of EPS, the compounded growth rate for ten years would be adaunting 48.74%. Assuming constant profit margins, sales would have togrow from $673 million per year in 2000 to $35.7 billion in 2010, and themarket cap of Juniper would be $370 billion. As a reality check, Microsofthad sales of $28.4 billion in 2002, which grew at an annually compoundedrate of 12.8% over the previous three years. As of April 23, 2003, its marketcap was only $275 billion. And Juniper Networks ain’t no Microsoft! If youare waiting for Juniper to regain its former high stock price, our best guess isthat you have a long time to wait. (Juniper’s stock price on April 23, 2003was $10.23.) What drove the price of Juniper and similartechnology/Internet stocks to such absurd levels is the stock markets’equivalent of the 100 year flood plain. It happens, but not very often.
The most rational cases for what to expect from stocks as measured bybroad indexes like the S&P 500 and MSCI EAFE are made by WarrenBuffett and Jeremy Siegel. Mr. Buffett wrote two articles on this topic inFORTUNE magazine. In the November 22, 1999 issue, he observed thatoverall corporate profits, at 6% of Gross Domestic Product, were at the highend of their historical range, and would be unlikely to increase as apercentage of GDP. Therefore, Mr. Buffett concluded that corporate profits
5
59509_Tweedy AR 3 5/21/03 11:30 AM Page 5
were likely to increase at the rate of nominal GDP growth. He assumed thatover the next seventeen years, GDP will have real growth of 3%, and theinflation rate will be 2%. These numbers add up to a nominal corporateprofit growth rate of 5%. Add a 2% dividend yield, and Mr. Buffettcalculated a 7% annual return from stocks over the next seventeen years. Atthe time, the Dow Jones Industrial Average was 11,194 versus approximately8,500 today. In the December 10, 2001 issue of FORTUNE magazine, Mr.Buffett revisited his previous prediction with the DJIA then at 9,900. Hisrevised prediction at the lower level for the DJIA was an 8% annuallycompounded rate of return over the next seventeen years. With the DJIAnow lower at approximately 8,500, following the Buffett assumptions, weestimate the seventeen-year rate of return to be about 9%.
Dr. Jeremy Siegel, author of Stocks for the Long Run and a professor offinance at the University of Pennsylvania’s Wharton School of Finance,arrived at a forecast which is similar to Mr. Buffett’s. Using the S&P 500 ashis benchmark, Dr. Siegel forecasts a long-term rate of return, growth anddividends combined of 6.7% before inflation. If inflation is 2%, the returnis 8.7%.
Over the period of time that spans Tweedy, Browne’s long-terminvestment results, from January 1, 1959 through December 31, 2002, theDJIA has compounded at an annual rate of 10.2%, and the S&P 500 hascompounded at 10.1%. These index numbers would suggest that Mr.Buffett’s and Dr. Siegel’s predictions are not too far off the mark. We suspect,but have not proven, that the index numbers during Tweedy, Browne’shistorical investment period, January 1, 1959 through December 31, 2002,are slightly higher than the Buffett and Siegel predictions because stocksmay have been cheaper in 1959 on the basis of price/earnings than they aretoday. Both Buffett and Siegel seem to be assuming a constant price/earningsratio looking to the future. Siegel observes that the current reportedearnings of the S&P 500 are approximately $50, which results in aprice/earnings ratio of 18.3X with the S&P 500 at 913. He further states thatthe “core” earnings of the S&P 500 are approximately $40. The adjustmentbetween reported and core earnings relates to the elimination ofextraordinary charges and the expensing of management stock options. TheP/E ratio using core earnings is 22.8X with the S&P 500 at 913. Thehistorical average price/earnings ratio of the S&P 500 has been in the rangeof 15X. Dr. Siegel believes a higher average price/earnings ratio is nowjustified because the Great Depression and the double-digit inflation of the1970s “will never happen again.” Both the Buffett and Siegel predictionscould rise if the dividend payout ratio of stocks rises. Currently, corporationsare paying out a smaller percentage of earnings than has been the casehistorically. An increase in the dividend payout ratio could increase thereturn on stocks by an additional 50 to 100 basis points.
6
59509_Tweedy AR 3 5/21/03 11:30 AM Page 6

Not everyone is so sanguine about the future rate of return on stocks.Some fear that investors’ expectations are too high based on returns theyenjoyed in the period up until early 2000. This was clearly an extraordinaryperiod. For the ten years ended March 31, 2000, the S&P 500 compoundedat 18.8% per annum. Roll forward three years, and the ten year rate ofcompounding has fallen to 8.5%, which is at or below our two experts’ long-term predictions for stock returns. Others fear that stocks must correct evenfurther before moving back up to their historical rates of return in the 9% to10% range. In “Sorry to Spoil the Fun” from the June 11, 2001 issue ofFORTUNE magazine, author Shawn Tully warns of a 60% drop in the S&P500 back to a price/earnings ratio of 14.4X. He calculates that corporateprofits will grow from that point forward by 6% per year. He adds in adividend yield of 1.2% and gets a combined return of 7.2% for theforeseeable future. We tend to side with Dr. Siegel in assuming theprice/earnings ratio could be higher going forward. Moreover, Mr. Tullyforgets that the dividend yield would rise significantly if stocks declined thatmuch. From a starting point of approximately 1,300 for the S&P 500 at thetime Mr. Tully wrote his article, the dividend yield on the S&P 500 wouldrise from 1.2% to 3.0% if his dire prediction came true, and the forward rateof return on stocks would be 9%, not 7.2%. Despite our quarrel with hismath, Mr. Tully was not all wrong. From the 1,300 level of the S&P 500when he wrote his article, it did decline 40% to 776.76 last year beforerebounding to its current level. We wonder whether he was tempted to goback into the market at that time, or did he stay out waiting for the 500bottom he had predicted?
Stock markets can be sloppy, even scary, especially when confrontedwith issues like war, terrorism, corporate scandals, and an assortment ofother negative factors. They can also be quite resilient as has been shown oflate. And even if Mr. Buffett and Dr. Siegel prove to be on the mark withtheir predictions of 9% stock returns going forward, we will not get therealong an entirely smooth path. Does anyone remember the passbook savingsaccount? Well, the stock market is not such an animal. Stocks will fluctuateabove and below their long-term rate of compounding. Such is the nature ofthe beast. However, if you can tolerate the volatility, we believe stocks stillbeat the alternative.
The traditional alternative to owning stocks is bonds. Unfortunately,the current yield on 10-year Treasuries is a scant 4%. The yield on 1-yearTreasuries is a penurious 1.7%. While there is little market risk in 1-yearTreasuries, the same cannot be said for 10 year notes. With interest rates attheir lowest level in decades, we are doubtful there is much upside marketpotential. Should interest rates rise, the possibility of market loss is quitereal. If interest rates stay the same for the next ten years and you are in a40% tax bracket, your after-tax yield is 2.4%, which is slightly above the
7
59509_Tweedy AR 3 5/21/03 11:30 AM Page 7

current rate of inflation. If you are able to reinvest your interest income at thesame rate, a $10,000 investment in 10-year Treasuries will grow to$12,676.50 in 10 years. If the same $10,000 is invested in stocks and theyachieve a 9% rate of return composed of a 2% dividend yield and 7%appreciation, it would grow to $19,306.90, assuming dividend taxes at a 40%rate and annual capital gains taxes at a 20% rate on the balance of your gain.If inflation holds at 2% over the ten-year period, you will need $12,189.94 tomaintain the purchasing power of your original $10,000. Invested inTreasuries, your capital would have grown 4% in current year dollars. Instocks, you would see your current purchasing power rise 70.6% in ten years.Having 70% more real money than 4% more real money after ten years seemslike an easy choice to us.
The difference in return from bonds versus stocks is the investor’scompensation for taking the extra risk inherent in stocks, a risk that is madeall too apparent by what has happened in the past three years. If you hadinvested in an S&P 500 or MSCI EAFE index fund on April 1, 2000, youwould have seen your investment decline 40.9% or 47.9%, respectively, byMarch 31, 2003. If in the next seven years you achieve the theoretical ratesof return described above, you will almost be whole for the ten years endingMarch 31, 2010. If you experienced the last three years of the NASDAQComposite index, which lost 70.4% as of March 31, 2003, it will takeseventeen years of compounding at the above rates to get even. For the tenyears ended March 31, 2000, the NASDAQ Composite had compounded ata brisk 26.5% per annum. Roll forward three years and the ten-year rate ofcompounding drops to an unappealing 6.8%. Over the last three years, theMSCI EAFE in US$ has declined 47.9%, and MSCI EAFE Hedged hasdropped 49.0%. For the ten years ended March 31, 2000, EAFE in US$compounded at 9.38%. (We do not have data for EAFE Hedged for the tenyears ended March 31, 2000.) As of March 31, 2003, EAFE in US$ andEAFE Hedged have ten-year compounded rates of return of 2.0% and 3.3%,respectively. What is clearly illustrated is the effect of bubbles, and how andwhen you invest can have a significant impact on your results.
Fortunately, stock market bubbles do not occur very often. As we noted,it has been thirty years between the last two. With a little luck, we hope tobe around for the next one. In the meantime, the most recent bubble is nowhistory. Our wounds are more surface than crippling. We avoided the worstof the bursting of the bubble by resisting the temptation of investing in stocksthat were soaring for reasons we could not comprehend. In today’s morerational stock market where the worst of the excesses of the past few yearshave been removed and stock valuations are more grounded in fundamentals,we can move on. Our approach is no different today than it was six years agowhen all this silliness began. We find it difficult to argue with Mr. Buffett andDr. Siegel, both of whom predict that stock returns will revert back to more
8
59509_Tweedy AR 3 5/21/03 11:30 AM Page 8

normal levels. If stocks, as measured by a broad index, provide returns in thefuture of 8% to 9% as compared to longer term returns of 10%, it is becausethe current starting point as regards stock prices-to-underlying-values maynot be as low as in previous cycles. However, we do not believe they areexcessively high either. While some unforeseen problem could drive thestock market down in the short run, we think such a reaction will betemporary. The more important question is how to gain an edge in a stockmarket that is likely to offer lower returns than the high mid-teens weenjoyed through much of the 1990s.
The Buffett/Siegel scenario assumes a constant price/earnings ratio forstocks as measured by a broad stock market index. We agree, as long as thereis not a significant increase in interest rates. If interest rates were to increase,we presume price/earnings ratios would decrease. From current levels, webelieve there is little chance for an expansion of the current price/earningsratio of the broad indexes. This was not the case in the mid-1970s and theearly 1980s when the price/earnings ratio of the S&P 500 was measured insingle digits. The great bull market of the 1980s and the 1990s was in largemeasure fueled by an expansion in the price/earnings ratio. Going forward,the return on stocks should reflect the increase in earnings plus dividends,which supports the case for expected returns in the 8% to 9% range. If aninvestor can buy stocks that will grow faster than the overall rate of growthof GDP, that investor should be able to achieve a rate of return above thepopular indices if price/earnings ratios remain constant. This statement maysound like a case for growth stock investing as opposed to value investing.However, nowhere is it written that value cannot be found in companies thathave the potential to grow. The difference between value and growth relatesto the premium one is willing to pay for better growth prospects. As Mr.Buffett has said about value and growth, “the two approaches are joined atthe hip.” The difference between value investors and growth investors ismore a function of price.
Growth in the eyes of value investors like us does not include new,cutting edge technology companies with little or no history of growth, andprospects based on unproven business models and projections. We believe thecase cited above, Juniper Networks, illustrates that point quite well.Moreover, the value placed on Juniper Networks at its peak provided nomargin of safety if it failed to meet the most optimistic projections. We dobelieve there are companies that can sustain growth rates greater than theaverage company for which one does not have to pay an absurd premium.These companies are in such diverse sectors as pharmaceuticals, consumerproducts, finance and media among others. They are in businesses with sounddemographic trends which permit growth, or they have a strong positionwithin their respective industries which accords them an advantage overtheir competitors.
9
59509_Tweedy AR 3 5/21/03 11:30 AM Page 9
We also hold companies that are simply cheap based on assets ornormalized earnings. Many of these are not in a position to grow at a ratefaster than the average stock in an index, but are, by our estimates, worthmore in private hands or to a competitor than their current stock marketvalue. For a variety of reasons, the prices of these non-growers, as we like tocall them, can be driven down to unrealistically low levels. Although wewould not recommend them as “buy and hold” stocks, from time to timetheir valuations can be compelling from a value point of view. The risk insuch companies is less in the valuation, and more in the time it may take thestock market to realize their greater value. These companies tend to be inmore mature and more competitive industries with growth prospects equalto or less than the overall economy.
By employing both strategies, we hope to create a portfolio of stockswhich do not reflect the general characteristics of the broader stock marketindices. We subscribe to the statement made by Robert Kirby, formerchairman of the Capital Guardian Group, a major investment managementfirm, that “If you are going to look like the market, you can’t beat themarket.”
Following is a description of the ten largest holdings in each Fund. Wehave not chosen the stocks we discuss because they illustrate any desiredpoint of view, or for the purpose of putting on a favorable face to our work.They are simply our largest holdings. In the case of the Global Value Fund,these ten largest holdings account for 27.45% of net assets, and for theAmerican Value Fund, they represent 40.52% of net assets.
Global Value Fund’s Ten Largest Holdings
Nestle SA: Based in Switzerland, Nestle is one of the largest global foodcompanies in the world. It has leading market positions in coffee, chocolate,mineral water and pet food. It owns a majority position in Alcon, a publiclyquoted pharmaceutical company specializing in eye medications, as well asa 25% stake in the French cosmetics company, L’Oreal. Organic sales growthhas been in the range of 6% per annum with operating profit marginsexpanding at approximately 50 basis points per annum. With strong cashgeneration, we believe that Nestle should be able to continue 10% growthin earnings per share. As of March 31, 2003, the shares traded at a belowmarket multiple of 12.5X estimated earnings for 2003.
Panamerican Beverages Inc.: This Miami-based owner of Coca-Colabottling businesses in Mexico, Venezuela, Colombia and Brazil is beingacquired by another Coca-Cola bottler, Coca-Cola Femsa, for a cash priceof $22.00 per share. The total acquisition price, including the assumption ofPanamerican Beverage’s interest-bearing debt, was 8X EBITDA (earningsbefore interest, taxes, depreciation and amortization), which was at the low
10
59509_Tweedy AR 3 5/21/03 11:30 AM Page 10

end of our estimated valuation range. We had estimated a value from 8X to10X EBITDA.
Merck KGaA: Based in Germany, Merck is one of the largest genericpharmaceutical manufacturers in Europe. It also has an ethicalpharmaceutical business with a promising pipeline of cancer drugs.Additionally, Merck is one of the largest global suppliers of liquid crystaldisplay chemicals for which it has patent protection for a number ofproducts. As of March 31, 2003, the price/earnings ratio for Merck stood at10X estimated earnings for 2003.
Kone Corporation: Kone, based in Finland, is the third largest elevatorcompany in the world, and one of the most innovative. Much of theattraction of the elevator business derives from the on going nature ofservice and maintenance revenues from the installed base. The market capof Kone is Euro 1.8 billion as of March 31, 2003, and the P/E is 7.2Xestimated earnings for 2003.
Pharmacia Inc.: Pharmacia, a New Jersey-based global pharmaceuticalbusiness, was in the process of being acquired by Pfizer Inc. as of the March31, 2003 close of the Fund’s fiscal year. The Fund has subsequently receivedPfizer Inc. shares in exchange for its shares of Pharmacia. Pfizer, the world’slargest pharmaceutical business, appears to have above average revenue andearnings growth prospects. Pfizer is selling at 17.5X estimated earnings for2003. In merger and acquisition transactions, pharmaceutical businesseshave typically been acquired at price-to-earnings ratios in excess of 20X.
Unilever: Unilever, based in The Netherlands, is a large worldwideconsumer products company with strong positions in ice cream, tea anddetergents. The company is in the midst of a major restructuring aimed atfocusing on a core number of leading brands in order to increase profitmargins. EPS growth is estimated to be in double digits and sales growth inthe range of 6% to 7%. The stock was trading at 12X estimated earnings for2003 as of March 31, 2003.
Novartis AG: Novartis is one of the largest and fastest growingpharmaceutical companies in the world. It is the product of the merger oftwo Swiss pharmaceutical companies, Ciba Geigy and Sandoz. Ciba Geigywas one of the first stocks purchased by the Global Value Fund. Thecompany has a diversified portfolio of drugs with concentrations incardiovascular and cancer therapies. In our opinion, its patent profile isamong the best in the industry. While not cheap at 21X estimated earningsfor 2003, Novartis shares hold value for their EPS growth potential.
11
59509_Tweedy AR 3 5/21/03 11:30 AM Page 11

CNP Assurances: CNP is the largest life insurance company in France.The company follows highly conservative accounting policies by expensingrather than capitalizing its policy acquisition costs. The company’s assetsand liabilities are well matched and its securities portfolio is conservativelymanaged. An innovative company in a mundane industry, as of March 31,2003 the shares were trading at book value and 8X estimated earnings for2003.
Trinity Mirror PLC: This company publishes the Daily Mirror and theSunday Mirror in London, and is one of the largest publishers of regionalnewspapers in the UK. While the regional newspapers are doing well, theLondon papers have been affected by an advertising slowdown of late. Thestock trades at 10X estimated earnings for 2003.
ABN AMRO Holding NV: A major worldwide bank, ABN AMRO is thelargest retail and investment bank in its home country of The Netherlands.It also has significant market positions in the US and Brazil. The companyhas been reducing costs to increase profits and sells at 8X estimated earningsfor 2003.
American Value Fund’s Ten Largest Holdings
Transatlantic Holdings Inc.: Transatlantic is a global reinsurance business,headquartered in New York City, which is managed and controlled by its60% shareholder, American International Group. Transatlantic is one of thelowest cost operators in the reinsurance industry, and its low-costcompetitive advantage and the insurance underwriting skills of itsmanagement have enabled the company to generate above-average growthin intrinsic value. Over the last 12 years, book value per share and sales pershare have increased at compounded annual rates of 13.8% and 14.2%,respectively. The stock price is 12.5X estimated earnings for 2003. In mergerand acquisition transactions, insurance and reinsurance businesses havebeen acquired at 15X – 17X earnings.
MBIA Inc.: MBIA provides financial guarantee insurance, which protectsowners of municipal bonds, asset backed securities, utility bonds, corporateloans and other types of financial instruments against loss of principal andinterest on those MBIA–insured obligations. The company’s revenue,earnings and return on equity have been very stable in the past, and earningsper share have increased at approximately a 12% compounded annual rateover the last 12 years. MBIA’s stock is selling at 8.7X estimated earnings for2003, and about 1X book value. If MBIA were acquired, our best guess isthat the valuation would be around 15X – 20X earnings. The company hasrecently been buying back its own stock.
12
59509_Tweedy AR 3 5/21/03 11:30 AM Page 12

Pharmacia Inc.: See description on page 11.
Panamerican Beverages Inc.: See description on page 10.
Torchmark Corp.: Torchmark is a steady-earning life and health insurancebusiness. The company has lower operating costs than most of itscompetitors and its average return on equity over the last 9 years, 17.5%, hasbeen above average. Torchmark’s management seems very shareholderoriented. They are averse to acquiring other companies when, as analternative, they can repurchase their own company’s stock at much cheaperprices in relation to earnings, book value and growth prospects.Consequently, the company has used some of its cash to take advantage ofthe low valuation of its own shares, and shares outstanding have declinedalmost 15% over the last four years. The stock price is 9.3X estimatedearnings for 2003. Similar life insurance businesses have sold at 17X earningsin acquisition transactions.
Popular Inc.: Popular is the largest bank in Puerto Rico. Earnings havegrown steadily over the last 12 years at about an 11% compounded annualrate. Various officers and directors have continued to buy Popular’s stock.Since the beginning of June 2002, insiders have bought more that 200,000shares at prices ranging from 10% less to 6% more than the price on March31, 2003. The stock is priced at 11.1X estimated earnings for 2003. In thepast, banks have often been valued at 15X – 20X earnings in acquisitiontransactions.
American Express: This global credit card and investment managementbusiness is selling at 14.8X estimated earnings for 2003.
Federated Investors Inc.: Federated is an investment management businesswhich manages equity, bond and money market mutual funds. Thecompany’s large, steady and growing fee revenues and earnings frommanaging bond and money market mutual funds have allowed the companyto increase earnings and intrinsic value during the recent bear market forequities. Federated’s stock is selling at 13.9X estimated earnings for 2003.The company has been repurchasing its own shares at recent price levels.Investment managers similar to Federated Investors have often sold foraround 17X earnings in acquisition transactions.
Freddie Mac: Freddie Mac, and its primary competitor, Fannie Mae, aregovernment sponsored enterprises which were established by Congress.Freddie Mac essentially purchases home mortgages from banks and othermortgage originators and owners with money funded by the sale of debtsecurities. Because Freddie Mac’s debt is thought to be implicitly guaranteedby the US government, the company can borrow money through the debt
13
59509_Tweedy AR 3 5/21/03 11:30 AM Page 13

markets at much lower interest rates than its competitors--the banks,savings and loans and other financial enterprises--that originate and ownmortgages. This low-interest rate cost advantage has enabled Freddie Macto increase its business and earnings at a rate in excess of the overall growthrate for mortgages in the US. Freddie Mac’s earnings per share have grownat a 20% compounded annual rate over the last 12 years. Freddie Mac’s andFannie Mae’s combined mortgage holdings, $1.8 trillion, account for 19%of the US residential mortgage market, which totals more than $7 trillion.Management of Freddie Mac expects earnings to increase at a rate in excessof the 7% to 9% expected rate of growth in the overall residential mortgagemarket over the next ten years. Freddie Mac’s stock is 9.2X estimatedearnings for 2003. In March 2003, the CEO of Freddie Mac added to histotal holdings of Freddie Mac stock by exercising a stock option andpurchasing 25,048 shares, which he has not sold.
Rayonier Inc.: Rayonier owns timberland and produces various woodproducts, including logs and fiberboard. Using information provided invarious Rayonier public documents, including prior-year annual reports andthe company’s website, and other information, we have calculated that theestimated market value of the company’s timberland assets exceeds thestated carrying value on its balance sheet by about $42 to $48 per share.Rayonier’s adjusted book value, adjusted to reflect timberland assets atestimated market value, is $68 to $74 per share. The stock price on March 31, 2003 was $44.06.
Both Funds are diversified over a number of issues well beyond theirrespective ten largest holdings, and over the entire range of market caps.The Global Value Fund is invested in 189 issues in twenty-three countries.Approximately 32% of the portfolio is comprised of stocks with market capsless than $1 billion, more than half of which is in stocks with market capsbelow $500 million. Nearly 32% of assets are in stocks with market capsranging from $1 billion to $5 billion, our so-called mid-cap range. Anadditional 37% of assets is invested in stocks with market caps above $5billion. Our definition of large and mid-cap stocks probably is smaller thanmost advisors. For some, mid-cap ranges from $5 billion to $15 billion withstocks larger than that considered large cap. Stocks with market caps below$500 million are considered micro-caps by many managers.
The portfolio of the American Value Fund is more concentrated thanthe Global Value Fund. Its portfolio is comprised of 75 issues, of which 11are listed on a non-US stock exchange and represent 6.5% of the portfolio.The American Value Fund also has a larger concentration in stocks withmarket caps above $5 billion representing approximately 47% of net assets.The balance is invested in stocks with market caps below $5 billion, andalmost 22% is invested in stocks with market caps below $1 billion.
14
59509_Tweedy AR 3 5/21/03 11:30 AM Page 14

We have always been market cap agnostic. We search for valuewherever we can find it and do not eliminate an investment opportunity justbecause it is a large or small cap stock. The origin of Tweedy, Browne, whichdates back to 1920, has its roots in smaller cap stocks. We have no difficultyresearching and analyzing companies that are not covered extensively by thebrokerage community. Nor do we have any difficulty arriving at investmentconclusions that are not shared by the broader investment community. If weare either incapable or fearful of arriving at a conclusion that is not sharedby others, we have little chance of doing better than others. The tendencyto arrive at our own investment conclusions, irrespective of the popularconsensus, enables us to make decisions based on investment principlesrather than emotion.
Throughout the turmoil of the past three years, we adhered to the sameinvestment principles we have followed through good times and bad. Wehad relatively little turnover in our holdings despite a crashing market,terrorist threats and war. The portfolio turnover rates for the Global ValueFund and the American Value Fund for the past three years are set forth inthe table below with comparisons to fund categories in the MorningstarDatabase that we consider relevant to our Funds’:
Portfolio Turnover(6)
For Years Ending March 312003 2002 2001
Tweedy, Browne Global Value Fund 8% 7% 12% Morningstar: Foreign Stock Category 88 87 87 Tweedy, Browne AmericanValue Fund 8 6 10Morningstar: Mid-Cap Value Category 85 98 113 Morningstar: Domestic Stock Fund
Category 102 107 113
One could say that we should have traded stocks more aggressively inlight of the decline in global stock markets over the past three years. Or onecould say, if you have invested soundly, there is no need to shuffle yourholdings through market fluctuations. We will let our co-investors decide.
It is not obvious to us that aggressively trading a fund’s portfolio duringperiods of political and economic instability provides any benefit to theinvestor. Fortunately, in our experience, most of the effect of political andeconomic instability is transient in nature. Sound investment principlesanticipate such events and help one avoid knee-jerk reactions tocircumstances over which one has little or no control. Conviction born oflong-term experience cannot insulate an investor from short-term market
15
59509_Tweedy AR 3 5/21/03 11:30 AM Page 15

16
swings arising from excessive greed or fear. However, it can insure that youare still in the game after the crowd has quieted down.
We are pleased to note that the first annual “Winners of Standard &Poor’s/BusinessWeek Excellence in Fund Management Award” published inthe March 24th issue of BusinessWeek magazine cited the Global Value Fundas the winner in the World Fund category among ten different categories.To quote the article:
As the bear market grinds on, you’re probably wary ofmutual funds. With good reason: The speculativebubble and its aftermath ruined thousands ofprofessional money managers—and the investorswho trusted them. But not all funds are in the tank.The past five years—with wildly bullish and horriblybearish times—provided a rare opportunity to testmanagers’ skills. So we teamed up with S&P’s GlobalFund Research team to identify those who navigatedthe markets with distinction.
We hope we can live up to their assessment and provide our shareholderswith positive returns in the future.
Sincerely,TWEEDY, BROWNE COMPANY LLC
Christopher H. BrowneWilliam H. BrowneJohn D. SpearsThomas H. ShragerRobert Q. Wyckoff, Jr.Managing Directors
April 28, 2003
59509_Tweedy AR 3 5/21/03 11:30 AM Page 16
17
Footnotes
(1) Indexes are unmanaged, and the figures for the indexes shown includereinvestment of dividends and capital gains distributions and do notreflect any fees or expenses. Investors cannot invest directly in an index.We strongly recommend that these factors be considered before aninvestment decision is made.
(2) MSCI EAFE US$ is an unmanaged capitalization-weighted index ofcompanies representing the stock markets of Europe, Australasia andthe Far East. MSCI EAFE Hedged consists of the results of the MSCIEAFE Index hedged 100% back into US dollars and accounts forinterest rate differentials in forward currency exchange rates. Results forboth indexes are inclusive of dividends and net of foreign withholdingtaxes.
(3) Inception dates for the Global Value Fund and the American ValueFund were June 15, 1993 and December 8, 1993, respectively. Except forthe S&P 500 Index, information with respect to all other indexes andaverages used is available at month end only; therefore the closestmonth end to each Fund’s inception date, May 31, 1993 and November30, 1993, respectively, were used.
(4) S&P 500 is an unmanaged capitalization-weighted index composed of500 widely held common stocks listed on the New York StockExchange, American Stock Exchange and over-the-counter market andincludes the reinvestment of dividends.
(5) NASDAQ Composite Index is an unmanaged capitalization-weightedindex composed of all NASDAQ domestic and non-US based commonstocks listed on the NASDAQ Stock Market.
(6) The turnover ratio is a measure of a fund’s trading activity which iscomputed by taking the lesser of purchases or sales (excluding allsecurities with maturities of less than one year) and dividing by theaverage monthly value of the long-term securities in the portfolio.Morningstar does not calculate turnover ratios. The figures are culled byMorningstar directly from the financial highlights of the funds’ annualreport. The turnover ratios for the categories ending March 31st consistof the average turnover for each fund in the category from the fund’slatest annual report received by Morningstar, and consist of differentone-year periods due to the varying fiscal year ends of the funds in eachcategory. The Morningstar Foreign Stock Fund Category consists of allmutual funds in the Morningstar Universe that have 90% or more oftheir assets invested in non-U.S. stocks. The Morningstar Domestic
59509_Tweedy AR 3 5/21/03 11:30 AM Page 17

18
Stock Fund Category consists of all mutual funds in the MorningstarUniverse that have over 70% of their assets invested in domestic stocks.With respect to the Morningstar Mid-Cap Value Fund Category,Morningstar further assigns its domestic stock funds to an investmentstyle category based on the market capitalization and growth and valuecharacteristics of the underlying securities in each fund’s portfolio.Morningstar defines large cap stocks as the group that accounts for thetop 70% of the capitalization of the Morningstar domestic stockuniverse; mid-cap stocks represent the next 20%; and small-cap stocksrepresent the balance. Assignments for the funds are recalculatedwhenever Morningstar receives updated portfolio holdings for eachfund.
© 2003 Morningstar, Inc. All Rights Reserved. The informationcontained herein: (1) is proprietary to Morningstar and/or its contentproviders; (2) may not be copied or distributed; and (3) is not warrantedto be accurate, complete or timely. Neither Morningstar nor its contentproviders are responsible for any damages or losses arising from any useof this information.
59509_Tweedy AR 3 5/21/03 11:30 AM Page 18

19
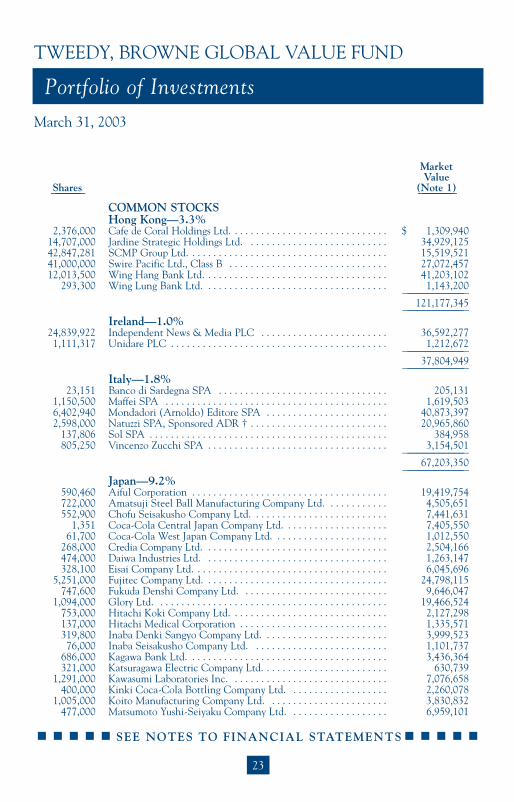
TWEEDY, BROWNE GLOBAL VALUE FUND
Portfolio HighlightsMarch 31, 2003
Hypothetical Illustration of $10,000 Invested inTweedy, Browne Global Value Fund vs. Morgan Stanley Capital
International (“MSCI”) Europe, Australasia and Far East (“EAFE”) Index (in US Dollars and Hedged)
________________________________________________________________________________________________________________________________________________________________________________________________________________
MSCI EAFE Index represents the change in market capitalizations of Europe, Australasia and the Far East(EAFE), including dividends reinvested monthly, net after foreign withholding taxes.
Index and Average information is available at month end only; therefore, the closest month end to inceptiondate of the Fund, May 31, 1993, has been used.
$5,000
$10,000
$15,000
$20,000
$25,000
$30,000
$23,565
$12,929
$10,856
Tweedy, Browne Global Value Fund*Index: MSCI EAFE Index (in US Dollars)*Index: MSCI EAFE Index (Hedged)*
$35,000
Jun 1993
Sep 1993
Mar 1994
Sep 1994
Mar 1995
Sep 1995
Mar 1996
Sep 1996
Mar 1997
Sep 1997
Mar 1998
Sep 1998
Mar 1999
Sep 1999
Mar 2001
Sep 2001
Sep 2002
Mar 2002
Mar 2003
Sep 2000
Mar 2000
AVERAGE ANNUAL TOTAL RETURN* AGGREGATE TOTAL RETURN*Year Inception
Without Ended (6/15/93)–The Fund Actual Waivers 3/31/03 3/31/03———————— —————— ————————— ———————— ————————Inception (6/15/93)
through 3/31/03 9.15% 8.51% The Fund (24.86)% 135.65%Year Ended 3/31/03 (24.86)% (24.86)% MSCI EAFE (in
US Dollar) (23.59)% 8.56%MSCI EAFE (Hedged) (35.71)% 40.35%
________________________________________________________________________________________________________________________________________________________________________________________________________________
Note: The performance shown represents past performance and is not a guarantee of future results. TheFund’s share price and investment return will vary with market conditions, and the principal value of shares, when redeemed, may be more or less than original cost.
* Assumes the reinvestment of all dividends and distributions and is net of foreign withholding tax.
59509_Tweedy AR 3 5/21/03 11:30 AM Page 19

20
TWEEDY, BROWNE GLOBAL VALUE FUND
Perspective On Assessing Investment Results
March 31, 2003
In accordance with rules and guidelines set out by the Securities andExchange Commission, we have provided a comparison of the historicalinvestment results of Tweedy, Browne Global Value Fund to the historicalinvestment results of the most appropriate broad-based securities indices, theMorgan Stanley Capital International (MSCI) Europe, Australasia and theFar East (EAFE) Index in US dollars and hedged into US dollars.
However, the historical results of the MSCI EAFE indices in largemeasure represent the investment results of stocks that we do not own. Anyportfolio which does not own exactly the same stocks in exactly the sameproportions as the index to which the particular portfolio is being compared isnot likely to have the same results as the index. The investment behavior of adiversified portfolio of undervalued stocks tends to be correlated to theinvestment behavior of a broad index; i.e., when the index is up, probablymore than one-half of the stocks in the entire universe of public companies inall the countries that are included in the same index will be up, albeit, ingreater or lesser percentages than the index. Similarly, when the indexdeclines, probably more than one-half of the stocks in the entire universe ofpublic companies in all countries that are included in the index will be downin greater or lesser percentages than the index. But it is almost a mathematicaltruth that “different stocks equal different results.”
Favorable or unfavorable historical investment results in comparison toan index are not necessarily predictive of future comparative investmentresults. In Are Short-Term Performance and Value Investing Mutually Exclusive?, Eugene Shahan analyzed the investment performance of sevenmoney managers, about whom Warren Buffett wrote in his article, The Super-investors of Graham and Doddsville. Over long periods of time, the seven managers significantly outperformed the market as measured by the Dow Jones Industrial Average (the “DJIA”) or the Standard & Poor’s 500 StockIndex (the “S&P 500”) by between 7.7% and 16.5% annually. (The goal ofmost institutional money managers is to outperform the market by 2% to 3%.) However, for periods ranging from 13 years to 28 years, this group ofmanagers underperformed the market between 7.7% and 42% of the years. Six of the seven investment managers underperformed the market between28% and 42% of the years. In today’s environment, they would have lost manyof their clients during their periods of underperformance. Longer term, it
59509_Tweedy AR 3 5/21/03 11:30 AM Page 20

21
TWEEDY, BROWNE GLOBAL VALUE FUND
Perspective On Assessing Investment Results
would have been the wrong decision to fire any of those money managers. In examining the seven long-term investment records, unfavorableinvestment results as compared to either index did not predict the future favorable comparative investment results which occurred, and favorable investment results in comparison to the DJIA or the S&P 500 werenot always followed by future favorable comparative results. Stretches of consecutive annual underperformance ranged from one to six years. Mr. Shahan concluded:
Unfortunately, there is no way to distinguish between a poor three-year stretchfor a manager who will do well over 15 years, from a poor three-year stretch for a manager who will continue to do poorly. Nor is there any reason to believethat a manager who does well from the outset cannot continue to do well, and consistently.
59509_Tweedy AR 3 5/21/03 11:30 AM Page 21

22
SEE NOTES TO FINANCIAL STATEMENTS
March 31, 2003
COMMON STOCKS—91.2%Belgium—1.5%
1,219,490 Almanij NV . . . . . . . . . . . . . . . . . . . . . . . . . . . . . . . . . . . . . . . . . $ 38,138,172287,669 Colruyt NV . . . . . . . . . . . . . . . . . . . . . . . . . . . . . . . . . . . . . . . . . . 17,390,348
————————————55,528,520
————————————Canada—1.4%
72,400 Canadian Western Bank . . . . . . . . . . . . . . . . . . . . . . . . . . . . . . . . 1,353,556260,700 Melcor Developments Ltd. . . . . . . . . . . . . . . . . . . . . . . . . . . . . . . 6,712,723
2,073,000 National Bank of Canada, Toronto . . . . . . . . . . . . . . . . . . . . . . . 45,619,135————————————
53,685,414————————————
Czech Republic—0.0%††2,800 Philip Morris CR AS . . . . . . . . . . . . . . . . . . . . . . . . . . . . . . . . . . 1,148,670
————————————Denmark—0.7%
1,500,000 Danske Bank A/S . . . . . . . . . . . . . . . . . . . . . . . . . . . . . . . . . . . . . 25,016,237————————————
Finland—4.0%3,085,650 Huhtamaki Oyj . . . . . . . . . . . . . . . . . . . . . . . . . . . . . . . . . . . . . . . 26,970,2281,963,000 Kesko Oyj, B Shares . . . . . . . . . . . . . . . . . . . . . . . . . . . . . . . . . . . 23,005,4123,194,942 Kone Oyj, B Shares . . . . . . . . . . . . . . . . . . . . . . . . . . . . . . . . . . . . 97,617,224
————————————147,592,864
————————————France—3.9%
174,706 Aventis SA . . . . . . . . . . . . . . . . . . . . . . . . . . . . . . . . . . . . . . . . . . 7,669,434433,783 BNP Paribas SA . . . . . . . . . . . . . . . . . . . . . . . . . . . . . . . . . . . . . . 17,371,768
2,138,040 CNP Assurances . . . . . . . . . . . . . . . . . . . . . . . . . . . . . . . . . . . . . . 77,643,40737,278 Compagnie Lebon SA . . . . . . . . . . . . . . . . . . . . . . . . . . . . . . . . . 2,074,571
1,500,813 Nexans SA . . . . . . . . . . . . . . . . . . . . . . . . . . . . . . . . . . . . . . . . . . 17,441,4124,614,300 Rhodia SA . . . . . . . . . . . . . . . . . . . . . . . . . . . . . . . . . . . . . . . . . . . 25,024,629
————————————147,225,221
————————————Germany—6.6%
2,104,179 Bayer AG . . . . . . . . . . . . . . . . . . . . . . . . . . . . . . . . . . . . . . . . . . . 28,678,1121,435,000 Bayerische Hypo-Und Vereinsbank AG . . . . . . . . . . . . . . . . . . . 10,773,226
375,657 Boewe Systec AG . . . . . . . . . . . . . . . . . . . . . . . . . . . . . . . . . . . . . 8,608,27762,263 Krones AG . . . . . . . . . . . . . . . . . . . . . . . . . . . . . . . . . . . . . . . . . . 2,765,22142,354 KSB AG . . . . . . . . . . . . . . . . . . . . . . . . . . . . . . . . . . . . . . . . . . . . 3,142,743
104,581 KSB AG, Vorzugsakt . . . . . . . . . . . . . . . . . . . . . . . . . . . . . . . . . . . 7,645,978108,159 Linde AG . . . . . . . . . . . . . . . . . . . . . . . . . . . . . . . . . . . . . . . . . . . 3,440,382
4,721,200 Merck KGaA . . . . . . . . . . . . . . . . . . . . . . . . . . . . . . . . . . . . . . . . . 113,081,709538,544 Moebel Walther AG . . . . . . . . . . . . . . . . . . . . . . . . . . . . . . . . . . . 4,113,625136,187 Moebel Walther AG, Vorzugsakt . . . . . . . . . . . . . . . . . . . . . . . . . 549,848
1,398,285 Springer (Axel) Verlag AG . . . . . . . . . . . . . . . . . . . . . . . . . . . . . 65,228,480————————————
248,027,601————————————
Portfolio of Investments
TWEEDY, BROWNE GLOBAL VALUE FUND
MarketValue
Shares (Note 1)—————— ———————
59509_Tweedy AR 3 5/21/03 11:30 AM Page 22
23
SEE NOTES TO FINANCIAL STATEMENTS
MarketValue
Shares (Note 1)—————— ———————COMMON STOCKSHong Kong—3.3%
2,376,000 Cafe de Coral Holdings Ltd. . . . . . . . . . . . . . . . . . . . . . . . . . . . . . $ 1,309,94014,707,000 Jardine Strategic Holdings Ltd. . . . . . . . . . . . . . . . . . . . . . . . . . . 34,929,12542,847,281 SCMP Group Ltd. . . . . . . . . . . . . . . . . . . . . . . . . . . . . . . . . . . . . . 15,519,52141,000,000 Swire Pacific Ltd., Class B . . . . . . . . . . . . . . . . . . . . . . . . . . . . . . 27,072,45712,013,500 Wing Hang Bank Ltd. . . . . . . . . . . . . . . . . . . . . . . . . . . . . . . . . . . 41,203,102
293,300 Wing Lung Bank Ltd. . . . . . . . . . . . . . . . . . . . . . . . . . . . . . . . . . . 1,143,200————————————
121,177,345————————————
Ireland—1.0%24,839,922 Independent News & Media PLC . . . . . . . . . . . . . . . . . . . . . . . . 36,592,2771,111,317 Unidare PLC . . . . . . . . . . . . . . . . . . . . . . . . . . . . . . . . . . . . . . . . . 1,212,672
————————————37,804,949
————————————Italy—1.8%
23,151 Banco di Sardegna SPA . . . . . . . . . . . . . . . . . . . . . . . . . . . . . . . . 205,1311,150,500 Maffei SPA . . . . . . . . . . . . . . . . . . . . . . . . . . . . . . . . . . . . . . . . . . 1,619,5036,402,940 Mondadori (Arnoldo) Editore SPA . . . . . . . . . . . . . . . . . . . . . . . 40,873,3972,598,000 Natuzzi SPA, Sponsored ADR † . . . . . . . . . . . . . . . . . . . . . . . . . . 20,965,860
137,806 Sol SPA . . . . . . . . . . . . . . . . . . . . . . . . . . . . . . . . . . . . . . . . . . . . . 384,958805,250 Vincenzo Zucchi SPA . . . . . . . . . . . . . . . . . . . . . . . . . . . . . . . . . . 3,154,501
————————————67,203,350
————————————Japan—9.2%
590,460 Aiful Corporation . . . . . . . . . . . . . . . . . . . . . . . . . . . . . . . . . . . . . 19,419,754722,000 Amatsuji Steel Ball Manufacturing Company Ltd. . . . . . . . . . . . 4,505,651552,900 Chofu Seisakusho Company Ltd. . . . . . . . . . . . . . . . . . . . . . . . . . 7,441,631
1,351 Coca-Cola Central Japan Company Ltd. . . . . . . . . . . . . . . . . . . . 7,405,55061,700 Coca-Cola West Japan Company Ltd. . . . . . . . . . . . . . . . . . . . . . 1,012,550
268,000 Credia Company Ltd. . . . . . . . . . . . . . . . . . . . . . . . . . . . . . . . . . . 2,504,166474,000 Daiwa Industries Ltd. . . . . . . . . . . . . . . . . . . . . . . . . . . . . . . . . . . 1,263,147328,100 Eisai Company Ltd. . . . . . . . . . . . . . . . . . . . . . . . . . . . . . . . . . . . . 6,045,696
5,251,000 Fujitec Company Ltd. . . . . . . . . . . . . . . . . . . . . . . . . . . . . . . . . . . 24,798,115747,600 Fukuda Denshi Company Ltd. . . . . . . . . . . . . . . . . . . . . . . . . . . . 9,646,047
1,094,000 Glory Ltd. . . . . . . . . . . . . . . . . . . . . . . . . . . . . . . . . . . . . . . . . . . . 19,466,524753,000 Hitachi Koki Company Ltd. . . . . . . . . . . . . . . . . . . . . . . . . . . . . . 2,127,298137,000 Hitachi Medical Corporation . . . . . . . . . . . . . . . . . . . . . . . . . . . . 1,335,571319,800 Inaba Denki Sangyo Company Ltd. . . . . . . . . . . . . . . . . . . . . . . . 3,999,52376,000 Inaba Seisakusho Company Ltd. . . . . . . . . . . . . . . . . . . . . . . . . . 1,101,737
686,000 Kagawa Bank Ltd. . . . . . . . . . . . . . . . . . . . . . . . . . . . . . . . . . . . . . 3,436,364321,000 Katsuragawa Electric Company Ltd. . . . . . . . . . . . . . . . . . . . . . . . 630,739
1,291,000 Kawasumi Laboratories Inc. . . . . . . . . . . . . . . . . . . . . . . . . . . . . . 7,076,658400,000 Kinki Coca-Cola Bottling Company Ltd. . . . . . . . . . . . . . . . . . . 2,260,078
1,005,000 Koito Manufacturing Company Ltd. . . . . . . . . . . . . . . . . . . . . . . 3,830,832477,000 Matsumoto Yushi-Seiyaku Company Ltd. . . . . . . . . . . . . . . . . . . 6,959,101
Portfolio of Investments
TWEEDY, BROWNE GLOBAL VALUE FUND
March 31, 2003
59509_Tweedy AR 3 5/21/03 11:30 AM Page 23

24
SEE NOTES TO FINANCIAL STATEMENTS
MarketValue
Shares (Note 1)—————— ———————COMMON STOCKSJapan—(Continued)
371,000 Meito Sangyo Company Ltd. . . . . . . . . . . . . . . . . . . . . . . . . . . . . $ 4,990,261249,600 Mirai Industry Company Ltd. . . . . . . . . . . . . . . . . . . . . . . . . . . . . 1,410,289124,000 Morito Company Ltd. . . . . . . . . . . . . . . . . . . . . . . . . . . . . . . . . . . 471,614374,000 Nankai Plywood Company Ltd. . . . . . . . . . . . . . . . . . . . . . . . . . . 763,265634,000 Nippon Broadcasting System Inc. . . . . . . . . . . . . . . . . . . . . . . . . 14,596,224
1,203,000 Nippon Cable System Inc. . . . . . . . . . . . . . . . . . . . . . . . . . . . . . . 10,753,75544,080 Nippon Kanzai Company Ltd. . . . . . . . . . . . . . . . . . . . . . . . . . . . 631,945
1,060,000 Nippon Konpo Unyu Soko Company Ltd. . . . . . . . . . . . . . . . . . 8,250,803746,000 Nissha Printing Company Ltd. . . . . . . . . . . . . . . . . . . . . . . . . . . . 5,183,877552,000 Nitto FC Company Ltd. . . . . . . . . . . . . . . . . . . . . . . . . . . . . . . . . 1,913,240867,000 Riken Vitamin Company Ltd. . . . . . . . . . . . . . . . . . . . . . . . . . . . 8,920,05538,000 Rock Paint Company Ltd. . . . . . . . . . . . . . . . . . . . . . . . . . . . . . . 237,140
451,000 Sangetsu Company Ltd. . . . . . . . . . . . . . . . . . . . . . . . . . . . . . . . . 8,367,348232,000 Sanko Sangyo Company Ltd. . . . . . . . . . . . . . . . . . . . . . . . . . . . . 749,334
1,483,200 Sanyo Shinpan Finance Company Ltd. . . . . . . . . . . . . . . . . . . . . 28,143,031213,000 Sasakura Engineering Company Ltd. . . . . . . . . . . . . . . . . . . . . . . 709,521760,600 Shikoku Coca-Cola Bottling Company Ltd. . . . . . . . . . . . . . . . . 6,427,065478,000 Shingakukai Company Ltd. . . . . . . . . . . . . . . . . . . . . . . . . . . . . . 1,429,002331,500 Shinki Company Ltd. . . . . . . . . . . . . . . . . . . . . . . . . . . . . . . . . . . 1,053,934
3,501,000 Shionogi & Company Ltd. . . . . . . . . . . . . . . . . . . . . . . . . . . . . . . 47,416,149448,000 SK Kaken Company Ltd. . . . . . . . . . . . . . . . . . . . . . . . . . . . . . . . 12,467,535712,000 Sonton Food Industry Company Ltd. . . . . . . . . . . . . . . . . . . . . . . 4,629,382369,000 Tachi-S Company Ltd. . . . . . . . . . . . . . . . . . . . . . . . . . . . . . . . . . 1,727,062484,070 Takefuji Corporation . . . . . . . . . . . . . . . . . . . . . . . . . . . . . . . . . . . 23,064,564269,000 TENMA Corporation . . . . . . . . . . . . . . . . . . . . . . . . . . . . . . . . . . 2,536,195156,000 Tochigi Bank Ltd. . . . . . . . . . . . . . . . . . . . . . . . . . . . . . . . . . . . . . 776,185236,000 Torii Company Ltd. . . . . . . . . . . . . . . . . . . . . . . . . . . . . . . . . . . . . 519,447
1,073,000 Torishima Pump Manufacturing Company Ltd. . . . . . . . . . . . . . . 4,243,86119,000 Toso Company Ltd. . . . . . . . . . . . . . . . . . . . . . . . . . . . . . . . . . . . . 32,286
111,000 Toyo Technical Company Ltd. . . . . . . . . . . . . . . . . . . . . . . . . . . . 416,554682,000 Tsubaki Nakashima Company Ltd. . . . . . . . . . . . . . . . . . . . . . . . . 4,083,48942,000 Zojirushi Corporation . . . . . . . . . . . . . . . . . . . . . . . . . . . . . . . . . . 108,028
————————————343,289,172
————————————Malaysia—0.3%
5,921,000 Star Publications (Malaysia) Berhad . . . . . . . . . . . . . . . . . . . . . . 9,271,015————————————
Mexico—4.6%9,467,000 Embotelladoras Arca SA † . . . . . . . . . . . . . . . . . . . . . . . . . . . . . . 14,407,637
28,097 Fomento Economico Mexicano, SA de CV, Sponsored ADR † . 934,78730,132,400 Grupo Continental SA † . . . . . . . . . . . . . . . . . . . . . . . . . . . . . . . . 39,864,3105,430,250 Panamerican Beverages Inc., Class A . . . . . . . . . . . . . . . . . . . . . . 117,727,820
————————————172,934,554
————————————
Portfolio of Investments
TWEEDY, BROWNE GLOBAL VALUE FUND
March 31, 2003
59509_Tweedy AR 3 5/21/03 11:30 AM Page 24
25
SEE NOTES TO FINANCIAL STATEMENTS
MarketValue
Shares (Note 1)—————— ———————COMMON STOCKSNetherlands—10.6%
5,310,524 ABN AMRO Holding NV . . . . . . . . . . . . . . . . . . . . . . . . . . . . . . $ 77,651,1011,780,000 Akzo Nobel NV . . . . . . . . . . . . . . . . . . . . . . . . . . . . . . . . . . . . . . 35,389,450
23,620 Crown Van Gelder Gemeenschappelijk Bezit NV . . . . . . . . . . . . 309,2901,484,600 Heineken Holding NV - A . . . . . . . . . . . . . . . . . . . . . . . . . . . . . . 42,119,9894,616,300 Holdingmaatschappij De Telegraaf NV . . . . . . . . . . . . . . . . . . . . 68,507,5401,357,432 IMTECH NV . . . . . . . . . . . . . . . . . . . . . . . . . . . . . . . . . . . . . . . . 19,404,1591,347,834 Koninklijke Grolsch NV . . . . . . . . . . . . . . . . . . . . . . . . . . . . . . . 25,591,226
896,555 Koninklijke Wessanen NV, CVA . . . . . . . . . . . . . . . . . . . . . . . . . 4,832,9174,017,888 Randstad Holding NV . . . . . . . . . . . . . . . . . . . . . . . . . . . . . . . . . 37,266,8082,032,224 Stork NV . . . . . . . . . . . . . . . . . . . . . . . . . . . . . . . . . . . . . . . . . . . . 12,595,788
706,587 Twentsche Kabel Holding NV . . . . . . . . . . . . . . . . . . . . . . . . . . . 4,741,832739,643 Unilever NV, CVA . . . . . . . . . . . . . . . . . . . . . . . . . . . . . . . . . . . . 44,027,330
4,498,159 Wegener NV . . . . . . . . . . . . . . . . . . . . . . . . . . . . . . . . . . . . . . . . . 17,670,252655,311 Wolters Kluwer NV, CVA . . . . . . . . . . . . . . . . . . . . . . . . . . . . . . 7,365,295
————————————397,472,977
————————————New Zealand—0.7%
25,000,596 Carter Holt Harvey Ltd. . . . . . . . . . . . . . . . . . . . . . . . . . . . . . . . . 24,660,574————————————
Norway—0.5%1,895,300 Schibsted ASA . . . . . . . . . . . . . . . . . . . . . . . . . . . . . . . . . . . . . . . 18,282,653
————————————Singapore—3.9%
4,624,625 Cycle & Carriage Ltd. . . . . . . . . . . . . . . . . . . . . . . . . . . . . . . . . . . 9,851,0557,453,900 Fraser & Neave Ltd. . . . . . . . . . . . . . . . . . . . . . . . . . . . . . . . . . . . 33,360,2304,210,800 Robinson & Company Ltd. . . . . . . . . . . . . . . . . . . . . . . . . . . . . . 12,762,5302,697,800 Singapore Press Holdings Ltd. . . . . . . . . . . . . . . . . . . . . . . . . . . . 27,204,963
10,378,088 United Overseas Bank Ltd. . . . . . . . . . . . . . . . . . . . . . . . . . . . . . . 60,558,200————————————
143,736,978————————————
South Africa—0.3%1,051,170 Sappi Ltd. . . . . . . . . . . . . . . . . . . . . . . . . . . . . . . . . . . . . . . . . . . . 12,286,576
————————————Spain—1.9%
2,475,000 Altadis SA . . . . . . . . . . . . . . . . . . . . . . . . . . . . . . . . . . . . . . . . . . . 60,334,23620,834 Banco de Andalucia SA . . . . . . . . . . . . . . . . . . . . . . . . . . . . . . . . 1,246,966
189,588 Indo Internacional SA †. . . . . . . . . . . . . . . . . . . . . . . . . . . . . . . . 587,5361,775,551 Recoletos Grupo de Comunicacion SA . . . . . . . . . . . . . . . . . . . . 8,815,562
————————————70,984,300
————————————Sweden—0.1%
35,600 BRIO AB, B Shares . . . . . . . . . . . . . . . . . . . . . . . . . . . . . . . . . . . 176,34333,000 Cloetta Fazer AB, B Shares . . . . . . . . . . . . . . . . . . . . . . . . . . . . . 720,019
262,800 SAS AB †. . . . . . . . . . . . . . . . . . . . . . . . . . . . . . . . . . . . . . . . . . . . 1,115,800380,398 VLT AB, B Shares . . . . . . . . . . . . . . . . . . . . . . . . . . . . . . . . . . . . . 3,140,470
————————————5,152,632
————————————
Portfolio of Investments
TWEEDY, BROWNE GLOBAL VALUE FUND
March 31, 2003
59509_Tweedy AR 3 5/21/03 11:30 AM Page 25
26
SEE NOTES TO FINANCIAL STATEMENTS
MarketValue
Shares (Note 1)—————— ———————
COMMON STOCKSSwitzerland—12.8%
24,608 Banque Cantonale Vaudoise, Bearer . . . . . . . . . . . . . . . . . . . . . . $ 1,092,5074,833 Bucher Industries AG, Bearer . . . . . . . . . . . . . . . . . . . . . . . . . . . . 425,560
3,260,600 Compagnie Financiere Richemont AG . . . . . . . . . . . . . . . . . . . . 44,513,3935,842 Daetwyler Holding AG, Bearer . . . . . . . . . . . . . . . . . . . . . . . . . . 7,175,736
93,220 Edipresse SA, Bearer . . . . . . . . . . . . . . . . . . . . . . . . . . . . . . . . . . . 25,556,07334,377 Forbo Holding AG . . . . . . . . . . . . . . . . . . . . . . . . . . . . . . . . . . . . 10,047,58919,506 Gurit-Heberlein AG, Bearer . . . . . . . . . . . . . . . . . . . . . . . . . . . . . 9,020,80028,536 Helvetia Patria Holding, Registered . . . . . . . . . . . . . . . . . . . . . . . 2,686,87629,327 Loeb Holding AG . . . . . . . . . . . . . . . . . . . . . . . . . . . . . . . . . . . . . 3,689,040
644,000 Nestle SA, Registered . . . . . . . . . . . . . . . . . . . . . . . . . . . . . . . . . . 127,469,5518 Neue Zuercher Zeitung † . . . . . . . . . . . . . . . . . . . . . . . . . . . . . . . . 384,769
2,321,385 Novartis AG, Registered . . . . . . . . . . . . . . . . . . . . . . . . . . . . . . . . 85,970,22449,390 Phoenix Mecano AG . . . . . . . . . . . . . . . . . . . . . . . . . . . . . . . . . . 6,395,491
155,033 PubliGroupe SA, Registered . . . . . . . . . . . . . . . . . . . . . . . . . . . . . 22,828,324185,872 Sarna Kunsstoff Holding AG, Registered . . . . . . . . . . . . . . . . . . . 15,266,299375,540 SIG Holding AG, Registered . . . . . . . . . . . . . . . . . . . . . . . . . . . . 33,206,332143,969 Sika AG, Bearer . . . . . . . . . . . . . . . . . . . . . . . . . . . . . . . . . . . . . . 38,989,429
2,896 Sulzer AG, Registered . . . . . . . . . . . . . . . . . . . . . . . . . . . . . . . . . . 355,180374,960 Syngenta AG . . . . . . . . . . . . . . . . . . . . . . . . . . . . . . . . . . . . . . . . 17,090,803471,045 Tamedia AG . . . . . . . . . . . . . . . . . . . . . . . . . . . . . . . . . . . . . . . . . 18,141,78218,192 Zehnder Group AG, Class B . . . . . . . . . . . . . . . . . . . . . . . . . . . . 9,153,479
————————————479,459,237
————————————United Kingdom—10.9%
4,885,418 AGA Foodservice Group PLC . . . . . . . . . . . . . . . . . . . . . . . . . . . 15,058,1842,006,739 Alumasc Group PLC . . . . . . . . . . . . . . . . . . . . . . . . . . . . . . . . . . . 3,647,750
992,166 Amersham PLC . . . . . . . . . . . . . . . . . . . . . . . . . . . . . . . . . . . . . . . 6,445,5867,503,152 BBA Group PLC . . . . . . . . . . . . . . . . . . . . . . . . . . . . . . . . . . . . . . 20,161,783
639,000 Burtonwood Brewery PLC . . . . . . . . . . . . . . . . . . . . . . . . . . . . . . 2,338,2353,979,658 Carclo PLC † . . . . . . . . . . . . . . . . . . . . . . . . . . . . . . . . . . . . . . . . . 1,320,9957,396,247 Diageo PLC . . . . . . . . . . . . . . . . . . . . . . . . . . . . . . . . . . . . . . . . . . 75,873,8933,102,000 Elementis PLC . . . . . . . . . . . . . . . . . . . . . . . . . . . . . . . . . . . . . . . 1,127,732
743,139 GlaxoSmithKline PLC, Sponsored ADR . . . . . . . . . . . . . . . . . . . 26,151,0611,098,479 Hardys & Hansons PLC . . . . . . . . . . . . . . . . . . . . . . . . . . . . . . . . 6,207,319
350,000 Johnston Group PLC . . . . . . . . . . . . . . . . . . . . . . . . . . . . . . . . . . 1,756,50013,999,124 Novar PLC . . . . . . . . . . . . . . . . . . . . . . . . . . . . . . . . . . . . . . . . . . 24,783,073
584,000 Partridge Fine Art PLC †. . . . . . . . . . . . . . . . . . . . . . . . . . . . . . . . 540,0148,454,945 Rolls-Royce PLC . . . . . . . . . . . . . . . . . . . . . . . . . . . . . . . . . . . . . . 9,455,261
779,500 Swan Hill Group PLC . . . . . . . . . . . . . . . . . . . . . . . . . . . . . . . . . 794,71623,145,557 Thistle Hotels PLC . . . . . . . . . . . . . . . . . . . . . . . . . . . . . . . . . . . . 42,438,68212,956,686 Trinity Mirror PLC . . . . . . . . . . . . . . . . . . . . . . . . . . . . . . . . . . . . 77,926,4448,635,167 TT Electronics PLC . . . . . . . . . . . . . . . . . . . . . . . . . . . . . . . . . . . 11,601,8155,025,000 Unilever PLC . . . . . . . . . . . . . . . . . . . . . . . . . . . . . . . . . . . . . . . . 46,544,6694,420,724 Weir Group PLC . . . . . . . . . . . . . . . . . . . . . . . . . . . . . . . . . . . . . . 13,940,314
Portfolio of Investments
TWEEDY, BROWNE GLOBAL VALUE FUND
March 31, 2003
59509_Tweedy AR 3 5/21/03 11:30 AM Page 26

27
SEE NOTES TO FINANCIAL STATEMENTS
MarketValue
Shares (Note 1)—————— ———————
COMMON STOCKSUnited Kingdom—(Continued)
1,917,457 Wolverhampton & Dudley Breweries PLC . . . . . . . . . . . . . . . . . $ 17,578,82737,500 Young & Company’s Brewery PLC, Class A . . . . . . . . . . . . . . . . 429,740
————————————406,122,593
————————————United States—11.2%
563,000 American Express Company . . . . . . . . . . . . . . . . . . . . . . . . . . . . . 18,708,49075,700 American National Insurance Company . . . . . . . . . . . . . . . . . . . 5,899,301
180,400 Freddie Mac . . . . . . . . . . . . . . . . . . . . . . . . . . . . . . . . . . . . . . . . . . 9,579,2406,728,996 Hollinger International Inc. . . . . . . . . . . . . . . . . . . . . . . . . . . . . . 53,159,0691,230,305 MBIA Inc. . . . . . . . . . . . . . . . . . . . . . . . . . . . . . . . . . . . . . . . . . . . 47,538,985
68,418 Monsanto Company . . . . . . . . . . . . . . . . . . . . . . . . . . . . . . . . . . . 1,122,0552,438,429 Pharmacia Corporation, Depository Shares . . . . . . . . . . . . . . . . . 105,583,976
460,000 PNC Financial Services Group Inc. . . . . . . . . . . . . . . . . . . . . . . . 19,494,800596,000 Popular Inc. . . . . . . . . . . . . . . . . . . . . . . . . . . . . . . . . . . . . . . . . . . 20,258,040
4,285,000 Schering-Plough Corporation . . . . . . . . . . . . . . . . . . . . . . . . . . . . 76,401,55074,100 Syms Corporation † . . . . . . . . . . . . . . . . . . . . . . . . . . . . . . . . . . . . 581,685
709,000 Torchmark Corporation . . . . . . . . . . . . . . . . . . . . . . . . . . . . . . . . 25,382,200395,880 Transatlantic Holdings Inc. . . . . . . . . . . . . . . . . . . . . . . . . . . . . . 25,949,934225,000 Wells Fargo & Company . . . . . . . . . . . . . . . . . . . . . . . . . . . . . . . . 10,122,750
————————————419,782,075
————————————
TOTAL COMMON STOCKS(Cost $3,478,479,289) . . . . . . . . . . . . . . . . . . . . . . . . . . . . . . . . 3,407,845,507
————————————
PREFERRED STOCKS—1.1%15,400 Krones AG . . . . . . . . . . . . . . . . . . . . . . . . . . . . . . . . . . . . . . . . . . 705,958
4,158,782 ProSieben Sat. 1 Media AG . . . . . . . . . . . . . . . . . . . . . . . . . . . . . 24,777,8861,718,250 Villeroy & Boch AG . . . . . . . . . . . . . . . . . . . . . . . . . . . . . . . . . . . 14,062,193
————————————
TOTAL PREFERRED STOCKS(Cost $52,913,549) . . . . . . . . . . . . . . . . . . . . . . . . . . . . . . . . . . . 39,546,037
————————————
FaceValue——————
U.S. TREASURY BILLS—0.4%$ 12,000,000 1.311% ** due 5/29/03 . . . . . . . . . . . . . . . . . . . . . . . . . . . . . . . . . 11,978,790
4,500,000 1.198% ** due 8/28/03 . . . . . . . . . . . . . . . . . . . . . . . . . . . . . . . . . 4,479,790————————————
TOTAL U.S. TREASURY BILLS(Cost $16,453,272) . . . . . . . . . . . . . . . . . . . . . . . . . . . . . . . . . . . 16,458,580
————————————
Portfolio of Investments
TWEEDY, BROWNE GLOBAL VALUE FUND
March 31, 2003
59509_Tweedy AR 3 5/21/03 11:30 AM Page 27

28
SEE NOTES TO FINANCIAL STATEMENTS
REPURCHASE AGREEMENT—12.8%(Cost $478,265,000)
$ 478,265,000 Agreement with UBS Warburg LLC, 1.300% dated 3/31/03, to be repurchased at $478,282,271 on 4/1/03, collateralized by $457,286,000 U.S.Treasury Bonds, 12.000%, 8.375% and 8.750% due 5/15/05, 8/15/08 and 11/15/08 (market value $487,832,683) . . . . . . . . . . . . . . . . . . . . . . . . . . . . $ 478,265,000
————————————TOTAL INVESTMENTS (Cost $4,026,111,110*) . . . . . . . . . . 105.5% 3,942,115,124UNREALIZED LOSS ON FORWARD CONTRACTS (Net) (5.4) (202,616,762)OTHER ASSETS AND LIABILITIES (Net) . . . . . . . . . . . . . (0.1) (2,874,156)————— ————————————NET ASSETS . . . . . . . . . . . . . . . . . . . . . . . . . . . . . . . . . . . . . . . . . . . 100.0% $3,736,624,206————— ————————————————— ————————————————————————* Aggregate cost for federal tax purposes is $4,026,261,237.
** Rate represents annualized yield at date of purchase.† Non-income producing security.
†† Amount represents less than 0.1% of net assets.
AbbreviationsADR— American Depository ReceiptCVA—Certificaaten van aandelen (Share Certificates)
MarketFace ValueValue (Note 1)—————— ———————
Portfolio of Investments
TWEEDY, BROWNE GLOBAL VALUE FUND
March 31, 2003
59509_Tweedy AR 3 5/21/03 11:30 AM Page 28

29
SEE NOTES TO FINANCIAL STATEMENTS
March 31, 2003
Portfolio of Investments
TWEEDY, BROWNE GLOBAL VALUE FUND
Percentage of Market ValueSector Diversification Net Assets (Note 1)———————————————————— ——————————— —————————
COMMON STOCKS:Food and Beverages . . . . . . . . . . . . . . . . . . . . . . . . . . . . . . . . . . . . . . 17.0% $ 636,983,380Printing and Publishing . . . . . . . . . . . . . . . . . . . . . . . . . . . . . . . . . . . 13.4 499,572,773Pharmaceuticals . . . . . . . . . . . . . . . . . . . . . . . . . . . . . . . . . . . . . . . . . 12.7 474,765,385Banking . . . . . . . . . . . . . . . . . . . . . . . . . . . . . . . . . . . . . . . . . . . . . . . 7.8 291,842,860Financial Services . . . . . . . . . . . . . . . . . . . . . . . . . . . . . . . . . . . . . . . 5.7 213,371,704Holdings . . . . . . . . . . . . . . . . . . . . . . . . . . . . . . . . . . . . . . . . . . . . . . . 5.7 212,583,134Machinery . . . . . . . . . . . . . . . . . . . . . . . . . . . . . . . . . . . . . . . . . . . . . 4.2 156,370,897Manufacturing . . . . . . . . . . . . . . . . . . . . . . . . . . . . . . . . . . . . . . . . . . 3.8 143,342,423Insurance . . . . . . . . . . . . . . . . . . . . . . . . . . . . . . . . . . . . . . . . . . . . . . 3.7 137,561,718Chemicals . . . . . . . . . . . . . . . . . . . . . . . . . . . . . . . . . . . . . . . . . . . . . . 2.6 96,910,713Paper Products . . . . . . . . . . . . . . . . . . . . . . . . . . . . . . . . . . . . . . . . . . 1.7 64,226,668Tobacco . . . . . . . . . . . . . . . . . . . . . . . . . . . . . . . . . . . . . . . . . . . . . . . 1.6 61,482,906Retail . . . . . . . . . . . . . . . . . . . . . . . . . . . . . . . . . . . . . . . . . . . . . . . . . 1.3 50,388,674Building Materials . . . . . . . . . . . . . . . . . . . . . . . . . . . . . . . . . . . . . . . 1.2 43,400,444Leisure . . . . . . . . . . . . . . . . . . . . . . . . . . . . . . . . . . . . . . . . . . . . . . . . 1.1 42,438,682Commercial Services . . . . . . . . . . . . . . . . . . . . . . . . . . . . . . . . . . . . . 1.0 38,670,487Wholesale . . . . . . . . . . . . . . . . . . . . . . . . . . . . . . . . . . . . . . . . . . . . . . 1.0 37,056,569Health Care . . . . . . . . . . . . . . . . . . . . . . . . . . . . . . . . . . . . . . . . . . . . 0.8 30,601,219Engineering and Construction. . . . . . . . . . . . . . . . . . . . . . . . . . . . . . 0.8 29,994,997Autos . . . . . . . . . . . . . . . . . . . . . . . . . . . . . . . . . . . . . . . . . . . . . . . . . 0.7 26,162,704Construction Materials . . . . . . . . . . . . . . . . . . . . . . . . . . . . . . . . . . . 0.7 25,313,888Electronics . . . . . . . . . . . . . . . . . . . . . . . . . . . . . . . . . . . . . . . . . . . . . 0.5 17,997,306Broadcast, Radio and TV. . . . . . . . . . . . . . . . . . . . . . . . . . . . . . . . . . 0.4 14,596,224Real Estate . . . . . . . . . . . . . . . . . . . . . . . . . . . . . . . . . . . . . . . . . . . . . 0.3 9,582,010Aerospace . . . . . . . . . . . . . . . . . . . . . . . . . . . . . . . . . . . . . . . . . . . . . . 0.3 9,455,261Transportation . . . . . . . . . . . . . . . . . . . . . . . . . . . . . . . . . . . . . . . . . . 0.3 9,366,603Medical Research and Supplies . . . . . . . . . . . . . . . . . . . . . . . . . . . . . 0.2 7,076,658Textiles . . . . . . . . . . . . . . . . . . . . . . . . . . . . . . . . . . . . . . . . . . . . . . . . 0.1 3,154,501Mining and Metal Fabrication. . . . . . . . . . . . . . . . . . . . . . . . . . . . . . 0.0†† 1,619,503Agriculture . . . . . . . . . . . . . . . . . . . . . . . . . . . . . . . . . . . . . . . . . . . . . 0.0†† 1,122,055Other . . . . . . . . . . . . . . . . . . . . . . . . . . . . . . . . . . . . . . . . . . . . . . . . . 0.6 20,833,161— — — — — — — — ————————————Total Common Stocks . . . . . . . . . . . . . . . . . . . . . . . . . . . . . . . . . . . 91.2 3,407,845,507— — — — — — — — ————————————Preferred Stocks . . . . . . . . . . . . . . . . . . . . . . . . . . . . . . . . . . . . . . . . 1.1 39,546,037U.S. Treasury Bills . . . . . . . . . . . . . . . . . . . . . . . . . . . . . . . . . . . . . . 0.4 16,458,580Repurchase Agreement. . . . . . . . . . . . . . . . . . . . . . . . . . . . . . . . . . . 12.8 478,265,000Unrealized Loss on Forward Contracts. . . . . . . . . . . . . . . . . . . . . . (5.4) (202,616,762)Other Assets and Liabilities (Net) . . . . . . . . . . . . . . . . . . . . . . . . . (0.1) (2,874,156)— — — — — — — — ————————————Net Assets . . . . . . . . . . . . . . . . . . . . . . . . . . . . . . . . . . . . . . . . . . . . . 100.0% $ 3,736,624,206— — — — — — — — ————————————— — — — — — — — ————————————————————————†† Amount represents less than 0.1% of net assets
59509_Tweedy AR 3 5/21/03 11:30 AM Page 29

30
SEE NOTES TO FINANCIAL STATEMENTS
March 31, 2003
Contract MarketValue Value
Contracts Date (Note 1)———————— ——————— ————————
FORWARD EXCHANGE CONTRACTS TO BUY88,000,000 Danish Krone . . . . . . . . . . . . . . . . . . . . . . . . . 4/7/03 $ 12,926,766
1,250,000,000 Japanese Yen . . . . . . . . . . . . . . . . . . . . . . . . . 4/14/03 10,546,646 23,000,000 Norwegian Krone . . . . . . . . . . . . . . . . . . . . . . 4/14/03 3,164,190 8,650,000 Singapore Dollar . . . . . . . . . . . . . . . . . . . . . . 4/23/03 4,901,994
55,000,000 South African Rand . . . . . . . . . . . . . . . . . . . . 8/1/03 6,704,722 —————————TOTAL FORWARD EXCHANGE CONTRACTS TO BUY(Contract Amount $37,880,672) . . . . . . . . . . . . . . . . . . . . . . $ 38,244,318——————————————————
FORWARD EXCHANGE CONTRACTS TO SELL2,700,000 Canadian Dollar . . . . . . . . . . . . . . . . . . . . . . . 4/14/03 $ (1,834,299)3,000,000 Canadian Dollar . . . . . . . . . . . . . . . . . . . . . . . 4/23/03 (2,037,180)4,250,000 Canadian Dollar . . . . . . . . . . . . . . . . . . . . . . . 4/28/03 (2,885,275)5,000,000 Canadian Dollar . . . . . . . . . . . . . . . . . . . . . . . 5/5/03 (3,393,117)
13,600,000 Canadian Dollar . . . . . . . . . . . . . . . . . . . . . . . 5/12/03 (9,225,539)2,500,000 Canadian Dollar . . . . . . . . . . . . . . . . . . . . . . . 6/6/03 (1,693,389)8,000,000 Canadian Dollar . . . . . . . . . . . . . . . . . . . . . . . 6/13/03 (5,416,543)4,000,000 Canadian Dollar . . . . . . . . . . . . . . . . . . . . . . . 7/17/03 (2,702,438)3,000,000 Canadian Dollar . . . . . . . . . . . . . . . . . . . . . . . 8/21/03 (2,021,956)4,000,000 Canadian Dollar . . . . . . . . . . . . . . . . . . . . . . . 10/23/03 (2,684,873)4,200,000 Canadian Dollar . . . . . . . . . . . . . . . . . . . . . . . 10/27/03 (2,818,334)8,500,000 Canadian Dollar . . . . . . . . . . . . . . . . . . . . . . . 1/13/04 (5,673,040)1,500,000 Canadian Dollar . . . . . . . . . . . . . . . . . . . . . . . 1/30/04 (999,949)3,000,000 Canadian Dollar . . . . . . . . . . . . . . . . . . . . . . . 2/13/04 (1,997,967)4,000,000 Canadian Dollar . . . . . . . . . . . . . . . . . . . . . . . 3/12/04 (2,658,819)8,000,000 Canadian Dollar . . . . . . . . . . . . . . . . . . . . . . . 4/5/04 (5,309,564)
30,000,000 Czech Koruna . . . . . . . . . . . . . . . . . . . . . . . . . 11/7/03 (1,015,161)88,000,000 Danish Krone . . . . . . . . . . . . . . . . . . . . . . . . . 4/7/03 (12,926,767)93,000,000 Danish Krone . . . . . . . . . . . . . . . . . . . . . . . . . 4/23/03 (13,652,591)7,500,000 Danish Krone . . . . . . . . . . . . . . . . . . . . . . . . . 4/28/03 (1,100,797)
27,200,000 Danish Krone . . . . . . . . . . . . . . . . . . . . . . . . . 7/17/03 (3,980,216)34,650,000 Danish Krone . . . . . . . . . . . . . . . . . . . . . . . . . 8/8/03 (5,066,101)24,400,000 European Economic Union Euro . . . . . . . . . . 4/7/03 (26,618,750)51,500,000 European Economic Union Euro . . . . . . . . . . 4/14/03 (56,168,948)40,000,000 European Economic Union Euro . . . . . . . . . . 4/22/03 (43,613,886)50,000,000 European Economic Union Euro . . . . . . . . . . 4/23/03 (54,515,408)12,000,000 European Economic Union Euro . . . . . . . . . . 4/28/03 (13,081,359)34,500,000 European Economic Union Euro . . . . . . . . . . 5/5/03 (37,599,381)80,000,000 European Economic Union Euro . . . . . . . . . . 5/12/03 (87,164,694)25,000,000 European Economic Union Euro . . . . . . . . . . 5/19/03 (27,232,009)4,000,000 European Economic Union Euro . . . . . . . . . . 6/13/03 (4,353,300)
51,000,000 European Economic Union Euro . . . . . . . . . . 6/17/03 (55,497,012)7,500,000 European Economic Union Euro . . . . . . . . . . 6/24/03 (8,159,380)
40,000,000 European Economic Union Euro . . . . . . . . . . 7/11/03 (43,490,854)71,000,000 European Economic Union Euro . . . . . . . . . . 7/17/03 (77,179,903)45,500,000 European Economic Union Euro . . . . . . . . . . 8/8/03 (49,423,752)44,800,000 European Economic Union Euro . . . . . . . . . . 8/21/03 (48,643,329)
Schedule of Forward Exchange ContractsTWEEDY, BROWNE GLOBAL VALUE FUND
59509_Tweedy AR 3 5/21/03 11:30 AM Page 30

31
SEE NOTES TO FINANCIAL STATEMENTS
March 31, 2003
Contract MarketValue Value
Contracts Date (Note 1)———————— ——————— ————————
FORWARD EXCHANGE CONTRACTS TO SELL32,000,000 European Economic Union Euro . . . . . . . . . . 9/2/03 $ (34,732,209)25,000,000 European Economic Union Euro . . . . . . . . . . 10/23/03 (27,092,183)34,000,000 European Economic Union Euro . . . . . . . . . . 10/27/03 (36,840,897)22,000,000 European Economic Union Euro . . . . . . . . . . 10/31/03 (23,835,335)40,000,000 European Economic Union Euro . . . . . . . . . . 11/12/03 (43,321,202)22,000,000 European Economic Union Euro . . . . . . . . . . 11/28/03 (23,815,106)32,000,000 European Economic Union Euro . . . . . . . . . . 12/9/03 (34,628,609)50,000,000 European Economic Union Euro . . . . . . . . . . 1/8/04 (54,061,342)14,000,000 European Economic Union Euro . . . . . . . . . . 1/13/04 (15,135,228)3,200,000 European Economic Union Euro . . . . . . . . . . 3/10/04 (3,454,414)
56,000,000 European Economic Union Euro . . . . . . . . . . 3/26/04 (60,427,844)50,000,000 European Economic Union Euro . . . . . . . . . . 3/29/04 (53,950,970)23,000,000 European Economic Union Euro . . . . . . . . . . 4/2/04 (24,815,935)42,000,000 European Economic Union Euro . . . . . . . . . . 4/5/04 (45,313,989)1,900,000 Great Britain Pound Sterling . . . . . . . . . . . . 4/14/03 (3,000,503)
10,500,000 Great Britain Pound Sterling . . . . . . . . . . . . 4/22/03 (16,573,380)3,500,000 Great Britain Pound Sterling . . . . . . . . . . . . 4/28/03 (5,522,372)
17,000,000 Great Britain Pound Sterling . . . . . . . . . . . . 6/6/03 (26,754,974)20,000,000 Great Britain Pound Sterling . . . . . . . . . . . . 6/13/03 (31,462,538)6,000,000 Great Britain Pound Sterling . . . . . . . . . . . . 7/7/03 (9,424,091)
11,500,000 Great Britain Pound Sterling . . . . . . . . . . . . 7/17/03 (18,050,548)10,000,000 Great Britain Pound Sterling . . . . . . . . . . . . 8/8/03 (15,673,966)12,600,000 Great Britain Pound Sterling . . . . . . . . . . . . 8/21/03 (19,733,915)8,500,000 Great Britain Pound Sterling . . . . . . . . . . . . 9/2/03 (13,302,943)
10,000,000 Great Britain Pound Sterling . . . . . . . . . . . . 9/3/03 (15,649,561)2,650,000 Great Britain Pound Sterling . . . . . . . . . . . . 10/23/03 (4,134,634)
10,000,000 Great Britain Pound Sterling . . . . . . . . . . . . 10/31/03 (15,594,969)10,000,000 Great Britain Pound Sterling . . . . . . . . . . . . 11/12/03 (15,583,833)10,000,000 Great Britain Pound Sterling . . . . . . . . . . . . 12/9/03 (15,558,777)20,000,000 Great Britain Pound Sterling . . . . . . . . . . . . 3/10/04 (30,956,440)9,000,000 Great Britain Pound Sterling . . . . . . . . . . . . 3/12/04 (13,928,843)9,000,000 Great Britain Pound Sterling . . . . . . . . . . . . 3/29/04 (13,916,292)
13,000,000 Great Britain Pound Sterling . . . . . . . . . . . . 4/2/04 (20,097,770)20,000,000 Great Britain Pound Sterling . . . . . . . . . . . . 4/5/04 (30,915,560)10,000,000 Hong Kong Dollar . . . . . . . . . . . . . . . . . . . . . 4/14/03 (1,282,116)
195,000,000 Hong Kong Dollar . . . . . . . . . . . . . . . . . . . . . 4/28/03 (25,000,606)160,000,000 Hong Kong Dollar . . . . . . . . . . . . . . . . . . . . . 5/5/03 (20,513,044)85,000,000 Hong Kong Dollar . . . . . . . . . . . . . . . . . . . . . 6/13/03 (10,896,477)30,000,000 Hong Kong Dollar . . . . . . . . . . . . . . . . . . . . . 6/17/03 (3,845,760)70,000,000 Hong Kong Dollar . . . . . . . . . . . . . . . . . . . . . 7/7/03 (8,972,782)
140,000,000 Hong Kong Dollar . . . . . . . . . . . . . . . . . . . . . 7/17/03 (17,944,898)30,000,000 Hong Kong Dollar . . . . . . . . . . . . . . . . . . . . . 8/21/03 (3,844,831)47,000,000 Hong Kong Dollar . . . . . . . . . . . . . . . . . . . . . 10/31/03 (6,021,383)63,000,000 Hong Kong Dollar . . . . . . . . . . . . . . . . . . . . . 1/13/04 (8,067,397)80,000,000 Hong Kong Dollar . . . . . . . . . . . . . . . . . . . . . 1/30/04 (10,243,049)11,600,000 Hong Kong Dollar . . . . . . . . . . . . . . . . . . . . . 3/10/04 (1,484,811)35,000,000 Hong Kong Dollar . . . . . . . . . . . . . . . . . . . . . 4/6/04 (4,479,075)
Schedule of Forward Exchange Contracts
TWEEDY, BROWNE GLOBAL VALUE FUND
59509_Tweedy AR 3 5/21/03 11:30 AM Page 31
32
SEE NOTES TO FINANCIAL STATEMENTS
Contract MarketValue Value
Contracts Date (Note 1)———————— ——————— ————————
Schedule of Forward Exchange Contracts
TWEEDY, BROWNE GLOBAL VALUE FUND
March 31, 2003
FORWARD EXCHANGE CONTRACTS TO SELL9,650,000,000 Japanese Yen . . . . . . . . . . . . . . . . . . . . . . . . . 4/14/03 $ (81,420,109)2,530,000,000 Japanese Yen . . . . . . . . . . . . . . . . . . . . . . . . . 4/22/03 (21,352,412)2,130,000,000 Japanese Yen . . . . . . . . . . . . . . . . . . . . . . . . . 4/28/03 (17,980,327)5,500,000,000 Japanese Yen . . . . . . . . . . . . . . . . . . . . . . . . . 4/30/03 (46,431,338)2,300,000,000 Japanese Yen . . . . . . . . . . . . . . . . . . . . . . . . . 5/6/03 (19,423,973)2,423,000,000 Japanese Yen . . . . . . . . . . . . . . . . . . . . . . . . . 6/6/03 (20,493,839)4,000,000,000 Japanese Yen . . . . . . . . . . . . . . . . . . . . . . . . . 6/13/03 (33,833,125)
944,000,000 Japanese Yen . . . . . . . . . . . . . . . . . . . . . . . . . 7/7/03 (7,987,243)938,000,000 Japanese Yen . . . . . . . . . . . . . . . . . . . . . . . . . 7/11/03 (7,937,527)
7,200,000,000 Japanese Yen . . . . . . . . . . . . . . . . . . . . . . . . . 7/17/03 (60,939,803)585,000,000 Japanese Yen . . . . . . . . . . . . . . . . . . . . . . . . . 8/8/03 (4,954,724)280,000,000 Japanese Yen . . . . . . . . . . . . . . . . . . . . . . . . . 8/21/03 (2,372,362)
1,300,000,000 Japanese Yen . . . . . . . . . . . . . . . . . . . . . . . . . 9/3/03 (11,018,889)710,550,000 Japanese Yen . . . . . . . . . . . . . . . . . . . . . . . . . 10/23/03 (6,032,725)765,000,000 Japanese Yen . . . . . . . . . . . . . . . . . . . . . . . . . 10/27/03 (6,495,897)960,000,000 Japanese Yen . . . . . . . . . . . . . . . . . . . . . . . . . 1/13/04 (8,173,553)180,000,000 Mexican Peso . . . . . . . . . . . . . . . . . . . . . . . . . 4/7/03 (16,631,248)180,000,000 Mexican Peso . . . . . . . . . . . . . . . . . . . . . . . . . 4/14/03 (16,608,597)110,000,000 Mexican Peso . . . . . . . . . . . . . . . . . . . . . . . . . 4/23/03 (10,131,956)24,500,000 Mexican Peso . . . . . . . . . . . . . . . . . . . . . . . . . 4/28/03 (2,254,473)41,000,000 Mexican Peso . . . . . . . . . . . . . . . . . . . . . . . . . 6/6/03 (3,743,144)80,000,000 Mexican Peso . . . . . . . . . . . . . . . . . . . . . . . . . 9/2/03 (7,172,883)
100,000,000 Mexican Peso . . . . . . . . . . . . . . . . . . . . . . . . . 12/9/03 (8,790,350)23,000,000 New Zealand Dollar . . . . . . . . . . . . . . . . . . . . 12/9/03 (12,362,896)11,000,000 New Zealand Dollar . . . . . . . . . . . . . . . . . . . . 2/13/04 (5,871,383)23,000,000 Norwegian Krone . . . . . . . . . . . . . . . . . . . . . . 4/14/03 (3,164,190)33,500,000 Norwegian Krone . . . . . . . . . . . . . . . . . . . . . . 5/5/03 (4,597,201)85,750,000 Norwegian Krone . . . . . . . . . . . . . . . . . . . . . . 5/19/03 (11,748,575)17,350,000 Singapore Dollar . . . . . . . . . . . . . . . . . . . . . . . 4/23/03 (9,832,323)10,650,000 Singapore Dollar . . . . . . . . . . . . . . . . . . . . . . . 5/5/03 (6,036,402)5,000,000 Singapore Dollar . . . . . . . . . . . . . . . . . . . . . . . 6/13/03 (2,835,317)9,000,000 Singapore Dollar . . . . . . . . . . . . . . . . . . . . . . . 6/17/03 (5,103,822)
14,700,000 Singapore Dollar . . . . . . . . . . . . . . . . . . . . . . . 6/24/03 (8,336,960)31,000,000 Singapore Dollar . . . . . . . . . . . . . . . . . . . . . . . 7/17/03 (17,586,277)7,000,000 Singapore Dollar . . . . . . . . . . . . . . . . . . . . . . . 8/1/03 (3,971,818)
31,000,000 Singapore Dollar . . . . . . . . . . . . . . . . . . . . . . . 8/21/03 (17,593,673)26,000,000 Singapore Dollar . . . . . . . . . . . . . . . . . . . . . . . 9/3/03 (14,758,471)5,650,000 Singapore Dollar . . . . . . . . . . . . . . . . . . . . . . . 10/27/03 (3,209,408)
20,000,000 Singapore Dollar . . . . . . . . . . . . . . . . . . . . . . . 12/15/03 (11,367,603)47,000,000 Singapore Dollar . . . . . . . . . . . . . . . . . . . . . . . 1/16/04 (26,723,828)10,000,000 Singapore Dollar . . . . . . . . . . . . . . . . . . . . . . . 2/13/04 (5,687,732)15,900,000 Singapore Dollar . . . . . . . . . . . . . . . . . . . . . . . 3/10/04 (9,046,169)12,000,000 Singapore Dollar . . . . . . . . . . . . . . . . . . . . . . . 3/29/04 (6,829,249)7,000,000 Singapore Dollar . . . . . . . . . . . . . . . . . . . . . . . 4/5/04 (3,984,532)
105,000,000 South African Rand . . . . . . . . . . . . . . . . . . . . 8/1/03 (12,799,923)70,000,000 South African Rand . . . . . . . . . . . . . . . . . . . . 9/3/03 (8,449,753)15,400,000 Swedish Krona . . . . . . . . . . . . . . . . . . . . . . . . 4/14/03 (1,814,638)
59509_Tweedy AR 3 5/21/03 11:30 AM Page 32

33
SEE NOTES TO FINANCIAL STATEMENTS
Contract MarketValue Value
Contracts Date (Note 1)———————— ——————— ————————
Schedule of Forward Exchange Contracts
TWEEDY, BROWNE GLOBAL VALUE FUND
March 31, 2003
FORWARD EXCHANGE CONTRACTS TO SELL40,000,000 Swedish Krona . . . . . . . . . . . . . . . . . . . . . . . . 4/22/03 $ (4,710,917)52,500,000 Swedish Krona . . . . . . . . . . . . . . . . . . . . . . . . 4/28/03 (6,180,691)4,000,000 Swedish Krona . . . . . . . . . . . . . . . . . . . . . . . . 6/6/03 (469,699)
25,500,000 Swedish Krona . . . . . . . . . . . . . . . . . . . . . . . . 6/24/03 (2,990,937)98,000,000 Swedish Krona . . . . . . . . . . . . . . . . . . . . . . . . 8/8/03 (11,460,684)49,400,000 Swedish Krona . . . . . . . . . . . . . . . . . . . . . . . . 10/23/03 (5,750,668)33,000,000 Swedish Krona . . . . . . . . . . . . . . . . . . . . . . . . 2/13/04 (3,815,136)84,000,000 Swedish Krona . . . . . . . . . . . . . . . . . . . . . . . . 3/26/04 (9,687,103)98,000,000 Swedish Krona . . . . . . . . . . . . . . . . . . . . . . . . 4/2/04 (11,298,124)4,165,000 Swiss Franc . . . . . . . . . . . . . . . . . . . . . . . . . . . 4/7/03 (3,082,470)
38,800,000 Swiss Franc . . . . . . . . . . . . . . . . . . . . . . . . . . . 4/14/03 (28,721,072)6,500,000 Swiss Franc . . . . . . . . . . . . . . . . . . . . . . . . . . . 4/23/03 (4,812,731)5,700,000 Swiss Franc . . . . . . . . . . . . . . . . . . . . . . . . . . . 4/28/03 (4,220,986)
27,000,000 Swiss Franc . . . . . . . . . . . . . . . . . . . . . . . . . . . 5/5/03 (19,997,904)20,000,000 Swiss Franc . . . . . . . . . . . . . . . . . . . . . . . . . . . 5/19/03 (14,818,748)21,000,000 Swiss Franc . . . . . . . . . . . . . . . . . . . . . . . . . . . 6/13/03 (15,569,258)21,000,000 Swiss Franc . . . . . . . . . . . . . . . . . . . . . . . . . . . 6/17/03 (15,570,703)16,000,000 Swiss Franc . . . . . . . . . . . . . . . . . . . . . . . . . . . 7/7/03 (11,868,940)37,000,000 Swiss Franc . . . . . . . . . . . . . . . . . . . . . . . . . . . 7/11/03 (27,449,505)14,500,000 Swiss Franc . . . . . . . . . . . . . . . . . . . . . . . . . . . 7/17/03 (10,758,756)17,550,000 Swiss Franc . . . . . . . . . . . . . . . . . . . . . . . . . . . 8/8/03 (13,028,372)17,000,000 Swiss Franc . . . . . . . . . . . . . . . . . . . . . . . . . . . 8/21/03 (12,623,730)30,000,000 Swiss Franc . . . . . . . . . . . . . . . . . . . . . . . . . . . 9/2/03 (22,282,987)9,200,000 Swiss Franc . . . . . . . . . . . . . . . . . . . . . . . . . . . 10/23/03 (6,840,867)
25,000,000 Swiss Franc . . . . . . . . . . . . . . . . . . . . . . . . . . . 10/27/03 (18,590,911)12,000,000 Swiss Franc . . . . . . . . . . . . . . . . . . . . . . . . . . . 10/31/03 (8,924,405)24,500,000 Swiss Franc . . . . . . . . . . . . . . . . . . . . . . . . . . . 11/28/03 (18,231,631)25,000,000 Swiss Franc . . . . . . . . . . . . . . . . . . . . . . . . . . . 12/9/03 (18,608,108)10,000,000 Swiss Franc . . . . . . . . . . . . . . . . . . . . . . . . . . . 12/15/03 (7,444,204)32,000,000 Swiss Franc . . . . . . . . . . . . . . . . . . . . . . . . . . . 1/13/04 (23,835,411)6,500,000 Swiss Franc . . . . . . . . . . . . . . . . . . . . . . . . . . . 1/16/04 (4,841,850)
20,000,000 Swiss Franc. . . . . . . . . . . . . . . . . . . . . . . . . . . 2/13/04 (14,906,115)4,500,000 Swiss Franc . . . . . . . . . . . . . . . . . . . . . . . . . . . 3/10/04 (3,355,573)
21,500,000 Swiss Franc . . . . . . . . . . . . . . . . . . . . . . . . . . . 3/26/04 (16,037,298)16,000,000 Swiss Franc . . . . . . . . . . . . . . . . . . . . . . . . . . . 4/2/04 (11,936,934)23,000,000 Swiss Franc . . . . . . . . . . . . . . . . . . . . . . . . . . . 4/5/04 (17,160,698)—————————
TOTAL FORWARD EXCHANGE CONTRACTS TO SELL(Contract Amount $2,528,489,639). . . . . . . . . . . . . . . . . . . . $(2,731,470,047)——————————————————
59509_Tweedy AR 3 5/21/03 11:30 AM Page 33

34
SEE NOTES TO FINANCIAL STATEMENTS
March 31, 2003
Statement of Assets and Liabilities
TWEEDY, BROWNE GLOBAL VALUE FUND
ASSETSInvestments, at value (Cost $4,026,111,110) (Note 1)
Securities . . . . . . . . . . . . . . . . . . . . . . . . . . . . . . . . . . . . . . . . . . . . . . $ 3,463,850,124Repurchase Agreement . . . . . . . . . . . . . . . . . . . . . . . . . . . . . . . . . . . 478,265,000———————————————————
Total Investments . . . . . . . . . . . . . . . . . . . . . . . . . . . . . . . . . . . . . . . . . . . 3,942,115,124Cash and foreign currency (Cost $6,586,170) . . . . . . . . . . . . . . . . . . . . 6,734,765Dividends and interest receivable . . . . . . . . . . . . . . . . . . . . . . . . . . . . . . 11,925,018Receivable for Fund shares sold . . . . . . . . . . . . . . . . . . . . . . . . . . . . . . . . 4,647,878Receivable for investment securities sold . . . . . . . . . . . . . . . . . . . . . . . . 1,413,528Prepaid expense . . . . . . . . . . . . . . . . . . . . . . . . . . . . . . . . . . . . . . . . . . . . 11,928———————————————————
Total Assets . . . . . . . . . . . . . . . . . . . . . . . . . . . . . . . . . . . . . . . . . . . 3,966,848,241———————————————————
LIABILITIESNet unrealized depreciation of forward exchange
contracts (Note 1) . . . . . . . . . . . . . . . . . . . . . . . . . . $ 202,616,762Payable for investment securities purchased . . . . . . . . 14,290,082Payable for Fund shares redeemed . . . . . . . . . . . . . . . . 9,892,835Investment advisory fee payable (Note 2) . . . . . . . . . . 2,589,620Custodian fees payable (Note 2) . . . . . . . . . . . . . . . . . 155,191Transfer agent fees payable (Note 2) . . . . . . . . . . . . . . 117,974Accrued expenses and other payables . . . . . . . . . . . . . 561,571————————————————————
Total Liabilities . . . . . . . . . . . . . . . . . . . . . . . . . . . . . . . . . . . . . . . . . 230,224,035———————————————————NET ASSETS . . . . . . . . . . . . . . . . . . . . . . . . . . . . . . . . . . . . . . . . . . . $ 3,736,624,206——————————————————————————————————————
NET ASSETS consist ofUndistributed net investment income . . . . . . . . . . . . . . . . . . . . . . . . . . $ 10,955,981Accumulated net realized loss on securities, forward
exchange contracts and foreign currencies . . . . . . . . . . . . . . . . . . . . (372,075,552)Net unrealized depreciation of securities, forward exchange
contracts, foreign currencies and net other assets . . . . . . . . . . . . . . . (286,193,705)Par value . . . . . . . . . . . . . . . . . . . . . . . . . . . . . . . . . . . . . . . . . . . . . . . . . . 25,884Paid-in capital in excess of par value. . . . . . . . . . . . . . . . . . . . . . . . . . . . 4,383,911,598———————————————————
Total Net Assets . . . . . . . . . . . . . . . . . . . . . . . . . . . . . . . . . . . . . . . . $ 3,736,624,206——————————————————————————————————————
NET ASSET VALUE, offering and redemption price per share ($3,736,624,206 ÷ 258,836,350 shares of common stock outstanding) . $14.44——————————
59509_Tweedy AR 3 5/21/03 11:30 AM Page 34

35
SEE NOTES TO FINANCIAL STATEMENTS
Statement of Operations
TWEEDY, BROWNE GLOBAL VALUE FUND
For the Year Ended March 31, 2003
INVESTMENT INCOMEDividends (net of foreign withholding taxes of $10,141,419) . . . . . . . $ 98,855,560Interest . . . . . . . . . . . . . . . . . . . . . . . . . . . . . . . . . . . . . . . . . . . . . . . . . . 9,571,890————————————————————————————————
Total Investment Income . . . . . . . . . . . . . . . . . . . . . . . . . . . . . . . . . 108,427,450————————————————————————————————EXPENSES
Investment advisory fee (Note 2) . . . . . . . . . . . . . . . . . . . . $ 53,477,001Custodian fees (Note 2) . . . . . . . . . . . . . . . . . . . . . . . . . . . . 1,810,318Administration and accounting fees (Note 2). . . . . . . . . . . 1,462,461Transfer agent fees (Note 2). . . . . . . . . . . . . . . . . . . . . . . . . 852,972Directors’ fees and expenses (Note 2) . . . . . . . . . . . . . . . . . 141,343Legal and audit fees . . . . . . . . . . . . . . . . . . . . . . . . . . . . . . . 141,247Other . . . . . . . . . . . . . . . . . . . . . . . . . . . . . . . . . . . . . . . . . . 674,504——————————
Total Expenses . . . . . . . . . . . . . . . . . . . . . . . . . . . . . . . . . . . . . . . . . 58,559,846————————————————————————————————NET INVESTMENT INCOME . . . . . . . . . . . . . . . . . . . . . . . . . . . . . . . 49,867,604————————————————————————————————
REALIZED AND UNREALIZED GAIN(LOSS) ON INVESTMENTS(Notes 1 and 3):
Net realized gain (loss) on:Securities . . . . . . . . . . . . . . . . . . . . . . . . . . . . . . . . . . . . . . . . . . . . . (84,430,900)Forward exchange contracts . . . . . . . . . . . . . . . . . . . . . . . . . . . . . . . (243,071,477)Foreign currencies and net other assets . . . . . . . . . . . . . . . . . . . . . . 1,270,098————————————————————————————————
Net realized loss on investments during the year . . . . . . . . . . . . . . . . . (326,232,279)————————————————————————————————Net unrealized appreciation (depreciation) of:
Securities . . . . . . . . . . . . . . . . . . . . . . . . . . . . . . . . . . . . . . . . . . . . . (690,019,650)Forward exchange contracts . . . . . . . . . . . . . . . . . . . . . . . . . . . . . . . (250,954,730)Foreign currencies and net other assets . . . . . . . . . . . . . . . . . . . . . . 416,911————————————————————————————————
Net unrealized depreciation of investments during the year . . . . . . . . . (940,557,469)————————————————————————————————NET REALIZED AND UNREALIZED LOSS ON INVESTMENTS . . . . . . . . . . . . . . . . . . . . . . . . . . . . . . . . . . . . . . . . . . . . . (1,266,789,748)————————————————————————————————NET DECREASE IN NET ASSETS RESULTING FROM OPERATIONS . . . . . . . . . . . . . . . . . . . . . . . . . . . . . . . . . . . . . . . $ (1,216,922,144)————————————————————————————————————————————————————————————————
59509_Tweedy AR 3 5/21/03 11:30 AM Page 35

36
SEE NOTES TO FINANCIAL STATEMENTS
Statements of Changes in Net Assets
TWEEDY, BROWNE GLOBAL VALUE FUND
Year YearEnded Ended
3/31/03 3/31/02————————————— —————————————Net investment income . . . . . . . . . . . . . . . . . . . . . . . . . . . . . $ 49,867,604 $ 48,895,367Net realized gain (loss) on securities, forward exchange
contracts and currency transactions during the year. . . . (326,232,279) 209,233,555Net unrealized depreciation of securities, forward
exchange contracts, foreign currencies and net otherassets during the year . . . . . . . . . . . . . . . . . . . . . . . . . . . . (940,557,469) (68,070,316)—————————————— —————————————
Net increase (decrease) in net assets resulting from operations . . . . . . . . . . . . . . . . . . . . . . . . . . . . . . . . . . . . . (1,216,922,144) 190,058,606
Distributions:Dividends to shareholders from net investment
income. . . . . . . . . . . . . . . . . . . . . . . . . . . . . . . . . . . . . (50,732,623) (39,539,408)Distributions to shareholders from net realized gain
on investments . . . . . . . . . . . . . . . . . . . . . . . . . . . . . . (67,657,606) (70,942,781)Net increase in net assets from Fund share transactions
(Note 4) . . . . . . . . . . . . . . . . . . . . . . . . . . . . . . . . . . . . . . 447,537,198 883,311,035—————————————— —————————————Net increase (decrease) in net assets . . . . . . . . . . . . . . . . . . . (887,775,175) 962,887,452
NET ASSETSBeginning of year . . . . . . . . . . . . . . . . . . . . . . . . . . . . . . . . . 4,624,399,381 3,661,511,929—————————————— —————————————End of year (including undistributed net investment
income of $10,955,981 and $14,397,628, respectively) . $ 3,736,624,206 $4,624,399,381—————————————— ——————————————————————————— —————————————
59509_Tweedy AR 3 5/21/03 11:30 AM Page 36

37
SEE NOTES TO FINANCIAL STATEMENTS
Financial Highlights
TWEEDY, BROWNE GLOBAL VALUE FUND
For a Fund share outstanding throughout each year.
Year Year Year Year YearEnded Ended Ended Ended Ended
3/31/03 3/31/02 3/31/01 3/31/00 3/31/99——————— ——————— ——————— ——————— ———————Net asset value, beginning of year . . . . $19.79 $19.52 $21.10 $18.08 $18.98———— ———— ———— ———— ————Income from investment operations:Net investment income . . . . . . . . . . . . 0.19 0.22 0.22 0.23 0.23Net realized and unrealized gain (loss)
on investments . . . . . . . . . . . . . . . . (5.07) 0.56 0.92 3.64 0.24———— ———— ———— ———— ————Total from investment
operations. . . . . . . . . . . . . . . (4.88) 0.78 1.14 3.87 0.47———— ———— ———— ———— ————Distributions:
Dividends from net investmentincome . . . . . . . . . . . . . . . . . . . (0.20) (0.18) (0.21) (0.26) (0.38)
Distributions from net realized gains. . . . . . . . . . . . . . . (0.27) (0.33) (2.23) (0.59) (0.99)
Distributions in excess of netrealized gains. . . . . . . . . . . . . . . — — (0.28) — ————— ———— ———— ———— ————Total distributions. . . . . . . . . . . (0.47) (0.51) (2.72) (0.85) (1.37)———— ———— ———— ———— ————
Net asset value, end of year . . . . . . . . . $14.44 $19.79 $19.52 $21.10 $18.08———— ———— ———— ———— ———————— ———— ———— ———— ————Total return (a) . . . . . . . . . . . . . . . . . . . (24.86)% 4.22% 5.17% 21.68% 3.03%—————— ———— ———— ———————— —————————— ———— ———— ———————— ————Ratios/Supplemental Data:Net assets, end of year (in 000s). . . . . . $3,736,624 $4,624,399 $3,661,512 $3,236,504 $2,589,574Ratio of operating expenses to
average net assets . . . . . . . . . . . . . 1.37% 1.37% 1.38% 1.38% 1.41%Ratio of net investment income to
average net assets . . . . . . . . . . . . . . 1.17% 1.22% 1.06% 1.10% 1.26%Portfolio turnover rate . . . . . . . . . . . . . 8% 7% 12% 16% 23%________________________________________________________________________________________________
(a) Total return represents aggregate total return for the periods indicated.
59509_Tweedy AR 3 5/21/03 11:30 AM Page 37

38
Notes to Financial Statements
TWEEDY, BROWNE GLOBAL VALUE FUND
1. Significant Accounting Policies
Tweedy, Browne Global Value Fund (the “Fund”) is a diversified series ofTweedy, Browne Fund Inc. (the “Company”). The Company is an open-endmanagement investment company registered with the Securities andExchange Commission under the Investment Company Act of 1940, asamended. The Company was organized as a Maryland corporation on January28, 1993. The Fund commenced operations on June 15, 1993. Thepreparation of financial statements in accordance with accounting principlesgenerally accepted in the United States requires management to makeestimates and assumptions that affect the reported amounts and disclosures inthe financial statements. Actual results could differ from those estimates. Thefollowing is a summary of significant accounting policies consistently followedby the Fund in the preparation of its financial statements.
Portfolio Valuation Generally, the Fund’s investments are valued atmarket value or at fair value as determined by or under the direction of theCompany’s Board of Directors. Portfolio securities and other assets, listed on aUS national securities exchange or through any system providing for same daypublication of actual prices (and not subject to restrictions against sale by theFund on such exchange or system) are valued at the last quoted sale price orthe Nasdaq Official Close Price (“NOCP”), when appropriate, prior to theclose of regular trading. Portfolio securities and other assets listed on a foreignexchange or through any system providing for same day publication of actualprices are valued at the last quoted sale price available before the time whenassets are valued. Portfolio securities and other assets for which there are noreported sales on the valuation date are valued at the mean between the lastasked price and the last bid price prior to the close of regular trading. Whenthe Investment Adviser determines that the last sale price prior to valuationor the NOCP does not reflect current market value, the Investment Adviserwill determine the market value of those securities or assets in accordance withindustry practice and other factors considered relevant by the InvestmentAdviser. All other securities and assets for which current market quotationsare not readily available and those securities which are not readily marketabledue to significant legal or contractual restrictions will be valued at fair valueas determined by the Investment Adviser under the direction of the Board ofDirectors. Debt securities purchased with a remaining maturity of 60 days orless are valued at amortized cost, which approximates market value, or byreference to other factors (i.e., pricing services or dealer quotations) by theInvestment Adviser.
59509_Tweedy AR 3 5/21/03 11:30 AM Page 38

39
Notes to Financial Statements
TWEEDY, BROWNE GLOBAL VALUE FUND
Repurchase Agreements The Fund engages in repurchase agreementtransactions. Under the terms of a typical repurchase agreement, the Fundtakes possession of an underlying debt obligation subject to an obligation ofthe seller to repurchase, and the Fund to resell, the obligation at an agreed-upon price and time, thereby determining the yield during the Fund’s holdingperiod. This arrangement results in a fixed rate of return that is not subject tomarket fluctuations during the Fund’s holding period. The value of thecollateral is at all times at least equal to the total amount of the repurchaseobligations, including interest. In the event of counterparty default, the Fundhas the right to use the collateral to offset losses incurred. There is potentialloss to the Fund in the event the Fund is delayed or prevented from exercisingits rights to dispose of the collateral securities, including the risk of a possibledecline in the value of the underlying securities during the period while theFund seeks to assert its rights. The Fund’s Investment Adviser reviews thevalue of the collateral and the creditworthiness of those banks and dealerswith which the Fund enters into repurchase agreements to evaluate potentialrisks.
Foreign Currency The books and records of the Fund are maintained inUS dollars. Foreign currencies, investments and other assets and liabilities aretranslated into US dollars at the exchange rates prevailing at the end of theperiod, and purchases and sales of investment securities, income and expensesare translated on the respective dates of such transactions. Unrealized gainsand losses which result from changes in foreign currency exchange rates havebeen included in the unrealized appreciation (depreciation) of currencies andnet other assets. Net realized foreign currency gains and losses resulting fromchanges in exchange rates include foreign currency gains and losses betweentrade date and settlement date on investments, securities transactions, foreigncurrency transactions and the difference between the amounts of interest anddividends recorded on the books of the Fund and the amount actuallyreceived. The portion of foreign currency gains and losses related tofluctuation in the exchange rates between the initial purchase trade date andsubsequent sale trade date is included in realized gains and losses oninvestment securities sold.
Forward Exchange Contracts The Fund has entered into forwardexchange contracts for non-trading purposes in order to reduce its exposure tofluctuations in foreign currency exchange on its portfolio holdings. Forwardexchange contracts are valued at the forward rate and are marked-to-market
59509_Tweedy AR 3 5/21/03 11:30 AM Page 39
40
Notes to Financial Statements
TWEEDY, BROWNE GLOBAL VALUE FUND
daily. The change in market value is recorded by the Fund as an unrealizedgain or loss. When the contract is closed, the Fund records a realized gain orloss equal to the difference between the value of the contract at the time thatit was opened and the value of the contract at the time that it was closed.
The use of forward exchange contracts does not eliminate fluctuations inthe underlying prices of the Fund’s investment securities, but it does establisha rate of exchange that can be achieved in the future. Although forwardexchange contracts limit the risk of loss due to a decline in the value of thehedged currency, they also limit any potential gain that might result shouldthe value of the currency increase. In addition, the Fund could be exposed torisks if the counterparties to the contracts are unable to meet the terms of theircontracts.
Securities Transactions and Investment Income Securities transactionsare recorded as of the trade date. Realized gains and losses from securitiestransactions are recorded on the identified cost basis. Dividend income anddistributions to shareholders are recorded on the ex-dividend date. Interestincome is recorded on the accrual basis. Dividend income and interest incomemay be subject to foreign withholding taxes. The Fund’s custodian applies forrefunds where available.
Tweedy, Browne Company LLC is reimbursed by the Fund for the cost ofsettling transactions in US securities for the Fund through its clearing broker.For the year ended March 31, 2003 the Fund reimbursed Tweedy, BrowneCompany LLC $393 for such transaction charges.
Dividends and Distributions to Shareholders Dividends from netinvestment income, if any, and distributions from realized capital gains afterutilization of capital loss carryforwards, if any, will be declared and paidannually. Additional distributions of net investment income and capital gainsfrom the Fund may be made at the discretion of the Board of Directors in orderto avoid the application of a 4% non-deductible Federal excise tax on certainundistributed amounts of ordinary income and capital gains. Income dividendsand capital gain distributions are determined in accordance with income taxregulations which may differ from accounting principles generally accepted inthe United States. These differences are primarily due to differing treatmentsof income and gains on various investment securities held by the Fund, timingdifferences and differing characterization of distributions made by the Fund.
59509_Tweedy AR 3 5/21/03 11:30 AM Page 40

41
Notes to Financial Statements
TWEEDY, BROWNE GLOBAL VALUE FUND
The character of distributions paid on a tax basis during December 2002for fiscal year 2003 and December 2001 for fiscal year 2002 is as follows:
2003 2002Distributions paid from:Investment income $ 50,732,623 $ 39,539,408Short-term capital gain 7,840,593 22,449,429
——————————————————————————————— ——————————————————————————————Ordinary income 58,573,216 61,988,837Long-term capital gain 59,817,013 48,493,352
——————————————————————————————— ——————————————————————————————Total Distributions $118,390,229 $110,482,189
——————————————————————————————— ————————————————————————————————————————————————————————————— ——————————————————————————————
As of March 31, 2003, the components of distributable earnings on a taxbasis were as follows:
Undistributed ordinary income $ 11,182,243Unrealized depreciation (88,723,538)
———————————————————————————————Total $ (77,541,295)
——————————————————————————————————————————————————————————————Federal Income Taxes The Fund has qualified and intends to continue
to qualify as a regulated investment company, if such qualification is in thebest interest of its shareholders, by complying with the requirements of theInternal Revenue Code of 1986, as amended, applicable to regulatedinvestment companies and by distributing substantially all of its taxableincome to its shareholders. Therefore, no Federal income tax provision isrequired.
Expenses Expenses directly attributable to each Fund as a diversifiedseries of the Company are charged to that Fund. Other expenses of theCompany are generally allocated to each Fund based on the average net assetsof each Fund.2. Investment Advisory Fee, Other Related Party Transactions andAdministration Fee
The Company, on behalf of the Fund, has entered into an investmentadvisory agreement (the “Advisory Agreement”) with Tweedy, BrowneCompany LLC (“Tweedy, Browne”). Under the Advisory Agreement, theCompany pays Tweedy, Browne a fee at the annual rate of 1.25% of the valueof its average daily net assets. The fee is payable monthly, provided the Fundwill make such interim payments as may be requested by the Investment
59509_Tweedy AR 3 5/21/03 11:30 AM Page 41

42
Notes to Financial Statements
TWEEDY, BROWNE GLOBAL VALUE FUND
Adviser not to exceed 75% of the amount of the fee then accrued on thebooks of the Fund and unpaid.
The current and retired managing directors and their families, as well asemployees of Tweedy, Browne, the Investment Adviser to the Fund, haveapproximately $39.0 million, as of March 31, 2003, of their own moneyinvested in the Fund.
The Company, on behalf of the Fund, has entered into an administrationagreement (the “Administration Agreement”) with PFPC Inc. (the“Administrator”), an indirect, majority-owned subsidiary of The PNCFinancial Services Group Inc. Under the Administration Agreement, theCompany pays the Administrator an administration fee and a fund accountingfee computed daily and payable monthly at the following annual rates of thevalue of the average daily net assets of the Fund:
Between Between$500 Million $1 Billion
Up to and and Exceeding$500 Million $1 Billion $4 Billion $4 Billion
Administration Fees 0.06% 0.04% 0.02% 0.015%
Between Between$100 Million $2 Billion
Up to and and Exceeding$100 Million $2 Billion $4 Billion $4 Billion
Accounting Fees 0.03% 0.01% 0.0075% 0.006%
No officer, director or employee of Tweedy, Browne, the Administrator orany parent or subsidiary of those corporations receives any compensation fromthe Company for serving as a director or officer of the Company. TheCompany pays each Non-Interested Director $50,000 annually to be paidquarterly in $12,500 increments plus out-of-pocket expenses for their servicesas directors. The annual fee of $50,000 paid to each Non-Interested Directoris divided proportionately between the Fund and the Tweedy, BrowneAmerican Value Fund.
Boston Safe Deposit and Trust Company (“Boston Safe”), an indirect,wholly-owned subsidiary of Mellon Trust, serves as the Fund’s custodianpursuant to a custody agreement (the “Custody Agreement”). PFPC Inc.
59509_Tweedy AR 3 5/21/03 11:30 AM Page 42

43
Notes to Financial Statements
TWEEDY, BROWNE GLOBAL VALUE FUND
serves as the Fund’s transfer agent. Tweedy, Browne also serves as thedistributor to the Fund and pays all distribution fees. No distribution fees arepaid by the Fund.
3. Securities Transactions
Cost of purchases and proceeds from sales of investment securities,excluding short-term investments, for the year ended March 31, 2003,aggregated $582,923,403 and $314,992,580, respectively.
At March 31, 2003, the aggregate gross unrealized appreciation for allsecurities, in which there was an excess of value over tax cost, was$580,391,532 and the aggregate gross unrealized depreciation for all securities,in which there was an excess of tax cost over value, was $664,537,645.
4. Capital Stock
The Company is authorized to issue one billion shares of $0.0001 parvalue capital stock, of which 600,000,000 of the unissued shares have beendesignated as shares of the Fund. Changes in shares outstanding for the Fundwere as follows:
Year Ended 3/31/03 Year Ended 3/31/02Shares Amount Shares Amount
Sold 354,762,237 $5,891,099,961 173,519,784 $3,321,002,070Reinvested 6,894,157 107,824,613 5,527,528 101,596,149Redeemed (336,482,653) (5,551,387,376) (132,959,446) (2,539,287,184)Net Increase 25,173,741 $ 447,537,198 46,087,866 $ 883,311,035
5. Foreign Securities
Investing in securities of foreign companies and foreign governmentsinvolves economic and political risks and considerations not typicallyassociated with investing in US companies and the US Government. Theseconsiderations include changes in exchange rates and exchange rate controls(which may include suspension of the ability to transfer currency from a givencountry), costs incurred in conversions between currencies, non-negotiablebrokerage commissions, less publicly available information, differentaccounting standards, lower trading volume, delayed settlements and greatermarket volatility, the difficulty of enforcing obligations in other countries, lesssecurities regulation, different tax provisions (including withholding ondividends paid to the Fund), war, expropriation, political and social instabilityand diplomatic developments.
59509_Tweedy AR 3 5/21/03 11:30 AM Page 43

44
Notes to Financial Statements
TWEEDY, BROWNE GLOBAL VALUE FUND
6. Line of Credit
The Company and Mellon Trust, N.A. (the “Bank”) entered into a Lineof Credit Agreement (the “Agreement”) which, as amended effectiveSeptember 25, 2002, provides the Company, on behalf of the Fund and theTweedy, Browne American Value Fund, with a $100 million line of credit (the“Commitment”) primarily for temporary or emergency purposes, including themeeting of redemption requests that might otherwise require the untimelydisposition of securities. The Fund may borrow up to the value of one-third ofits net assets; provided, however, that the total Commitment available to theFund is reduced by any borrowings of the Tweedy, Browne American ValueFund. Interest is payable at the Bank’s money market rate plus 0.75% on anannualized basis. Under the Agreement, the Company pays a facility fee equalto 0.10% annually of the unutilized Commitment. The Agreement requires,among other provisions, the Fund to maintain a ratio of net assets (notincluding funds borrowed pursuant to the Agreement) to aggregated amountof indebtedness pursuant to the Agreement of no less than three to one. Forthe year ended March 31, 2003, the Company did not borrow, on behalf of theFund, under the Agreement.
7. Post-October Loss Deferral Disclosure
Certain losses incurred after October 31 within a fund’s fiscal year aredeemed to arise on the first business day of the fund’s following fiscal year. Forthe fiscal year ended March 31, 2003, the Tweedy, Browne Global Value Fundincurred and elected to defer $290,173,353 in capital losses.
8. Capital Loss Carryover Disclosure
As of March 31, 2003, the Fund had a capital loss carryforward for federalincome tax purposes of $279,598,628 expiring on March 31, 2011.
9. Securities Lending
The Fund may lend securities to brokers, dealers and other financialorganizations to earn additional income. Each security out on loan iscollateralized with segregated assets held with the borrower in an amountequal to or greater than the current market value of the loaned securities.
At March 31, 2003, the Fund did not have any securities out on loan anddid not have any segregated assets with the borrower.
59509_Tweedy AR 3 5/21/03 11:30 AM Page 44

45
Report of Ernst & Young LLP, Independent Auditors
TWEEDY, BROWNE GLOBAL VALUE FUND
To the Shareholders and Board of Directors of Tweedy, Browne Fund Inc.
We have audited the accompanying statement of assets and liabilities,including the portfolio of investments and the schedule of forward exchangecontracts, of Tweedy, Browne Global Value Fund (the “Fund”) (a series ofTweedy, Browne Fund Inc.) as of March 31, 2003, and the related statementof operations for the year then ended, the statements of changes in net assetsfor each of the two years in the period then ended and the financial highlightsfor each of the five years in the period then ended. These financial statementsand financial highlights are the responsibility of the Fund’s management. Ourresponsibility is to express an opinion on these financial statements andfinancial highlights based on our audits.
We conducted our audits in accordance with auditing standards generallyaccepted in the United States of America. Those standards require that weplan and perform the audit to obtain reasonable assurance about whether thefinancial statements and financial highlights are free of material misstatement.An audit includes examining, on a test basis, evidence supporting the amountsand disclosures in the financial statements. Our procedures includedconfirmation of securities owned as of March 31, 2003 by correspondence withthe custodian and brokers, or by other appropriate auditing procedures wherereplies from brokers were not received. An audit also includes assessing theaccounting principles used and significant estimates made by management, aswell as evaluating the overall financial statement presentation. We believethat our audits provide a reasonable basis for our opinion.
In our opinion, the financial statements and financial highlights referredto above present fairly, in all material respects, the financial position of theTweedy, Browne Global Value Fund, a series of Tweedy, Browne Fund Inc., atMarch 31, 2003, the results of its operations for the year then ended, thechanges in its net assets for each of the two years in the period then ended andthe financial highlights for each of the five years in the period then ended, inconformity with accounting principles generally accepted in the United Statesof America.
Boston, MassachusettsMay 6, 2003
59509_Tweedy AR 3 5/21/03 11:30 AM Page 45
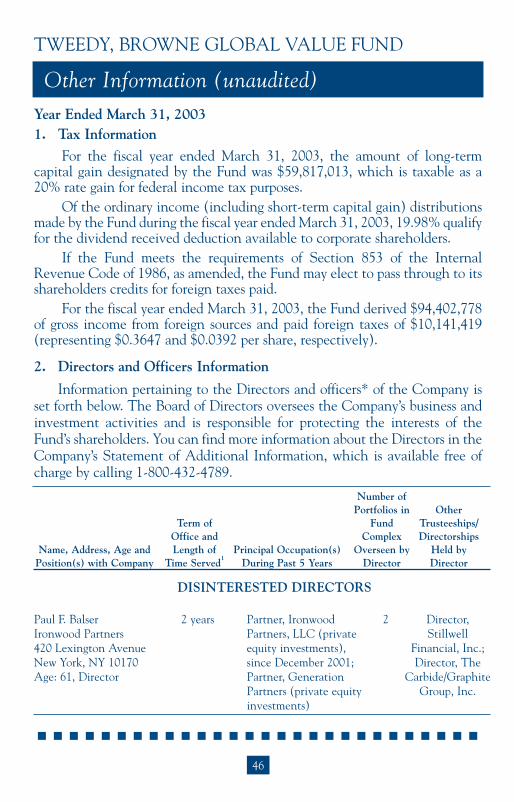
46
Other Information (unaudited)
TWEEDY, BROWNE GLOBAL VALUE FUND
Number ofPortfolios in Other
Term of Fund Trusteeships/ Office and Complex Directorships
Name, Address, Age and Length of Principal Occupation(s) Overseen by Held by Position(s) with Company Time Served
1During Past 5 Years Director Director
DISINTERESTED DIRECTORS
Paul F. Balser 2 years Partner, Ironwood 2 Director,Ironwood Partners Partners, LLC (private Stillwell420 Lexington Avenue equity investments), Financial, Inc.;New York, NY 10170 since December 2001; Director, TheAge: 61, Director Partner, Generation Carbide/Graphite
Partners (private equity Group, Inc.investments)
Year Ended March 31, 20031. Tax Information
For the fiscal year ended March 31, 2003, the amount of long-termcapital gain designated by the Fund was $59,817,013, which is taxable as a20% rate gain for federal income tax purposes.
Of the ordinary income (including short-term capital gain) distributionsmade by the Fund during the fiscal year ended March 31, 2003, 19.98% qualifyfor the dividend received deduction available to corporate shareholders.
If the Fund meets the requirements of Section 853 of the InternalRevenue Code of 1986, as amended, the Fund may elect to pass through to itsshareholders credits for foreign taxes paid.
For the fiscal year ended March 31, 2003, the Fund derived $94,402,778of gross income from foreign sources and paid foreign taxes of $10,141,419(representing $0.3647 and $0.0392 per share, respectively).
2. Directors and Officers Information
Information pertaining to the Directors and officers* of the Company isset forth below. The Board of Directors oversees the Company’s business andinvestment activities and is responsible for protecting the interests of theFund’s shareholders. You can find more information about the Directors in theCompany’s Statement of Additional Information, which is available free ofcharge by calling 1-800-432-4789.
59509_Tweedy AR 3 5/21/03 11:30 AM Page 46

47
Other Information (unaudited)
TWEEDY, BROWNE GLOBAL VALUE FUND
Number ofPortfolios in Other
Term of Fund Trusteeships/ Office and Complex Directorships
Name, Address, Age and Length of Principal Occupation(s) Overseen by Held by Position(s) with Company Time Served
1During Past 5 Years Director Director
DISINTERESTED DIRECTORS (Continued)Bruce A. Beal 10 years Partner and officer, 2 NoneThe Beal Companies The Beal Companies177 Milk Street (real estate developmentBoston, MA 02109 and investment companies);Age: 67, Director Real estate consultant
John C. Hover II Elected Executive Vice President 2 Nonec/o Tweedy, Browne March United States TrustCompany LLC 2003 Company of New York;350 Park Avenue Retired since 1998New York, NY 10022Age: 60, Director
Anthony H. Meyer 5 years Retired since 1987 2 Nonec/o Tweedy, Browne Company LLC 350 Park AvenueNew York, NY 10022Age: 72, Director
Richard B. Salomon 8 years Partner, Salans 2 NoneSalans (law firm)620 Fifth AvenueNew York, NY 10020Age: 55, Director
INTERESTED DIRECTOR2
Christopher H. Browne3 10 years Managing Director 2 Director,Tweedy, Browne Tweedy, Browne AmericanCompany LLC Company LLC Atlantic 350 Park Avenue CompanyNew York, NY 10022Age: 56Chairman and President
59509_Tweedy AR 3 5/21/03 11:30 AM Page 47

48
Other Information (unaudited)
TWEEDY, BROWNE GLOBAL VALUE FUND
Number ofPortfolios in Other
Term of Fund Trusteeships/ Office and Complex Directorships
Name, Address, Age and Length of Principal Occupation(s) Overseen by Held by Position(s) with Company Time Served
1During Past 5 Years Director Director
OFFICERS WHO ARE NOT DIRECTORS
William H. Browne3 10 years Managing Director N/A N/ATweedy, Browne Tweedy, BrowneCompany LLC Company LLC350 Park AvenueNew York, NY 10022Age: 58, Vice President
M. Gervase Rosenberger 10 years Executive Vice N/A N/ATweedy, Browne President,Tweedy, Company LLC Browne Company 350 Park Avenue LLCNew York, NY 10022Age: 52, Chief Operating Officer, Vice President and SecretaryJohn D. Spears 10 years Managing Director N/A N/ATweedy, Browne Tweedy, BrowneCompany LLC Company LLC350 Park AvenueNew York, NY 10022Age: 55, Vice President
Robert Q. Wyckoff, Jr. Elected Managing Director N/A N/ATweedy, Browne December Tweedy, BrowneCompany LLC 2002 Company LLC350 Park AvenueNew York, NY 10022Age: 50, Treasurer
* The term “officer” means the president, vice president, secretary, treasurer, controller or any otherofficer who performs a policy making function.
1 Directors and Officers will serve for an indefinite term until the earliest of their: (i) removal, (ii) resignation or (iii) death.
2 “Interested person” of the Company as defined in the Investment Act of 1940. Mr. Christopher H.Browne is an “interested person” because of his affiliation with Tweedy, Browne Company LLC,which acts as the Company’s investment adviser and distributor.
3 Mr. Christopher Browne and Mr. William Browne are brothers.
59509_Tweedy AR 3 5/21/03 11:30 AM Page 48
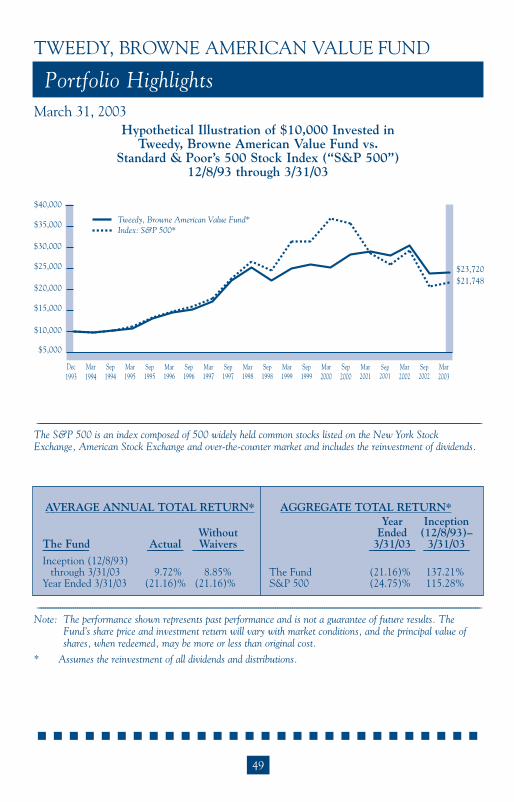
49
Portfolio Highlights
TWEEDY, BROWNE AMERICAN VALUE FUND
March 31, 2003Hypothetical Illustration of $10,000 Invested in
Tweedy, Browne American Value Fund vs. Standard & Poor’s 500 Stock Index (“S&P 500”)
12/8/93 through 3/31/03
________________________________________________________________________________________________________________________________________________________________________________________________________________
The S&P 500 is an index composed of 500 widely held common stocks listed on the New York StockExchange, American Stock Exchange and over-the-counter market and includes the reinvestment of dividends.
$5,000
$10,000
$15,000
$20,000
$30,000
$25,000
$40,000
$35,000 Tweedy, Browne American Value Fund*Index: S&P 500*
$23,720 $21,748
Dec 1993
Mar 1994
Sep 1994
Mar 1995
Sep 1995
Mar 1996
Sep 1996
Mar 1997
Sep 1997
Mar 1998
Sep 1998
Mar 1999
Sep 1999
Mar 2001
Sep 2001
Sep 2002
Mar 2002
Mar 2003
Sep 2000
Mar 2000
________________________________________________________________________________________________________________________________________________________________________________________________________________
Note: The performance shown represents past performance and is not a guarantee of future results. TheFund’s share price and investment return will vary with market conditions, and the principal value ofshares, when redeemed, may be more or less than original cost.
* Assumes the reinvestment of all dividends and distributions.
AVERAGE ANNUAL TOTAL RETURN* AGGREGATE TOTAL RETURN*Year Inception
Without Ended (12/8/93)–The Fund Actual Waivers 3/31/03 3/31/03———————— —————— ————————— ———————— ————————Inception (12/8/93)
through 3/31/03 9.72% 8.85% The Fund (21.16)% 137.21%Year Ended 3/31/03 (21.16)% (21.16)% S&P 500 (24.75)% 115.28%
59509_Tweedy AR 3 5/21/03 11:30 AM Page 49

50
Perspective On Assessing Investment Results
TWEEDY, BROWNE AMERICAN VALUE FUND
March 31, 2003
In accordance with rules and guidelines set out by the Securities andExchange Commission, we have provided a comparison of the historicalinvestment results of Tweedy, Browne American Value Fund to the historicalinvestment results of the most appropriate broad-based securities marketindex, the Standard & Poor’s 500 Stock Index (the “S&P 500”). The S&P500 is an index composed of 500 widely held common stocks listed on theNew York Stock Exchange, American Stock Exchange and over-the-countermarket. However, the historical results of the S&P 500 in large measurerepresent the investment results of stocks that we do not own. Any portfoliowhich does not own exactly the same stocks in exactly the same proportionsas the index to which the particular portfolio is being compared is not likelyto have the same results as the index. The investment behavior of a diversifiedportfolio of undervalued stocks tends to be correlated to the investmentbehavior of a broad index; i.e., when the index is up, probably more than one-half of the stocks in the entire universe of public companies that are includedin the same index will be up, albeit, in greater or lesser percentages than theindex. Similarly, when the index declines, probably more than one half of thestocks in the entire universe of public companies that are included in theindex will be down in greater or lesser percentages than the index. But it isalmost a mathematical truth that “different stocks equal different results.”
Favorable or unfavorable historical investment results in comparison toan index are not necessarily predictive of future comparative investmentresults. In Are Short-Term Performance and Value Investing Mutually Exclusive?,Eugene Shahan analyzed the investment performance of seven moneymanagers, about whom Warren Buffett wrote in his article, The Super Investorsof Graham and Doddsville. Over long periods of time, the seven managerssignificantly outperformed the market as measured by the Dow JonesIndustrial Average (the “DJIA”) or the S&P 500 by between 7.7% and 16.5%annually. (The goal of most institutional money managers is to outperform themarket by 2% to 3%.) However, for periods ranging from 13 years to 28 years,this group of managers underperformed the market between 7.7% and 42% ofthe years. Six of the seven investment managers underperformed the marketbetween 28% and 42% of the years. In today’s environment, they would havelost many of their clients during their periods of underperformance. Longerterm, it would have been the wrong decision to fire any of those moneymanagers. In examining the seven long-term investment records, unfavorable
59509_Tweedy AR 3 5/21/03 11:30 AM Page 50
51
Perspective On Assessing Investment Results
TWEEDY, BROWNE AMERICAN VALUE FUND
investment results as compared to either index did not predict the future favorable comparative investment results which occurred, and favorable investment results in comparison to the DJIA or the S&P 500 were not always followed by future favorable comparative results. Stretches of consecutive annual underperformance ranged from one to six years. Mr. Shahan concluded:
Unfortunately, there is no way to distinguish between a poor three-year stretchfor a manager who will do well over 15 years, from a poor three-year stretch for a manager who will continue to do poorly. Nor is there any reason to believe that a manager who does well from the outset cannot continue to dowell, and consistently.
59509_Tweedy AR 3 5/21/03 11:30 AM Page 51
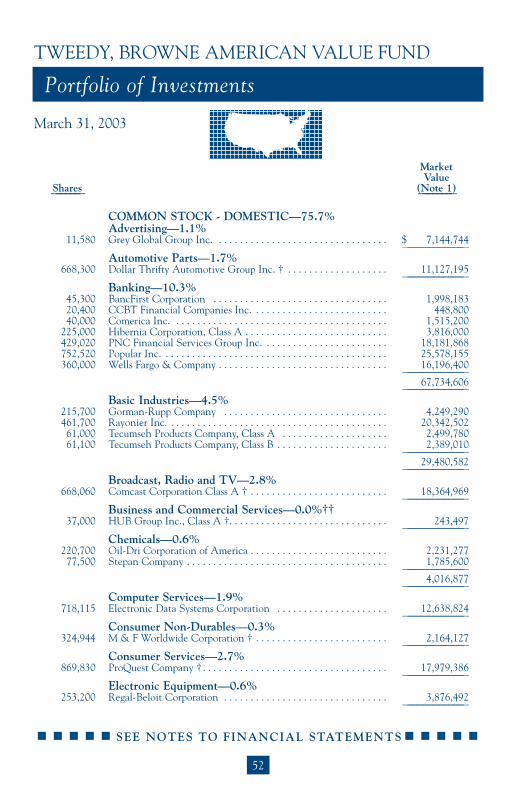
52
SEE NOTES TO FINANCIAL STATEMENTS
March 31, 2003
COMMON STOCK - DOMESTIC—75.7%Advertising—1.1%
11,580 Grey Global Group Inc. . . . . . . . . . . . . . . . . . . . . . . . . . . . . . . . . $ 7,144,744————————————
Automotive Parts—1.7%668,300 Dollar Thrifty Automotive Group Inc. † . . . . . . . . . . . . . . . . . . . 11,127,195
————————————Banking—10.3%
45,300 BancFirst Corporation . . . . . . . . . . . . . . . . . . . . . . . . . . . . . . . . . 1,998,18320,400 CCBT Financial Companies Inc. . . . . . . . . . . . . . . . . . . . . . . . . . 448,80040,000 Comerica Inc. . . . . . . . . . . . . . . . . . . . . . . . . . . . . . . . . . . . . . . . . 1,515,200
225,000 Hibernia Corporation, Class A . . . . . . . . . . . . . . . . . . . . . . . . . . . 3,816,000429,020 PNC Financial Services Group Inc. . . . . . . . . . . . . . . . . . . . . . . . 18,181,868752,520 Popular Inc. . . . . . . . . . . . . . . . . . . . . . . . . . . . . . . . . . . . . . . . . . . 25,578,155360,000 Wells Fargo & Company . . . . . . . . . . . . . . . . . . . . . . . . . . . . . . . . 16,196,400
————————————67,734,606
————————————Basic Industries—4.5%
215,700 Gorman-Rupp Company . . . . . . . . . . . . . . . . . . . . . . . . . . . . . . . 4,249,290461,700 Rayonier Inc. . . . . . . . . . . . . . . . . . . . . . . . . . . . . . . . . . . . . . . . . . 20,342,50261,000 Tecumseh Products Company, Class A . . . . . . . . . . . . . . . . . . . . 2,499,78061,100 Tecumseh Products Company, Class B . . . . . . . . . . . . . . . . . . . . . 2,389,010
————————————29,480,582
————————————Broadcast, Radio and TV—2.8%
668,060 Comcast Corporation Class A † . . . . . . . . . . . . . . . . . . . . . . . . . . 18,364,969————————————
Business and Commercial Services—0.0%††37,000 HUB Group Inc., Class A †. . . . . . . . . . . . . . . . . . . . . . . . . . . . . . 243,497
————————————Chemicals—0.6%
220,700 Oil-Dri Corporation of America . . . . . . . . . . . . . . . . . . . . . . . . . . 2,231,27777,500 Stepan Company . . . . . . . . . . . . . . . . . . . . . . . . . . . . . . . . . . . . . . 1,785,600
————————————4,016,877
————————————Computer Services—1.9%
718,115 Electronic Data Systems Corporation . . . . . . . . . . . . . . . . . . . . . 12,638,824————————————
Consumer Non-Durables—0.3%324,944 M & F Worldwide Corporation † . . . . . . . . . . . . . . . . . . . . . . . . . 2,164,127
————————————Consumer Services—2.7%
869,830 ProQuest Company † . . . . . . . . . . . . . . . . . . . . . . . . . . . . . . . . . . . 17,979,386————————————
Electronic Equipment—0.6%253,200 Regal-Beloit Corporation . . . . . . . . . . . . . . . . . . . . . . . . . . . . . . . 3,876,492
————————————
Portfolio of Investments
TWEEDY, BROWNE AMERICAN VALUE FUND
MarketValue
Shares (Note 1)—————— ———————
59509_Tweedy AR 3 5/21/03 11:30 AM Page 52

53
MarketValue
Shares (Note 1)—————— ———————
SEE NOTES TO FINANCIAL STATEMENTS
COMMON STOCK - DOMESTICFinancial Services—15.9%
754,390 American Express Company . . . . . . . . . . . . . . . . . . . . . . . . . . . . . $ 25,068,380602,400 Credit Acceptance Corporation † . . . . . . . . . . . . . . . . . . . . . . . . . 2,951,760962,500 Federated Investors Inc., Class B . . . . . . . . . . . . . . . . . . . . . . . . . 24,495,625416,215 Freddie Mac . . . . . . . . . . . . . . . . . . . . . . . . . . . . . . . . . . . . . . . . . . 22,101,01741,600 Kent Financial Services Inc. †. . . . . . . . . . . . . . . . . . . . . . . . . . . . 135,616
783,832 MBIA Inc. . . . . . . . . . . . . . . . . . . . . . . . . . . . . . . . . . . . . . . . . . . . 30,287,268————————————
105,039,666————————————
Food and Beverages—0.2%32,320 Coca-Cola Bottling Company . . . . . . . . . . . . . . . . . . . . . . . . . . . 1,612,768
————————————Health Care—1.8%
166,824 Johnson & Johnson . . . . . . . . . . . . . . . . . . . . . . . . . . . . . . . . . . . . 9,654,105423,111 Orthodontic Centers of America, Inc. † . . . . . . . . . . . . . . . . . . . . 2,204,408
————————————11,858,513
————————————Insurance—15.5%
408,900 21st Century Insurance Group Inc. . . . . . . . . . . . . . . . . . . . . . . . 5,070,36077,400 American Indemnity Financial Corporation . . . . . . . . . . . . . . . . 77,400
165,125 American National Insurance Company . . . . . . . . . . . . . . . . . . . 12,868,191463,500 Great American Financial Resources Inc. . . . . . . . . . . . . . . . . . . 7,026,66016,520 Kansas City Life Insurance Company . . . . . . . . . . . . . . . . . . . . . . 706,065
119,000 Leucadia National Corporation . . . . . . . . . . . . . . . . . . . . . . . . . . 4,253,06021,600 Merchants Group Inc. . . . . . . . . . . . . . . . . . . . . . . . . . . . . . . . . . . 475,200
110,000 National Western Life Insurance Company, Class A † . . . . . . . . 10,297,100717,000 Torchmark Corporation . . . . . . . . . . . . . . . . . . . . . . . . . . . . . . . . 25,668,600548,137 Transatlantic Holdings Inc. . . . . . . . . . . . . . . . . . . . . . . . . . . . . . 35,930,380
————————————102,373,016
————————————Metals and Metal Products—0.4%
100,000 Schnitzer Steel Industries Inc., Class A . . . . . . . . . . . . . . . . . . . . 2,424,100————————————
Office Furnishings—1.6%375,440 HON Industries Inc. . . . . . . . . . . . . . . . . . . . . . . . . . . . . . . . . . . . 10,700,040
————————————Pharmaceuticals—8.8%
600,000 Bristol-Myers Squibb Company . . . . . . . . . . . . . . . . . . . . . . . . . . 12,678,000682,167 Pharmacia Corporation, Depository Shares . . . . . . . . . . . . . . . . . 29,537,831892,000 Schering-Plough Corporation . . . . . . . . . . . . . . . . . . . . . . . . . . . . 15,904,360
————————————58,120,191
————————————Printing and Publishing—1.8%
1,531,719 Hollinger International Inc. . . . . . . . . . . . . . . . . . . . . . . . . . . . . . 12,100,580————————————
March 31, 2003
Portfolio of Investments
TWEEDY, BROWNE AMERICAN VALUE FUND
59509_Tweedy AR 3 5/21/03 11:30 AM Page 53

54
SEE NOTES TO FINANCIAL STATEMENTS
MarketValue
Shares (Note 1)—————— ———————
COMMON STOCK - DOMESTICReal Estate—0.5%
108,000 Koger Equity Inc. . . . . . . . . . . . . . . . . . . . . . . . . . . . . . . . . . . . . . $ 1,652,40013,200 Mays (J.W.) Inc. † . . . . . . . . . . . . . . . . . . . . . . . . . . . . . . . . . . . . . 171,60055,225 Ramco-Gershenson Properties Trust . . . . . . . . . . . . . . . . . . . . . . 1,213,293
————————————3,037,293
————————————Retail—0.7%
102,650 EZCORP Inc., Class A † . . . . . . . . . . . . . . . . . . . . . . . . . . . . . . . . 354,14354,500 Friedman’s Inc., Class A . . . . . . . . . . . . . . . . . . . . . . . . . . . . . . . . 523,200
309,960 Syms Corporation † . . . . . . . . . . . . . . . . . . . . . . . . . . . . . . . . . . . . 2,433,186580,073 Value City Department Stores Inc. † . . . . . . . . . . . . . . . . . . . . . . 986,124
————————————4,296,653
————————————Telecommunications—0.6%
93,600 Commonwealth Telephone Enterprises Inc. † . . . . . . . . . . . . . . . 3,633,552————————————
Transportation/Transportation Services—1.4%650,400 GATX Corporation . . . . . . . . . . . . . . . . . . . . . . . . . . . . . . . . . . . . 9,417,792
————————————
TOTAL COMMON STOCK - DOMESTIC(Cost $432,897,535) . . . . . . . . . . . . . . . . . . . . . . . . . . . . . . . . . . 499,385,463
————————————
COMMON STOCK - FOREIGN—17.9%Italy—0.5%
407,000 Natuzzi SPA, Sponsored ADR † . . . . . . . . . . . . . . . . . . . . . . . . . . 3,284,490————————————
Japan—2.3%326,000 Fujitec Company Ltd. . . . . . . . . . . . . . . . . . . . . . . . . . . . . . . . . . . 1,539,552262,500 Fukuda Denshi Company Ltd. . . . . . . . . . . . . . . . . . . . . . . . . . . . 3,386,95486,000 Matsumoto Yushi-Seiyaku Company Ltd. . . . . . . . . . . . . . . . . . . 1,254,681
118,000 Nippon Konpo Unyu Soko Company Ltd. . . . . . . . . . . . . . . . . . 918,48652,000 Nitto FC Company Ltd. . . . . . . . . . . . . . . . . . . . . . . . . . . . . . . . . 180,23323,000 Sanko Sangyo Company Ltd. . . . . . . . . . . . . . . . . . . . . . . . . . . . . 74,287
130,600 Sanyo Shinpan Finance Company Ltd. . . . . . . . . . . . . . . . . . . . . 2,478,07463,800 Shikoku Coca-Cola Bottling Company Ltd. . . . . . . . . . . . . . . . . 539,10988,600 Takefuji Corporation . . . . . . . . . . . . . . . . . . . . . . . . . . . . . . . . . . . 4,221,539
162,000 Torishima Pump Manufacturing Company Ltd. . . . . . . . . . . . . . . 640,732————————————
15,233,647————————————
Mexico—4.2%1,277,502 Panamerican Beverages Inc., Class A . . . . . . . . . . . . . . . . . . . . . . 27,696,243
————————————Netherlands—3.6%
1,180,893 ABN AMRO Holding NV, Sponsored ADR . . . . . . . . . . . . . . . . 17,300,083107,857 Unilever NV, ADR . . . . . . . . . . . . . . . . . . . . . . . . . . . . . . . . . . . . 6,411,020
————————————23,711,103
————————————
March 31, 2003
Portfolio of Investments
TWEEDY, BROWNE AMERICAN VALUE FUND
59509_Tweedy AR 3 5/21/03 11:30 AM Page 54

55
MarketValue
Shares (Note 1)—————— ———————
COMMON STOCK - FOREIGNSwitzerland—2.8%
355,000 Nestle SA, Registered, Sponsored ADR . . . . . . . . . . . . . . . . . . . $ 17,566,53621,332 Novartis AG, ADR . . . . . . . . . . . . . . . . . . . . . . . . . . . . . . . . . . . . 790,5642,310 Syngenta AG, ADR . . . . . . . . . . . . . . . . . . . . . . . . . . . . . . . . . . . 21,137
————————————18,378,237
————————————United Kingdom—4.5%
276,000 Diageo PLC, Sponsored ADR . . . . . . . . . . . . . . . . . . . . . . . . . . . 11,349,120136,274 GlaxoSmithKline PLC, Sponsored ADR . . . . . . . . . . . . . . . . . . . 4,795,482364,000 Unilever PLC, Sponsored ADR . . . . . . . . . . . . . . . . . . . . . . . . . . 13,486,200
————————————29,630,802
————————————
TOTAL COMMON STOCK - FOREIGN(Cost $100,462,520) . . . . . . . . . . . . . . . . . . . . . . . . . . . . . . . . . . 117,934,522
————————————
FaceValue——————
U.S. TREASURY BILLS—0.2%(Cost $1,496,894)
$ 1,500,000 1.311% ** due 5/29/03 . . . . . . . . . . . . . . . . . . . . . . . . . . . . . . . . . 1,497,349————————————
REPURCHASE AGREEMENT—7.1%(Cost $46,949,000)
46,949,000 Agreement with UBS Warburg LLC, 1.300% dated 3/31/03, to be repurchased at $46,950,695 on 4/1/03, collateralized by $28,633,000 U.S. Treasury Bond, 11.250% due 2/15/15 (market value $47,888,693) . . . . . . . . . . . . . . . . . . . . . . . . . . . . . 46,949,000
————————————TOTAL INVESTMENTS (Cost $581,805,949*) . . . . . . . . . . . 100.9% 665,766,334UNREALIZED LOSS ON FORWARD CONTRACTS (Net) (0.6) (4,135,454)OTHER ASSETS AND LIABILITIES (Net) . . . . . . . . . . . . . (0.3) (1,747,192)————— ————————————NET ASSETS . . . . . . . . . . . . . . . . . . . . . . . . . . . . . . . . . . . . . . . . . . . 100.0% $ 659,883,688————— ————————————————— ————————————————————————* Aggregate cost for Federal tax purposes is $581,713,061.
** Rate represents annualized yield at date of purchase.† Non-income producing security.
†† Amount represents less than 0.1% of net assets.
AbbreviationsADR—American Depository Receipt.
March 31, 2003
Portfolio of Investments
TWEEDY, BROWNE AMERICAN VALUE FUND
SEE NOTES TO FINANCIAL STATEMENTS
59509_Tweedy AR 3 5/21/03 11:30 AM Page 55

56
SEE NOTES TO FINANCIAL STATEMENTS
March 31, 2003Contract Market
Value ValueContracts Date (Note 1)———————— ——————— ————————
Schedule of Forward Exchange Contracts
TWEEDY, BROWNE AMERICAN VALUE FUND
FORWARD EXCHANGE CONTRACTS TO BUY4,500,000 European Economic Union Euro . . . . . . . . . . 4/22/03 $ 4,906,562 1,400,000 European Economic Union Euro . . . . . . . . . . 8/8/03 1,520,731
160,000,000 Japanese Yen . . . . . . . . . . . . . . . . . . . . . . . . . 5/6/03 1,351,232 346,000,000 Japanese Yen . . . . . . . . . . . . . . . . . . . . . . . . . 6/13/03 2,926,566 —————————
TOTAL FORWARD EXCHANGE CONTRACTS TO BUY(Contract Amount $10,281,438) . . . . . . . . . . . . . . . . . . . . . . $ 10,705,091——————————————————FORWARD EXCHANGE CONTRACTS TO SELL
4,500,000 European Economic Union Euro . . . . . . . . . . 4/22/03 $ (4,906,562)2,800,000 European Economic Union Euro . . . . . . . . . . 8/8/03 (3,041,462)2,000,000 European Economic Union Euro . . . . . . . . . . 9/2/03 (2,170,763)1,000,000 European Economic Union Euro . . . . . . . . . . 10/27/03 (1,083,556)3,600,000 European Economic Union Euro . . . . . . . . . . 10/31/03 (3,900,327)1,000,000 European Economic Union Euro . . . . . . . . . . 11/12/03 (1,083,030)1,000,000 European Economic Union Euro . . . . . . . . . . 1/8/04 (1,081,227)1,500,000 European Economic Union Euro . . . . . . . . . . 3/26/04 (1,618,603)1,000,000 Great Britain Pound Sterling . . . . . . . . . . . . 4/22/03 (1,578,417)1,450,000 Great Britain Pound Sterling . . . . . . . . . . . . 8/8/03 (2,272,725)
355,000 Great Britain Pound Sterling . . . . . . . . . . . . 10/27/03 (553,753)660,000 Great Britain Pound Sterling . . . . . . . . . . . . 3/26/04 (1,020,663)
6,000,000 Great Britain Pound Sterling . . . . . . . . . . . . 4/2/04 (9,275,894)160,000,000 Japanese Yen . . . . . . . . . . . . . . . . . . . . . . . . . 5/6/03 (1,351,233)600,000,000 Japanese Yen . . . . . . . . . . . . . . . . . . . . . . . . . 6/13/03 (5,074,968)920,000,000 Japanese Yen . . . . . . . . . . . . . . . . . . . . . . . . . 6/24/03 (7,781,963)655,000,000 Japanese Yen . . . . . . . . . . . . . . . . . . . . . . . . . 7/24/03 (5,545,113)12,500,000 Mexican Peso . . . . . . . . . . . . . . . . . . . . . . . . . 11/28/03 (1,101,236)17,500,000 Mexican Peso . . . . . . . . . . . . . . . . . . . . . . . . . 12/9/03 (1,538,311)12,350,000 Swedish Krona . . . . . . . . . . . . . . . . . . . . . . . . 4/22/03 (1,454,496)11,000,000 Swedish Krona . . . . . . . . . . . . . . . . . . . . . . . . 5/5/03 (1,294,402)30,000,000 Swedish Krona . . . . . . . . . . . . . . . . . . . . . . . . 8/8/03 (3,508,372)11,000,000 Swedish Krona . . . . . . . . . . . . . . . . . . . . . . . . 10/23/03 (1,280,513)6,200,000 Swedish Krona . . . . . . . . . . . . . . . . . . . . . . . . 10/27/03 (721,565)
22,600,000 Swedish Krona . . . . . . . . . . . . . . . . . . . . . . . . 3/29/04 (2,605,946)10,000,000 Swedish Krona . . . . . . . . . . . . . . . . . . . . . . . . 4/2/04 (1,152,870)1,650,000 Swiss Franc . . . . . . . . . . . . . . . . . . . . . . . . . . . 4/22/03 (1,221,659)1,000,000 Swiss Franc . . . . . . . . . . . . . . . . . . . . . . . . . . . 5/5/03 (740,663)
700,000 Swiss Franc . . . . . . . . . . . . . . . . . . . . . . . . . . . 6/13/03 (518,975)3,000,000 Swiss Franc . . . . . . . . . . . . . . . . . . . . . . . . . . . 8/8/03 (2,227,072)2,500,000 Swiss Franc . . . . . . . . . . . . . . . . . . . . . . . . . . . 1/16/04 (1,862,250)1,400,000 Swiss Franc . . . . . . . . . . . . . . . . . . . . . . . . . . . 2/13/04 (1,043,428)1,400,000 Swiss Franc . . . . . . . . . . . . . . . . . . . . . . . . . . . 3/26/04 (1,044,289)—————————
TOTAL FORWARD EXCHANGE CONTRACTS TO SELL(Contract Amount $72,097,199) . . . . . . . . . . . . . . . . . . . . . . $ (76,656,306)——————————————————
59509_Tweedy AR 3 5/21/03 11:30 AM Page 56
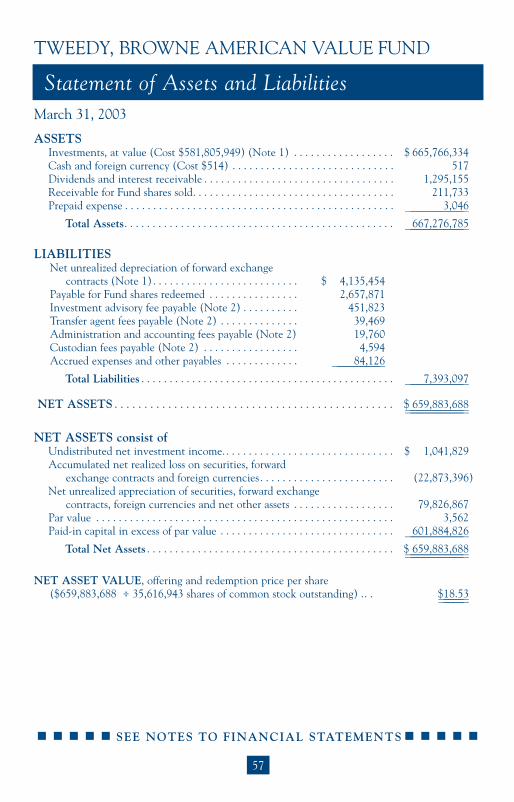
57
SEE NOTES TO FINANCIAL STATEMENTS
March 31, 2003
Statement of Assets and Liabilities
TWEEDY, BROWNE AMERICAN VALUE FUND
ASSETSInvestments, at value (Cost $581,805,949) (Note 1) . . . . . . . . . . . . . . . . . . $ 665,766,334Cash and foreign currency (Cost $514) . . . . . . . . . . . . . . . . . . . . . . . . . . . . . 517Dividends and interest receivable . . . . . . . . . . . . . . . . . . . . . . . . . . . . . . . . . . 1,295,155Receivable for Fund shares sold. . . . . . . . . . . . . . . . . . . . . . . . . . . . . . . . . . . . 211,733Prepaid expense . . . . . . . . . . . . . . . . . . . . . . . . . . . . . . . . . . . . . . . . . . . . . . . . 3,046———————————
Total Assets. . . . . . . . . . . . . . . . . . . . . . . . . . . . . . . . . . . . . . . . . . . . . . . . 667,276,785———————————
LIABILITIESNet unrealized depreciation of forward exchange
contracts (Note 1) . . . . . . . . . . . . . . . . . . . . . . . . . . $ 4,135,454Payable for Fund shares redeemed . . . . . . . . . . . . . . . . 2,657,871Investment advisory fee payable (Note 2) . . . . . . . . . . 451,823Transfer agent fees payable (Note 2) . . . . . . . . . . . . . . 39,469Administration and accounting fees payable (Note 2) 19,760Custodian fees payable (Note 2) . . . . . . . . . . . . . . . . . 4,594Accrued expenses and other payables . . . . . . . . . . . . . 84,126—————————
Total Liabilities . . . . . . . . . . . . . . . . . . . . . . . . . . . . . . . . . . . . . . . . . . . . . 7,393,097———————————
NET ASSETS . . . . . . . . . . . . . . . . . . . . . . . . . . . . . . . . . . . . . . . . . . . . . . . $ 659,883,688——————————————————————
NET ASSETS consist ofUndistributed net investment income. . . . . . . . . . . . . . . . . . . . . . . . . . . . . . . $ 1,041,829Accumulated net realized loss on securities, forward
exchange contracts and foreign currencies. . . . . . . . . . . . . . . . . . . . . . . . (22,873,396)Net unrealized appreciation of securities, forward exchange
contracts, foreign currencies and net other assets . . . . . . . . . . . . . . . . . . 79,826,867Par value . . . . . . . . . . . . . . . . . . . . . . . . . . . . . . . . . . . . . . . . . . . . . . . . . . . . . 3,562Paid-in capital in excess of par value . . . . . . . . . . . . . . . . . . . . . . . . . . . . . . . 601,884,826———————————
Total Net Assets . . . . . . . . . . . . . . . . . . . . . . . . . . . . . . . . . . . . . . . . . . . . $ 659,883,688——————————————————————
NET ASSET VALUE, offering and redemption price per share ($659,883,688 ÷ 35,616,943 shares of common stock outstanding) .. . $18.53——————————
59509_Tweedy AR 3 5/21/03 11:30 AM Page 57

58
SEE NOTES TO FINANCIAL STATEMENTS
Statement of Operations
TWEEDY, BROWNE AMERICAN VALUE FUND
For the Year Ended March 31, 2003
INVESTMENT INCOMEDividends (net of foreign withholding taxes of $39,851) . . . . . . . . . . . . . . $ 14,518,024Interest . . . . . . . . . . . . . . . . . . . . . . . . . . . . . . . . . . . . . . . . . . . . . . . . . . . . . 672,631Securities lending (Note 9) . . . . . . . . . . . . . . . . . . . . . . . . . . . . . . . . . . . . . . 179,421——————————————————————
Total Investment Income . . . . . . . . . . . . . . . . . . . . . . . . . . . . . . . . . . . . 15,370,076——————————————————————EXPENSES
Investment advisory fee (Note 2) . . . . . . . . . . . . . . . . . . . . . . $9,860,575Transfer agent fees (Note 2) . . . . . . . . . . . . . . . . . . . . . . . . . . 316,381Administration and accounting fees (Note 2) . . . . . . . . . . . . 264,119Custodian fees (Note 2) . . . . . . . . . . . . . . . . . . . . . . . . . . . . . 72,203Directors’ fees and expenses (Note 2) . . . . . . . . . . . . . . . . . . 46,051Legal and audit fees . . . . . . . . . . . . . . . . . . . . . . . . . . . . . . . . . 33,310Other . . . . . . . . . . . . . . . . . . . . . . . . . . . . . . . . . . . . . . . . . . . . 153,825————————
Total Expenses . . . . . . . . . . . . . . . . . . . . . . . . . . . . . . . . . . . . . . . . . . . . 10,746,464——————————————————————NET INVESTMENT INCOME . . . . . . . . . . . . . . . . . . . . . . . . . . . . . . . . . . . 4,623,612——————————————————————
REALIZED AND UNREALIZED GAIN(LOSS) ON INVESTMENTS(Notes 1 and 3):
Net realized gain (loss) on:Securities . . . . . . . . . . . . . . . . . . . . . . . . . . . . . . . . . . . . . . . . . . . . . . . . . (13,860,196)Forward exchange contracts . . . . . . . . . . . . . . . . . . . . . . . . . . . . . . . . . . (5,755,664)Foreign currencies and net other assets . . . . . . . . . . . . . . . . . . . . . . . . . 17,244——————————————————————
Net realized loss on investments during the year . . . . . . . . . . . . . . . . . . . . . (19,598,616)——————————————————————Net unrealized appreciation (depreciation) of:
Securities . . . . . . . . . . . . . . . . . . . . . . . . . . . . . . . . . . . . . . . . . . . . . . . . . (176,371,642)Forward exchange contracts . . . . . . . . . . . . . . . . . . . . . . . . . . . . . . . . . . (7,402,863)Foreign currencies and net other assets . . . . . . . . . . . . . . . . . . . . . . . . . 2,271——————————————————————
Net unrealized depreciation of investments during the year . . . . . . . . . . . . (183,772,234)——————————————————————NET REALIZED AND UNREALIZED LOSS ON INVESTMENTS . . . (203,370,850)——————————————————————NET DECREASE IN NET ASSETS RESULTING FROM OPERATIONS . . . . . . . . . . . . . . . . . . . . . . . . . . . . . . . . . . . . . . . . . . . . . . . . . . $(198,747,238)————————————————————————————————————————————
59509_Tweedy AR 3 5/21/03 11:30 AM Page 58

59
SEE NOTES TO FINANCIAL STATEMENTS
Statements of Changes in Net Assets
TWEEDY, BROWNE AMERICAN VALUE FUND
Year YearEnded Ended
3/31/03 3/31/02————————————— —————————————Net investment income . . . . . . . . . . . . . . . . . . . . . . . . . . . . . $ 4,623,612 $ 2,206,773Net realized gain (loss) on securities, forward exchange
contracts and currency transactions during the year. . . . (19,598,616) 24,003,325Net unrealized appreciation (depreciation) of securities,
forward exchange contracts, foreign currencies and net other assets during the year . . . . . . . . . . . . . . . . . . . . (183,772,234) 15,363,769————————————— —————————————
Net increase (decrease) in net assets resulting from operationss . . . . . . . . . . . . . . . . . . . . . . . . . . . . . . . . . . . . (198,747,238) 41,573,867
Distributions:Dividends to shareholders from net investment
income. . . . . . . . . . . . . . . . . . . . . . . . . . . . . . . . . . . . . (3,622,243) (3,090,091)Distributions to shareholders from net realized
gain on investments . . . . . . . . . . . . . . . . . . . . . . . . . . (13,465,313) (34,482,729)Net increase (decrease) in net assets from Fund share
transactions (Note 4) . . . . . . . . . . . . . . . . . . . . . . . . . . . . (95,511,689) 6,825,973————————————— —————————————Net increase (decrease) in net assets . . . . . . . . . . . . . . . . . . . (311,346,483) 10,827,020
NET ASSETSBeginning of year . . . . . . . . . . . . . . . . . . . . . . . . . . . . . . . . . 971,230,171 960,403,151————————————— —————————————End of year (including undistributed net investment
income of $1,041,829 and $33,092, respectively) . . . . . . $ 659,883,688 $ 971,230,171————————————— —————————————————————————— —————————————
59509_Tweedy AR 3 5/21/03 11:31 AM Page 59
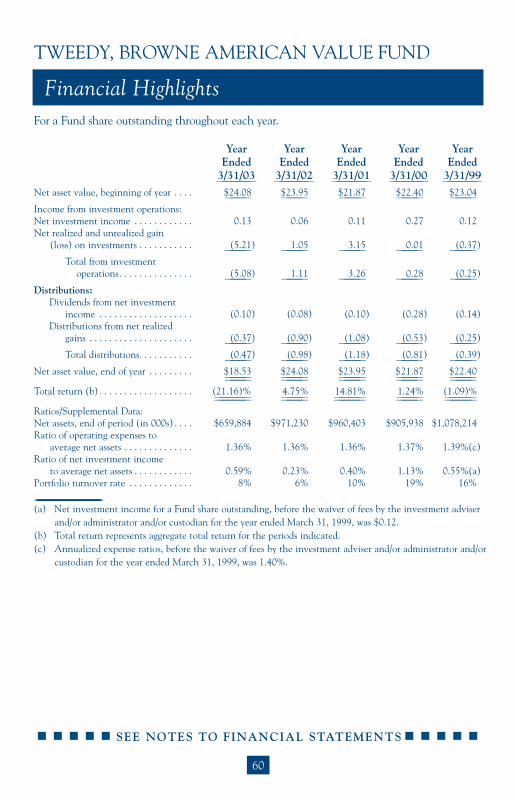
60
SEE NOTES TO FINANCIAL STATEMENTS
Financial Highlights
TWEEDY, BROWNE AMERICAN VALUE FUND
For a Fund share outstanding throughout each year.
Year Year Year Year YearEnded Ended Ended Ended Ended
3/31/03 3/31/02 3/31/01 3/31/00 3/31/99——————— ——————— ——————— ——————— ———————Net asset value, beginning of year . . . . $24.08 $23.95 $21.87 $22.40 $23.04———— ———— ———— ———— ————Income from investment operations:Net investment income . . . . . . . . . . . . 0.13 0.06 0.11 0.27 0.12Net realized and unrealized gain
(loss) on investments . . . . . . . . . . . (5.21) 1.05 3.15 0.01 (0.37)———— ———— ———— ———— ————Total from investment
operations. . . . . . . . . . . . . . . (5.08) 1.11 3.26 0.28 (0.25)———— ———— ———— ———— ————Distributions:
Dividends from net investment income . . . . . . . . . . . . . . . . . . . (0.10) (0.08) (0.10) (0.28) (0.14)
Distributions from net realized gains . . . . . . . . . . . . . . . . . . . . . (0.37) (0.90) (1.08) (0.53) (0.25)———— ———— ———— ———— ————Total distributions. . . . . . . . . . . (0.47) (0.98) (1.18) (0.81) (0.39)———— ———— ———— ———— ————
Net asset value, end of year . . . . . . . . . $18.53 $24.08 $23.95 $21.87 $22.40———— ———— ———— ———— ———————— ———— ———— ———— ————Total return (b) . . . . . . . . . . . . . . . . . . . (21.16)% 4.75% 14.81% 1.24% (1.09)%—————— ———— ————— ———— ——————————— ———— ————— ———— —————Ratios/Supplemental Data:Net assets, end of period (in 000s) . . . . $659,884 $971,230 $960,403 $905,938 $1,078,214Ratio of operating expenses to
average net assets . . . . . . . . . . . . . . 1.36% 1.36% 1.36% 1.37% 1.39%(c)Ratio of net investment income
to average net assets . . . . . . . . . . . . 0.59% 0.23% 0.40% 1.13% 0.55%(a)Portfolio turnover rate . . . . . . . . . . . . . 8% 6% 10% 19% 16%________________________________________________________________________________________________(a) Net investment income for a Fund share outstanding, before the waiver of fees by the investment adviser
and/or administrator and/or custodian for the year ended March 31, 1999, was $0.12.(b) Total return represents aggregate total return for the periods indicated.(c) Annualized expense ratios, before the waiver of fees by the investment adviser and/or administrator and/or
custodian for the year ended March 31, 1999, was 1.40%.
59509_Tweedy AR 3 5/21/03 11:31 AM Page 60

61
Notes to Financial Statements
TWEEDY, BROWNE AMERICAN VALUE FUND
1. Significant Accounting Policies
Tweedy, Browne American Value Fund (the “Fund”) is a diversified seriesof Tweedy, Browne Fund Inc. (the “Company”). The Company is an open-endmanagement investment company registered with the Securities andExchange Commission under the Investment Company Act of 1940, asamended. The Company was organized as a Maryland corporation on January28, 1993. The Fund commenced operations on December 8, 1993. Thepreparation of financial statements in accordance with accounting principlesgenerally accepted in the United States requires management to makeestimates and assumptions that affect the reported amounts and disclosures inthe financial statements. Actual results could differ from those estimates. Thefollowing is a summary of significant accounting policies consistently followedby the Fund in the preparation of its financial statements.
Portfolio Valuation Generally, the Fund’s investments are valued atmarket value or at fair value as determined by or under the direction of theCompany’s Board of Directors. Portfolio securities and other assets, listed on aUS national securities exchange or through any system providing for same daypublication of actual prices (and not subject to restrictions against sale by theFund on such exchange or system) are valued at the last quoted sale price orthe Nasdaq Official Close Price (“NOCP”), when appropriate, prior to theclose of regular trading. Portfolio securities and other assets listed on a foreignexchange or through any system providing for same day publication of actualprices are valued at the last quoted sale price available before the time whenassets are valued. Portfolio securities and other assets for which there are noreported sales on the valuation date are valued at the mean between the lastasked price and the last bid price prior to the close of regular trading. Whenthe Investment Adviser determines that the last sale price prior to valuationor the NOCP does not reflect current market value, the Investment Adviserwill determine the market value of those securities or assets in accordance withindustry practice and other factors considered relevant by the InvestmentAdviser. All other securities and assets for which current market quotationsare not readily available and those securities which are not readily marketabledue to significant legal or contractual restrictions will be valued at fair valueas determined by the Investment Adviser under the direction of the Board ofDirectors. Debt securities purchased with a remaining maturity of 60 days orless are valued at amortized cost, which approximates market value, or by
59509_Tweedy AR 3 5/21/03 11:31 AM Page 61

62
Notes to Financial Statements
TWEEDY, BROWNE AMERICAN VALUE FUND
reference to other factors (i.e., pricing services or dealer quotations) by theInvestment Adviser.
Repurchase Agreements The Fund engages in repurchase agreementtransactions. Under the terms of a typical repurchase agreement, the Fundtakes possession of an underlying debt obligation subject to an obligation ofthe seller to repurchase, and the Fund to resell, the obligation at an agreed-upon price and time, thereby determining the yield during the Fund’s holdingperiod. This arrangement results in a fixed rate of return that is not subject tomarket fluctuations during the Fund’s holding period. The value of thecollateral is at all times at least equal to the total amount of the repurchaseobligations, including interest. In the event of counterparty default, the Fundhas the right to use the collateral to offset losses incurred. There is potentialloss to the Fund in the event the Fund is delayed or prevented from exercisingits rights to dispose of the collateral securities, including the risk of a possibledecline in the value of the underlying securities during the period while theFund seeks to assert its rights. The Fund’s Investment Adviser reviews thevalue of the collateral and the creditworthiness of those banks and dealerswith which the Fund enters into repurchase agreements to evaluate potentialrisks.
Foreign Currency The books and records of the Fund are maintained inUS dollars. Foreign currencies, investments and other assets and liabilities aretranslated into US dollars at the exchange rates prevailing at the end of theperiod, and purchases and sales of investment securities, income and expensesare translated on the respective dates of such transactions. Unrealized gainsand losses which result from changes in foreign currency exchange rates havebeen included in the unrealized appreciation (depreciation) of currencies andnet other assets. Net realized foreign currency gains and losses resulting fromchanges in exchange rates include foreign currency gains and losses betweentrade date and settlement date on investments, securities transactions, foreigncurrency transactions and the difference between the amounts of interest anddividends recorded on the books of the Fund and the amount actuallyreceived. The portion of foreign currency gains and losses related tofluctuation in the exchange rates between the initial purchase trade date andsubsequent sale trade date is included in realized gains and losses oninvestment securities sold.
59509_Tweedy AR 3 5/21/03 11:31 AM Page 62

63
Notes to Financial Statements
TWEEDY, BROWNE AMERICAN VALUE FUND
Forward Exchange Contracts The Fund has entered into forwardexchange contracts for non-trading purposes in order to reduce its exposure tofluctuations in foreign currency exchange on its portfolio holdings. Forwardexchange contracts are valued at the forward rate and are marked-to-marketdaily. The change in market value is recorded by the Fund as an unrealizedgain or loss. When the contract is closed, the Fund records a realized gain orloss equal to the difference between the value of the contract at the time thatit was opened and the value of the contract at the time that it was closed.
The use of forward exchange contracts does not eliminate fluctuations inthe underlying prices of the Fund’s investment securities, but it does establisha rate of exchange that can be achieved in the future. Although forwardexchange contracts limit the risk of loss due to a decline in the value of thehedged currency, they also limit any potential gain that might result shouldthe value of the currency increase. In addition, the Fund could be exposed torisks if the counterparties to the contracts are unable to meet the terms of theircontracts.
Securities Transactions and Investment Income Securities transactionsare recorded as of the trade date. Realized gains and losses from securitiestransactions are recorded on the identified cost basis. Dividend income anddistributions to shareholders are recorded on the ex-dividend date. Interestincome is recorded on the accrual basis. Dividend income and interest incomemay be subject to foreign withholding taxes. The Fund’s custodian applies forrefunds where available.
Tweedy, Browne Company LLC is reimbursed by the Fund for the cost ofsettling transactions in US securities for the Fund through its clearing broker.For the year ended March 31, 2003 the Fund reimbursed Tweedy, BrowneCompany LLC $3,397 for such transaction charges.
Dividends and Distributions to Shareholders Dividends from netinvestment income, if any, and distributions from realized capital gains afterutilization of capital loss carryforwards, if any, will be declared and paidannually. Additional distributions of net investment income and capital gainsfrom the Fund may be made at the discretion of the Board of Directors in orderto avoid the application of a 4% non-deductible Federal excise tax on certainundistributed amounts of ordinary income and capital gains. Income dividends
59509_Tweedy AR 3 5/21/03 11:31 AM Page 63

64
Notes to Financial Statements
TWEEDY, BROWNE AMERICAN VALUE FUND
and capital gain distributions are determined in accordance with income taxregulations which may differ from accounting principles generally accepted inthe United States. These differences are primarily due to differing treatmentsof income and gains on various investment securities held by the Fund, timingdifferences and differing characterization of distributions made by the Fund.
The character of distributions paid on a tax basis during December2002 for fiscal year 2003 and December 2001 for fiscal year 2002 is as follows:
2003 2002Distributions paid from:Investment income $ 3,622,243 $ 3,090,091Short-term capital gain 903,716 10,130,616
——————————————————————————— ————————————————————————————Ordinary income 4,525,959 13,220,707Long-term capital gain 12,561,597 24,352,113
——————————————————————————— ————————————————————————————Total Distributions $17,087,556 $37,572,820
——————————————————————————— ——————————————————————————————————————————————————————— ————————————————————————————
As of March 31, 2003, the components of distributable earnings on a taxbasis were as follows:
Undistributed ordinary income $ 953,223Unrealized appreciation 84,055,206
———————————————————————————Total $85,008,429
——————————————————————————————————————————————————————
Federal Income Taxes The Fund has qualified and intends to continue toqualify as a regulated investment company, if such qualification is in the bestinterest of its shareholders, by complying with the requirements of the InternalRevenue Code of 1986, as amended, applicable to regulated investmentcompanies and by distributing substantially all of its taxable income to itsshareholders. Therefore, no Federal income tax provision is required.
Expenses Expenses directly attributable to each Fund as a diversifiedseries of the Company are charged to that Fund. Other expenses of theCompany are generally allocated to each Fund based on the average net assetsof each Fund.
59509_Tweedy AR 3 5/21/03 11:31 AM Page 64

65
Notes to Financial Statements
TWEEDY, BROWNE AMERICAN VALUE FUND
2. Investment Advisory Fee, Other Related Party Transactions andAdministration Fee
The Company, on behalf of the Fund, has entered into an investmentadvisory agreement (the “Advisory Agreement”) with Tweedy, BrowneCompany LLC (“Tweedy, Browne”). Under the Advisory Agreement, theCompany pays Tweedy, Browne a fee at the annual rate of 1.25% of the valueof its average daily net assets. The fee is payable monthly, provided the Fundwill make such interim payments as may be requested by the InvestmentAdviser not to exceed 75% of the amount of the fee then accrued on thebooks of the Fund and unpaid.
The current and retired managing directors and their families, as well asemployees of Tweedy, Browne, the Investment Adviser to the Fund, haveapproximately $28.9 million, as of March 31, 2003, of their own moneyinvested in the Fund.
The Company, on behalf of the Fund, has entered into an administrationagreement (the “Administration Agreement”) with PFPC Inc. (the“Administrator”), an indirect, majority-owned subsidiary of The PNCFinancial Services Group Inc. Under the Administration Agreement, theCompany pays the Administrator an administration fee and a fund accountingfee computed daily and payable monthly at the following annual rates of thevalue of the average daily net assets of the Fund:
Between Between$500 Million $1 Billion
Up to and and Exceeding$500 Million $1 Billion $4 Billion $4 Billion
Administration Fees 0.06% 0.04% 0.02% 0.015%
Between Between$100 Million $2 Billion
Up to and and Exceeding$100 Million $2 Billion $4 Billion $4 Billion
Accounting Fees 0.03% 0.01% 0.0075% 0.006%
59509_Tweedy AR 3 5/21/03 11:31 AM Page 65

66
Notes to Financial Statements
TWEEDY, BROWNE AMERICAN VALUE FUND
No officer, director or employee of Tweedy, Browne, the Administrator orany parent or subsidiary of those corporations receives any compensation fromthe Company for serving as a director or officer of the Company. TheCompany pays each Non-Interested Director $50,000 annually to be paidquarterly in $12,500 increments plus out-of-pocket expenses for their servicesas directors. The annual fee of $50,000 paid to each Non-Interested Directoris divided proportionately between the Fund and the Tweedy, Browne GlobalValue Fund.
Boston Safe Deposit and Trust Company (“Boston Safe”), an indirect,wholly-owned subsidiary of Mellon Trust, serves as the Fund’s custodianpursuant to a custody agreement (the “Custody Agreement”). PFPC Inc.serves as the Fund’s transfer agent. Tweedy, Browne also serves as thedistributor to the Fund and pays all distribution fees. No distribution fees arepaid by the Fund.
3. Securities Transactions
Cost of purchases and proceeds from sales of investment securities,excluding short-term investments, for the year ended March 31, 2003,aggregated $59,195,473 and $154,772,991, respectively.
At March 31, 2003, the aggregate gross unrealized appreciation for allsecurities, in which there was an excess of value over tax cost, was$169,983,206 and the aggregate gross unrealized depreciation for all securities,in which there was an excess of tax cost over value, was $85,929,933.
4. Capital Stock
The Company is authorized to issue one billion shares of $0.0001 parvalue capital stock, of which 400,000,000 of the unissued shares have beendesignated as shares of the Fund. Changes in shares outstanding for the Fundwere as follows:
59509_Tweedy AR 3 5/21/03 11:31 AM Page 66

67
Notes to Financial Statements
TWEEDY, BROWNE AMERICAN VALUE FUND
Year Ended 3/31/03 Year Ended 3/31/02Shares Amount Shares Amount
Sold 8,688,008 $ 178,689,959 9,109,841 $ 218,526,882Reinvested 825,428 15,889,486 1,478,796 34,529,868 Redeemed (14,234,308) (290,091,134) (10,356,938) (246,230,777)Net Increase
(Decrease) (4,720,872) $ (95,511,689) 231,699 $ 6,825,973
5. Foreign Securities
Investing in securities of foreign companies and foreign governmentsinvolves economic and political risks and considerations not typicallyassociated with investing in US companies and the US Government. Theseconsiderations include changes in exchange rates and exchange rate controls(which may include suspension of the ability to transfer currency from a givencountry), costs incurred in conversions between currencies, non-negotiablebrokerage commissions, less publicly available information, differentaccounting standards, lower trading volume, delayed settlements and greatermarket volatility, the difficulty of enforcing obligations in other countries, lesssecurities regulation, different tax provisions (including withholding ondividends paid to the Fund), war, expropriation, political and social instabilityand diplomatic developments.
6. Line of Credit
The Company and Mellon Trust, N.A. (the “Bank”) entered into a Lineof Credit Agreement (the “Agreement”) which, as amended effectiveSeptember 25, 2002, provides the Company, on behalf of the Fund and theTweedy, Browne Global Value Fund, with a $100 million line of credit (the“Commitment”) primarily for temporary or emergency purposes, including themeeting of redemption requests that might otherwise require the untimelydisposition of securities. The Fund may borrow up to the value of one-third ofits net assets; provided, however, that the total Commitment available to theFund is reduced by borrowings of the Tweedy, Browne Global Value Fund.Interest is payable at the Bank’s money market rate plus 0.75% on anannualized basis. Under the Agreement, the Company pays a facility fee equalto 0.10% annually of the unutilized Commitment. The Agreement requires,among other provisions, the Fund to maintain a ratio of net assets (not
59509_Tweedy AR 3 5/21/03 11:31 AM Page 67

68
Notes to Financial Statements
TWEEDY, BROWNE AMERICAN VALUE FUND
including funds borrowed pursuant to the Agreement) to aggregated amountof indebtedness pursuant to the Agreement of no less than three to one. Forthe year ended March 31, 2003, the Company did not borrow, on behalf of theFund, under the Agreement.
7. Post-October Loss Deferral Disclosure
Certain losses incurred after October 31 within a fund’s fiscal year aredeemed to arise on the first business day of the fund’s following fiscal year. Forthe fiscal year ended March 31, 2003, the Tweedy, Browne American ValueFund incurred and elected to defer $4,285 in currency losses.
8. Capital Loss Carryover Disclosure
As of March 31, 2003, the Fund had a capital loss carryforward for federalincome tax purposes of $27,008,847 expiring on March 31, 2011.
9. Securities Lending
The Fund may lend securities to brokers, dealers and other financialorganizations to earn additional income. Each security out on loan iscollateralized with segregated assets held with the borrower in an amountequal to or greater than the current market value of the loaned securities.
At March 31, 2003, the Fund did not have any securities out on loan anddid not have any segregated assets with the borrower.
59509_Tweedy AR 3 5/21/03 11:31 AM Page 68

69
Report of Ernst & Young LLP, Independent Auditors
TWEEDY, BROWNE AMERICAN VALUE FUND
To the Shareholders and Board of Directors ofTweedy, Browne Fund Inc.
We have audited the accompanying statement of assets and liabilities,including the portfolio of investments and the schedule of forward exchangecontracts, of Tweedy, Browne American Value Fund (the “Fund”) (a series ofTweedy, Browne Fund Inc.) as of March 31, 2003, and the related statementof operations for the year then ended, the statements of changes in net assetsfor each of the two years in the period then ended and the financial highlightsfor each of the five years in the period then ended. These financial statementsand financial highlights are the responsibility of the Fund’s management. Ourresponsibility is to express an opinion on these financial statements andfinancial highlights based on our audits.
We conducted our audits in accordance with auditing standards generallyaccepted in the United States of America. Those standards require that weplan and perform the audit to obtain reasonable assurance about whether thefinancial statements and financial highlights are free of material misstatement.An audit includes examining, on a test basis, evidence supporting the amountsand disclosures in the financial statements. Our procedures includedconfirmation of securities owned as of March 31, 2003 by correspondence withthe custodian and brokers, or by other appropriate auditing procedures wherereplies from brokers were not received. An audit also includes assessing theaccounting principles used and significant estimates made by management, aswell as evaluating the overall financial statement presentation. We believethat our audits provide a reasonable basis for our opinion.
In our opinion, the financial statements and financial highlights referredto above present fairly, in all material respects, the financial position of theTweedy, Browne American Value Fund, a series of Tweedy, Browne Fund Inc.,at March 31, 2003, the results of its operations for the year then ended, thechanges in its net assets for each of the two years in the period then ended andthe financial highlights for each of the five years in the period then ended, inconformity with accounting principles generally accepted in the United Statesof America.
Boston, MassachusettsMay 6, 2003
59509_Tweedy AR 3 5/21/03 11:31 AM Page 69

70
Other Information (unaudited)
TWEEDY, BROWNE AMERICAN VALUE FUND
Number ofPortfolios in Other
Term of Fund Trusteeships/ Office and Complex Directorships
Name, Address, Age and Length of Principal Occupation(s) Overseen by Held by Position(s) with Company Time Served1 During Past 5 Years Director Director
DISINTERESTED DIRECTORSPaul F. Balser 2 years Partner, Ironwood 2 Director,Ironwood Partners Partners, LLC (private Stillwell420 Lexington Avenue equity investments), Financial, Inc.;New York, NY 10170 since December 2001; Director, TheAge: 61, Director Partner, Generation Carbide/Graphite
Partners (private equity Group, Inc.investments)
Bruce A. Beal 10 years Partner and officer, 2 NoneThe Beal Companies The Beal Companies177 Milk Street (real estate developmentBoston, MA 02109 and investment companies);Age: 67, Director Real estate consultantJohn C. Hover II Elected Executive Vice President 2 Nonec/o Tweedy, Browne March United States Trust Company LLC 2003 Company of New York;350 Park Avenue Retired since 1998New York, NY 10022Age: 60, Director.
Year Ended March 31, 20031. Tax Information
For the fiscal year ended March 31, 2003, the amount of long-termcapital gain designated by the Fund was $12,561,597, which is taxable as a20% rate gain for Federal income tax purposes.
Of the ordinary income (including short-term capital gain) distributionsmade by the Fund during the fiscal year ended March 31, 2003, 100% qualifyfor the dividend received deduction available to corporate shareholders.2. Directors and Officers Information
Information pertaining to the Directors and officers* of the Company isset forth below. The Board of Directors oversees the Company’s business andinvestment activities and is responsible for protecting the interests of theFund’s shareholders. You can find more information about the Directors in theCompany’s Statement of Additional Information, which is available free ofcharge by calling 1-800-432-4789.
59509_Tweedy AR 3 5/21/03 11:31 AM Page 70

71
Other Information (unaudited)Number of
Portfolios in OtherTerm of Fund Trusteeships/
Office and Complex DirectorshipsName, Address, Age and Length of Principal Occupation(s) Overseen by Held by
Position(s) with Company Time Served1
During Past 5 Years Director Director
DISINTERESTED DIRECTORS (Continued)
Anthony H. Meyer 5 years Retired since 1987 2 Nonec/o Tweedy, Browne Company LLC 350 Park AvenueNew York, NY 10022Age: 72, DirectorRichard B. Salomon 8 years Partner, Salans 2 NoneSalans (law firm)620 Fifth AvenueNew York, NY 10020Age: 55, Director
INTERESTED DIRECTOR2
Christopher H. Browne3 10 years Managing Director 2 Director,Tweedy, Browne Tweedy, Browne AmericanCompany LLC Company LLC Atlantic350 Park Avenue CompanyNew York, NY 10022Age: 56, Chairman and President
OFFICERS WHO ARE NOT DIRECTORS
William H. Browne3 10 years Managing Director N/A N/ATweedy, Browne Tweedy, Browne Company LLC Company LLC350 Park AvenueNew York, NY 10022Age: 58, Vice President
59509_Tweedy AR 3 5/21/03 11:31 AM Page 71

72
Other Information (unaudited)Number of
Portfolios in OtherTerm of Fund Trusteeships/
Office and Complex DirectorshipsName, Address, Age and Length of Principal Occupation(s) Overseen by Held by
Position(s) with Company Time Served1
During Past 5 Years Director Director
OFFICERS WHO ARE NOT DIRECTORS (Continued)
M. Gervase Rosenberger 10 years Executive Vice N/A N/ATweedy, Browne President, Tweedy, Company LLC Browne Company LLC350 Park AvenueNew York, NY 10022Age: 52, Chief OperatingOfficer, Vice President and Secretary
John D. Spears 10 years Managing Director N/A N/ATweedy, Browne Tweedy, BrowneCompany LLC Company LLC350 Park AvenueNew York, NY 10022Age: 55, Vice President
Robert Q. Wyckoff, Jr. Elected Managing Director N/A N/ATweedy, Browne December Tweedy, BrowneCompany LLC 2002 Company LLC350 Park AvenueNew York, NY 10022Age: 50, Treasurer
* The term “officer” means the president, vice president, secretary, treasurer, controller or any otherofficer who performs a policy making function.
1 Directors and Officers will serve for an indefinite term until the earliest of their: (i) removal, (ii) resignation or (iii) death.
2 “Interested person” of the Company as defined in the Investment Act of 1940. Mr. Christopher H.Browne is an “interested person” because of his affiliation with Tweedy, Browne Company LLC,which acts as the Company’s investment adviser and distributor.
3 Mr. Christopher Browne and Mr. William Browne are brothers.
59509_Tweedy AR 3 5/21/03 11:31 AM Page 72

x

TWEEDY, BROWNE FUND INC.350 Park Avenue, NY, NY 10022
800-432-4789www.tweedy.com
59509_Tweedy AR 3 5/21/03 11:31 AM Page 74