ANNUAL STAKEHOLDER EETING - Pennsylvania PUC · High Bay Lighting Linear Fluorescent High Bay Metal...
27
ANNUAL STAKEHOLDER MEETING Market Potential Study (MPS) Methodology July 10, 2014 Presented by the Statewide Evaluation Team:
Transcript of ANNUAL STAKEHOLDER EETING - Pennsylvania PUC · High Bay Lighting Linear Fluorescent High Bay Metal...

ANNUAL STAKEHOLDER MEETING
Market Potential Study (MPS) Methodology
July 10, 2014
Presented by the Statewide Evaluation Team:

MARKET POTENTIAL STUDY (MPS) INTRODUCTION
• Study commenced in March, 2014• Study scheduled to be complete at the end of 2014
• Public comment period on results in early 2015• Study will include an assessment of energy
efficiency• Demand response study will be conducted separately, with
outcome integrated at the conclusion to both studies• Working Phase II methodology similar to final
methodology used for Phase I study• Will continue to discuss, revise, and refine methodology over next
several months

PLANNED TASKS & SCHEDULE
1) Prepare & Distribute MPS Methodology (Complete)1) Prepare & Distribute MPS Methodology (Complete)
2) Submit MPS Data Request & Collect Data (Complete)2) Submit MPS Data Request & Collect Data (Complete)
3) Develop Disaggregated Baseline Forecast (July)3) Develop Disaggregated Baseline Forecast (July)
4)Draft Measure List (Complete)4)Draft Measure List (Complete)
5) Conduct Measure Savings & Cost Research (September)5) Conduct Measure Savings & Cost Research (September)
6) Determine Technical Potential & Supply Curves (September)
6) Determine Technical Potential & Supply Curves (September)
7) Determine Measure Cost Effectiveness and Economic Potential (October)
7) Determine Measure Cost Effectiveness and Economic Potential (October)
8) Determine Achievable/Program Potential Scenario(s) (October)
8) Determine Achievable/Program Potential Scenario(s) (October)
9) Research DSM Program Spending and Savings Performance (October)
9) Research DSM Program Spending and Savings Performance (October)
10) Prepare Final Report and Appendices (December)10) Prepare Final Report and Appendices (December)

METHODOLOGY OVERVIEWMarket Potential Study Methodology

REQUIRED DATA/DATA SOURCES
Historical & Forecast Load
Historical & Forecast Load Avoided CostsAvoided Costs Line LossesLine Losses
General Modeling
Assumptions
General Modeling
Assumptions
Measure Savings
Measure Savings Measure CostsMeasure Costs Useful LivesUseful Lives
Load Shapes & Coincidence
Factors
Load Shapes & Coincidence
Factors
Baseline Saturation Data
Baseline Saturation Data
Energy Efficient Saturation DataEnergy Efficient Saturation Data
Market Adoption Rates
Market Adoption Rates
Non-Incentive Costs
Non-Incentive Costs
Historical & Forecast Load
---EDC Data Request
Historical & Forecast Load
---EDC Data Request
Avoided Costs---
EDC Data Request
Avoided Costs---
EDC Data Request
Line Losses---
EDC Data Request
Line Losses---
EDC Data Request
General Modeling Assumptions
---EDC Data Request
General Modeling Assumptions
---EDC Data Request
Measure Savings---
PA TRM (2015)
Measure Savings---
PA TRM (2015)
Measure Costs---
2014 Incremental Cost Database Update
Measure Costs---
2014 Incremental Cost Database Update
Useful Lives---
PA TRM (2015)
Useful Lives---
PA TRM (2015)
Load Shapes & Coincidence Factors
---2014 Metering / EDC
Data Request
Load Shapes & Coincidence Factors
---2014 Metering / EDC
Data Request
Baseline Saturation Data
---EDC Data
Request/2014 Baseline
Baseline Saturation Data
---EDC Data
Request/2014 Baseline
Energy Efficient Saturation Data
--2014 Baseline Data
Energy Efficient Saturation Data
--2014 Baseline Data
Market Adoption Rates---
WTP Results / EDC Data
Market Adoption Rates---
WTP Results / EDC Data
Non-Incentive Costs---
EDC Data / Benchmarking
Non-Incentive Costs---
EDC Data / Benchmarking

EDC DATA REQUESTS• High Priority Data Request Items
– EDC Load Forecasts & Line Losses
• Medium Priority Data RequestItems
– Participation Metrics, Saturation Studies, Measure CostData, Load Shapes & Coincidence Factors
• Low Priority Data Request Items– EDC Avoided Energy & Capacity Costs, Inflation Rates,
Discount Rates

MEASURE CHARACTERIZATION - BREAKOUTS
Electric Residential Non-Residential
Building/Home Type
Construction Type(Existing vs. New Construction)
Income Type(Low Income -
Residential Only)
Equipment Status (Replace on Burnout vs.
Retrofit)

C/I SEGMENTATION EXAMPLE (PRELIMINARY)Sector Segment
Mfg: Chemicals & PlasticsMfg: Computers & ElectronicsMfg: FoodMfg: MetalsMfg: PaperMfg: PlasticsMfg: OtherMiningOther Non‐MfgEducationHealthcareGovernment / Public ServiceNon‐profitOther InstitutionalGroceryLodgingOfficeRestaurantRetailWarehouseMisc.
Institutional
Industrial
Commercial
Commercial End UseLinear Fluorescent Lighting T12 T8 HPT8 T5 Lin Fluor Lighting OtherHigh Bay Lighting Linear Fluorescent High Bay Metal Halide High Bay High Pressure Sodium High Bay Mercury Vapor High Bay High Bay Lighting OtherOther Interior Lighting Incandescent CFL Exit Signs Int Lighting OtherStreet Lighting Street Lighting Street Lighting OtherExterior Building Lighting Building Mounted Exterior Parking Garage Pole Mounted Ext Building Lighting OtherSpace Cooling Unitary Split System Room AC Packaged DX Space Cooling Unitary OtherSpace Cooling Central Packaged Central Plant/Chil ler Space Cooling Central OtherSpace Heating Packaged Central Plant Electric resistance Unit Heater Space Heating OtherHeat Pump Air Source Ground/Water Source Ductless Heat Pump OtherRefrigeration Display Case Refrigerator Freezer Central Refrigeration Refrigeration OtherWater Heating Central w Storage Tank Heat Pump Heat Recovery Self‐Contained Water Heating OtherCooking Oven Range Steamer Fryer Cooking OtherPlug Load Computer Appliance Office Equip Plug Load OtherMotors Ventilation Space Cooling Water Pump Space Heating Water Pump Water Heating Water Pump Motors OtherOther Other Other
Equipment Types
Indusial End UseHVAC Central HVAC Improvements Unitary HVAC ImprovementsMotors Motors: Motor Improvements Motor O&MLighting High Bay Linear Fluorescent Task LightingFans Fans: Motor ImprovementsPumps Pumps: Motor ImprovementsProcess Heating Process Heat Improvements Process Heat O&MProcess Cooling Process Cool Improvements Process Cooling O&MProcess Air Compressor Process Air: Air Comp Improvements Process Air: Motor ImprovementsProcess Refrigeration Process Refrig: Motor Improvements Process Refrigeration O&MProcess Other Other Improvements Process Other O&M Process Air O&MOther Bldg Improvements
Equipment Types

FORECAST DISAGGREGATION (EXAMPLE)
• Forecast disaggregated end-uses and segments into the future, considering:– Expected growth
and decay– Codes and
standards
RESIDENTIAL FORECAST CALIBRATION• Calibrate Energy Modeling Results to Total Residential
Forecast Load– Develop Housing Prototypes based on 2014 Baseline Study Results– Use end-use energy consumption model outputs– Use EDC-specific end-use saturation data from baseline study
• Ex: Total # of homes * Total % of homes w/ central cooling * central cooling end-useconsumption estimate = Total Residential Cooling Load
– Compare sum of all end-use loads to total residential forecast
• Calibration checks currently underway– Using both REM/Rate & BeOpt to compare results
• Complete all EDCs in July– Share individual EDC results, housing prototype characteristics, and end-use
saturation assumptions for individual EDC review and comment

DRAFT MEASURE LISTS• Includes all measures included in the draft 2015 PA TRM• Includes “universe” of possible energy-efficiency measures for
all sectors• ‘Emerging’ Technologies included
• Ex: Smart Thermostats, Showerstart, • Extensive research on measure parameters across study
horizon• Code baseline update• Measure costs• Measure Life
• Additional emphasis on lighting measures due to market diversity and traditionally large share of DSM savings

LED REPLACEMENT BULB PRICE FORECAST
• Current available sources include:DOE MYPP, EIA TechnologyForecast Updates (Navigant),NEEP RLS, IMS Research
• Reviewing A19 (standard) andPAR38 (reflector) bulbs
• Will also recognize increasedefficacy; reduced LED wattagesover time
• MPS will recognize expected decrease in LEDreplacement bulbs costs over time

TYPES OF DSM POTENTIAL
Not TechnicallyFeasible Technical Potential
Not Technically Feasible
Not Cost Effective Economic Potential
Not Technically Feasible
Not Cost Effective
Market & Adoption Barriers
Achievable Potential
Not Technically Feasible
Not Cost Effective
Market & Adoption Barriers
Program Design, Budget & Time Constraints
Program Potential

GENERAL MODELING APPROACH
Technical Potential of
Efficient Measure
Total # of Households (or Sq. Ft. by
Bus. Type) by EDC
Base Case Equip.
End-Use Intensity
[kWh/unit]
Saturation Share
Remaining Factor
Applicability Factor
Savings Factor
Where:Base Case Equipment End Use Intensity = the electricity used per customer per year by each base-case technology in each market segment. This is the consumption of the electrical energy using equipment that the efficient technology replaces or affects. Saturation Share = the fraction of the end use electrical energy that is applicable for the efficient technology in a given market segment. For example, for residential water heating, this would be the fraction of all residential electric customers that have electric water heating in their household.Remaining Factor = the fraction of equipment that is not considered to already be energy efficient. To extend the example above, the fraction of electric water heaters that are not already energy efficient.Applicability Factor = the fraction of the applicable units that is technically feasible for conversion to the efficient technology from an engineering perspective (e.g., it may not be possible to install CFLs in all light sockets in a home because the CFLs may not fit in every socket.)Savings Factor = the percentage reduction in electricity consumption resulting from application of the efficient technology.

DETERMINING COST-EFFECTIVENESS
Lifetime Economic Benefit (NPV)
Total Cost (NPV)
Benefits and Costs Associated with the Five Standard Cost-Effectiveness Tests Associated with DSM
TRC Test: As defined by the PA PUC in the latest TRC Order

ACHIEVABLE & PROGRAM POTENTIAL
• Achievable Potential• Scenario #1 will base achievable potential on paying incentives equal to 100%
of measure incremental costs• Scenario #2 will base achievable potential scenario on EDCs paying incentive
levels (as a % of incremental measure costs) comparable to those in effect during Program Years 4 and 5, generally 25% to 50% of the measure incremental costs
• Achievable Potential takes into account the natural replacement cycle of equipment
• Program Potential• Funding levels of 2% of 2006 utility electric revenues (this is the funding cap
specified in Act 129 legislation). • Account for specific sub-sector “set-asides” for the low-income and GNI
sectors. • A second program potential scenario will be defined as we move closer to the
achievable/potential analysis phase
DSM PROGRAM PERFORMANCE RESEARCH
• PA SWE does not generate specific, typicalDSM program models for estimating programspending or savings performance– Program design is the responsibility of the EDCs.
• PA SWE researches– PA EDC historical performance
• Program Budgets/Achieved Savings
– 2014-2016 Utility DSM Program Plans• Projected Program Budgets / Projected MWh Savings• Limited by Publicly available data

EDC PERFORMANCE BENCHMARKING• Preliminary Findings: Annual Incremental Savings (as %
of 1st Yr Sales)*
*Data compiled from EDC Annual Reports
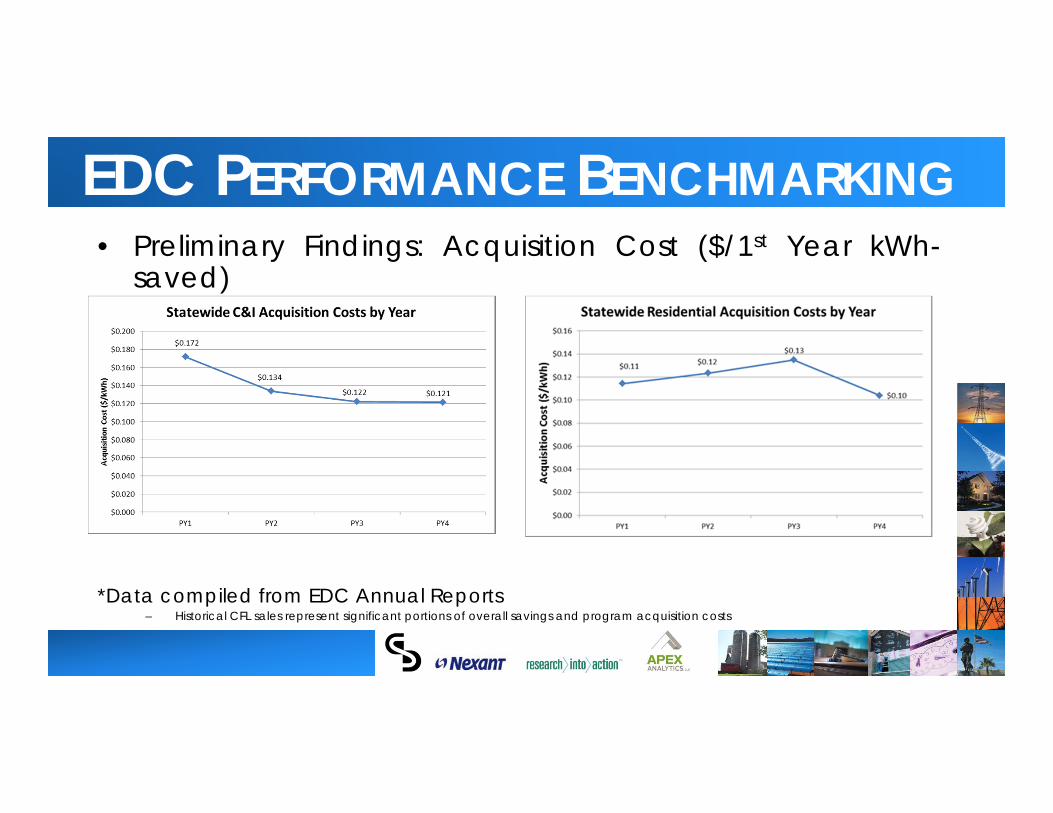
EDC PERFORMANCE BENCHMARKING• Preliminary Findings: Acquisition Cost ($/1st Year kWh-
saved)
*Data compiled from EDC Annual Reports– Historical CFL sales represent significant portions of overall savings and program acquisition costs

OTHER STATE/UTILITY BENCHMARKS• Total Program Administrator Cost / First Year MWh
Saved– Based on 2009-2011 data in LBNL DSM Project Impacts Database.– Cost of Saved Energy based on gross savings at the meter level. Costs do not
include performance incentives and participant costs.
Sector First Year CSE ($/MWh)Commercial & Industrial $188
Residential $116
Low Income $569
Cross Sector/Other $120
NATIONAL $162
The Program Administrator Cost of Saved Energy for Utility Customer-Funded Energy Efficiency Programs. LBNL. March 2014
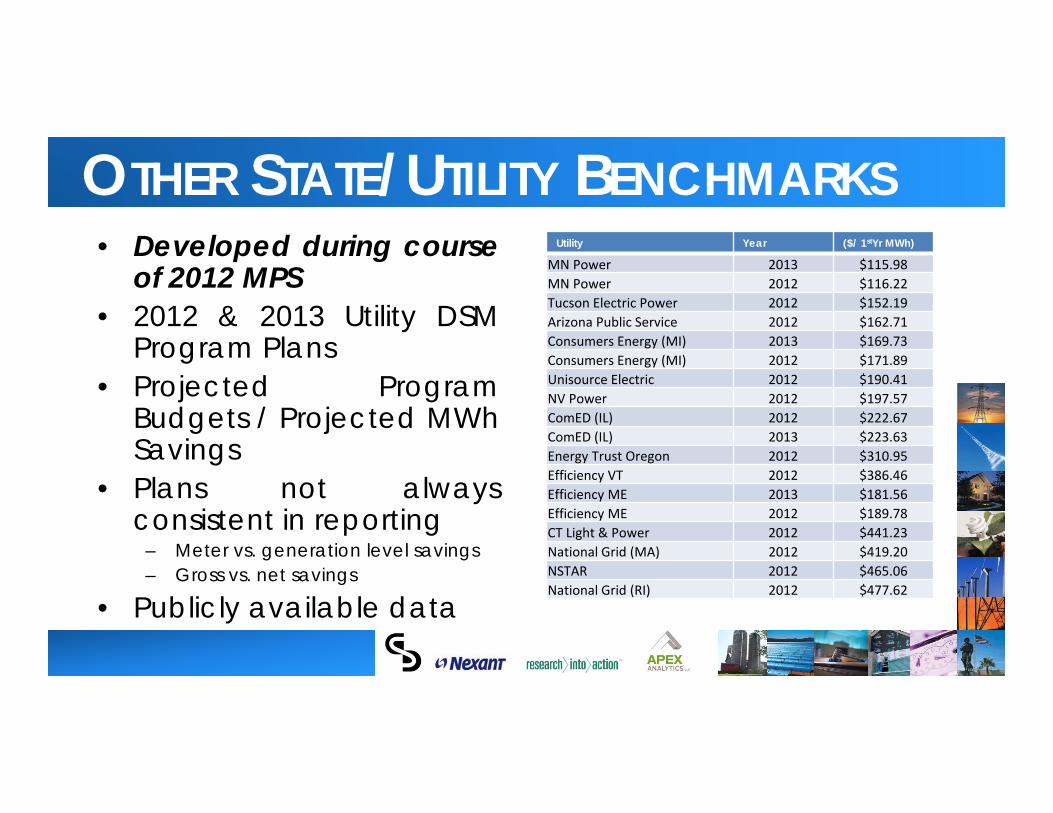
OTHER STATE/UTILITY BENCHMARKS• Developed during course
of 2012 MPS• 2012 & 2013 Utility DSM
Program Plans• Projected Program
Budgets / Projected MWhSavings
• Plans not alwaysconsistent in reporting
– Meter vs. generation level savings– Gross vs. net savings
• Publicly available data
Utility Year ($/ 1stYr MWh)
MN Power 2013 $115.98 MN Power 2012 $116.22 Tucson Electric Power 2012 $152.19 Arizona Public Service 2012 $162.71 Consumers Energy (MI) 2013 $169.73 Consumers Energy (MI) 2012 $171.89 Unisource Electric 2012 $190.41 NV Power 2012 $197.57 ComED (IL) 2012 $222.67 ComED (IL) 2013 $223.63 Energy Trust Oregon 2012 $310.95 Efficiency VT 2012 $386.46 Efficiency ME 2013 $181.56 Efficiency ME 2012 $189.78 CT Light & Power 2012 $441.23 National Grid (MA) 2012 $419.20 NSTAR 2012 $465.06 National Grid (RI) 2012 $477.62

OTHER STATE/UTILITY BENCHMARKS• Updated Data
Gathering for MPS– Still underway
• 2014-2016 Utility DSMProgram Plans
• Plans not alwaysconsistent in reporting
– Meter vs. generation level savings– Gross vs. net savings
Utility Year ($/ 1stYr MWh)
MN Power 2016 $149.36 MN Power 2015 $145.90 MN Power 2014 $141.34 Tucson Electric Power 2015 $114.15 Tucson Electric Power 2014 $114.15 Consumers Energy (MI) 2015 $173.67 Consumers Energy (MI) 2014 $175.54 NV Power 2015 $243.04 NV Power 2014 $228.14 ComED (IL) 2016 $250.72 ComED (IL) 2015 $243.21 ComED (IL) 2014 $234.87 AEP‐OHIO 2016 $194.05 AEP‐OHIO 2015 $192.07 Efficiency ME 2016 $301.42 Efficiency ME 2015 $303.02 Efficiency ME 2014 $306.08 CT Light & Power 2015 $464.09 CT Light & Power 2014 $472.78 National Grid (MA) 2015 $362.85 National Grid (MA) 2014 $373.22
MODEL OUTPUTS
• Technical, Economic, and Achievable Potential– By Measure, End-Use, Building Type
• Energy, Demand, and Gas Impacts by Measure– Incremental Annual– Cumulative Annual
• Installed Units for Each Measure– Incremental / Cumulative Annual
• Installed Cost by Measure– Incentives– Participant Share
• Non-Incentive Costs by Program/Sector

MODEL OUTPUTS (EXAMPLE – PRIOR STUDY)

MODEL OUTPUTS (POTENTIAL SEGMENTATION)
Residential56%
Non-Residential
44%

MODEL OUTPUTS (RESIDENTIAL POTENTIAL EXAMPLE)
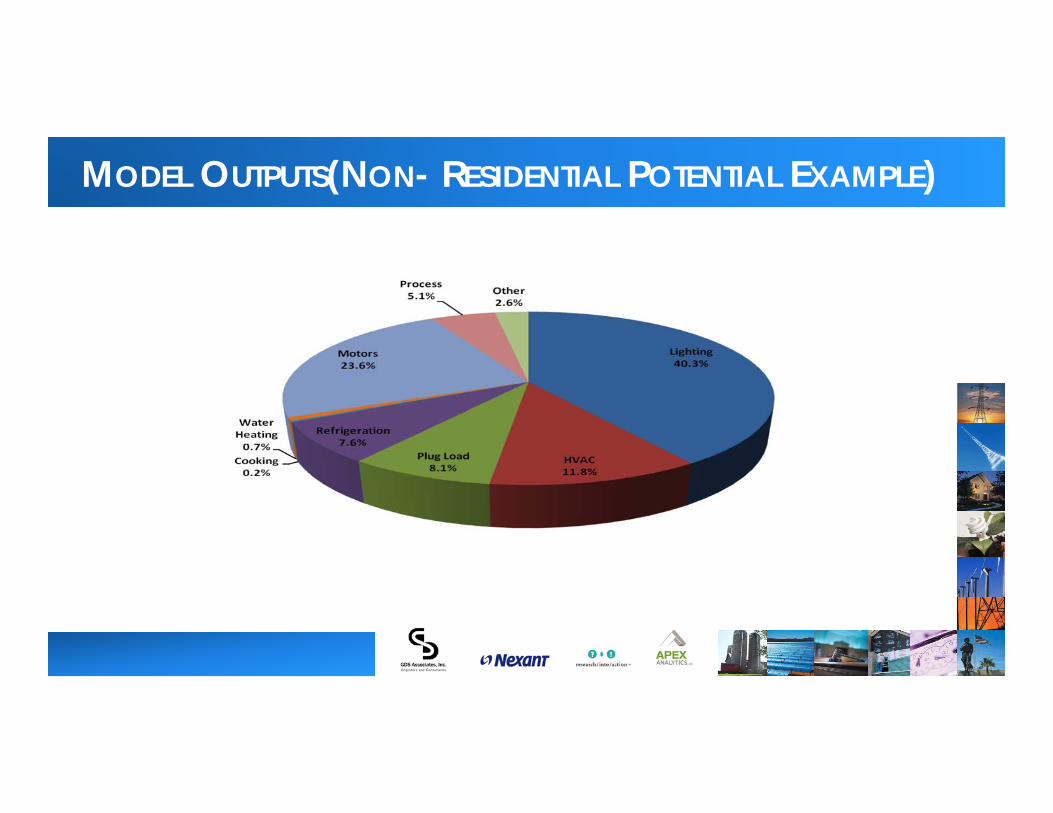
MODEL OUTPUTS(NON- RESIDENTIAL POTENTIAL EXAMPLE)