神経内科Clinical Questions & Pearls運動ニューロン疾患Ⅴ Ⅵ栄養管理,経管栄養 リハビリテーション・ 代替コミュニケーション Ⅶ呼吸管理,緩和ケア

Annual Securities Report
for the fiscal year ended March 31, 2018
(the 111th Business Term)
Panasonic Corporation

[Cover]
Filed Document: Annual Securities Report ("Yukashoken Hokokusho") Applicable Law: Article 24, Paragraph 1 of the Financial Instruments and Exchange Act
of Japan Filed to: Director, Kanto Local Finance Bureau Filing Date: June 29, 2018 Fiscal Year: The 111th Business Term (from April 1, 2017 to March 31, 2018) Company Name: Panasonic Kabushiki Kaisha Company Name in English: Panasonic Corporation Position and Name of Representative:
Kazuhiro Tsuga, Representative Director, President
Address of Head Office: 1006, Oaza Kadoma, Kadoma-shi, Osaka, Japan Phone Number: 06-6908-1121 Contact Person: Seiichirou Igaki, General Manager, Financial and Accounting
Department Contact Address: Panasonic Tokyo Shiodome building, 5-1, Higashi-shimbashi 1-chome,
Minato-ku, Tokyo, Japan Phone Number: 03-3437-1121 Contact Person: Hayato Sakamoto, in charge of Government and External Relations,
Financial and Accounting Department Place Where the Filed Document is Available for Public Inspection:
Panasonic Corporation (Panasonic Tokyo Shiodome building, 5-1, Higashi-shimbashi 1-chome, Minato-ku, Tokyo) Tokyo Stock Exchange, Inc. (2-1, Nihombashi Kabuto-cho, Chuo-ku, Tokyo) Nagoya Stock Exchange, Inc. (8-20, Sakae 3-chome, Naka-ku, Nagoya)
Certain References and Information This is an English translation of the Annual Securities Report ("Yukashoken Hokokusho") submitted to the Director of the Kanto Local Finance Bureau via Electronic Disclosure for Investors' Network ("EDINET") on June 29, 2018, pursuant to the Financial Instruments and Exchange Act of Japan. In this document, "fiscal 2018" refers to the year ended March 31, 2018. All information contained in this document is as of March 31, 2018 or for fiscal 2018, unless otherwise indicated.

Disclaimer Regarding Forward-Looking Statements This report includes forward-looking statements (that include those within the meaning of Section 27A of the U.S. Securities Act of 1933, as amended, and Section 21E of the U.S. Securities Exchange Act of 1934, as amended) about Panasonic and its Group companies (the Panasonic Group). To the extent that statements in this report do not relate to historical or current facts, they constitute forward-looking statements. These forward-looking statements are based on the current assumptions and beliefs of the Panasonic Group in light of the information currently available to it, and involve known and unknown risks, uncertainties and other factors. Such risks, uncertainties and other factors may cause the Panasonic Group's actual results, performance, achievements or financial position to be materially different from any future results, performance, achievements or financial position expressed or implied by these forward-looking statements. Panasonic undertakes no obligation to publicly update any forward-looking statements after the date of this report. Investors are advised to consult any further disclosures by Panasonic in its subsequent filings under the Financial Instrument and Exchange Act of Japan (the FIEA) and other publicly disclosed documents. The risks, uncertainties and other factors referred to above include, but are not limited to, economic conditions, particularly consumer spending and corporate capital expenditures in the Americas, Europe, Japan, China and other Asian countries; volatility in demand for electronic equipment and components from business and industrial customers, as well as consumers in many product and geographical markets; the possibility that excessive currency rate fluctuations of the U.S. dollar, the euro, the Chinese yuan and other currencies against the yen may adversely affect costs and prices of Panasonic’s products and services and certain other transactions that are denominated in these foreign currencies; the possibility of the Panasonic Group incurring additional costs of raising funds, because of changes in the fund raising environment; the possibility of the Panasonic Group not being able to respond to rapid technological changes and changing consumer preferences with timely and cost-effective introductions of new products in markets that are highly competitive in terms of both price and technology; the possibility of not achieving expected results or incurring unexpected losses in connection with the alliances or mergers and acquisitions; the possibility of not being able to achieve its business objectives through joint ventures and other collaborative agreements with other companies, including due to the pressure of price reduction exceeding that which can be achieved by its effort and decrease in demand for products from business partners which Panasonic highly depends on in BtoB business areas; the possibility of the Panasonic Group not being able to maintain competitive strength in many product and geographical areas; the possibility of incurring expenses resulting from any defects in products or services of the Panasonic Group; the possibility that the Panasonic Group may face intellectual property infringement claims by third parties; current and potential, direct and indirect restrictions imposed by other countries over trade, manufacturing, labor and operations; fluctuations in market prices of securities and other financial assets in which the Panasonic Group has holdings or changes in valuation of non-financial assets, including property, plant and equipment, goodwill and deferred tax assets; future changes or revisions to accounting policies or accounting rules; the possibility of incurring expenses resulting from a leakage of customers’ or confidential information from Panasonic Group systems due to unauthorized access or a detection of vulnerability of network-connected products of the Panasonic Group; as well as natural disasters including earthquakes, prevalence of infectious diseases throughout the world, disruption of supply chain and other events that may negatively impact business activities of the Panasonic Group. The factors listed above are not all-inclusive and further information is contained in the most recent English translated version of Panasonic’s securities reports under the FIEA and any other documents which are disclosed on its website.

Contents
PartⅠ Information on Panasonic Group 1 Ⅰ Overview of Panasonic Group 1 1. Key Financial Data (Consolidated) 1 2. History 3 3. Description of Business 6 4. Information on Affiliates 8 5. Employees 11 Ⅱ Business Overview 12 1. Management Policy, Business Environment and Challenges of Panasonic Group 12 2. Risk Factors 15 3. Analyses of Consolidated Financial Position, Operating Results and Cash Flows 21 4. Material Agreements, etc. 27 5. Research and Development 29 Ⅲ Property, Plants and Equipment 31 1. Summary of Capital Investment 31 2. Major Property, Plants and Equipment 32 3. Plans for Capital Investment, Disposals of Property, Plants and Equipment, etc. 36 Ⅳ Information on the Company 37 1. Information on the Company's Stock, etc. 37 (1) Total number of shares, etc. 37 (2) Information on the stock acquisition rights, etc. 38 (3) Information on moving strike convertible bonds, etc. 46 (4) Changes in the total number of issued shares and the amount of common stock, etc. 46 (5) Composition of Issued Shares by Type of Shareholders 46 (6) Major shareholders 47 (7) Information on voting rights 48 2. Information on Acquisition of Treasury Stock, etc. 50 3. Dividend Policy 51 4. Stock Prices 51 5. Member of the Board of Directors and Audit & Supervisory Board Members 52 6. Corporate Governance, etc. 62
Ⅴ Consolidated Financial Statements 78
Ⅵ Stock-related Administration for the Company 157
Ⅶ Reference Information on the Company 158
PartⅡ Information on Guarantors, etc. for the Company 160
(Translation) Independent Auditor's Report on the Financial Statements and Internal Control Over Financial Reporting
161
【Confirmation Letter】 164
【Internal Control Report】 166

Part Ⅰ Information on Panasonic Group
Ⅰ Overview of Panasonic Group
1. Key Financial Data (Consolidated) (Millions of yen, unless otherwise stated)
IFRS
Fiscal year Transition date 109th business term
110th business term
111th business term
Year end April 1, 2015 March 2016 March 2017 March 2018 Net sales - 7,626,306 7,343,707 7,982,164 Profit before income taxes - 227,529 275,066 378,590 Net profit attributable to Panasonic
Corporation stockholders - 165,212 149,360 236,040
Comprehensive income (loss) attributable to Panasonic Corporation stockholders
- (54,617) 174,892 292,381
Total Panasonic Corporation stockholders’ equity
1,535,518 1,444,442 1,571,889 1,707,551
Total equity 1,759,446 1,647,233 1,759,935 1,882,285 Total assets 5,820,789 5,488,024 5,982,961 6,291,148 Panasonic Corporation stockholders’ equity
per share (yen) 664.36 622.34 673.93 732.12
Earnings per share attributable to Panasonic Corporation stockholders, basic (yen)
- 71.30 64.33 101.20
Earnings per share attributable to Panasonic Corporation stockholders, diluted (yen)
- 71.29 64.31 101.15
Total Panasonic Corporation stockholders’ equity to total assets ratio (%)
26.4 26.3 26.3 27.1
Return on equity (%) - 11.1 9.9 14.4 Price earnings ratio (times) - 14.50 19.56 15.03 Net cash provided by operating activities - 419,355 385,410 423,182 Net cash used in investing activities - (293,804) (420,156) (458,828) Net cash provided by (used in) financing
activities - (309,565) 294,598 (128,763)
Cash and cash equivalents at end of year 1,279,943 1,012,666 1,270,787 1,089,585 Number of employees (persons) 257,216 252,923 257,533 274,143
(Notes) 1. The Company’s consolidated financial statements are prepared in conformity with International Financial
Reporting Standards (IFRS) since the 110th business term. 2. Net sales do not include consumption tax, etc.
- 1 -

(Millions of yen, unless otherwise stated) U.S.GAAP
Fiscal year 107th business term
108th business term
109th business term
Year end March 2014 March 2015 March 2016 Net sales 7,736,541 7,715,037 7,553,717 Income before income taxes 206,225 182,456 217,048 Net income attributable to Panasonic
Corporation 120,442 179,485 193,256
Comprehensive income (loss) attributable to Panasonic Corporation
296,972 437,933 (81,821)
Total Panasonic Corporation shareholders’ equity
1,548,152 1,823,293 1,705,056
Total equity 1,586,438 1,992,552 1,854,314 Total assets 5,212,994 5,956,947 5,596,982 Panasonic Corporation shareholders’ equity
per share (yen) 669.74 788.87 734.62
Net income attributable to Panasonic Corporation common shareholders per share, basic (yen)
52.10 77.65 83.40
Net income attributable to Panasonic Corporation common shareholders per share, diluted (yen)
- 77.64 83.39
Total Panasonic Corporation shareholders’ equity to total assets ratio (%)
29.7 30.6 30.5
Return on equity (%) 8.6 10.6 11.0 Price earnings ratio (times) 22.51 20.31 12.39 Net cash provided by operating activities 581,950 491,463 398,680 Net cash provided by (used in) investing
activities 12,128 (138,008) (274,274)
Net cash provided by (used in) financing activities
(532,315) 257,615 (308,031)
Cash and cash equivalents at end of year 592,467 1,280,408 1,014,264 Number of employees (persons) 271,789 254,084 249,520
(Notes) 1. The Company’s consolidated financial statements were prepared in conformity with U.S. generally accepted
accounting principles (U.S. GAAP) until the 109th business term. 2. Net sales do not include consumption tax, etc. 3. Diluted net income, attributable to Panasonic Corporation common shareholders per share for 107th business
term, have been omitted because the Company did not have potentially dilutive common shares that were outstanding for the period.
- 2 -

2. History
Month/Year Events
March, 1918 Konosuke Matsushita founded Matsushita Denkikigu Seisakusho at Ohiraki-cho, Fukushima-ku, Osaka and started to manufacture wiring instrument.
March, 1923 Bullet-shaped bicycle lamp developed and marketed. April, 1927 Established "National" brand. May, 1933 Relocated new head office and factory in Kadoma.
Instituted divisional system. August, 1935 Established Matsushita Electric Trading Co., Ltd. December, 1935 Incorporated as Matsushita Electric Industrial Co., Ltd. on December 15, 1935 (10
million yen in capital). May, 1949 Listed on Tokyo Stock Exchange and Osaka Securities Exchange. September, 1951 Listed on Nagoya Stock Exchange. January, 1952 Formed a capital alliance with Nakagawa Kikai Kabushiki Kaisha (subsequently
renamed Matsushita Refrigeration Company). December, 1952 Established Matsushita Electronics Corporation through a technology alliance with
Philips in Netherlands, and transferred four lamp manufacturing factories to this establishment.
May, 1953 Established the Central Research Laboratory. February, 1954 Formed a capital alliance with Victor Company of Japan Ltd. (JVC). December, 1955 Established Kyushu Matsushita Electric Co., Ltd. (subsequently renamed Panasonic
Communications Co., Ltd.). May, 1956 Established Osaka Denki Seiki Kabushiki Kaisha (subsequently renamed Matsushita
Seiko Co., Ltd.). January, 1958 Established Matsushita Communication Industrial Co., Ltd. (subsequently renamed
Panasonic Mobile Communications Co., Ltd.), and transferred communication equipment manufacturing section to this establishment.
September, 1959 Established Matsushita Electric Corporation of America (currently Panasonic Corporation of North America). (Since then, established manufacturing and sales sites at various locations in the world.)
January, 1961 Masaharu Matsushita became President of the Company. August, 1962 Formed a capital alliance with Toho Denki Kabushiki Kaisha (subsequently renamed
Matsushita Graphic Communication Systems, Inc.). November, 1969 Established Matsushita Kotobuki Electronics Industries, Ltd. (subsequently Panasonic
Healthcare Co., Ltd.). December, 1971 Listed on New York Stock Exchange. December, 1975 Issued U.S. dollar-denominated convertible bonds (100 million U.S. dollars at face
value). January, 1976 Established Matsushita Electronic Components Co., Ltd. (subsequently renamed
Panasonic Electronic Devices Co., Ltd.), and transferred electronic device manufacturing section to this establishment.
January, 1977 Established Matsushita Household Equipment Co., Ltd., and transferred household equipment manufacturing section to this establishment. Established Matsushita Industrial Equipment Co., Ltd. (subsequently renamed Matsushita Industrial Information Equipment Co., Ltd.), and transferred industrial equipment manufacturing section to this establishment.
February, 1977 Toshihiko Yamashita became President of the Company. January, 1979 Established Matsushita Battery Industrial Co., Ltd., and transferred battery
manufacturing section to this establishment. July, 1985 Established a finance subsidiary in U.S.
(In May, 1986, established two finance subsidiaries in Europe.) October, 1985 Established Semiconductor Fundamental Research Laboratory.
- 3 -

Month/Year Events
February, 1986 Akio Tanii became President of the Company. March, 1987 Changed the fiscal year end from November 20 to March 31. April, 1988 Absorbed Matsushita Electric Trading Co., Ltd. April, 1989 The Company's founder Konosuke Matsushita passed away. December, 1990 Acquired MCA INC. (MCA), a leading entertainment company (subsequently renamed
Universal Studios). February, 1993 Yoichi Morishita became President of the Company. May, 1993 Dissolved partnership with Philips regarding Matsushita Electronics Corporation and
purchased all shares of Matsushita Electronics Corporation which Philips held. April, 1995 Absorbed Matsushita Household Equipment Co., Ltd. June, 1995 Sold 80% equity interest in MCA shares, which a subsidiary of the Company in U.S.
held, to Seagram Company Ltd. (subsequently renamed Vivendi Universal S.A.). February, 1999 Cancelled 50 million shares of treasury stock by 98.8 billion yen of retained earnings
decided by resolution of 91st Ordinary General Meeting of Shareholders. April, 2000 Made Matsushita Refrigeration Company into a wholly-owned subsidiary through share
-exchange. June, 2000 Kunio Nakamura became President of the Company. April, 2001 Absorbed Matsushita Electronics Corporation. April, 2002 Established a joint venture liquid crystal display panel manufacturing company,
Toshiba Matsushita Display Technology Co., Ltd. with Toshiba Corporation. October, 2002 Made Matsushita Communication Industrial Co., Ltd., Kyushu Matsushita Electric Co.,
Ltd., Matsushita Seiko Co., Ltd. (currently Panasonic Ecology Systems Co., Ltd.), Matsushita Kotobuki Electronics Industries, Ltd. and Matsushita Graphic Communication Systems, Inc. into wholly-owned subsidiaries through share-exchanges.
January, 2003 Instituted business domain system through business restructuring. Kyushu Matsushita Electric Co., Ltd. was merged with Matsushita Graphic Communication Systems, Inc.
April, 2003 Established a joint venture cathode ray tubes manufacturing company, Matsushita Toshiba Picture Display Co., Ltd. (currently MT Picture Display Co., Ltd.) with Toshiba Corporation. Made Matsushita Electronic Components Co., Ltd. and Matsushita Battery Industrial Co., Ltd. into wholly-owned subsidiaries through share-exchanges. Created a unified global brand, "Panasonic."
April, 2004 Made Matsushita Electric Works, Ltd. (subsequently renamed Panasonic Electric Works Co., Ltd. (PEW)), PanaHome Corporation (subsequently into a wholly-owned subsidiary in fiscal 2018 and renamed Panasonic Homes Co., Ltd. in April 2018.) and their subsidiaries into consolidated subsidiaries of the Company through additional purchase of shares of Matsushita Electric Works, Ltd.
April, 2005 Absorbed Matsushita Industrial Information Equipment Co., Ltd. February, 2006 Sold the remaining shares of affiliated company of Universal Studios (formerly MCA),
which a subsidiary of the Company in U.S. held, to Vivendi Universal. June, 2006 Fumio Ohtsubo became President of the Company. March, 2007 Made Matsushita Toshiba Picture Display Co., Ltd. into a wholly-owned subsidiary. August, 2007 Excluded JVC and its subsidiaries from consolidated subsidiaries of the Company due
to JVC's issuance of new shares and third party allotments. As a result, JVC became an associated company accounted for under the equity method. (Subsequently, in January, 2011, JVC was excluded from an associated company accounted for under the equity method)
April, 2008 Absorbed Matsushita Refrigeration Company.
- 4 -

Month/Year Events
October, 2008 The Company changed its name from Matsushita Electric Industrial Co., Ltd. to Panasonic Corporation. Absorbed Matsushita Battery Industrial Co., Ltd.
April, 2009 Sold all the shares of Toshiba Matsushita Display Technology Co., Ltd., which the Company held, to Toshiba Corporation.
December, 2009 Acquired majority of the voting rights in SANYO Electric Co., Ltd. (SANYO) and made SANYO and its subsidiaries into consolidated subsidiaries of the Company.
January, 2010 Transferred the business of System Solutions Company, the Company's internal division company, to Panasonic Communications Co., Ltd., which was at the same time renamed Panasonic System Networks Co., Ltd.
April, 2011 Made PEW and SANYO into wholly-owned subsidiaries through share-exchanges. January, 2012 Absorbed PEW.
Reorganized domain system to 9 domains and 1 marketing section through business restructuring.
April, 2012 Absorbed companies including Panasonic Electronic Devices Co., Ltd. June, 2012 Kazuhiro Tsuga became President of the Company. October, 2012 Established the Corporate Strategy Head Office. March, 2013 Panasonic System Solutions Japan Co., Ltd. absorbed companies including Panasonic
System Networks Co., Ltd., and was at the same time renamed Panasonic System Networks Co., Ltd. (Subsequently, in April 2017, renamed as Panasonic System Solutions Japan Co., Ltd. due to partial reorganization.)
April, 2013 Transformed to new basic group formation through business division system from business domain system. Absorbed Panasonic Mobile Communications Co., Ltd. subsequent to carrying out the incorporation-type company split of mobile phone terminal business and transferring mobile phone base station business to Panasonic System Networks Co., Ltd. in the company split. Delisted from New York Stock Exchange.
March, 2014 Transferred all the shares and other related assets of Panasonic Healthcare Co., Ltd. to PHC Holdings Co., Ltd. and subscribed 20% of shares of PHC Holdings Co., Ltd.
June, 2014 Transferred semiconductor business to Panasonic Semiconductor Solutions Co., Ltd. in the company split.
- 5 -

3. Description of Business
The Panasonic Group is comprised primarily of the parent Panasonic Corporation and 591 consolidated subsidiaries in and outside of Japan, operating in close cooperation with each other. As a comprehensive electronics manufacturer, Panasonic is engaged in development, production, sales and service activities in a broad array of business areas.
The Company supplies a full spectrum of electric/electronic equipment and related products, which is categorized in the following five segments: Appliances, Eco Solutions, Connected Solutions, Automotive & Industrial Systems, and Other. For further details about each segment, please refer to "Ⅴ. Consolidated Financial Statements, Note 4."
The Company's consolidated financial statements have been prepared in conformity with IFRS, and the scopes of affiliates are also disclosed based on the definition of those accounting principles. The same applies to "Ⅱ. Business Overview" and "Ⅲ. Property, Plants and Equipment."
- 6 -

(Panasonic Group) As of March 31, 2018
*1 AVC Networks segment was renamed as Connected Solutions segment on April 1, 2017. *2 Each business was transferred among segments on April 1, 2017. *3 Each company was renamed on April 1, 2017. *4 The Company made Ficosa International, S.A., supplier of automotive mirrors, its consolidated subsidiary in April 2017.
- 7 -

4. Information on Affiliates
(1) Principal Consolidated Subsidiaries As of March 31, 2018
Name Location in Japan
Common stock (millions of yen)
Principal businesses (Note 2)
Ratio of voting rights
(%) (Note 1)
Relationship
Remark Interlocking directorate,
etc. (Note 3)
Advances to
Business transaction
PanaHome Corporation Toyonaka- shi, Osaka
28,375 Other 100.0
Sale of Panasonic products and purchase of materials
Note 4 Note 9
Panasonic Smart Factory Solutions Co., Ltd.
Kadoma-shi, Osaka
15,000 Connected Solutions 100.0 Manufacture of Panasonic products
Note 10
Panasonic Ecology Systems Co., Ltd.
Kasugai-shi, Aichi
12,092 Eco Solutions 100.0 Manufacture of Panasonic products
KMEW Co., Ltd. Chuo-ku, Osaka-shi
8,000 Eco Solutions 50.0 Sale of Panasonic products
Note 6
Panasonic Consumer Marketing Co., Ltd.
Chuo-ku, Osaka-shi
1,000 Appliances 100.0 Sale of Panasonic products
Note 4
Panasonic Liquid Crystal Display Co., Ltd.
Himeji-shi, Hyogo
500 Automotive & Industrial Systems
100.0 Yes Manufacture of Panasonic products
Note 5
SANYO Electric Co., Ltd. Daito-shi,
Osaka 400
Eco Solutions, Automotive & Industrial Systems, Other, Corporate
100.0 (0.0)
Yes
Manufacture and sale of Panasonic products and supply of materials and merchandise
Note 5
Panasonic Semiconductor Solutions Co., Ltd.
Nagaokakyo -shi, Kyoto
400 Automotive & Industrial Systems
100.0 Yes Yes Manufacture of Panasonic products
Note 5
Panasonic System Solutions Japan Co., Ltd.
Hakata-ku, Fukuoka-shi
350 Connected Solutions 100.0
Manufacture and sale of Panasonic products and provision of IT services
Note 10
- 8 -

Name Location Common stock
(millions) Principal businesses
(Note 2)
Ratio of voting rights
(%) (Note 1)
Relationship
Remark Interlocking directorate,
etc. (Note 3)
Advances to
Business transaction
Panasonic Corporation of North America
New Jersey, U.S.A.
US$ 537
Appliances, Eco Solutions, Connected Solutions, Automotive & Industrial Systems, Other, Corporate
100.0 (100.0)
Yes
Manufacture and sale of Panasonic products and management service to Panasonic affiliates
Note 4
Panasonic Avionics Corporation
California, U.S.A.
US$ 22 Connected Solutions 100.0
(100.0)
Manufacture and sale of Panasonic products
Hussmann Corporation Missouri,
U.S.A US$ ー Appliances
100.0 (100.0)
Manufacture and sale of Panasonic products
Note 8
Panasonic do Brasil Limitada
Amazonas, Brazil
BRL 1,018
Appliances, Connected Solutions, Automotive & Industrial Systems
100.0 Manufacture and sale of Panasonic products
Note 4
Panasonic Europe Ltd. Berkshire,
U.K. Stg£ 200 Corporate
100.0 (100.0)
Management service to Panasonic affiliates
Note 4
Ficosa International S.A. Barcelona,
Spain EUR 32
Automotive & Industrial Systems
69.0 (69.0)
Manufacture and sale of Panasonic products
Panasonic AVC Networks Czech s.r.o.
Plzen, Czech
Republic KC 2,414 Appliances
100.0 (100.0)
Manufacture and sale of Panasonic products
Panasonic Holding (Netherlands) B.V.
Amsterdam,Netherlands
US$ 0.2 Corporate 100.0 Yes
Control of investment and financing and management service of Panasonic oversea subsidiaries
Note 4
Panasonic Asia Pacific Pte. Ltd.
Singapore US$ 1,478
Appliances, Eco Solutions, Connected Solutions, Automotive & Industrial Systems, Corporate
100.0 (100.0)
Manufacture and sale of Panasonic products and management service to Panasonic affiliates
Note 4
Panasonic India Pvt. Ltd. Gurugram,
India INR 18,305
Appliances, Connected Solutions, Automotive & Industrial Systems
100.0 (100.0)
Manufacture and sale of Panasonic products
Note 4
Panasonic Taiwan Co., Ltd.
New Taipei, Taiwan
NT$ 3,422
Appliances, Eco Solutions, Automotive & Industrial Systems, Corporate
69.8 Manufacture and sale of Panasonic products
Panasonic Corporation of China
Beijing, China
RMB 8,381 Appliances, Eco Solutions, Connected Solutions, Corporate
100.0
Sale of Panasonic products and management service to Panasonic affiliates
Note 4
Panasonic Appliances Air-Conditioning (Guangzhou) Co., Ltd.
Guangzhou, China
RMB 282 Appliances 67.8
(67.8)
Manufacture of Panasonic products
Panasonic Automotive Systems Dalian Co., Ltd.
Dalian, China
RMB 94 Automotive & Industrial Systems
60.0 (60.0)
Manufacture of Panasonic products
- 9 -

(2) Principal Companies under the Equity Method (As of March 31, 2018)
Name Location Common stock
(millions of yen) Principal businesses
Ratio of voting rights
(%) (Note 1)
Relationship
Remark Interlocking directorate,
etc. (Note 3)
Advances to
Business transaction
Panasonic Healthcare Holdings Co., Ltd.
Minato-ku, Tokyo
31,334 Manufacture and sale of healthcare products
20.0 Yes
Manufacture and sale of Panasonic products through subsidiaries
Socionext Inc. Kohoku-ku, Yokohama-
shi 30,200
Design, development, and sale of system LSI
20.0
Design, development, and sale of Panasonic products
Sumitomo Mitsui Trust Panasonic Finance Co., Ltd.
Minato-ku, Tokyo
25,584 Total financial services
15.1 Lease and credit sale of Panasonic products
Note 7
(Notes) 1. A number in the parenthesis represents the ratio of indirect voting rights, which is a part of the ratio of voting
rights. 2. The column "Principal businesses" indicates the segment in which the subsidiaries are classified. For
subsidiaries that do not belong to any segment, the segments handling the products are described if it is a sales company, and "Corporate" is described otherwise.
3. Regarding the interlocking directorate, etc., other than what is disclosed above, the Company's employees concurrently hold position of directors or officers in the most of the consolidated subsidiaries or companies under the equity method.
4. Subsidiaries that meet the criteria of the specified subsidiaries or "Tokutei Kogaisya" defined in Cabinet Office Ordinance on Disclosure of Corporate Affairs, etc. of Japan.
5. Subsidiaries with insolvency The amounts of liabilities in excess of assets as of March 31, 2018 are shown below:
Panasonic Liquid Crystal Display Co., Ltd. 545,899 million yen SANYO Electric Co., Ltd. Panasonic Semiconductor Solutions Co., Ltd.
510,856 million yen 49,302 million yen
6. Although the ratio of voting rights is 50.0%, KMEW Co., Ltd. is treated as a consolidated subsidiary because the Company controls it by involving in its manufacturing and sale activities.
7. Although the ratio of voting rights is 15.1%, Sumitomo Mitsui Trust Panasonic Finance Co., Ltd. is treated as a company under the equity method because the Company holds significant influence over its decision on operating and financial policies.
8. Common stock of Hussmann Corporation is zero as registered. 9. PanaHome Corporation became a wholly owned subsidiary in the fiscal year ended March 31, 2018 and
changed its name into Panasonic Homes Co., Ltd effective on April 1, 2018. 10. Subsidiaries that changed their name in the fiscal year ended March 31, 2018.
. New name Former name
Panasonic Smart Factory Solutions Co., Ltd. Panasonic Factory Solutions Co., Ltd.
Panasonic System Solutions Japan Co., Ltd. Panasonic System Networks Co., Ltd.
There is no consolidated subsidiary in the list above, of which sales amount, excluding internal transactions, exceeds 10% of the Company's consolidated sales.
- 10 -

5. Employees
(1) Consolidated basis As of March 31, 2018
Segment Number of employees
Appliances 64,037
Eco Solutions 51,095
Connected Solutions 31,549
Automotive & Industrial Systems 102,414
Other 22,639
Corporate 2,409
Total 274,143 (Notes) 1. The number of employees refers solely to full-time employees of the Company on a consolidated basis. 2. The number of employees increased by 16,610, compared with the end of last fiscal year.
(2) Parent-alone basis As of March 31, 2018
Number of employees Average age Average tenure (years) Average annual salary (yen)
61,311 45.6 22.9 7,680,506
Segment Number of employees Appliances 13,178 Eco Solutions 12,846 Connected Solutions 9,711 Automotive & Industrial Systems 21,771 Other 1,396 Corporate 2,409
Total 61,311 (Notes) 1. The number of employees refers solely to full-time employees of the parent company. 2. Average annual salary includes bonuses and extra wages.
(3) Relationship with labor union
The total number of union members of the federation of Panasonic group labor union is 91,076 as of March 31, 2018, and most of the labor unions belong to the Japanese Electrical Electronic & Information Union except some labor unions. The followings are main labor unions which belong to federation of Panasonic group labor union.
Panasonic Appliances labor union (Belongs to the Japanese Electrical Electronic & Information Union) Panasonic Eco Solutions labor union (Belongs to the Japanese Electrical Electronic & Information Union) Panasonic Connected Solutions labor union (Belongs to the Japanese Electrical Electronic & Information Union) Panasonic Industrial Devices labor union (Belongs to the Japanese Electrical Electronic & Information Union)
The relationship between management and labor unions is quite stable and smooth.
- 11 -

Ⅱ Business Overview
1. Management Policy, Business Environment and Challenges of Panasonic Group
Future expectations included in this section are as of June 29, 2018, the filing date of this annual securities report.
(1) Basic Management Policy Panasonic aims at offering "A Better Life, A Better World" for each customer – a brand slogan that embodies the founding philosophy to contribute to the progress and development of society and the well-being of people worldwide through its business activities.
(2) Management Strategy and Challenges of Panasonic Group 1) Main initiatives for fiscal 2019 Panasonic had set targets of operating profit and net profit attributable to Panasonic Corporation stockholders as its management targets for fiscal 2019. To meet these targets and achieve sustainable growth into the future, in fiscal 2018, Panasonic promoted its growth strategies aiming at sustainable sales and profit increase. More specifically, on April 1, the Company established a new Divisional Company, named the Connected Solutions Company, as a result of re-organizing the former AVC Networks Company and developed a customer-oriented structure for the business that will play a central role in the growth of the group-wide B2B business. Furthermore, the Company took on initiatives that included implementing capital investment related to automotive lithium-ion batteries, as well as undertaking investment related to mergers and acquisitions in part by making PanaHome Corporation a wholly-owned subsidiary, and Spanish automotive parts and systems supplier Ficosa International S.A. a consolidated subsidiary. The Company’s initiatives including the above resulted in increases in both sales and profit in fiscal 2018. In the management environment for fiscal 2019, moderate recovery of the overall global economy is expected to continue, despite uncertainties due to factors such as geopolitical risks, economic conditions in emerging countries, as well as politics and policies in various countries. In Japan, whereas consumption shows a weak recovery, the rate of economic growth is expected to decline as upward momentum previously fueled by public investment stemming from economic measures subsides. Accordingly, in fiscal 2019, Panasonic will promote its strategies for sustainable growth while further clarifying the areas where it will concentrate its management resources.
2) Major initiatives in each segment Appliances
In its Consumer Electronics business, Panasonic aims to generate sustainable increases in sales and profit. To that end, the Company will forge ahead in making investment concentrated in the air conditioner business and the small & built-in business involving personal-care products, cooking appliances and other such merchandise, both of the businesses hold promise of growth, and will also focus efforts on the high-growth markets of Asia, and China in particular. Meanwhile, the Company will make further progress in shifting authority overseas, with the aim of providing products that are better tailored to the demands of local customers. The Company will step up to the challenge of designing and creating new aspirations by more swiftly spurring the evolution of consumer electronics that are equipped with IoT, actively drawing on technologies and knowledge from beyond the Company.
Eco Solutions Premised on its aim of expanding the notion of "A Better Life" to homes, communities and society overall, Panasonic will engage in business that improves people’s everyday lives and brings them greater comfort in that regard. In its space innovation business, the Company will provide new forms of value with respect to spaces in a manner unique to Panasonic, drawing on the Group’s comprehensive strengths, in addition to the Company’s operations involving electrical construction materials and housing materials. Moreover, the Company is forging ahead in construction business and other areas of lifestyle innovation business by strengthening its housing prime contracting business and its urban development business.
- 12 -

Connected Solutions As a technology partner of its corporate customers, Panasonic aims to facilitate business growth of such customers by helping them heighten productivity of their on-site operations and continue to create value. More specifically, the Company will leverage its know-how amassed in the manufacturing industry as well as its robotics technologies in helping to innovate processes for making, transporting and selling products with respect to customers who are encountering challenges such as increasingly diverse and sophisticated consumer needs along with shortages of labor. The Company will also create new forms of value that extend across customer value chains in part by facilitating tasks of matching supply and demand, and bringing about improvements in supply chain traceability.
Automotive & Industrial Systems Panasonic will work to strengthen its management foundations that underpin rapid growth, while promoting its "selection and concentration" strategy from an earnings perspective. In the Automotive Business, the Company will achieve growth in earnings by placing focus on in-vehicle infotainment (IVI), cockpit, advanced driver assistance systems (ADAS) and products such as rechargers that support the shift to electric vehicles. In the Energy Business, automotive batteries will drive business growth, amid further efforts to promote alliances with vehicle manufacturers. In the Industrial Business, the Company will pursue high profitability by further concentrating efforts on devices that underpin areas of high growth potential within the automotive and industrial businesses, particularly in terms of the shift to vehicle electrification, autonomous driving, and labor-saving, as well as IT infrastructures.
3) Foundations toward sustainable growth Corporate Governance
Panasonic continues to strengthen its corporate governance system and improve its effectiveness, as the Company recognizes it as a key foundation to enhance its mid-to-long term corporate value. Effective April 1, 2018, the Company revised its Corporate Advisor System and transitioned to a new governance system. Executive Advisors and Special Corporate Advisors had previously served as board members of foundations, incorporated associations and the like. Under the new system, individuals who had served as Chairman or President will be appointed Special Corporate Advisors and fulfill these roles for external organizations. Executive Advisors will not be appointed. Special Corporate Advisors will serve part-time without compensation. Their term of office will not be renewed after they reach the age of 80.
Environment Looking toward the "Environmental Vision 2050" which was formulated with the aim of helping to bring about a sustainable society, the Panasonic Group will promote efforts that involve reducing energy used by Panasonic, while generating energy in excess of such amounts consumed, by developing products, technologies and solutions relating to creation, storage, and conservation of energy and energy management. Moreover, with respect to reducing CO2 emissions, the Group has been promoting energy conservation at factories and other such locations, and drawing on renewable energy, having set the goal of ensuring that the Group’s own business activities produce zero emissions by the year 2050.
Human Resources Strategy In order to create new business and achieve growth by being closer to its customers in markets with growth potential, the Panasonic Group has been reorganizing its workplace environments and systems that enable each of its employees, regardless of nationality or length of service, to work in a rewarding environment as well as developing and promoting optimum talents. More specifically, the Group has been promoting and strengthening its locally-based talent management committees, which consists of those in positions of responsibility within respective regions, thereby enabling it to move at a more rapid pace with respect to making employee assignments and engaging in career development in a manner that extends across companies and nations. Also, the Group has been successively adopting mechanisms that include a global human resources database system which makes it possible to monitor skills, experience and other attributes of individual employees, as well as a performance management system that gauges results of employees and hastens the process of human resources development on the basis of an approach that is consistent across global operations.
- 13 -

(3) Policy on Control of Panasonic Corporation 1) Efforts to boost corporate value of the Company
Since the Company’s foundation, Panasonic has operated its businesses under its management philosophy, which sets forth that Panasonic’s mission as a business enterprise is to contribute to the progress and development of society and the well-being of people worldwide through its business activities, thereby enhancing the quality of life throughout the world. Honing strengths it has amassed in the manufacturing industry and collaborating with a variety of partners, the Company will also work to sustainably grow its corporate value to satisfy its shareholders, investors, customers, business partners, employees and all other stakeholders while offering "A Better Life, A Better World" for each customer. In fiscal 2019, Panasonic will promote its strategies for sustainable growth while further clarify the areas where it will concentrate its management resources.
2) Measures against large-scale purchase Panasonic has a basic policy that shareholders should make final decision in the event that a large-scale purchase of the Company’s shares is offered, regarding whether or not the offer should be accepted. However, in such cases, there is a possibility that shareholders might not be provided with sufficient information required to make appropriate decisions, and a concern that corporate value and shareholder interest might be significantly damaged. Panasonic will take appropriate measures within the scope permitted by the Financial Instruments and Exchange Act, the Companies Act, and other related laws and regulations, including requesting any party proposing a Large-scale Purchase of the Company’s shares to provide sufficient information necessary to assist shareholders in making appropriate decisions, expressing or disclosing opinions or other statements from the Board of Directors, and endeavoring to secure sufficient time for shareholders to consider the proposed purchase. Before the Board of Directors’ opinions or other statements are expressed or disclosed, the Company will set up an independent committee comprising Outside Directors and Outside Audit & Supervisory Board Members to ensure its objectivity. The Board of Directors will consult this committee regarding its opinion and treat the committee’s report with the utmost respect.
- 14 -

2. Risk Factors
Annually, Panasonic conducts a risk assessment by which it surveys to identify potential risks which may affect its business activities, evaluates such risks based on its common global standards mainly focusing on the impact to the management of Panasonic and the probability of the materialization of the risks, and prioritizes the risks against which measures should be taken. For the risks identified as material in these processes, each level of Panasonic Group, such as the Corporate, Divisional Companies and Business Divisions, forms and takes countermeasures that correspond to the characteristics of the risks, monitors the progress of such countermeasures, and seeks continuous improvements.
The following are the potential risks which may affect its business activities and may have a material impact on the investors’ decision, but is not comprehensive to include all the risks related to Panasonic. Other than described herein, there are unforeseeable risks. These risks may substantially and adversely affect Panasonic’s business, operating results and financial condition.
This section includes forward-looking statements and future expectations as of June 29, 2018, the filing date of this annual securities report.
(1) Risks Related to Economic Conditions Changing economic conditions
Demand for Panasonic’s products and services may be affected by general economic trends in the countries or regions in which Panasonic’s products and services are sold. Economic downturns and resulting declines in demand in Panasonic’s major markets worldwide may thus adversely affect the Company’s business, operating results and financial condition. For fiscal 2019, ending March 31, 2019, the Company anticipates a moderate recovery of the overall global economy to continue. In Japan, while not robust, consumption is showing a recovery trend. On the other hand, there are uncertainties due to factors such as geopolitical risks, economic conditions in emerging countries, as well as politics and policies in various countries. If additional business restructuring is necessary to cope with such situations, Panasonic may incur increased costs. In addition, if the global economy worsens contrary to the Panasonic’s expectations, the business environment of Panasonic may deteriorate more than currently anticipated, which may adversely affect the Company’s business, operating results and financial condition.
Currency exchange rate fluctuations Foreign exchange rate fluctuations may adversely affect Panasonic’s business, operating results and financial condition, because costs and prices of its products and services and certain other transactions that are denominated in a foreign currency are affected by foreign exchange rate changes. In addition, foreign exchange rate changes also affect the yen value of Panasonic’s overseas assets and liabilities because the amounts of such assets and liabilities are translated and presented in Japanese yen in Panasonic’s consolidated financial statements. Generally, an appreciation of the yen against the local currencies of the countries in which Panasonic operates may adversely affect Panasonic’s operating results. Meanwhile, a depreciation of the yen against local currencies may have a favorable impact on Panasonic’s operating results. However, the depreciation of the yen against certain currencies such as the RMB may adversely affect the operating results of certain businesses on a Japanese yen basis due to the price increase of imported products. Excessive foreign exchange rate fluctuations may adversely affect the Company’s business, operating results and financial condition.
Interest rate fluctuations Panasonic is exposed to interest rate fluctuation risks which may affect the Company’s interest expenses, interest income and the value of financial assets and liabilities. Accordingly, interest rate fluctuations may adversely affect the Company’s business, operating results and financial condition.
- 15 -

Changing fundraising environment Panasonic raises funds for its business through methods such as borrowing from financial institutions and issuing bonds and commercial paper. If, among other factors, the financial market becomes unstable or deteriorates, financial institutions reduce lending to Panasonic or rating agencies downgrade Panasonic’s credit ratings, Panasonic may not be able to raise funds in the time and amount necessary for Panasonic, or under conditions which Panasonic deems appropriate, and Panasonic may incur additional costs of raising funds, which may adversely affect the Company’s business, operating results and financial condition.
Decreases in the value of stocks Panasonic holds both Japanese and overseas stocks as part of its financial assets. Decreases in the value of the stocks, such as stock price decline, may reduce Panasonic Corporation stockholders’ equity, thereby adversely affecting Panasonic’s condition.
(2) Risks Related to Panasonic’s Business Competition in the industry
Panasonic develops, produces and sells a broad range of products and services and therefore faces many different types of competitors, from large international companies to relatively small, rapidly growing, and highly specialized organizations. Panasonic is strengthening an investment in strategically important business, but may not be able to invest in a specific business to the same degree as its competitors do, or it may not be able to do so in a timely manner or even at all. These competitors may have greater financial strength, technological capability, and marketing resources than Panasonic in the respective businesses in which they compete.
Competition including price competition, worldwide Panasonic’s business is subject to intense competition worldwide, which makes it difficult for the Company to determine product prices and maintain adequate profits. Although Panasonic makes efforts to reduce costs and develop high value products, downward price pressure due to such price competition may seriously affect Panasonic’s ability to maintain or secure profits notwithstanding such efforts, especially during periods of possible decreases in product demand. In business-to-consumer, or BtoC business areas, amid accelerating changes in the structure of markets, such as a demand shift to emerging markets and lower-priced products, Panasonic’s product prices in digital electronics and other business areas may continue to decline. On the other hand, notwithstanding the Company’s efforts, in business-to-business, or BtoB business areas, the Company’s business, operating results and financial condition may be adversely affected by the downward price pressure, decrease in demand for products, or pressure for capital investment from business partners that the Company highly depends on.
Risks generally associated with international business operations One of Panasonic’s business strategies is business expansion in overseas markets. In many of these markets, Panasonic may face risks generally associated with international manufacturing and other business operations, such as political instability, including war, civil war, conflict, riot and terrorist attacks, cultural and religious differences and labor relations, as well as economic uncertainty and foreign currency exchange risks. Panasonic may also face barriers in commercial and business customs in foreign countries, including difficulties in timely collection of accounts receivable or in building and expanding relationships with customers, subcontractors or parts suppliers. Panasonic may also experience various political, legal or other restrictions including restrictions on foreign investment or the repatriation of profits on invested capital, nationalization of local industry, changes in export or import restrictions or foreign exchange controls, and changes in the tax system, including the change in the rate of taxation and international tax risk, such as tax on the transfer pricing, in countries where Panasonic operates businesses. With respect to products exported overseas, tariffs, other barriers or shipping costs may make Panasonic’s products less competitive in terms of price. Expanding its overseas businesses may require significant investments long before Panasonic realizes returns on such investments, and increased investments may result in expenses growing at a faster rate than revenues.
- 16 -

Product formats that prevail as de facto standards Panasonic may fail to develop or provide new products or services in a timely manner. Some of Panasonic’s core businesses in both BtoC and BtoB areas are concentrated in industries where technological innovation is the central competitive factor. In cases where Panasonic fails to predict with reasonable accuracy both future demand and new technologies that will be available to meet such demand or the technology developed or provided by Panasonic does not lead the market and, instead, the technology developed by its competitors are recognized as de facto standards, the Company may lose its competitiveness in new markets.
Competition in recruiting and retaining skilled employees Panasonic’s future success depends largely on its ability to attract and retain certain key personnel, including professionals in the fields of research, development, technology, manufacturing and management. However, the number of qualified personnel in each field is limited, and the competition for attracting and retaining these employees is intense. Because of this intense competition for skilled employees, Panasonic may be unable to retain its existing personnel or attract additional qualified employees to keep up with future business needs. If this should happen, Panasonic’s business, operating results and financial condition could be adversely affected.
Alliances with, and strategic investments in, third parties, and corporate takeovers Panasonic has formed strategic alliances such as business alliances or joint ventures with, or strategic investments in, other companies, and has also purchased other companies, in order to introduce new products and services. Furthermore, the importance of strategic alliances with third parties as well as corporate takeovers is increasing. In the strategic alliances, Panasonic may not be able to successfully collaborate or achieve expected synergies with its alliance partners, or recover some or all of its respective investments. Furthermore, the alliance partners may make decisions regarding their business undertaken with Panasonic that may be contrary to Panasonic’s interests. In addition, if these partners change their business strategies, Panasonic may fail to maintain these partnerships. In the corporate takeovers, Panasonic may incur substantial expenses in relation to such takeovers which may not be able to fully achieve expected results or may incur unexpected losses in connection with business integration or restructuring after such takeovers.
Reorganization Panasonic owns a large number of subsidiaries and associated companies, etc., and may restructure its group-wide business organization, such as transferring its business or equity interest to outside and re-organizing its organization or locations of the group businesses, for management efficiency and strengthening competitiveness. However, Panasonic may fail to fully achieve the expected results from any ongoing or future restructuring.
Shortage of and increased purchase prices for raw materials, components and services, as well as electricity
Panasonic’s manufacturing operations depend on obtaining raw materials, parts and components, equipment and other supplies including services from reliable suppliers at adequate quality and quantity in a timely manner. It may be difficult for Panasonic to substitute one supplier for another, increase the number of suppliers or change one component for another in a timely manner or at all due to the shortage or interruption of supply caused by, among other factors, natural disasters, accidents, the bankruptcy of suppliers or increased industry demand. Any of these factors may adversely affect the Panasonic Group’s operations. Although Panasonic and its suppliers agree on purchase prices by contract, the prices of raw materials, including iron and steel, resin, non-ferrous metals, and parts and components may increase due to changes in demand and supply conditions and the inflow of investment funds. Some sort of raw materials and components are only available from a limited number of suppliers. The production and sales activities of Panasonic may be adversely and significantly affected by the aforementioned factors.
- 17 -

Customers facing financial difficulties Many of Panasonic’s customers purchase products and services from Panasonic on payment terms that do not provide for immediate payment. If customers from whom Panasonic has substantial accounts receivable encounter financial difficulties and are unable to make payments on time, Panasonic’s business, operating results and financial condition could be adversely affected.
(3) Risks Relating to Panasonic’s Management Targets Panasonic sets profit targets in connection with its management of the Panasonic group and implements specific measures to achieve these targets. While such targets are based on information, analysis and other factors that Panasonic deems appropriate at the time they are determined, Panasonic may not be able to achieve such targets due to various factors, such as the deterioration of the business environment.
(4) Risks Related to Legal Restrictions and Litigations Significant direct or indirect costs resulting from product liability or warranty claims
The occurrence of quality problems due to product defects, including safety incidents, relating to Panasonic products could make Panasonic liable for damages not covered by product and completed operation liability insurance, whereby the Company could incur significant expenses to manage such problems. Due to the occurrence of these problems, Panasonic may experience the deterioration of its image or reputation or may not be able to retain its customers. As a result, Panasonic’s business, operating results and financial condition may be adversely affected.
Damages related to intellectual properties rights Patents may not be granted or may not be of sufficient scope or force to provide Panasonic with adequate protection. In addition, effective intellectual property rights may be unavailable or limited in some countries in which Panasonic operates. Competitors or other third parties may also develop technologies that are protected by patents and other intellectual property rights, which make such technologies unavailable or available only on terms unfavorable to Panasonic. The Company obtains licenses for patents and other intellectual property rights from other parties; however, such licenses may not be available on acceptable terms or at all, and the terms of such licenses may be modified unfavorably. Litigation may also be necessary to enforce Panasonic’s intellectual property rights or to defend against intellectual property infringement claims brought against Panasonic by third parties. In such cases, Panasonic may incur significant expenses and management resources in connection with such lawsuits. Furthermore, Panasonic may be prohibited from using certain important technologies or be found liable for damages in cases of admitted violations of intellectual property rights of others.
Changes, etc. in accounting standards and tax systems Introduction of new accounting standards or tax systems, or changes thereof, which are applicable to Panasonic, may have a material adverse effect on the Company’s operating results and financial condition. In addition, if tax authorities have different opinions from Panasonic on the Company’s tax declarations, Panasonic may need to make larger tax payments than estimated.
Environmental regulations or issues Panasonic is subject to environmental laws and regulations such as those relating to climate change, natural resources, water, biodiversity, chemical substances, waste materials, product recycling, and soil, groundwater and air contamination, and may be held responsible for certain related payments or compensation. Furthermore, if these regulations become stricter and an additional duty with the aim of eliminating the use of environmentally hazardous materials is imposed, or if Panasonic Group determines that it is necessary and appropriate, from the viewpoint of corporate social responsibility, to respond more to environmental issues, the payment of penalties for the violation of these laws and regulations or the payment of expenses of such efforts may adversely affect Panasonic’s business, operating results and financial condition.
- 18 -

Risk related to information security In the normal course of business, Panasonic holds confidential information mainly about customers regarding privacy, creditworthiness and other information such as customers’ personal information, and receives confidential information about companies and other third parties. Other than the information regarding customers and companies and other third parties, Panasonic also deals with its own trade secrets (including Panasonic’ technical information). Such information may be leaked due to an intentional action or negligence including fraudulent access to the Company’s systems or cyber security attacks. Furthermore, the number of the Company’s products, services and production facilities utilizing the Internet is increasing, and despite the Company implementing security measures to protect against external threats, the Company may experience a leak of personal information, a release of information to outside parties, suspension of its services, adverse effect to its processes or other incidents due to reasons such as an unexpected intrusion or fraudulent activities conducted through the network linked with its products, services or production facilities. Such events may cause Panasonic to be liable for damages against the affected parties or result in significant expense to manage these issues or otherwise adversely affect Panasonic’s business and image. If such is the case, Panasonic’s business, operating results and financial condition may be adversely affected.
Restrictions, costs or legal liability relating to governmental laws and regulations Panasonic is subject to governmental regulations in Japan and other jurisdictions in which it conducts its business, including requirements to obtain governmental approvals for conducting business and investments, laws and regulations governing the telecommunications businesses and the safety of electric products, national security-related laws and regulations and export/import laws and regulations, as well as commercial, antitrust, patent, product liability, environmental laws and regulations, consumer protection, labor relations, financial transactions, internal control and business taxation laws and regulations. If, due to the implementation of stricter laws and regulations and stricter interpretations by governmental authorities, Panasonic cannot comply with these laws and regulations from technical and economic perspectives, or Panasonic determines that it would not be economical to continue to comply with them, Panasonic will need to limit its activities in the affected business areas. Such laws and regulations could increase Panasonic’s operating costs. In addition, in the event that governmental authorities find or determine that Panasonic has violated such laws and regulations, Panasonic could become subject to regulatory sanctions, including monetary penalties, as well as criminal sanctions or civil lawsuits for damages, and could also suffer reputational harm.
(5) Risks Relating to Disasters, Accidents and Unpredictable Events Panasonic continues to expand its manufacturing, sales, and research and development activities globally and has facilities all over the world. If major natural disasters, such as earthquakes, tsunamis, floods, including those caused by climate change, fires, explosions, wars, terrorist attacks or other events occur, Panasonic’s employees, facilities, information systems and other assets may be seriously injured or damaged, or the Company may have to stop or delay production and shipment of its products. Panasonic may incur expenses relating to restoration of damaged facilities. In addition, if an infectious disease, such as a new highly pathogenic flu strain, becomes prevalent throughout the world, Panasonic’s manufacturing and sales may be materially disrupted. In addition, if such natural disasters and accidents or other unpredictable events disrupt Panasonic’s supply chain, including through disruptions affecting suppliers of parts or components and manufacturers to which Panasonic sells its products, the production and sales activities of Panasonic may be adversely and significantly affected due to the shortage or interruption in the supply of parts or components from such suppliers, or suspension of or decline in the production activities of such manufacturers.
(6) Other Risks Panasonic’s pension plan benefit obligations
Panasonic Group has contributory, funded benefit pension plans covering substantially all employees in Japan who meet eligibility requirements. The Company and certain domestic subsidiaries made a transition from a defined benefit pension plan to a defined contribution pension plan for contributions made on or after the transition date. Regarding the contributions made prior to the transition date, a decline in interest rates may cause a decrease in the discount rate on benefit obligations. A decrease in the value of stocks may also reduce the fair value of the plan assets. As a result, Panasonic’s pension plan benefit obligations may increase, causing the Panasonic Corporation stockholders’ equity to decrease.
- 19 -

Impairment of non-financial assets Panasonic has many non-financial assets, such as property, plant and equipment, goodwill, and intangible assets. In terms of non-financial assets (excluding inventories and deferred tax assets, etc.), an assessment is made for any indications of impairment in "each asset or cash-generating unit" ("the Asset"). If any such indication exists, then the recoverable amount of the Asset is estimated and impairment tests are conducted. Regardless of whether or not there are indications of impairment, impairment tests of goodwill and intangible assets with indefinite useful lives are conducted annually. Depending on the results of impairment tests, the carrying amount may have to be reduced to the recoverable amount, and the amount of difference may have to be recognized as an impairment loss.
Realizability of deferred tax assets In assessing the realizability of deferred tax assets, Panasonic recognizes those which it considers that it is probable that they can be utilized against its future taxable profit. Deferred tax assets are reviewed at the end of each period and reduced by the portion that it is no longer probable that the related tax benefits will be realized, leading to Panasonic’s income taxes increase.
Financial results and condition of companies under the equity method Panasonic holds equities in several companies under the equity method. Panasonic has significant influence in terms of financial and operating policies over these companies, but does not have control over these companies. Therefore, Panasonic does not make decisions for their policies. Deterioration of business results and financial condition of these companies under the equity method may affect Panasonic’s business results and financial condition.
- 20 -

3. Analyses of Consolidated Financial Position, Operating Results and Cash Flows
(1) Significant Accounting Policies and Estimates
The Company’s consolidated financial statements are prepared in conformity with IFRS. The preparation of consolidated financial statements requires management to make estimates and assumptions that affect the reported amounts of assets and liabilities and disclosure of contingent assets and liabilities at the date of the consolidated financial statements, and the reported amounts of revenues and expenses during the reporting period. Significant estimates and assumptions are reflected in valuation and disclosure of revenue recognition, net realizable value of inventories, recoverability of deferred tax assets, measurement of defined benefit obligation, impairment of non-financial assets (including goodwill), and assets acquired and liabilities assumed by business combinations. Actual results could differ from those estimates.
The details of critical accounting policies and estimates are stated in "Ⅴ. Consolidated Financial Statements, Note 3. Significant accounting policies."
(2) Production, Orders Received and Sales
The Company's production and range of sales items is extensive and diverse. Even for the same type of products, their capacity, structure and format are not necessarily uniform. Due to the nature of the products, in principle, the Company adopts a production system that operates mainly based on projection.
Since the Company is engaged in production activities in a way that the product inventories are kept at a certain level, production results is generally similar to the sales performance.
(3) Analyses of Operating Results for Fiscal 2018, ended March 31, 2018
During the year ended March 31, 2018 (fiscal 2018), the global economy showed signs of recovery. The U.S. economy performed strongly on stable consumer spending and recovering capital investment, while the Chinese economy also saw an increase in exports driven by growth in foreign demand. The Japanese economy made a moderate recovery owing to stable employment and other factors.
Panasonic had set company targets of operating profit and net profit attributable to Panasonic Corporation stockholders for fiscal 2019. Toward achieving such targets and pursuing sustainable growth, in fiscal 2018, Panasonic promoted growth strategies aimed at sustainably increasing sales and profits while identifying growth areas where the Company will focus its management resources.
For the B2B business, on April 1, 2017, Panasonic established a new Divisional Company, the Connected Solutions Company, as a result of reorganizing the former AVC Networks Company and developed a more customer-oriented structure for the business that is expected to play a key role in the growth of the group-wide B2B business. For the automotive-related business, Panasonic further increased production capacity for automotive batteries, including a new factory in Dalian, China, which started mass production and shipment. Panasonic also announced an agreement with Toyota Motor Corporation on studying the feasibility of a joint business to further advance automotive prismatic batteries. For the housing-related business, Panasonic made PanaHome Corporation a wholly-owned subsidiary with the aim of generating synergies among the Group’s management resources.
In the solar business, Panasonic started selling individual cell devices to complement existing module sales. The Company also made changes to its module production system that included termination of production at the Shiga plant. The Company’s initiatives including the above resulted in increases in sales and profit in fiscal 2018.
- 21 -

1) Sales
Sales increased in fiscal 2018 due mainly to growth in the automotive- and industrial-related businesses. Consolidated group sales increased by 9% from 7,343.7 billion yen to 7,982.2 billion yen, as domestic sales were firm and overseas sales saw significant growth from the automotive-related business. Contributions were made in particular by the Automotive Business, which includes automotive infotainment systems and car-related equipment, and the Energy Business, which includes rechargeable batteries. Newly consolidated Ficosa and Zetes and favorable exchange rates also contributed to the growth in sales.
2) Operating Profit
Cost of sales increased from 5,157.2 billion yen a year ago to 5,643.0 billion yen. Selling, general and administrative expenses totaled 1,938.0 billion yen, an increase from 1,842.9 billion yen a year ago. Share of profit of investments accounted for using the equity method increased year on year to 10.1 billion yen. Other income (expenses), net, amounted to a loss of 30.8 billion yen, compared to a loss of 75.2 billion yen the previous fiscal year, due to declines in business restructuring expenses and legal costs.
As a result, operating profit totaled 380.5 billion yen, an increase from 276.8 billion yen the previous fiscal year. Sales increases mainly in the Automotive Business and the Industrial Business and rationalization efforts offset the negative impacts from raw material cost hikes and increased fixed-costs due to upfront investments. The operating profit ratio also improved to 4.8%, from 3.8% a year ago.
3) Profit before Income Taxes Finance income increased from 21.8 billion yen the previous fiscal year to 22.8 billion yen. Finance expenses increased from 23.5 billion yen to 24.7 billion yen.
As a result, profit before income taxes was 378.6 billion yen, compared to 275.1 billion yen the previous fiscal year.
4) Net Profit attributable to Panasonic Corporation Stockholders
Income taxes were 126.6 billion yen, compared to 102.7 billion yen a year ago. As a result, net profit attributable to Panasonic Corporation stockholders totaled 236.0 billion yen, compared to 149.4 billion yen a year ago. Also, net profit attributable to Panasonic Corporation stockholders per share was 101.20 yen, against 64.33 yen the previous fiscal year.
5) Segment information
The Panasonic Group is divided into four companies for business management, and they support the autonomy of each business division and execute businesses in their respective areas on a global scale. The results of their performance are classified and disclosed in the five segments of Appliances, Eco Solutions, Connected Solutions, Automotive & Industrial Systems, and Other. From fiscal 2018, the AVC Networks segment was renamed as the Connected Solutions segment. Certain businesses were transferred among segments on April 1, 2017. Accordingly, the figures for segment information in fiscal 2017 have been reclassified to conform to the presentation for fiscal 2018 in the following analysis.
a. Appliances
Sales increased by 3% to 2,588.4 billion yen from a year ago, mainly due to growth in sales of appliances and devices in China and other areas in fiscal 2018.
Looking at the main Business Divisions (BD) of this segment, the Air-Conditioner Company saw sales growth driven by brisk sales of both room air-conditioners and large air-conditioners in China and other countries.
- 22 -

In the Laundry Systems and Vacuum Cleaner BD, sales increased due to strong sales of washing machines in China and Asia.
In the TV BD, sales increased with growth in sales of organic electroluminescent (EL) TVs, mainly in Japan and Europe.
In the Refrigerator BD, sales increased with brisk sales in China and Asia.
Operating profit increased by 5.5 billion yen to 104.4 billion yen from a year ago, despite a surge in raw material prices mainly for home appliances such as air-conditioners. The increase was mainly due to progress made in controlling procurement prices for raw materials and components and utilizing alternative materials and components, coupled with gains from increased sales.
b. Eco Solutions
Sales increased by 5% to 1,623.5 billion yen from a year ago, mainly due to growth in sales in Japan for the electrical construction materials business and water-related equipment, along with brisk sales overseas for heat-exchanging ventilation units in China and the electrical construction materials business in India and Vietnam.
Looking at the main BDs of this segment, the Energy Systems BD saw an increase in sales mainly due to strong sales of wiring devices in Japan as well as in India, Turkey and Vietnam, despite the impact of contraction in Japan’s solar business market.
The Lighting BD saw growth in sales thanks to brisk sales of non-housing lighting in Japan and expansion of the China business in the overseas market.
At Panasonic Ecology Systems Co., Ltd., sales rose as the increase in sales of ventilation systems in Japan, which absorbed a decline in sales overseas in the environmental engineering business, which had received an order for major projects in the previous year.
In the Housing Systems BD, sales increased on growth in sales of water-related equipment such as modular system kitchens.
Operating profit increased by 8.3 billion yen to 72.5 billion yen from a year ago, mainly due to gains from increased sales and the effect of improving cost competitiveness, despite the impact of high procurement prices for raw materials and components and a drop in sales prices in the market.
c. Connected Solutions
Sales increased by 6% to 1,119.3 billion yen from a year ago, mainly due to brisk sales of mounting equipment to smartphone manufacturers and mobile notebook PCs.
Looking at the main BDs of this segment, at Panasonic Avionics Corporation sales declined despite a solid performance from communications and maintenance services, mainly reflecting lackluster growth in aircraft in-flight entertainment systems due to lower market demand.
In the Mobile Solutions BD, sales increased, mainly due to growth in sales of notebook PCs and the new consolidation of Belgian logistics solutions company Zetes Industries S.A., which outweighed a decline in sales of feature phones.
In the Process Automation BD, sales increased due to growth in sales of mounting equipment and expansion of the product line up in welding equipment for the automotive industry.
- 23 -

In the Media Entertainment BD, sales increased due to buoyant sales of high-brightness projectors and new professional AV system products for the video production market.
Operating profit increased by 55.3 billion yen to 105.7 billion yen from a year ago, mainly due to gains from increased sales in the Mobile Solutions BD and the Process Automation BD, an increase in the profit ratio for the Media Entertainment BD caused by a shift towards high-value added products, and improvement of other income and expenses following a review of the reserve for legal costs.
d. Automotive & Industrial Systems
Sales increased by 16% to 2,803.5 billion yen from a year ago, mainly reflecting growth in electrification and automation-related sales in the automotive field due to market growth for eco-cars and expansion in demand for advanced driver assistance systems (ADAS). In the industrial field, device sales in China were brisk.
Looking at the main businesses of this segment, in the Automotive Business, sales increased due to higher sales of automotive infotainment-related equipment such as display audio systems and cockpit systems, as well as ADAS-related products such as automotive cameras and sonars. Consolidation of Ficosa International S.A. also contributed to the increase.
In the Energy Business, sales increased due to growth in sales of prismatic and cylindrical automotive batteries in line with market growth for eco-cars, as well as to the launch of new dry battery products in Japan and strong sales of micro batteries overseas.
In the Industrial Business, sales increased due to brisk sales of motors and sensors for Chinese industrial equipment, film capacitors for eco-cars, and conductive capacitors for data servers and semiconductor storage.
Operating profit declined by 1.6 billion yen to 91.4 billion yen from a year ago, due mainly to recording a reversal of provision and gains from business transfer in the previous fiscal year, despite major gains from increased sales of automotive and industrial products centered on the Industrial Business and automotive batteries.
e. Other
Sales were 675.9 billion yen, the same level as a year ago.
In fiscal 2018, sales at PanaHome Corporation fell slightly affected by lower orders for new house building and apartments despite brisk sales in Japan for interior remodeling and condominiums.
Operating profit increased by 2.8 billion yen to 10.8 billion yen from a year ago.
(4) Risks Materially Affecting Panasonic’s Business, Operating Results and Financial Conditions
Refer to "2. Risk Factors."
(5) Financial Conditions and Liquidity
1) Liquidity and Capital Resources
The Panasonic Group has a basic policy of generating funds needed for business activities from internal sources. Funds generated are efficiently utilized through intra-Group financing. Based on this, when funds are needed for working capital or business investment, external financing is obtained through appropriate means based on financial strength and financial market conditions.
- 24 -

(Cash)
Cash and cash equivalents as of March 31, 2018 were 1,089.6 billion yen, decreased from 1,270.8 billion yen at the end of the previous fiscal year.
(Interest bearing debt)
Interest-bearing debt increased to 1,239.4 billion yen as of March 31, 2018 from 1,124.0 billion yen at the end of the previous fiscal year due to the issue of short-term bonds and other factors, despite repayments of straight bonds.
(Ratings)
The Company has obtained credit ratings from Rating and Investment Information, Inc. (R&I), Standard & Poor’s Ratings Japan K.K. (S&P), and Moody’s Japan K.K. (Moody’s). The Company’s credit ratings as of March 31, 2018 are as follows.
R&I: A (Long-term, Outlook: Stable), a-1 (Short-term) S&P: A- (Long-term, Outlook: Stable), A-2 (Short-term) Moody’s: A3 (Long-term, Outlook: Stable)
2) Cash Flows
The Company recognizes the importance of increasing free cash flow by strengthening business profitability and developing businesses over the medium-to-long term. The Company also works simultaneously to create cash flows through continuous reductions of working capital, revisions of asset holdings and other measures.
Net cash provided by operating activities for fiscal 2018 was 423.2 billion yen and net cash used in investing activities was 458.8 billion yen. Free cash flow, the total of the two, was an outflow of 35.6 billion yen, compared with an outflow of 34.7 billion yen a year ago. Despite an increase in net profit , the free cash flow for fiscal 2018 stayed the same level with the previous year, due to an increase in capital investment and other factors.
A detailed analysis of cash flows is as follows. (Cash flows from operating activities) Net cash provided by operating activities for the year ended March 31, 2018 amounted to 423.2 billion yen, compared with an inflow of 385.4 billion yen a year ago. This was due mainly to increases in net profit and income taxes payable in fiscal 2018 and a significant decrease in provisions in fiscal 2017, despite an increase in working capital in line with the sales increase in real terms.
(Cash flows from investing activities) Net cash used in investing activities amounted to 458.8 billion yen, compared with an outflow of 420.1 billion yen a year ago. This was due mainly to an increase in capital investment in fiscal 2018, while a significant amount was spent to acquire Hussmann in fiscal 2017.
(Cash flows from financing activities) Net cash used in financing activities amounted to 128.8 billion yen, compared with an inflow of 294.6 billion yen a year ago. Despite the issuance of short-term bonds amounting 240.0 billion yen in fiscal 2018, this was due mainly to the issuance of straight bonds amounting 400.0 billion yen in fiscal 2017, as well as the acquisition of additional equity interest in PanaHome and repayments of straight bonds of 150.0 billion yen in fiscal 2018.
Taking into consideration the exchange rate fluctuations, cash and cash equivalents totaled 1,089.6 billion yen as of March 31, 2018, a decrease from 1,270.8 billion yen compared with a year ago.
- 25 -

3) Capital Investment and Depreciations
The Panasonic Group makes capital investment based on a policy of steady investments primarily in key businesses for future growth.
Capital investment in fiscal 2018 (tangible assets only) increased by 26% to 392.2 billion yen from 311.6 billion yen a year ago. Major capital investments were made at production facilities (U.S. and China) for lithium-ion batteries for automobiles.
Depreciation (tangible assets only) increased by 1% to 226.6 billion yen from 224.4 billion yen a year ago.
4) Assets, Liabilities and Equity
The Company’s consolidated total assets as of March 31, 2018 were 6,291.1 billion yen, an increase of 308.2 billion yen from March 31, 2017. This increases mainly attributable to increases in trade receivables and inventories from higher sales and an increase in property, plant and equipment from capital investments. The Company’s consolidated total liabilities were 4,408.8 billion yen, an increase of 185.8 billion yen from March 31, 2017. This increase was due mainly to the issuance of short-term bonds and an increase in trade payables.
Panasonic Corporation stockholders’ equity increased by 135.7 billion yen compared to March 31, 2017 to 1,707.6 billion yen due to recording net profit and other factors. As a result, the ratio of Panasonic Corporation stockholders’ equity was 27.1%, increasing from 26.3% on March 31, 2017. With non-controlling interests added to Panasonic Corporation stockholders’ equity, total equity was 1,882.3 billion yen.
- 26 -

4. Material Agreements, etc.
(1) As Licensee
Licensor Country Contract description Contract period
QUALCOMM INC. U.S.A License of patents relating to 3G mobile phone and base station
From March 2001 to the expiration of the patents under contracts
(2) As Licensor
Licensee Country Contract description Contract period
MPEG LA LLC. U.S.A License of patents relating to MPEG-4 Visual
From January 2000 to the expiration of the patents under contracts
(3) Cross License Agreement
Party Country Contract description Contract period
Koninklijke Philips Electronics N.V.
Netherlands Cross license of patents relating to mobile phone and AV products
From March 2007 to the expiration of the patents under contracts
Pioneer Corporation Japan Cross license of patents relating to major AV products
From April 2006 to March 2018
(4) PanaHome Corporation ("PanaHome") becoming Panasonic’s Wholly-owned Subsidiary The Company resolved at the Board of Directors meeting held on April 21, 2017, to acquire shares of common stock of PanaHome through a tender offer (the "Tender Offer") in accordance with the Financial Instruments and Exchange Act. The Company and PanaHome also resolved to terminate, by mutual agreement, the share exchange agreement concluded on December 20, 2016, to make PanaHome, which was the Company’s consolidated subsidiary, a wholly-owned subsidiary through share exchange and Panasonic the wholly-owning parent company. Both companies terminated the share exchange agreement by mutual agreement on the same day and entered into a memorandum of understanding with respect to the implementation of the Tender Offer, subject to certain conditions being satisfied. The Tender Offer was completed in June 2017. Subsequently, PanaHome resolved at the extraordinary shareholders meeting held on August 31, 2017, to consolidate shares, abolish provisions relating to the share unit number and amend part of the Articles of Incorporation. Through the October 2, 2017 share consolidation, followed by the acquiring of fractional shares, the Company has made PanaHome a wholly-owned subsidiary.
(5) Establishment of a Subsidiary through an Incorporation-Type Company Split The Company resolved at the Board of Directors meeting held on December 22, 2017, to conduct an incorporation-type company split (the "Company Split"), in order to transfer a part of its wholly-owned subsidiaries to a newly incorporated intermediate holding company ("NewCo").
a) Purpose of the Company Split To enhance investment and collection management for its subsidiaries in Japan.
b) Method of Company Split An incorporation-type company split (simplified incorporation-type company split) by which Panasonic is the splitting company and the NewCo is the succeeding company.
- 27 -

c) Company Split date (effective date) April 2, 2018
d) Allotment of shares in relation to the Company Split The NewCo issued one common share at the time of the Company Split, allotting all of it to Panasonic. The Company Split is an incorporation-type company split performed solely by Panasonic, and since all shares of the NewCo established by the incorporation-type company split are allotted to Panasonic, no share price calculation by a third-party organization has been implemented.
e) Amounts of assets and liabilities transferred to the NewCo The NewCo succeeded the shares in and the long-term loan claims against certain wholly-owned subsidiaries of Panasonic, which were considered necessary to enhance investment and collection management for Panasonic’s subsidiaries in Japan. Total assets: 660,652 million yen (as of March 31, 2018)
f) Stated capital and principal lines of business of the NewCo Corporate name: Panasonic Equity Management Japan Co., Ltd. Stated capital: 10 million yen Principal lines of business: Investment and collection management for Panasonic group’s subsidiaries in Japan Head Office: Kadoma City, Osaka, Japan
In accordance with the above, the Company implemented the Company Split on April 2, 2018.
- 28 -

5. Research and Development
The Panasonic Group concentrated on development of new technologies and new products to underpin the future based on the growth strategies for the major business fields. In addition, to drive innovation the Group established the Business Innovation Division within Head Office, and actively worked to create new businesses that make use of new technologies such as the IoT(Note), artificial intelligence (AI), and big data.
R&D expenditures totaled 448.9 billion yen in fiscal 2018.
Key development themes and achievement during fiscal 2018 were as follows:
Development of facial recognition technology capable of recognizing a person regardless of passage of time, makeup, or facial expression
The Panasonic Group developed facial recognition technology able to cope with facial hair, makeup, wrinkles and blemishes by combining image-sensing technologies cultivated in digital cameras and so forth with AI technology that has learned by identifying many people. This technology was incorporated in a facial recognition gate along with universal design based on ergonomics to create an automatic border control gate using facial recognition that can be used intuitively by beginners and the elderly. The gates have been installed at Haneda Airport to streamline the processing of travelers returning to Japan.
The gate received "2017 Good Design Award."
Development of drowsiness-control technology that can detect and predict a driver’s drowsiness without physical contact and allow them to stay comfortably awake
The Panasonic Group developed a technology that can detect a driver’s initial stage of shallow drowsiness with high accuracy and without physical contact by measuring their blinking, facial expressions, and other aspects captured by a camera and processing them using AI. Further, using measurement data from the in-vehicle environment, such as release of heat from the driver and illuminance, the new technology also successfully predicts the transition of the driver’s drowsiness level. Combined with thermal sensation monitoring, the newly developed drowsiness control technology can help drivers stay comfortably awake until they reach their destination. These technologies can be used as a system to help prevent drivers from falling asleep while driving.
This technology was awarded "2017 Top Ten New Product Awards 60th Anniversary Special Award" sponsored by Nikkan Kogyo Shimbun, Ltd.
Development of a "Safety Monitoring Service" using IoT devices and its application to nursing care facilities and remote at-home care services
The Panasonic Group developed a service solution for remote monitoring of room temperature and humidity, as well as the occupant’s sleep rhythm and amount of activity using an air conditioner and room sensor. The system was introduced to facilities such as elderly homes with support services to implement a service for increasing the operational efficiency of care staff.
With a view to widening the scope of application, the Panasonic Group started a trial demonstration of the system for a remote at-home service in Minoh-shi, Osaka, Katano-shi, Osaka, and Toyota-shi, Aichi. In 2025, one in three Japanese people will be senior citizens, and the looming shortage of nursing care personnel is an issue to be addressed. The Company will contribute to streamlining of at-home care and care services for supporting independence of disabled people by realizing comprehensive regional care systems that make use of the IoT.
- 29 -

Development of high-speed electric power line communication technology using three-phase power lines for communication and demonstration of utilizing the IoT at a large-scale facility
Combining HD-PLC technology that makes use of power lines for high-speed communications and Multi-hop technology that stably transmits data through multiple terminals, the Panasonic Group developed a communication technology capable of realizing long-distance communications over several kilometers using existing power lines and networks of around 1,000 terminals. The Company also started a demonstration at its Saga Plant with the three-phase power lines used for supplying power to electric motor systems and bulk power systems. This technology removes the need for dedicated communication lines and enables flexible layout changes, while offering low-cost construction of a network with highly robust security compared with wireless networks.
The Panasonic Group will position HD-PLC as a foundation technology for the IoT and will work to promote its further spread going forward.
* IoT: Internet of Things refers to the connection of many things and devices to the Internet
- 30 -

Ⅲ Property, Plants and Equipment
1. Summary of Capital Investment
Capital investment by segment for the year ended March 31, 2018 is shown in the table below.
Segment Amount
(Billions of yen) Change from last fiscal year (%)
Main purpose of investment
Appliances 61.5 +17.4 Production of new products and an increase in production capacity of electric appliances for home use and video and AV equipment
Eco Solutions 42.1 +21.7 Production of new products and streamlining of electrical construction material, building material and solar photovoltaic system, etc.
Connected Solutions 22.1 +2.3 Production of new products and streamlining of B2B solution business related equipment, etc.
Automotive & Industrial Systems
226.0 +17.8
Increase in production capacity of rechargeable batteries, and production of new products and an increase in production capacity of automotive- and automotive infotainment-related equipment, and electronic components, etc.
Other & Corporate 40.5 +261.6
Capital investment which is related to PanaHome Corporation and capital investment by head office and regional headquarter, etc.
Total 392.2 +25.9 ─
(Notes) 1. Panasonic restructured its Group organization on April 1, 2017. In calculating the percentage of change from
last fiscal year, prior year's figure has been revised to conform to the presentation for fiscal 2018. 2. "Other & Corporate" includes capital investments, recorded in the "Other" segment, and investments which
are not included in any other segments, as shown above.
- 31 -

2. Major Property, Plants and Equipment
(1) Panasonic Corporation (As of March 31, 2018)
Facility (Location) Segment Details of major
facilities and equipment
Book value (Millions of yen)
Number of employees Buildings
Machinery and
equipment
Land (Area in
thousands of ㎡)
Lease assets
Others Total
Kusatsu Plant
(Kusatsu-shi, Shiga) Appliances
Manufacturing facilities for air conditioners and refrigerators, etc.
14,312 9,517 5,941
(564) 1,149 1,259 32,178 4,834
Hikone Plant
(Hikone-shi, Shiga) Appliances
Manufacturing facilities for personal-care equipment and healthcare equipment
4,481 3,885
1,323
(88)
[4]
71 4 9,764 982
Kobe Plant
(Nishi-ku, Kobe-shi)
Appliances,
Connected Solutions
Manufacturing facilities for cooking appliances and information equipment
2,471 1,932 4,924
(185) 24 751 10,102 680
Nara Plant
(Yamatokoriyama-shi,
Nara)
Appliances Manufacturing facilities for meter devices
2,124 3,074 218
(128) 209 330 5,955 332
Niigata Plant
(Tsubame-shi, Niigata) Eco Solutions
Manufacturing facilities for lighting fixture
1,914 3,082 2,035
(143) - 319 7,350 416
Tsu Plant
(Tsu-shi, Mie)
Eco Solutions,
Automotive &
Industrial Systems
Manufacturing facilities for wiring devices and security equipment
3,721 3,485
2,120
(92)
[9]
- 291 9,617 1,853
Ritto Plant
(Ritto-shi, Shiga) Eco Solutions
Manufacturing facilities for rain gutters
1,077 1,639 1,495
(59) - 98 4,309 166
Kadoma Plant
(Kadoma-shi, Osaka)
Appliances,
Connected Solutions
Manufacturing facilities for video and audio equipment
2,283 3,608
77
(215)
[147]
256 1,651 7,875 7,092
Saedo Plant
(Tsuzuki-ku, Yokohama-
shi)
Connected Solutions,
Automotive &
Industrial Systems
Manufacturing facilities for car equipment, other facilities
8,217 5,655 12,530
(122) 287 300 26,989 3,068
Matsumoto Plant
(Matsumoto-shi, Nagano)
Automotive &
Industrial Systems
Manufacturing facilities for car equipment
722 3,222 473
(69) 101 1 4,519 540
Ise Plant
(Watarai-gun, Mie)
Automotive &
Industrial Systems
Manufacturing facilities for automation controls
3,333 4,705 555
(152) - 929 9,522 1,352
Tsuyama Plant
(Tsuyama-shi, Okayama)
Automotive &
Industrial Systems
Manufacturing facilities for input devices
1,227 2,347
78
(53)
[5]
29 682 4,363 619
Kanazu Plant
(Awara-shi, Fukui)
Automotive &
Industrial Systems Manufacturing facilities for sensors 1,542 2,710
576
(51)
[6]
119 129 5,076 435
Morita Plant
(Fukui-shi, Fukui)
Automotive &
Industrial Systems Manufacturing facilities for resistors
798 3,935 194
(18) 66 699 5,692 521
Uji Plant
(Uji-shi, Kyoto)
Automotive &
Industrial Systems Manufacturing facilities for capacitors 2,399 4,678
359
(48) 8 816 8,260 673
- 32 -

Facility (Location) Segment Details of major
facilities and equipment
Book value (Millions of yen)
Number of employees Buildings
Machinery and
equipment
Land (Area in
thousands of ㎡)
Lease assets
Others Total
Yamaguchi Plant
(Yamaguchi-shi,
Yamaguchi)
Automotive &
Industrial Systems Manufacturing facilities for capacitors
352 2,845 519
(48) 4 966 4,686 355
Hokkaido Plant
(Chitose-shi, Hokkaido)
Automotive &
Industrial Systems
Manufacturing facilities for thermal management solutions devices
1,444 4,028 117
(100) - 105 5,694 295
Osaka Plant
(Moriguchi-shi, Osaka)
Automotive &
Industrial Systems Manufacturing facilities for batteries 3,946 4,216
93
(65)
[3]
1 630 8,886 1,421
Suminoe Plant
(Suminoe-ku, Osaka-shi)
Automotive &
Industrial Systems Manufacturing facilities for batteries 14,815 1,545
-
(116)
[116]
569 261 17,190 1,044
Yokkaichi Plant
(Yokkaichi-shi, Mie)
Automotive &
Industrial Systems
Manufacturing facilities for electronic materials
3,685 1,982 4,196
(209) - 128 9,991 288
Koriyama Plant
(Koriyama-shi, Fukushima)
Automotive &
Industrial Systems
Manufacturing facilities for electronic materials
1,312 3,515 1,284
(159) - 156 6,267 659
Fukuoka Office
(Hakata-ku, Fukuoka-shi)
Appliances,
Connected Solutions Other facilities 514 291
7,758
(54)
[4]
1 58 8,622 2,024
Technology Innovation
Division Head Office Area
(Moriguchi-shi, Osaka)
Corporate, etc. R&D facilities 2,592 1,498 197
(38) 290 44 4,621 856
Technology Innovation
Division Keihanna Area
(Soraku-gun, Kyoto)
Corporate, etc. R&D facilities 2,160 253 3,706
(53) 0 13 6,132 47
Production Engineering
Laboratory, etc.
(Kadoma-shi, Osaka)
Corporate, etc. R&D facilities 3,466 2,171 2,019
(125) 16 92 7,764 1,078
Branch Office and Sales
Office
(Nakamura-ku, Nagoya-shi,
etc.)
Appliances, Eco Solutions, Connected Solutions, Automotive & Industrial Systems
Equipment for sales
and marketing 7,136 403
4,556
(76)
[31]
11 4 12,110 5,403
Management department of
Eco Solutions Company
(Moriguchi-shi, Osaka,
etc.)
Eco Solutions Other facilities 33,141 3,243
30,380
(529)
[65]
- 259 67,023 2,000
Management department of
Automotive & Industrial
Systems Company, etc.
(Kadoma-shi, Osaka, etc.)
Automotive &
Industrial Systems Other facilities 2,167 2,207
907
(78) 251 105 5,637 5,127
Head Office, etc.
(Kadoma-shi, Osaka, etc.) Corporate, etc.
Head office, employee housing and welfare facilities, etc.
12,469 4,244
8,329
(447)
[16]
26 109 25,177 4,017
- 33 -

(2) Domestic subsidiaries (As of March 31, 2018)
Company Facility (Location) Segment Details of major
facilities and equipment
Book value (Millions of yen)
Number of employees Buildings
Machinery and
equipment
Land (Area in
thousands of ㎡)
Others Total
SANYO Electric Co., Ltd.
Kasai plant (Kasai-shi, Hyogo)
Automotive & Industrial Systems
Manufacturing facilities for rechargeable batteries
10,234 11,479 2,977 (181)
1,380 26,070 1,125
Sumoto plant (Sumoto-shi, Hyogo)
Automotive & Industrial Systems
Manufacturing facilities for rechargeable batteries
5,997 13,137 2,979 (96)
1,113 23,226 676
Tokushima plant (Itano-gun, Tokushima)
Automotive & Industrial Systems
Manufacturing facilities for rechargeable batteries
7,381 5,478 3,739 (177) 162 16,760 601
Tokyo plant (Ora-gun, Gunma, etc.)
Appliances Manufacturing facilities for industrial equipment, etc.
9,886 1,791 1,865 (885) 767 14,309
5 <926>
Panasonic Ecology Systems Co., Ltd
(Kasugai-shi, Aichi) Eco Solutions
Manufacturing facilities for equipment relates to ecology system business
4,301 2,506 3,383 (197) 6 10,196 982
KMEW Co., Ltd. (Chuo-ku, Osaka-shi)
Eco Solutions
Manufacture facilities of exterior building and housing related products
1,301 12,952 -
(301) [301]
2,007 16,260 1,696
Panasonic Liquid Crystal Display Co., Ltd.
(Himeji-shi, Hyogo)
Automotive & Industrial Systems
Manufacturing facilities for LCD panels, etc.
41,718 1,423 -
(361) [361]
94 43,235 549
Panasonic System Solutions Japan Co., Ltd.
(Hakata-ku, Fukuoka-shi, etc.)
Connected Solutions
Manufacturing facilities for information communication equipment, etc.
5,960 1,735 2,942 (299)
[50] 38 10,675 4,327
<3,351>
Panasonic Semiconductor Solutions Co., Ltd.
(Nagaokakyo-shi, Kyoto, etc.)
Automotive & Industrial Systems
Manufacturing facilities for semiconductors, etc.
16,709 2,033 7,248 (725)
[14] 330 26,320 1,731
Panasonic Smart Factory Solutions Co., Ltd.
(Kadoma-shi, Osaka, etc.)
Connected Solutions
Manufacturing facilities for mounter, etc.
2,547 3,273 739
(108) 399 6,958 1,311
PanaHome Corporation
Head plant (Higashiomi-shi, Shiga)
Other
Manufacturing and logistics facilities for materials and components of housing system
1,958 1,687 5,813 (320) 125 9,583 302
Tsukuba plant (Tsukubamirai-shi, Ibaraki)
Other
Manufacturing and logistics facilities for materials and components of housing system
889 1,149 2,879 (126)
132 5,049 220
- 34 -

(3) Overseas subsidiaries (As of March 31, 2018)
Company (Location) Segment Details of major facilities
and equipment
Book value (Millions of yen)
Number of employees Buildings
Machinery and
equipment
Land (Area in
thousands of ㎡)
Others Total
Panasonic Corporation of North America (New Jersey, U.S.A.)
Appliances, Eco Solutions, Connected Solutions, Automotive & Industrial Systems, Other, Corporate
Manufacturing and sales facilities for various electric and electronic products
6,167 9,025 1,752 (287)
91,644 108,588 12,539
Panasonic Avionics Corporation (California, U.S.A.)
Connected Solutions Manufacturing facilities for aircraft-in-flight entertainment systems
3,571 15,176 - (7)
1,540 20,287 4,452
Hussmann Corporation (Missouri, U.S.A.)
Appliances
Manufacture facilities of commercial-use refrigerated and freezer showcases
5,107 4,096 1,475 (593) 1,070 11,748 5,619
Panasonic do Brasil Limitada (Amazonas, Brazil)
Appliances, Connected Solutions, Automotive & Industrial Systems
Manufacturing and sales facilities for various electric and electronic products
2,287 4,443 349 (540) 594 7,673 2,337
Panasonic AVC Networks Czech s.r.o. (Plzen, Czech Republic)
Appliances Manufacturing facilities for flat-panel TVs 4,083 838 258
(166) 32 5,211 930
Ficosa International S.A. (Barcelona, Spain)
Automotive & Industrial Systems
Manufacture facilities of automotive components such as electric mirrors
9,650 10,755 4,889 (1,091)
[30] 2,148 27,442 8,844
Panasonic Asia Pacific Pte. Ltd. (Singapore)
Appliances, Eco Solutions, Connected Solutions, Automotive & Industrial Systems, Corporate
Manufacturing and sales facilities for various electric and electronic products
568 7,169 97 (209)
1,128 8,962 2,240
(Notes) 1. The above amounts do not include the consumption tax, etc. 2. Some plants or offices are rented to affiliated companies. Regarding rented plants and offices to affiliated
companies, the number of employees of the company, which rents the related plants or offices, are shown with parenthesis notation of < > in the "Number of employees" column.
3. Parenthesis notation of [ ] in the "Land" column shows the size of land rented from a party other than consolidated companies.
4. In addition to the above, the Company accounted for some machinery, etc. as finance leases as a lessor.
- 35 -

3. Plans for Capital Investment, Disposals of Property, Plants and Equipment, etc.
The planned capital investment for the fiscal year ending March 31, 2019 will be 380.0 billion yen, a decrease of 3% compared with the actual capital investment for the previous fiscal year, and a breakdown by segment is as follows.
Segment Amount
planned for fiscal 2019
(Billions of yen) Main purpose of investment Capital resource
Appliances 50.0
Production of new products and an increase in production capacity of electric appliances for home use and video and AV equipment
Own capital, etc.
Eco Solutions 53.0
Production of new products and streamlining of electrical construction material, building material and solar photovoltaic system, etc.
Own capital, etc.
Connected Solutions 19.0 Production of new products and streamlining of B2B solution business related equipment, etc.
Own capital, etc.
Automotive &
Industrial Systems 241.0
Increase in production capacity of rechargeable batteries, and production of new products and an increase in production capacity of automotive- and automotive infotainment-related equipment, electronic components, etc.
Own capital, etc.
Other & Corporate 17.0 Capital investment by head office and regional headquarter, etc.
Own capital, etc.
Total 380.0 - -
(Notes) 1. The above amounts do not include the consumption tax, etc. 2. There is no plan of other material disposals or sales of principal facilities, with the exception of disposing
and selling facilities due to routine upgrading. 3. The above amounts has been reclassified to conform to the presentation for the year ended March 31, 2019.
- 36 -

Ⅳ Information on the Company
1. Information on the Company's Stock, etc.
(1) Total number of shares, etc.
1) Total number of shares
Class Total number of shares authorized to be issued (shares)
Common stock 4,950,000,000
Total 4,950,000,000
2) Issued shares
Class
Number of shares issued as of the end of fiscal
year (shares)
(March 31, 2018)
Number of shares issued as of the filling date
(shares) (June 29, 2018)
Stock exchange on which the Company is listed Description
Common stock
2,453,053,497 2,453,053,497
Tokyo stock exchange (the first section)
Nagoya stock exchange (the first section)
The number of shares per one unit of shares is 100 shares.
Total 2,453,053,497 2,453,053,497 ― ―
- 37 -

(2) Information on the stock acquisition rights, etc.
1)Details of stock option plans
Resolution date of the Board of Directors July 31, 2014 July 29, 2015
Category and number of persons granted
Directors of the Company ( excluding Outside Directors ) : 13 Executive Officers and certain other officers ( excluding Directors who concurrently serve as Executive officers ) :14
Directors of the Company ( excluding Outside Directors ) : 13 Executive Officers and certain other officers ( excluding Directors who concurrently serve as Executive officers ) : 17
Number of stock acquisition rights Note 6
2,034 1,729
Class, details and number of shares to be acquired upon exercise of stock acquisition rights
Note 6
Common stock of Panasonic 203,400 shares
Note 1
Common stock of Panasonic 172,900 shares
Note 1 Subscription amount to be paid upon exercise of stock acquisition
One (1) yen One (1) yen
Exercise period of stock acquisition rights From August 23, 2014 to August 22, 2044
From August 21, 2015 to August 20, 2045
Issue price for shares issued through the exercise of the stock acquisition rights and the amount capitalized as common stock
Issue price : 1,055 yen Note 2
Amount capitalized as common stock
Note 3
Issue price : 1,125 yen Note 2
Amount capitalized as common stock
Note 3 Conditions for exercise of stock acquisition rights
Note 4
Matters regarding transfer of stock acquisition rights
The stock acquisition rights cannot be acquired through transfer, unless such acquisition is expressly approved by a resolution of the Board of Directors.
Matters regarding grant of stock acquisition rights accompanying reorganization
Note 5
(Notes) 1. The number of shares to be acquired upon exercise of each stock acquisition right (the "Number of Shares
Acquired") shall be 100 shares (1 unit:100 shares); provided, however, that in the case that Panasonic conducts a share split (including an allotment without consideration (musho-wariate) of shares of common stock of Panasonic; the same shall apply to all references to the share split herein) or share consolidation on and after the date on which the stock acquisition rights shall be allotted, the Number of Shares Acquired shall be adjusted in accordance with the following formula, rounding down any fraction of less than one (1) share resulting from such adjustment.
Number of Shares Acquired after adjustment = Number of Shares Acquired before adjustment x Ratio of share split or share consolidation
The Number of Shares Acquired after adjustment shall become effective, in the case of a share split, on and after the day immediately following the record date of the relevant share split (if the record date is not set forth, on and after its effective date) or, in the case of a share consolidation, on and after its effective date; provided, however, that, in the event that a share split is conducted on the condition that a proposal to increase the capital or reserves by reducing the amount of surplus is approved at a general meeting of shareholders and that the record date for such share split is prior to the date of closing of such general meeting of shareholders, the Number of Shares Acquired after adjustment shall be applicable retroactively
- 38 -

from the day immediately following the relevant record date, on and after the day immediately following the date of closing of the relevant general meeting of shareholders. In addition to the above, in any event that makes it necessary to adjust the Number of Shares Acquired, including a merger and company split, Panasonic may make appropriate adjustment to the Number of Shares Acquired within a reasonable range. When the Number of Shares Acquired is adjusted, Panasonic shall give notice of necessary matters to each holder of the stock acquisition rights registered in the register of stock acquisition rights (the "Holder") or give public notice thereof, no later than the day immediately preceding the date on which the Number of Shares Acquired after adjustment shall become effective; provided, however, that, if Panasonic is unable to give such notice or public notice no later than the day immediately preceding such applicable date, Panasonic shall thereafter promptly give such notice or public notice.
2. Issue price is the total of the fair value of the stock acquisition rights in allotment date and the subscription amount to be paid upon exercise of stock acquisition (one (1) yen per share).
3. The amount of capital to be increased due to the issuance of shares upon exercise of the stock acquisition rights shall be a half of the maximum amount of capital Increase, etc. which is calculated in accordance with Article 17, Paragraph 1 of the Ordinance on Company Accounting, and any fraction less than one (1) yen arising therefrom shall be rounded up to the nearest one (1) yen.
4.(i) During the period when the stock acquisition rights may be exercised, the Holder may exercise the stock acquisition rights on and after the day immediately following the date on which such Holder loses the status of Director, Executive Officer, Audit & Supervisory Board Member or any status equivalent thereto, of Panasonic.
(ii) Notwithstanding (i) above, the Holder may exercise the stock acquisition rights within the respective periods prescribed below if either (a) or (b) below occurs (provided that the case mentioned in (b) below excludes where the allotment of stock acquisition rights by the reorganized company to the Holder in accordance with "Matters regarding grant of stock acquisition rights accompanying reorganization" above is stipulated in a merger agreement, a share exchange agreement, or a share transfer plan): (a) If the Status Losing Date does not occur on or before the date that is one year prior to the expiration
date of "Exercise period of stock acquisition rights": From the next day of the date that is one year prior to the expiration date of "Exercise period of stock acquisition rights" to expiration date of "Exercise period of stock acquisition rights"
(b) If proposal for approval of a merger agreement under which Panasonic shall become a dissolving company or proposal for approval of a share exchange agreement or share transfer plan under which Panasonic shall become a wholly-owned subsidiary is approved at a general meeting of shareholders (or, if a resolution of a general meeting of shareholders is not required, is approved by a resolution of the Board of Directors):
During a 15 day-period commencing from the day immediately following the date (inclusive) when the proposal is approved.
(iii) (i) and (ii) (a) above shall not be applicable to those who have succeeded to the stock acquisition rights by inheritance.
(iv) If the Holder waives the stock acquisition rights, the relevant stock acquisition rights may not be exercised thereafter.
5. If Panasonic conducts a merger (limited to the case where Panasonic is dissolved due to the merger), an absorption-type or incorporation-type company split (both, limited to the case where Panasonic is split), or a share exchange or transfer (both, limited to the case where Panasonic becomes a wholly-owned subsidiary) (collectively, the "Structural Reorganization"), Panasonic shall, in each of the above cases, allot stock acquisition rights of any of the relevant companies listed in "a" through "e" of Article 236, Paragraph 1, Item 8 of the Companies Act (the "Reorganized Company") to the Holders holding the stock acquisition rights remaining at the time immediately preceding the effective date of the relevant Structural Reorganization (the "Remaining Stock Acquisition Rights") (the effective date of the relevant Structural Reorganization shall mean, in the case of a merger, the date on which the merger becomes effective; in the case of a consolidation, the date of establishment of a newly-incorporated company through consolidation; in the case of an absorption-type company split, the date on which such absorption type company split becomes effective; in the case of an incorporation-type company split, the date of establishment of a newly-incorporated company through such incorporation-type company split; in the case of a share exchange, the date on which the share
- 39 -

exchange becomes effective; and in the case of a share transfer, the date of establishment of a wholly-owning parent company through the share transfer; hereinafter the same shall apply). In this case, the Remaining Stock Acquisition Rights shall be extinguished and the Reorganized Company shall issue new stock acquisition rights; provided, however, that the foregoing shall be on the condition that transfer of such stock acquisition rights by the Reorganized Company in accordance with each of the following items is stipulated in a merger agreement, a consolidation agreement, an absorption-type company split agreement, an incorporation-type company split plan, a share exchange agreement or a share transfer plan.
(i) Number of stock acquisition rights of the Reorganized Company to be allotted: A number equal to the number of the Remaining Stock Acquisition Rights held by the Holder shall be transferred to such Holder.
(ii) Class of shares of the Reorganized Company to be acquired upon exercise of stock acquisition rights: Common stock of the Reorganized Company.
(iii) Number of shares of the Reorganized Company to be acquired upon exercise of stock acquisition rights: To be determined in accordance with "Numbers of shares to be acquired upon exercise of stock acquisition rights " above, taking into consideration, among others, the conditions of Structural Reorganization.
(iv) Value of assets to be contributed upon exercise of each stock acquisition right: The value of assets to be contributed upon exercise of each stock acquisition right to be allotted shall be the amount obtained by multiplying (x) the exercise price after reorganization set forth below by (y) the number of shares of the Reorganized Company to be acquired upon exercise of the relevant stock acquisition rights as determined in accordance with (iii) above. The "exercise price after reorganization" shall be one (1) yen per share of the Reorganized Company to be acquired upon exercise of each of its stock acquisition rights.
(v) Exercise period of stock acquisition rights: From and including whichever is the later of (x) the commencement date of the period during which the stock acquisition rights may be exercised as provided for in " Exercise period of stock acquisition rights " above or (y) the effective date of the Structural Reorganization, to and including the expiration date of the period during which the stock acquisition rights may be exercised as provided for in " Exercise period of stock acquisition rights " above.
(vi) Matters concerning capital and capital reserve to be increased due to issuance of shares upon exercise of stock acquisition rights: To be determined in accordance with " Issue price for shares issued through the exercise of the stock acquisition rights and the amount capitalized as common stock " above.
(vii) Restrictions on acquisition of stock acquisition rights by transfer: The stock acquisition rights cannot be acquired through transfer, unless such acquisition is expressly approved by a resolution of the Board of Directors of the Reorganized Company.
(viii) Provisions concerning acquisition of stock acquisition rights: If any of the proposals set forth in (a), (b), (c), (d) and (e) below is approved at a general meeting of shareholders of Panasonic (or, if a resolution of a general meeting of shareholders is not required, is approved by a resolution of the Board of Directors of Panasonic), Panasonic may acquire the stock acquisition rights without consideration on the date to be separately determined by the Board of Directors: (a) Proposal for approval of a merger agreement under which Panasonic shall become a dissolving
company; (b) Proposal for approval of split agreement or split plan under which Panasonic shall be split; (c) Proposal for approval of a share exchange agreement or share transfer plan under which Panasonic
shall become a wholly-owned subsidiary; (d) Proposal for approval of an amendment to the Articles of Incorporation in order to establish the
provision that an acquisition by way of transfer of any shares issued or to be issued by Panasonic shall require the approval of Panasonic; and
(e) Proposal for approval of an amendment to the Articles of Incorporation in order to establish the provision that an acquisition by way of transfer of a class of shares to be acquired upon exercise of the stock acquisition rights shall require the approval of Panasonic or that Panasonic may acquire all of such class of shares upon a resolution of a general meeting of shareholders.
(ix) Conditions for exercise of stock acquisition rights: To be determined in accordance with " Conditions for exercise of stock acquisition rights" above.
- 40 -

6. The contents are described as of the end of fiscal 2018 (March 31, 2018). The description as of the end of the
month previous to the filing is omitted, because there is no change in what should be described from the end of fiscal 2018 to the end of the month previous to the filing (May 31, 2018).
Resolution date of the Board of Directors July 29, 2016
Category and number of persons granted
Directors of the Company (excluding Outside Directors) : 13 Executive Officers and certain other officers (excluding Directors who concurrently serve as Executive officers) : 23 Former Directors of the Company and Former Executive Officers and certain other officers : 2
Number of stock acquisition rights Note 6
5,800
Class, details and number of shares to be acquired upon exercise of stock acquisition rights
Note 6
Common stock of Panasonic 580,000 shares
Note 1
Subscription amount to be paid upon exercise of stock acquisition
One (1) yen
Exercise period of stock acquisition rights From August 24, 2016 to August 23, 2046
Issue price for shares issued through the exercise of the stock acquisition rights and the amount capitalized as common stock
Issue price : 714 yen Note 2
Amount capitalized as common stock
Note 3 Conditions for exercise of stock acquisition rights
Note 4
Matters regarding transfer of stock acquisition rights
The stock acquisition rights cannot be acquired through transfer, unless such acquisition is expressly approved by a resolution of the Board of Directors.
Matters regarding grant of stock acquisition rights accompanying reorganization
Note 5
(Notes) 1-3, 5, 6. Same as respective notes of resolution of the Board of Directors meeting held on July 31, 2014 and
resolution of the Board of Directors meeting held on July 29, 2015. 4. (i) During the period when the stock acquisition rights may be exercised, the Holder may exercise the
stock acquisition rights on and after the day immediately following the date on which such Holder loses the status of Director, Executive Officer, Audit & Supervisory Board Member or any status equivalent thereto, of Panasonic, or the day immediately following the day when three (3) years have
- 41 -

transpired since the day immediately following the day the stock acquisition rights were allotted, whichever falls earlier.
(ii) Notwithstanding (i) above, if proposal for approval of a merger agreement under which Panasonic shall become a dissolving company or proposal for approval of a share exchange agreement or share transfer plan under which Panasonic shall become a wholly-owned subsidiary is approved at a general meeting of shareholders (or, if a resolution of a general meeting of shareholders is not required, is approved by a resolution of the Board of Directors), stock acquisition rights can be exercised only in a 15 day-period commencing from the day immediately following the date (inclusive) when the proposal is approved. Provided it excludes where the allotment of stock acquisition rights by the Reorganized Company to the Holder in accordance with "Matters regarding grant of stock acquisition rights accompanying reorganization" above is stipulated in a merger agreement, a share exchange agreement, or a share transfer plan.
(iii) (i) above shall not be applicable to those who have succeeded to the stock acquisition rights by inheritance.
(iv) If the Holder waives the stock acquisition rights, the relevant stock acquisition rights may not be exercised thereafter.
- 42 -

Resolution date of the Board of Directors July 31, 2017
Category and number of persons granted
Directors of the Company (excluding Outside Directors) : 8 Executive Officers and certain other officers (excluding Directors who concurrently serve as Executive officers) : 31 Former Executive Officer : 1
Number of stock acquisition rights Note 6
3,561 [3,461]
Class, details and number of shares to be acquired upon exercise of stock acquisition rights
Note 6
Common stock of Panasonic 356,100 shares
[346,100 shares] Note 1
Subscription amount to be paid upon exercise of stock acquisition
One (1) yen
Exercise period of stock acquisition rights From August 24, 2017 to August 23, 2047
Issue price for shares issued through the exercise of the stock acquisition rights and the amount capitalized as common stock
Issue price : 1,129 yen Note 2
Amount capitalized as common stock
Note 3 Conditions for exercise of stock acquisition rights
Note 4
Matters regarding transfer of stock acquisition rights
The stock acquisition rights cannot be acquired through transfer, unless such acquisition is expressly approved by a resolution of the Board of Directors.
Matters regarding grant of stock acquisition rights accompanying reorganization
Note 5
(Notes) 1-3, 5. Same as respective notes of resolution of the Board of Directors meeting held on July 31, 2014 and
resolution of the Board of Directors meeting held on July 29, 2015. 4. (i) During the period when the stock acquisition rights may be exercised, the Holder may exercise the stock
acquisition rights on and after the day immediately following the date on which such Holder loses the status of Director, Executive Officer, Audit & Supervisory Board Member or any status equivalent thereto, of Panasonic, or the day immediately following the day when three (3) years have transpired since the day immediately following the day the stock acquisition rights were allotted, whichever falls earlier.
(ii) Notwithstanding (i) above, if proposal for approval of a merger agreement under which Panasonic shall become a dissolving company or proposal for approval of a share exchange agreement or share transfer plan under which Panasonic shall become a wholly-owned subsidiary is approved at a general meeting of shareholders (or, if a resolution of a general meeting of shareholders is not required, is approved by a resolution of the Board of Directors), stock acquisition rights can be exercised only in a 15 day-period
- 43 -

commencing from the day immediately following the date (inclusive) when the proposal is approved. Provided it excludes where the allotment of stock acquisition rights by the Reorganized Company to the Holder in accordance with "Matters regarding grant of stock acquisition rights accompanying reorganization" above is stipulated in a merger agreement, a share exchange agreement, or a share transfer plan.
(iii) (i) above shall not be applicable to those who have succeeded to the stock acquisition rights by inheritance.
(iv) If the Holder waives the stock acquisition rights, the relevant stock acquisition rights may not be exercised thereafter.
6. The contents are described as of the end of fiscal 2018 (March 31, 2018). The items which changed during the period from the end of fiscal 2018 to the end of the month previous to the filing (May 31, 2018), the contents described in [ ] as of the end of the month previous to the filing. No other contents changed from the end of fiscal 2018.
- 44 -

(Resolution contents after the end of fiscal 2018) The following stock acquisition rights did not exist on the end of fiscal 2018 (March 31, 2018) and the end of the month previous to the filling (May 31, 2018). The Board of Directors approved to allot the stock acquisition rights on June 28, 2018.
Resolution date of the Board of Directors June 28, 2018
Category and number of persons granted
Directors of the Company (excluding Outside Directors) : 7 Executive Officers and certain other officers (excluding Directors who concurrently serve as Executive officers) : 34 Former Executive Officer : 1
Number of stock acquisition rights 3,473 Class, details and number of shares to be acquired upon exercise of stock acquisition rights
Common stock of Panasonic 347,300 shares
Note 1 Subscription amount to be paid upon exercise of stock acquisition
One (1) yen
Exercise period of stock acquisition rights From July 19, 2018 to July 18, 2048
Issue price for shares issued through the exercise of the stock acquisition rights and the amount capitalized as common stock
Issue price Note 2
Amount capitalized as common stock
Note 3 Conditions for exercise of stock acquisition rights
Note 4
Matters regarding transfer of stock acquisition rights
The stock acquisition rights cannot be acquired through transfer, unless such acquisition is expressly approved by a resolution of the Board of Directors.
Matters regarding grant of stock acquisition rights accompanying reorganization
Note 5
(Notes) 1, 3, 5. Same as respective notes of resolution of the Board of Directors meeting held on July 31, 2014 and
resolution of the Board of Directors meeting held on July 29, 2015. 4. Same as respective notes of resolution of the Board of Directors meeting held on July 31, 2017. 2. Issue price is the total of the fair value of the stock acquisition rights in allotment date and the
subscription amount to be paid upon exercise of stock acquisition (one (1) yen per share).The fair value of the stock acquisition rights is the option price per share calculated by the Black-Sholes Model on the day of the allotment.
- 45 -

2) Details of rights plans
Not applicable.
3) Other share acquisition rights
Not applicable.
(3) Information on moving strike convertible bonds, etc.
Not applicable.
(4) Changes in the total number of issued shares and the amount of common stock, etc.
Date
Change in the total
number of issued shares
(Thousands)
Balance of the total
number of issued shares
(Thousands)
Change in common stock
(millions of yen)
Balance of common stock
(millions of yen)
Change in capital reserve
(millions of yen)
Balance of capital reserve
(millions of yen)
August 31, 2013*
― 2,453,053 ― 258,740 (568,212) ―
* The full amount of the capital reserve was reduced and the reduced amount was allocated to other capital surplus, pursuant to Article 448, Paragraph 1 of the Companies Act.
(5) Composition of Issued Shares by Type of Shareholders As of March 31, 2018
Class
Status of shares (one unit of stock: 100 shares) Number of shares less than one
unit (shares)
National and local
governments Financial
institutions
Financial instruments
business operators
Other institutions
Foreign shareholders Individual and others Total Non-
individuals Individuals
Number of shareholders (persons)
1 218 100 3,426 1,016 380 422,603 427,744 ―
Share ownership (units)
1 7,371,244 461,695 1,667,088 8,167,015 12,271 6,771,467 24,450,781 7,975,397
Percentage of shares (%)
0.00 30.15 1.89 6.82 33.40 0.05 27.69 100.00 ―
(Notes) 1. Of 120,718,303 shares of treasury stock, 1,207,183 units are included in "Individual and others," and 3
shares are included in "Number of shares less than one unit." 2. Of the shares registered in the name of Japan Securities Depository Center, Inc., 127 units are included in
"Other institutions," and 89 shares are included in "Number of shares less than one unit."
- 46 -
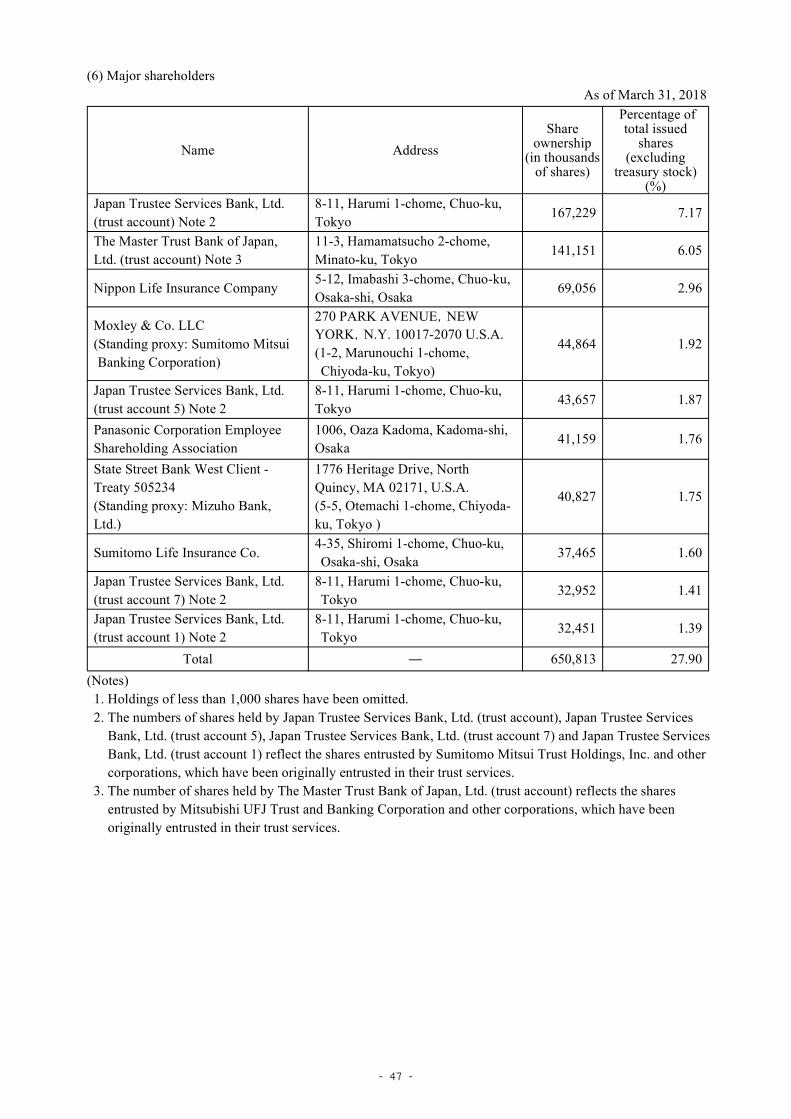
(6) Major shareholders As of March 31, 2018
Name Address Share
ownership (in thousands
of shares)
Percentage of total issued
shares(excluding
treasury stock) (%)
Japan Trustee Services Bank, Ltd. (trust account) Note 2
8-11, Harumi 1-chome, Chuo-ku, Tokyo
167,229 7.17
The Master Trust Bank of Japan, Ltd. (trust account) Note 3
11-3, Hamamatsucho 2-chome, Minato-ku, Tokyo
141,151 6.05
Nippon Life Insurance Company 5-12, Imabashi 3-chome, Chuo-ku, Osaka-shi, Osaka
69,056 2.96
Moxley & Co. LLC
(Standing proxy: Sumitomo Mitsui Banking Corporation)
270 PARK AVENUE,NEW YORK,N.Y. 10017-2070 U.S.A. (1-2, Marunouchi 1-chome, Chiyoda-ku, Tokyo)
44,864 1.92
Japan Trustee Services Bank, Ltd. (trust account 5) Note 2
8-11, Harumi 1-chome, Chuo-ku, Tokyo
43,657 1.87
Panasonic Corporation Employee Shareholding Association
1006, Oaza Kadoma, Kadoma-shi, Osaka
41,159 1.76
State Street Bank West Client - Treaty 505234 (Standing proxy: Mizuho Bank, Ltd.)
1776 Heritage Drive, North Quincy, MA 02171, U.S.A. (5-5, Otemachi 1-chome, Chiyoda-ku, Tokyo )
40,827 1.75
Sumitomo Life Insurance Co. 4-35, Shiromi 1-chome, Chuo-ku, Osaka-shi, Osaka
37,465 1.60
Japan Trustee Services Bank, Ltd. (trust account 7) Note 2
8-11, Harumi 1-chome, Chuo-ku, Tokyo
32,952 1.41
Japan Trustee Services Bank, Ltd. (trust account 1) Note 2
8-11, Harumi 1-chome, Chuo-ku, Tokyo
32,451 1.39
Total ― 650,813 27.90 (Notes) 1. Holdings of less than 1,000 shares have been omitted. 2. The numbers of shares held by Japan Trustee Services Bank, Ltd. (trust account), Japan Trustee Services
Bank, Ltd. (trust account 5), Japan Trustee Services Bank, Ltd. (trust account 7) and Japan Trustee Services Bank, Ltd. (trust account 1) reflect the shares entrusted by Sumitomo Mitsui Trust Holdings, Inc. and other corporations, which have been originally entrusted in their trust services.
3. The number of shares held by The Master Trust Bank of Japan, Ltd. (trust account) reflects the shares entrusted by Mitsubishi UFJ Trust and Banking Corporation and other corporations, which have been originally entrusted in their trust services.
- 47 -
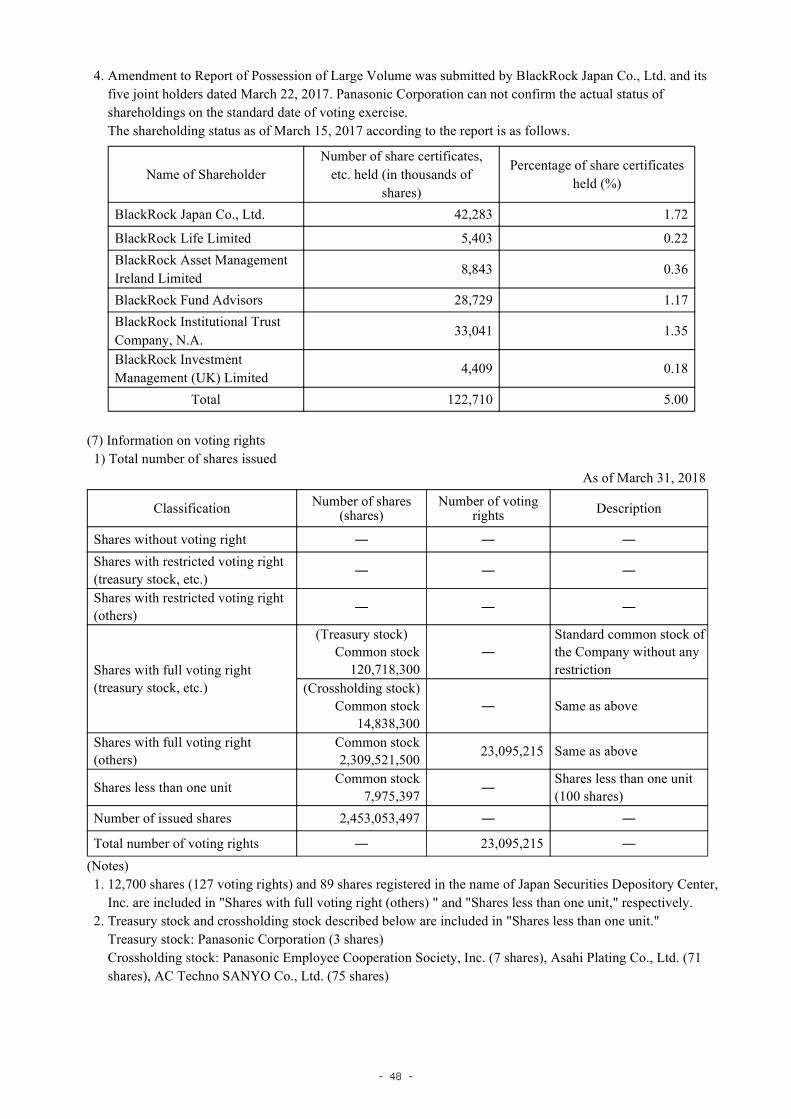
4. Amendment to Report of Possession of Large Volume was submitted by BlackRock Japan Co., Ltd. and its five joint holders dated March 22, 2017. Panasonic Corporation can not confirm the actual status of shareholdings on the standard date of voting exercise. The shareholding status as of March 15, 2017 according to the report is as follows.
Name of Shareholder Number of share certificates,
etc. held (in thousands of shares)
Percentage of share certificates held (%)
BlackRock Japan Co., Ltd. 42,283 1.72
BlackRock Life Limited 5,403 0.22 BlackRock Asset Management Ireland Limited
8,843 0.36
BlackRock Fund Advisors 28,729 1.17 BlackRock Institutional Trust Company, N.A.
33,041 1.35
BlackRock Investment Management (UK) Limited
4,409 0.18
Total 122,710 5.00
(7) Information on voting rights 1) Total number of shares issued
As of March 31, 2018
Classification Number of shares (shares)
Number of voting rights Description
Shares without voting right ― ― ―
Shares with restricted voting right (treasury stock, etc.) ― ― ―
Shares with restricted voting right (others) ― ― ―
Shares with full voting right (treasury stock, etc.)
(Treasury stock) Common stock
120,718,300 ―
Standard common stock of the Company without any restriction
(Crossholding stock) Common stock
14,838,300 ― Same as above
Shares with full voting right (others)
Common stock 2,309,521,500 23,095,215 Same as above
Shares less than one unit Common stock 7,975,397 ―
Shares less than one unit (100 shares)
Number of issued shares 2,453,053,497 ― ―
Total number of voting rights ― 23,095,215 ―
(Notes) 1. 12,700 shares (127 voting rights) and 89 shares registered in the name of Japan Securities Depository Center,
Inc. are included in "Shares with full voting right (others) " and "Shares less than one unit," respectively. 2. Treasury stock and crossholding stock described below are included in "Shares less than one unit."
Treasury stock: Panasonic Corporation (3 shares) Crossholding stock: Panasonic Employee Cooperation Society, Inc. (7 shares), Asahi Plating Co., Ltd. (71 shares), AC Techno SANYO Co., Ltd. (75 shares)
- 48 -

2) Treasury stock, etc. As of March 31, 2018
Name of shareholder Address
Number of shares held under own
name (shares)
Number of shares held under the name of others
(shares)
Total shares held
(Shares)
Percentage of total
issued shares (%)
(Treasury stock)
Panasonic Corporation 1006, Oaza Kadoma, Kadoma-shi, Osaka
120,718,300 ― 120,718,300 4.92
(Crossholding stock)
Panasonic Employee Cooperation Society, Inc.
1006, Oaza Kadoma, Kadoma-shi, Osaka
14,798,800
―
14,798,800
0.60
Asahi Plating Co., Ltd.
5-16, Shinmori 4-chome, Asahi-ku, Osaka-shi, Osaka
23,400
―
23,400
0.00
Osaka National Electric Works Co., Ltd.
7-21, Imagawa 8-chome, Higashisumiyoshi -ku, Osaka-shi, Osaka
10,000
―
10,000
0.00
AC Techno SANYO Co., Ltd.
597-1, Nisshincho 3-chome, Kita-ku, Saitama-shi, Saitama
5,100
―
5,100
0.00
Sanin Panasonic Corporation
416, Watarihashicho, Izumo-shi, Shimane
1,000
―
1,000
0.00
Crossholding stock total ― 14,838,300 ― 14,838,300 0.60 Total ― 135,556,600 ― 135,556,600 5.52
- 49 -

2. Information on Acquisition of Treasury Stock, etc.
Class of shares Acquisition of common stock under Article 155, Item 7 of the Companies Act and acquisition of common stock under Article 155, Item 9 of the Companies Act.
(1) Acquisition of treasury stock resolved at the general meeting of shareholders
Not applicable.
(2) Acquisition of treasury stock resolved at the Board of Directors meetings
Not applicable.
(3) Details of acquisition of treasury stock not based on the resolutions of the general meeting of shareholders or the Board of Directors meetings
Classification Number of shares (shares) Total amount (yen)
Treasury stock acquired during the fiscal year ended March 31, 2018
77,386 119,202,164
Treasury stock acquired during the current period 5,629 8,844,799 (Note) With regard to "Treasury stock acquired during the current period," the number of treasury stock acquired due to requests to purchase stock less than one unit shares from June 1, 2018 to the filing date is not included.
(4) Status of the disposition and holding of acquired treasury stock
Classification
Fiscal year ended March 31, 2018 Current period
Number of shares (shares)
Total disposition
amount (yen) Number of
shares (shares) Total
disposition amount (yen)
Acquired treasury stock which was offered to subscribers
― ― ― ―
Acquired treasury stock which was canceled
― ― ― ―
Acquired treasury stock which was transferred due to merger, share exchange or company split
― ― ― ―
Others Note 2 7,806 13,637,422 10,254 17,913,816
Total numbers of treasury stock held 120,718,303 ― 120,713,678 ―
(Notes) 1. With regard to "Number of shares (shares)" and "Total disposition amount (yen)" of the current period, the
number of treasury stock which was sold or acquired due to requests from shareholders holding less than one unit shares to purchase or sell additional shares from June 1, 2018 to the filing date are not included.
2. The breakdown of "others" in "Fiscal year ended March 31, 2018" are selling due to requests from shareholders holding shares less than one unit shares to sell additional shares (Number of shares 4,806 shares, Total disposition amount 8,396,364 yen) and exercise of stock acquisition rights (Number of shares 3,000 shares, Total disposition amount 5,241,058 yen) The breakdown of "others" in "Current period" are selling due to requests from shareholders holding shares less than one unit shares to sell additional shares (Number of shares 254 shares, Total disposition amount 443,740 yen) and exercise of stock acquisition rights (Number of shares 10,000 shares, Total disposition amount 17,470,076 yen)
- 50 -

3. Dividend Policy
Since its foundation, Panasonic has managed its businesses under the concept that returning profits to shareholders is one of its most important policies. From the perspective of providing returns on the capital investment made by shareholders, the Company, in principle, distributes profits to shareholders based on its business performance and strives to provide stable and continuous dividends, targeting a dividend payout ratio of approximately 30% with respect to consolidated net profit attributable to Panasonic Corporation stockholders.
Panasonic pays dividends twice a year, an interim and a year-end. Dividends are resolved at the Board of Directors meeting under articles of incorporation.
In view of this basic policy as well as its current financial position, Panasonic expects to pay an annual dividend of 30 yen per share for fiscal 2018, which includes the interim dividend of 10 yen per share and a year-end dividend of 20 yen per share.
The Company will utilize its internal reserve funds for further enhancing the management structure and future business development.
Dividends for the 111th term are as follows.
Resolution date Total amount of dividends
(Millions of yen) Dividends per share (yen)
The Board of Directors meeting held on October 31, 2017
23,324 10.0
The Board of Directors meeting held on May 10, 2018
46,647 20.0
4. Stock Prices
(1) Highest and lowest stock prices in the recent five fiscal years
Fiscal year 107th business term
108th business term
109th business term
110th business term
111th business term
Year end March 2014 March 2015 March 2016 March 2017 March 2018
Highest (yen)
1,408 1,614.0 1,853.5 1,309.5 1,800.0
Lowest (yen)
594 1,030 799.0 831.4 1,207.5
(Note) The stock prices are market prices on the first section of the Tokyo Stock Exchange.
(2) Highest and lowest stock prices in the recent six months
Month October 2017
November 2017
December 2017
January 2018
February 2018
March 2018
Highest (yen)
1,731.5 1,800.0 1,693.5 1,740.5 1,706.5 1,696.5
Lowest (yen)
1,594.5 1,646.0 1,579.0 1,610.5 1,523.5 1,479.0
(Note) The stock prices are market prices on the first section of the Tokyo Stock Exchange.
- 51 -

5. Member of the Board of Directors and Audit & Supervisory Board Members
Consisting of 15 men and 2 women (the ratio of women members in the Board of Directors and Audit & Supervisory Board Members is 11.8%.)
Position Responsibility Name Date of birth Brief personal records Term of office
Share ownership
(100 shares)
Director, Chairman of
the Board
Shusaku Nagae
January 30, 1950
Apr. 1972 Joined Matsushita Electric Works, Ltd. (MEW);
Note 4 387
Dec. 2004 Managing Executive Officer, MEW;
June 2007 Managing Director, MEW;
June 2010 President, Panasonic Electric Works Co., Ltd. (former MEW);
Apr. 2011 Senior Managing Executive Officer of the Company / In charge of Lighting Company and Panasonic Ecology Systems Co., Ltd.;
Jan. 2012 In charge of Solution Business / President, Eco Solutions Company;
June 2012 Executive Vice President of the Company / In charge of Corporate Division for Promoting Energy Solution Business;
June 2013 Chairman of the Board of Directors (current position).
Director, Vice
Chairman of the Board
Masayuki Matsushita
October 16, 1945
Apr. 1968 Joined the Company;
Note 4 127,231
Oct. 1981 Director, Washing Machine Division;
Feb. 1986 Director of the Company; June 1990 Managing Director of the
Company; June 1992 Senior Managing Director of the
Company; July 1995 In charge of Overseas
Operations; June 1996 Executive Vice President of the
Company; June 2000 Vice Chairman of the Board of
Directors (current position).
- 52 -

Position Responsibility Name Date of birth Brief personal records Term of office
Share ownership
(100 shares)
Representative Director, President
President/ CEO
Kazuhiro Tsuga
November 14, 1956
Apr. 1979 Joined the Company;
Note 4 677
June 2001 Director, Multimedia Development Center;
June 2004 Executive Officer of the Company / In charge of Digital Network & Software Technology;
Apr. 2008 Managing Executive Officer of the Company / President, Panasonic Automotive Systems Company;
Apr. 2011 Senior Managing Executive Officer of the Company / President, AVC Networks Company;
June 2011 Senior Managing Director of the Company;
June 2012 June 2017
President of the Company; Representative Director, President of the Company (current position) / President of the Company (current position) / Chief Executive Officer (CEO) (current position).
Representative Director
Executive Vice
President/ CEO,
Automotive & Industrial
Systems Company
Yoshio Ito
March 18, 1953
Apr. 1973 Joined the Company;
Note 4 449
Apr. 2006 Vice President, Panasonic AVC Networks Company / Director, System Business Group;
Apr. 2009 Executive Officer of the Company / President, Lighting Company;
Jan. 2013 President, Industrial Devices Company / President, Energy Company;
Apr. 2013 Managing Executive Officer of the Company;
Apr. 2014 Senior Managing Executive Officer of the Company / President (now CEO) , Automotive & Industrial Systems Company (current position) ;
June 2014
Apr. 2017
June 2017
Senior Managing Director of the Company; Executive Vice President of the Company Representaive Director of the Company (current position) / Executive Vice President of the Company (current position).
- 53 -
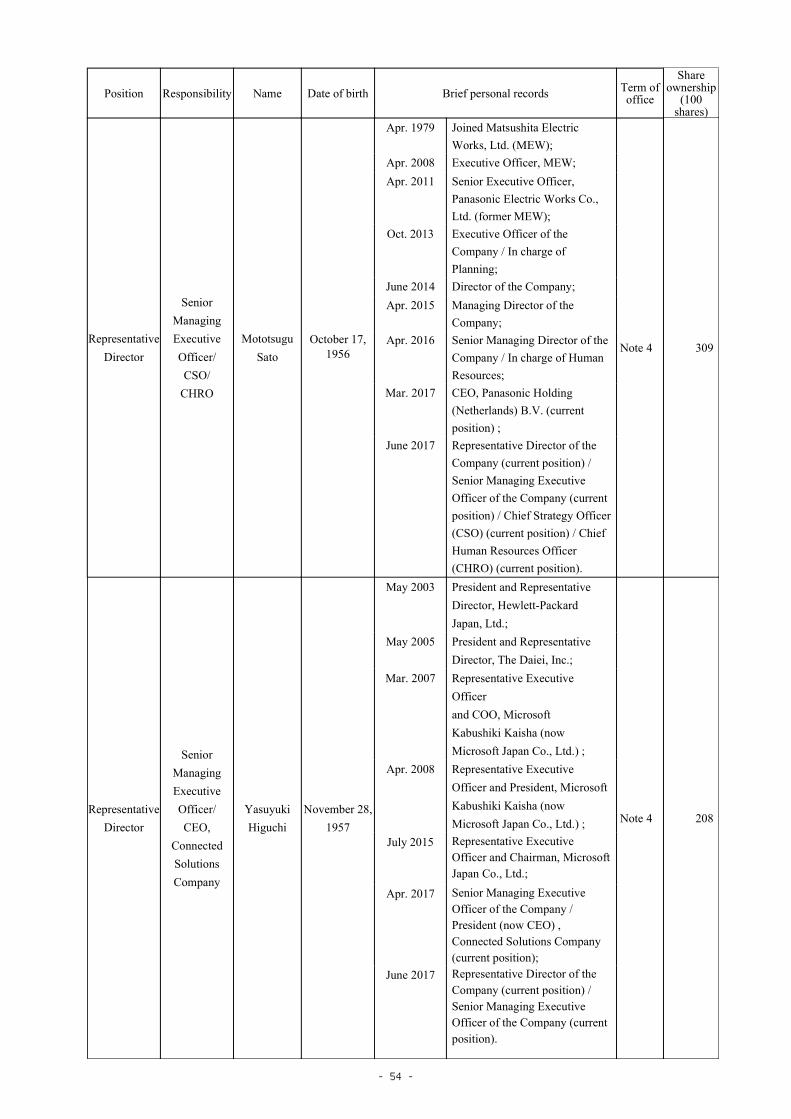
Position Responsibility Name Date of birth Brief personal records Term of office
Share ownership
(100 shares)
Representative Director
Senior Managing Executive Officer/ CSO/
CHRO
Mototsugu Sato
October 17, 1956
Apr. 1979 Joined Matsushita Electric Works, Ltd. (MEW);
Note 4 309
Apr. 2008 Executive Officer, MEW; Apr. 2011 Senior Executive Officer,
Panasonic Electric Works Co., Ltd. (former MEW);
Oct. 2013 Executive Officer of the Company / In charge of Planning;
June 2014 Director of the Company; Apr. 2015
Managing Director of the Company;
Apr. 2016 Senior Managing Director of the Company / In charge of Human Resources;
Mar. 2017
CEO, Panasonic Holding (Netherlands) B.V. (current position) ;
June 2017 Representative Director of the Company (current position) / Senior Managing Executive Officer of the Company (current position) / Chief Strategy Officer (CSO) (current position) / Chief Human Resources Officer (CHRO) (current position).
Representative Director
Senior Managing Executive Officer/ CEO,
Connected Solutions Company
Yasuyuki Higuchi
November 28, 1957
May 2003 President and Representative Director, Hewlett-Packard Japan, Ltd.;
Note 4 208
May 2005
President and Representative Director, The Daiei, Inc.;
Mar. 2007 Representative Executive Officer and COO, Microsoft Kabushiki Kaisha (now
Microsoft Japan Co., Ltd.) ; Apr. 2008 Representative Executive
Officer and President, Microsoft Kabushiki Kaisha (now Microsoft Japan Co., Ltd.) ;
July 2015
Representative Executive Officer and Chairman, Microsoft Japan Co., Ltd.;
Apr. 2017 Senior Managing Executive Officer of the Company / President (now CEO) , Connected Solutions Company (current position);
June 2017 Representative Director of the Company (current position) / Senior Managing Executive Officer of the Company (current position).
- 54 -

Position Responsibility Name Date of birth Brief personal records Term of office
Share ownership
(100 shares)
Director Masayuki
Oku December 2,
1944
June 2005 President, Sumitomo Mitsui Banking Corporation / Chairman, Board of Directors of Sumitomo Mitsui Financial Group, Inc.;
Note 4 10 June 2008 Director of the Company
(current position); June 2017 Honorary Advisor, Sumitomo
Mitsui Financial Group, Inc. (current position).
Director Yoshinobu
Tsutsui January 30,
1954
Apr. 2011
June 2015
President, Nippon Life Insurance Company; Director of the Company (current position); Note 4 ―
Apr. 2018 Chairman, Nippon Life Insurance Company (current position).
Director Hiroko Ota February 2,
1954
Sep. 2006 Minister of State for Economic and Fiscal Policy;
Note 4 50 Aug. 2008 Professor of National Graduate
Institute for Policy Studies (current position);
June 2013 Director of the Company (current position).
Director Kazuhiko Toyama
April 15, 1960
Apr. 2003 Senior Representative Director (COO), Industrial Revitalization Corporation of Japan;
Note 4 140 Apr. 2007 Representative Director (CEO),
Industrial Growth Platform, Inc. (current position);
June 2016 Director of the Company (current position).
Director
Managing Executive Officer/
CFO
Hirokazu Umeda
January 13, 1962
Apr. 1984 Oct. 2012
Apr. 2017
June 2017
Joined the Company; General Manager, Corporate Management Support Group, Corporate Strategy Division; Executive Officer of the Company / In charge of Accounting and Finance; Director of the Company (current position) / Executive Officer of the Company / Chief Financial Officer (CFO) (current position);
Note 4 110
Apr. 2018 Managing Executive Officer of the Company (current position) / President, Panasonic Equity Management Japan Co., Ltd. (current position).
- 55 -

Position Responsibility Name Date of birth Brief personal records Term of office
Share ownership
(100 shares)
Director
Executive Officer/
GC/ CRO/ CCO
Laurence W. Bates
February 13, 1958
Mar. 1987 Admitted to New York State Bar (current position);
Note 4 1
Sep. 1998 General Counsel-Japan, General Electric Company, Tokyo;
Apr. 2014 Senior Managing Director and Chief Legal Officer, LIXIL Group Corporation, Tokyo;
Apr. 2018 Executive Officer of the Company (current position) / General Counsel (GC) (current position) / Chief Risk Management Officer (CRO) (current position) / Chief Compliance Officer (CCO) (current position);
June 2018 Director of the Company (current position).
Senior Audit & Supervisory
Board Member
Hirofumi Yasuhara
August 28, 1956
Apr. 1979 Joined the Company;
Note 5 ―
June 2008 Director, PanaHome Corporation;
June 2012 Representative Director, PanaHome Corporation;
June 2014 Senior Audit & Supervisory Officer (non-statutory, full- time), Automotive &
Industrial Systems Company of Panasonic Corporation;
June 2015 Senior Audit & Supervisory Board Member of the Company (current position).
Senior Audit & Supervisory
Board Member
Mamoru Yoshida
May 21, 1956
Apr. 1979 Joined the Company;
Note 6 348
Apr. 2008 Vice President, Panasonic AVC Networks Company / Director, Network Business Group;
Apr. 2009 Executive Officer of the Company / Senior Vice President, AVC Networks Company;
Apr. 2012 Managing Executive Officer of the Company / President, AVC Networks Company;
June 2012 Managing Director of the Company;
Apr. 2013 In charge of Technology, Intellectual Property and information Systems;
Apr. 2015 Senior Vice President, Appliances Company;
June 2015 Managing Executive Officer of the Company;
June 2016 Senior Audit & Supervisory Board Member of the Company (current position).
- 56 -

Position Responsibility Name Date of birth Brief personal records Term of office
Share ownership
(100 shares)
Audit & Supervisory
Board Member
Yoshio
Sato August 25,
1949
July 2007 President and Director, Chief Executive Officer (Representative Director) of Sumitomo Life Insurance Company;
Note 7 ―
July 2011 President and Representative Director, Chief Executive Officer of Sumitomo Life Insurance Company;
Apr. 2014 Chairman and Representative Director of Sumitomo Life Insurance Company;
June 2014 Audit & Supervisory Board Member of the Company (current position);
July 2015 Chairman of the Board of Sumitomo Life Insurance Company (current position).
Audit & Supervisory
Board Member
Toshio
Kinoshita April 12,
1949
July 1983 Registered as Certified Public Accountant (Japan) (current position);
Note 7 ―
June 1994 Senior Partner of Chuo Audit Corporation;
July 1998 Managing Partner for Japanese Business Network of PricewaterhouseCoopers LLP National Office;
July 2007 Chief Executive of The Japanese Institute of Certified Public Accountants;
July 2013 Council Member of The Japanese Institute of Certified Public Accountants;
June 2014 Audit & Supervisory Board Member of the Company (current position).
Audit & Supervisory
Board Member
Mitsuko
Miyagawa February 13,
1960
Apr. 1986 Registered as Attorney at Law (Japan) (current position);
Note 6 10 Apr. 1995 Partner, TMI Associates (current
position); June 2016 Audit & Supervisory Board
Member of the Company (current position).
Total 129,930
(Notes) 1. "Share ownership" of less than 100 shares has been omitted. 2. Masayuki Oku, Yoshinobu Tsutsui, Hiroko Ota and Kazuhiko Toyama are outside directors. 3. Yoshio Sato, Toshio Kinoshita and Mitsuko Miyagawa are outside Audit & Supervisory Board Members. 4. The term of office of Directors, which commenced from the conclusion of the Ordinary General Meeting of
Shareholders for the year ended March 31, 2018, shall expire at the conclusion of the Ordinary General Meeting of Shareholders for the year ending March 31, 2019.
- 57 -

5. The term of office of Hirofumi Yasuhara, Audit & Supervisory Board Member, which commenced from the conclusion of the Ordinary General Meeting of Shareholders for the year ended March 31, 2015 shall expire at the conclusion of the Ordinary General Meeting of Shareholders for the year ending March 31, 2019.
6. The term of office of Mamoru Yoshida and Mitsuko Miyagawa, Audit & Supervisory Board Member, which commenced from the conclusion of the Ordinary General Meeting of Shareholders for the year ended March 31, 2016 shall expire at the conclusion of the Ordinary General Meeting of Shareholders for the year ending March 31, 2020.
7. The term of office of Yoshio Sato and Toshio Kinoshita, Audit & Supervisory Board Members, which commenced from the conclusion of the Ordinary General Meeting of Shareholders for the year ended March 31, 2018, shall expire at the conclusion of the Ordinary General Meeting of Shareholders for the year ending March 31, 2022.
8. Main responsibilities are provided in the Responsibility column.
- 58 -

9. Management execution of Panasonic group is mainly conducted by Executive Officers.
Position Name Responsibility
President Kazuhiro Tsuga Chief Executive Officer (CEO)
Executive Vice President
Yoshio Ito CEO, Automotive & Industrial Systems Company
Senior Managing Executive
Officer
Yoshiyuki Miyabe
Chief Technology Officer (CTO) Chief Manufacturing Officer (CMO) Chief Quality Officer (CQO) Chief Procurement Officer (CPO) Chief Information Officer (CIO)
Senior Managing Executive
Officer
Mototsugu Sato
Chief Strategy Officer (CSO) Chief Human Resources Officer (CHRO) In charge of Business Development, General Affairs, Social Relations, and Business Creation Project CEO, Panasonic Holding (Netherlands) B.V.
Senior Managing Executive
Officer
Tetsuro Homma CEO, Appliances Company In charge of Consumer Business and FF Customer Support & Management
Senior Managing Executive
Officer
Masahisa Shibata Senior Vice President, Automotive & Industrial Systems Company In charge of Automotive Business
Senior Managing Executive
Officer
Makoto Kitano CEO, Eco Solutions Company In charge of Construction Safety Regulations Administration Department
Senior Managing Executive
Officer
Yasuyuki Higuchi CEO, Connected Solutions Company
Managing Executive
Officer Takashi Toyama
Representative in Tokyo In charge of Government and External Relations Director, Government and External Relations Division In charge of Tokyo Olympic & Paralympic Business Promotion
Managing Executive
Officer Laurent Abadie
COO, Panasonic Holding (Netherlands) B.V. Regional Head for Europe & CIS Chairman & CEO, Panasonic Europe Ltd. Managing Director, Panasonic Marketing Europe GmbH
Managing Executive
Officer Yukio Nakashima
In charge of Customer Satisfaction Senior Vice President, Appliances Company In charge of Consumer Marketing Director, Consumer Marketing Sector for Japan Region
Managing Executive
Officer Daizo Ito
Regional Head for India, South Asia, Middle East and Africa Chairman, Panasonic India Pvt. Ltd. Senior Vice President, Eco Solutions Company In charge of Global Marketing
Managing Executive
Officer Toshiyuki Takagi
Senior Vice President, Appliances Company President, Air-Conditioner Company
Managing Executive
Officer Shinji Sakamoto
Senior Vice President, Automotive & Industrial Systems Company In charge of Industrial Business
- 59 -

Position Name Responsibility
Managing Executive
Officer Tatsuo Katakura
Senior Vice President, Connected Solutions Company In charge of Global Solution Business President, Panasonic System Solutions Japan Co., Ltd.
Managing Executive
Officer Kenji Tamura
Senior Vice President, Automotive & Industrial Systems Company In charge of Energy Business
Managing Executive
Officer Hirokazu Umeda
Chief Financial Officer (CFO) In charge of Groupwide Cost Busters Project and BPR Project President, Panasonic Equity Management Japan Co., Ltd.
Executive Officer
Masahiro Ido
In charge of Solution Sales Director, Business Solutions Division In charge of MICE Business Promotion Director, MICE Business Promotion Division Director, Tokyo Olympic & Paralympic Enterprise Division
Executive Officer
Satoshi Takeyasu Chief Brand Communications Officer (CBCO) Director, Groupwide Brand Communications Division In charge of Facility Management and Corporate Sports Promotion
Executive Officer
Junichiro Kitagawa Vice President, Appliances Company In charge of Overseas Marketing Director, Consumer Marketing Division
Executive Officer
Yuki Kusumi Vice President, Automotive & Industrial Systems Company Director, Automotive Energy Business Division, SANYO Electric Co., Ltd.
Executive Officer
Yoshiyuki Iwai Vice President, Eco Solutions Company In charge of Legal Affairs, Intellectual Property, and Intelligence & Liaison
Executive Officer
Makoto Ishii In charge of Information Systems and Logistics Vice President, Appliances Company In charge of Information Systems and Logistics
Executive Officer
Hiroyuki Aota Vice President, Connected Solutions Company Director, Process Automation Business Division President, Panasonic Smart Factory Solutions Co., Ltd.
Executive Officer
Masashi Yamada Vice President, Eco Solutions Company Director, Housing Systems Business Division
Executive Officer
Michiko Ogawa
In charge of Technics Brand Vice President, Appliances Company In charge of Technology Director, Corporate Engineering Division General Manager, Technics Business Promotion
Executive Officer
Hirotoshi Uehara Vice President, Automotive & Industrial Systems Company Director, Automotive Infotainment Systems Business Division
Executive Officer
Eiichi Katayama
In charge of Strategic Business Vice President, Eco Solutions Company In charge of AGE-FREE Business President, Panasonic Cycle Technology Co., Ltd.
Executive Officer
Mitsuki Wada In charge of Procurement President, Global Procurement Company
Executive Officer
Thomas Gebhardt Regional Head for North America Chairman & CEO, Panasonic Corporation of North America
Executive Officer
Akira Kono Vice President, Appliances Company Director, Consumer Marketing Division (Japan), Consumer Marketing Sector for Japan Region
Executive Officer
Masashi Nagayasu Vice President, Automotive & Industrial Systems Company Director, Automotive Marketing & Sales Division
- 60 -

Position Name Responsibility
Executive Officer
Ryuji Matsushita Vice President, Eco Solutions Company In charge of Construction Business President, Panasonic Homes Co., Ltd.
Executive Officer
Manish Sharma President, Panasonic India Pvt. Ltd. Vice President, Appliances Company
Executive Officer
Eiji Fujii Vice President, Automotive & Industrial Systems Company In charge of Technology Director, Engineering Division
Executive Officer
Hiroyuki Tagishi Vice President, Appliances Company Managing Director, Panasonic Appliances Asia Pacific
Executive Officer
Kiyoshi Otaki Vice President, Appliances Company In charge of Home Appliances Business
Executive Officer
Sadaaki Yokoo Regional Head for China & Northeast Asia Chairman, Panasonic Corporation of China
Executive Officer
Masahiro Shinada Vice President, Eco Solutions Company Director, Energy Systems Business Division Director, Solar Systems Business Unit
Executive Officer
Laurence W. Bates
General Counsel (GC) Chief Risk Management Officer (CRO) Chief Compliance Officer (CCO) Director, Risk & Governance Management Division
Executive Officer
Hideshi Fuchiue Vice President, Appliances Company In charge of AVC Business
Executive Officer
Masaharu Michiura Vice President, Eco Solutions Company In charge of Marketing for Japan Region Director, Marketing Division
Executive Officer
Toshinori Kishi Vice President, Connected Solutions Company Director, Media Entertainment Business Division
Executive Officer
Shigeo Okuda Vice President, Automotive & Industrial Systems Company In charge of Automotive Technology Director, Automotive Electronics Systems Business Division
Executive Officer
Tatsuo Ogawa In charge of Manufacturing Innovation Director, Manufacturing Technology and Engineering Division In charge of Quality Administration and Environmental Affairs
- 61 -

6. Corporate Governance, etc.
This section includes the matters of consolidated companies. This section refers to the matters as of June 29, 2018, the date of the filing of this annual securities report, unless otherwise indicated.
(1) Corporate Governance
1) Basic Policy of Corporate Governance The Company, since its establishment, has operated its business under its business philosophy, "contributing to the progress and development of society and the well-being of people worldwide through its business activities". Also, the Company believes it is important to increase corporate value by fulfilling accountability through dialogue with various stakeholders such as shareholders and customers, making effort to execute transparent business activities, and swiftly conducting business activities with fairness and honesty based on its basic philosophy of "a company is a public entity of society".
The Company recognizes that corporate governance is the important basic structure for the aforementioned purpose, and endeavors to establish and strengthen the effective corporate governance structure based on the Audit & Supervisory Board System composed of the Board of Directors which is responsible for deciding important operational matters for the whole Group and monitoring the execution of business by Directors, and Audit & Supervisory Board Member (A&SB Member) / Audit & Supervisory Board (A&SB) which are independent from the Board of Directors and responsible for auditing the performance of duties by Directors.
The Company conducts the following activities to enhance effectiveness of its corporate governance.
1. Secures the rights and equal treatment of shareholders. 2. Endeavors to appropriately cooperate with stakeholders such as employees, customers, business partners
and local societies with the recognition that its sustainable growth is brought about as a result of receiving resources and contributions from such stakeholders.
3. Appropriately discloses corporate information and ensure transparency of the management. 4. Given its fiduciary responsibility and accountability to shareholders, the Board of Directors set the broad
direction of corporate strategy, establish an environment where appropriate risk-taking is supported and carry out effective oversight of Directors and management from an independent and objective standpoint.
5. Engages in constructive dialogue with shareholders in order to contribute to the sustainable growth and the increase of corporate value over the mid- to long-term.
2) Structure of Business Execution and Overview of Organization In the Company, each of thirty-seven (37) business divisions as basic management unit, autonomously manages R&D, production and sales as well as its cash and profit on a global basis. In order to unite these business divisions, the Company introduced divisional company system. The four (4) Divisional Companies (Appliances, Eco Solutions, Connected Solutions and Automotive & Industrial Systems) promote the business division’s evolution and change in the area in which they have responsibility and take a leading role to actualize growth strategy. Also the Company established Corporate Strategy Head Office, which is responsible for enhancement of corporate value by formulating mid- and long-term group-wide strategy. In addition, the Company has incorporated Professional Business Support Sector which assumes the function of group-wide management control with high expertise and management perspective such as the Company wide rules and systems infrastructure and structuring system and listing and maintaining the legal entities etc. Also the Company has established Innovation Promotion Sector which assumes the function of creating new business projects and business models focused on AI/IoT technologies, contributing to the business with its innovation technologies and production technologies, and overseeing the Company-wide technology development, manufacturing and designing.
- 62 -

<The Board of Directors and Executive Officer System>
The Company’s Board of Directors is composed of twelve (12) Directors including four (4) Outside Directors. In accordance with the Companies Act of Japan and related laws and ordinances (collectively, the "Companies Act"), the Board of Directors has ultimate responsibility for administration of the Company’s affairs and monitoring of the execution of business by Directors.
Under the four (4) Divisional Company-based management structure, the Company has empowered each of four (4) Divisional Companies and business divisions through delegation of authority. At the same time, the Company employs an Executive Officer system to provide the execution of business at its various domestic and overseas group companies. This system facilitates the development of optimum corporate strategies that integrate the Group’s comprehensive strengths. The Company has forty-five (45) Executive Officers (including those who concurrently serve as Directors), which include President, senior managements of each of four (4) Divisional Companies, senior officers responsibly for certain foreign regions and officers responsible for corporate functions.
In addition, in order to ensure swift and strategic decision-making, along with sound and appropriate monitoring at the same time, the Board of Directors, as a decision-making body for Group-wide matters, concentrates on decisions about the corporate strategies and the supervision of the four (4) Divisional Companies. Taking into consideration the diverse scope of its business operations, the Company has opted to maintain a system where Executive Officers, who are most familiar with the specifics of the operations, take an active part in the Board of Directors. Moreover, to clarify the responsibilities of Directors and build a structure of the Board of Directors flexibly, the Company limits the term of each Director to one (1) year.
<Audit & Supervisory Board Members (A&SB Members) and Audit & Supervisory Board (A&SB)>
Pursuant to the Companies Act, the Company has elected A&SB Members and established A&SB, made up of A&SB Members. The A&SB Members and A&SB monitor the status of corporate governance and audit the day-to-day activities of management, including the performance of duties by Directors. The Company has five (5) A&SB Members, including three (3) Outside A&SB Members. Additionally, the Company elected A&SB Members who have substantial finance and accounting knowledge. A&SB Members participate in the general meetings of shareholders and the Board of Directors, receive reports from Directors, Executive Officers, employees and Accounting Auditors, and exercise other auditing authority granted to A&SB Members under the law. Full-time Senior A&SB Members also attend important meetings and conduct visiting audits to business offices in order to ensure effective audits. In order to augment the internal auditing functions in the Group, the Company assigns ten (10) full-time Audit & Supervisory Officers (A&SOs), who directly report to the Senior A&SB Members of the Company, to the four (4) Divisional Companies, etc. The Company also inaugurated the Panasonic Group Audit & Supervisory Board Members’ Meeting (comprising Senior A&SB Members of the Company, A&SOs. and A&SB Members of the Group Companies), chaired by the Senior A&SB Member of the Company, to enhance coordination between the Company’s Senior A&SB Members, and A&SOs and audit & supervisory board members of the Group companies, for effective functioning of the entire group corporate governance. In addition, in the course of the performance of their duties, A&SB Members maintain mutual cooperation with the Internal Audit Department and other departments, which perform business audits and internal control audits, to conduct efficient audits. A&SB Members regularly receive, from the Internal Audit Department and other sections, reports regarding the status involving the internal control system and results of audits. A&SB Members may request the Internal Audit Group or Accounting Auditors to conduct an investigation, if necessary. Also, in order to enhance the effectiveness of the audits conducted by A&SB Members and to ensure the smooth implementation of audits, the Company has established a A&SB Member’s Office with seven (7) full-time staff under the direct control of the A&SB.
- 63 -

Mr. Hirofumi Yasuhara, a Senior A&SB Member of the Company, has substantial finance and accounting knowledge, having held the position of Representative Director and Senior Managing Executive Officer, in charge of Control Group, at PanaHome Corporation ( subsequently renamed Panasonic Homes Co., Ltd as of April 1, 2018.) which is a subsidiary of the Company. Mr. Toshio Kinoshita, Outside A&SB Member of the Company, has substantial finance and accounting knowledge, having held the career experiences with a corporate accounting in global companies in Japan and overseas for long periods as a certified public accountant.
The Company has established the Independence Standards for Outside Directors / Audit & Supervisory Board Members (A&SB Members) based on the independence standard required by financial instruments exchange such as Tokyo Stock Exchange. Accordingly, all of the Outside Directors and Outside A&SB Members are notified to the financial instrument exchanges as "independent directors/audit & supervisory board members" defined in article 436-2 and others of Securities Listing Regulations of the Tokyo Stock Exchange, who shall not to have any conflict of interests with Panasonic's general shareholders.
<Optional Nomination and Compensation Advisory Committee> In November 2015, the Company has established an optional Nomination and Compensation Advisory Committee, chaired by an independent Outside Director. This committee deliberates and reports to the Board, on the results of internal reviews on the nomination of candidates for Director, Executive Officer and A&SB Member, and on the appropriateness of the Company’s Director and Executive Officer Compensation System.
<Analysis and Evaluation of the Board of Directors Effectiveness> The Board of Directors, to enhance effectiveness of the Board, conducts a survey to all the Board members who attend the meeting, and reports the results and evaluations of the survey at the Board at least annually. Also, the Board of Directors has been sequentially implementing those opinions and proposals that are practicable. The items of the survey in fiscal 2018 are as follows;
・ Size and Composition of the Board ・ Operation of the Board ・ Discussion of mid-and long-term business strategies which were executed in the fiscal year ・ Function of supervision and decision-making of the Board of Directors Meeting ・ Provision of information to Directors and A&SB Members
<Group Strategy Meeting> From July 2012, the Company holds, twice a month as a general rule, the Group Strategy Meeting to discuss and set the direction of the Company’s mid-term and long-term strategies and certain important issues. Members of "Group management team", which consist of approximately ten (10) people in managerial position, including the President and presidents of four (4) Divisional Companies, and a non-Japanese Executive Officer, attend the Group Strategy Meeting, and the responsible persons of the related businesses and functions also participate in the meeting, depending on the matter to be discussed.
- 64 -

3) Basic Policy on Internal Control Systems and Status of the Operation of the System
The Company’s Board of Directors made the following resolution concerning the Company’s basic policy regarding the development of internal control systems. It was decided at the Board of Directors’ meeting held on July 31, 2017 that this basic policy should be continued with some amendments made to it to reflect the business environment, status of the Company, etc. The details are as follows:
<Basic Policy Regarding the Development of Internal Control Systems>
(a) System for ensuring legal compliance in the performance of Directors’ duties The Company shall ensure legal compliance in the performance of Directors’ duties by developing effective corporate governance and monitoring systems, as well as by ensuring total compliance awareness among Directors.
(b) System for retention and management of information pertaining to the performance of Directors’ duties The Company shall properly retain and manage information on the performance of Directors’ duties in accordance with all applicable laws and regulations and the internal rules of the Company.
(c) Rules and other measures for financial risk management The Company shall establish rules for risk management, and identify material risk through assessment of risks affecting management of the business. The Company shall also take countermeasures against each material risk, while monitoring the progress of such countermeasures with the aim of seeking continual improvement.
(d) System for ensuring efficiency of the performance of Directors’ duties The Company shall ensure efficiency in the performance of Directors’ duties by clarifying business goals based on its business strategies, and examining progress towards achievement of such goals, while seeking to expedite decision-making.
(e) System for ensuring compliance with applicable laws in the performance of employees’ duties The Company shall seek to increase employees’ awareness of compliance issues by clarifying the Company’s compliance policy. The Company shall also ensure legal compliance in the performance of employees’ duties by developing effective monitoring systems.
- 65 -

(f) System for ensuring the properness of operations across the Panasonic Group While respecting the autonomy of each Group company’s management practices, the Company shall fully ensure that Group companies adhere to the Company’s management policy, management philosophy and basic policy regarding the development of internal control systems, and shall develop a system for reporting to the Company to thoroughly ensure proper operations of the Panasonic Group as a whole.
(g) Employees who assist A&SB Members in auditing, and such employees’ independence from Directors The Company shall establish a body independent from Directors, tasked with enhancing the effectiveness of audits by A&SB Members and facilitating the smooth performance of audits.
(h) Ensuring effectiveness of instructions given by A&SB Members to employees who assist A&SB Members
Staff members assisting the A&SB Members, while still subject to the internal rules of the Company, shall be under the instruction and supervision of the respective A&SB Members, and personnel-related matters shall be undertaken upon prior discussion with A&SB Members.
(i) System for Directors, employees and other staffs of the Company and its subsidiaries to report to the Company’s A&SB Members
The Company shall ensure opportunities and systems that enable Directors, employees and other staffs of the Company and Group companies to properly report to the respective A&SB Members, and moreover shall ensure opportunities and systems that enable audit & supervisory officers, who are non-statutory full-time auditors, of Divisional Companies and other such bodies, and A&SB Members of Group companies to report to the Company's A&SB Members.
(j) System for ensuring that parties who have reported to A&SB Members do not incur unfavorable treatment as a consequence of such reporting
In ensuring opportunities and systems for Company and Group company employees and other staffs to report to A&SB Members, the Company shall make sure that employees and other staffs who have duly reported do not incur unfavorable treatment as a consequence of such reporting.
(k) Policy on management of expenses and debt incurred in execution of A&SB Member duties The Company shall calculate budgets on an annual basis for expenses arising with respect to the execution of duties of A&SB Members to ensure effectiveness of audits, and moreover shall provide pre-payment or reimbursement in accordance with laws and regulations with respect to expenses incurred beyond amounts budgeted.
(l) Other systems for ensuring effective performance of audits by the A&SB Members The Company shall have audit & supervisory officers assigned to Divisional Companies and other such entities to assist with audits by A&SB Members. Moreover, the Company shall develop a system enabling effective performance of audits, including mutual cooperation with the accounting auditors and the internal auditing group, in accordance with the Audit Plan established by the A&SB Members each year.
<Status of Basic Policy Implementation in the Company>
(a) System for ensuring legal compliance in the performance of Directors’ duties ・ The Company has established internal rules such as the Panasonic Code of Conduct and the Code of
Ethics for Directors and Executive Officers, and endeavors to ensure that its Directors act in accordance with laws, regulations and the Company’s Articles of Incorporation. Additionally, when Directors assume their positions, the Company provides them with opportunities to acquire the knowledge necessary to fulfill their roles and obligations, and during their terms of office it continues to provide Directors with opportunities to acquire the knowledge they need, including presentations on management and compliance by external experts as required.
- 66 -

・ The Company strengthens its supervisory functions by making the composition of Outside Directors of the Board of Directors Meeting to be one third or more and by providing opportunities for the Outside Directors to actively communicate through Board of Directors’ meetings and other such occasions. The Company has also established a Nomination and Compensation Advisory Committee whose composition ratio of Outside Directors to be majority, and whose chairperson to be an Outside Director to ensure objectivity and transparency in the process of determining the nomination and remuneration of Directors.
・ Audits are conducted by A&SB Members and the Audit & Supervisory Board. In addition, at the Divisional Companies, management committees have been established and audit & supervisory officers have been appointed, which correspond in function to the Board of Directors and the A&SB Members, respectively.
(b) System for retention and management of information pertaining to the performance of Directors’ duties The minutes of meetings of the Board of Directors are prepared after each meeting of the Board of Directors and retained permanently by the section responsible for administration relating to the Board of Directors. Records of approval by the President are also retained permanently by the responsible department.
(c) Rules and other measures for financial risk management Based on Basic Risk Management Regulations, the Company identifies material risks by collecting and assessing information on risks in an integrated and comprehensive fashion through the Global and Group (G&G) Risk Management Committee, and takes countermeasures proportionate to the materiality of each risk.
(d) System for ensuring efficiency of the performance of Directors’ duties ・The Company expedites decision-making through Rules of Approval for Decision-making in Important
Matters, the clarification of roles between Directors and Executive Officers, the delegation of authority to entities such as Divisional Companies and business divisions, the holding of Group Strategy Meetings, and the implementation of an IT system that ensures the rapid and accurate collection and transmission of important management information.
・ The Company plans and implements measures to achieve the business goals it sets based on its business strategies by confirming and examining the status of progress towards the goals at the time of monthly settlement of accounts.
(e) System for ensuring compliance with applicable laws in the performance of employees’ duties ・ The Company has established internal rules such as the Panasonic Code of Conduct and implements
various awareness-building activities such as its Compliance Awareness Month on a Company-wide basis as well as training tailored to specific employee levels and e-learning.
・ The Company seeks to detect improper acts at an early stage through operational audits and internal control audits, operating various types of hotlines in addition to other measures.
・ The Company is stepping up its efforts to implement fair business practices emphasizing compliance and taking measures to change of its business environments accordingly by establishing organizations that perform the functions of promotion of fair business, business legal affairs, risk management, and administration of corporate governance.
・ The Company aims to resolutely prevent any association with anti-social forces (such as organized criminal networks) by assigning an employee in the division overseeing such preventative measures specifically to the task of blocking any relations with such forces.
- 67 -

(f) System for Ensuring the Properness of Operations across the Panasonic Group ・ The Company ensures that basic policy for internal control systems is fully implemented by Group
companies, and disseminates relevant information among Group companies. Initiatives to that end include: implementing the Panasonic Code of Conduct and the Rules of Approval for Decision-Making in Important Matters; implementing group-wide regulations respecting individual professional functions; dispatching Directors and A&SB Members to Group companies and exercising the Company’s shareholder rights thereof; establishing the governance rules whose observance to be ensured by Group companies, conducting regular operational audits and internal control audits of Group companies through the internal auditing group, and; sharing and disseminating information on business objectives through management policy announcements.
・ For publicly listed subsidiaries, the Company puts into effect those measures described above while taking into consideration the nature of such entities as publicly listed companies.
・ The framework described above ensures the properness of operations, thereby enabling the Panasonic Group to establish the internal controls necessary for financial reporting based on the Financial Instruments and Exchange Act.
(g) Employees who assist A&SB Members in auditing, and such employees’ independence from Directors The Company has established the Audit & Supervisory Board Member’s Office, whose dedicated staff is under the direct control of the Audit & Supervisory Board and separate from any operating function of the Company’s business. The Company assigns A&SB Member assistant staff members who possess appropriate capabilities and knowledge as required by the A&SB Members.
(h) Ensuring effectiveness of instructions given by A&SB Members to employees who assist A&SB Members
・ Respective A&SB Members issue instructions to their staff members, and those staff members accordingly assist the A&SB Members in performing their duties.
・ The Company consults with A&SB Members in advance of undertaking personnel-related matters including employee transfers and other affairs involving staff members who assist the A&SB Members.
(i) System for Directors, employees and other staffs of the Company and its subsidiaries to report to the Company's A&SB Members
・ Directors, employees and other staffs of the Company and Group companies report on business operations and other issues at respective regular meetings held by A&SB Members and other such occasions, and also report as necessary at other important meetings with A&SB Members, where their attendance has been requested. Moreover, A&SB Members of Group companies report as necessary to the Company’s A&SB Members regarding content of reports at respective Group companies. Audit & supervisory officers conduct inquiries at respective Divisional Companies regarding business operations and issues at such Divisional Companies, and report such matters as necessary to the Company’s A&SB Members.
・ The Company has established an Audit Report System by which employees of the Company and Group companies directly report to the Company’s Audit & Supervisory Board about irregularities or concerns in regards to accounting or auditing.
(j) System for ensuring that parties who have reported to A&SB Members do not incur unfavorable treatment as a consequence of such reporting
The Company calls on departments associated with reported matters not to act unfavorably toward parties who have reported as a consequence of such reporting. Moreover, the Company enables parties to report matters anonymously under the Audit Report System, and prohibits unfavorable treatment to such parties as a consequence of such reporting in accordance with its Internal Reporting Rules.
- 68 -

(k) Policy on management of expenses and debt incurred in execution of A&SB Member duties ・ To ensure effectiveness of audits, the Company calculates preliminary budgets with respect to anticipated
expenses required by A&SB Members in executing their duties, in accordance with Audit & Supervisory Standards.
・ The Company also provides pre-payment or reimbursement for expenses paid under urgent or extraordinary circumstances in accordance with laws and regulations.
・ In making payment of audit expenses, A&SB Members are required to remain mindful of efficiency and appropriateness in that regard.
(l) Other systems for ensuring effective performance of audits by the A&SB Members ・ Audit & supervisory officers tasked with monthly reporting and implementing liaison meetings are
assigned to Divisional Companies and other such entities. Any decisions on personnel-related matters involving the audit & supervisory officers require the agreement of A&SB Members.
・ The Company has established and operates the Panasonic Group Audit & Supervisory Board Members’ Meeting chaired by the Company’s Senior A&SB Member, in order to facilitate cooperation among the A&SB Members of the Company, the audit & supervisory officers of Divisional Companies and other such entities, and the A&SB Members of Group companies.
・ Representative Directors and A&SB Members exchange opinions regularly and whenever necessary. Moreover, respective departments cooperate in implementing visiting audits of business offices inside and outside Japan conducted by A&SB Members. Internal auditing groups also cooperate to enhance the effectiveness of audits carried out by A&SB Members through collaboration with A&SB Members, including reporting as appropriate to the A&SB Members.
・ When the accounting auditors formulate their audit plans, perform quarterly reviews, and conduct final audits, the A&SB Members hold regular meetings with the accounting auditors at which they receive explanations and reports, and exchange opinions with the accounting auditors as necessary.
Note: "Group companies" means subsidiaries as stipulated in the Companies Act.
4) The status of the Company’s internal system concerning disclosure of corporate information Under its basic philosophy, "A company is a public entity of society," the Company has committed to highly transparent business activities and endeavored to be accountable its accountability to its stakeholders. The Company’s basic policy concerning information disclosure is set forth in the "Panasonic Code of Conduct," which prescribes specific items to be complied with in order to put the Group’s business policy into practice, and the standards in the course of business is published on the Company’s website as "the Disclosure Policy". The Company’s basic policy is to provide the Company’s fair and accurate financial information and corporate information, including management policies, business activities and corporate social responsibility (CSR) activities, in a timely, appropriate and easily understandable manner.
In accordance with this basic policy, important matters concerning the management of the Group are resolved or reported at the Board of Directors pursuant to the Regulations of the Board of Directors. These important matters and other matters, which are required to be disclosed under relevant laws and ordinances in Japan and overseas or any other regulations, are timely and accurately reported from each relevant department, that has the important internal information, to the department that handles relevant information under the monitoring of the Chief Financial Officer (CFO), so that important information is gathered. Further, matters required to be disclosed under the rules of financial instruments exchanges are also under the monitoring of the CFO.
Also, if any of the matters which is required to be disclosed under relevant laws and ordinances in Japan and overseas, and the rules of financial instruments exchanges or any other regulations, occurs at the Company’s business divisions including subsidiaries, such matter shall be immediately reported to the "Financial & Accounting Department" or the "Financial and, Finance & IR Department", depending upon the nature thereof; Thus, the Company has established a structure whereby these matters can be collected.
- 69 -

With respect to the information gathered or identified, the Company determines the necessity of disclosure thereof in accordance with relevant laws and ordinances in Japan and overseas, and the rules of financial instruments exchanges or any other regulations, and makes effort to disclose it at the time that the organization, which effectively decides execution of the business of the Company, makes a resolution or determination, or becomes aware of its occurrence.
In addition, the Company endeavors to confirm the contents and expressions of the disclosure with the relevant departments within the Company and outside legal counsel to ensure the accuracy, fairness and adequacy of the disclosure.
Moreover, the Company has established disclosure control procedures in order to comply with relevant laws and ordinances in Japan and overseas, the rules of financial instruments exchanges and any other regulations, and to implement the fair, accurate and timely disclosure of information about its Group, etc. In the process of preparation and confirmation of documents such as annual securities reports and quarterly reports, the Disclosure Committee, which is comprised of managers from principal departments that handle relevant information, confirms the validity of the content of the descriptions and the appropriateness of the procedures concerning the disclosure under the supervision of the President and the CFO, who are responsible for establishing, maintaining and ensuring the effectiveness of the internal control and disclosure control of the Company. The chairman of the Disclosure Committee is appointed by the President and the CFO, and the members of the Disclosure Committee are appointed by the chairman of the Disclosure Committee. The Disclosure Committee also develops, maintains, improves and evaluates the internal control procedures concerning disclosure matters.
5) Internal Control Over Financial Reporting The Company has documented the actual status of its internal control system, with integrated control provided by the Internal Control Promotion Office, in order to ensure reliability in the financial reporting of the Panasonic Group including its subsidiaries, ranging from the control infrastructure to actual internal control activities. Specifically, the Company has reinforced its internal controls by implementing self-checks and self-assessment programs at each of the Divisional Companies and business divisions, etc. Then, Internal Auditing Managers of the Divisional Companies appointed by the Company at each of the Divisional Companies, etc. conduct audits. Based on the audits, the Internal Control Promotion Office supervises the group-wide internal control audits in order to confirm the effectiveness of each company’s financial reporting. With the aim of further enhancing the Group’s internal control system, in fiscal 2018 Panasonic had approximately 400 personnel assigned to conduct internal audits in the Internal Auditing Group.
6) Amount of compensation for Directors and Audit & Supervisory Board Members (A&SB Members) Remuneration for Directors and A&SB Members of Panasonic are determined within the framework of the maximum total amounts of remuneration for Directors and A&SB Members which has been determined respectively by resolution of a general meeting of shareholders. With regards to the determination of the Remuneration for Directors, the optional Nomination and Compensation Advisory Committee, a majority of whose members as well as whose chair are Outside Directors who are Independent Directors, deliberates and reports to the Board, the appropriateness of the remuneration System. The remuneration system comprises the "basic remuneration," which is a fixed remuneration, "performance based remuneration," which is a short-term incentive, and "stock-type compensation stock options," which is a long-term incentive.
The objective of "performance based remuneration" is to provide incentive to boost business performance, and it shall be determined in conjunction with performance evaluation for Panasonic as a whole and the specific businesses a Director is in charge of, using performance indicators, such as net sales, operating income, free cash flow, and CCM (Capital Cost Management)*.
- 70 -

The objective for the allotment of "stock-type compensation stock options" is for Directors to share the benefits and risks of shareholdings with Panasonic's shareholders, and to engage in efforts to boost corporate value from a long-term perspective. Only the "basic remuneration," which is the fixed remuneration, is paid to Outside Directors and A&SB Members.
(Note) CCM (Capital Cost Management) is a management control index developed by the Company to evaluate return on capital.
Amount of Remuneration for Directors and A&SB Members
Classification Number of
persons
Amounts (million yen)
Basic
remuneration
Performance based
remuneration
Stock-type compensation stock option
Directors (other than Outside Directors)
15 1,089 672 239 178
A&SB Members (other than Outside A&SB Members)
2 75 75 - -
Outside Directors 4 64 64 - -
Outside A&SB Members 3 39 39 - -
(Note) Seven Directors who retired at the conclusion of the 110th Ordinary General Meeting of Shareholders held on June 29, 2017 are included in the above.
Directors which Received Remuneration over 100 million yen
Name Classification
Amounts (million yen)
Basic
remuneration
Performance based
remuneration
Stock-type compensation stock option
Shusaku Nagae Director 119 100 - 19
Kazuhiro Tsuga Director 238 104 63 71
Yoshio Ito Director 147 78 44 25
Mototsugu Sato Director 128 69 40 19
- 71 -

7) Status of accounting audit Panasonic Corporation has an auditing agreement with KPMG AZSA LLC for this company to conduct the accounting audit of Panasonic Corporation. The following is accountants who conducted the accounting audit Panasonic Corporation. The number of years each accountant had continued to audit the Company is seven years or less.
CPA having executed accounting audit works
Audit corporation to which CPA belongs
Masahiro Mekada KPMG AZSA LLC
Kengo Chida KPMG AZSA LLC
Masaki Hirota KPMG AZSA LLC
Working with to assist the above accountants in conducting audit of Panasonic Corporation were 129 certified public accountants and 114 other people.
8) Outside Directors and Outside Audit & Supervisory Board Members (A&SB Members) The Company elects four (4) Outside Directors and three (3) Outside A&SB Members.
Mr. Masayuki Oku, an Outside Director of the Company, was formerly Chairman, Board of Directors of Sumitomo Mitsui Financial Group, Inc. Sumitomo Mitsui Banking Corporation which is a subsidiary of Sumitomo Mitsui Financial Group, Inc. is one of the shareholders of Panasonic. As is described in "5. Member of the Board of Directors and Audit & Supervisory Board Members", Mr. Oku holds Panasonic shares, but does not have any other noteworthy relationships with the Company.
Mr. Yoshinobu Tsutsui, an Outside Director of the Company, is a Chairman of Nippon Life Insurance Company. Although Nippon Life Insurance Company is one of the Major Shareholders of Panasonic. Mr. Tsutsui does not have any other noteworthy relationships with the Company.
Ms. Hiroko Ota, an Outside Director of the Company, as is described in "5. Member of the Board of Directors and Audit & Supervisory Board Members", holds Panasonic shares, but does not have any other noteworthy relationships with the Company.
Mr. Kazuhiko Toyama, an Outside Director of the Company, as is described in "5. Member of the Board of Directors and Audit & Supervisory Board Members", holds Panasonic shares, but does not have any other noteworthy relationships with the Company.
Mr. Yoshio Sato, an Outside A&SB Member of the Company, is Chairman of Sumitomo Life Insurance Company. Although Sumitomo Life Insurance Company is one of the Major Shareholders of Panasonic, Mr. Sato does not have any other noteworthy relationships with the Company.
Ms. Mitsuko Miyagawa, an Outside A&SB Member of the Company, as is described in "5. Member of the Board of Directors and Audit & Supervisory Board Members", holds Panasonic shares, but does not have any other noteworthy relationships with the Company.
As for the four (4) Outside Directors, the Company elects them based on the independency stated in the Independence Standards for Outside Directors / Audit & Supervisory Board Members (A&SB Members) that the Company established, and the policy that the election will enhance and strengthen the effectiveness of the monitoring performed by the Board of Directors regarding the execution of business by Directors, from an objective and neutral standpoint. As for the three (3) Outside A&SB Members, the Company appoints them based on the independency stated in the Independence Standards for Outside Directors / Audit & Supervisory Board Members (A&SB Members) that the Company established, and the policy that the election will enhance and strengthen the effectiveness of the audits performed by A&SB Members regarding the execution of business by Directors, from an objective and neutral standpoint.
- 72 -

<Overview of the Independence Standards for Outside Directors / Audit & Supervisory Board Members (A&SB Members)>
The following persons are not considered independent.
(1) A person executing the operations of a parent company or a subsidiary of the parent company of the Company. (Including those who corresponds to the person recently or previously, hereinafter, "executing person")
(2) A person or an executing person of such person who has a major business relationship with the Company, or a person or an executing person of such person with whom the Company has a major business relationship.
(3) A consultant, accounting expert, or legal expert who receives a significant amount of money or other property from the Company other than compensation as a Director / A&SB Member. If the person who receives such property is an organization such as a legal entity or association, those who belongs or belonged to the organization corresponds to the relevant person.
(4) A principal shareholder of the Company (If a principal shareholder is a legal entity, An executing person of such legal entity)
(5) A close relative listed in items numbered (1) to (4) above (A second-degree or closer relative applies. The same applies, hereinafter) or a close relative of an executing person of the Company or subsidiary of the Company (If an Outside A&SB Member is appointed to as an independent Director / A&SB Member, the person who is or who was an non-executing director / accounting advisor is included in the executing person).
Notes) i) In the items numbered (1), (2), (4) and (5) above, an "executing person" corresponds to any of the
following. ・A Director who is an executive director, an executive officer (shikkouyaku) or a director / A&SB
Member who executes business of a legal entity, etc. ・An employee who executes business, a person responsible of serving duties of an employee who
executes business of a legal entity in the case that the legal entity is an employee executing business, or other such equivalent person.
・An employee
Also, the wording "recently" shall be assumed to be the point of time when the item of the agenda of the shareholders’ meeting appointing the person as a Director or an A&SB Member are decided, and the wording "previously" shall be assumed to be "within the last three years."
ii) In the item (2) above, "major" shall be applied to the case in which the amount of the transaction between the Company and a person whom the Company has a business relationship, exceeds 2% of either of their annual consolidated sales.
iii) In the item (3) above, "significant" shall be applied to the case in which the person (individual) or the organization such as a legal entity or association to which a service provider belongs, in providing a service to the Company, corresponds to any of the followings. A person "belongs or belonged" includes not only a partner, but also an associate as it is so called.
・A person oneself who provides a service: Receives compensation of more than or equal to 12 million yen per year from the Company.
・An organization to which a service provider belongs: The amount of the transaction between the Company and the organization exceeds 2% of either of their annual consolidated sales. "A person who belonged to an organization" shall be assumed to be identified based on whether the person belonged to the organization within the last three years.
- 73 -

iv) In the item (4) above, "a principal shareholder" shall mean a shareholder holding 10% or more of the voting rights of the Company.
v) In the item (5) above, "A person who was a non-executive director / an accounting advisor" shall be assumed to be identified based on whether the person was in the position in the last three years.
Outside Directors directly or indirectly cooperate with the internal audit, audit by A&SB Members and accounting audit, receive reports from the Internal Control Department and conduct an effective monitoring through reports on financial results at the Board of Directors and through reviews of the basic policy regarding the development of the internal control systems and other methods.
Outside A&SB Members directly or indirectly cooperate with the internal audit, audit by A&SB Members and accounting audit, receive reports from the Internal Control Department and conduct an effective monitoring through reports on financial results at the Board of Directors, through reviews of the basic policy regarding the development of internal control systems, exchanges of opinions and information at A&SB and other methods.
Note: Major Shareholders: Shareholders listed in (7) Major Shareholders of 1. Information on the Company's Stock, etc.
9) Contract between the Company and Outside Directors / Outside A&SB Members (A&SB Members) under Article 427, Paragraph 1 of the Companies Act
The Company has entered into liability limitation agreements with all Outside Directors and Outside A&SB Members, respectively, which limit the amount of their liability under Article 423, Paragraph 1 of the Companies Act to the aggregate of the amounts specified in Article 425, Paragraph 1 of the Companies Act, if they perform their duties in good faith and without significant negligence.
10) Matters to be resolved at general meetings of shareholders that can also be resolved by the Board of Directors
The Company stipulates in its Articles of Incorporation that unless otherwise provided by law, the Company may determine, by a resolution of the Board of Directors, a distribution of surplus or any other matters set forth in each item of Article 459, Paragraph 1 of the Companies Act. This is to enable the Company to more flexibly distribute profits to shareholders based on its consolidated business performance and to repurchase and cancel its own stock under its basic policy of providing returns to shareholders.
The Company, pursuant to Article 426, Paragraph 1 of the Companies Act, stipulates in its Articles of Incorporation that it may, by a resolution of the Board of Directors, exempt a Director (including a former Director) and a A&SB Member (including a former A&SB Member) from being held liable for his/her actions as set forth in Article 423, Paragraph 1 of the Companies Act to the extent permitted by applicable laws and ordinances, to enable the Directors and A&SB Members to perform their duties in a satisfactory manner.
11) Requirements for the adoption of resolutions for the election of Directors The Company stipulates in its Articles of Incorporation that the presence of shareholders representing one-third or more of the voting rights held by the total shareholders entitled to exercise their voting rights and a majority of the votes held by those shareholders are required for the adoption of resolutions necessary to approve the election of Directors.
- 74 -
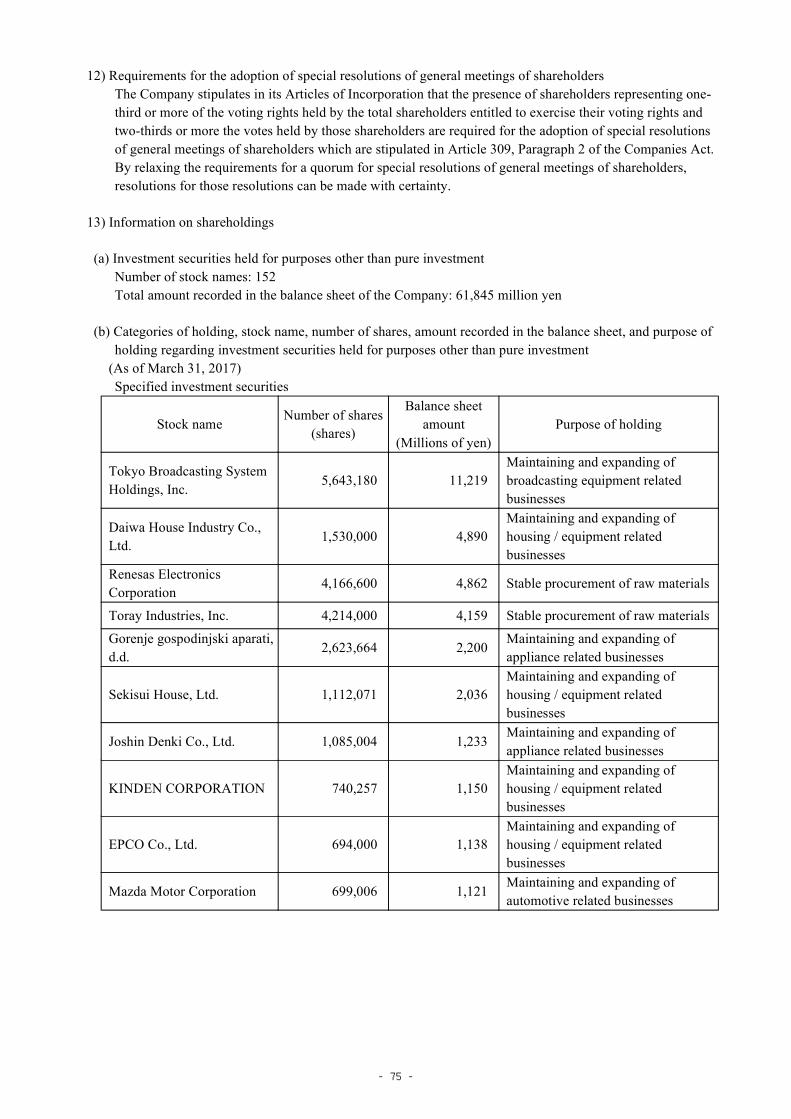
12) Requirements for the adoption of special resolutions of general meetings of shareholders The Company stipulates in its Articles of Incorporation that the presence of shareholders representing one-third or more of the voting rights held by the total shareholders entitled to exercise their voting rights and two-thirds or more the votes held by those shareholders are required for the adoption of special resolutions of general meetings of shareholders which are stipulated in Article 309, Paragraph 2 of the Companies Act. By relaxing the requirements for a quorum for special resolutions of general meetings of shareholders, resolutions for those resolutions can be made with certainty.
13) Information on shareholdings
(a) Investment securities held for purposes other than pure investment Number of stock names: 152 Total amount recorded in the balance sheet of the Company: 61,845 million yen
(b) Categories of holding, stock name, number of shares, amount recorded in the balance sheet, and purpose of holding regarding investment securities held for purposes other than pure investment
(As of March 31, 2017) Specified investment securities
Stock name Number of shares
(shares)
Balance sheet amount
(Millions of yen) Purpose of holding
Tokyo Broadcasting System Holdings, Inc.
5,643,180 11,219 Maintaining and expanding of broadcasting equipment related businesses
Daiwa House Industry Co., Ltd.
1,530,000 4,890 Maintaining and expanding of housing / equipment related businesses
Renesas Electronics Corporation
4,166,600 4,862 Stable procurement of raw materials
Toray Industries, Inc. 4,214,000 4,159 Stable procurement of raw materials
Gorenje gospodinjski aparati, d.d.
2,623,664 2,200 Maintaining and expanding of appliance related businesses
Sekisui House, Ltd. 1,112,071 2,036 Maintaining and expanding of housing / equipment related businesses
Joshin Denki Co., Ltd. 1,085,004 1,233 Maintaining and expanding of appliance related businesses
KINDEN CORPORATION 740,257 1,150 Maintaining and expanding of housing / equipment related businesses
EPCO Co., Ltd. 694,000 1,138 Maintaining and expanding of housing / equipment related businesses
Mazda Motor Corporation 699,006 1,121 Maintaining and expanding of automotive related businesses
- 75 -

Regarded as holding securities
Stock name Number of shares
(shares)
Balance sheet amount
(Millions of yen) Purpose of holding
Toyota Motor Corporation 3,000,000 18,126 Have a right to exercise voting rights
Honda Motor Co., Ltd. 1,000,000 3,351 Have a right to exercise voting rights
(As of March 31, 2018) Specified investment securities
Stock name Number of shares
(shares)
Balance sheet amount
(Millions of yen) Purpose of holding
Tokyo Broadcasting System Holdings, Inc.
5,643,180 12,737 Maintaining and expanding of broadcasting equipment related businesses
Daiwa House Industry Co., Ltd.
1,530,000 6,273 Maintaining and expanding of housing / equipment related businesses
Renesas Electronics Corporation
4,166,600 4,458 Stable procurement of raw materials
Toray Industries, Inc. 4,214,000 4,241 Stable procurement of raw materials
Sekisui House, Ltd. 1,112,071 2,160 Maintaining and expanding of housing / equipment related businesses
EPCO Co., Ltd. 1,388,000 2,011 Maintaining and expanding of housing / equipment related businesses
Gorenje gospodinjski aparati, d.d.
2,623,664 1,931 Maintaining and expanding of appliance related businesses
Joshin Denki Co., Ltd. 492,502 1,913 Maintaining and expanding of appliance related businesses
NIPPON TELEGRAPH AND TELEPHONE CORPORATION
281,724 1,380 Maintaining and expanding of broadcasting equipment related businesses
KINDEN CORPORATION 740,257 1,304 Maintaining and expanding of housing / equipment related businesses
Regarded as holding securities
Stock name Number of shares
(shares)
Balance sheet amount
(Millions of yen) Purpose of holding
Toyota Motor Corporation 3,000,000 20,475 Have a right to exercise voting rights
Honda Motor Co., Ltd. 1,000,000 3,660 Have a right to exercise voting rights
(c) Equity securities for pure investment
Not applicable.
- 76 -

(2) Audit Fees
1) Fees to Certified Public Accountants
Category
Fiscal year ended March 31, 2017 Fiscal year ended March 31, 2018
Fees for audit services
(Millions of yen)
Fees for non-audit services
(Millions of yen)
Fees for audit services
(Millions of yen)
Fees for non-audit services
(Millions of yen)
Panasonic Corporation 740 95 695 81
Consolidated subsidiaries 416 93 386 120
Total 1,156 188 1,081 201
2) Other fees Audit fees paid by Panasonic Corporation and its consolidated subsidiaries to the Company's accounting auditors, KPMG AZSA LLC Group (including KPMG and its group firms which belong to the same network as KPMG AZSA LLC), other than above were 2,788 million yen for the fiscal year ended March 31, 2017, and 2,531 million yen for the fiscal year ended March 31, 2018, respectively. These fees are mainly paid for audit services. Some consolidated subsidiaries paid audit fees to other accounting auditors which do not belong to the same network as KPMG AZSA LLC Group. These fees are mainly paid for audit services.
3) Descriptions of non-audit services to the Company Non-audit services to the Company in the fiscal year ended March 31, 2017 and 2018 include advisory services relating to accounting and tax matters, etc., respectively, to which the fee is charged.
4) Policy on determination of audit fees In determining the amount of audit fees, the Company considers matters that include the number of days of audit, taking into consideration of the size of the Company, the scope and characteristics of the audit, etc.
- 77 -

Ⅴ Consolidated Financial Statements
PANASONIC CORPORATION
AND SUBSIDIARIES Consolidated Statements of Financial Position
March 31, 2018 and 2017
Yen (millions)
March 31 March 31
2018 2017
Assets
Current assets:
Cash and cash equivalents (Note 5)............................................................. 1,089,585 1,270,787 Trade receivables (Note 6)........................................................................... 1,038,984 847,003 Other financial assets (Note 12)................................................................... 203,557 143,519 Inventories (Note 7)..................................................................................... 988,609 806,309 Other current assets (Note 14)..................................................................... 165,223 137,201
Total current assets.................................................................................. 3,485,958 3,204,819 Non-current assets:
Investments accounted for using the equity method (Note 11)................... 147,959 155,987 Other financial assets (Note 12)................................................................... 166,466 161,986 Property, plant and equipment (Notes 8)..................................................... 1,374,066 1,323,282 Goodwill and intangible assets (Notes 9 and 26)........................................ 738,251 665,132 Deferred tax assets (Note 13)....................................................................... 325,255 407,720 Other non-current assets (Note 14).............................................................. 53,193 64,035
Total non-current assets........................................................................... 2,805,190 2,778,142 Total assets........................................................................................... 6,291,148 5,982,961
- 78 -

PANASONIC CORPORATION
AND SUBSIDIARIES Consolidated Statements of Financial Position (Continued)
March 31, 2018 and 2017
Yen (millions)
March 31 March 31
2018 2017
Liabilities and Equity
Current liabilities:
Short-term debt, including current portion of long-term debt (Note 15)............................................................................. 375,392 177,038
Trade payables (Note 16)............................................................................. 1,146,476 955,965
Other financial liabilities (Note 19)............................................................. 304,977 329,625
Income taxes payable................................................................................... 77,380 66,785
Provisions (Note 18).................................................................................... 285,954 317,261
Other current liabilities (Note 20)................................................................ 907,756 865,389
Total current liabilities............................................................................. 3,097,935 2,712,063
Non-current liabilities:
Long-term debt (Note 15)............................................................................ 864,052 946,966
Other financial liabilities (Note 19)............................................................. 18,623 -
Retirement benefit liabilities (Note 17)....................................................... 349,873 467,749
Provisions (Note 18).................................................................................... 10,217 17,679
Deferred tax liabilities (Note 13)................................................................. 56,447 62,531
Other non-current liabilities (Note 20)........................................................ 11,716 16,038
Total non-current liabilities..................................................................... 1,310,928 1,510,963
Total liabilities..................................................................................... 4,408,863 4,223,026
Equity: (Note 21)
Panasonic Corporation stockholders' equity
Common stock........................................................................................... 258,740 258,740
Capital surplus........................................................................................... 527,408 636,905
Retained earnings....................................................................................... 1,300,336 1,051,445
Other components of equity....................................................................... (168,259 ) (164,632 )
Treasury stock (Note 32)........................................................................... (210,674 ) (210,569 )
Total Panasonic Corporation stockholders' equity (Note 28)................ 1,707,551 1,571,889 Non-controlling interests (Note 30)............................................................. 174,734 188,046
Total equity.......................................................................................... 1,882,285 1,759,935
Total liabilities and equity................................................................. 6,291,148 5,982,961
- 79 -

PANASONIC CORPORATION
AND SUBSIDIARIES Consolidated Statements of Profit or Loss
Years ended March 31, 2018 and 2017
Yen (millions)
Year ended March 31
2018 2017
Net sales........................................................................................................... 7,982,164 7,343,707 Cost of sales..................................................................................................... (5,642,952 ) (5,157,163 ) Gross profit...................................................................................................... 2,339,212 2,186,544 Selling, general and administrative expenses (Note 23).................................. (1,938,010 ) (1,842,928 ) Share of profit of investments accounted for using the equity method (Note 11).......................................................................................................... 10,074
8,378
Other income (expenses), net (Notes 25 and 26)............................................. (30,737 ) (75,210 ) Operating profit................................................................................................ 380,539 276,784 Finance income (Note 27)................................................................................ 22,772 21,832 Finance expenses (Note 27)............................................................................. (24,721 ) (23,550 ) Profit before income taxes............................................................................... 378,590 275,066 Income taxes (Note 13).................................................................................... (126,563 ) (102,624 ) Net profit.......................................................................................................... 252,027 172,442
Net profit attributable to:
Panasonic Corporation stockholders............................................................ 236,040 149,360 Non-controlling interests............................................................................. 15,987 23,082
Yen
Earnings per share attributable to Panasonic Corporation stockholders (Note 28)
Basic............................................................................................................. 101.20 64.33 Diluted......................................................................................................... 101.15 64.31
- 80 -

PANASONIC CORPORATION
AND SUBSIDIARIES Consolidated Statements of Comprehensive Income
Years ended March 31, 2018 and 2017
Yen (millions)
Year ended March 31
2018 2017
Net Profit 252,027 172,442 Other comprehensive income (loss), net of tax (Note 21)
Items that will not be reclassified to profit or loss
Remeasurements of defined benefit plans............................................... 61,662 73,513 Financial assets measured at fair value through other comprehensive income...................................................................
6,445
4,260
Subtotal................................................................................................ 68,107 77,773 Items that may be reclassified to profit or loss
Exchange differences on translation of foreign operations..................... (6,852 ) (61,304 ) Net changes in fair value of cash flow hedges........................................ 1,626 964
Subtotal............................................................................................... (5,226 ) (60,340 ) Total other comprehensive income ............................................................ 62,881 17,433
Comprehensive income .................................................................................. 314,908 189,875
Comprehensive income attributable to:
Panasonic Corporation stockholders........................................................... 292,381 174,892 Non-controlling interests............................................................................. 22,527 14,983
- 81 -

PANASONIC CORPORATION
AND SUBSIDIARIES Consolidated Statements of Changes in Equity
Years ended March 31, 2018 and 2017
Yen (millions)
Common
stock Capital surplus
Retained earnings
Other components
of equity
Treasury stock
Panasonic Corporation
stockholders’ equity
Non-
controlling interests
Total equity
Balance as of March 31, 2016 258,740 645,949 878,208 (107,922 ) (230,533 ) 1,444,442 202,791 1,647,233
Comprehensive income :
Net profit..................................... - - 149,360 - - 149,360 23,082 172,442
Other comprehensive income (loss) - net of tax (Note 21).......
-
-
-
25,532
-
25,532
(8,099
)
17,433
Total comprehensive income... - - 149,360 25,532 - 174,892 14,983 189,875
Transfer to hedged non- financial assets (Note 21)...........................
-
-
-
0
-
0
-
0
Transfer from other components of equity to retained earnings (Note 21).....................................
-
-
72,870
(72,870
)
-
-
-
-
Cash dividends (Note 21).............. - - (58,025 ) - - (58,025 ) (17,648 ) (75,673 )
Purchase of treasury stock............. - - - - (106 ) (106 ) - (106 )
Disposal of treasury stock............. - (6,324 ) - - 20,070 13,746 - 13,746
Transactions with non-controlling interests and other.......................
-
(2,720
)
-
-
-
(2,720
)
(12,080
)
(14,800
)
Cumulative effects of new accounting standards applied (Note 3).......................................
-
-
9,032
(9,372
)
-
(340
)
-
(340
)
Balance as of March 31, 2017 258,740 636,905 1,051,445 (164,632 ) (210,569 ) 1,571,889 188,046 1,759,935
Comprehensive income :
Net profit..................................... - - 236,040 - - 236,040 15,987 252,027
Other comprehensive income - net of tax (Note 21)...................
-
-
-
56,341
-
56,341
6,540
62,881
Total comprehensive income... - - 236,040 56,341 - 292,381 22,527 314,908
Transfer to hedged non- financial assets (Note 21)...........................
-
-
-
(561 )
-
(561 )
-
(561 )
Transfer from other components of equity to retained earnings (Note 21).....................................
-
-
71,161
(71,161
)
-
-
-
-
Cash dividends (Note 21)............. - - (58,310 ) - - (58,310 ) (20,053 ) (78,363 )
Purchase of treasury stock............. - - - - (119 ) (119 ) - (119 )
Disposal of treasury stock............. - (3 ) - - 14 11 - 11
Purchase of subsidiaries (Note 34).....................................
-
-
-
-
-
-
21,126
21,126
Transactions with non-controlling interests and other (Notes 21 and 30)........................
-
(109,494
)
-
11,754
-
(97,740
)
(36,912
)
(134,652
)
Balance as of March 31, 2018 258,740 527,408 1,300,336 (168,259 ) (210,674 ) 1,707,551 174,734 1,882,285
- 82 -

PANASONIC CORPORATION
AND SUBSIDIARIES Consolidated Statements of Cash Flows Years ended March 31, 2018 and 2017
Yen (millions)
Year ended March 31
2018 2017
Cash flows from operating activities:
Net profit...................................................................................................... 252,027 172,442 Depreciation and amortization................................................................. 287,754 270,767 Impairment losses on property, plant and equipment, goodwill and Intangible assets (Note 26)..................................................................... 26,772 45,868
Income tax expenses................................................................................ 126,563 102,624 (Increase) decrease in trade receivables................................................... (156,577 ) (7,983 ) (Increase) decrease in inventories............................................................ (164,137 ) (36,612 ) Increase (decrease) in trade payables....................................................... 143,023 64,044 Other - net................................................................................................ (16,773 ) (116,107 )
Subtotal................................................................................................ 498,652 495,043 Interests received..................................................................................... 20,522 16,956 Dividend income received....................................................................... 2,250 1,857 Interest expenses paid.............................................................................. (21,800 ) (23,816 ) Income taxes paid.................................................................................... (76,442 ) (104,630 )
Net cash provided by operating activities.................................................... 423,182 385,410 Cash flows from investing activities (Note 32):
Purchase of property, plant and equipment................................................ (394,485 ) (278,594 ) Proceeds from sale of property, plant and equipment................................. 29,046 51,155 Purchase of intangible assets....................................................................... (81,118 ) (63,220 ) Collection of lease receivables.................................................................. 19,281 - Purchase of investments accounted for using the equity method and other financial assets........................................................................................... (23,938 ) (29,119 )
Proceeds from sale and redemption of investments accounted for using the equity method and other financial assets............................................. 14,677 31,163
Proceeds from sales of subsidiaries............................................................. 183 11,622 Purchase of subsidiaries, net of cash acquired (Note 34)............................ (15,646 ) (142,844 ) Other - net.................................................................................................... (6,828 ) (319 ) Net cash used in investing activities............................................................ (458,828 ) (420,156 )
- 83 -

PANASONIC CORPORATION
AND SUBSIDIARIES Consolidated Statements of Cash Flows (Continued)
Years ended March 31, 2018 and 2017
Yen (millions)
Year ended March 31
2018 2017
Cash flows from financing activities (Note 32):
Increase (decrease) in short-term debt (Note 15)......................................... 239,990 6,261 Proceeds from long-term debt (Note 15)..................................................... 3,521 400,549 Repayments of long-term debt (Note 15).................................................... (163,429 ) (50,900 ) Dividends paid to Panasonic Corporation stockholders (Note 21).............. (58,310 ) (58,025 ) Dividends paid to non-controlling interests................................................. (20,053 ) (17,648 ) Purchase of treasury stock........................................................................... (119 ) (106 ) Proceeds from sale of treasury stock........................................................... 11 9 Transactions with non-controlling interests (Note 30)................................ (129,229 ) (2,946 ) Other - net (Note 15).................................................................................... (1,145 ) 17,404 Net cash provided by (used in) financing activities.................................... (128,763 ) 294,598
Effect of exchange rate changes on cash and cash equivalents....................... (16,793 ) (1,731 ) Net increase (decrease) in cash and cash equivalents...................................... (181,202 ) 258,121 Cash and cash equivalents at the beginning of the year (Note 5).................... 1,270,787 1,012,666 Cash and cash equivalents at the end of the year (Note 5).............................. 1,089,585 1,270,787
- 84 -

PANASONIC CORPORATION
AND SUBSIDIARIES Notes to Consolidated Financial Statements
1. Reporting Entity
Panasonic Corporation is a company incorporated in Japan. As a comprehensive electronics manufacturer, Panasonic Corporation and its subsidiaries (together referred to as the "Company") are engaged in development, production, sales and service activities in a broad array of business areas in close cooperation with domestic and overseas group companies.
The details of principal businesses and activities of the Company are stated in "4. Segment information."
2. Basis of Preparation
(1) Compliance of consolidated financial statements with "International Financial Reporting Standards" (hereinafter, "IFRS") The Company has prepared the consolidated financial statements under IFRS.
The consolidated financial statements were approved on June 29, 2018 by Representative Director, President, Kazuhiro Tsuga and Director (CFO) Hirokazu Umeda.
(2) Basis of measurement The Company's consolidated financial statements have been prepared on a historical cost basis except for the financial instruments, the net amount of liabilities/assets for retirement benefit plans, etc. stated in "3. Significant Accounting Policies."
(3) Functional currency and presentation currency The Company's consolidated financial statements are presented in Japanese yen, which is the Company's functional currency, and figures are rounded to the nearest million (Japanese yen).
- 85 -

3. Significant Accounting Policies
(1) Basis of Consolidation
1) Subsidiaries Subsidiaries are entities that are controlled by the Company. The Company is deemed to control an entity when the Company has exposures or rights to variable returns arising from the Company's involvement in the entity and has an ability to affect those returns through its power over the entity.
The financial statements of subsidiaries are included in the Company's consolidated financial statements from the date on which control commences until the date on which control is lost.
If any accounting policies applied by a subsidiary differ from those applied by the Company, adjustments are made to the consolidated subsidiary's financial statements where necessary.
Balance of receivables and payables and volume of transactions between group companies and unrealized gains or losses arising from transactions between group companies are eliminated in the preparation of consolidated financial statements.
Any change in ownership interests in subsidiaries that does not result in a loss of control is accounted for as equity transaction. When control is lost, gains and losses arising from the loss of control are recognized in profit or loss.
2) Associates and joint ventures Associates are entities over which the Company has significant influence, but not control or joint control, in terms of financial and operating policies.
A joint venture is a specific type of joint arrangement under which operations are independent from each of the investing companies and the investing companies have rights only to the net assets of the arrangement. A joint arrangement is a contractual arrangement in which multiple ventures or parties undertake economic activities under joint control and significant decisions require unanimous consent of the parties sharing control.
Investments in associates and joint ventures are accounted for using the equity method from the date on which significant influence commences or the Company obtains joint control until the date on which significant influence or joint control ceases.
In the application of the equity method, when accounting policies applied by an associate or joint venture that is accounted for using the equity method differ from those applied by the Company, adjustments are made to financial statements of the associate or joint venture where necessary.
When an entity no longer meets the criteria for an associate or joint venture and the application of the equity method is discontinued, gains or losses arising from the discontinuation of application of the equity method are recognized in profit or loss.
(2) Business Combinations
The identifiable assets acquired and the liabilities assumed of the acquiree are recognized at the fair values on the acquisition date.
When the total of consideration transferred in business combinations, amount of non-controlling interests in the acquiree and fair value of the equity interest in the acquiree previously held by the acquirer exceeds the net value of identifiable assets and liabilities on the acquisition date, the excess amount is recognized as goodwill. When the total is lower than the net value of identifiable assets and liabilities, the difference is recognized as profit. Consideration transferred is calculated as the total of the fair value of the assets transferred, liabilities
- 86 -

assumed and equity interests issued, and includes fair value of assets or liabilities arising from the contingent consideration arrangement. Acquisition costs are recognized as expenses in the period they are incurred.
Non-controlling interests are measured at fair value or as non-controlling interests’ proportionate share of the acquiree’s net identifiable assets, for each individual business combination transaction.
(3) Foreign Currency Translation
1) Foreign currency transactions Foreign currency transactions are translated into the functional currency of the Company and each of its subsidiaries using the exchange rates at the date of the transactions.
Foreign currency monetary items at the end of each reporting period are translated into the functional currency using the closing rate, and non-monetary items measured at fair value in foreign currencies are translated into the functional currency using the exchange rates at the date when the fair value was measured.
Exchange differences arising from the translation or settlement are generally recognized in profit or loss.
2) Translation of foreign operations Assets and liabilities of foreign operations are translated at the closing rate, while their income and expenses are translated at the average rate during the period unless exchange rates fluctuate significantly. Exchange differences arising from translation are recognized in other comprehensive income.
When a foreign operation is disposed of, cumulative translation differences associated with the foreign operation are transferred to profit or loss at the time of disposal.
(4) Financial instruments
1) Non-derivative financial assets (i) Initial recognition and measurement
Financial assets that are stocks and bonds are initially recognized on the contract date. All other financial assets are initially recognized on the transaction date.
Financial assets are classified into financial assets measured at amortized cost or financial assets measured at fair value at initial recognition. This classification is made as follows, depending on whether the financial asset is a debt instrument or equity instrument.
Financial assets that are debt instruments are classified as financial assets measured at amortized cost when the following conditions are both satisfied, and as financial assets measured at fair value through profit or loss (hereinafter, "FVTPL") in other cases.
(a) The asset is held within a business model whose objective is to hold assets in order to collect contractual cash flows.
(b) The contractual terms of the financial asset give rise on specified dates to cash flows that are solely payments of principal and interest on the principal amount outstanding.
Except for equity instruments held for trading, financial assets that are equity instruments are, in principle, classified as financial assets measured at fair value through other comprehensive income (hereinafter, "FVTOCI").
For financial assets measured at FVTPL, the transaction costs are recognized in profit or loss when they are incurred. Financial assets measured at FVTOCI are measured at the fair value plus transaction costs directly attributable to the asset.
- 87 -

(ii) Subsequent measurement (a) Financial assets measured at amortized cost
These financial assets are measured at amortized cost using the effective interest method, and interests are recognized as "finance income" in profit or loss.
(b) Financial assets measured at fair value These financial assets are measured at fair value. For equity instruments that the Company has chosen to classify as financial assets measured at FVTOCI, changes in fair value are recognized in other comprehensive income. Cumulative gains or losses are transferred to retained earnings when the instrument is derecognized. However, dividends are recognized as "finance income" in profit or loss. For financial assets measured at FVTPL, changes in fair value are recognized in profit or loss.
(iii) Derecognition Financial assets are derecognized when the contractual rights to the cash flows from the financial assets expire or when the contractual rights to receive the cash flows of the financial assets are transferred and substantially all the risks and rewards of ownership of such financial assets are transferred.
(iv) Impairment For financial assets measured at amortized cost, an assessment is made at the end of each reporting period as to whether or not the credit risk associated with such assets has increased significantly since the initial recognition, and the following amounts are recognized as allowance for expected credit losses depending on whether or not a significant increase in credit risk has occurred since the initial recognition. (a) If credit risk has not increased significantly since initial recognition
Amount equivalent to 12-month expected credit losses (b) If credit risk has increased significantly since initial recognition
Amount equivalent to lifetime expected credit losses (c) If financial assets, whose credit risk has increased significantly since initial recognition, are credit-
impaired Amount equivalent to lifetime expected credit losses
Evidence that a financial asset is credit-impaired includes observable data about the following events: ・significant financial difficulty of the issuer or the borrower ・a breach of contract, such as a default or past due event ・it is becoming probable that the borrower will enter bankruptcy or other financial reorganization ・the disappearance of an active market for that financial asset because of financial difficulties
However, for trade receivables and lease receivables, allowance for expected credit losses in the amount equivalent to lifetime expected credit losses is recognized, regardless of whether a significant increase in credit risk has occurred since initial recognition.
Allowance for expected credit losses is recognized in profit or loss. When an event that results in a reduction in allowance for expected credit losses occurs, the reversal is recognized in profit or loss.
2) Non-derivative financial liabilities (i) Initial recognition and measurement
Financial liabilities are classified into financial liabilities measured at amortized cost and financial liabilities measured at FVTPL at initial recognition. While all financial liabilities are initially measured at fair value, financial liabilities measured at amortized cost are measured at fair value net of directly attributable issuance costs.
(ii) Subsequent measurement After initial recognition, financial liabilities are measured based on the classification as follows. (a) Financial liabilities measured at amortized cost
- 88 -

These financial liabilities are measured at amortized cost using the effective interest method. Amortization using the effective interest method and gains or losses arising in the case of derecognition are recognized as "finance costs" in profit or loss.
(b) Financial liabilities measured at FVTPL These financial liabilities are measured at fair value.
(iii) Derecognition Financial liabilities are derecognized when the obligation specified in a contract is discharged or cancelled or expired.
3) Derivatives and hedge accounting The Company utilizes derivatives such as foreign exchange contracts, cross currency swaps and commodity futures to hedge currency risk and risk of changes in commodity prices. These derivatives are initially recognized at fair value when the contract is entered into, and are subsequently measured at fair value.
Changes in fair value of derivatives are recognized as profit or loss. However, the effective portion of cash flow hedges is recognized as other comprehensive income.
The Company formally documents relationships between hedging instruments and hedged items, as well as its risk management objective and strategy for undertaking various hedge transactions. The Company also assesses, both at the hedge's inception and an ongoing basis, whether the derivatives that are used in hedging transactions are highly effective in offsetting changes in fair values or cash flows of hedged items. Hedges that meet the requirements for hedge accounting are classified and accounted for as follows: (i) Fair value hedges Changes in fair value of hedging instruments are recognized as profit or loss. Changes in fair value of hedged items resulting from the hedged risk are recognized as profit or loss, while the carrying amount of the hedged item is adjusted for the changes.
(ii) Cash flow hedges Of changes in fair value of hedging instruments, the effective portion is recognized in other comprehensive income, while the ineffective portion is recognized in profit or loss.
The amounts of hedging instruments recorded in other comprehensive income are reclassified to profit or loss when the hedged transactions affect profit or loss. In cases where hedged items result in the recognition of non-financial assets or liabilities, the amounts recognized as other comprehensive income are reclassified as adjustments to the initial carrying amount of non-financial assets or liabilities.
4) Offsetting of financial assets and financial liabilities The Company offsets financial assets and financial liabilities and presents them as a net amount only when it holds a legally enforceable right to set off the amounts recognized as assets and liabilities and intends either to settle them on a net basis or to realize the asset and settle the liability simultaneously.
(5) Cash and Cash Equivalents
Cash and cash equivalents consist of cash on hand, demand deposits withdrawable at any time, and short-term investments with a maturity of three months or less from the acquisition date that are readily convertible to cash and are subject to insignificant risk of changes in value.
(6) Inventories
Inventories are recognized at the lower of cost or net realizable value. Cost is principally calculated on an average basis. Cost includes purchase costs, processing costs and all expenses required to bring the inventories to the present location and condition. Net realizable value is the estimated selling price in the ordinary course of business less the estimated costs of completion and the estimated selling costs.
- 89 -

(7) Property, Plant and Equipment
1) Recognition and measurement Property, plant and equipment are measured using the cost model. Property, plant and equipment are presented at the amount of cost less accumulated depreciation and any accumulated impairment losses.
Cost includes cost directly attributable to the acquisition of assets, and the initial estimate of dismantling and removing costs and restoration costs.
2) Depreciation Depreciation is calculated to write off cost of Property, plant and equipment (except for assets that are not subject to depreciation such as land) less their estimated residual values using the straight-line method over their estimated useful lives.
The estimated useful lives of major asset items are as follows: ・ Buildings and structures: 5 to 50 years ・ Machinery and vehicles: 2 to 10 years ・ Tools, furniture and fixtures: 1 to 10 years Leased assets are depreciated over the shorter of the lease term and their estimated useful lives unless it is reasonably certain that the Company will obtain ownership by the end of lease terms. The depreciation methods, estimated useful lives and residual values are reviewed at the end of each fiscal year, and changed if necessary.
(8) Goodwill and Intangible Assets
1) Goodwill Goodwill acquired in the business combination is stated at the amount of cost less accumulated impairment losses. Goodwill is not amortized and tested for impairment annually.
2) Intangible assets Intangible assets are measured using the cost model. Intangible assets with finite useful lives are presented at the amount of cost less accumulated amortization and any accumulated impairment losses, while intangible assets with indefinite useful lives are presented at the amount of cost less accumulated impairment losses.
Expenditures in development activities are recognized as assets only if all of the following requirements can be demonstrated. Otherwise, it is recognized in profit or loss as incurred. (i) Technical feasibility of completing the intangible asset so that it will be available for use or sale (ii) Intention to complete the intangible asset and use or sell it (iii) Ability to use or sell the intangible asset (iv) How the intangible asset will generate probable future economic benefits (v) Availability of adequate technical, financial and other resources to complete the development and to use
or sell the intangible asset (vi) Ability to measure reliably the expenditure attributable to the intangible asset during its development Amortization is calculated to write off the cost of intangible assets with finite useful lives less their estimated residual values using the straight-line method over their estimated useful lives from the date when the asset becomes available for use.
The estimated useful lives of major asset items are as follows: ・ Software: 2 to 5 years ・ Technology: 3 to 34 years ・ Customer: 2 to 29 years
The amortization methods and estimated useful lives are reviewed at the end of each fiscal year, and changed if necessary.
- 90 -

(9) Leases
Determining whether an arrangement is, or contains, a lease is based on the substance of the arrangement at the inception of the arrangement.
Leases are classified as finance leases when substantially all the risks and rewards incidental to ownership of an asset are transferred to the lessee, while all other leases are classified as operating leases.
(10) Impairment of Non-Financial Assets
In terms of non-financial assets (excluding inventories and deferred tax assets, etc.), an assessment is made for any indications of impairment in each asset or cash-generating unit. If any such indication exists, then the recoverable amount of the asset or the cash-generating unit is estimated and impairment tests are conducted. Regardless of whether or not there are indications of impairment, impairment tests of goodwill and intangible assets with indefinite useful lives are conducted annually. The Company designated January 1 as the impairment date and conducts impairment tests of goodwill and intangible assets with indefinite useful lives at least once a year. In addition, impairment tests are performed whenever an indication of impairment becomes apparent.
As corporate assets do not independently generate cash inflows, when indications of impairment become apparent in corporate assets, impairment tests are conducted based on the recoverable amount of the cash-generating unit to which such assets belong.
The recoverable amount is calculated at the higher of the fair value less costs to sell or the value in use. Value in use is calculated by discounting the future cash flows expected to be derived from the asset or cash-generating unit to their present value.
If the recoverable amount of the asset or cash-generating unit is less than the carrying amount, the carrying amount is reduced to the recoverable amount, and the amount of difference is recognized as an impairment loss in profit or loss.
Impairment losses recognized for goodwill are not reversed. Other assets or cash-generating units for which impairment losses were recognized in past years are evaluated to determine whether there is any indication of reversal of the impairment loss. If any such indication exists, recoverable amount of the asset or cash-generating unit is estimated, and if the recoverable amount exceeds the carrying amount, impairment loss is reversed. The amount of reversal is recognized in profit or loss up to the carrying amount, net of depreciation or amortization, that would have been determined if no impairment loss had been recognized in past years.
Goodwill on an investment in associates and joint ventures that forms part of the carrying amount of the investment is not separated from the other part and subject to impairment as a single asset.
(11) Income Taxes
Income taxes, which comprise current taxes and deferred taxes, are recognized in profit or loss, except to the extent that they relate to business combinations or item recognized in other comprehensive income or directly in equity.
Current taxes are measured at the expected amount of taxes payable to or recoverable from tax authorities, using the tax rates and tax laws that have been enacted or substantively enacted by the end of the reporting period.
Deferred taxes are recognized based on temporary differences between the carrying amounts of assets and liabilities for accounting purposes and the amounts used for taxation purpose. Deferred tax assets and liabilities
- 91 -

are not recognized for temporary differences related to initial recognition of assets or liabilities in transactions that are not business combinations and affect neither of accounting nor taxable profit. Deferred tax liabilities are also not recognized for taxable temporary differences arising from the initial recognition of goodwill.
In principle, deferred tax liabilities are recognized for taxable temporary differences associated with investments in subsidiaries, associates and joint ventures. However, if the Company is able to control the timing of the reversal of the temporary differences and it is probable that the temporary differences will not reverse in the foreseeable future, deferred tax liabilities are not recognized. Deductible temporary differences associated with investments in subsidiaries, associates and joint ventures are recognized only to the extent that it is probable that there will be sufficient taxable profit against which the benefit from temporary differences can be utilized and the temporary differences will reverse in the foreseeable future.
Deferred taxes are measured using the tax rates that are expected to be applied when they reverse, using tax rates and tax laws that have been enacted or substantively enacted by the end of the reporting period. Deferred tax assets and liabilities are offset if the Company has a legally enforceable right to offset current tax assets against current tax liabilities, and if the same taxation authority levies income taxes on the same taxable entity.
Deferred tax assets are recognized for deductible temporary differences, unused tax losses and tax credits carryforward only to the extent that it is probable that they can be utilized against future taxable profit. Deferred tax assets are reviewed at the end of each reporting period and reduced to the extent that it is no longer probable that the related tax benefits will be realized.
(12) Employee Benefits
1) Post-employment benefits The Company adopts defined benefit plans and defined contribution plans.
(i) Defined benefit plans Net defined benefit liability or asset is calculated by deducting the fair value of plan assets from the present value of defined benefit obligation. The ceiling of the amount recorded as assets based on this calculation is the present value of any future economic benefits available in the form of refunds from the plan or reductions in future contributions to the plan. Defined benefit obligation is determined using the projected unit credit method, and its present value is calculated by discounting future estimated benefits. The discount rate is determined by reference to market yields on high-quality corporate bonds as of the end of the fiscal year, reflecting the estimated timing and amount of benefit payment.
Service cost and net interest on the net defined benefit liability or asset are recognized as profit or loss. Past service cost is immediately recognized in profit or loss.
Remeasurements of net defined benefit liability or asset including actuarial gains and losses are recognized in other comprehensive income when they are incurred, and immediately transferred to retained earnings.
(ii) Defined contribution plans Contributions to defined contribution pension plans are recognized as employee benefits expenses in profit or loss in the period during which employees render services.
2) Short-term employee benefits Short-term employee benefits are measured on an undiscounted basis and are recognized as employee benefits expenses in profit or loss when employees render the related services.
For bonuses and paid absences, estimated amounts are recognized as liabilities when the Company has legal and constructive obligations to make such payments and a reliable estimate of the amounts can be made.
- 92 -

(13) Provisions
Provisions are recognized when the Company has present legal or constructive obligations as a result of past events, it is probable that outflows of resources embodying economic benefits will be required to settle the obligations, and reliable estimates can be made of the amount of obligations.
When the effect of the time value of money is material, the amount of provision is measured at the present value of the expected future cash flows required to settle the obligation.
(14) Equity
1) Ordinary shares With regard to ordinary shares issued by the Company, the issuance value is recorded in common stock and capital surplus, and costs directly attributable to the issue of ordinary shares are recognized as a deduction from equity.
2) Treasury shares When treasury shares are acquired, the amount of the consideration paid, which includes directly attributable cost is recognized as a deduction from equity. When treasury shares are sold, the amount of the consideration received is recognized as an increase in equity.
(15) Share-Based Payments
The Company has the share option plan as an incentive plan for its Directors (excluding Outside Directors), Executive Officers and certain other officers. Share options are estimated at fair value on the grant date and recognized as expenses over the period from the grant date to the vesting of rights, with a corresponding increase in equity. The fair value of options granted is calculated using the Black-Scholes model, taking into account terms and conditions of options.
(16) Revenue Recognition
1) Sales of products The Company principally has sales transactions of products such as consumer and industrial products, equipment, and supplies.
Sales of products are recognized when all of the following requirements are satisfied. ・ The significant risks and rewards of ownership of the goods are transferred to the buyer. ・ Neither continuing managerial involvement to the degree usually associated with ownership nor effective control over the goods sold is retained.
・ The amount of revenue can be measured reliably. ・ It is probable that the economic benefits associated with the transaction will flow to the Company. ・ The costs incurred or to be incurred in respect of the transaction can be measured reliably.
Net sales are measured at fair value of the consideration received or receivable. The Company deducts certain price adjustment expenses that are appropriated to payments to compensate for the decline in product prices in association with sales to its consumer business distributors and sales rebates under incentive programs offered to distributors, from net sales.
- 93 -

2) Rendering of services The Company has transactions of services such as repair request and maintenance incidental to sales of products, and investigation, analysis, supervision, maintenance, etc. of electric and building equipment, environment-related equipment and disaster prevention/security-related equipment.
Net sales from these transactions are principally recognized according to the stage of completion of the transaction at the end of the fiscal year.
3) Construction contracts The Company has transactions of design, construction, etc. for housing, electric and building equipment, environment-related equipment and disaster prevention/security-related equipment.
For these transactions, when the amount of order received and total cost required to complete the transaction can be estimated reliably, net sales are recorded in accordance with the percentage of actual costs incurred to date to estimated total costs at the end of each reporting period (percentage-of-completion method). When the initial estimate of net sales or progress up to the completion may be changed, the Company reviews the estimate.
When the amount of order received or total cost required to complete the transaction cannot be estimated reliably, the amount equivalent to the extent of costs incurred that is considered highly recoverable is recorded as net sales (cost recovery method). Costs are recognized as cost of sales in profit or loss in the fiscal period during which they are incurred.
4) Multiple-element transactions The Company has entered into a variety of transaction arrangements with customers through a combination of products, equipment, installation, maintenance, etc. Revenue from such arrangements is recognized individually for each element when the following requirements are satisfied. ・ The element has standalone value to the customer. ・ The fair value of the element can be measured reliably.
For multiple-element transactions, when consideration of the arrangement needs to be allocated, the allocation is made based on estimated fair values of each element.
5) Gross and net presentation of net sales The Company judges whether the Company is a principal or agent to the transaction for each arrangement taking into account the following indicators. ・ Have the primary responsibility for providing the goods or services to the customer or for fulfilling the order
・ Have inventory risk before or after the customer order, during shipping or on return ・ Have discretion in establishing prices, either directly or indirectly ・ Bear the customer’s credit risk for the amount receivable from the customer
When the Company judges that the Company is a principal to the transaction, net sales for the transaction are presented on a gross basis. When the Company judges that the Company is an agent, net sales for the transaction are presented on a net basis.
(17) Government Grants
Government grants for acquisition of an asset are measured at fair value, and directly deducted from acquisition cost of the asset, when it is reasonably certain that the Company receives the grants and complies with the terms and conditions attached to the grants.
- 94 -

(18) Earnings Per Share
Basic earnings per share are calculated by dividing net profit attributable to owners of parent by the weighted average number of issued ordinary shares less the number of treasury shares during the fiscal year. Diluted earnings per share are calculated, adjusted for the effects of all dilutive potential ordinary shares.
(19) Significant Accounting Estimates and Judgments Involving Estimations
The Company makes judgments, estimates and assumptions that affect the application of accounting policies and the reported amounts of assets, liabilities, income and expenses for the preparation of consolidated financial statements. Actual results may differ from the accounting estimates and their underlying assumptions.
Estimates and their underlying assumptions are reviewed on an ongoing basis, and revisions to accounting estimates are recognized in the reporting period in which the estimates are revised and in future reporting periods.
Items related to assumptions and estimates that have a risk to cause significant adjustment in the next fiscal year are as follows: ・ Revenue recognition ・ Net realizable value of inventories ("7. Inventories") ・ Recoverability of deferred tax assets ("13. Income Taxes") ・ Defined benefit obligations ("17. Employee Benefits") ・ Impairment of non-financial assets (including goodwill) ("26. Impairment of Non-Financial Assets") ・ Fair value of assets acquired and liabilities assumed in business combinations ("34. Business Combinations")
Items for which judgments are made in applying accounting policies that have the most significant effects on the amounts recognized in the consolidated financial statements are as follows: ・ Scope of subsidiaries, associates and joint ventures ("11. Investments Accounted for Using the Equity Method" and "30. Major Subsidiaries")
・ Classification of leases ("10. Leases") ・ Classification of financial assets ("12. Other Financial Assets") ・ Recognition of provisions ("18. Provisions") ・ Determination of cash-generating units in conducting impairment test of non-financial assets ("26. Impairment of Non-financial Assets")
・ Assessment on whether or not there is any indication of impairment of non-financial assets ("26. Impairment of Non-Financial Assets")
・ Presence of a significant increase in credit risk of financial assets measured at amortized cost ("29. Financial Instruments")
- 95 -

(20) Standards and interpretations that have been issued but not yet applied
The following shows major published IFRS standards and interpretations that were newly issued or amended by the date of approval of the consolidated financial statements but have not been applied as of March 31, 2018 because the application is not yet mandatory.
The Company applies IFRS 15, "Revenue from Contracts with Customers" from April 1, 2018 using the method recognizing the cumulative effect of applying IFRS 15 at the date of initial application. Cumulative effects of applying IFRS 15, "Revenue from Contracts with Customers" on the opening balance of the Company's "retained earnings" at April 1, 2018 are insignificant. Effects on "net profit", "basic earnings per share" and "diluted earnings per share" for the year ended March 31, 2019 are expected to be insignificant.
The impact of the application of IFRS16, "Leases" on the consolidated financial statements of the Company is under consideration and cannot be estimated at this point.
Name of the standards
Mandatory application (from the fiscal year beginning on or after)
To be applied by the Company
Description of new standards, interpretations and
amendments
IFRS 15 Revenue from Contracts with Customers
January 1, 2018 Fiscal year ending March 31, 2019
Establishment of standards for revenue from contracts with customers
IFRS 16 Leases January 1, 2019 Fiscal year ending March 31, 2020
Establishment of standards for leases
(21) Application of new standards and interpretations
1) IFRS 9, "Financial Instruments" The Company early applied IFRS 9 (revised July 2014) from April 1, 2016. The amounts of effects are stated in "Cumulative effects of new accounting standards applied" in "Consolidated Statements of Changes in Equity" for the year ended March 31, 2017.
2) IAS 7, "Statement of Cash Flows" The Company applied IAS 7 (revised January 2016) from April 1, 2017. The amendments require an entity to provide additional disclosures that enable users of financial statements to evaluate changes in liabilities arising from financing activities, including both changes arising from cash flows and non-cash changes. "Changes in liabilities arising from financing activities" based on this standard is as stated in Note 15 "Short-term Debt and Long-term Debt".
- 96 -
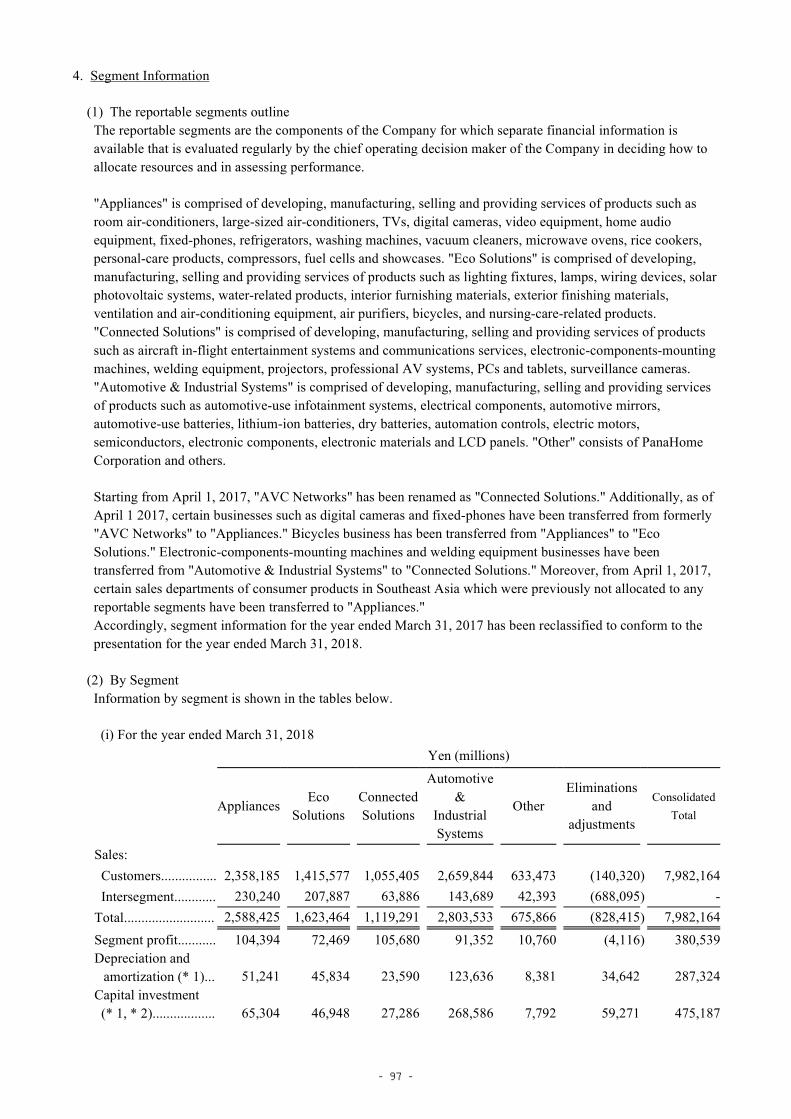
4. Segment Information
(1) The reportable segments outline The reportable segments are the components of the Company for which separate financial information is available that is evaluated regularly by the chief operating decision maker of the Company in deciding how to allocate resources and in assessing performance.
"Appliances" is comprised of developing, manufacturing, selling and providing services of products such as room air-conditioners, large-sized air-conditioners, TVs, digital cameras, video equipment, home audio equipment, fixed-phones, refrigerators, washing machines, vacuum cleaners, microwave ovens, rice cookers, personal-care products, compressors, fuel cells and showcases. "Eco Solutions" is comprised of developing, manufacturing, selling and providing services of products such as lighting fixtures, lamps, wiring devices, solar photovoltaic systems, water-related products, interior furnishing materials, exterior finishing materials, ventilation and air-conditioning equipment, air purifiers, bicycles, and nursing-care-related products. "Connected Solutions" is comprised of developing, manufacturing, selling and providing services of products such as aircraft in-flight entertainment systems and communications services, electronic-components-mounting machines, welding equipment, projectors, professional AV systems, PCs and tablets, surveillance cameras. "Automotive & Industrial Systems" is comprised of developing, manufacturing, selling and providing services of products such as automotive-use infotainment systems, electrical components, automotive mirrors, automotive-use batteries, lithium-ion batteries, dry batteries, automation controls, electric motors, semiconductors, electronic components, electronic materials and LCD panels. "Other" consists of PanaHome Corporation and others.
Starting from April 1, 2017, "AVC Networks" has been renamed as "Connected Solutions." Additionally, as of April 1 2017, certain businesses such as digital cameras and fixed-phones have been transferred from formerly "AVC Networks" to "Appliances." Bicycles business has been transferred from "Appliances" to "Eco Solutions." Electronic-components-mounting machines and welding equipment businesses have been transferred from "Automotive & Industrial Systems" to "Connected Solutions." Moreover, from April 1, 2017, certain sales departments of consumer products in Southeast Asia which were previously not allocated to any reportable segments have been transferred to "Appliances." Accordingly, segment information for the year ended March 31, 2017 has been reclassified to conform to the presentation for the year ended March 31, 2018.
(2) By Segment Information by segment is shown in the tables below.
(i) For the year ended March 31, 2018 Yen (millions)
Appliances Eco
Solutions Connected Solutions
Automotive &
Industrial Systems
Other
Eliminations and
adjustments Consolidated
Total
Sales:
Customers................ 2,358,185 1,415,577 1,055,405 2,659,844 633,473 (140,320 ) 7,982,164 Intersegment............ 230,240 207,887 63,886 143,689 42,393 (688,095 ) - Total.......................... 2,588,425 1,623,464 1,119,291 2,803,533 675,866 (828,415 ) 7,982,164
Segment profit........... 104,394 72,469 105,680 91,352 10,760 (4,116 ) 380,539 Depreciation and amortization (* 1)...
51,241
45,834
23,590
123,636
8,381
34,642
287,324 Capital investment (* 1, * 2)..................
65,304
46,948
27,286
268,586
7,792
59,271
475,187
- 97 -

(ii) For the year ended March 31, 2017 Yen (millions)
Appliances Eco
Solutions Connected Solutions
Automotive &
Industrial Systems
Other
Eliminations and
adjustments Consolidated
Total
Sales:
Customers............... 2,276,328 1,327,386 987,381 2,268,921 638,608 (154,917 ) 7,343,707 Intersegment........... 227,028 219,915 63,847 147,646 35,810 (694,246 ) - Total.......................... 2,503,356 1,547,301 1,051,228 2,416,567 674,418 (849,163 ) 7,343,707 Segment profit.......... 98,869 64,248 50,350 93,013 8,011 (37,707 ) 276,784 Depreciation and amortization (* 1)..
48,512
46,986
24,295
107,486
8,732
33,987
269,998 Capital investment (* 1, * 2)...................
56,186
39,620
25,405
226,845
7,963
17,189
373,208
(* 1) Property, plant and equipment and intangible assets (* 2) Amounts on an accrual basis
The accounting policies for reportable segments are the same as the Company's accounting policies that are provided in Note 3 "Significant accounting policies". Transactions between segments have been conducted at arm's length prices. Profit of the reportable segments is calculated on an operating profit basis.
The figures in "Eliminations and Adjustments" include revenues and expenses which are not attributable to any reportable segments for the purpose of evaluating operating results of each segment, consolidation adjustments, and eliminations of intersegment transactions.
Adjustments to segment sales to customers for the years ended March 31, 2018 and 2017 mainly include price differences between sales prices to external customers and the internal sales prices adopted for performance measurement purposes for the sales of consumer products through certain sales departments, and consolidation adjustments for sales price.
Adjustments to segment profit for the years ended March 31, 2018 and 2017 include profit (loss) of corporate headquarters, etc. and profit (loss) which is attributable to certain sales departments of consumer products. Consolidation adjustments also include amortization of certain intangible assets acquired in business combination, and share of profit of investments accounted for using the equity method which are not attributable to any specific segments. The amount of share of profit of investments accounted for using the equity method which are attributable to each segment is immaterial.
(3) Information about products and services This information has been omitted because similar information has been disclosed in "(1)The reportable segments outline", and "(2) By Segment".
- 98 -

(4) Information about geographical areas Net sales and non-current assets (except for Investments accounted for using the equity method, Financial instruments, Deferred tax assets and net Defined benefit pension plan assets) broken down by the customers' location are as follows:
(i) Net sales Yen (millions)
2018 2017
Japan.............................................................................. 3,724,061 3,659,113 North and South America.............................................. 1,368,297 1,272,214 Europe............................................................................ 821,053 607,695 Asia, China and others................................................... 2,068,753 1,804,685 Consolidated total........................................................ 7,982,164 7,343,707 United States included in North and South America..... 1,237,527 1,147,690 China included in Asia, China and others...................... 981,697 827,473
(ii) Non-current assets (except for Investments accounted for using the equity method, Financial instruments, Deferred tax assets and net Defined benefit pension plan assets)
Yen (millions)
March 31
2018 2017
Japan.............................................................................. 1,187,947 1,175,162 North and South America.............................................. 395,264 422,240 Europe............................................................................ 183,952 80,656 Asia, China and others................................................... 384,845 363,189 Consolidated total........................................................ 2,152,008 2,041,247
(*) Major countries or regions belonging to categories other than Japan : North and South America: North America, Central and South America Europe: Europe and Africa Asia, China and others: Asia, China and Oceania
There is no material country in North and South America, Europe, and Asia, China and others whose information should be separately disclosed, except for the United States and China on net sales.
(5) Information about major customers This information has been omitted because no sales to a single external customer accounts for more than 10% of net sales.
- 99 -

5. Cash and Cash Equivalents
Cash and cash equivalents as of March 31, 2018 and 2017, consist of cash on hand, demand deposits withdrawal at any time and short-term investments with a maturity of three months or less, and the balance on the consolidated statements of financial position is equal to the balance on the consolidated statements of cash flows. Cash and cash equivalents are classified as financial assets measured at amortized cost.
6. Trade receivables
Trade receivables (except for receivables from construction contracts in progress) are classified as financial assets measured at amortized cost. Components of trade receivables are as follows:
Yen (millions)
March 31
2018 2017
Trade notes receivable................................. 78,963 68,368 Trade accounts receivable........................... 978,627 799,271 Less allowance for credit losses.................. (18,606 ) (20,636 ) Total........................................................... 1,038,984 847,003
7. Inventories
Inventories are summarized as follows:
Yen (millions)
March 31
2018 2017
Finished goods............................................ 606,417 492,521 Work in process........................................... 141,381 115,665 Raw materials.............................................. 240,811 198,123 Total........................................................... 988,609 806,309
The amounts of write-downs of inventories that were recognized as expenses for the years ended March 31, 2018 and 2017 are 43,799 million yen and 40,704 million yen, respectively. The amounts of write-downs are included in "cost of sales" in the consolidated statements of profit or loss. The amounts of reversal of write-downs for the years ended March 31, 2018 and 2017 are not material.
- 100 -

8. Property, plant and equipment
(1) Reconciliation of the beginning and ending balances of book value, cost, and accumulated depreciation and accumulated impairment losses are as follows:
(i) Book value Yen (millions)
Land
Buildings and
structures
Machinery and
vehicles
Tools, furniture and fixtures
Construction in progress
Total
Balance as of March 31, 2016 223,469 492,268 390,211 106,284 76,002 1,288,234 Additions, excluding business combinations.........
1,224
14,379
35,964
42,893
217,181
311,641
Transfers between accounts... 11 20,771 97,770 27,444 (145,996 ) - Sales or disposal.................... (19,245 ) (4,479 ) (2,363 ) (2,279 ) (2,572 ) (30,938 ) Depreciation........................... - (49,133 ) (113,447 ) (61,825 ) - (224,405 ) Impairment losses.................. (6,102 ) (3,762 ) (7,551 ) (2,055 ) (293 ) (19,763 ) Acquisitions through business combinations.........
1,637
6,155
5,081
357
998
14,228
Exchange differences on foreign currencies.................
(277
)
(4,841
)
(9,187
)
(2,436
)
1,026
(15,715
) Balance as of March 31, 2017 200,717 471,358 396,478 108,383 146,346 1,323,282 Additions, excluding business combinations......... 16,951 25,397 54,005 48,152 247,729 392,234
Transfers between accounts... 82 33,504 153,174 23,678 (210,438 ) - Sales or disposal.................... (2,507 ) (28,101 ) (81,640 ) (1,670 ) (8,641 ) (122,559 ) Depreciation.......................... - (48,196 ) (119,198 ) (59,182 ) - (226,576 ) Impairment losses.................. (2,696 ) (4,586 ) (6,987 ) (1,610 ) (1,657 ) (17,536 ) Acquisitions through business combinations.........
5,405 11,374 7,560 2,351 3,344 30,034
Exchange differences on foreign currencies................
103 1,743 1,523 1,091 (4,166 ) 294
Others................................ (57 ) (2,444 ) (2,225 ) (346 ) (35 ) (5,107 )
Balance as of March 31, 2018 217,998 460,049 402,690 120,847 172,482 1,374,066
1. Depreciation is included in "cost of sales," "selling, general and administrative expenses," and "other income (expenses), net" in the consolidated statements of profit or loss.
2. "Sales or disposal" of each property, plant and equipment for the year ended March 31, 2018 includes a decrease due to recognition of finance leases, as the lessor. For further detail, please refer to "(2) Lessor" in Note 10 "Leases."
(ii) Cost Yen (millions)
Land
Buildings and
structures
Machinery and
vehicles
Tools, furniture and fixtures
Construction in progress
Total
As of March 31, 2016...... 257,833 1,544,718 2,354,686 927,744 77,202 5,162,183 As of March 31, 2017...... 236,041 1,525,408 2,354,091 909,323 147,574 5,172,437 As of March 31, 2018...... 251,063 1,547,677 2,415,561 932,322 174,129 5,320,752
- 101 -

(iii) Accumulated depreciation and impairment losses Yen (millions)
Land
Buildings and
structures
Machinery and
vehicles
Tools, furniture and fixtures
Construction in progress
Total
As of March 31, 2016...... (34,364 ) (1,052,450 ) (1,964,475 ) (821,460 ) (1,200 ) (3,873,949 ) As of March 31, 2017...... (35,324 ) (1,054,050 ) (1,957,613 ) (800,940 ) (1,228 ) (3,849,155 ) As of March 31, 2018...... (33,065 ) (1,087,628 ) (2,012,871 ) (811,475 ) (1,647 ) (3,946,686 )
(2) Leased assets under finance leases
The carrying amounts of leased assets under finance leases included in property, plant and equipment are as follows:
Yen (millions)
Building and
structures
Machinery and
vehicles
Tools, furniture and fixtures
Total
As of March 31, 2016.... 585 6,042 5,628 12,255 As of March 31, 2017.... 968 3,893 5,711 10,572 As of March 31, 2018.... 1,631 2,496 4,672 8,799
- 102 -

9. Goodwill and intangible assets
(1) Book value Yen (millions)
Intangible assets
Goodwill Software Technology Customer Others Total
Balance as of March 31, 2016 295,574 58,142 66,337 21,494 32,602 178,575 Additions, including internal developments......................
-
29,924
30,947
-
696
61,567
Acquisitions through business combinations.........
106,247
1,576
9,608
62,254
33,037
106,475
Amortization......................... - (25,196 ) (10,783 ) (5,518 ) (4,096 ) (45,593 ) Impairment losses................. (10,068 ) (390 ) (13,464 ) - (2,183 ) (16,037 ) Exchange differences on foreign currencies................
(4,062
)
403
(17
)
(2,650
)
(2,053
)
(4,317
) Disposal and others............... (804 ) (1,307 ) (505 ) - (613 ) (2,425 )
Balance as of March 31, 2017 386,887 63,152 82,123 75,580 57,390 278,245 Additions, including internal developments...................... - 42,498 38,195 - 2,260 82,953
Acquisitions through business combinations.........
31,021 370 16,779 18,521 4,846 40,516
Amortization......................... - (27,881 ) (23,388 ) (6,586 ) (2,893 ) (60,748 ) Impairment losses................. (3,256 ) (275 ) (3,019 ) (1,346 ) (1,340 ) (5,980 ) Exchange differences on foreign currencies................
(4,604 ) (12 ) 1,436 (2,655 ) (2,234 ) (3,465 )
Disposal and others............... (1,745 ) 38 221 1,154 (2,986 ) (1,573 )
Balance as of March 31, 2018 408,303 77,890 112,347 84,668 55,043 329,948
Amortization is included in "cost of sales" and "selling, general and administrative expenses" in the consolidated statements of profit or loss.
Additions include internal developments with amount of 52,939 million yen and 38,109 million yen for the years ended March 31, 2018 and 2017, respectively. Internal developments principally relate to software and technology.
Intangible assets with indefinite useful lives are included in "Others" on above table and the carrying amounts as of March 31, 2018 and 2017 are 41,572 million yen and 43,647 million yen, respectively. Since these assets are mainly trade names and basically exist as long as the business continues, they have been determined to have an indefinite useful life.
- 103 -

(2) Acquisition Cost Yen (millions)
Intangible assets
Goodwill Software Technology Customer Others Total
As of March 31, 2016............ 662,555 354,358 429,414 57,045 101,391 942,208 As of March 31, 2017............ 763,936 367,560 461,111 115,601 133,386 1,077,658 As of March 31, 2018............ 788,608 396,583 508,352 131,937 115,538 1,152,410
(3) Accumulated amortization and accumulated impairment losses Yen (millions)
Intangible assets
Goodwill Software Technology Customer Others Total
As of March 31, 2016............ (366,981 ) (296,216 ) (363,077 ) (35,551 ) (68,789 ) (763,633 ) As of March 31, 2017............ (377,049 ) (304,408 ) (378,988 ) (40,021 ) (75,996 ) (799,413 ) As of March 31, 2018............ (380,305 ) (318,693 ) (396,005 ) (47,269 ) (60,495 ) (822,462 )
(4) Individually material intangible assets There were no individually material intangible assets as of March 31, 2018 and 2017.
- 104 -

10. Leases
(1) Lessee The Company uses leased land, buildings and structures, machinery and vehicles, tools, furniture and fixtures, software, etc. under finance leases and operating leases. For certain leased assets, the Company can choose to purchase the leased asset or to terminate the lease contract and guarantee certain value of the leased asset, under given conditions during or at the end of the lease term.
The Company sells and leases back certain assets. With regard to assets leased back, there are no terms and conditions of transactions, obligations, covenants or circumstances that result in the Company's continuous involvement in the asset.
(a) Finance leases
Future minimum lease payments and present value based on finance leases are as follows: Yen (millions)
Future minimum lease payments Present value of future
minimum lease payments
March 31 March 31
2018 2017 2018 2017
Within 1 year...................................... 9,686 9,831 9,291 9,295 Over 1 year to 5 years......................... 10,106 17,354 9,495 16,761 Over 5 years........................................ 2,107 1,646 1,979 1,590 Total.................................................. 21,899 28,831 20,765 27,646 Less amount representing interest...... (1,134 ) (1,185 )
Present value of net future minimum lease payments..................................
20,765
27,646
(b) Operating leases
Future minimum lease payments based on non-cancellable operating leases are as follows: Yen (millions)
March 31
2018 2017
Within 1 year...................................... 43,761 38,375 Over 1 year to 5 years......................... 49,327 41,786 Over 5 years........................................ 14,850 7,036 Total.................................................. 107,938 87,197
Lease payments under operating leases in the years ended March 31, 2018 and 2017 were 48,422 million yen and 42,898 million yen, respectively.
Future minimum sublease payments receivable under non-cancellable sublease contracts as of March 31, 2018 and 2017 were immaterial.
Sublease payments received in the years ended March 31, 2018 and 2017 were 30,943 million yen and 27,882 million yen, respectively.
- 105 -
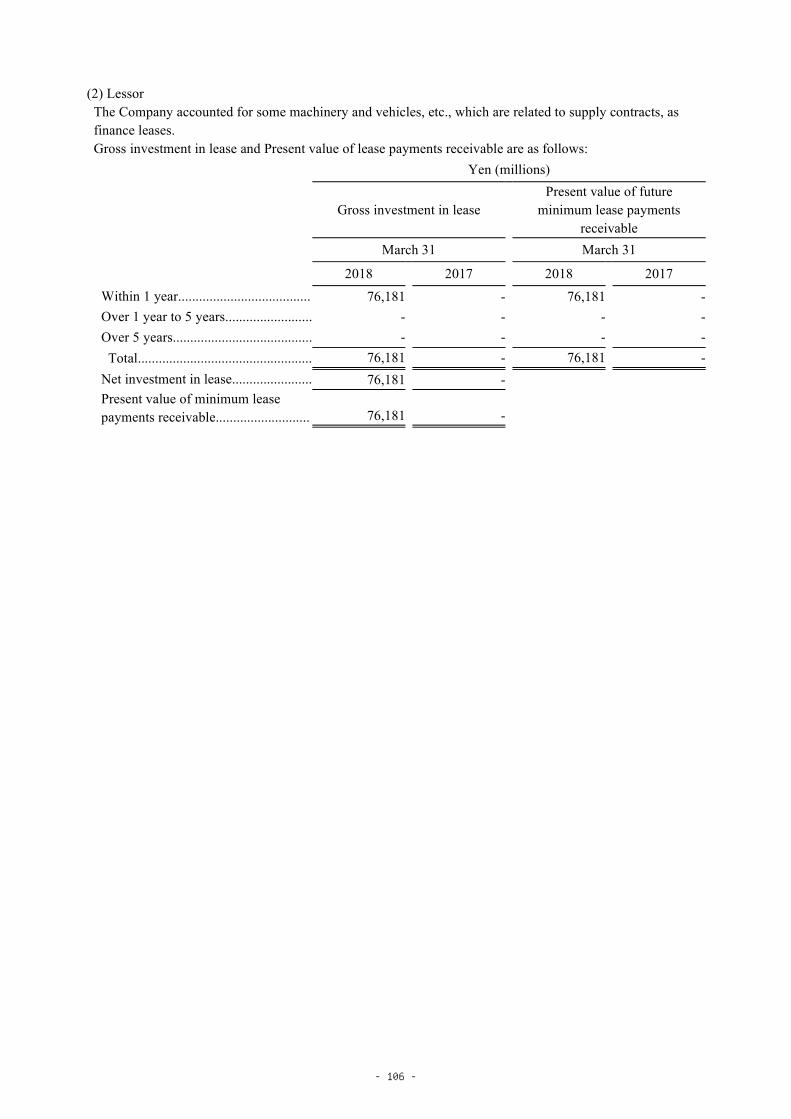
(2) Lessor The Company accounted for some machinery and vehicles, etc., which are related to supply contracts, as finance leases. Gross investment in lease and Present value of lease payments receivable are as follows: Yen (millions)
Gross investment in lease
Present value of future minimum lease payments
receivable
March 31 March 31
2018 2017 2018 2017
Within 1 year...................................... 76,181 - 76,181 - Over 1 year to 5 years......................... - - - - Over 5 years........................................ - - - - Total.................................................. 76,181 - 76,181 - Net investment in lease....................... 76,181 -
Present value of minimum lease payments receivable........................... 76,181 -
- 106 -

11. Investments Accounted for Using the Equity Method
(1) Investments in associates The Company accounts for investments in associates using the equity method. There are no associates that are individually material to the Company.
The carrying amounts of investments in individually immaterial associates and the Company's share of comprehensive income of those companies are as follows:
Yen (millions)
March 31
2018 2017
Carrying amounts of investments.................... 145,992 136,845
Yen (millions)
2018 2017
Net profit.......................................................... 10,566 9,140 Other comprehensive income (loss)................. 336 (1,147 ) Comprehensive income.................................... 10,902 7,993
(2) Investments in joint ventures The Company accounts for investments in joint ventures using the equity method. There are no joint ventures that are individually material to the Company.
The carrying amounts of investments in individually immaterial joint ventures and the Company's share of comprehensive income of those companies are as follows:
Yen (millions)
March 31
2018 2017
Carrying amounts of investments.................... 1,967 19,142
Yen (millions)
2018 2017
Net profit (loss) ............................................... (492 ) (762 ) Other comprehensive income (loss)................. - (1,135 ) Comprehensive income (loss).......................... (492 ) (1,897 )
- 107 -

12. Other Financial Assets
(1) Details Other financial assets are summarized as follows:
Yen (millions)
March 31
2018 2017
Financial assets, measured at amortized cost :
Time deposits........................................................ 55,383 47,299 Accounts receivable (non-trade)........................... 64,070 84,892 Lease receivable...……………………….........… 76,181 - Others.................................................................... 26,632 32,969 Subtotal................................................................. 222,266 165,160 Financial assets, measured at FVTPL :
Derivatives............................................................ 16,085 15,716 Subtotal................................................................. 16,085 15,716 Financial assets, measured at FVTOCI :
Equity securities.................................................... 129,050 122,095 Others.................................................................... 2,622 2,534 Subtotal................................................................. 131,672 124,629 Total........................................................................ 370,023 305,505 Current assets........................................................ 203,557 143,519 Non-current assets................................................. 166,466 161,986
(2) Financial assets measured at FVTOCI The Company has designated shares held principally for the purpose of maintaining and strengthening transactional or business relationships as financial assets measured at FVTOCI.
1) Fair value by major issuer The fair values by major issuer are as follows:
Yen (millions)
March 31
Security names 2018 2017 Tesla, Inc. ............................................................... 40,108 44,291 Tokyo Broadcasting System Holdings, Inc. ........... 12,737 11,219 Daiwa House Industry Co., Ltd. ............................. 6,273 4,890
Renesas Electronics Corporation............................ 4,458 4,862
Toray Industries, Inc. .............................................. 4,241 4,159 Dalian Refrigeration Co., Ltd. ................................ 3,762 4,602
- 108 -

2) Derecognition of financial assets measured at FVTOCI Since the year ended March 31, 2017, the Company has disposed certain financial assets measured at FVTOCI and has derecognized them principally to promote efficiency of asset holdings.
The fair values and the accumulated gains or losses at the time of sale are as follows:
Yen (millions)
2018 2017
Fair values................................................................ 2,604 804 Accumulated gains (losses)..................................... (1,736 ) (1,579 )
The above accumulated losses are the amounts before tax. The losses after tax in other comprehensive income that were transferred to retained earnings in connection with the above derecognition, for the years ended March, 2018 and 2017 are 2,153 million and 1,135 million yen, respectively.
- 109 -

13. Income taxes
(1) Deferred tax assets and liabilities
1) The major components and fluctuations of deferred tax assets and liabilities
Major components of deferred tax assets and liabilities are as follows: Yen (millions)
Consolidated statements of
financial position Consolidated statements of
profit or loss
March 31 Year ended March 31
2018 2017 2018 2017
Deferred tax assets :
Inventories......................................... 44,738 44,744 (1,169 ) (2,644 ) Provisions and accrued expenses....... 105,105 97,559 6,678 (14,267 ) Property, plant and equipment........... 58,923 64,194 (3,887 ) (6,726 ) Retirement benefit liabilities.............. 96,571 135,450 (10,052 ) (8,382 ) Tax loss carryforwards..................... 55,203 82,648 (30,606 ) 50,537 Others................................................. 50,534 53,736 (6,685 ) (2,129 ) Total deferred tax assets................... 411,074 478,331 (45,721 ) 16,389
Deferred tax liabilities :
Investment in securities..................... (11,698 ) (10,170 ) - 12,434 Intangible assets................................. (58,762 ) (59,956 ) 11,421 1,778 Others................................................. (71,806 ) (63,016 ) (8,430 ) (31,987 ) Total deferred tax liabilities............. (142,266 ) (133,142 ) 2,991 (17,775 ) Net deferred tax assets..................... 268,808 345,189 (42,730 ) (1,386 )
Fluctuations in net deferred tax assets are as follows: Yen (millions)
2018 2017
Deferred tax assets, net at the beginning of the year............................. 345,189 409,702 Amounts recognized through profit or loss......................................... (42,730 ) (1,386 ) Amounts recognized through other comprehensive income............... (31,542 ) (31,073 ) Acquisitions, divestitures and others................................................... (2,109 ) (32,054 ) Deferred tax assets, net at the end of the year....................................... 268,808 345,189
2) Deductible temporary differences, tax loss carryforwards and tax credit carryforwards for which deferred tax assets are not recognized
In recognizing deferred tax assets, the Company takes into account whether it is probable that part or all of deductible temporary differences, tax loss carryforwards and tax credit carryforwards can be deducted against future taxable profits and income taxes. The ultimate recoverability of deferred tax assets is determined based on the level of taxable profits during the period in which temporary differences, tax loss carryforwards and tax credit carryforwards are deductible. In this determination, the Company takes into account the expected periods in which deferred tax liabilities are realized, projection of future taxable profits and tax strategy. Based on the level of taxable profits in the past and projection of taxable profits during the future periods in which deferred tax assets are deductible, the Company believes that it is probable that deferred tax assets recognized as of March 31, 2018 will be realized. As a result of the assessment of recoverability, the Company has not
- 110 -

recognized deferred tax assets for certain deductible temporary differences, tax loss carryforwards and tax credit carryforwards.
The amounts of the deductible temporary differences, tax loss carryforwards and tax credit carryforwards for which deferred tax assets are not recognized are as follows: Yen (millions)
March 31, 2018 Deductible temporary differences....................................................... 663,621 Tax loss carryforwards of which:
expire from the years ending March 31, 2019 through 2027............ 1,211,576 expire thereafter or do not expire...................................................... 71,000 Total................................................................................................. 1,282,576
Tax credit carryforwards..................................................................... 30,824
Yen (millions)
March 31, 2017 Deductible temporary differences....................................................... 656,617 Tax loss carryforwards of which:
expire from the years ending March 31, 2018 through 2026............ 1,674,090 expire thereafter or do not expire...................................................... 48,044 Total................................................................................................. 1,722,134
Tax credit carryforwards..................................................................... 39,648
The Company applies the consolidated taxation system in Japan. The above amounts do not include tax loss carryforwards related to local tax (inhabitant tax and enterprise tax), as it is not covered by consolidated taxation system. The amounts of tax loss carryforwards related to inhabitant tax and enterprise tax as of March 31, 2018 was 127,144 million yen and 610,383 million yen, respectively.
3) Taxable temporary differences associated with investments in subsidiaries, etc. for which deferred tax liabilities are not recognized
Deferred tax liabilities are not recognized if the Company is able to control the timing of the reversal of the temporary differences and it is probable that the taxable temporary differences will not reverse in the foreseeable period of time, while recognized deferred tax liabilities are included in Deferred tax liabilities - Others. The total amount of taxable temporary differences associated with investments in subsidiaries and associates for which deferred tax liabilities are not recognized is 324,002 million yen as of March 31, 2018, and 364,597 million yen as of March 31, 2017.
- 111 -

(2) Income tax expenses
1) The components of income tax expenses recognized in the consolidated statements of profit or loss are as follows:
Yen (millions)
2018 2017
Current tax expenses.................................................................. 83,833 101,238 Deferred tax expenses:
Temporary differences originated and reversed...................... 44,228 38,616 Changes in recoverability of deferred tax assets..................... (1,498 ) (37,230 ) Total....................................................................................... 42,730 1,386
Income tax expenses total.................................................... 126,563 102,624
Current tax expenses include the amount of benefits arising from tax losses, tax credits or temporary differences, for which deferred tax assets were not recognized in prior periods. These effects decreased current tax expenses by 7,750 million yen and 28,133 million yen for the years ended March 31, 2018 and 2017, respectively.
Deferred tax expenses include the amount of benefits arising from tax losses, tax credits or temporary differences, for which deferred tax assets were not recognized in prior periods. These effects decreased deferred tax expenses by 8,464 million yen and 37,273 million yen for the years ended March 31, 2018 and 2017, respectively. Additionally, the effect of the amendments to corporation tax law decreased deferred tax expenses by 1,142 million yen for the year ended March 31, 2018.
2) Reconciliation of effective tax rates The Company is subject mainly to corporate tax, inhabitant tax and enterprise tax, and the combined statutory tax rate calculated based on these taxes was 30.7% for the years ended March 31, 2018 and 2017. Foreign subsidiaries are subject to income taxes at their locations. Panasonic Corporation and some of its subsidiaries have applied a consolidated taxation system.
Differences between the combined statutory tax rates and the effective tax rates are as follows: %
2018 2017
Combined statutory tax rates...................................................... 30.7 % 30.7 %
Effects of lower tax rates in foreign jurisdictions..................... (4.8 ) (3.3 ) Expenses not deductible for tax purposes................................. 1.3 7.4 Change in unrecognized deferred tax assets............................. 1.8 (19.5 ) Effects attributable to investments in subsidiaries.................... 4.5 19.2 Goodwill impairment................................................................ 0.3 1.2 Effects of amendments to corporation tax law......................... (0.3 ) 0.0 Others........................................................................................ (0.1 ) 1.6
Effective tax rates................................................................... 33.4 % 37.3 %
- 112 -
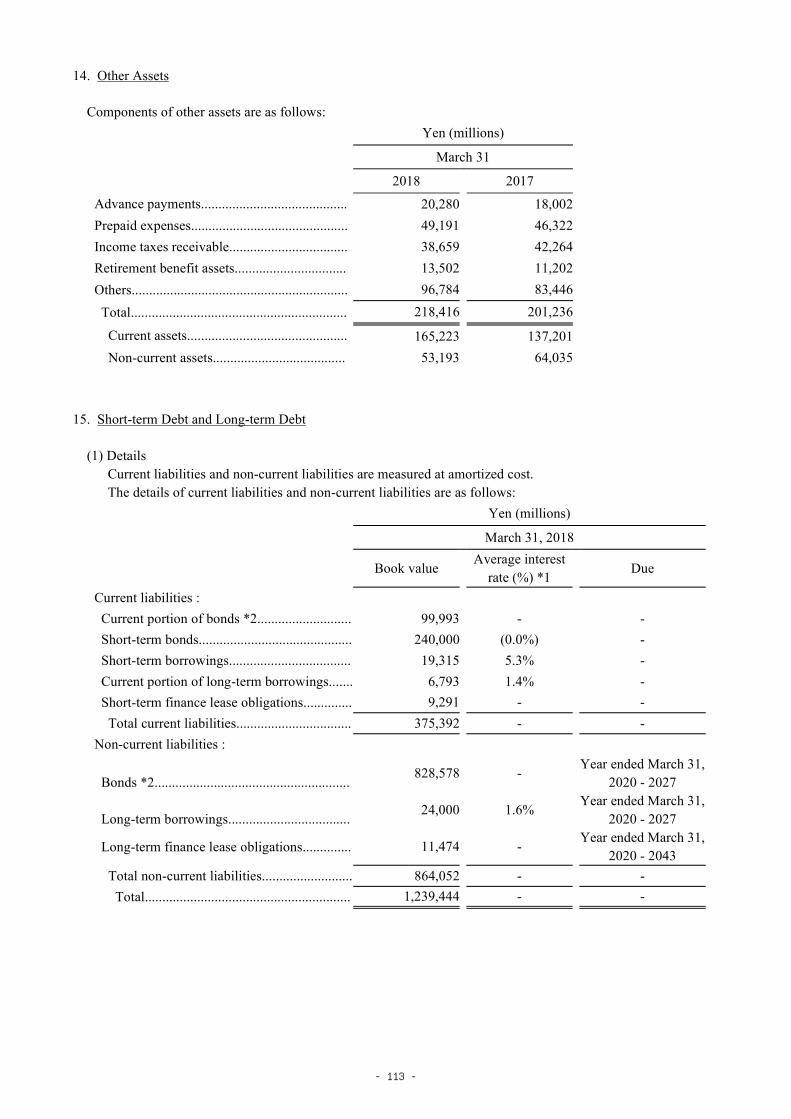
14. Other Assets
Components of other assets are as follows: Yen (millions)
March 31
2018 2017
Advance payments.......................................... 20,280 18,002 Prepaid expenses............................................. 49,191 46,322 Income taxes receivable.................................. 38,659 42,264 Retirement benefit assets................................ 13,502 11,202 Others.............................................................. 96,784 83,446
Total.............................................................. 218,416 201,236
Current assets.............................................. 165,223 137,201 Non-current assets...................................... 53,193 64,035
15. Short-term Debt and Long-term Debt
(1) Details Current liabilities and non-current liabilities are measured at amortized cost. The details of current liabilities and non-current liabilities are as follows:
Yen (millions)
March 31, 2018
Book value
Average interest rate (%) *1
Due
Current liabilities :
Current portion of bonds *2........................... 99,993 - - Short-term bonds............................................ 240,000 (0.0%) - Short-term borrowings................................... 19,315 5.3% - Current portion of long-term borrowings....... 6,793 1.4% - Short-term finance lease obligations.............. 9,291 - - Total current liabilities................................. 375,392 - -
Non-current liabilities :
Bonds *2........................................................ 828,578 -
Year ended March 31, 2020 - 2027
Long-term borrowings................................... 24,000 1.6%
Year ended March 31, 2020 - 2027
Long-term finance lease obligations.............. 11,474 - Year ended March 31,
2020 - 2043 Total non-current liabilities.......................... 864,052 - - Total........................................................... 1,239,444 - -
- 113 -

Yen (millions)
March 31, 2017
Book value
Average interest rate (%) *1
Due
Current liabilities :
Current portion of bonds *2........................... 149,946 - - Short-term borrowings................................... 16,454 10.3% - Current portion of long-term borrowings....... 1,343 1.9% - Short-term finance lease obligations.............. 9,295 - - Total current liabilities................................. 177,038 - -
Non-current liabilities :
Bonds *2........................................................
928,195
- Year ended March 31,
2019 - 2027
Long-term borrowings...................................
420
2.4% Year ended March 31,
2019 - 2021
Long-term finance lease obligations..............
18,351
- Year ended March 31,
2019 - 2041 Total non-current liabilities.......................... 946,966 - - Total........................................................... 1,124,004 - -
(*1) Average interest rate refers to weighted average interest rate on the ending balance. (*2) The contractual terms of the bonds are as follows:
Yen (millions)
March 31, 2018 March 31, 2017 Interest rate (%)
Due (Year ended March 31)
8th Unsecured Straight bond 100,000 100,000 2.05% 2019 11th Unsecured Straight bond - 150,000 1.081% 2018 12th Unsecured Straight bond 220,000 220,000 0.387% 2020 13th Unsecured Straight bond 80,000 80,000 0.568% 2022 14th Unsecured Straight bond 100,000 100,000 0.934% 2025 15th Unsecured Straight bond 200,000 200,000 0.19% 2022 16th Unsecured Straight bond 70,000 70,000 0.3% 2024 17th Unsecured Straight bond 130,000 130,000 0.47% 2027 4th Unsecured Straight bond (Originally Panasonic Electric Works)
30,000 30,000 1.593% 2020
- 114 -

(2) Changes in liabilities arising from financing activities Changes in liabilities arising from financing activities for the year ended March 31, 2018 are as follows:
Yen (millions)
Balance as of April 1, 2017
Changes from
financing cash flows
Non-cash changes Balance as of March 31, 2018
Acquisitions, divestitures
Exchange differences on foreign currencies
Other changes
Short term bonds....................... - 240,000 - - - 240,000 Borrowings............................... 18,217 (660 ) 33,646 2,428 (3,523 ) 50,108 Bonds........................................ 1,078,141 (150,000 ) - - 430 928,571 Finance lease obligations.......... 27,646 (9,258 ) - - 2,377 20,765 Other financial liabilities.......... 31,896 (6,403 ) - (487 ) 17,417 42,423 Total........................................ 1,155,900 73,679 33,646 1,941 16,701 1,281,867
(3) Assets pledged as collateral for liabilities As is customary in Japan, short-term and long-term bank loans are made under general agreements which provide that security and guarantees for future and present indebtedness will be given upon request of the bank, and that the bank shall have the right, when the obligations become due, or in the event of their default, to offset cash deposits against such obligations due to the bank.
Each of the loan agreements grants the lender the right to request additional security or mortgages on certain assets.
Assets pledged as collateral as of March 31, 2018 and 2017 are not material.
16. Trade Payables
Trade payables are measured at amortized cost. Components of trade payables are as follows:
Yen (millions)
March 31
2018 2017
Trade notes payable..................................... 271,270 245,854 Trade accounts payable............................... 875,206 710,111 Total.......................................................... 1,146,476 955,965
- 115 -

17. Employee Benefit
(1) Defined benefit plans Panasonic Corporation and certain subsidiaries have contributory, funded benefit pension plans covering substantially all employees who meet eligibility requirements. Benefits under the plans are primarily calculated based on the combination of years of service and compensation.
Pursuant to the Defined Benefit Corporate Pension Act, the Company is required to make contributions to the Panasonic Corporate Pension Fund that operates the corporate pension plan (hereinafter, the "Fund") and has other obligations. Directors of the Fund are required to comply with laws and regulations, decisions of the Minister of Health, Labor and Welfare or the Director General of each Regional Bureau of Health and Welfare under laws and regulations, rules of the Fund and resolutions of the board of representatives, and to be faithful in the performance of their duties for the Fund. In addition, it is specified that the directors shall not perform any act that impairs the appropriateness of management and operation of reserve funds to be applied to benefit payment (hereinafter "reserve funds") for the benefit of themselves or a third party and that the directors shall assume collective responsibility for the Fund when a director fails to fulfill his or her duties in the Fund’s activities related to the management and operation of reserve funds.
The Fund is an organization legally independent of the Company. Its board of representatives evenly consists of representatives appointed by the employer (appointed representatives) and representatives elected by employees (co-opted representatives). While decisions of the board of representatives shall be made by a majority of the representatives present, in the case of a tie, the president, who is the chairperson, has authorization to make a decision. However, it is specified that decisions on particularly important matters shall be made by a majority exceeding the above.
The management of reserve funds is conducted by a managing trustee in accordance with contractual terms and conditions provided for by the investment management rules on which resolution was passed by the board of representatives. The Fund fulfills its obligations to manage reserve funds safely and efficiently by developing basic policies for operation, producing operation guidelines in conformity to the basic policies and delivering them to the managing trustee, and other means.
The Company continues to have an obligation to make contributions set forth by the Fund to the reserve funds in the future. The amount of contributions is regularly reviewed to the extent permitted by laws and regulations.
In addition to the above pension plan, employees are eligible for lump-sum retirement payments based on salary and service years at that time upon the retirement for a reason other than dismissal. In the case of retirement at the Company’s request or due to death, the amount of benefits exceeds the amount of benefits in the case of voluntary retirement. For this lump-sum retirement payment plan, external funding is not used.
Effective April 1, 2002, Panasonic Corporation and some of the subsidiaries amended their benefit pension plans by introducing a "point-based benefits system", and changing their lump-sum payment plans to cash balance pension plans. Under the point-based benefits system, benefits are calculated based on accumulated points allocated to employees each year according to their job classification and years of service. Under the cash balance pension plans, each participant has an account which is credited yearly based on the current rate of pay and market-related interest rate.
Effective July 1, 2013, Panasonic Corporation and certain domestic subsidiaries made a transition from the defined benefit pension plan to a defined contribution pension plan with respect to employees' future service.
- 116 -

(i) The present value of the defined benefit obligations
Changes in the present value of the defined benefit obligations are as follows: Yen (millions)
2018 2017
Beginning balance................................................... 2,410,394 2,528,512 Service cost............................................................ 11,873 12,381 Interest cost............................................................ 21,678 19,208 Remeasurements of the defined benefit obligations :
Actuarial gains and losses arising from changes in demographic assumptions............................
5,132
792
Actuarial gains and losses arising from changes in financial assumptions...................................
(43,024
)
(53,543
) Other.................................................................... 3,229 (87 ) Benefits paid.......................................................... (111,927 ) (112,073 ) Exchange differences on foreign currencies.......... 514 (6,839 ) Past service cost..................................................... (1,047 ) (528 ) Settlements............................................................ (11,377 ) (7,808 ) Effect of business combinations and disposals...... 3,860 30,379 Ending balance......................................................... 2,289,305 2,410,394
Service cost is included in "cost of sales" or "selling, general and administrative expenses" in the consolidated statements of profit or loss. Interest cost is included in "finance expenses" in the consolidated statements of profit or loss. Weighted average duration of defined benefit obligations as of both March 31, 2018 and 2017 are 17 years.
Significant actuarial assumptions used to calculate the present value of defined benefit obligations are as follows:
March 31,2018 March 31,2017
Discount rate............................................................ 0.8% 0.9%
Rate of salary increase............................................. 3.6% 3.6%
In the significant actuarial assumptions stated above, calculation of the present value of defined benefit obligation is particularly susceptible to the assumption of discount rate. The effect of 0.5% change in the discount rate on the present value of defined benefit obligation is as follows, holding other assumptions constant.
Yen (millions)
Effect on the present value of defined benefit obligations
Change in an assumption March 31,2018 March 31,2017 0.5% increase........................... 141,044 (decrease) 155,025 (decrease) 0.5% decrease.......................... 156,974 (increase) 169,005 (increase)
The sensitivity analysis assumes that other assumptions remain unchanged. In reality, any change in other assumptions may affect the sensitivity analysis. No significant change in rate of salary increase is expected.
- 117 -

(ii) The fair value of the plan assets
Each plan of the Company has a different investment policy, which is designed to ensure sufficient plan assets are available to provide future payments of pension benefits to the eligible plan participants and is individually monitored for compliance and appropriateness on an on-going basis. Considering the expected long-term rate of return on plan assets, each plan of the Company establishes a "basic" portfolio comprised of the optimal combination of equity instruments and debt instruments. Plan assets are invested in individual equity and debt instruments using the guidelines of the "basic" portfolio in order to generate a total return that will satisfy the expected return on a mid-term to long-term basis. The Company evaluates the difference between expected return and actual return of invested plan assets on an annual basis to determine if such differences necessitate a revision in the formulation of the "basic" portfolio. The Company revises the "basic" portfolio when and to the extent considered necessary to achieve the expected long-term rate of return on plan assets.
The Company's pension plan assets allocation is approximately 25% for equity instruments, approximately 45% for debt instruments, and approximately 30% for other investments, primarily in life insurance company general accounts.
For the Company's major defined benefit pension plans, equity instruments are mainly investments in listed equity securities and widely diversified, including Japanese equity, developed international equity and equity in emerging markets. The investments in debt instruments are comprised primarily of government, municipal, and corporate bonds. The Company mainly chooses debt securities with rating above BBB, high liquidity and appropriate repayment, and has appropriately diversified the investments by sector and geography. As for investments in life insurance company general accounts, the contracts with the insurance companies include a guaranteed interest rate and return of capital. Other investments include fund-of-funds investment, equity long/short hedge funds investment and private equity investment. Fund-of-funds investment and equity long/short hedge funds investment are primarily invested in listed equity securities with trading frequency and a stable return, while private equity investment is diversified products with low correlation.
Changes in the fair value of plan assets are as follows: Yen (millions)
2018 2017
Beginning balance................................................... 1,959,308 1,958,782 Interest income........................................................ 18,457 15,218 Remeasurements of plan assets:
Return on plan assets............................................. 57,062 49,288 Employer contributions........................................... 30,642 37,505 Benefits paid............................................................ (108,993 ) (107,182 ) Exchange differences on foreign currencies............ 1,683 (6,084 ) Settlements............................................................... - (7,341 ) Effect of business combinations and disposals........ 1,416 19,122 Ending balance........................................................ 1,959,575 1,959,308
The Company plans to pay contributions of 44,120 million yen in the year ended March 31, 2019.
- 118 -

The fair value of plan assets by asset category is as follows: Yen (millions)
March 31, 2018
With quoted market price in an active
market
With no quoted market price in an active market
Total
Cash and cash equivalents.............................. 272,015 - 272,015 Equity instruments:
Japanese companies...................................... 55,096 - 55,096 Foreign companies........................................ 44,612 - 44,612 Commingled funds*1.................................... - 376,448 376,448 Debt instruments:
Government and municipal bonds................ 46,313 - 46,313 Corporate bonds............................................ - 8,293 8,293 Commingled funds*2.................................... - 754,340 754,340 Life insurance company general accounts...... - 287,249 287,249 Other*3............................................................ - 115,209 115,209 Total............................................................ 418,036 1,541,539 1,959,575
Yen (millions)
March 31, 2017
With quoted market price in an active
market
With no quoted market price in an active market
Total
Cash and cash equivalents............................... 214,981 - 214,981 Equity instruments:
Japanese companies....................................... 20,821 - 20,821 Foreign companies......................................... 51,086 - 51,086 Commingled funds*1..................................... - 416,334 416,334 Debt instruments:
Government and municipal bonds................. 44,822 - 44,822 Corporate bonds............................................. - 8,217 8,217 Commingled funds*2..................................... - 788,360 788,360 Life insurance company general accounts....... - 299,011 299,011 Other*3............................................................. - 115,676 115,676 Total............................................................. 331,710 1,627,598 1,959,308
*1 These funds invest mainly in listed equity securities, of which approximately 45% are Japanese equities and 55% are foreign equities.
*2 These funds primarily invest in Japanese government bonds and foreign government bonds. *3 Other investments primarily include fund-of-funds investment, equity long/short hedge funds investment.
- 119 -

(iii) Effect of asset ceiling Changes in the effect of asset ceiling are as follows: Yen (millions)
2018 2017 Beginning balance........................................................... 5,461 4,240 Interest cost..................................................................... 36 24 Remeasurements of asset ceiling:
Changes in the effect of asset ceiling............................ 1,144 1,197 Ending balance................................................................ 6,641 5,461
Note: When the defined benefit plan is in surplus, the amount of defined benefit assets (other non-current assets) recorded on the consolidated statements of financial position is limited to a ceiling defined by the present value of any future economic benefits available in the form of reductions in future contributions to the defined benefit plan.
(iv) Assets and liabilities recognized in the consolidated statements of financial position The amounts of assets and liabilities recorded in the consolidated statements of financial position with regard to defined benefit plans are as follows: Yen (millions)
March 31
2018 2017
The present value of the defined benefit obligations..... 2,289,305 2,410,394 The fair value of the plan assets...................................... 1,959,575 1,959,308 Effect of asset ceiling...................................................... 6,641 5,461 Total............................................................................... 336,371 456,547 Amount recognized :
Retirement benefit liabilities......................................... 349,873 467,749 Retirement benefit assets............................................... 13,502 11,202 Net amount.................................................................. 336,371 456,547
(2) Defined contribution plans
The amount of expenses recorded with regard to defined contribution plans was 33,729 million yen and 33,751 million yen for the years ended March 31, 2018 and 2017, respectively.
(3) Employee benefits expenses
In the consolidated statements of profit or loss, the total of employee benefits expenses included in "cost of sales" and "selling, general and administrative expenses" was 1,678,632 million yen and 1,569,172 million yen for the years ended March 31, 2018 and 2017, respectively.
- 120 -

18. Provisions
A breakdown of movements in provisions is as follows: Yen (millions)
Provision for product
warranties
Provision for restructuring
Other
provisions Total
Balance as of March 31, 2017...... 51,458 3,627 279,855 334,940 Additions.................................... 24,024 5,694 80,190 109,908 Utilized....................................... (23,927 ) (7,964 ) (99,323 ) (131,214 ) Others......................................... (2,446 ) - (15,017 ) (17,463 ) Balance as of March 31, 2018...... 49,109 1,357 245,705 296,171
A breakdown of provisions by current and non-current categories is as follows: Yen (millions)
March 31
2018 2017
Current liabilities...................... 285,954 317,261 Non-current liabilities............... 10,217 17,679 Total........................................ 296,171 334,940
A warranty for quality and performance of products and services is provided for a fixed period, and provision for product warranties is recorded at the estimated amount of service expenses within the warranty period based on past results to prepare for payment of expenses for the after-sale services.
Provision for restructuring is recorded at the estimated amount of expenses for restructuring activities that are implemented for the purpose of improvement in operating efficiency and promotion of cost efficiency in and outside of Japan. The timing of payment is affected by a future business plan, etc., but this provision is usually short-term by its nature with payment completed within one year of the incurrence.
Other provisions are principally provision for onerous contracts, provisions for expenses related to environmental improvement, provision for litigation and provision for sales promotion, etc.
Provision for onerous contracts relates to contracts where certain subsidiaries purchase specific raw materials for the period up to 2020.
To ensure appropriate disposal by March 31, 2027 of electric equipment containing polychlorinated biphenyls (PCB) (hereinafter, "PCB equipment") that may have been buried under the Company's manufacturing facilities and sites of its former manufacturing facilities in accordance with the Act on Special Measures concerning Promotion of Proper Treatment of PCB Wastes, provision for expenses related to environmental improvement is recognized for the estimated total expenses for necessary actions, such as investigating whether or not PCB equipment has been buried under the Company’s manufacturing facilities and sites (including excavation, storage and disposal of already discovered PCB equipment, and soil remediation).
Provision for litigation, etc., relates to litigations or governmental investigations which the Company and certain of its subsidiaries have been dealing with. Depending upon the outcome of these different proceedings, the Company and certain of its subsidiaries may be subject to an uncertain amount of fines, and accordingly the Company has accrued certain probable and reasonably estimated amounts for the fines. Provision for litigation, etc., includes one related to the business operations of the Company's U.S. subsidiary, Panasonic Avionics Corporation (PAC). The Company and PAC have entered into agreements with the United States Securities and Exchange Commission and the United States Department of Justice (U.S. Government Agencies), respectively in May, 2018. The agreements resolve investigations by the U.S. Government Agencies under the Foreign Corrupt
- 121 -

Practices Act and other securities laws regarding activities at PAC with respect to certain contracts with airline customers, and the use of sales agents and consultants pertaining to such contracts. In connection with these resolutions, the Company and PAC agreed to pay a combined total of $280,602,830.93 to the U.S. Government Agencies.
Provision for sales promotion expenses is made for estimated total expenses related to sales promotion of merchandise, etc. in the distribution process based on sales policies.
19. Other financial liabilities
Other financial liabilities, except for derivative liabilities, are measured at amortized cost. Derivatives are measured at fair value and the changes in fair value are recognized as profit or loss (except for hedging instruments).
Components of other financial liabilities are as follows: Yen (millions)
March 31
2018 2017
Derivative liabilities................................................ 15,805 21,896 Accounts payable (non-trade).................................. 98,523 102,070 Deposits received-current........................................ 183,920 199,100 Others....................................................................... 25,352 6,559 Total....................................................................... 323,600 329,625 Current liabilities................................................. 304,977 329,625 Non-current liabilities.......................................... 18,623 -
20. Other liabilities
Components of other liabilities are as follows: Yen (millions)
March 31
2018 2017
Accrued expenses.................................................... 546,024 538,281 Accrued payroll, etc................................................. 226,158 201,848 Deposits and deferred revenue................................. 111,403 107,021 Others....................................................................... 35,887 34,277
Total....................................................................... 919,472 881,427
Current liabilities................................................. 907,756 865,389 Non-current liabilities.......................................... 11,716 16,038
- 122 -

21. Equity
(1) Capital management The Company's basic policy is to manage methods, terms and conditions and others for fund management and financing in business activities, and promote reduction of cost of funds and stability and improvement of the financial structure through increase in efficiency of investments. In addition, the Company thinks that it is important to generate and improve free cash flows through enhancement of the profitability, continuous inventory reduction, concentration of capital expenditure, review of portfolio assets and other means to achieve medium to long term business development. Key indicators used by the Company in capital management are as follows:
2018 2017
Net Cash (millions of yen, * 1)........................ (91,902 ) 196,587 Shareholder’s equity ratio................................ 27.1% 26.3%
Return on equity............................................... 14.4% 9.9%
Free Cash Flow (millions of yen, * 2)............. (35,646 ) (34,746 ) Capital investment (millions of yen, * 3)......... 392,234 311,641 Depreciation (millions of yen)......................... 226,576 224,405
(* 1) This was calculated by deducting interest-bearing debt (total of "short-term debt, including current portion of long-term debt" and "long-term debt") from the total of time deposits and others included in "cash and cash equivalents" and "other financial assets".
(* 2) This is the total of cash flows from operating activities and cash flows from investing activities. (* 3) This is the amount of an increase in "property, plant and equipment" on an accrual basis.
There is no significant capital restriction applicable to the Company.
- 123 -

(2) Common stock All shares issued by the Company are common stock without par value. Issued shares are fully paid.
Total number of shares authorized to be issued and the number of issued shares of the Company is as follows: Shares
2018 2017 Total number of shares authorized to be issued....... 4,950,000,000 4,950,000,000 Number of shares issued:
Balance at the beginning of the year........................ 2,453,053,497 2,453,053,497 Changes during the period....................................... - - Balance at the end of the year.................................. 2,453,053,497 2,453,053,497
The number of shares of treasury stock included in the above number of shares issued is 120,718,303 shares and 120,648,723 shares as of March 31, 2018 and 2017, respectively.
(3) Capital surplus and retained earnings
The Companies ACT of Japan provides that an amount equal to 10% of cash dividends be appropriated as a capital reserve or legal reserve until the aggregated amount of capital reserve and legal reserve equals 25% of stated capital. The capital reserve and legal reserve are not available for dividends but may be transferred to capital surplus or retained earnings or stated capital upon approval at the shareholders' meeting.
In accordance with the Companies ACT of Japan, there are certain restrictions on distributable amount in connection with the treasury stock repurchased. As a result, retained earnings of 210,896 million yen and 210,791 million yen are restricted as of March 31, 2018 and 2017, respectively from distributions of cash dividends.
- 124 -
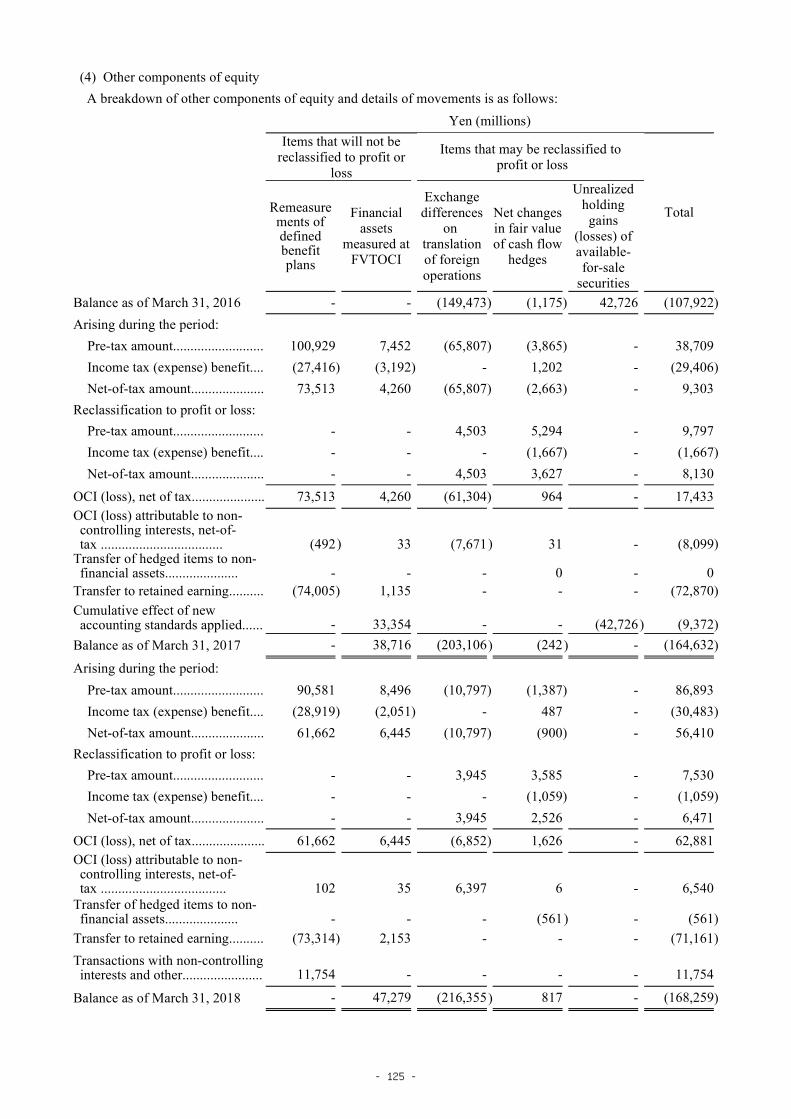
(4) Other components of equity A breakdown of other components of equity and details of movements is as follows:
Yen (millions)
Items that will not be reclassified to profit or
loss
Items that may be reclassified to profit or loss
Total
Remeasurements of defined benefit plans
Financial assets
measured at FVTOCI
Exchange differences
on translation of foreign operations
Net changes in fair value of cash flow hedges
Unrealized holding gains
(losses) of available- for-sale securities
Balance as of March 31, 2016 - - (149,473 ) (1,175 ) 42,726 (107,922 ) Arising during the period:
Pre-tax amount.......................... 100,929 7,452 (65,807 ) (3,865 ) - 38,709 Income tax (expense) benefit.... (27,416 ) (3,192 ) - 1,202 - (29,406 ) Net-of-tax amount..................... 73,513 4,260 (65,807 ) (2,663 ) - 9,303
Reclassification to profit or loss:
Pre-tax amount.......................... - - 4,503 5,294 - 9,797 Income tax (expense) benefit.... - - - (1,667 ) - (1,667 ) Net-of-tax amount..................... - - 4,503 3,627 - 8,130
OCI (loss), net of tax..................... 73,513 4,260 (61,304 ) 964 - 17,433 OCI (loss) attributable to non-controlling interests, net-of-tax ...................................
(492
)
33
(7,671
)
31
-
(8,099
)
Transfer of hedged items to non-financial assets.....................
-
-
-
0
-
0
Transfer to retained earning.......... (74,005 ) 1,135 - - - (72,870 ) Cumulative effect of new accounting standards applied......
-
33,354
-
-
(42,726
)
(9,372
)
Balance as of March 31, 2017 - 38,716 (203,106 ) (242 ) - (164,632 )
Arising during the period:
Pre-tax amount.......................... 90,581 8,496 (10,797 ) (1,387 ) - 86,893 Income tax (expense) benefit.... (28,919 ) (2,051 ) - 487 - (30,483 ) Net-of-tax amount..................... 61,662 6,445 (10,797 ) (900 ) - 56,410
Reclassification to profit or loss:
Pre-tax amount.......................... - - 3,945 3,585 - 7,530 Income tax (expense) benefit.... - - - (1,059 ) - (1,059 ) Net-of-tax amount..................... - - 3,945 2,526 - 6,471
OCI (loss), net of tax..................... 61,662 6,445 (6,852 ) 1,626 - 62,881 OCI (loss) attributable to non-controlling interests, net-of-tax ....................................
102
35
6,397
6
-
6,540
Transfer of hedged items to non-financial assets.....................
-
-
-
(561
)
-
(561
)
Transfer to retained earning.......... (73,314 ) 2,153 - - - (71,161 ) Transactions with non-controlling interests and other.......................
11,754
-
-
-
-
11,754
Balance as of March 31, 2018 - 47,279 (216,355 ) 817 - (168,259 )
- 125 -

(5) Dividends 1) Dividends for the year ended March 31, 2018 are summarized as follows: (i) Amount of cash dividends paid
Resolution date Class Cash dividends (millions of yen)
Dividends resource
Cash dividends per share (yen)
Record date Effective date
The Board of Directors meeting held on May 11, 2017
Common stock
34,986 Retained earnings
15.0 March 31, 2017 June 8, 2017
The Board of Directors meeting held on October 31, 2017
Common stock
23,324 Retained earnings
10.0 September 30,
2017 November 30,
2017
(ii) Cash dividends resolved in the year ended March 31, 2018 but effective in the following fiscal year
Resolution date Class Cash dividends (millions of yen)
Dividends resource
Cash dividends per share (yen)
Record date Effective date
The Board of Directors meeting held on May 10, 2018
Common stock
46,647 Retained earnings
20.0 March 31, 2018 June 8, 2018
2) Dividends for the year ended March 31, 2017 are summarized as follows: (i) Amount of cash dividends paid
Resolution date Class Cash dividends (millions of yen)
Dividends resource
Cash dividends per share (yen)
Record date Effective date
The Board of Directors meeting held on April 28, 2016
Common stock
34,815 Retained earnings
15.0 March 31, 2016 June 3, 2016
The Board of Directors meeting held on October 31, 2016
Common stock
23,210 Retained earnings
10.0 September 30,
2016 November 30,
2016
(ii) Cash dividends resolved in the year ended March 31, 2017 but effective in the following fiscal year
Resolution date Class Cash dividends (millions of yen)
Dividends resource
Cash dividends per share (yen)
Record date Effective date
The Board of Directors meeting held on May 11, 2017
Common stock
34,986 Retained earnings
15.0 March 31, 2017 June 8, 2017
- 126 -

22. Share-based Payment Plan
(1) Details of share-based payment plan
The Company has introduced a plan of share-based payment stock options (stock acquisition rights) for its Directors (excluding Outside Directors), Executive Officers and certain other company executives of Panasonic, as an incentive for them to further contribute to the improvement of long-term operating results and higher corporate value through sharing the benefits and risks of share price fluctuations with its shareholders.
Stock acquisition rights granted under this plan are fully vested on grant date. As the exercise condition, during the period when the stock acquisition rights may be exercised, the holder may exercise the stock acquisition rights on and after the day immediately following the day on which such holder loses the status of the Company's Director, Executive Officer or any status equivalent thereto, of Panasonic (the "Status Losing Date"). As for the stock acquisition rights issued in August, 2017 and August 2016, the holder may exercise the rights on and after the day immediately following status losing date or the day immediately following the day when three (3) years have transpired since the day immediately following the day the stock acquisition rights were allotted, whichever falls earlier. The exercise price of the stock acquisition right is 1 yen.
Upon exercise of each stock acquisition right, in principle, 100 shares of common stock of the Company are granted; provided, however, that in the case that the Company conducts a share split (including an allotment without consideration (musho-wariate) of shares of common stock of the Company) or share consolidation of the Company's common stock, the number of shares granted is adjusted in accordance with a specific formula.
The exercise period is a period specified in the allotment contract. When stock acquisition rights are not exercised during the period, the stock acquisition rights are forfeited.
The Company's stock acquisition rights that existed in the years ended March 31, 2018 are as follows:
Grant date Number of stock acquisition right
Fair value of one stock acquisition right on grant date (yen)
Exercisable period
Panasonic Corporation stock acquisition rights issued in August, 2014
August 22, 2014 2,088 105,400 From August 23, 2014 to August 22, 2044
Panasonic Corporation stock acquisition rights issued in August, 2015
August 20, 2015 1,729 112,400 From August 21, 2015 to August 20, 2045
Panasonic Corporation stock acquisition rights issued in August, 2016
August 23, 2016 5,800 71,300 From August 24, 2016 to August 23, 2046
Panasonic Corporation stock acquisition rights issued in August, 2017
August 23, 2017 3,561 112,800 From August 24, 2017 to August 23, 2047
- 127 -

(2) Change in the number of stock acquisition rights and their weighted average exercise prices
Year ended March 31
2018 2017
Number of stock acquisition
right
Weighted-average exercise price
(yen)
Number of stock acquisition
right
Weighted-average exercise price
(yen) Outstanding at the beginning of the year..................................
9,593
1
3,793
1 Granted.................................... 3,561 1 5,800 1 Forfeited.................................. - - - - Exercised................................. (30 ) 1 - - Expired.................................... - - - - Outstanding at the end of the year..................................
13,124
1
9,593
1 Exercisable at the end of the year..................................
2,904
1
503
1
The weighted average share price of stock options exercised during the year ended March 31, 2018 was 1,719 yen on the exercise date. There was no exercise of the stock acquisition rights during the year ended March 31, 2017.
The exercise price of exercisable stock acquisition rights in the years ended March 31, 2018 and 2017 was 1 yen each. In the years ended March 31, 2018 and 2017, the weighted average remaining contractual term for outstanding stock acquisition rights at the year-end was 23.8 years and 27.6 years, respectively, and for exercisable stock acquisition rights at the year-end was 8.2 years and 7.9 years, respectively.
- 128 -

(3) Measurement method for fair value of stock options granted during the year
1) Valuation technique used Black-Scholes model
2) Fair value at grant date and key inputs
Year ended March 31
2018 2017
Panasonic Corporation stock acquisition rights issued in August, 2017
Panasonic Corporation stock acquisition rights issued in August, 2016
Option price per share......................... 1,128 yen 713 yen Stock price at grant date (*1).............. 1,459.5 yen 1,028.0 yen Exercise price...................................... 1 yen 1 yen Expected remaining term.................... 15 years 15 years Expected volatility.............................. 34.75 % (*2) 35.39 % (*3) Risk-free interest rate (*4).................. 0.28 % 0.06 %
Expected dividend yield...................... 1.71 % (*5) 2.43 % (*6)
(*1) The closing price of common stock of the Company on the Tokyo Stock Exchange at grant date was used. (*2) The figure was calculated based on the closing price of ordinary transactions of shares of common stock
of the Company on each transaction date for 15 years (from August 23, 2002 to August 23, 2017). (*3) The figure was calculated based on the closing price of ordinary transactions of shares of common stock
of the Company on each transaction date for 15 years (from August 23, 2001 to August 23, 2016). (*4) The interest rate, at grant date, of government bonds with remaining maturity corresponding to the
expected remaining life (15 years) was used. (*5) The figure was calculated as "dividends per share (actual dividends paid for the year ended March 31,
2017) / share price at grant date". (*6) The figure was calculated as "dividends per share (actual dividends paid for the year ended March 31,
2016) / share price at grant date".
(4) Stock-based compensation expenses
Expenses recorded in association with share-based payments in the years ended March 31, 2018 and 2017 were 402 million yen and 414 million yen, respectively, included in "selling, general and administrative expenses" in the consolidated statements of profit or loss.
- 129 -

23. Selling, General and Administrative Expenses
Selling, general and administrative expenses are as follows:
Yen (millions)
2018 2017 Employee benefit............................................. 861,131 815,348 Advertising expenses....................................... 112,238 105,285 Transportation and storage............................... 189,786 176,779 Depreciation and amortization......................... 84,947 82,449 Others............................................................... 689,908 663,067 Total............................................................... 1,938,010 1,842,928
24. Research and Development Expenses
Research and development expenses are as follows:
Yen (millions)
2018 2017 Research and development expenses.............. 448,879 436,130
25. Other Income (Expenses)
Other income (expenses), net for the year ended March 31, 2018 includes expenses associated with discontinuation or voluntary recall of products of 18,127 million yen, loss on sales and retirement of property, plant and equipment of 6,566 million yen, restructuring charges of 5,694 million yen, gain on sales of fixed assets of 13,401 million yen, and benefits from settlement of the defined benefit corporate pension plan in certain subsidiaries of 11,377 million yen.
Other income (expenses), net for the year ended March 31, 2017 includes litigation-related expenses of 14,867 million yen, loss on sales and retirement of property, plant and equipment of 8,671 million yen, restructuring charges of 6,336 million yen, and gain on sales of fixed assets of 27,103 million yen.
- 130 -

26. Impairment of Non-Financial Assets
(1) Impairment losses The losses are included in "Other income (expenses), net" in the consolidated statements of profit or loss. The amount by segment represents the amount corresponding to each cash-generating unit to which allocation is made in impairment tests, and is not equal to the amount allocated to each segment for the internal management purpose. Amount by segment for the year ended March 31, 2017 has been reclassified to conform to the presentation for the year ended March 31, 2018. The amounts of impairment losses recorded for property, plant and equipment, goodwill and intangible assets by segment are as follows:
Yen (millions)
2018 2017 Appliances....................................................... 270 2,480 Eco Solutions................................................... 8,599 24,725 Connected Solutions........................................ 5,871 8,513 Automotive & Industrial Systems.................... 7,250 4,841 Other................................................................ 4,782 5,309 Consolidated total.......................................... 26,772 45,868
In the year ended March 31, 2018, the Company recorded impairment losses for intangible assets, etc. of certain businesses which belong to "Eco Solutions" segment. This is because it was expected that the carrying amount of these assets could not be recovered by future cash flows due to a deterioration of the business environment. The fair value less costs of disposal was measured by the relief-from-royalty method, the excess earnings method, and other means. The level in the hierarchy for the fair value measurement is Level 3.
In the year ended March 31, 2017, the Company recorded impairment losses for intangible assets, etc. of certain businesses which belong to "Eco Solutions" segment. This is because it was expected that the carrying amount of these assets could not be recovered by future cash flows due to a deterioration of the business environment. The fair value less costs of disposal was measured by the relief-from-royalty method, the excess earnings method, and other means. The level in the hierarchy for the fair value measurement is Level 3.
- 131 -

(2) Goodwill and intangible assets with indefinite useful lives (i) Impairment tests The recoverable amount of goodwill and intangible assets with indefinite useful lives in impairment test of each cash-generating unit is calculated at the higher of fair value less costs of disposal or value in use.
As of March 31, 2018 and 2017, goodwill with carrying amount of 82,148 million yen and 91,026 million yen, respectively, and trademark with carrying amount of 25,179 million yen and 29,506 million yen, respectively, which are relating to "Hussmann Corporation" included in the "Appliance" segment, are individually significant goodwill or intangible assets with indefinite useful lives allocated to cash generating unit in comparison with the Company's total carrying amount.
For the years ended March 31, 2018 and 2017, the recoverable amount of cash-generating unit, to which goodwill and trademark with individually significant carrying amount in comparison with the Company's total carrying amount are allocated, is measured principally by the discounted cash flow method and the comparable listed company analysis method. The level in the hierarchy for this fair value measurement is Level 3. Discounted cash flow method is calculated by discounting the estimated amount of future cash flows based on the most recent business plan approved by the Board of Directors to the present value. The period of future outlook is five years, and future outlook reflects past experience and is shaped after verifying the consistency with external information. The growth rate (2.1% and 2.1%, respectively) is determined in view of long-term average growth rate of markets or countries to which each cash-generating unit belongs. The discount rate (11.7% and 12.7% on pre-tax basis, respectively) is calculated based on weighted average cost of capital of cash-generating unit. Since the amount of fair value less costs of disposal or value in use, whichever is higher, adequately exceeds the carrying amount, the Company has determined that significant impairment is unlikely to occur in this cash-generating units, even if the major assumption such as the growth rate and the discount rate used in the above impairment test change within a reasonably predictable range.
(ii) Goodwill As of March 31, 2018 and 2017, the aggregate carrying amount of cash-generating unit for which the carrying amount of goodwill allocated to that unit is not individually significant in comparison with the Company's total carrying amount of goodwill is 326,155 million yen and 295,861 million yen, respectively.
Impairment losses in the years ended March 31, 2018 and 2017 are 3,256 million yen and 10,068 million yen, respectively.
(iii) Intangible assets with indefinite useful lives As of March 31, 2018 and 2017, the aggregate carrying amount of cash-generating unit for which the carrying amount of intangible assets with indefinite useful lives allocated to that unit is not individually significant in comparison with the Company's total carrying amount is 16,393 million yen and 14,141 million yen, respectively.
Impairment losses in the years ended March 31, 2018 and 2017 are immaterial.
- 132 -

27. Finance Income and Expenses
(1) Finance income
Finance income are as follows: Yen (millions)
2018 2017
Dividend income:
Financial assets measured at FVTOCI.................. 2,250 1,857 Interest income:
Financial assets measured at amortized cost......... 20,522 16,956 Foreign exchange gains........................................... - 3,019 Total....................................................................... 22,772 21,832
(2) Finance expenses
Finance expenses are as follows: Yen (millions)
2018 2017
Interest expenses:
Finacial liabilities measured at amortized cost...... 18,526 19,536 Net interest cost on employee benefits.................. 3,257 4,014 Foreign exchange losses.......................................... 2,938 - Total....................................................................... 24,721 23,550
(3) Transfers of financial assets
The Company transfers financial assets such as trade receivables to unconsolidated structured entities. These entities have been set up by third-party financial institutions and managed by the financial institutions as part of their business. Because the entities also purchase a large amount of assets from customers other than the Company, the proportion of financial assets transferred by the Company in total assets of the entities is small. The Company has therefore determined that the Company's relevance to the assessment of exposures to the risk carried by the entities is low.
The Company has provided no support to these structured entities outside contracts and made no implicit agreement on support with them. The main content of the interests in these structured entities is provision of limited credit enhancement, servicing and receipt of fees on servicing.
In the years ended March 31, 2018 and 2017, loss on transfer due to the transfer of trade receivables, etc. which were derecognized in their entirety was 2,066 million yen and 1,461 million yen, respectively. This loss is included in "finance expenses" in the consolidated statements of profit or loss.
The Company has reserved obligations to provide servicing for financial assets which were derecognized in their entirety. However, since the amounts of expenses and fees received for provision of servicing are immaterial, the Company did not record assets and liabilities on serving as of March 31, 2018 and March 31, 2017.
The maximum exposure to losses resulting from continuing involvement in the derecognized financial assets as of March 31, 2018 and March 31, 2017 was 23,694 million yen and 14,205 million yen, respectively, which is the total amount of the outstanding balance of obligations to repurchase the transferred assets under restricted, specific conditions.
- 133 -
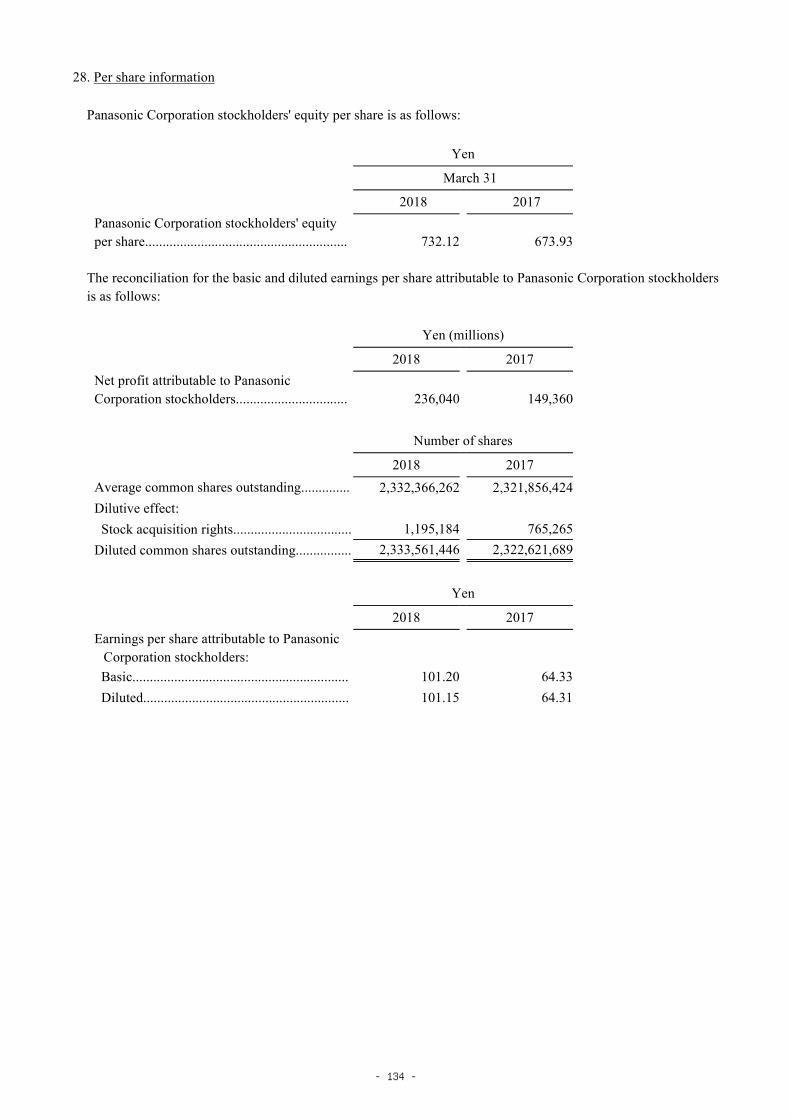
28. Per share information
Panasonic Corporation stockholders' equity per share is as follows:
Yen
March 31
2018 2017
Panasonic Corporation stockholders' equity per share..........................................................
732.12
673.93
The reconciliation for the basic and diluted earnings per share attributable to Panasonic Corporation stockholders is as follows:
Yen (millions)
2018 2017 Net profit attributable to Panasonic Corporation stockholders................................
236,040
149,360
Number of shares
2018 2017 Average common shares outstanding.............. 2,332,366,262 2,321,856,424 Dilutive effect:
Stock acquisition rights.................................. 1,195,184 765,265 Diluted common shares outstanding................ 2,333,561,446 2,322,621,689
Yen
2018 2017 Earnings per share attributable to Panasonic
Corporation stockholders:
Basic.............................................................. 101.20 64.33 Diluted........................................................... 101.15 64.31
- 134 -

29. Financial Instruments
(1) Financial risk management policy
The Company is exposed to various financial risks (credit risks, liquidity risks and market risks) in the process of its business activities, and it manages risks based on a specific policy in order to avoid or reduce these risks.
The Company limits derivatives to transactions for the purpose of mitigating risks from transactions based on actual demand. Therefore, it does not own or issue derivatives for speculative purposes.
(2) Credit risk management
The Company is principally exposed to credit risk of customers on trade receivables and lease receivables as well as credit risk of financial institutions as counterparties of derivatives held to hedge currency risks and commodity price fluctuation risks.
With regard to trade receivables and lease receivables, the Company assesses management conditions of business partners and determines their credit quality to consider whether or not the transaction is appropriate in accordance with the internal rules for credit management. After the commencement of the transaction, in accordance with the internal rules for management of receivables, the Company manages due dates and balances for each business partner, continuously manages records of progress of transactions, details of collection and changes and trends of receivable balances, and proactively gathers information on management conditions, trends, etc. of business partners in an effort to early detect and mitigate any concerns about collection due to deterioration of the financial condition, etc.
With regard to derivative transactions, since the Company only deals with financial institutions, etc. with high credit ratings and credit quality of counterparties is high, the Company believes that credit risk is small. The maximum exposure to credit risk that does not take into account collateral held and other credit enhancements at the end of the fiscal year is the carrying amount of financial assets in the consolidated statements of financial position except for the derecognized financial assets stated in "27. Finance Income and Expenses" and guarantees of obligations. The Company provides guarantees mainly on bank loans provided to associates and customers to enhance their credit. For each guarantee provided, the Company is required to perform under the guarantee if the guaranteed party defaults on a payment. As of March 31, 2018, the maximum amount of undiscounted payments the Company would have to make in the event of default was 39,729 million yen.
1) Changes in allowance for credit losses
The Company determines the amount of allowance for credit losses by such classification as trade receivables and lease receivables and receivables other than trade receivables and lease receivables, etc..
For trade receivables and lease receivables, allowance for credit losses is always recorded at an amount equal to the lifetime expected credit losses. For receivables other than trade receivables and lease receivables, etc., allowance for credit losses is recorded at an amount equal to the 12-month expected credit losses in principle. However, if terms and conditions for repayment stipulated by contract cannot be fulfilled, it is considered that credit risk has increased significantly since the initial recognition, and allowance for credit losses is recorded at an amount equal to the lifetime expected credit losses, except in the case of the failure to fulfill such terms and conditions due to administrative errors of the counterparty and other cases.
- 135 -

Any financial asset is treated as credit-impaired financial asset, if there is request for changing terms and conditions for repayment from the debtor, serious financial difficulties of the debtor, or commencement of legal liquidation procedures due to bankruptcy and others of the debtor, etc. For any amount that clearly cannot be recovered in the future, the carrying amount of the financial asset is directly reduced, and the corresponding amount of allowance for credit losses is reduced.
The amount of allowance for credit losses is determined as follows:
・ Trade receivables and lease receivables The amount of the allowance is determined by classifying the receivables according to the number of days overdue and multiplying the amount of the receivables by the provision rate calculated by considering future prospects of economic conditions, etc. in addition to the historical rate of credit losses calculated according to the classification.
・ Receivables other than trade receivables and lease receivables, etc. For assets with which credit risk is not considered to significantly increase the amount of allowance is calculated by multiplying the carrying amount by the provision rate that is determined by considering the future prospects of economic conditions, etc. in addition to the historical rate of credit losses of homogeneous assets. However, if credit risk of the asset is considered to significantly increase or the asset meets criteria for credit-impaired financial assets, the amount expected to be recovered on the asset is individually estimated, and the amount of the allowance is determined as difference between the present value discounted using the original effective interest rate of the asset and the carrying amount.
Changes in allowance for credit losses are as follows:
Yen (millions)
2018 2017
Beginning balance............................................ 20,636 22,201 Increment during the period........................... 3,933 4,210 Decrement during the period (Utilization)..... (2,768 ) (1,735 ) Decrement during the period (Reversal)........ (2,538 ) (3,650 ) Others............................................................. (60 ) (390 ) Ending balance............................................. 19,203 20,636
With regard to financial assets that were recognized for the first time in the years ended March 31, 2018 and 2017, there were no material financial assets for which allowance for credit losses was recorded at the time of initial recognition.
Furthermore, in the years ended March 31, 2018 and 2017, there were no significant increases or decreases in the gross carrying amount that could affect a change in allowance for credit losses.
- 136 -

2) Gross carrying amount of financial assets for which allowance for credit losses is to be recorded
The gross carrying amount of financial assets for which allowance for credit losses is to be recorded is as follows:
(i) Trade receivables and lease receivables Yen (millions)
2018 2017
Not past due..................................................... 1,023,482 818,506 Due within 3 months........................................ 99,134 21,057 Due after 3 months through a year................... 6,263 17,532 Due after 1 year................................................ 4,892 10,544
Total............................................................... 1,133,771 867,639
The contract balances of financial assets that were directly written off during the reporting period but still subject to recovery activities as of March 31, 2018 and March 31, 2017 were not material.
(ii) Receivables other than trade receivables and lease receivables, etc. For receivables other than trade receivables and lease receivables, etc., information has been omitted since there are no assets of which credit risk was considered to significantly increase and credit risks of the carrying amount as of March 31, 2018 and March 31, 2017 were not material.
(3) Liquidity risk management
Liquidity risks are the Company’s risks of nonfulfillment of repayment obligations for financial liabilities due. The Company develops its business under the basic policy of self-generating funds necessary for business activities. In addition, generated funds are utilized efficiently through intra-group financing. On that basis, when funds are required for working capital, investments in businesses and others, the Company raises funds externally by appropriate means in consideration of the financial structure and conditions of financial markets.
The balances of major financial liabilities by contractual maturities are as follows: Yen (millions)
March 31, 2018
Carrying amount
Contract amount
Within 1 year After 1 year but not more than 5 years
More than 5 years
Non-derivative liabilities:
Trade payables...................... 1,146,476 1,146,476 1,146,476 - - Short-term debt, including current portion of long-term debt.....................................
375,392
378,023
378,023
-
-
Long-term debt..................... 864,052 883,695 - 567,949 315,746 Other financial liabilities...... 18,623 20,687 - 1,501 19,186 Total.................................... 2,404,543 2,428,881 1,524,499 569,450 334,932 Derivative liabilities......... 15,805 15,805 15,805 - -
- 137 -

Yen (millions)
March 31, 2017
Carrying amount
Contract amount
Within 1 year After 1 year but not more than 5 years
More than 5 years
Non-derivative liabilities:
Trade payables...................... 955,965 955,965 955,965 - - Short-term debt, including current portion of long-term debt.....................................
177,038
179,416
179,416
-
-
Long-term debt....................... 946,966 974,056 - 658,541 315,515 Total...................................... 2,079,969 2,109,437 1,135,381 658,541 315,515 Derivative liabilities........... 21,896 21,896 21,896 - -
(4) Market risk management
The Company operates internationally, giving rise to exposure to market risks arising from changes in foreign exchange rates, interest rates, and commodity prices. The Company assesses these risks by continually monitoring changes in these exposures and by evaluating hedging opportunities.
1) Currency risks Foreign exchange rate fluctuations may adversely affect the Company's business, operating results and financial condition, because costs and prices of its products and services that are traded in a foreign currency are affected by foreign exchange rate changes. The Company makes efforts to mitigate currency risks principally by utilizing derivatives such as foreign exchange contracts.
(i) Exposure to currency risks Exposure to currency risks (net) of the Company is as follows. The amount of exposure to currency risks that is hedged by derivatives is excluded.
March 31
2018 2017
US Dollar (Thousands of US dollar)...................... 948,552 820,519 Euro (Thousands of Euro)...................................... 84,640 101,639 Chinese Yuan (Thousands of Chinese Yuan)......... 51,489 39,537
(ii) Sensitivity analysis for currency risks For financial instruments held by the Company as of the end of each fiscal year, the impact of a 1% appreciation of Japanese yen against US Dollar, Euro and Chinese Yuan on profit before income taxes is as follows. In the case where Japanese yen decreases by 1% against US Dollar, Euro and Chinese Yuan on profit before income taxes, there would be an opposite effect with same amount as stated in the following table.
This analysis is based on the assumption that all other variables are constant.
- 138 -

Yen (millions)
March 31
2018 2017
US Dollar................................................................ (1,008 ) (921 ) Euro........................................................................ (110 ) (122 ) Chinese Yuan.......................................................... (9 ) (6 )
2) Interest rate risks Interest-bearing debt is principally corporate bonds and borrowings obtained at fixed rates, and the interest rate risk is not material to the Company.
3) Commodity price fluctuation risks The Company procures raw materials, including non-ferrous metals, under a long-term purchase agreement and is exposed to commodity price fluctuation risks due to market fluctuations, etc. The Company makes efforts to mitigate commodity price fluctuation risks by utilizing derivatives such as commodity futures.
4) Market price fluctuation risks The Company is exposed to stock price fluctuation risks arising from its holdings of stocks of domestic and foreign companies. For equity instruments, the Company periodically assesses fair value and financial condition of issuers and continually reviews the status of holding.
(5) Derivatives and hedge accounting
Derivatives held by the Company are comprised principally of foreign exchange contracts and commodity futures. The Company uses foreign exchange contracts and others to hedge the impact of exchange rate fluctuations on costs and prices of products and services, etc. that are traded in a foreign currency. In addition, the Company utilizes commodity futures and others to hedge commodity price fluctuation risks due to market fluctuations, etc. associated with procurement of raw materials, including non-ferrous metals, under a long-term purchase agreement. All these hedges meet the criteria for cash flow hedges.
The Company confirms the existence of an economic relationship between the hedged item and the hedging instrument at the inception and on an ongoing basis, through qualitative assessment on whether important terms and conditions of the hedged item match or conform closely to those of the hedging instrument, or quantitative assessment on whether changes in values of the hedged item and the hedging instrument are offset with each other because of the same risk, in order to make sure that the hedged item and the hedging instrument has an economic relationship in which changes in cash flows of the hedged item are offset by changes in cash flows of the hedging instrument.
In addition, the Company has set the appropriate hedge ratio based on the quantity of hedged items and the quantity of hedging instruments at the hedge's inception, and in principle, this ratio is set to ensure a one-to-one relationship. Because the Company performs highly effective hedges, it expects that usually no significant ineffective portion arises.
- 139 -

1) The year ended March 31,2018 (i) Effects of hedge accounting on the consolidated statements of financial position Significant derivatives designated as hedging instruments as of March 31, 2018 are as follows:
Derivatives associated to currency risks;
Hedging instruments
Contract amounts
Average rate
Carrying amount (*1)
Yen (millions)
Assets Liabilities
Foreign exchange contracts:
US Dollar sell / Japanese Yen buy.... 741,965 Thousands
US Dollar
108.72 Yen / Dollar
2,098 -
Euro sell / Japanese Yen buy............. 199,025 Thousands
Euro
134.11 Yen / Euro
704 -
US Dollar buy / Japanese Yen sell.... 634,231 Thousands
US Dollar
108.80 Yen / Dollar
- 1,888
Euro buy / Japanese Yen sell............ 4,069 Thousands
Euro
130.92 Yen / Euro
- 2
(*1) In the consolidated statements of financial position, fair value of assets related to hedging instruments is included in "other financial assets," while fair value of liabilities related to hedging instruments is included in "other financial liabilities." The maximum term over which the Company hedges changes in cash flows due to risks of fluctuation in exchange rates is approximately six months.
The balance (after tax) of "net changes in cash flow hedges" related to ongoing hedges as of March 31, 2018 is as follows:
In the year ended March 31, 2018, there was no hedge relationship to which hedge accounting no longer applied. Yen (millions)
Risk March 31, 2018
Foreign currency risk........................... (178 ) Commodity price risk.......................... 995
Total................................................... 817
Since the amount of the ineffective portion of hedges recognized in profit or loss in the year ended March 31, 2018 is immaterial, information on changes in fair value of hedged items used as the basis for recognition of the ineffective portion of hedges has been omitted.
- 140 -

(ii) Effects of hedge accounting on the consolidated statements of profit or loss and the consolidated statements of comprehensive income
Effects of the application of hedge accounting on profit or loss and other comprehensive income (loss) in the year ended March 31, 2018 are as follows:
Yen (millions)
Risk
Amounts of gain (loss) recognized
in OCI (pre-tax amount)
Amounts of gain (loss) reclassified
from other components of
equity into profit or loss (pre-tax amount)
Recognized in consolidated
statements of profit or loss
Amounts of gain (loss) reclassified to acquisition cost of hedged item (pre-tax amount)
Foreign currency risk..... (917 ) 3,585 Finance income (expenses)
-
Commodity price risk.... (470 ) - Cost of sales (810 )
In the year ended March 31, 2018, the amount of the ineffective portion of hedges recognized in profit or loss was immaterial.
Reclassification adjustments related to foreign currency risk from other components of equity to profit or loss in the year ended March 31, 2018 are attributed to effects of hedged items on profit or loss.
2) The year ended March 31, 2017 (i) Effects of hedge accounting on the consolidated statements of financial position Significant derivatives designated as hedging instruments as of March 31, 2017 are as follows:
Derivatives associated to currency risks;
Hedging instruments
Contract amounts
Average rate
Carrying amount (*1)
Yen (millions)
Assets Liabilities
Foreign exchange contracts:
US Dollar sell / Japanese Yen buy.... 760,867 Thousands
US Dollar
112.05 Yen / Dollar
180
-
Euro sell / Japanese Yen buy............. 206,941 Thousands
Euro
120.74 Yen / Euro
188
-
US Dollar buy / Japanese Yen sell.... 298,512 Thousands
US Dollar
113.60 Yen / Dollar
-
555
Euro buy / Japanese Yen sell............. 22,284 Thousands
Euro
120.18 Yen / Euro
-
9
(*1) In the consolidated statements of financial position, fair value of assets related to hedging instruments is included in "other financial assets," while fair value of liabilities related to hedging instruments is included in "other financial liabilities." The maximum term over which the Company hedges changes in cash flows due to risks of fluctuation in exchange rates is approximately six months.
- 141 -

The balance (after tax) of "net changes in cash flow hedges" related to ongoing hedges as of March 31, 2017 is as follows:
In the year ended March 31, 2017, there was no hedge relationship to which hedge accounting no longer applied. Yen (millions)
Risk March 31, 2017
Foreign currency risk............................ (1,512 ) Commodity price risk........................... 1,270
Total.................................................... (242 )
Since the amount of the ineffective portion of hedges recognized in profit or loss in the year ended March 31, 2017 is immaterial, information on changes in fair value of hedged items used as the basis for recognition of the ineffective portion of hedges has been omitted.
(ii) Effects of hedge accounting on the consolidated statements of profit or loss and the consolidated statements of comprehensive income
Effects of the application of hedge accounting on profit or loss and other comprehensive income (loss) in the year ended March 31, 2017 are as follows:
Yen (millions)
Risk
Amounts of gain (loss) recognized
in OCI (pre-tax amount)
Amounts of gain (loss) reclassified
from other components of
equity into profit or loss (pre-tax amount)
Recognized in consolidated
statements of profit or loss
Amounts of gain (loss) reclassified to acquisition cost of hedged item (pre-tax amount)
Foreign currency risk..... (2,166 ) 5,544 Finance income (expenses)
-
Commodity price risk.... (1,699 ) (250 ) Cost of sales 0
In the year ended March 31, 2017, the amount of the ineffective portion of hedges recognized in profit or loss was immaterial.
Reclassification adjustments related to foreign currency risk from other components of equity to profit or loss in the year ended March 31, 2017 are attributed to effects of hedged items on profit or loss. Reclassification adjustments for commodity price fluctuation risks from other components of equity to profit or loss is due to cease of forecast transactions of commodity futures.
- 142 -

(6) Offsetting of financial assets and financial liabilities
For derivative assets and liabilities, the Company conducts transactions under master netting agreements or similar agreements. In the case where settlement failure occurs between the contracting parties, receivables from and payables to the counterparty are to be settled on a net basis.
Of financial assets and financial liabilities recognized to the same counterparty as of March 31, 2018, there were no financial instruments offset in accordance with requirements for offsetting of financial assets and financial liabilities. The amount of financial instruments that are subject to enforceable master netting agreements or similar agreements but have not been offset because they do not satisfy part or all of requirements for offsetting of financial assets and financial liabilities was 5,518 million yen.
Of financial assets and financial liabilities recognized to the same counterparty as of March 31, 2017, there were no financial instruments offset in accordance with requirements for offsetting of financial assets and financial liabilities. The amount of financial instruments that are subject to enforceable master netting agreements or similar agreements but have not been offset because they do not satisfy part or all of requirements for offsetting of financial assets and financial liabilities was 6,401 million yen.
(7) Fair values of financial instruments
1) Comparison between fair values and carrying amounts are as follows: Yen (millions)
March 31
2018 2017
Book value Fair value Book value Fair value
Long-term debt, including current portion of long-term dept....................................... 980,129 990,684 1,107,550 1,120,226
Fair values shown above are estimated, based on the market price or its present value of the market price or the future cash flow, which is calculated using the observable discount rate at the year-end of 2018 and 2017. They are all categorized as level 2 (refer to "2) Fair value measurement hierarchy").
With regard to financial assets and financial liabilities measured at amortized cost other than the above, their fair values approximate their carrying amounts.
2) Fair value measurement hierarchy
IFRS 13, "Fair Value Measurement" provides that fair values shall be categorized into the following three levels according to the extent to which the input information used in the measurement is observable from the outside: ・ Level 1: Fair value measured by quoted prices in active markets ・ Level 2: Fair value measured directly or indirectly using inputs other than quoted prices included within
Level 1 that are observable ・ Level 3: Fair value measured through valuation techniques which include inputs that are not based on
observable market data
The fair value measurement hierarchy level used in the measurement is determined by the lowest-level of significant input in the measurement of fair value.
- 143 -

The breakdown of financial instruments measured at fair value is as follows:
Yen (millions)
March 31, 2018
Level 1 Level 2 Level 3 Total Financial assets:
Financial assets measured at FVTPL
Derivative assets
Foreign exchange contracts..................... - 8,029 - 8,029 Commodity futures.................................. 6,710 1,346 - 8,056 Subtotal.................................................. 6,710 9,375 - 16,085
Financial assets measured at FVTOCI
Equity securities......................................... 96,416 - 32,634 129,050 Others......................................................... - 2,622 - 2,622 Subtotal................................................... 96,416 2,622 32,634 131,672 Total financial assets............................ 103,126 11,997 32,634 147,757
Financial liabilities:
Financial liabilities measured at FVTPL
Derivative liabilities
Foreign exchange contracts...................... - 3,046 - 3,046 Cross currency swaps............................. - 16 - 16 Commodity futures................................ 7,791 4,952 - 12,743 Total financial liabilities...................... 7,791 8,014 - 15,805
Yen (millions)
March 31, 2017
Level 1 Level 2 Level 3 Total Financial assets:
Financial assets measured at FVTPL
Derivative assets
Foreign exchange contracts..................... - 2,930 - 2,930 Commodity futures.................................. 11,793 993 - 12,786 Subtotal................................................ 11,793 3,923 - 15,716
Financial assets measured at FVTOCI
Equity securities...................................... 96,683 - 25,412 122,095 Others...................................................... - 2,534 - 2,534 Subtotal.................................................. 96,683 2,534 25,412 124,629 Total financial assets............................ 108,476 6,457 25,412 140,345
Financial liabilities:
Financial liabilities measured at FVTPL
Derivative liabilities
Foreign exchange contracts...................... - 3,704 - 3,704 Cross currency swaps............................... - 23 - 23 Commodity futures................................... 7,132 11,037 - 18,169 Total financial liabilities....................... 7,132 14,764 - 21,896
- 144 -

The Company's existing marketable equity securities and commodity futures are included in Level 1, which are valued using an unadjusted quoted market price in active markets with sufficient volume and frequency of transactions. Level 2 derivatives including foreign exchange contracts, cross currency swaps and commodity futures are valued using quotes obtained from brokers, which are periodically validated by pricing models using observable market inputs, such as foreign currency exchange rates and market prices for commodity futures.
Equity securities classified as Level 3 are unlisted stocks, and their fair values are measured by an appropriate valuation method that comprehensively takes into account the outlook for future profitability of the investee and quantitative information such as net asset value and major assets held by the investee, in accordance with the policy and procedures set by the Company for using the most appropriate and highly relevant, available data. The reasonableness of this assessment is verified by the department in charge of accounting using various methods and approved by the manager of the department. Specific methods of verification include use of external assessment organizations.
For financial instruments classified as Level 3, significant changes in fair value occurring when unobservable inputs are changed to reasonably possible alternative assumptions are not expected.
Transfers between levels are recognized on the day when the event or change in circumstances that caused the transfer occurred. In the years ended March 31, 2018 and 2017, there are no financial instruments of which a significant transfer was made between levels.
The breakdown of movements in financial instruments measured at fair value on a recurring basis that were classified as Level 3 in the fair value measurement hierarchy is as follows: Yen (millions)
Financial assets measured at FVTOCI
2018 2017
Balance at beginning of year........................ 25,412 27,918 Accumulated gains (losses)........................ 3,796 (5,592 ) Purchase..................................................... 4,908 3,790 Sales........................................................... (1,482 ) (704 ) Balance at end of year.............................. 32,634 25,412
(Note) Gains or losses are related to financial assets measured at FVTOCI as of March 31, 2018 and 2017, and included in "financial assets measured at fair value through other comprehensive income" in the consolidated statement of comprehensive income.
- 145 -

30. Major Subsidiaries
(1) Composition of the Group Major subsidiaries of the Company as of March 31, 2018 are as follows:
Name Principal businesses Location Ratio of
voting rights (%)
PanaHome Corporation (* 1) Other Japan 100.0 Panasonic Smart Factory Solutions Co., Ltd. Connected Solutions Japan 100.0 Panasonic Ecology Systems Co., Ltd. Eco Solutions Japan 100.0 KMEW Co., Ltd. (* 3) Eco Solutions Japan 50.0 Panasonic Consumer Marketing Co., Ltd. Appliances Japan 100.0 Panasonic Liquid Crystal Display Co., Ltd. (*1)
Automotive & Industrial Systems
Japan 100.0
SANYO Electric Co., Ltd. Eco Solutions, Automotive & Industrial Systems, Other, Corporate
Japan 100.0
Panasonic Semiconductor Solutions Co., Ltd.
Automotive & Industrial Systems
Japan 100.0
Panasonic System Solutions Japan Co., Ltd. Connected Solutions Japan 100.0
Panasonic Corporation of North America
Appliances, Eco Solutions, Connected Solutions, Automotive & Industrial Systems, Other, Corporate
U.S.A. 100.0
Panasonic Avionics Corporation Connected Solutions U.S.A. 100.0 Hussmann Corporation Appliances U.S.A. 100.0
Panasonic do Brasil Limitada Appliances, Connected Solutions, Automotive & Industrial Systems
Brazil 100.0
Panasonic Europe Ltd. Corporate U.K. 100.0
Ficosa International S.A. (*2) Automotive & Industrial Systems
Spain 69.0
Panasonic AVC Networks Czech s.r.o. Appliances Czech
Republic 100.0
Panasonic Holding (Netherlands) B.V. Corporate Netherlands 100.0
Panasonic Asia Pacific Pte. Ltd.
Appliances, Eco Solutions, Connected Solutions, Automotive & Industrial Systems, Corporate
Singapore 100.0
Panasonic India Pvt. Ltd Appliances, Connected Solutions, Automotive & Industrial Systems
India 100.0
Panasonic Taiwan Co., Ltd. Appliances, Eco Solutions, Automotive & Industrial Systems, Corporate
Taiwan 69.8
Panasonic Corporation of China Appliances, Eco Solutions, Connected Solutions, Corporate
China 100.0
Panasonic Appliances Air-Conditioning (Guangzhou) Co., Ltd.
Appliances China 67.8
Panasonic Automotive Systems Dalian Co., Ltd.
Automotive & Industrial Systems
China 60.0
- 146 -

The column "Principal businesses" indicates the segment which the subsidiaries are classified in. For subsidiaries that do not belong to any segment, the segments of the products being handled are disclosed if it is a sales company, and "Corporate" is described otherwise. *1. The ratio of voting rights of PanaHome Corporation and Panasonic Liquid Crystal Display Co., Ltd. became
100% in the fiscal year ended March 31, 2018. *2. Ficosa International S.A. became a consolidated subsidiary in the fiscal year ended March 31, 2018. Except these changes, no significant change occurred in major subsidiaries or ratio of voting rights from March 31, 2017 to March 31, 2018.
*3. Although the ratio of voting rights is 50.0%, KMEW Co., Ltd. is treated as a consolidated subsidiary because
the Company controls it by involving in its manufacturing and sale activities.
(2) Subsidiaries with material non-controlling interests Condensed financial statements, etc. of subsidiaries with material non-controlling interests are as follows. The condensed financial statements show amounts before elimination of intra-group transactions.
PanaHome Corporation The Company acquired additional interests in PanaHome, and increasing its ownership from 54.5% to 100% for the fiscal year ended March 31, 2018. Accordingly, the information relating to PanaHome is only for the fiscal year ended March 31, 2017.
March 31
2017
Shareholding ratio of non-controlling interests...... 45.5%
March 31
2017
Current assets.......................................................... 222,364 Non-current assets................................................... 56,692 Current liabilities..................................................... 105,210 Non-current liabilities............................................. 14,889 Cumulative amount of non-controlling interests.... 52,104
Yen (millions)
2017
Net sales.................................................................. 359,607 Net profit................................................................. 7,727 Other comprehensive income (loss)........................ 233 Comprehensive income........................................... 7,960 Net profit attributable to non-controlling interests.. 3,272 Dividends paid to non-controlling interests............ 1,615
- 147 -

(3) Acquisition of material non-controlling interests
The Company acquired additional interests in PanaHome, increasing its ownership from 54.5% to 100% for the fiscal year ended March 31, 2018. Transactions with non-controlling interests are as follows.
Yen (millions)
2018
Carrying amount of NCI acquired..................................................... 49,184 Consideration paid to NCI................................................................. 92,788 A decrease in equity attributable to owners of the Company............ 43,604
The Company acquired additional interests in Panasonic Liquid Crystal Display Co., Ltd., increasing its ownership from 95.0% to 100% for the fiscal year ended March 31, 2018. Accordingly, the equity attributable to owners of the Company decreased by 20,718 million yen.
- 148 -

31. Related Party Transactions
(1) Transactions with associates and joint ventures Transactions and balances of receivables and payables of Panasonic Corporation with associates and joint ventures are as follows:
Transactions with associates and joint ventures are conducted on general terms and conditions similar to arm's length transactions.
1) Balance of Panasonic Corporation's receivables from and payables to associates and joint ventures Yen (millions)
March 31
2018 2017
Associates:
Receivables.................................................... 21,935 17,153 Liabilities....................................................... 70,563 69,330 Joint ventures:
Receivables.................................................... - 78 Liabilities....................................................... - 40
2) Amounts of Panasonic Corporation's sales to and purchases from associates and joint ventures Yen (millions)
2018 2017
Associates:
Sales............................................................... 119,178 127,176 Purchases........................................................ 292,565 274,336 Joint ventures:
Sales............................................................... - - Purchases........................................................ - 94
(2) Remuneration for key management personnel Remuneration for key management personnel (Directors and Outside Directors) of the Company is as follows: Yen (millions)
2018 2017
Basic remuneration......................................... 736 937 Performance based remuneration.................... 239 308 Share based payment - stock option................ 178 295 Total............................................................... 1,153 1,540
- 149 -

32. Non-cash transactions
Significant non-cash transactions are as follows: Yen (millions)
2018 2017
Acquisition of property, plant and equipment, due to newly-contracted financing lease..............................
3,273
3,393
Decrease of treasury stocks, due to stock exchange... - 20,055
33. Commitments for acquisition of assets, etc.
Commitments as of March 31, 2018 and 2017 principally include the contracts to purchase specific raw materials for the period up to 2020, purchase contracts for property, plant and equipment, etc. with total outstanding amounts of 90,823 million yen and 126,338 million yen, respectively.
- 150 -

34. Business Combinations
Material business combinations for the years ended March 31, 2018 and 2017 are described below. Business combinations other than below are immaterial individually or collectively.
(1) For the year ended March 31, 2018 (i) Consolidation of Ficosa International S. A. With regard to Ficosa International S.A. (hereinafter, collectively including their subsidiaries, referred to as "Ficosa"), 49% of whose shares were owned by the Company and accounted for using the equity method, the terms and conditions to exercise call options to acquire additional 20% shares were satisfied on April 19, 2017, and Ficosa became a consolidated subsidiary due to the potential voting rights set in the call options.
Ficosa is involved in research and development, manufacturing, and marketing of system and components in automotive business. As a result of this alliance, Panasonic and Ficosa accelerate the expansion of businesses, which show great potential growth, such as next generation cockpit systems and ADAS.
The fair value of consideration paid for the acquisition of control, which were measured based on discounted cash flow method classified in Level 3, and non-controlling interests, which were measured at their proportionate share of net identifiable assets, were as follows:
Yen (million) Fair value of total consideration: Equity interests held by Panasonic immediately before the acquisition date...................................
22,818 Non-controlling interests....................................... 11,383 Total..................................................................... 34,201
As a result of remeasuring the equity interest held by Panasonic immediately before the acquisition date, the valuation gain or loss recognized was not material. Acquisition cost was also not material.
Assets acquired and liabilities assumed as of the acquisition date were as follows:
Yen (million) Cash and cash equivalents....................................... 15,442 Trade receivables..................................................... 27,521 Property, plant and equipment................................. 23,250 Goodwill.................................................................. 11,881 Intangible assets....................................................... 17,991 Other acquired assets............................................... 20,098 Total assets acquired.............................................. 116,183 Current liabilities and non-current liabilities........... 32,462 Trade Payables......................................................... 27,129 Other assumed liabilities.......................................... 22,391 Total liabilities assumed........................................ 81,982 Total net assets acquired...................................... 34,201
The total amount of goodwill was included in "Automotive and Industrial Systems" segment, and was not deductible for tax purpose. All intangible assets were subject to amortization, including technology and customer, and their useful lives were 5 to 10 years.
- 151 -

Net sales and profit before income taxes of Ficosa that were included in the consolidated statements of profit or loss for the year ended March 31, 2018 were 155,022 million yen and 4,343 million yen, respectively.
Pro forma information has been omitted as the amounts excluded in the consolidated statements of profit or loss for the year ended March 31, 2018 were not material.
ii) Acquisition of control of Zetes Industries S. A. On April 27, 2017, the Company acquired 56.66% of shares excluding treasury stock to obtain control of Zetes Industries S.A., which is incorporated in Belgium (hereinafter, collectively including their subsidiaries, referred to as "Zetes").
Zetes is involved in the businesses of goods and people identification and mobility solutions in Europe. As a result of this acquisition, both Panasonic and Zetes will be able to satisfy the global customers’ needs by combining Zetes’ identification and mobility solutions and Panasonic’s advanced research and development capabilities, technological expertise, and global customer network, to expand the solution and service in the area of supply chain solutions and security solutions.
The fair value of consideration paid for the controlling interests of Zetes as of the acquisition date and non-controlling interests, which were measured at their proportionate share of net identifiable assets, were as follows:
Yen (million) Fair value of total consideration: Cash.......................................................................
20,044 Non-controlling interests....................................... 8,247 Total..................................................................... 28,291
Costs incurred for acquisition of control were not material.
Assets acquired and liabilities assumed as of the acquisition date were as follows:
Yen (million)
Cash and cash equivalents....................................... 2,427 Goodwill.................................................................. 9,263 Intangible assets....................................................... 20,062 Other acquired assets............................................... 16,412 Total assets acquired.............................................. 48,164 Current liabilities and non-current liabilities........... 1,567 Deferred tax liabilities............................................. 6,935 Other assumed liabilities......................................... 11,371 Total liabilities assumed........................................ 19,873 Total net assets acquired..................................... 28,291
The total amount of goodwill was included in "Connected Solutions" segment, and was not deductible for tax purpose. Intangible assets with the amount of 18,605 million yen were subject to amortization, including customer of 15,299 million yen, whose useful life was 25 to 29 years.
Net sales and profit before income taxes of Zetes that were included in the consolidated statements of profit or loss for the year ended March 31, 2018 were not material.
Pro forma information has been omitted as the amounts were not material.
- 152 -

(2) For the year ended March 31, 2017 On April 1, 2016, the Company acquired all outstanding shares of Hussmann Parent Inc., which in turn owned all shares of Hussmann Corporation of the United States, and accordingly, obtained control in the two companies and their subsidiaries (hereinafter, collectively including their subsidiaries, referred to as "Hussmann") from the acquisition date.
Hussmann is in the business of manufacturing, selling, developing and providing services related to commercial-use refrigerated and freezer display cases. This acquisition will enable the combination of Hussmann's strengths in customer relationship, maintenance and services with the Company's wide-ranging technology and product lineup. The Company will use this synergy to drive growth and further innovation on a global basis. Hussmann will be able to leverage core refrigeration product technology and case platforms including the Company's CO2 systems and foodservice products. Other synergy opportunities include LED's, remote monitoring and other technology platforms that will enhance retail customer's merchandising and consumer connectivity.
The fair value of consideration paid for the controlling interests of Hussmann as of the acquisition date was 141,771 million yen and was paid in cash. Acquisition-related cost was not material.
Assets acquired and liabilities assumed as of the acquisition date were as follows: Yen (million) Cash and cash equivalents....................................... 16,917 Goodwill.................................................................. 91,156 Intangible assets....................................................... 96,733 Other acquired assets............................................... 51,893 Total assets acquired.............................................. 256,699 Debt.......................................................................... 41,371 Deferred tax liabilities............................................. 31,523 Other assumed liabilities......................................... 42,034 Total liabilities assumed........................................ 114,928 Total net assets acquired...................................... 141,771
The total amount of goodwill is included in "Appliances" segment, and is not deductible for tax purpose. Intangible assets of 67,185 million yen are subject to amortization, which include customer of 62,130 million yen with a 21-year useful life. Intangible assets of 29,548 million yen are not subject to amortization, all of which relates to trademark.
Net sales and profit before income taxes of Hussmann that are included in the consolidated statements of profit or loss for the year ended March 31, 2017 were 126,884 million yen and 6,523 million yen, respectively.
Pro forma information has been omitted as the acquisition occurred at the beginning of the year ended March 31, 2017.
- 153 -

35. Contingent Liabilities
Litigation, etc. The Company and certain of its subsidiaries are subject to a number of legal proceedings including civil litigations related to trade, tax, products or intellectual properties, or governmental investigations. The Company has been dealing with the various litigations and investigations. Depending upon the outcome of these different proceedings, the Company and certain of its subsidiaries may be subject to an uncertain amount of fines, and accordingly the Company has accrued for certain probable and reasonable estimated amounts for the fines.
Since November 2007, the Company and MT Picture Display Co., Ltd. (MTPD), a subsidiary of the Company, had been subjected to investigations by the Japan Fair Trade Commission (JFTC), in respect of alleged antitrust violations relating to cathode ray tubes (CRTs). MTPD and its three subsidiaries appealed the Tokyo High Court to revoke the decisions of the Japan Fair Trade Commission, including the fine assessed in 2010, but the court rendered the judgment to reject the appeal in April, 2016. MTPD and the subsidiaries appealed to the Supreme Court of Japan. The Supreme Court rendered the judgement to reject the appeal and the judgment of the Tokyo High Court against MTPD and the subsidiaries became final in December, 2017.
The Company and SANYO Electric Co., Ltd. are also subject to relevant litigations mainly in the U.S..
The Company and one of its U.S. subsidiaries, Panasonic Avionics Corporation (PAC), have entered into agreements with the United States Securities and Exchange Commission and the United States Department of Justice (U.S. Government Agencies), respectively in May, 2018. The agreements resolve investigations by the U.S. Government Agencies under the Foreign Corrupt Practices Act and other securities laws regarding activities at PAC with respect to certain contracts with airline customers, and the use of sales agents and consultants pertaining to such contracts. In connection with these resolutions, the Company and PAC agreed to pay a fine to the U.S. Government Agencies.
Other than those above, there are a number of legal actions against the Company and certain subsidiaries. Management is of the opinion that damages, if any, resulting from these actions, will not have a material effect on the Company's consolidated financial statements.
The ability to predict the outcome of these actions and proceedings is difficult to assess given that certain of the investigations and legal proceedings are still at an early stage, present novel legal theories, involving a large number of parties or taking place in jurisdictions outside of Japan where the laws are complex or unclear. Accordingly, the Company is unable to estimate the losses or range of losses for the actions and proceedings where there is only a reasonable possibility that a loss exceeding the amounts already recognized may have been incurred.
36. Subsequent Events
The Company entered into commitment line agreements of total 700,000 million yen for three years with several banks in June 2018.
- 154 -

Independent Auditor’s Report
To the Board of Directors of Panasonic Corporation:
We have audited the accompanying consolidated financial statements of Panasonic Corporation and its consolidated subsidiaries, which comprise the consolidated statement of financial position as at March 31, 2018, and the consolidated statement of profit or loss, statement of comprehensive income, statement of changes in equity and statement of cash flows for the year then ended, and the related notes to the consolidated financial statements.
Management’s Responsibility for the Consolidated Financial Statements Management is responsible for the preparation and fair presentation of these consolidated financial statements in accordance with International Financial Reporting Standards, and for such internal control as management determines is necessary to enable the preparation of consolidated financial statements that are free from material misstatement, whether due to fraud or error.
Auditor’s Responsibility Our responsibility is to express an opinion on these consolidated financial statements based on our audit. We conducted our audit in accordance with auditing standards generally accepted in Japan. Those standards require that we comply with ethical requirements and plan and perform the audit to obtain reasonable assurance about whether the consolidated financial statements are free from material misstatement. An audit involves performing procedures to obtain audit evidence about the amounts and disclosures in the consolidated financial statements. The procedures selected depend on our judgment, including the assessment of the risks of material misstatement of the consolidated financial statements, whether due to fraud or error. In making those risk assessments, we consider internal control relevant to the entity’s preparation and fair presentation of the consolidated financial statements in order to design audit procedures that are appropriate in the circumstances, while the objective of the financial statement audit is not for the purpose of expressing an opinion on the effectiveness of the entity’s internal control. An audit also includes evaluating the appropriateness of accounting policies used and the reasonableness of accounting estimates made by management, as well as evaluating the overall presentation of the consolidated financial statements. We believe that the audit evidence we have obtained is sufficient and appropriate to provide a basis for our audit opinion.
Opinion In our opinion, the consolidated financial statements present fairly, in all material respects, the financial position of Panasonic Corporation and its consolidated subsidiaries as at March 31, 2018, and their financial performance and cash flows for the year then ended in accordance with International Financial Reporting Standards.
KPMG AZSA LLC
June 29, 2018 Osaka, Japan
- 155 -

Other information
(1) Quarterly financial Information for fiscal 2017 (Millions of yen, unless otherwise stated)
(Cumulative) First quarter Second quarter Third quarter Year total
Net sales....................................... 1,865,275 3,857,864 5,912,166 7,982,164 Profit before income taxes........... 81,972 194,785 313,523 378,590 Net profit attributable to Panasonic Corporation stockholders................................
48,759
118,911
200,111
236,040
Earnings per share attributable to Panasonic Corporation stockholders, basic (yen)............
20.91
50.98
85.80
101.20
(Three months) First quarter Second quarter Third quarter Fourth quarter
Earnings per share attributable to Panasonic Corporation stockholders, basic (yen)............
20.91
30.08
34.81
15.40
(2) Litigation, etc. Significant litigation, etc. associated with the Company are as stated in "35. Contingent Liabilities" in the notes to consolidated financial statements.
- 156 -

Ⅵ Stock-related Administration for the Company
Fiscal Year From April 1 to March 31
Ordinary General Meeting of Shareholders June
Record date March 31
Record date for distribution of surplus September 30 March 31
Number of shares constituting one unit 100 shares
Purchase and sales of shares less than one unit
Handling office Sumitomo Mitsui Trust Bank, Limited 5-33, Kitahama, 4-chome, Chuo-ku, Osaka-shi
Transfer agent Sumitomo Mitsui Trust Bank, Limited 4-1, Marunouchi, 1-chome, Chiyoda-ku, Tokyo
Forward office ―
Purchasing and selling fee Amount separately specified as an amount equivalent to the fees pertaining to the entrustment of sale and purchase of shares
Method of public notice
The Company's method of public notice is through electronic public notice. However, if the Company cannot use the above-mentioned method of public notice due to an accident or other inevitable reasons, Nihon Keizai Shimbun will be adopted as its medium. URL for public notice is following https://www.panasonic.com/jp/home.html
Special benefit for Shareholders Not applicable
- 157 -

Ⅶ Reference Information on the Company
1. Information on a Parent Company, etc. of the Company
Not applicable.
2. Other Reference Information
The Company filed the following documents during the period from the commencing date of the fiscal year ended March 31, 2018 to the filing date of Annual Securities Report. (1) Annual Securities
Report and documents attached, and Confirmation Letter
Business Term
(110th) From April 1, 2016 To March 31, 2017
Filed with the Director of the Kanto Local Finance Bureau on June 30, 2017
(2) Internal Control Report and documents attached
Filed with the Director of the Kanto Local Finance Bureau on June 30, 2017
(3) Quarterly Report and Confirmation Letter
(111th First Quarter) From April 1, 2017 To June 30, 2017
Filed with the Director of the Kanto Local Finance Bureau on August 8, 2017
(111th Second Quarter)
From July 1, 2017 To September 30, 2017
Filed with the Director of the Kanto Local Finance Bureau on November 10, 2017
(111th Third Quarter) From October 1, 2017 To December 31, 2017
Filed with the Director of the Kanto Local Finance Bureau on February 14, 2018
(4) Extraordinary Report
Pursuant to Article 24-5, paragraph 4 of the Financial Instruments and Exchange Act and Article 19, Paragraph 2, Item 9-2 of the Cabinet Office Ordinance Concerning Disclosure of Corporate Affairs, etc.
Filed with the Director of the Kanto Local Finance Bureau on July 3, 2017
Pursuant to Article 24-5, paragraph 4 of the Financial Instruments and Exchange Act, and Article 19, Paragraph 1 and Paragraph 2, Item 2-2 of the Cabinet Office Ordinance Concerning Disclosure of Corporate Affairs, etc.
Filed with the Director of the Kanto Local Finance Bureau on July 31, 2017
Pursuant to Article 24-5, paragraph 4 of the Financial Instruments and Exchange Act, and Article 19, Paragraph 2, Item 12 of the Cabinet Office Ordinance Concerning Disclosure of Corporate Affairs, etc.
Filed with the Director of the Kanto Local Finance Bureau on May 11, 2018
- 158 -

Pursuant to Article 24-5, paragraph 4 of the Financial Instruments and Exchange Act, and Article 19, Paragraph 1 and Paragraph 2, Item 2-2 of the Cabinet Office Ordinance Concerning Disclosure of Corporate Affairs, etc.
Filed with the Director of the Kanto Local Finance Bureau on June 28, 2018
(5) Amendment to Extraordinary Report
Amendment to Extraordinary Report concerning the Extraordinary Report which was submitted on July 31, 2017
Filed with the Director of the Kanto Local Finance Bureau on August 23, 2017
- 159 -

Part Ⅱ Information on Guarantors, etc. for the Company
Not applicable.
- 160 -

TRANSLATION
Following is an English translation of the Independent Auditor’s Report filed under the Financial Instruments and Exchange Act of Japan. This report is presented merely as supplemental information.
There are differences between an audit of internal control over financial reporting under the Financial Instruments and Exchange Act and an audit of internal control over financial reporting conducted under the attestation standards established by the American Institute of Certified Public Accountants. In an audit of internal control over financial reporting under the Financial Instruments and Exchange Act, the auditors express an opinion on management's report on internal control over financial reporting, and do not express an opinion on the Company’s internal control over financial reporting taken as a whole.
Independent Auditor’s Report on the Financial Statements and
Internal Control Over Financial Reporting
June 29, 2018 To the Board of Directors of Panasonic Corporation:
KPMG AZSA LLC
Masahiro Mekada Designated Limited Liability Partner Engagement Partner Certified Public Accountant
Kengo Chida Designated Limited Liability Partner Engagement Partner Certified Public Accountant
Masaki Hirota Designated Limited Liability Partner Engagement Partner Certified Public Accountant
Financial Statement Audit
We have audited the accompanying consolidated financial statements of Panasonic Corporation and its consolidated subsidiaries provided in the “V. Consolidated Financial Statements” section in the Company’s Annual Securities Report, which comprise the consolidated statement of financial position as at March 31, 2018 and the consolidated statement of profit or loss, statement of comprehensive income, statement of changes in equity and statement of cash flows for the year then ended, and the related notes to the consolidated financial statements, in accordance with Article 193-2, paragraph (1) of the Financial Instruments and Exchange Act of Japan.
Management’s Responsibility for the Consolidated Financial Statements
Management is responsible for the preparation and fair presentation of these consolidated financial statements in accordance with International Financial Reporting Standards pursuant to the provisions of Article 93 of the Ordinance on Terminology, Forms and Preparation Methods of Consolidated Financial Statements, and for such internal control as management determines is necessary to enable the preparation of consolidated financial statements that are free from material misstatement, whether due to fraud or error.
- 161 -

Auditor’s Responsibility
Our responsibility is to independently express an opinion on these consolidated financial statements based on our audit. We conducted our audit in accordance with auditing standards generally accepted in Japan. Those standards require that we plan and perform the audit to obtain reasonable assurance about whether the consolidated financial statements are free from material misstatement.
An audit involves performing procedures to obtain audit evidence about the amounts and disclosures in the consolidated financial statements. The procedures selected depend on our judgment, including the assessment of the risks of material misstatement of the consolidated financial statements, whether due to fraud or error. In making those risk assessments, we consider internal control relevant to the entity’s preparation and fair presentation of the consolidated financial statements in order to design audit procedures that are appropriate in the circumstances, while the objective of the financial statement audit is not for the purpose of expressing an opinion on the effectiveness of the entity’s internal control. An audit also includes evaluating the appropriateness of accounting policies used and the reasonableness of accounting estimates made by management, as well as evaluating the overall presentation of the consolidated financial statements.
We believe that the audit evidence we have obtained is sufficient and appropriate to provide a basis for our audit opinion.
Opinion
In our opinion, the consolidated financial statements present fairly, in all material respects, the financial position of Panasonic Corporation and its consolidated subsidiaries as at March 31, 2018, and their financial performance and cash flows for the year then ended in accordance with International Financial Reporting Standards.
Internal Control Audit
We also have audited the accompanying internal control report of Panasonic Corporation as at March 31, 2018, in accordance with Article 193-2, paragraph (2) of the Financial Instruments and Exchange Act of Japan.
Management’s Responsibility for the Internal Control Report
Management is responsible for the design and operation of internal control over financial reporting and the preparation and fair presentation of the internal control report in accordance with assessment standards for internal control over financial reporting generally accepted in Japan. Internal control over financial reporting may not completely prevent or detect financial statement misstatements.
Auditor’s Responsibility
Our responsibility is to independently express an opinion on the internal control report based on our internal control audit. We conducted our internal control audit in accordance with auditing standards for internal control over financial reporting generally accepted in Japan. Those standards require that we plan and perform the audit to obtain reasonable assurance about whether the internal control report is free from material misstatement.
An internal control audit involves performing procedures to obtain audit evidence about the assessment of internal control over financial reporting in the internal control report. The procedures selected depend on our judgment, including significance of effect on the reliability of financial reporting. Also, an internal control audit includes evaluating the appropriateness of the scope, procedures and result of the assessment of internal control over financial reporting determined and presented by management, and the overall internal control report presentation.
We believe that the audit evidence we have obtained is sufficient and appropriate to provide a basis for our audit opinion.
- 162 -

Opinion
In our opinion, the internal control report, in which Panasonic Corporation states that internal control over financial reporting was effective as at March 31, 2018, presents fairly, in all material respects, the assessment of internal control over financial reporting in accordance with assessment standards for internal control over financial reporting generally accepted in Japan.
Other Matter
Our firm and engagement partners have no interest in the Company which should be disclosed pursuant to the provisions of the Certified Public Accountants Law of Japan.
Notes to the reader of audit report: The Independent Auditor’s Report herein is the English translation of the Independent Auditor’s Report as required by the Financial Instruments and Exchange Act of Japan.
- 163 -

[Cover]
Filed Document: Confirmation Letter Applicable Law: Article 24-4-2, Paragraph 1 of the Financial Instruments and
Exchange Act of Japan Filed to: Director, Kanto Local Finance Bureau Filing Date: June 29, 2018 Company Name: Panasonic Kabushiki Kaisha Company Name in English: Panasonic Corporation Position and Name of Representative: Kazuhiro Tsuga, Representative Director, President Name and Title of CFO: Hirokazu Umeda, Director Address of Head Office: 1006, Oaza Kadoma, Kadoma-shi, Osaka Place Where the Filed Document is Available for Public Inspection:
Panasonic Corporation (Panasonic Tokyo Shiodome building, 5-1, Higashi-shimbashi 1-chome, Minato-ku, Tokyo) Tokyo Stock Exchange, Inc. (2-1, Nihombashi Kabuto-cho, Chuo-ku, Tokyo) Nagoya Stock Exchange, Inc. (8-20, Sakae 3-chome, Naka-ku, Nagoya)
- 164 -

1. Matters Related to Adequacy of Statements Contained in the Annual Securities Report
Mr. Kazuhiro Tsuga, Representative Director, President, and Mr. Hirokazu Umeda, Director, confirmed that statements contained in the Annual Securities Report for the 111th fiscal year (from April 1, 2017 to March 31, 2018) were adequate under the Financial Instruments and Exchange Act.
2. Special Notes
Not applicable.
- 165 -

[Cover]
Filed Document: Internal Control Report Applicable Law: Article 24-4-4, Paragraph 1 of the Financial Instruments and
Exchange Act of Japan Filed to: Director, Kanto Local Finance Bureau Filing Date: June 29, 2018 Company Name: Panasonic Kabushiki Kaisha Company Name in English: Panasonic Corporation Position and Name of Representative: Kazuhiro Tsuga, Representative Director, President Name and Title of CFO: Hirokazu Umeda, Director Address of Head Office: 1006, Oaza Kadoma, Kadoma-shi, Osaka Place Where the Filed Document is Available for Public Inspection:
Government and External Relations of Panasonic Corporation (Panasonic Tokyo Shiodome building, 5-1, Higashi-shimbashi 1-chome, Minato-ku, Tokyo) Tokyo Stock Exchange, Inc. (2-1, Nihombashi Kabuto-cho, Chuo-ku, Tokyo) Nagoya Stock Exchange, Inc. (8-20, Sakae 3-chome, Naka-ku, Nagoya)
- 166 -

1. Matters Related to Basic Framework of Internal Control over Financial Reporting
Mr. Kazuhiro Tsuga, Representative Director, President, and Mr. Hirokazu Umeda, Director, are responsible for establishing and maintaining internal control over financial reporting of Panasonic Corporation (the "Company") and have established and maintained internal control over financial reporting in accordance with the basic framework for internal control set forth in the "On the Setting of the Standards and Practice Standards for Management Assessment and Audit concerning Internal Control Over Financial Reporting (Council Opinions)" published by the Business Accounting Council.
The internal control over financial reporting is designed to achieve its objectives to the extent reasonable through the effective function and combination of its basic elements. Therefore, there is a possibility that internal control over financial reporting may not completely prevent or detect misstatements.
2. Matters Related to Scope of Assessment, Record Date, and Assessment Procedure
We assessed the effectiveness of our internal control over financial reporting on the record date as of March 31, 2018. We made this assessment in accordance with assessment standards for internal control over financial reporting generally accepted in Japan.
In making this assessment, we evaluated internal control which may have a material effect on the entire financial reporting on a consolidated basis ("company-level controls") and based on the result of this assessment, we appropriately selected business processes to be evaluated, analyzed these selected business processes, identified key controls that may have a material impact on the reliability of our financial reporting, and assessed the design and operation of these key controls. These procedures have allowed us to evaluate the effectiveness of our internal controls. We determined the required scope of assessment of internal control over financial reporting for the Company, as well as its consolidated subsidiaries and equity-method affiliates, from the perspective of the materiality that may affect the reliability of our financial reporting. The materiality that may affect the reliability of our financial reporting is determined taking into account the materiality of quantitative and qualitative impacts. We confirmed that we had reasonably determined the scope of assessment of internal controls over business processes in light of the results of assessment of company-level controls conducted for the Company, its consolidated subsidiaries and equity-method affiliates. We did not include those consolidated subsidiaries and equity-method affiliates which do not have any quantitatively or qualitatively material impact on the consolidated financial statements in the scope of assessment of company-level controls.
Regarding the scope of assessment of internal control over business processes, we accumulated business units in descending order of total revenues (after elimination of intercompany transactions) for the previous fiscal year, and those business units whose combined amount of revenues reaches approximately two-thirds of total revenues on a consolidated basis were selected as significant business units.
For the selected significant business units, we included, in the scope of assessment those business processes leading to revenues, accounts receivables and inventories. Further, not only for selected significant business units”, but also for other business units, we added to the scope of assessment, those business processes having greater materiality considering their impact on the financial reporting, those business processes relating to greater likelihood of material misstatements in significant accounts involving estimates or forecasts as these significant accounts that may have a material impact on our business objectives; or those business processes relating to businesses or operations dealing with high-risk transactions.
3. Matters Related to Results of Assessment
As a result of the assessment above, we concluded that our internal control over financial reporting was effective as of March 31, 2018.
- 167 -

4. Supplementary Matters
None.
5. Special Notes
None.
- 168 -
![クレオパトラⅦの追憶 - [分冊版] クレオパトラⅦの追憶 3/4](https://static.fdocuments.net/doc/165x107/57906fbc1a28ab68749a339d/-3457906fbc1a28ab68749a339d.jpg)

![クレオパトラⅦの追憶 - [分冊版] クレオパトラⅦの追憶 4/4](https://static.fdocuments.net/doc/165x107/57906feb1a28ab68749b11f1/-57906feb1a28ab68749b11f1.jpg)

![クレオパトラⅦの追憶 - [分冊版] クレオパトラⅦの追憶 4/4](https://static.fdocuments.net/doc/165x107/57906fbc1a28ab68749a339e/-4457906fbc1a28ab68749a339e.jpg)


![クレオパトラⅦの追憶 - [分冊版] クレオパトラⅦの追憶 2/4](https://static.fdocuments.net/doc/165x107/57906fbc1a28ab68749a339b/-2457906fbc1a28ab68749a339b.jpg)