Annual Securities Report - Hitachi · Annual Securities Report (The 143rd Business Term) From April...
205
[Translation] Annual Securities Report (The 143rd Business Term) From April 1, 2011 to March 31, 2012 6-6, Marunouchi 1-chome, Chiyoda-ku, Tokyo Hitachi, Ltd.
Transcript of Annual Securities Report - Hitachi · Annual Securities Report (The 143rd Business Term) From April...

[Translation]
Annual Securities Report
(The 143rd Business Term) From April 1, 2011 to March 31, 2012
6-6, Marunouchi 1-chome, Chiyoda-ku, Tokyo
Hitachi, Ltd.

[Cover]
[Document Filed] Annual Securities Report (“Yukashoken Hokokusho”)
[Applicable Law] Article 24, Paragraph 1 of the Financial Instruments and Exchange Act of
Japan
[Filed to] Director, Kanto Local Finance Bureau
[Filing Date] June 22, 2012
[Fiscal Year] The 143rd Business Term (from April 1, 2011 to March 31, 2012)
[Company Name] Kabushiki Kaisha Hitachi Seisakusho
[Company Name in English] Hitachi, Ltd.
[Position and Name of
Representative]
Hiroaki Nakanishi, President
[Address of Head Office] 6-6, Marunouchi 1-chome, Chiyoda-ku, Tokyo
[Phone No.] 03-3258-1111
[Contact Person] Taro Kaiho, Manager, Legal Division
[Contact Address] 6-6, Marunouchi 1-chome, Chiyoda-ku, Tokyo
[Phone No.] 03-3258-1111
[Contact Person] Taro Kaiho, Manager, Legal Division
[Place Where Available for
Public Inspection]
Tokyo Stock Exchange, Inc.
(2-1, Nihombashi Kabutocho, Chuo-ku, Tokyo)
Osaka Securities Exchange Co., Ltd.
(8-16, Kitahama 1-chome, Chuo-ku, Osaka)
Nagoya Stock Exchange, Inc.
(8-20, Sakae 3-chome, Naka-ku, Nagoya)
This is an English translation of the Annual Securities Report filed with the Director of the Kanto Local Finance Bureau
via Electronic Disclosure for Investors’ NETwork (“EDINET”) pursuant to the Financial Instruments and Exchange Act of Japan.
Certain information in “Part I. Information on the Company - II. Business Overview - 4. Risk Factors - Risks Related to Our American Depositary Shares” is only included in this English translation of the Annual Securities Report for ADSs holders and not included in the original report.
Certain information in “Part I. Information on the Company - V. Financial Information” in this document incorporates financial statements prepared in conformity with accounting principles generally accepted in the United States and independent auditor’s report instead of the English translation of the Annual Securities Report.
The translation of the Internal Control Report and the Confirmation Letter for the original Annual Securities Report are included at the end of this document.
In this document, the terms “we,” “us,” “our” and “Hitachi” refer to Hitachi, Ltd. and our consolidated subsidiaries or, as the context may require, Hitachi, Ltd. on a non-consolidated basis and the term “the Company” refers to Hitachi, Ltd. on a non-consolidated basis.
Unless otherwise stated, in this document, where we present information in millions or hundreds of millions of yen, we have truncated amounts of less than one million or one hundred million, as the case may be. Accordingly, the total of figures presented in columns or otherwise may not equal the total of the individual items. We have rounded all percentages to the nearest percent, one-tenth of one percent or one-hundredth of one percent, as the case may be.
References in this document to the “Financial Instruments and Exchange Act” are to the Financial Instruments and Exchange Act of Japan and other laws and regulations amending and/or supplementing the Financial Instruments and Exchange Act of Japan.
References in this document to the “Companies Act” are to the Companies Act of Japan and other laws and regulations amending and/or supplementing the Companies Act of Japan.

Contents
Part I Information on the Company ................................................................................................................... 1 I. Overview of the Company ......................................................................................................................... 1
1. Key Financial Data ............................................................................................................................ 1 2. History ............................................................................................................................................... 4 3. Description of Business .................................................................................................................... 6 4. Information on Affiliates ................................................................................................................... 8 5. Employees ....................................................................................................................................... 17
II. Business Overview ................................................................................................................................. 18 1. Summary of Business Results ......................................................................................................... 18 2. Production, Orders Received and Sales .......................................................................................... 18 3. Challenges Facing Hitachi Group. .................................................................................................. 18 4. Risk Factors .................................................................................................................................... 19 5. Material Agreements, etc. ............................................................................................................... 27 6. Research and Development ............................................................................................................. 28 7. Analyses of Consolidated Financial Position, Operating Results and Cash Flows ......................... 30
III. Property, Plants and Equipment ............................................................................................................ 43 1. Summary of Capital Investment, etc. .............................................................................................. 43 2. Major Property, Plants and Equipment ........................................................................................... 44 3. Plans for Capital Investment, Disposals of Property, Plants and Equipment, etc. .......................... 48
IV. Information on the Company ................................................................................................................ 49 1. Information on the Company’s Stock, etc. ...................................................................................... 49
(1) Total number of shares, etc. ........................................................................................................ 49 (2) Information on the stock acquisition rights, etc. ......................................................................... 49 (3) Information on moving strike convertible bonds, etc. ................................................................ 53 (4) Information on shareholder right plans....................................................................................... 54 (5) Changes in the total number of issued shares and the amount of common stock and other ....... 54 (6) Shareholders composition........................................................................................................... 54 (7) Major shareholders ..................................................................................................................... 55 (8) Information on voting rights ....................................................................................................... 56 (9) Details of stock option plans ...................................................................................................... 57
2. Information on Acquisition, etc. of Treasury Stock ........................................................................ 57 3. Dividend Policy .............................................................................................................................. 59 4. Changes in Share Prices .................................................................................................................. 59 5. Directors and Senior Management .................................................................................................. 60 6. Corporate Governance, etc. ............................................................................................................. 69
V. Financial Information ............................................................................................................................. 80 VI. Stock-Related Administration for the Company ................................................................................... 81 VII. Reference Information on the Company ............................................................................................. 82
Part II Information on Guarantors, etc. for the Company ................................................................................ 83 [Consolidated Financial Statements]................................................................................................................. F-1
Reports of Independent Registered Public Accounting Firm. ................................................................... F-2 Consolidated Financial Statements of Hitachi, Ltd. and Subsidiaries. ..................................................... F-4
[Internal Control Report] .................................................................................................................................. A-1 [Confirmation Letter] ........................................................................................................................................ A-3

-1-
Part I Information on the Company
I. Overview of the Company
1. Key Financial Data (1) Consolidated financial data, etc.
(Millions of yen, unless otherwise stated)
Fiscal year 139th
business term140th
business term141st
business term142nd
business term 143rd
business termYear end March 2008 March 2009 March 2010 March 2011 March 2012
Revenues 11,226,735 10,000,369 8,968,546 9,315,807 9,665,883Income (loss) before income taxes
324,782 (289,871) 63,580 432,201 557,730
Net income (loss) attributable to Hitachi, Ltd.
(58,125) (787,337) (106,961) 238,869 347,179
Total comprehensive income - - - 228,459 392,581Total Hitachi, Ltd. stockholders’ equity
2,170,612 1,049,951 1,284,658 1,439,865 1,771,782
Total equity 3,313,120 2,179,352 2,267,845 2,441,389 2,773,995Total assets 10,530,847 9,403,709 8,964,464 9,185,629 9,418,526Total Hitachi, Ltd. stockholders’ equity per share (yen)
652.95 315.86 287.13 318.73 382.26
Net income (loss) attributable to Hitachi, Ltd. per share, basic (yen)
(17.48) (236.86) (29.20) 52.89 76.81
Net income (loss) attributable to Hitachi, Ltd. per share, diluted (yen)
(17.77) (236.87) (29.20) 49.38 71.86
Total Hitachi, Ltd. stockholders’ equity ratio (%)
20.6 11.2 14.3 15.7 18.8
Return on equity (%) - - - 17.5 21.6Price earnings ratio (times) - - - 8.2 6.9Net cash provided by operating activities
791,837 558,947 798,299 841,554 447,155
Net cash used in investing activities
[(637,618)](689,316)
(550,008) (530,595) (260,346) (195,584)
Net cash provided by (used in) financing activities
[(185,556)](133,858)
284,388 (502,344) (584,176) (167,838)
Cash and cash equivalents at end of year
560,960 807,926 577,584 554,810 619,577
Number of employees [Average number of part-time employees, etc.]
347,810[40,692]
361,796[42,097]
359,746[39,562]
361,745 [44,353]
323,540[46,182]
(Notes) 1. Our consolidated financial statements have been prepared in conformity with accounting principles generally accepted in the United States.
2. Revenues do not include the consumption tax, etc. 3. Effective from the 141st business term, the Company has adopted the provisions of the
Accounting Standards Codification (hereinafter “ASC”) 810 “Consolidation” of the U.S. Financial Accounting Standards Board concerning noncontrolling interests of subsidiaries. As a result, minority interests previously presented separately from liabilities and equity on the consolidated balance sheets are included as noncontrolling interests in equity. In line with this change, in the table above, total equity including noncontrolling interests are presented as “Total equity,” and the item presented as “Total equity” up to the Annual Securities Report for the 140th business term is presented as “Total Hitachi, Ltd. stockholders’ equity.”

-2-
4. Effective from the 141st business term, in line with the adoption of the provisions of ASC 810, the presentation of cash flows related to the acquisition and sale of shares in a subsidiary, which does not result in changes in the scope of consolidation of the Company or its consolidated subsidiaries, has been changed from “Cash flows from investing activities” to “Cash flows from financing activities,” and amounts from the preceding fiscal years have been restated. For the 139th business term, the amounts before the restatement are presented in brackets in the upper rows since we have not received the Auditor’s Report based on the Financial Instruments and Exchange Act of Japan.
5. The amount of “Total assets” for the 141st business term is restated in accordance with the provisions of ASC 805 “Business Combinations,” since evaluation of fair values related to the business combinations implemented in March 2010 was completed during the 142nd business term. In line with this change, the amount of “Total Hitachi, Ltd. stockholders’ equity ratio” is also restated.
6. Effective from the 142nd business term, the Company has adopted the provisions of ASC 860 “Transfers and Servicing” of the U.S. Financial Accounting Standards Board as amended by Accounting Standards Update 2009-16 “Accounting for Transfers of Financial Assets” and the provisions of ASC 810 “Consolidation,” as amended by Accounting Standards Update 2009-17 “Improvements to Financial Reporting by Enterprises involved with Variable Interest Entities.”
-3-
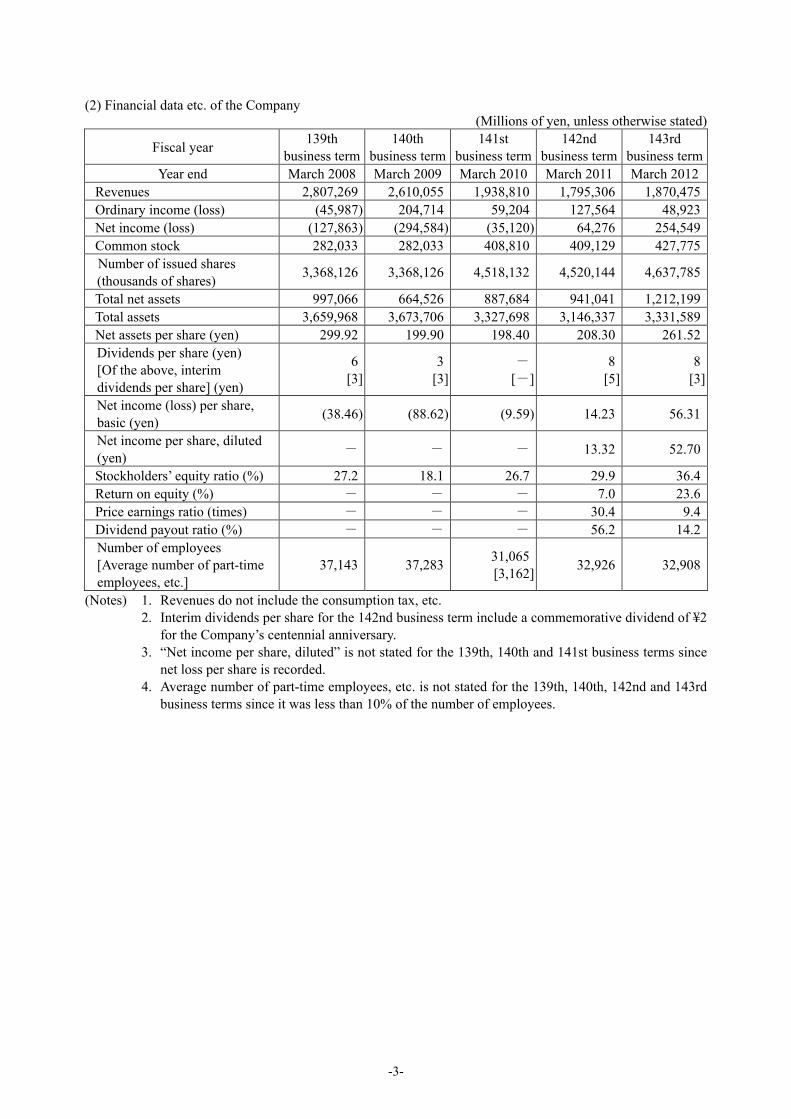
(2) Financial data etc. of the Company
(Millions of yen, unless otherwise stated)
Fiscal year 139th
business term140th
business term141st
business term142nd
business term 143rd
business termYear end March 2008 March 2009 March 2010 March 2011 March 2012
Revenues 2,807,269 2,610,055 1,938,810 1,795,306 1,870,475Ordinary income (loss) (45,987) 204,714 59,204 127,564 48,923Net income (loss) (127,863) (294,584) (35,120) 64,276 254,549Common stock 282,033 282,033 408,810 409,129 427,775Number of issued shares (thousands of shares)
3,368,126 3,368,126 4,518,132 4,520,144 4,637,785
Total net assets 997,066 664,526 887,684 941,041 1,212,199Total assets 3,659,968 3,673,706 3,327,698 3,146,337 3,331,589Net assets per share (yen) 299.92 199.90 198.40 208.30 261.52Dividends per share (yen) [Of the above, interim dividends per share] (yen)
6[3]
3[3]
-[-]
8 [5]
8[3]
Net income (loss) per share, basic (yen)
(38.46) (88.62) (9.59) 14.23 56.31
Net income per share, diluted (yen)
- - - 13.32 52.70
Stockholders’ equity ratio (%) 27.2 18.1 26.7 29.9 36.4Return on equity (%) - - - 7.0 23.6Price earnings ratio (times) - - - 30.4 9.4Dividend payout ratio (%) - - - 56.2 14.2Number of employees [Average number of part-time employees, etc.]
37,143 37,28331,065[3,162]
32,926 32,908
(Notes) 1. Revenues do not include the consumption tax, etc. 2. Interim dividends per share for the 142nd business term include a commemorative dividend of ¥2
for the Company’s centennial anniversary. 3. “Net income per share, diluted” is not stated for the 139th, 140th and 141st business terms since
net loss per share is recorded. 4. Average number of part-time employees, etc. is not stated for the 139th, 140th, 142nd and 143rd
business terms since it was less than 10% of the number of employees.
-4-
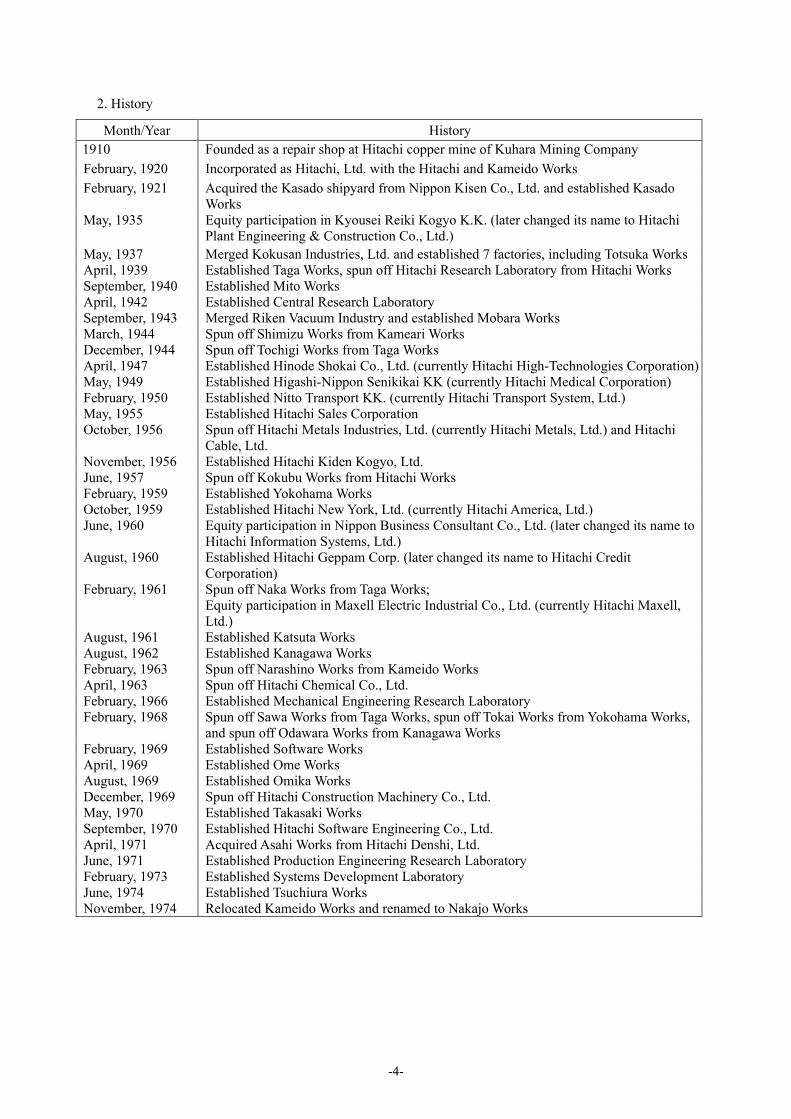
2. History
Month/Year History 1910 Founded as a repair shop at Hitachi copper mine of Kuhara Mining Company
February, 1920 Incorporated as Hitachi, Ltd. with the Hitachi and Kameido Works
February, 1921 Acquired the Kasado shipyard from Nippon Kisen Co., Ltd. and established Kasado Works
May, 1935 Equity participation in Kyousei Reiki Kogyo K.K. (later changed its name to Hitachi Plant Engineering & Construction Co., Ltd.)
May, 1937 Merged Kokusan Industries, Ltd. and established 7 factories, including Totsuka Works April, 1939 Established Taga Works, spun off Hitachi Research Laboratory from Hitachi Works September, 1940 Established Mito Works April, 1942 Established Central Research Laboratory September, 1943 Merged Riken Vacuum Industry and established Mobara Works March, 1944 Spun off Shimizu Works from Kameari Works December, 1944 Spun off Tochigi Works from Taga Works April, 1947 Established Hinode Shokai Co., Ltd. (currently Hitachi High-Technologies Corporation)May, 1949 Established Higashi-Nippon Senikikai KK (currently Hitachi Medical Corporation) February, 1950 Established Nitto Transport KK. (currently Hitachi Transport System, Ltd.) May, 1955 Established Hitachi Sales Corporation October, 1956 Spun off Hitachi Metals Industries, Ltd. (currently Hitachi Metals, Ltd.) and Hitachi
Cable, Ltd. November, 1956 Established Hitachi Kiden Kogyo, Ltd. June, 1957 Spun off Kokubu Works from Hitachi Works February, 1959 Established Yokohama Works October, 1959 Established Hitachi New York, Ltd. (currently Hitachi America, Ltd.) June, 1960 Equity participation in Nippon Business Consultant Co., Ltd. (later changed its name to
Hitachi Information Systems, Ltd.) August, 1960 Established Hitachi Geppam Corp. (later changed its name to Hitachi Credit
Corporation) February, 1961 Spun off Naka Works from Taga Works; Equity participation in Maxell Electric Industrial Co., Ltd. (currently Hitachi Maxell,
Ltd.) August, 1961 Established Katsuta Works August, 1962 Established Kanagawa Works February, 1963 Spun off Narashino Works from Kameido Works April, 1963 Spun off Hitachi Chemical Co., Ltd. February, 1966 Established Mechanical Engineering Research Laboratory February, 1968 Spun off Sawa Works from Taga Works, spun off Tokai Works from Yokohama Works,
and spun off Odawara Works from Kanagawa Works February, 1969 Established Software Works April, 1969 Established Ome Works August, 1969 Established Omika Works December, 1969 Spun off Hitachi Construction Machinery Co., Ltd. May, 1970 Established Takasaki Works September, 1970 Established Hitachi Software Engineering Co., Ltd. April, 1971 Acquired Asahi Works from Hitachi Denshi, Ltd. June, 1971 Established Production Engineering Research Laboratory February, 1973 Established Systems Development Laboratory June, 1974 Established Tsuchiura Works November, 1974 Relocated Kameido Works and renamed to Nakajo Works

-5-
Month/Year History
June, 1982 Established Hitachi Europe Ltd. April, 1985 Established Advanced Research Laboratory February, 1989 Established Hitachi Asia Pte. Ltd. (currently Hitachi Asia Ltd.) February, 1991 Integrated Sawa Works into Automotive Products Division August, 1991 Integrated Katsuta Works into Materials Process Technology Division; integrated
Totsuka Works into Information & Telecommunication Division; integrated Naka Works into Instruments Division
February, 1992 Integrated Yokohama Works and Tokai Works into AV Products Division August, 1992 Changed operation unit of home appliances, computers and electronic devices
businesses from factory to business division February, 1993 Integrated Semiconductor Technology Development Center, Musashi Works and
Takasaki Works into Semiconductor Division August, 1993 Integrated Shimizu Works into Air Conditioning Division, integrated Nakajo Works and
Narashino Works into Industrial Equipment Division August, 1994 Integrated Consumer Products Group and Image & Information Media Division and
renamed to Consumer Products & Information Media Systems Group October, 1994 Established Hitachi (China), Ltd. February, 1995 Reorganized business groups as Power & Industrial Systems Group, Consumer Products
& Information Media Systems Group, Information Systems Group and Electronics Components Group; integrated a part of R&D division and sales division into the business groups
April, 1995 Merged Hitachi Sales Corporation April, 1999 Reorganized business groups into de facto companies to independently operate each
business group October, 2000 Merged Hitachi Credit Corporation with Hitachi Leasing Corp. and changed its name to
Hitachi Capital Corporation October, 2001 Split Instruments Group and Semiconductor Manufacturing Equipment Group via
company split and reorganized as Hitachi High-Technologies Corporation; Split Industrial Machinery Systems Division via company split and reorganized as Hitachi Industries Co., Ltd.
April, 2002 Split Home Appliance Group via company split and reorganized as Hitachi Home & Life Solutions, Inc.;
Split Industrial Equipment Group via company split and reorganized as Hitachi Industrial Equipment Systems Co., Ltd.
October, 2002 Split Display Group via company split and established Hitachi Displays, Ltd.; Split Telecommunication Equipment Division via company split and reorganized as
Hitachi Communication Technologies, Ltd.; Turned Unisia Jecs Corporation (later changed its name to Hitachi Unisia Automotive,
Ltd.) into a wholly owned subsidiary via share exchange January, 2003 Acquired HDDs business from IBM Corp., and commenced operations as Hitachi
Global Storage Technologies Netherlands B.V. April, 2003 Split semiconductor business, centering on system LSIs, via company split and
established Renesas Technology Corp. (later merged with NEC Electronics Corporation and changed its name to Renesas Electronics Corporation)
June, 2003 Adopted committee system as the Company’s corporate governance structure October, 2004 Merged TOKICO, Ltd. and Hitachi Unisia Automotive, Ltd.; Split Mechatronics System Division, centering on ATMs, via company split and
established Hitachi-Omron Terminal Solutions, Corp.

-6-
Month/Year History
April, 2006 Split Social & industrial infrastructure business via company split and integrated with Hitachi Plant Engineering & Construction Co., Ltd., Hitachi Kiden Kogyo, Ltd. and Hitachi Industries Co., Ltd. and reorganized as Hitachi Plant Technologies, Ltd.;
Merged Hitachi Home & Life Solutions, Inc. with Hitachi Air Conditioning Systems Co., Ltd. and changed its name to Hitachi Appliances, Inc.
December, 2006 Turned Clarion Co., Ltd. into a consolidated subsidiary via tender offer July, 2007 Split nuclear power systems business via company split and reorganized as Hitachi-GE
Nuclear Energy, Ltd. March, 2009 Turned Hitachi Koki Co., Ltd. into a consolidated subsidiary via tender offer; Turned Hitachi Kokusai Electric Inc. into a consolidated subsidiary via tender offer July, 2009 Merged Hitachi Communication Technologies, Ltd.; Split Automotive Systems Group via company split and established Hitachi Automotive
Systems, Ltd.; Split Consumer Business Group via company split and established Hitachi Consumer
Electronics Co., Ltd. October, 2009 Reorganized business groups into in-house companies with independent accounting to
promote quick business operation February, 2010 Turned Hitachi Information Systems, Ltd., Hitachi Software Engineering Co, Ltd. and
Hitachi Systems & Services, Ltd. into wholly owned subsidiaries April, 2010 Turned Hitachi Plant Technologies, Ltd. and Hitachi Maxell, Ltd. into wholly owned
subsidiaries via share exchanges October, 2010 Merged Hitachi Software Engineering Co., Ltd. with Hitachi Systems & Services, Ltd.
and changed its name to Hitachi Solutions, Ltd. November, 2011 Merged Hitachi Electronics Services Co., Ltd. with Hitachi Information Systems, Ltd.
and changed its name to Hitachi Systems, Ltd. March, 2012 Transferred HDDs business to Western Digital Corporation via share sale of Viviti
Technologies Ltd., a holding company for Hitachi Global Storage Technologies Inc., etc. Transferred small and medium-sized displays business via share sale of Hitachi
Displays, Ltd.
3. Description of Business
The Company’s consolidated financial statements have been prepared in conformity with accounting principles generally accepted in the United States, and affiliates are disclosed based on the definitions of those accounting principles. The same applies to “II. Business Overview” and “III. Equipment and Facilities.”
The Hitachi Group, which is comprised of the Company and 1,122 affiliates (939 consolidated
subsidiaries (including variable interest entities) and 183 equity-method affiliates, while consolidated trust accounts are not included in the number of consolidated subsidiaries), engages in a broad range of business activities, from product development and manufacturing to sales and services, in 11 segments of Information & Telecommunication Systems, Power Systems, Social Infrastructure & Industrial Systems, Electronic Systems & Equipment, Construction Machinery, High Functional Materials & Components, Automotive Systems, Components & Devices, Digital Media & Consumer Products, Financial Services, and Others. Effective from April 1, 2011, the battery business for automotive applications, which was previously included in the Components & Devices segment, has been included in the Automotive Systems segment.
Major business outline for each segment and the positioning of principal affiliated companies are described as follows. The Company mainly engages in manufacturing and sales of products and providing services in the segments of Information & Telecommunication Systems, Power Systems, and Social Infrastructure & Industrial Systems.

(As of March 31, 2012)
Main products and services Positioning of principal affiliated companies
Manufacturing Sales and services Information & Telecommunication Systems
Systems Integration, Outsourcing Services, Software, Disk Array Subsystems, Servers, Mainframes, Telecommunications Equipment, ATMs
[Consolidated subsidiaries] Hitachi-Omron Terminal Solutions, Corp. Hitachi Computer Products (America), Inc. Hitachi Computer Products (Europe) S.A.S.
[Consolidated subsidiaries] Hitachi Information & Control Solutions, Ltd. Hitachi Solutions, Ltd. Hitachi Systems, Ltd. Hitachi Consulting Corporation Hitachi Data Systems Corporation Hitachi Information & Telecommunication Systems Global Holding Corporation
Power Systems Thermal, Nuclear, Hydroelectric and Wind Power Generation Systems
[Consolidated subsidiaries] Babcock-Hitachi Kabushiki Kaisha Hitachi-GE Nuclear Energy, Ltd.
[Equity-method affiliates] Japan AE power Systems Corporation
[Consolidated subsidiaries] Hitachi Engineering & Services Co., Ltd. Hitachi Power Europe GmbH Hitachi Power Systems America, Ltd.
Social Infrastructure & Industrial Systems Industrial Machinery and Plants, Elevators, Escalators, Railway Systems
[Consolidated subsidiaries] Hitachi Industrial Equipment Systems Co., Ltd. Hitachi Elevator (China) Co., Ltd.
[Consolidated subsidiaries] Hitachi Building Systems Co., Ltd. Hitachi Plant Technologies, Ltd.
Electronic Systems & Equipment Semiconductor and LCDs Manufacturing Equipment, Test and Measurement Equipment, Medical Electronics Equipment, Power Tools, Electronic Parts Manufacturing Systems
[Consolidated subsidiaries] Hitachi High-Technologies Corporation Hitachi Koki Co., Ltd. Hitachi Kokusai Electric Inc. Hitachi Medical Corporation Hitachi Via Mechanics, Ltd.
Construction Machinery Hydraulic Excavators, Wheel Loaders, Mining Dump Trucks
[Consolidated subsidiaries] Hitachi Construction Machinery Co., Ltd.
High Functional Materials & Components Wires and Cables, Copper Products, Semiconductor and Display Related Materials, Circuit Boards and Materials, Specialty Steels, Magnetic Materials and Components, High Grade Casting Components and Materials
[Consolidated subsidiaries] Hitachi Cable, Ltd. Hitachi Chemical Co., Ltd. Hitachi Metals, Ltd.
Automotive Systems Engine Management Systems, Electric Powertrain Systems, Drive Control Systems, Car Information Systems
[Consolidated subsidiaries] Clarion Co., Ltd. Hitachi Automotive Systems, Ltd. Hitachi Automotive Systems Americas, Inc.
Components & Devices Information Storage Media, Batteries
[Consolidated subsidiaries] Hitachi Maxell, Ltd. Hitachi Maxell Energy, Ltd.
Digital Media & Consumer Products Optical Disk Drives, Flat-Panel TVs, LCD Projectors, Room Air Conditioners, Refrigerators, Washing Machines, Air-Conditioning Equipment
[Consolidated subsidiaries] Hitachi Appliances, Inc. Hitachi Consumer Electronics Co., Ltd. Hitachi Media Electronics Co., Ltd. Hitachi Consumer Products (Thailand), Ltd.
[Consolidated subsidiaries] Hitachi-LG Data Storage, Inc.
Financial Services Leasing, Loan Guarantees
[Consolidated subsidiaries] Hitachi Capital Corporation
Others Logistics, Property Management
[Consolidated subsidiaries] Chuo Shoji, Ltd. Hitachi Life, Ltd. Hitachi Transport System, Ltd. Hitachi America, Ltd. Hitachi Asia Ltd. Hitachi (China), Ltd. Hitachi Europe Ltd. Hitachi India Pvt. Ltd.
(Notes) 1. Hitachi America, Ltd., Hitachi Asia Ltd., Hitachi (China), Ltd., Hitachi Europe Ltd. and Hitachi India Pvt. Ltd. are the Hitachi Group’s regional supervising company for the U.S., Asia, China, Europe and India, and they sell the Hitachi Group’s products.
2. Hitachi Displays, Ltd., Hitachi Display Device (Suzhou) Co., Ltd., a consolidated subsidiary of Hitachi Displays, Ltd., and Viviti Technologies Ltd., which were classified in the Components & Devices segment, ceased to be consolidated subsidiaries of the Company in March 2012 due to selling their shares.
3. Chuo Shoji, Ltd. changed its name to Hitachi Urban Investment, Ltd. as of April 1, 2012.
-7-

-8-
4. Information on Affiliates
(1) Consolidated subsidiaries (As of March 31, 2012)
Company name Location Common stock Principal business
Ownership percentage of voting rights
(%)
Relationship
Hitachi Information & Control Solutions, Ltd.
Hitachi, Ibaraki 2,270
Information & Telecommunication Systems
100.0
The Company outsources development of information control systems, etc. The Company’s Directors, Executive Officers or employees concurrently hold position of directors or officers.
Hitachi-Omron Terminal Solutions, Corp.
Shinagawa-ku, Tokyo 8,500
Information & Telecommunication Systems
55.0
The Company purchases ATMs and other information equipment. The Company’s Directors, Executive Officers or employees concurrently hold position of directors or officers.
Hitachi Solutions, Ltd.
Shinagawa-ku, Tokyo 38,372
Information & Telecommunication Systems
100.0
The Company outsources development of information systems and software, etc. The Company’s Directors, Executive Officers or employees concurrently hold position of directors or officers.
Hitachi Systems, Ltd.
Shinagawa-ku, Tokyo 19,162
Information & Telecommunication Systems
100.0
The Company outsources calculation, development of software, installation and maintenance of telecommunication equipment and computers. The Company’s Directors, Executive Officers or employees concurrently hold position of directors or officers.
Hitachi Computer Products (America), Inc.
Oklahoma, U.S.A.
(Thousands of US dollars)
14,000
Information & Telecommunication Systems
[100.0]100.0
The Company supplies parts for computer peripherals. The Company’s Directors, Executive Officers or employees concurrently hold position of directors or officers.

-9-
(As of March 31, 2012)
Company name Location Common stock Principal business
Ownership percentage of voting rights
(%)
Relationship
Hitachi Computer Products (Europe) S.A.S.
Ardon, France
(Thousands of Euro)
15,245
Information & Telecommunication Systems
100.0
The Company supplies parts for computer peripherals. The Company’s Directors, Executive Officers or employees concurrently hold position of directors or officers.
Hitachi Consulting Corporation
Texas, U.S.A.
(Thousands of US dollars) 415,599
Information & Telecommunication Systems
[99.5] 99.5
The Company outsources consulting services. The Company’s Directors, Executive Officers or employees concurrently hold position of directors or officers.
**Hitachi Data Systems Corporation
California, U.S.A.
(Thousands of US dollars) 531,651
Information & Telecommunication Systems
[100.0] 100.0
Sales company for the Company’s disk array subsystems, etc. The Company’s Directors, Executive Officers or employees concurrently hold position of directors or officers.
**Hitachi Information & Telecommunication Systems Global Holding Corporation
California, U.S.A.
(Thousands of US dollars) 599,380
Information & Telecommunication Systems
100.0
Holding company for Hitachi Consulting Corporation and Hitachi Data Systems Corporation. The Company’s Directors, Executive Officers or employees concurrently hold position of directors or officers.
Babcock-Hitachi Kabushiki Kaisha
Chiyoda-ku, Tokyo 5,000 Power Systems 100.0
The Company purchases boilers, environment-related equipment, etc. The Company’s Directors, Executive Officers or employees concurrently hold position of directors or officers.
Hitachi Engineering & Services Co., Ltd.
Hitachi, Ibaraki 1,950 Power Systems 100.0
The Company purchases power plant parts, and outsources maintenance of power generation equipment and control equipment, etc. The Company’s Directors, Executive Officers or employees concurrently hold position of directors or officers.

-10-
(As of March 31, 2012)
Company name Location Common stock Principal business
Ownership percentage of voting rights
(%)
Relationship
Hitachi-GE Nuclear Energy, Ltd.
Hitachi, Ibaraki 5,000 Power Systems 80.0
The Company delivers nuclear power generation equipment, etc. The Company’s Directors, Executive Officers or employees concurrently hold position of directors or officers.
Hitachi Power Europe GmbH
Duisburg, Germany
(Thousands of EURO)
182,000Power Systems [40.0]
100.0
The Company delivers thermal power generation equipment, etc. The Company’s Directors, Executive Officers or employees concurrently hold position of directors or officers.
Hitachi Power Systems America, Ltd.
New Jersey, U.S.A.
(Thousands of US dollars)
10,000Power Systems [100.0]
100.0
The Company delivers thermal power generation equipment, etc. The Company’s Directors, Executive Officers or employees concurrently hold position of directors or officers.
Hitachi Building Systems Co., Ltd.
Chiyoda-ku, Tokyo 5,105
Social Infrastructure & Industrial Systems
100.0
Sales, installation and maintenance of the Company’s elevators and escalators. The Company’s Directors, Executive Officers or employees concurrently hold position of directors or officers.
Hitachi Industrial Equipment Systems Co., Ltd.
Chiyoda-ku, Tokyo 10,000
Social Infrastructure & Industrial Systems
100.0
The Company purchases motors, pumps and other industrial equipment. The Company’s Directors, Executive Officers or employees concurrently hold position of directors or officers.
Hitachi Plant Technologies, Ltd.
Toshima-ku, Tokyo 12,000
Social Infrastructure & Industrial Systems
100.0
The Company purchases pumps, cranes and other industrial equipment, and outsources plant construction. The Company’s Directors, Executive Officers or employees concurrently hold position of directors or officers.

-11-
(As of March 31, 2012)
Company name Location Common stock Principal business
Ownership percentage of voting rights
(%)
Relationship
Hitachi Elevator (China) Co., Ltd.
Guangzhou, China
(Thousands of yuan)
538,806
Social Infrastructure & Industrial Systems
[70.0]70.0
Manufacturing, sales, installation and maintenance of the Company’s elevators and escalators in China. The Company’s Directors, Executive Officers or employees concurrently hold position of directors or officers.
*Hitachi High-Technologies Corporation
Minato-ku, Tokyo 7,938 Electronic Systems
& Equipment 51.8
The Company sells information equipment, etc. and purchases parts for information equipment and power-related parts through this company. The Company’s Directors, Executive Officers or employees concurrently hold position of directors or officers.
*Hitachi Koki Co., Ltd.
Minato-ku, Tokyo 17,813 Electronic Systems
& Equipment [10.9]51.2
The Company’s Directors, Executive Officers or employees concurrently hold position of directors or officers.
*Hitachi Kokusai Electric Inc.
Chiyoda-ku, Tokyo 10,058 Electronic Systems
& Equipment [0.0]52.4
The Company purchases electronic equipment and parts, etc. The Company’s Directors, Executive Officers or employees concurrently hold position of directors or officers.
*Hitachi Medical Corporation
Chiyoda-ku, Tokyo 13,884 Electronic Systems
& Equipment [0.0]63.2
The Company supplies parts for medical equipment. The Company’s Directors, Executive Officers or employees concurrently hold position of directors or officers.
Hitachi Via Mechanics, Ltd.
Ebina, Kanagawa 2,900 Electronic Systems
& Equipment 100.0
The Company’s Directors, Executive Officers or employees concurrently hold position of directors or officers.
** *Hitachi Construction Machinery Co., Ltd.
Bunkyo-ku, Tokyo 81,576 Construction
Machinery [0.6]51.7
The Company’s Directors, Executive Officers or employees concurrently hold position of directors or officers.

-12-
(As of March 31, 2012)
Company name Location Common stock Principal business
Ownership percentage of voting rights
(%)
Relationship
*Hitachi Cable, Ltd.
Chiyoda-ku, Tokyo 25,948
High Functional Materials & Components
[0.1]52.8
The Company purchases wires and cables, etc. The Company’s Directors, Executive Officers or employees concurrently hold position of directors or officers.
*Hitachi Chemical Co., Ltd.
Shinjuku-ku, Tokyo 15,454
High Functional Materials & Components
[0.1]51.4
The Company purchases electronic materials, organic chemical materials, etc. The Company’s Directors, Executive Officers or employees concurrently hold position of directors or officers.
*Hitachi Metals, Ltd.
Minato-ku, Tokyo 26,283
High Functional Materials & Components
[0.6]55.7
The Company purchases specialty steels, etc. The Company’s Directors, Executive Officers or employees concurrently hold position of directors or officers.
*Clarion Co., Ltd. Chuo-ku, Saitama, Saitama
26,100 Automotive Systems 64.0
The Company supplies parts for car navigation systems, etc. The Company’s Directors, Executive Officers or employees concurrently hold position of directors or officers.
Hitachi Automotive Systems, Ltd.
Hitachinaka, Ibaraki 15,000 Automotive
Systems 100.0
The Company purchases parts for railway vehicles, etc. The Company’s Directors, Executive Officers or employees concurrently hold position of directors or officers.
Hitachi Automotive Systems Americas, Inc.
Kentucky, U.S.A.
(Thousands of US dollars)
86,278
Automotive Systems
[100.0]100.0
Manufacturing and sales company in North America for the Hitachi Group’s automotive systems products.
Hitachi Maxell, Ltd.
Ibaraki, Osaka 12,202 Components &
Devices 100.0
The Company purchases computer tapes and other information storage media, etc. The Company’s Directors, Executive Officers or employees concurrently hold position of directors or officers.

-13-
(As of March 31, 2012)
Company name Location Common stock Principal business
Ownership percentage of voting rights
(%)
Relationship
Hitachi Maxell Energy, Ltd.
Oyamazaki-cho, Kyoto 1,000 Components &
Devices 100.0
The Company’s Directors, Executive Officers or employees concurrently hold position of directors or officers.
Hitachi Appliances, Inc.
Minato-ku, Tokyo 20,000
Digital Media & Consumer Products
100.0
The Company purchases electronic parts, etc. The Company’s Directors, Executive Officers or employees concurrently hold position of directors or officers.
Hitachi Consumer Electronics Co., Ltd.
Chiyoda-ku, Tokyo 1,000
Digital Media & Consumer Products
100.0
Development, manufacturing and sales company for the Hitachi Group’s visual-related equipment, etc. The Company’s Directors, Executive Officers or employees concurrently hold position of directors or officers.
Hitachi-LG Data Storage, Inc.
Minato-ku, Tokyo 1,500
Digital Media & Consumer Products
51.0
Development and sales company for the Hitachi Group’s optical disk drives. The Company’s Directors, Executive Officers or employees concurrently hold position of directors or officers.
Hitachi Media Electronics Co., Ltd.
Oshu, Iwate 500Digital Media & Consumer Products
100.0
Development, manufacturing and sales company for the Hitachi Group’s optical disk drives equipment and TV parts, etc. The Company’s Directors, Executive Officers or employees concurrently hold position of directors or officers.
Hitachi Consumer Products (Thailand), Ltd.
Prachinburi, Thailand
(Thousands of Thai Baht)
2,472,000
Digital Media & Consumer Products
80.1
Manufacturing and sales company for the Hitachi Group’s refrigerators and washing machines, etc. in Thailand.

-14-
(As of March 31, 2012)
Company name Location Common stock Principal business
Ownership percentage of voting rights
(%)
Relationship
*Hitachi Capital Corporation
Minato-ku, Tokyo 9,983 Financial Services [2.1]
60.7
Leases manufacturing equipment, industrial equipment, office equipment, etc. to the Company, and engages in leasing and credit sales of the Company’s business equipment, etc. The Company’s Directors, Executive Officers or employees concurrently hold position of directors or officers.
Chuo Shoji, Ltd. Chiyoda-ku, Tokyo 2,000 Others 100.0
The Company outsources management of welfare facilities, etc. The Company’s Directors, Executive Officers or employees concurrently hold position of directors or officers.
Hitachi Life, Ltd. Hitachi, Ibaraki 1,000 Others [21.8]
100.0
The Company outsources management of welfare facilities, etc. The Company’s Directors, Executive Officers or employees concurrently hold position of directors or officers.
*Hitachi Transport System, Ltd.
Koto-ku, Tokyo 16,802 Others [5.7]
59.0
The Company outsources transportation and storage of products. The Company’s Directors, Executive Officers or employees concurrently hold position of directors or officers.
**Hitachi America, Ltd.
New York, U.S.A.
(Thousands of US dollars)
2,328,558Others 100.0
The Hitachi Group’s regional supervising company in Americas, and sells the Hitachi Group’s plant, industrial machinery, digital media-related products, etc. The Company’s Directors, Executive Officers or employees concurrently hold position of directors or officers.

-15-
(As of March 31, 2012)
Company name Location Common stock Principal business
Ownership percentage of voting rights
(%)
Relationship
Hitachi Asia Ltd. Singapore (Thousands of
Singapore dollars)67,000
Others 100.0
The Hitachi Group’s regional supervising company for Asia, and sells the Hitachi Group’s plants, industrial machinery, digital media-related products, etc. The Company’s Directors, Executive Officers or employees concurrently hold position of directors or officers.
Hitachi (China), Ltd.
Beijing, China
(Thousands of yuan)
1,684,893Others 100.0
The Hitachi Group’s regional supervising company for China, and sells the Hitachi Group’s plant, industrial machinery, digital media and information-related products, etc. The Company’s Directors, Executive Officers or employees concurrently hold position of directors or officers.
Hitachi Europe Ltd.
Maidenhead, U.K.
(Thousands of Sterling pounds)
133,485 Others 100.0
The Hitachi Group’s regional supervising company for Europe, and sells the Hitachi Group’s plants, computer-related products, digital media-related products, etc. The Company’s Directors, Executive Officers or employees concurrently hold position of directors or officers.
Hitachi India Pvt. Ltd.
New Delhi, India
(Thousands of Indian rupee)
308,969Others [100.0]
100.0
The Hitachi Group’s regional supervising company for India, and sells the Hitachi Group’s digital media-related products, etc. The Company’s Directors, Executive Officers or employees concurrently hold position of directors or officers.
Others - 893 companies - - - - -

-16-
(Notes) 1. The unit of amounts and currency shown in the “Common stock” column are in millions of yen, unless otherwise specified.
2. Companies with two asterisks (**) in the “Company name” column are specified subsidiaries. 3. Companies with one asterisk (*) in the “Company name” column submit Securities Registration
Statement or Annual Securities Report. 4. The name of segment in which the companies classified is shown in the “Principal business”
column. 5. The amounts in brackets in upper row of the “Ownership percentage of voting rights” column
represent the percentage of voting rights owned indirectly by subsidiaries, of the total ownership percentage.
6. Companies with negative net worth are shown below, along with the amount of liabilities in excess of assets. Hitachi Power Europe GmbH ¥32,568 million Hitachi Vehicle Energy, Ltd. ¥21,943 million Hitachi Plasma Display Limited ¥118,095 million
(2) Equity-method affiliates
(As of March 31, 2012)
Company name Location Common
stock Principal business
Ownership percentage of voting rights
(%)
Relationship
Japan AE power Systems Corporation
Minato-ku, Tokyo 10 Power Systems 50.0
The Company purchases facilities and equipment for power transmission and distribution. The Company’s Directors, Executive Officers or employees concurrently hold position of directors or officers.
*Renesas Electronics Corporation
Chiyoda-ku, Tokyo 153,255
Semiconductor development, design, manufacture, sales and services.
30.6
This company outsources R&D for semiconductors to the Company. The Company’s Directors, Executive Officers or employees concurrently hold position of directors or officers.
Others - 181 companies - - - - -
(Notes) 1. The unit of amounts and currency shown in the “Common stock” column are in millions of yen. 2. Companies with an asterisk (*) in the “Company name” column submit Securities Registration
Statement or Annual Securities Report. 3. The name of segment in which Japan AE Power Systems Corporation classified is shown in the
“Principal business” column. 4. On April 1, 2012, the joint venture relationship in the power transmission and distribution
business of Japan AE Power Systems Corporation has been dissolved and such business has been succeeded by the three companies, which were the parties in the joint venture agreement.

-17-
5. Employees (1) Consolidated basis
(As of March 31, 2012)
Name of segment Number of employees
Information & Telecommunication Systems
73,334 [15,015]
Power Systems 17,235 [4,710]
Social Infrastructure & Industrial Systems
41,136 [5,748]
Electronic Systems & Equipment 25,878
[-]
Construction Machinery 20,571
[-] High Functional Materials & Components
47,468 [-]
Automotive Systems 28,125
[-]
Components & Devices 3,998
[-]
Digital Media & Consumer Products 25,042
[12]
Financial Services 4,060
[-]
Others 33,473 [4,203]
Corporate (Head Office and others) 3,220
[3,220]
Total 323,540 [32,908]
(Notes) 1. In addition to those listed above, the average number of part-time employees for the fiscal year was 46,182.
2. The number in brackets in the lower row of the “Number of Employees” column is the number of employees of the Company included in each of the numbers in the upper row.
3. The total number of employees decreased by 38,205 persons during the fiscal year ended March 31, 2012 due primarily to sales of HDDs business and small and medium-sized displays business.
(2) The Company
(As of March 31, 2012) Number of employees Average age Average length of service Average annual salary
32,908 40.0 17.9 years ¥8,002,940 (Note) Average annual salary includes bonuses and extra wages.
(3) Relationship with labor union In the Hitachi Group, labor union is organized by each company. The Company’s labor union, Hitachi
Workers Union, is a member of the Japanese Electrical Electronic & Information Union. The relationship between management and labor unions is stable and smooth.

-18-
II. Business Overview
1. Summary of Business Results
See “7. Analyses of Consolidated Financial Position, Operating Results and Cash Flows.”
2. Production, Orders Received and Sales
The Hitachi Group does not present production and orders received in amount or volume terms for each segment since it produces and sells a wide variety of products, there are variety of specifications in same kinds of products and certain products are mass-produced.
Regarding sales, see “7. Analyses of Consolidated Financial Position, Operating Results and Cash Flows.”
3. Challenges Facing Hitachi Group (1) Business and Financial Position
In our future business environment, the recovery of global economy show signs of slowdown affected by sovereign debt crisis in some countries in Europe, and the capital investment and individual consumption doesn’t seem to rapidly recover. In addition, uncertainty of the market environment increases owing to the fluctuations of exchange rate and the price of oil and raw materials. On the other hand, the global demand for maintenance and update of social infrastructure and the reduction of environmental burdens is increasing, and its market is anticipated to continuously grow in the future.
In such situation, we aim to establish a stable and profitable business structure through the strengthening of the Social Innovation Business that provides highly sophisticated social infrastructure utilizing information and telecommunication systems technology, improving the management efficiency to stabilize profitability, and promoting global growth strategies. Furthermore, we will promote measures directed at recovering from the Great East Japan Earthquake. At the same time, we will utilize such experience to contribute to the development of social infrastructures worldwide.
Strengthening Our Social Innovation Business
Our Social Innovation Business mainly relates to the Information & Telecommunication Systems, Power Systems, Social Infrastructure & Industrial Systems and Construction Machinery segments, including businesses that integrate information and communication technology and social infrastructure, and the High Functional Materials & Components segment. We believe our Social Innovation Business will take advantage of our knowledge, experience and customer confidence, and exploit synergies across our information and telecommunication systems and social infrastructure businesses. In addition, when necessary and appropriate, we believe we can leverage our ability to build environmental systems by drawing on our advanced environmental technologies and experience. For example, in order to react the market’s needs which is various and rapidly changing, we have restructured the Hitachi Group’s management organizations. In addition, we focus additional attention on generating synergies and address issues that have group-wide implications, such as the adoption of a uniform advanced IT platform and coordinating production engineering, procurement and our brand to help in-house companies and group companies strengthen competitiveness by establishing Social Innovation Business Project Division, etc. Furthermore, we will focus our business resources, including capital expenditures and R&D investments, on our Social Innovation Business.
Improving the Management Efficiency to Stabilize Profitability
In order to stabilize profitability by improving the management efficiency, we continue to implement a variety of measures to reduce costs, including reorganizing our operation and production bases, reducing material procurement costs and centralize of indirect operations. For example, we are executing “the Hitachi Smart Transformation Project” promoting cost reductions by thoroughly overhauling our cost structure across the Group including procurement, production and administrative operations. In addition, we will continue to strengthen the financial position by implementing measures such as inventory management, reduction of working capital and reduction and efficiency of total assets.

-19-
Promotion of the Global Growth Strategies
In order to achieve global growth, we will develop a detailed strategy in each region via local leadership by strengthening our local corporate functions, including business planning and external relations. We will also work to cultivate and recruit human capital that can be utilized globally, throughout the Hitachi Group. In addition, we have established a position of Chief Executive Officer for Asia Pacific and will increase the investment in China and ASEAN countries, including Myanmar, Thailand, Indonesia and Vietnam, for which high levels of growth are expected.
(2) Fundamental Policy on the Conduct of Persons Influencing Decision on the Company’s Financial and
Business Policies The Group invests a great deal of business resources in fundamental research and in the development of
market-leading products and businesses that will bear fruit in the future, and realizing the benefits from these management policies requires that they be continued for a set period of time. For this purpose, the Company keeps its shareholders and investors well informed of not just the business results for each period but also of the Company’s business policies for creating value in the future.
The Company does not deny the significance of the vitalization of business activities and performance that can be brought about through a change in management control, but it recognizes the necessity of determining the impact on company value and the interests of all shareholders of the buying activities and buyout proposals of parties attempting to acquire a large share of stock of the Company or a Group company by duly examining the business description, future business plans, past investment activities, and other necessary aspects of such a party.
There is no party that is currently attempting to acquire a large share of the Company’s stocks nor is there a specific threat, neither does the Company intend to implement specified so-called anti-takeover measures in advance of the appearance of such a party, but the Company does understand that it is one of the natural duties bestowed upon it by the shareholders and investors to continuously monitor the state of trading of the Company’s stock and then to immediately take what the Company deems to be the best action in the event of the appearance of a party attempting to purchase a large share of the Company’s stock. In particular, together with outside experts, the Company will evaluate the buyout proposal of the party and hold negotiations with the buyer, and if the Company deems that said buyout will not maintain the Company’s value and is not in the best interest of the shareholders, then the Company will quickly determine the necessity, content, etc., of specific countermeasures and prepare to implement them. The same response will also be taken in the event a party attempts to acquire a large percentage of the shares of a Group company.
4. Risk Factors
We conduct business on a global scale across a broad range of business areas and utilize sophisticated, specialized technologies to carry out our operations. Therefore, we are exposed to risks attributable to the economic environment, risks inherent in individual industrial sectors and business lines and risks related to our operations. Investment in our securities also involves risks. The following risks are based on the assumption we consider reasonable as of the filing date of this report.
Risks Related to Operations
Economic Trends
Our business environment is influenced by conditions in the domestic and global economies. During the year ended March 31, 2012, the recovery of the global economy showed signs of slowing resulting from sovereign debt crisis in Greece and other parts of Europe. In Japan, the yen’s persisted strength against currencies such as the U.S. dollar and the euro has negatively affected and may continue to negatively affect corporate earnings and exports. Unemployment in Japan has remained at a relatively high level since early 2009, and chronic unemployment could negatively affect consumer spending and economic activity. Although, in terms of real GDP, the Japanese economy grew by 1.2%, or an annualized 4.7%, in the quarter ended March 31, 2012, such factors could diminish economic growth or result in a return to the contractions of recent years. The global economic recovery may also be harmed by sovereign debt crisis in Greece and other parts of Europe, which could cause instability of global capital markets and a further weakening of the euro against the yen, as well as the potential inability of emerging markets, including China, to maintain economic growth.

-20-
If the recent gradual recovery in global economic conditions is halted or reversed, our revenues may decrease, with a resultant adverse impact on our profitability.
Currency Exchange Rates Fluctuations
Since we conduct business in many foreign countries, the portion of our assets and liabilities denominated in various currencies is exposed to risks from fluctuations in foreign currency exchange rates. In addition, we sell products and purchase raw materials in local currencies, principally the U.S. dollar and the euro. Therefore, fluctuations in foreign currency exchange rates may result in lower revenues or higher costs in yen to us and thus affect our financial results, which are reported in Japanese yen. Our price competitiveness, and thus our financial results, may be harmed if we seek to increase prices in local currencies to compensate for lower revenues or to increase prices in yen to absorb the higher cost. While we take measures to reduce the risks from fluctuations in foreign currency exchange rates, such measures may only delay or temporarily mitigate the adverse impact of such fluctuations and may not be effective.
Access to Liquidity and Long-term Financing
Our primary sources of funds are cash flows from operations, borrowings from banks and other institutional lenders, and funding from capital markets, such as offerings of commercial paper and other debt securities, as well as equity securities. We need liquid funds to pay our operating expenses, the principal of and interest on our debt and dividends on our capital stock. We also need long-term financing to fund, among other things, capital expenditures and research and development expenses. We currently believe our cash flows from operations, borrowings from banks and other institutional lenders and funding from the capital markets can provide sufficient funding for our operations and other liquidity needs. However, a return to a global economic downturn could adversely affect our cash flows from operations, business results and financial condition and may adversely affect our credit ratings. If our ratings are downgraded, our ability to obtain additional financing on terms we consider favorable may be negatively affected.
Our reliance on banks and institutional lenders exposes us to risks related to rising interest rates, and we may need to increase our reliance on external sources of funding. An increased reliance on debt instruments may adversely affect our credit ratings, which might affect our ability to successfully obtain additional financing on terms we consider favorable. The inability to successfully obtain such financing may increase our financing costs, and therefore could adversely affect our financial condition and results of operations.
Furthermore, failure of one or more of our major lenders or a decision by one or more of them to change the terms and conditions of their loans or to stop lending to us could have an adverse effect on our access to funding.
Marketable Securities Risks
We invest in marketable securities to maintain or promote our business or other relationships with other companies. These marketable securities are exposed to the risk of declining stock market prices. Such declines may require that we write down equity securities that we hold. This may have an adverse effect on our financial condition and results of operations. Further, contractual and other obligations may require us to maintain our holdings of these securities despite declining share prices and this may lead to material losses.
Worsening of Business Performance of Equity Method Affiliates
We have a number of equity method affiliates. If one or more of these equity method affiliates records a loss during a given period, we must record that loss in a manner proportionate to our ownership interest in our consolidated financial statements. For example, we recognized equity in net loss of affiliated companies in the year ended March 31, 2012, primarily owing to significant net losses recorded by Renesas Electronics Corporation, our equity method affiliate. In addition, a decline in the fair value of our investments in our equity method affiliates below the carrying amount of the investments that is deemed other than temporary could require us to record an impairment loss.

-21-
Intense Competition
We are subject to intense competition in many of the markets in which we operate, and this may adversely affect our results of operations.
The industrial sectors and business lines in which we are engaged are experiencing increasingly intense competition. We compete with diverse competitors ranging from huge global corporations to specialized companies. Competitors are increasingly manufacturing products, including sophisticated electronic products, in low-cost jurisdictions. Low-cost manufacturing and the globalization of world markets have accelerated the commoditization of certain products, which has resulted in increasingly intense price competition for many of our products. Products which are facing intense price competition or decreases in prices include computer-related products, such as disk array subsystems and optical disk drives, semiconductors, digital media products, such as flat-panel TVs, and home appliances. To succeed in this competitive environment, we believe that our products and services must be price competitive. The commoditization of such products affects our ability to set prices for our products. If we are unable to charge comparable prices to those of our competitors, our competitiveness and overall profitability may be harmed. On the other hand, charging comparable prices to those of our competitors may require us to sell products at a loss. Our products must also be competitive in terms of engineering sophistication, quality and brand value. We must introduce our products and services to the markets in a timely manner. There can be no assurance that the products or services that we offer will be competitive. The failure of such products or services to be competitive may negatively affect our business results.
Rapid Technological Innovation
New technologies are rapidly emerging in the segments in which we do business, with the pace of technological innovation being especially notable in the fields of information systems, electronics and digital media. The development of new and advanced technologies, the continuous, timely and cost-effective incorporation of such technologies into products and services and the effective marketing of such products and services are indispensable to remaining competitive. While introducing such products and services requires a significant commitment to research and development, there can be no assurance that our research and development will be successful. Failure in our endeavors to develop and incorporate such advanced technologies into products and services in a timely manner, or to achieve market acceptance for such products and services, may negatively affect our business, financial condition and results of operations.
Estimates, Fluctuations in Cost and Cancellation of Long-term Contracts
We enter into a substantial number of long-term contracts, particularly in connection with the construction of nuclear, thermal and hydroelectric power plants. We use the percentage-of-completion method to recognize revenue from sales of tangible products under these long-term contracts. Under the percentage-of-completion method, we recognize revenue from a sale in an amount equal to estimated total revenue from the arrangement multiplied by the percentage that costs incurred to date bear to estimated total costs at completion based upon the most recently available information. The use of the percentage-of-completion method requires us to make significant assumptions about estimates of total contract costs, remaining costs to completion, total contract revenues, contract risks and other factors. We charge any anticipated losses on fixed price contracts to operations when we are able to estimate such losses. While we employ our best judgment based on available information, there can be no assurance that these estimates will, ultimately, prove to be correct. We regularly review these estimates and adjust them as we deem necessary. Fluctuations in costs can occur for a variety of reasons, many of which are beyond our control. In addition, we or our counterparties may cancel these contracts, which would require us to revise our initial assumptions regarding a particular contract, and may adversely affect our business, financial condition and results of operations.
Material and Component Procurement
Our manufacturing operations rely on third parties for supplies of materials, parts, components and services of adequate quality and quantity, delivered in a timely manner at a reasonable price. External suppliers may have other customers and may not have sufficient capacity to meet all of our needs during periods of excess demand. Shortages of materials, parts, components and services may cause a sharp rise in their prices. Prices of certain raw materials, parts and components that we purchase, such as petroleum
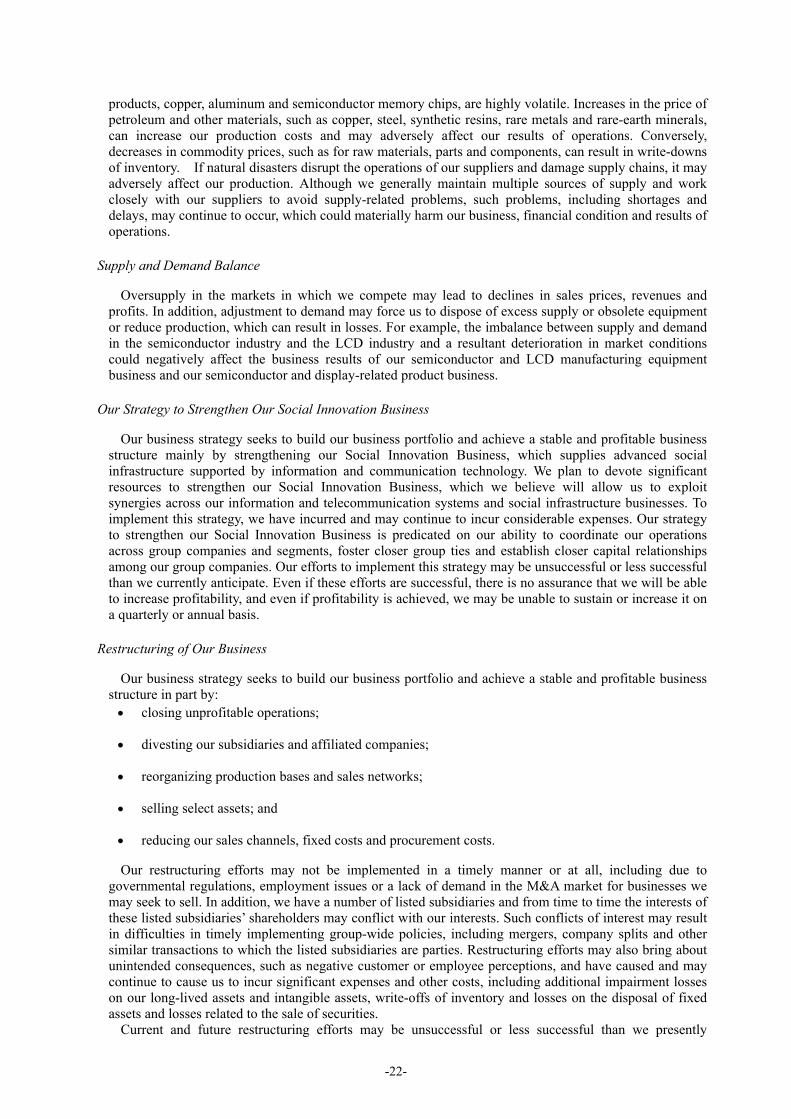
-22-
products, copper, aluminum and semiconductor memory chips, are highly volatile. Increases in the price of petroleum and other materials, such as copper, steel, synthetic resins, rare metals and rare-earth minerals, can increase our production costs and may adversely affect our results of operations. Conversely, decreases in commodity prices, such as for raw materials, parts and components, can result in write-downs of inventory. If natural disasters disrupt the operations of our suppliers and damage supply chains, it may adversely affect our production. Although we generally maintain multiple sources of supply and work closely with our suppliers to avoid supply-related problems, such problems, including shortages and delays, may continue to occur, which could materially harm our business, financial condition and results of operations.
Supply and Demand Balance
Oversupply in the markets in which we compete may lead to declines in sales prices, revenues and profits. In addition, adjustment to demand may force us to dispose of excess supply or obsolete equipment or reduce production, which can result in losses. For example, the imbalance between supply and demand in the semiconductor industry and the LCD industry and a resultant deterioration in market conditions could negatively affect the business results of our semiconductor and LCD manufacturing equipment business and our semiconductor and display-related product business.
Our Strategy to Strengthen Our Social Innovation Business
Our business strategy seeks to build our business portfolio and achieve a stable and profitable business structure mainly by strengthening our Social Innovation Business, which supplies advanced social infrastructure supported by information and communication technology. We plan to devote significant resources to strengthen our Social Innovation Business, which we believe will allow us to exploit synergies across our information and telecommunication systems and social infrastructure businesses. To implement this strategy, we have incurred and may continue to incur considerable expenses. Our strategy to strengthen our Social Innovation Business is predicated on our ability to coordinate our operations across group companies and segments, foster closer group ties and establish closer capital relationships among our group companies. Our efforts to implement this strategy may be unsuccessful or less successful than we currently anticipate. Even if these efforts are successful, there is no assurance that we will be able to increase profitability, and even if profitability is achieved, we may be unable to sustain or increase it on a quarterly or annual basis.
Restructuring of Our Business
Our business strategy seeks to build our business portfolio and achieve a stable and profitable business structure in part by: closing unprofitable operations;
divesting our subsidiaries and affiliated companies;
reorganizing production bases and sales networks;
selling select assets; and
reducing our sales channels, fixed costs and procurement costs.
Our restructuring efforts may not be implemented in a timely manner or at all, including due to governmental regulations, employment issues or a lack of demand in the M&A market for businesses we may seek to sell. In addition, we have a number of listed subsidiaries and from time to time the interests of these listed subsidiaries’ shareholders may conflict with our interests. Such conflicts of interest may result in difficulties in timely implementing group-wide policies, including mergers, company splits and other similar transactions to which the listed subsidiaries are parties. Restructuring efforts may also bring about unintended consequences, such as negative customer or employee perceptions, and have caused and may continue to cause us to incur significant expenses and other costs, including additional impairment losses on our long-lived assets and intangible assets, write-offs of inventory and losses on the disposal of fixed assets and losses related to the sale of securities.
Current and future restructuring efforts may be unsuccessful or less successful than we presently

-23-
anticipate and may adversely affect our financial condition and results of operations.
Cost Reduction Measures
We implemented “the Hitachi Smart Transformation Project”, which promotes cost reductions by thoroughly overhauling our cost structure across the Group including procurement, production and administrative operations. We seek to improve our management efficiency and stabilize earnings through the Project. The Project may be unsuccessful or less successful than we currently anticipate. Even if the Project is successful, there is no assurance that we will be able to increase profitability, and even if profitability is achieved, we may be unable to sustain or increase it on a quarterly or annual basis.
Our Overseas Growth Strategies
We seek to expand our business, including our Social Innovation Business, in overseas markets as part of our business strategy. Through such overseas expansion, we aim to increase our revenues, reduce our costs and improve profitability. In many of these markets, we face barriers in the form of long-standing relationships between our potential customers and their local suppliers. In addition, various factors in foreign countries where we operate may adversely affect our overseas business activities. These factors include: changes in regulations relating to investments, exports, tariffs, antitrust, anti-bribery, consumer and
business taxation, intellectual property, foreign trade and exchange controls, environmental and recycling requirements;
differences in commercial and business customs such as contract terms and conditions;
labor relations;
public sentiment against Japan; and
other political and social factors as well as economic trends and currency exchange rate fluctuations.
Because of these factors, there can be no assurance that we will be able to achieve all or any of the initial aims of our overseas growth strategy. This may adversely affect our business growth prospects and results of operations.
Acquisitions, Joint Ventures and Strategic Alliances
In every operating sector, we depend to some degree on acquisitions of other companies, joint ventures and strategic alliances with outside partners to design and develop key new technologies and products and to strengthen competitiveness. For example, integration of our affiliate, Renesas Technology, with NEC Electronics to form Renesas Electronics, the acquisition of BlueArc Corporation, an American network storage business company, consolidation of Aloka Co., Ltd. (currently Hitachi Aloka Medical, Ltd.) by Hitachi Medical Corporation and consolidation of Vantec Corporation by Hitachi Transport System, Ltd. Such transactions are inherently risky because of the difficulties in integrating operations, technologies, products and personnel. Integration issues are complex, time-consuming and expensive and, without proper planning and implementation, could adversely affect our business. Decisions made by or the performance of alliance partners that we cannot control or adverse business trends may also negatively affect the success of our alliances. We may incur significant acquisition, administrative and other costs in connection with these transactions, including costs related to integration or restructuring of acquired businesses. There can be no assurance that these transactions will be beneficial to our business or financial condition. Even assuming these transactions are beneficial, there can be no assurance that we will be able to successfully integrate acquired businesses or achieve all or any of the initial objectives of these transactions.
Intellectual Property
We depend in part on proprietary technology and our ability to obtain patents, licenses, trademarks and other forms of intellectual property rights covering our products, product design and manufacturing processes in Japan and other countries. The fact that we hold such intellectual property rights does not

-24-
ensure that they will provide a competitive advantage to us. Various parties may challenge, invalidate or circumvent our patents, trademarks and other intellectual property rights. There can be no assurance that claims allowed on any future patents will be sufficiently broad to protect our technology. Effective patent, copyright and trade secret protection may be unavailable or limited in some of the markets in which we operate, and our trade secrets may be vulnerable to disclosure or misappropriation by employees, contractors and other persons.
We design many of our products to include software or other intellectual property licenses from third parties. Competitors may not make their protected technology available to us, or may make it available to us only on unfavorable terms and conditions. There can be no assurance that we will be able to maintain a license for such intellectual property if obtained, for economic or other reasons, or that such intellectual property will give us the commercial advantages that we desire.
From time to time, we are sued or receive notices regarding patent and other intellectual property claims. Whether or not these claims have merit, they may require significant resources to defend against and may divert management attention from our business and operations and result in harm to our reputation. In addition, a successful infringement claim and our inability to obtain the license for the infringed technology or substitute similar non-infringing technology may adversely affect our business.
Litigation and Regulatory Investigations
We face risks of litigation and regulatory investigation and actions in connection with our operations. Lawsuits, including regulatory actions, may seek recovery of large, indeterminate amounts or otherwise limit our operations, and their existence and magnitude may remain unknown for substantial periods of time.
For example, in the past several years, we have been the subject of investigations of alleged antitrust violations in Japan, Europe and North America. In December 2006, we and one of our European subsidiaries received requests for information from the European Commission in respect of alleged antitrust violations relating to LCDs. In November 2007, one of our subsidiaries in the U.S. received a grand jury subpoena in connection with an investigation conducted by the Antitrust Division of the U.S. Department of Justice in respect of alleged antitrust violations relating to cathode ray tubes, or CRTs. In addition, in November 2007, subsidiaries of ours in Asia and Europe, received requests for information from the European Commission in respect of alleged antitrust violations relating to CRTs. Further, in November 2007, one of our Canadian subsidiaries received requests for information from the Canadian Competition Bureau in respect of alleged antitrust violations relating to CRTs. In July 2011, one of our Japanese subsidiaries and one of our Japanese affiliated companies received statements of objections from the European Commission in respect of alleged antitrust violations relating to high-voltage power cables. Also in July 2011, one of our Japanese subsidiaries was investigated by the Fair Trade Commission of Japan, one of our subsidiaries in the U.S. was investigated by and received a grand jury subpoena from the Antitrust Division of the U.S. Department of Justice, we and one of our European subsidiaries received requests for information from the European Commission, and one of our Canadian subsidiaries received requests for information from the Canadian Competition Bureau, all in respect of alleged antitrust violations relating to automotive equipment.
Relevant authorities in the markets in which we operate continue to investigate us and may initiate similar investigations in the future. These investigations may result in significant penalties in multiple jurisdictions, and we may become involved in disputes with private parties seeking compensation for damages resulting from the relevant violations. Such substantial legal liability or regulatory action could have a material adverse effect on our business, results of operations, financial condition, cash flows, reputation and credibility.
In addition, our business activities are subject to various governmental regulations in countries where we operate, which include investment approvals, export regulations, tariffs, antitrust, anti-bribery, intellectual property, consumer and business taxation, foreign trade and exchange controls, and environmental and recycling requirements. These regulations limit, and other new or amended regulations may further limit, our business activities or increase operating costs. In addition, the enforcement of such regulations, including the imposition of fines or surcharges for violation of such regulations, may adversely affect our results of operations, financial condition, cash flows, reputation and credibility.
Product Quality and Liability
We increasingly provide products and services utilizing sophisticated technologies, including but not limited to components of nuclear power stations. Reliance on external suppliers reduces our control over

-25-
quality assurance. There is a risk that defects may occur in our products and services. The occurrence of such defects could negatively affect our reputation for quality products, expose us to liability for damages caused by such defects and negatively affect our ability to sell certain products. A significant product defect could materially and adversely affect our results of operations, financial condition and future business prospects.
Risks of Natural Disasters and Similar Events
Portions of our facilities, including our research and development facilities, manufacturing facilities and our headquarters, are located in Japan. Historically, Japan has experienced numerous natural disasters such as earthquakes, tsunamis and typhoons. The Great East Japan Earthquake in March 2011 had a significantly adverse affect on an array of our corporate activities, from production to sales. We also have overseas facilities in Asia, the U.S. and Europe, which are also subject to similar events including the October 2011 flooding in Thailand. As a result of such flooding, we suffered damage to certain of our plants and offices in Thailand. The operations of our suppliers and customers were also adversely affected by the floods. Such significant natural disasters may directly damage or destroy our facilities, which could disrupt our operations, delay new production and shipments of existing inventory or result in costly repairs, replacements or other costs, all of which would result in significant losses. Furthermore, even if such significant natural disasters do not directly affect our facilities, they could result in disruptions in distribution channels or supply chains. The spread of infectious diseases, such as a new flu virus, may also disrupt our operations, render our employees unable to work, reduce consumer demand for our products or disrupt our supply and distribution channels. In addition, we are not insured against all potential losses, and even losses that insurance covers may not be fully covered and may be subject to challenges of or delays in payment. Direct and indirect disruption of our operations as a result of natural disasters or other events has had, and may continue to have, a negative impact on our operating activities, results of operations and financial condition.
Dependence on Information Systems
With the increased importance of information systems to our operating activities, disruptions in such systems due to computer viruses and other factors could have a negative impact on our operating activities, results of operations and financial condition.
Management of Confidential Information
We maintain and manage personal information obtained from our customers, as well as confidential information relating to our technology, research and development, or R&D, production, marketing and business operations and those of our customers and clients, in various forms. Although we have implemented controls to protect the confidentiality of such information, there can be no assurance that such controls will be effective. Unauthorized disclosures of such information could subject us to complaints or lawsuits for damages or could otherwise have a negative impact on our business, financial condition, results of operations, reputation and credibility.
Employee Retirement Benefits
We have a significant amount of employee retirement benefit costs that we derive from actuarial valuations based on a number of assumptions. Inherent in these valuations are key assumptions used in estimating pension costs including mortality, withdrawal and retirement rates, changes in wages, the discount rate and expected return on plan assets. We are required to make judgments regarding the key assumptions by taking into account various factors including personnel demographics, market conditions and expected trends in interest rates. Although management believes that its key assumptions are reasonable in light of the various underlying factors, there can be no assurance that the key assumptions will correspond to actual results. If our key assumptions differ from actual results, the consequent deviation of actual pension costs from estimated costs may have a material adverse effect on our financial condition and results of operations. A decrease in the discount rate may result in an increase in the amount of the actuarial loss which we amortize into income over the service lives of employees. In addition, we may change these key assumptions, such as the discount rate or the expected return on plan assets. Changes in key assumptions may also have a material adverse effect on our financial condition and results of operations.

-26-
Dependence on Specially Skilled Personnel
We believe we can continue to remain competitive only if we can maintain and secure additional people who are highly skilled in the fields of management and technology. However, the number of skilled personnel is limited and the competition for attracting and maintaining such personnel is intense. We cannot ensure that we will be able to successfully attract new or maintain our current skilled personnel.
Risks Related to Our American Depositary Shares
Rights of ADS holders
The rights of shareholders under Japanese law to take actions, including voting their shares, receiving dividends and distributions, bringing derivative actions, examining our accounting books and records and exercising appraisal rights are available only to shareholders of record. Because the depositary, through its custodian agents, is the record holder of the shares underlying the American Depositary Shares, or ADSs, only the depositary can exercise those rights in connection with the deposited shares. The depositary will make efforts to vote the shares underlying ADSs in accordance with the instructions of ADS holders and will pay dividends and distributions collected from us as and to the extent provided in the deposit agreement. However, ADS holders will not be able to bring derivative actions, examine our accounting books and records, or exercise appraisal rights through the depositary.
We are incorporated in Japan with limited liability. A significant portion of our assets are located outside the United States. As a result, it may be more difficult for investors to enforce against us judgments obtained in U.S. courts predicated upon the civil liability provisions of the federal securities laws of the United States or judgments obtained in other courts outside Japan. There is doubt as to the enforceability in Japanese courts, in original actions or in actions for enforcement of judgments of U.S. courts, of civil liabilities predicated solely upon the federal securities laws of the United States.
Unit Share System
The Companies Act allows companies to establish a “unit” of shares for the purpose of exercising voting rights at the general meetings of shareholders. Under our articles of incorporation, one unit of our shares is composed of 1,000 shares, equivalent to 100 ADSs. Each unit of our shares has one vote. A holder who owns shares or ADSs in other than multiples of 1,000 or 100, respectively, will own less than a whole unit (i.e., for the portion constituting fewer than 1,000 shares, or fewer than 100 ADSs). Our articles of incorporation, in accordance with the Companies Act, impose significant restrictions on the rights of holders of shares constituting less than a whole unit, which include restrictions on the right to vote, to attend a shareholders meeting and to bring derivative actions. In addition, less than whole unit shares cannot be traded on Japanese stock markets. Under the unit share system, holders of our shares constituting less than one unit have the right to require us to purchase their shares and the right to require us to sell them additional shares to create a whole unit of 1,000 shares. However, holders of our ADSs are unable to withdraw underlying shares representing less than one unit and, as a practical matter, are unable to require us to purchase those underlying shares. The unit share system, however, does not affect the transferability of ADSs, which may be transferred in lots of any number of whole ADSs.
Dilution of Your Shares by Issuances of Additional Shares
We may issue additional shares in the future within the unissued portion of our authorized share capital and sell shares held as treasury stock, generally without shareholder vote unless the subscription or sale price is significantly lower than the market price. Issuances and sales of our shares in the future may be at prices below the prevailing market prices and may be dilutive.
Foreign Exchange Fluctuations
Market prices for our ADSs may fall if the value of the yen declines against the U.S. dollar. In addition, the amount of cash dividends or other cash payments made to holders of ADSs will decline if the value of the yen declines against the dollar.

-27-
5. Material Agreements, etc. (1) As Licensee
Licensee Licensor CountryItem under
contract Contract
description Contract period
Hitachi, Ltd. (The Company)
General Electric Company
U.S.A. Gas turbines License of technology (Note 1)
From March 31, 2006 to March 30, 2016
Babcock-Hitachi Kabushiki Kaisha (Consolidated subsidiary)
Siemens AG Germany Boilers License of technology (Note 2)
From January 1, 1998 to December 31, 2013
(Notes) 1. A lump-sum payment has been made, and a certain percentage of sales of the item is paid as royalties.
2. A certain percentage based on the specifications of the item is paid as royalties.
(2) Cross License Agreement
Party Party CountryItem under
contract Contract
description Contract period
Hitachi, Ltd. (The Company)
International Business Machines Corp.
U.S.A. Information handling systems
Cross license of patents
From January 1, 2008 to the expiration of the patent under contracts
Hitachi, Ltd. (The Company)
Hewlett-Packard Co. U.S.A. All products and services
Cross license of patents
From March 31, 2010 to the expiration of patents applied on or before December 31, 2014
Hitachi, Ltd. (The Company)
EMC Corporation U.S.A. Information handling systems
Cross license of patents
From January 1, 2003 to the expiration of patents applied on or before December 31, 2002
Hitachi-GE Nuclear Energy, Ltd. (Consolidated subsidiary)
GE-Hitachi Nuclear Energy Americas LLC
U.S.A. Nuclear reactor systems
Cross license of patents and technology
From October 30, 1991 to April 30, 2016
(3) As Licensor
Licensor Licensee CountryItem under
contract Contract
description Contract period
Hitachi Metals, Ltd. (Consolidated subsidiary)
Magnequench Limited BarbadosRare earth magnets
License of patents (Note)
From August 10, 2007 to the expiration of the patents under contracts
(Note) A lump-sum payment has been received, and royalties are received in installments until the end of the contract period.

-28-
6. Research and Development
The Hitachi Group (the Company and consolidated subsidiaries) is conducting research and development activities in a broad range of fields, from information and telecommunications systems to financial services. The Hitachi Group places priority on allocating R&D resources on core businesses of the Group and make efforts for selecting R&D themes carefully and commercializing them quickly. Currently, in order to strengthen the global competitiveness of the Social Innovation Business, the Group is focusing on R&D activities to develop technologies combining social infrastructure with information and telecommunications systems, products and services to promote environmental operations and high functional materials. In addition, the Hitachi Group conducts advanced research to cultivate future core businesses.
The Hitachi Group also works to improve the efficiency of R&D through close coordination between the Company’s corporate research laboratories, development divisions at business departments and factories, and research laboratories of group companies. Furthermore, the Hitachi Group is actively expanding collaborations with universities and other research institutions as well as with outside firms.
The Company has established a new R&D framework to accelerate global growth through the Social Innovation Business. In order to support the global growth, it aims to promote R&D that can meet local needs quickly by expanding R&D facilities and personnel in China, Europe, the Americas, Asia and India and accelerating locally-led R&D. Three corporate research laboratories aim to promote integration of technologies from basic research to applied research, to create synergies by consolidating R&D in the social infrastructure field, and to combine enhanced efficiency in information technology research with manufacturing.
The Hitachi Group’s R&D expenditures for the fiscal year ended March 31, 2012 were ¥412.5 billion, 4.3% of revenues. A breakdown of R&D expenditures by segment is shown below.
(Billions of yen) Segment Amount
Information & Telecommunication Systems
87.9
Power Systems 16.5 Social Infrastructure & Industrial Systems
22.5
Electronic Systems & Equipment 47.3 Construction Machinery 16.4 High Functional Materials & Components
46.1
Automotive Systems 52.8 Components & Devices 70.1 Digital Media & Consumer Products 23.6 Financial Services 0.3 Others 4.5 Corporate Items 24.0
Total 412.5
Notable achievements of R&D activities in the fiscal year ended March 31, 2012 are as follows.
- Heat radiation technology for power modules which can develop smaller inverters for electric and
hybrid automobiles (Automotive Systems segment)
Power modules are the key components to electric and hybrid automobiles. We developed new technologies adopting an original water cooled system, which directly sends heat radiated from inverters into coolant and change heat radiation structure of power semiconductor devices from one-side to both-sides of them. This technology is anticipated to improve a cooling performance of power modules and downsize inverters for automobiles.

-29-
- Technologies for eco-friendly combustion of the next-generation coal fired power generations (Power Systems segment)
For Carbon Dioxide Capture and Storage and Integrated Coal Gasification Combined Cycle (CCS-ICGCC), we devised technologies that can reduce nitrogen oxide emissions without diluents regardless of the concentration of hydrogen, a main ingredient of fuel. Such achievement could be realized by a combination of a technology to safely and rapidly mix air and fuel and a technology to realize the stable combustion (This is an achievement of research and development activities entrusted by the New Energy and Industrial Technology Development Organization (NEDO) ).
- Digital watermark technologies which can restrain pirated copies of animations (Information &
Telecommunication Systems segment)
We developed embedded digital watermark technologies for securing animation data. If someone plays pirated copies of the original animation, warning messages embedded in an original animation is displayed on the screen utilizing aliasing effects caused by illegally copying with the reduced data size.
- Ultrasonic flaw detection test system which can display three dimensional images of internal part of
metals in short time (Power Systems segment)
We succeeded to develop technologies for ultrasonic flaw detection test systems to search internal flaws of metals by using reflection of ultrasonic beam. This technology can dramatically shorten the time that takes to display internal part of metals in three dimensional images and make it possible to find more imperceptible flaws by using more microscopic and powerful ultrasonic beam.
- Integrated railway systems simulator to globally promote railway systems business (Social
Infrastructure & Industrial Systems segment)
We developed an integrated railway systems simulator, which can evaluate and analyze overall railway systems including energy supply measure for railway systems and services which could differ according to countries and lines, passing through electrified and non-electrified zones and interactions and coordinated control between multiple railway sub-systems such as rolling stock, signaling, traffic control and power-feed equipment. We anticipate that this integrated railway systems simulator enables to provide customers with optimal proposals which meet the needs of local railway operators and match construction and maintenance plans for railway networks in diverse countries.

-30-
7. Analyses of Consolidated Financial Position, Operating Results and Cash Flows (1) Summary of Business Results, etc.
Economic Environment
We conduct business operations such as manufacturing, marketing, and research and development activities throughout the world. Therefore, the economic conditions in global markets where the Hitachi Group conducts business, in particular Japan, Asia, the Americas, and Europe, affect its results of operations. In the year ended March 31, 2012, the world economy showed slowed recovery due primarily to sovereign debt crises in some European countries and the impact of floods in Thailand which worsened in October 2011. Although the U.S. economy continued to moderately recover, the European economy was sluggish. The Chinese economy, which has developed at a higher rate of economic growth, experienced moderate domestic demand and decreased export due to monetary tightening policy of Chinese government. In addition, other emerging nations’ economies were stagnant, due mainly to decreased export and rising inflation. The Japanese economy gradually recovered in the latter half of the year ended March 31, 2012 as a result of increases in public investment, capital investment in the private sector and housing investment for post-quake reconstruction.
We conduct business in many foreign countries, and a portion of our assets and liabilities denominated in currencies other than the Japanese yen is exposed to risks from fluctuations in foreign currency exchange rates. In addition, we export products and import components and raw materials in local currencies, principally the U.S. dollar and the euro. Therefore, fluctuations in foreign currency exchange rates may affect our financial results, which are reported in Japanese yen. The Japanese yen on average strengthened against the U.S. dollar and the euro during the years ended March 31, 2012. We employ forward exchange contracts and cross-currency swap agreements to reduce the impact of foreign currency exchange rate fluctuations. In addition, to alleviate the adverse effects of foreign currency exchange rate fluctuations, when we believe it is appropriate, we seek to manufacture outside Japan and procure materials and parts locally. Business Strategy
We aim to achieve sustainable growth and establish a stable and profitable business structure by enhancing our competitiveness through promotion of our Social Innovation Business. Our Social Innovation Business mainly relates to the Information & Telecommunication Systems, Power Systems, Social Infrastructure & Industrial Systems and Construction Machinery segments, including businesses that integrate information and communication technology and social infrastructure, and the High Functional Materials & Components segment. We believe our Social Innovation Business will take advantage of our knowledge, experience and customer confidence, and exploit synergies across our information and telecommunication systems and social infrastructure businesses. In addition, when necessary and appropriate, we believe we can leverage our ability to build environmental systems by drawing on our advanced environmental technologies and experience. We aim to expand our Social Innovation Business globally, particularly in emerging countries and regions, by strengthening local leadership and by developing business strategy precisely responsive to local needs. Furthermore, we focus our business resources, including capital expenditures and R&D investments, on our Social Innovation Business. We also work to cultivate, recruit and promote human capital that can be utilized globally on a consolidated group-wide basis in order to facilitate the acceleration of our global business operations.
In order to enhance our competitiveness, we continue to strengthen our financial position, such as through optimization or integration of manufacturing bases throughout our consolidated group including a number of subsidiaries and affiliates, through highly effective asseting management and reduction of interest-bearing debt, and by thoroughly overhauling our cost structure including procurement costs and administrative operations.
In addition, in order to accelerate the promotion of our Social Innovation Business, we have restructured the Hitachi Group’s management organizations and our headquarters will take the lead on consolidated group-wide matters and integration of highly related businesses that are conducted by diverse divisions or in-house companies.

-31-
Business Reorganization
We continuously reorganize our business in order to further focus our business resources on the Social Innovation Business. The important business reorganizations conducted in the year ended March 31, 2012 are as follows:
In March 2012, we sold all shares of Viviti Technologies Ltd., the holding company of Hitachi Global Storage Technologies, Inc., which manufactures and sells HDDs, to Western Digital Corporation. The sale resulted in Viviti Technologies ceasing to be our subsidiary.
In March 2012, we sold all shares of Hitachi Displays, Ltd., a subsidiary engaged in our small- and medium-sized LCD panel business. The sale resulted in Hitachi Displays ceasing to be our subsidiary. Results of Operations
Effective from April 1, 2011, the battery business for automotive applications, which was previously included in the Components & Devices segment, has been included in the Automotive Systems segment. Figures for each segment, including figures for the year ended March 31, 2011, reflect the new segmentation.
Summary In the year ended March 31, 2012, total revenues increased 4% compared with the year ended March 31,
2011. Income before income taxes for the year ended March 31, 2012 increased ¥125.5 billion to ¥557.7 billion, as compared with the year ended March 31, 2011. This increase was due primarily to recording a net gain on securities. In the year ended March 31, 2012, net income attributable to Hitachi, Ltd. was ¥347.1 billion, an increase of ¥108.3 billion compared with the year ended March 31, 2011.
Analysis of Statement of Operations Our total revenues in the year ended March 31, 2012 increased 4% to ¥9,665.8 billion compared with
the year ended March 31, 2011. This increase was due primarily to increases in revenues in the Information & Telecommunication Systems, Automotive Systems and Others segments. An increase in revenues in the Information & Telecommunication Systems segment was mainly due to increase in services business, and an increase in revenues in the Automotive Systems segment was due to worldwide recovery of demand for automobiles. An increase in revenues in the Others segment was mainly the result of higher revenues at Hitachi Transport System, Ltd. owing to the effect of making Vantec Corporation a consolidated subsidiary in April 2011. This increase was partially offset by decreases in revenues in the Components & Devices, Digital Media & Consumer Products and Financial Services segments due mainly to decreases in demand. Our overseas revenues increased 2% to ¥4,131.4 billion in the year ended March 31, 2012, compared with the year ended March 31, 2011. This increase was due primarily to increased revenues in the Information & Telecommunication Systems segment owing to higher revenue from our storage solutions business mainly in the U.S. market, and to increase in revenues in the Automotive Systems segment owing mainly to improved demand for automotive equipment in overseas markets, in particular in the United States and emerging economies.
Our cost of sales in the year ended March 31, 2012 was ¥7,278.9 billion, an increase of 4% compared
with the year ended March 31, 2011. The ratio of cost of sales to total revenues was 75%, approximately the same as in the year ended March 31, 2011.
Our selling, general and administrative expenses in the year ended March 31, 2012 increased 4% to
¥1,974.6 billion compared with the year ended March 31, 2011. The ratio of selling, general and administrative expenses to total revenues was 20%, approximately the same as in the year ended March 31, 2011.
Impairment losses for long-lived assets decreased ¥3.3 billion to a total of ¥31.8 billion in the year
ended March 31, 2012, as compared with the year ended March 31, 2011. The High Functional Materials & Components segment recorded an impairment loss of ¥19.4 billion due primarily to restructuring of its semiconductor packaging materials business suffered by a decrease in demand of the market and integrating manufacturing facilities for electronics and IT devices. In addition, the Information & Telecommunication Systems segment recorded an impairment loss of ¥4.5 billion due primarily to restructuring of micro devices business as a result of lower-than-expected future income. The fair value estimates used to determine these losses were based primarily on discounted future cash flows.
-32-
Restructuring charges in the year ended March 31, 2012 increased ¥17.3 billion to ¥23.0 billion, as compared with the year ended March 31, 2011. The increase was due primarily to increases in special and one-time termination benefits. In the year ended March 31, 2012, special and one-time termination benefits was ¥22.9 billion, which mainly consisted of special termination benefits expensed for restructuring in order to rationalize the workforce of LCDs business in the Components & Devices segment and to reorganize wires, cables and other relevant business, which has encountered severe deterioration in the business environment, in the High Functional Materials & Components segment.
Interest income decreased ¥0.6 billion to ¥12.6 billion, as compared with the year ended March 31, 2011. Dividend income increased ¥1.3 billion to ¥5.5 billion, as compared with the year ended March 31,
2011. Other income, including net gain on securities and net gain on sale and disposal of rental assets and
other property, increased ¥159.1 billion to ¥228.9 billion, as compared with the year ended March 31, 2011. The increase was due primarily to an increase in a net gain on securities. In the year ended March 31, 2012, net gain on securities was ¥209.7 billion, an increase of ¥148.6 billion compared with the year ended March 31, 2011. This increase in net gain on securities consisted mainly of a gain from the sales of shares of Viviti Technologies Ltd. and Hitachi Displays, Ltd. Net gain on sale and disposal of rental assets and other property increased to ¥19.1 billion, compared with a net loss on sale and disposal of rental assets and other property of ¥3.1 billion in the year ended March 31, 2011.
Interest charges increased ¥3.2 billion to ¥28.1 billion, as compared with the year ended March 31, 2011. Other deductions decreased ¥10.5 billion to ¥3.0 billion, as compared with the year ended March 31,
2011. Equity in net loss of affiliated companies decreased ¥4.5 billion to ¥15.5 billion in the year ended March
31, 2012, as compared with the year ended March 31, 2011. This was due primarily to a decrease in the loss resulting from our interest in Renesas Electronics Corporation, our equity method affiliate in the semiconductor industry.
As a result of the foregoing, income before income taxes increased ¥125.5 billion to ¥557.7 billion, as
compared with the year ended March 31, 2011. Income taxes increased ¥15.8 billion to ¥144.9 billion, as compared with the year ended March 31, 2011.
The increase was due primarily to revisions of Japanese taxation for corporations. Net income increased ¥109.6 billion to ¥412.8 billion in the year ended March 31, 2012, as compared
with the year ended March 31, 2011. In the year ended March 31, 2012, net income attributable to noncontrolling interests was ¥65.6 billion,
an increase of ¥1.3 billion compared with the year ended March 31, 2011. As a result of foregoing, net income attributable to Hitachi, Ltd. increased ¥108.3 billion to ¥347.1
billion.
Operations by Segment
The following is an overview of results of operations by segment. Revenues for each segment include intersegment transactions.
(Information & Telecommunication Systems)
Revenues in the year ended March 31, 2012 were ¥1,764.2 billion, a 7% increase compared with the year ended March 31, 2011. The increase was due primarily to increased revenues from our domestic services business and increased revenues from software and services related to storage solutions and consulting

-33-
business in the overseas market. Revenues from hardware business were approximately the same as the year ended March 31, 2011.
Segment profit increased 3% compared with the year ended March 31, 2011, to ¥101.7 billion. This increase was due primarily to improvement in profitability of our hardware business owing to an increase in the number of projects with higher profitability in our telecommunication networks business. By contrast, profits from our services business were approximately the same as in the year ended March 31, 2011 owing to deterioration in its profitability, despite higher sales.
(Power Systems)
Revenues in the year ended March 31, 2012 were ¥832.4 billion, a 2% increase compared with the year ended March 31, 2011. The increase was due primarily to higher sales of thermal power generation systems in the domestic market and increased revenues from preventative maintenance services. This increase was partially offset by lower sales of nuclear power generation systems in the aftermath of the Great East Japan Earthquake.
Segment loss was ¥33.9 billion in the year ended March 31, 2012, a decrease of ¥56.0 billion compared with the year ended March 31, 2011. This return to a segment loss was due primarily to additional costs owing to defects in boiler materials and delays in progress in an overseas project for coal-fired power systems and to the effects of the Great East Japan Earthquake.
(Social Infrastructure & Industrial Systems)
Revenues in the year ended March 31, 2012 were ¥1,204.9 billion, a 4% increase compared with the year ended March 31, 2011. The increase was due primarily to increased revenue from plant-related equipment and construction owing to alleviation of the effects of the Great East Japan Earthquake and an increase in air conditioning system projects. The increase was also attributable to higher revenue from elevators and escalators in the overseas markets, particularly in China.
Segment profit increased 23% compared with the year ended March 31, 2011, to ¥49.1 billion. The increase was due primarily to increased revenues from plant-related equipment and construction and elevators and escalators. This increase was also attributable to cost reduction.
(Electronic Systems & Equipment)
Revenues in the year ended March 31, 2012 were ¥1,101.7billion, a 2% increase compared with the year ended March 31, 2011. The increase was due primarily to higher sales at Hitachi Medical Corporation resulting from consolidating Aloka Co., Ltd. (currently Hitachi Aloka Medical, Ltd.) in January 2011. The increase was partially offset by declined revenues from electronic parts manufacturing equipment.
Segment profit increased 34% compared with the year ended March 31, 2011, to ¥49.9 billion. The increase was due primarily to higher earnings at Hitachi Kokusai Electric Inc. resulting from business restructuring and to higher earnings at Hitachi Koki Co., Ltd. and Hitachi Medical Corporation, despite a decrease in profit of electronic parts manufacturing equipment due to decreased revenues.
(Construction Machinery)
Revenues in the year ended March 31, 2012 were ¥798.7 billion, a 6% increase compared with the year ended March 31, 2011. The increase was due primarily to increased revenues in the domestic market owing to demand from post-quake reconstruction. The increase was also attributable to higher sales from mining machinery and services and parts in resource-rich nations, mainly in Australia, and to increased revenues in the U.S. market, mainly in the lease industries. This increase was partially offset by decreased revenues in China due to lower demand for hydraulic excavators.
Segment profit increased 28% compared with the year ended March 31, 2011, to ¥63.1 billion. The increase was due primarily to improvement in profitability owing to increased sales of highly profitable services and parts, revision of sales prices, and cost reduction.
(High Functional Materials & Components)
Revenues in the year ended March 31, 2012 were ¥1,437.1 billion, a 2% increase compared with the year ended March 31, 2011. The increase was due primarily to increased revenues at Hitachi Metals, Ltd. owing to higher sales of automotive-related materials. The increase was also attributable to higher revenues at Hitachi

-34-
Cable, Ltd. mainly resulting from a change of fiscal year-end for some of its overseas subsidiaries. This increase was partially offset by lower sales at Hitachi Chemical Co., Ltd. due to lower demand for semiconductor- and LCD-related products and the impact of the Great East Japan Earthquake and floods in Thailand.
Segment profit decreased 9% compared with the year ended March 31, 2011, to ¥77.0 billion. The decrease was due primarily to decrease in profit at Hitachi Chemical owing to the decreased revenues and the impact of the Great East Japan Earthquake and floods in Thailand. This decrease was partially offset by improvement in profitability at Hitachi Metals due to increased revenues and by higher earnings at Hitachi Cable due to increased revenues and its restructuring effort.
(Automotive Systems)
Revenues in the year ended March 31, 2012 were ¥811.5 billion, a 10% increase compared with the year ended March 31, 2011. The increase was due primarily to an upturn in demand for automotive equipment reflecting a recovery in automobile production in Japan and strong demand for automotive equipment in the U.S. and emerging economies, despite the lasting effects of the Great East Japan Earthquake felt at the beginning of the year.
Segment profit increased 56% compared with the year ended March 31, 2011, to ¥37.0 billion. The increase was due primarily to improvement in profitability owing to an increase in the level of production activity in response to rising demand for automotive equipment and cost reduction.
(Components & Devices)
Revenues in the year ended March 31, 2012 were ¥768.0 billion, a 5% decrease compared with the year ended March 31, 2011. The decrease was due primarily to lower revenues from HDDs owing to a decrease in shipment volume, resulting from difficulties with procurement of parts stemming from the floods in Thailand and the Great East Japan Earthquake, and to the effects of the appreciation of the Japanese yen. The decrease was also attributable to lower revenues from our LCDs business due mainly to the effects of the Great East Japan Earthquake and the floods in Thailand.
Segment profit decreased 20% compared with the year ended March 31, 2011, to ¥39.4 billion. The decrease was due primarily to deterioration in profitability of our HDDs business owing to lower sales.
(Digital Media & Consumer Products)
Revenues in the year ended March 31, 2012 were ¥858.8 billion, a 10% decrease compared with the year ended March 31, 2011. The decrease was due primarily to decreased revenues from our optical disk drives business owing mainly to the effect of floods in Thailand and declining sales price levels. The decrease was also attributable to decreased revenues from our flat-panel TVs business resulting from lower demand and declining sales price levels. This decrease was partially offset by increased revenues from air-conditioning equipment in the domestic market, owing to demand generated by capital investment and post-quake reconstruction, and those in overseas markets, mainly China and Taiwan.
Segment loss in the year ended March 31, 2012 was ¥10.9 billion, a decrease of ¥25.8 billion as compared with the year ended March 31, 2011. This return to a segment loss was due primarily to significant deterioration in profitability owing to lower sales from flat-panel TVs and optical disk drives. The return was also attributable to posting losses for refrigerators, due mainly to rising price levels for raw materials, lower sales prices and the effect of floods in Thailand, and losses for room air conditioners owing to rising price levels for raw materials.
(Financial Services)
Revenues in the year ended March 31, 2012 were ¥353.2 billion, a 5% decrease compared with the year ended March 31, 2011. The decrease was due primarily to lower revenues from finance services business for domestic corporations at Hitachi Capital Corporation. The decrease was partially offset by higher revenues from the overseas business, in particular in Asia except Japan, at Hitachi Capital.
Segment profit increased 112% compared with the year ended March 31, 2011, to ¥30.2 billion. The increase was due primarily to reduced financing and credit costs.
-35-
(Others)
Revenues in the year ended March 31, 2012 were ¥951.6 billion, a 24% increase compared with the year ended March 31, 2011. The increase was due primarily to higher revenues at Hitachi Transport System, Ltd. owing to the effect of making Vantec Corporation a consolidated subsidiary in April 2011 and healthy growth in sales in third-party logistics solutions. As a result, segment profit increased 15% compared with the year ended March 31, 2011, to ¥33.2 billion.
Revenues by Geographic Area
The following is an overview of revenues attributed to geographic areas based on customer location. (Japan)
Revenues in Japan in the year ended March 31, 2012 were ¥5,534.4 billion, a 5% increase compared with the year ended March 31, 2011. The increase was due primarily to increased revenues in the Information & Telecommunication Systems, Power Systems and Construction Machinery segments. The increase was also attributable to increased revenues in the Others segment, resulting from higher revenues at Hitachi Transport System, Ltd. owing to the effect of making Vantec Corporation a consolidated subsidiary in April 2011 and to healthy growth in sales in third-party logistics solutions. The increase was partially offset by lower revenues in the Components & Devices segment due primarily to the effect of the Great East Japan Earthquake and floods in Thailand, and decreased revenues in the Digital Media & Consumer Products and Financial Services segments.
(Asia)
Revenues in Asia in the year ended March 31, 2012 were ¥2,000.9 billion, a 4% decrease compared with the year ended March 31, 2011. The decrease was due primarily to decreased revenues in the Construction Machinery, Components & Devices and Digital Media & Consumer Products segments. The decreased revenues in the Construction Machinery segment resulted from lower demand in China for hydraulic excavators. The decreased revenues in the Components & Devices segment mainly resulted from the effect of the floods in Thailand on our HDDs business. The decreased revenues in the Digital Media & Consumer Products segment resulted from lower sales of optical disk drive-related products. The decrease was partially offset by higher revenues mainly from elevators and escalators in the Social Infrastructure & Industrial Systems segment and increased revenues in the Automotive Systems segment.
(North America)
Revenues in North America in the year ended March 31, 2012 were ¥869.0 billion, an 11% increase compared with the year ended March 31, 2011. The increase was due primarily to increased revenues in the Information & Telecommunication Systems segment due primarily to higher sales for our storage solutions business. The increase was also attributable to increased revenues in the Electronic Systems & Equipment segment, in particular higher sales at Hitachi High-Technologies Corporation, and increased revenues in the Construction Machinery segment reflecting higher demand in the leasing industry.
(Europe)
Revenues in Europe in the year ended March 31, 2012 were ¥761.1 billion, which was almost the same level as in the year ended March 31, 2011. Revenues in the Electronic Systems & Equipment segment increased due primarily to the higher revenues at Hitachi High-Technologies Corporation and Hitachi Medical Corporation. Revenues in the Construction Machinery segment also increased, particularly in Russia. However, this increase was offset by lower sales from coal-fired power systems due primarily to delays in progress of a certain project.
(Other Areas)
Revenues in other areas in the year ended March 31, 2012 increased 16% to ¥500.2 billion due primarily to increased revenues in the Power Systems segment, in particular from coal-fired power generation systems in South Africa. The increase was also attributable to higher revenues in the Construction Machinery segment, mainly in Australia and Turkey.
-36-
(2) Summary of Financial Position, etc.
Liquidity and Capital Resources
Our management considers maintaining an appropriate level of liquidity and securing adequate funds for current and future business operations to be important financial objectives. Through efficient management of working capital and selective investment in new plants and equipment, we are working to optimize the efficiency of capital utilization throughout our business operations. We endeavor to improve our group cash management by centralizing such management among us and our overseas financial subsidiaries. Our internal sources of funds include cash flows generated by operating activities and cash on hand. Our management also considers short-term investments to be an immediately available source of funds. In addition, we raise funds both in the capital markets and from Japanese and international commercial banks in response to our capital requirements. Our management’s policy is to finance capital expenditures primarily by internally generated funds and to a lesser extent by funds raised through the issuance of debt and equity securities in domestic and foreign capital markets. In order to flexibly access funding, we maintain our shelf registration with the maximum outstanding balance of ¥300.0 billion.
As of March 31, 2012, we maintained commitment line agreements with a number of domestic banks under which we may borrow in order to ensure efficient access to necessary funds. These commitment line agreements generally provide for a one-year term, renewable upon mutual agreement between us and each of the lending banks, although we also maintained another commitment line agreement that will end in May 2013. These committed credit arrangements are, in general, subject to financial and other covenants and conditions both prior to and after drawdown, the most restrictive of which require maintenance of minimum issuer rating or long-term debt ratings from R&I of BBB or BBB-. As of March 31, 2012, our unused commitment lines totaled ¥506.1 billion, including these of ¥106.1 billion which our certain subsidiaries maintained.
Our debt ratings affect our ability to obtain short- and long-term financing. Our current debt ratings (long-term/short-term) are: A3/P-2 by Moody’s; BBB+/A-2 by S&P and A+/a-1 by R&I. With our current ratings, we believe that our access to the global capital markets will remain sufficient for our financing needs. We seek to improve our credit ratings in order to ensure financial flexibility for liquidity and capital management, and to continue to maintain access to sufficient funding resources through the capital markets. Cash Flows (Cash Flows from Operating Activities)
Net income amounted to ¥412.8 billion in the year ended March 31, 2012, an increase of ¥109.6 billion compared to the year ended March 31, 2011, due mainly to an increase in net gain on securities. Trade receivables increased by ¥259.2 billion in the year ended March 31, 2012 as compared to a decrease of ¥121.6 billion in the year ended March 31, 2011, due in part to the effects of the Great East Japan Earthquake and collateral events which caused delays in product shipment and delivery. An increase in payables of ¥47.5 billion in the year ended March 31, 2011 changed to an increase of ¥119.1 billion in the year ended March 31, 2012. As a result, the net cash provided by operating activities in the year ended March 31, 2012 decreased by ¥394.3 billion to ¥447.1 billion. (Cash Flows from Investing Activities)
A net sum of ¥403.3 billion in the year ended March 31, 2012 was recorded as investment related to property, plant and equipment, where the collection of investments in leases, the proceeds from disposal of property, plant and equipment and the proceeds from disposal of tangible assets and software to be leased were subtracted from the amount of the capital expenditures, the purchase of intangible assets and the purchase of tangible assets and software to be leased, an increase of ¥118.5 billion from the year ended March 31, 2011. In addition, purchase of investments in securities and shares of newly consolidated subsidiaries increased by ¥28.8 billion and amounted to ¥151.4 billion as a result of stock acquisition of Vantec Corporation and a network storage business entity in the U.S. Proceeds from sale of investments in securities and shares of consolidated subsidiaries resulting in deconsolidation increased by ¥183.0 billion and amounted to ¥331.0 billion owing to share transfer of Viviti Technologies Ltd. As a result, net cash used in investing activities in the year ended March 31, 2012 was ¥195.5 billion, a decrease of ¥64.7 billion from the year ended March 31, 2011. (Cash Flows from Financing Activities)
Net increase in short-term debt in the year ended March 31, 2012 was ¥70.1 billion due in part to the issuance of commercial paper in response to increased working capital. A net sum of ¥155.8 billion was recorded as payments related to long-term debt, where the proceeds from long-term debt were subtracted from
-37-
the payments on long-term debt, a decrease of ¥455.1 billion from the year ended March 31, 2011. As a result, net cash used in financing activities in the year ended March 31, 2012 was ¥167.8 billion, a decrease of ¥416.3 billion from the year ended March 31, 2011.
As a result of the above items, in the year ended March 31, 2012, cash and cash equivalents increased ¥64.7 billion, to ¥619.5 billion from the year ended March 31, 2011. Free cash flows, the sum of cash flows from operating and investing activities, represented an inflow of ¥251.5 billion in the year ended March 31, 2012, a decrease of ¥329.6 billion compared with the year ended March 31, 2011. Assets, Liabilities and Equity
As of March 31, 2012, our total assets amounted to ¥9,418.5 billion, an increase of ¥232.8 billion from March 31, 2011. The increase was due primarily to an increase in trade accounts receivables as a result of increased revenues and an increase in investments and advances resulting from acquiring shares of Western Digital Corporation as part of the consideration for selling our HDDs business to Western Digital Corporation. The increase was also attributable to an increase in inventories in response to strong demand in construction machinery. Our total cash and cash equivalents and short-term investments as of March 31, 2012 amounted to ¥631.1 billion, an increase of ¥59.7 billion from the level as of March 31, 2011.
As of March 31, 2012, our total interest-bearing debt, which represents the sum of short-term debt, long-term debt and non-recourse borrowings of consolidated securitization entities, amounted to ¥2,396.4 billion, a decrease of ¥125.0 billion from March 31, 2011. This decrease was due primarily to the decrease of non-recourse borrowings of consolidated securitization entities. As of March 31, 2012, short-term debt, consisting mainly of borrowings from banks and commercial paper, amounted to ¥531.4 billion, an increase of ¥58.8 billion from March 31, 2011, due primarily to an increase of working capital, partially offset by repayment of short-term debt with the consideration received for the sale of our HDDs business. As of March 31, 2012, long-term debt (excluding current portion), consisting mainly of debentures, debentures with stock acquisition rights, medium-term notes and loans principally from banks and insurance companies, amounted to ¥1,248.8 billion, a decrease of ¥51.4 billion from March 31, 2011, due primarily to a part of long-term debt becoming current liability and conversion of the Company’s bonds with stock acquisition rights into stocks.
As of March 31, 2012, noncontrolling interests amounted to ¥1,002.2 billion, an increase of ¥0.6 billion from March 31, 2011.
As of March 31, 2012, total Hitachi, Ltd. stockholders’ equity amounted to ¥1,771.7 billion, an increase of ¥331.9 billion from March 31, 2011. As a result, ratio of total Hitachi, Ltd. stockholders’ equity to total assets as of March 31, 2012 was 18.8%, compared with 15.7% as of March 31, 2011. Ratio of interest-bearing debt to total equity (the sum of total Hitachi, Ltd. stockholders’ equity and noncontrolling interests) decreased to 0.86, compared with 1.03 as of March 31, 2011. (3) Important Accounting Policies and Estimates
The preparation of our consolidated financial statements in conformity with U.S. GAAP requires our management to make estimates and assumptions that affect the reported amounts of assets and liabilities and disclosure of contingent assets and liabilities at the date of the financial statements and the reported amounts of revenues and expenses during the reporting period. Certain accounting estimates are particularly sensitive because of their significance to the financial statements and because of the possibility that future events affecting the estimate may differ significantly from management’s current assumptions. Management considers the accounting estimates discussed in this section to be critical accounting estimates for two reasons. First, the estimates require us to make assumptions about matters that are highly uncertain at the time the accounting estimate is made. Second, different estimates that we reasonably could have used for the accounting estimate in the current period, or changes in the accounting estimate that are reasonably likely to occur from period to period, could have a material impact on the presentation of our financial condition, changes in financial condition or results of operations. Management believes the following represent our critical accounting policies.
Revenue Recognition for Sales under Long-term Construction Arrangements
We use the percentage-of-completion method to recognize revenue from sales of tangible products under long-term construction type arrangements, in connection with the construction of nuclear, thermal and hydroelectric power plants and customization of software. Under the percentage-of-completion method, we recognize revenue from a sale in an amount equal to estimated total revenue from the arrangement multiplied

-38-
by the percentage that costs incurred to date bear to estimated total costs at completion based upon the most recently available information. The use of the percentage-of-completion method requires us to make significant assumptions about estimates of total contract costs, remaining costs to completion, total contract revenues, contract risks and other factors. We regularly review these estimates and adjust them as we deem necessary. We charge any anticipated losses on fixed price contracts to operations when we are able to estimate such losses. We make provisions for contingencies in the period in which they become known to us under the specific terms and conditions of the relevant contract and are estimable by us.
Impairment of Long-Lived Assets
We review the carrying value of our long-lived assets held and used whenever events or changes in circumstances indicate that the carrying value of the assets may not be recoverable. Such events or changes include, but are not limited to:
changes in production due to trends of supply and demand in the markets;
rapid changes in selling prices of products or purchasing prices of materials and components;
unexpected technological innovation causing obsolescence of present products; and
unpredictable changes in business assumptions, which cause revision of business plans that result in changes in the extent or manner in which we use long-lived assets.
We perform an initial impairment review using estimates of undiscounted future cash flows. If the carrying value of the asset is greater than our estimates of undiscounted cash flows, an impairment charge is recorded for the amount by which the carrying value of the asset exceeds its estimated fair value. In estimating, we use available quoted market prices and present value techniques, if appropriate, based on the estimated future cash flow expected to result from the use of the assets and their eventual disposition.
Although management believes that the estimates of future cash flows and fair value are reasonable, changes in estimates resulting in lower future cash flows and fair value due to unforeseen changes in business assumptions could negatively affect the valuations of long-lived assets.
For the year ended March 31, 2012, we recognized ¥31.8 billion of impairment losses for long-lived assets, mainly relating to semiconductor package material businesses in the High Functional Materials & Components segment and a micro devices business in the Information & Telecommunication Systems segment.
Goodwill and Intangible Assets
We do not amortize goodwill and other intangible assets with indefinite useful lives but we test them for impairment in accordance with Accounting Standards Codification, or ASC 350, “Intangibles—Goodwill and Other,” on an annual basis, normally in the fourth quarter after our annual forecasts have been determined, or more frequently if events occur or circumstances change in a manner that would more likely than not reduce the fair value of these assets below their respective carrying values. Such an event might include the current global economic and financial market crisis. An impairment of these assets is recorded if their calculated fair values are less than their carrying amounts.
We determine the fair value of our reporting units mainly using an income approach (i.e., present value technique). When determining such fair value, we may, however, also use the fair value of that unit based on a comparison of comparable publicly traded companies or based on that unit’s stand-alone market capitalization. Depending on the complexity, we consult with external experts when appropriate.
The determination requires estimates based on quoted market prices, prices of comparable businesses, present value or other valuation techniques, or a combination thereof, requiring management to make subjective judgments and assumptions, including assumptions about future operating results for the relevant business unit and discount rates.
In estimating future cash flows, we base the forecasted operational results on currently available assumptions considered by management to be reasonable. However, actual results may differ materially from those projected, including due to:

-39-
economic trends in Japan, North America, Asia and other major markets where we do business;
supply in excess of demand leading to a decline in selling prices or production volumes;
intense price competition or decreases in prices;
a sharp rise in the purchasing prices of material and components; and
currency exchange rate fluctuations.
We base our discount rate assumptions for purposes of estimating the fair value of our reporting units on our cost of capital and liabilities. Stock market trends and changes in interest rates affect these assumptions. Although management believes that the estimates of future cash flows and fair value are reasonable, changes in estimates resulting in lower future cash flows and fair value due to unforeseen changes in the business environment could result in additional goodwill impairment charges.
While our businesses are diverse, the number of reporting units to which goodwill has been allocated is limited. Therefore, a decrease in our market capitalization will not necessarily have a proportional or direct effect on the carrying value of goodwill.
As of March 31, 2012, our carrying amount of goodwill was ¥214.7 billion. The majority of goodwill consists of the Information & Telecommunication Systems segment (¥79.9 billion) and the High Functional Materials & Components segment (¥58.9 billion).
The carrying amount of goodwill of the Information & Telecommunication Systems segment at March 31, 2012 mainly relates to our information and telecommunication business. Our information and telecommunication business is sensitive to customers’ motivation to invest in information-technology systems affected by macro-economic conditions. We may be required to record an impairment in goodwill in this segment if any economic downturn is expected to be prolonged beyond current estimates of our management.
The carrying amount of goodwill of the High Functional Materials & Components segment at March 31, 2012 mainly relates to our metals business. The metals business is sensitive to increases in materials prices and product demand. We may need to recognize an impairment loss for goodwill in this segment if there is a sustained increase in materials prices or an unforeseen decrease in demand.
In order to evaluate the sensitivity of the fair value calculations on the goodwill impairment analysis, we applied a hypothetical and approximate 10% decrease to the fair value of each reporting unit. As a result of our sensitivity analysis, as of March 31, 2012, we do not have any reporting units that are at risk that the carrying amount of the reporting unit would reasonably likely exceed its fair value.
Deferred Tax Assets
In assessing the realizability of deferred tax assets, management considers whether it is more likely than not that we will not realize a portion or all of our deferred tax assets. The ultimate realization of our deferred tax assets is dependent on whether we are able to generate sufficient future taxable income in specific tax jurisdictions during the periods in which temporary differences become deductible. Management has scheduled the expected future reversals of the temporary differences and projected future taxable income, including the execution of certain available tax strategies if appropriate, in making this assessment. Actual results may differ materially from forecasted operating results, which are the basis for projecting future taxable income, and may be subject to adjustment because of factors such as economic trends in major markets where we do business, trends of supply and demand in the markets, prices of products and services, purchasing prices of materials and components, currency exchange rate fluctuations and rapid technological innovation. As a result, the differences could negatively affect the amount of deferred tax assets and valuation allowances. The realizability of deferred tax assets is assessed for each taxable unit in each taxable jurisdiction, and the results of the assessment may differ from unit to unit due to different products or jurisdictions even if they operate the same kind of business. Based on these factors, management believes that it is more likely than not that we will realize the benefits of these temporary differences, net of the existing valuation allowance as of March 31, 2012. However, the amount of deferred tax assets may be different if we do not realize estimated future taxable income during the carry forward periods as originally expected.

-40-
Retirement Benefits
We have a significant amount of accrued employee retirement benefit costs that are developed from actuarial valuations. Inherent in these valuations are key assumptions in estimating pension costs including mortality, withdrawal, retirement, changes in compensation, discount rates and expected return on plan assets. We are required to make key assumptions by taking into account various factors including personnel demographics, current market conditions and expected trends in interest rates. We determine the discount rates by looking at available information about rates implicit in the return on high-quality fixed-income government and corporate bonds. Accordingly, the discount rate is likely to change from period to period based on these ratings. A decrease in the discount rate results in an increase in actuarial pension benefit obligations. Increases and decreases in the pension benefit obligation affect the amount of the actuarial gain or loss that is amortized into income over the service lives of employees. Changes in the key assumptions may have a material effect on our financial position and results of operations. Management believes that estimation of the key assumptions is reasonable in light of the various underlying factors.
The table below shows the sensitivity to a change in discount rates and the expected rate of return on plan assets to pre-tax income and projected benefit obligation (PBO), holding all other assumptions constant.
Effect on pre-tax income for the
year ending March 31, 2013
Effect on PBO as of March 31,
2012 (Millions of yen)
Discount rates: 0.5% decrease ......................................................................................... (8,013) 164,227 0.5% increase .......................................................................................... 8,064 (151,489)
Expected rate of return on plan asset: 0.5% decrease ......................................................................................... (6,486) - 0.5% increase .......................................................................................... 6,486 -
The objective of our investment policy is to ensure a stable return from the plans’ investments over the
long term, which allows our and our subsidiaries’ pension funds to meet their future obligations, and we and certain of our subsidiaries attempt to maintain the pension funds in sound condition.
Allowance for Doubtful Accounts
We estimate the collectability of our trade receivables as well as of our investments in leases to measure our incurred losses (that is those amounts with regard to which collection is not probable based on current information). Assessing the ultimate realization of these receivables, based on historical experience and analyses, including the current creditworthiness of each customer, requires a considerable amount of judgment. Each company in our consolidated group considers factors which are relevant to its business and circumstances, including business practices that are unique to the respective country or region in which it operates. Such factors which have been present on a historical basis and have contributed to losses at our subsidiaries in the past include: historical credit loss experience; existence of overdue payments; extended payment terms; negative evaluation by third-party credit rating agencies; excessive debt; and evaluation of deteriorating financial position and operating results. Specifically, we consider probability of credit losses if overdue payments exist or if extended payment terms are subsequently granted. However, we also consider the other factors noted above in determining probability of credit losses when outstanding balances are current but other factors indicate significant doubt about customers’ ability to make future payments in full. In addition, we perform a retrospective review of the assumptions relied upon in establishing allowances for doubtful receivables, including comparisons of such assumptions to actual collections experience in order to adjust our loss estimation methods to reduce the difference between estimated losses and actual subsequent charge-offs.
Our policies require that we refrain from writing off overdue receivables until after exhaustive collection efforts have been undertaken. Account balances are generally written off against the allowance only after all means of collection have been exhausted and the potential for recovery is considered remote. Write-offs generally occur only when a debtor enters bankruptcy or liquidation because collection efforts normally continue until that point. In addition, in Japan and certain other countries where we operate, tax deductions for uncollectible receivables are only allowed upon the debtor’s bankruptcy, liquidation or when legal proceedings

-41-
are concluded. This policy, which is driven by business practices and income tax regulations, results in potentially long collection and write-off cycles.
We have recorded changes in required reserves in recent periods and may record them in the future due to the market environment and financial condition of customers. Any deterioration in customers’ financial positions or in their credit ratings, or increases in levels or amounts of delinquency may adversely affect net income.
Investments in Securities
We hold various investments in securities and equity-method investments.
A decline in the fair value of equity securities classified as available-for-sale, cost-method or equity-method investments below their carrying value that is deemed other than temporary results in a write-down of the carrying value to the fair value as a new cost basis. The amount of the write-down is included in earnings. Fair value is determined based on quoted market prices, projected discounted cash flows or other valuation techniques as appropriate and maximizing the use of observable inputs. Management periodically reviews each equity security classified as an available-for-sale, cost-method and equity-method investment for possible impairment based on criteria such as the extent to which the carrying value exceeds fair value, the length of time the fair value has been below the carrying value and the financial condition and near-term specific prospects of the issuer.
Whether a decline in fair value of debt securities classified as available-for-sale or held-to-maturity below carrying value that is deemed other than temporary is recognized in earnings depends on whether we intend to sell the impaired debt security or it is more likely than not that we will be required to sell the security before recovery. If we do not intend to sell the security and it is not more likely than not that we will be required to sell the security before recovery, the component of the other-than-temporary impairment related to the credit loss is recognized in earnings and the component of the other-than-temporary impairment related to other factors is recognized in other comprehensive income (loss). Management periodically reviews each debt security classified as available-for-sale or held-to-maturity for the existence of impairment that is other than temporary based on criteria such as whether there is intent to sell the impaired debt security, it is more likely than not that the impaired debt security will be required to be sold before recovery, or the holder is not expected to recover the entire amortized cost basis of the security for any other reason.
A decline in market prices or a change in the financial condition of an issuer could negatively affect the fair value of an investment in a security. (4) Forward-Looking Statements
Certain statements found in “4. Risks Factors” and “7. Analyses of Consolidated Financial Position, Operating Results and Cash Flows” and other descriptions in this report may constitute “forward-looking statements” as defined in the U.S. Private Securities Litigation Reform Act of 1995. Such “forward-looking statements” reflect management’s current views with respect to certain future events and financial performance and include any statement that does not directly relate to any historical or current fact. Words such as “anticipate,” “believe,” “expect,” “estimate,” “forecast,” “intend,” “plan,” “project” and similar expressions which indicate future events and trends may identify “forward-looking statements.” Such statements are based on currently available information and are subject to various risks and uncertainties that could cause actual results to differ materially from those projected or implied in the “forward-looking statements” and from historical trends. Certain “forward-looking statements” are based upon current assumptions of future events which may not prove to be accurate. Undue reliance should not be placed on “forward-looking statements,” as such statements speak only as of the date of this report.

-42-
Factors that could cause actual results to differ materially from those projected or implied in any “forward-looking statement” and from historical trends include, but are not limited to:
• economic conditions, including consumer spending and plant and equipment investment in Hitachi’s major markets, particularly Japan, Asia, the United States and Europe, as well as levels of demand in the major industrial sectors Hitachi serves, including, without limitation, the information, electronics, automotive, construction and financial sectors;
• exchange rate fluctuations of the yen against other currencies in which Hitachi makes significant sales or in which Hitachi’s assets and liabilities are denominated, particularly against the U.S. dollar and the euro;
• uncertainty as to Hitachi’s ability to access, or access on favorable terms, liquidity or long-term financing; • uncertainty as to general market price levels for equity securities, declines in which may require Hitachi to
write down equity securities that it holds; • the potential for significant losses on Hitachi’s investments in equity method affiliates; • increased commoditization of information technology products and digital media-related products and
intensifying price competition for such products, particularly in the Digital Media & Consumer Products segments;
• uncertainty as to Hitachi’s ability to continue to develop and market products that incorporate new technologies on a timely and cost-effective basis and to achieve market acceptance for such products;
• rapid technological innovation; • the possibility of cost fluctuations during the lifetime of, or cancellation of, long-term contracts for which
Hitachi uses the percentage-of-completion method to recognize revenue from sales; • fluctuations in the price of raw materials including, without limitation, petroleum and other materials, such
as copper, steel, aluminum, synthetic resins, rare metals and rare-earth minerals, or shortages of materials, parts and components;
• fluctuations in product demand and industry capacity; • uncertainty as to Hitachi’s ability to implement measures to reduce the potential negative impact of
fluctuations in product demand, exchange rates and/or price of raw materials or shortages of materials, parts and components;
• uncertainty as to Hitachi’s ability to achieve the anticipated benefits of its strategy to strengthen its Social Innovation Business;
• uncertainty as to the success of restructuring efforts to improve management efficiency by divesting or otherwise exiting underperforming businesses and to strengthen competitiveness;
• uncertainty as to the success of cost reduction measures; • general socioeconomic and political conditions and the regulatory and trade environment of countries
where Hitachi conducts business, particularly Japan, Asia, the United States and Europe, including, without limitation, direct or indirect restrictions by other nations on imports and differences in commercial and business customs including, without limitation, contract terms and conditions and labor relations;
• uncertainty as to the success of alliances upon which Hitachi depends, some of which Hitachi may not control, with other corporations in the design and development of certain key products;
• uncertainty as to Hitachi’s access to, or ability to protect, certain intellectual property rights, particularly those related to electronics and data processing technologies;
• uncertainty as to the outcome of litigation, regulatory investigations and other legal proceedings of which the Company, its subsidiaries or its equity method affiliates have become or may become parties;
• the possibility of incurring expenses resulting from any defects in products or services of Hitachi; • the possibility of disruption of Hitachi’s operations by earthquakes, tsunamis or other natural disasters; • uncertainty as to Hitachi’s ability to maintain the integrity of its information systems, as well as Hitachi’s
ability to protect its confidential information or that of its customers; • uncertainty as to the accuracy of key assumptions Hitachi uses to evaluate its significant employee
benefit-related costs; and • uncertainty as to Hitachi’s ability to attract and retain skilled personnel.
The factors listed above are not all-inclusive and are in addition to other factors contained elsewhere in
this report and in other materials published by Hitachi.

-43-
III. Property, Plants and Equipment
1. Summary of Capital Investment, etc.
The Hitachi Group (the Company and consolidated subsidiaries) selectively invests in R&D and product fields expected to grow over the long term, and it also invests to streamline manufacturing process, etc. and to improve the reliability of its products.
Capital investment (based on the amount recorded as tangible fixed assets) in the fiscal year ended March 31, 2012 was ¥649.2 billion. A breakdown of capital investment by segment is as follows. Effective from April 1, 2011, the battery business for automotive applications, which was previously included in the Components & Devices segment, has been included in the Automotive Systems segment and figures for each segment and change from the preceding fiscal year are presented on the basis of the new segmentation.
Segment Capital investment(Billions of yen)
Change from preceding fiscal
year (%)Main purpose of investment
Information & Telecommunication Systems
50.6 170.9
Correspondence to the Great East Japan Earthquake, expand data centers, streamline development and production of other products
Power Systems 27.3 258.8 Correspondence to the Great East Japan Earthquake, streamline development and production of products
Social Infrastructure & Industrial Systems
24.2 134.9 Increase production of elevators and escalators, streamline development and production of other products
Electronic Systems & Equipment
22.3 168.0 Streamline development and production of products
Construction Machinery 65.0 178.0 Increase and streamline production of construction machinery
High Functional Materials & Components
67.8 111.7
Increase and streamline production of high grade metal products, magnetic materials/components and automotive related materials/components, etc.
Automotive Systems 38.3 208.1 Increase production of automotive equipment, etc.
Components & Devices 44.7 80.6 HDDs manufacturing equipment, streamline production of small and medium-sized LCDs
Digital Media & Consumer Products
20.4 138.9 Increase production of air conditioning equipment, streamline development and production of other products
Financial Services 256.2 90.7 Assets for leasing business
Others 40.6 119.9 Real estate for renting, etc.
Subtotal 658.1 114.7 -
Eliminations & Corporate Items
(8.9) - -
Total 649.2 116.6 - (Notes) 1. The above table includes ¥271.9 billion investment in lease assets. It is mainly for computers and
other information-related equipment, industrial machinery and machine tools, vehicles and medical equipment related to lease agreements under the Financial Services segment.
2. The figures in the above table include the amount of the tangible fixed assets leased under non-transferable finance lease transactions.
3. These investments were mostly financed with the Hitachi Group’s own capital.

-44-
2. Major Property, Plants and Equipment
The Hitachi Group (the Company and consolidated subsidiaries) engages in diverse business operations in Japan and overseas. It discloses information on major property, plants and equipment.
The situation at the end of the fiscal year under review is as follows. (1) Breakdown by Segment
(As of March 31, 2012)
Segment
Book value (Millions of yen)
Number of employeesBuildings Machinery and
equipment
Land[Area in
thousands of m2]
Lease assets Others Total
Information & Telecommunication Systems
66,185 48,139 33,944[1,832] 8,571 15,357 172,196 73,334
Power Systems 40,834 33,125 15,012[4,724] 13,257 11,179 113,407 17,235
Social Infrastructure & Industrial Systems
68,833 43,504 29,871[3,612] 10,927 6,679 159,814 41,136
Electronic Systems & Equipment
53,828 25,257 46,700[2,288] 879 2,428 129,092 25,878
Construction Machinery
67,374 98,724 67,016[10,519] 3,076 15,852 252,042 20,571
High Functional Materials & Components
123,344 149,501 93,606[13,340] 2,219 19,635 388,305 47,468
Automotive Systems
38,065 52,186 47,914[5,381] 545 11,672 150,382 28,125
Components & Devices
10,927 8,512 40,007[1,074] 33 661 60,140 3,998
Digital Media & Consumer Products
28,566 47,164 18,719[4,091] 1,041 3,367 98,857 25,042
Financial Services 666 188,362 121[12] 9,079 229 198,457 4,060
Others 143,724 29,844 110,463[4,128] 17,944 11,642 313,617 33,473
Subtotal 642,346 724,318 503,373[51,002] 67,571 98,701 2,036,309 320,320
Eliminations & Corporate Items
26,717 2,714 (39,280)[1,187] (1,960) 1,038 (10,771) 3,220
Total 669,063 727,032 464,093[52,188] 65,611 99,739 2,025,538 323,540
(Notes) 1. The “Others” column represents the total amount of vehicles and construction in progress.
2. The figures in the above table include ¥242,222 million of operating lease assets for leasing business, mainly owned by Hitachi Capital Corporation.
3. The figures in the above table include ¥52,619 million of lease assets concerning non-transfer ownership finance lease transactions leased from within the Hitachi Group, mainly from Hitachi Capital Corporation.
4. Except for the figures in the above table, there are operating lease assets leased, mainly machinery, etc. The annual lease fee for such assets was ¥136,219 million.

-45-
(2) The Company
(As of March 31, 2012)
Facility (Main location) Segment
Details of major facilities and equipment
Book value (Millions of yen)
Number of employeesBuildings
Machinery and
equipment
Land[Area in
thousands of m2]
Lease assets Others Total
Information & Telecommunication Systems Company (Shinagawa-ku, Tokyo)
Information & Telecommuni-cation Systems
System development facilities, manufacturing facilities for servers, mainframes, etc.
31,853 18,487 2,006[746] 3,084 12,807 68,238 13,421
Power Systems Company (Hitachi, Ibaraki)
Power Systems
Manufacturing facilities for power generating equipment, etc.
15,933 18,872 3,473[3,629] 952 5,292 44,524 3,993
Research & Development Group (Kokubunji, Tokyo)
Others R&D facilities 15,900 5,218 6,089[815] 520 2,824 30,552 3,295
Area Operations (Osaka, Osaka) Corporate Other facilities 8,146 478 8,423
[87] 16 - 17,065 1,497
Urban Planning and Development Systems Company (Hitachinaka, Ibaraki)
Social Infrastructure & Industrial Systems
Manufacturing facilities for elevators and escalators
9,573 5,747 89[528] 1,327 293 17,031 1,491
Head Office (Chiyoda-ku, Tokyo)
Corporate Other facilities 6,944 2,110 5,549[1,051] 174 235 15,014 1,674
Information Technology Division (Chiyoda-ku, Tokyo)
Others System development facilities
3,598 10,143 -[-] - 849 14,591 713
Ibaraki Hospital Center (Hitachi, Ibaraki)
Corporate Medical facilities 10,431 1,029 10[49] 1,366 802 13,641 1,325
Information & Control Systems Company (Hitachi, Ibaraki)
Information & Telecommuni-cation Systems, Power Systems and Social Infrastructure & Industrial Systems
Manufacturing facilities for switchboards and calculation control equipment, system development facilities
6,814 2,909 635[206] 2,398 464 13,222 2,679
Transportation Systems Company (Kudamatsu, Yamaguchi)
Social Infrastructure & Industrial Systems
Manufacturing facilities for railway vehicles, etc.
7,186 3,997 862[693] 32 383 12,462 1,774

-46-
(3) Domestic subsidiaries
(As of March 31, 2012)
Facility (Main location) Segment
Details of major facilities and equipment
Book value (Millions of yen)
Number of employeesBuildings
Machinery and
equipment
Land [Area in
thousands of m2]
Lease assets
Others Total
Hitachi Automotive Systems, Ltd. (Hitachinaka, Ibaraki)
Automotive Systems
Manufacturing facilities for automotive equipment
16,632 21,766 7,492[2,528] 3 1,413 47,309 6,052
Hitachi Construction Machinery Co., Ltd., Tsuchiura Works (Tsuchiura, Ibaraki)
Construction Machinery
Manufacturing facilities for construction machinery
9,251 16,806 7,562[5,534] - 3,387 37,007 2,514
Hitachi Metals, Ltd., Yasugi Works (Yasugi, Shimane)
High Functional Materials & Components
Manufacturing facilities for high grade steel
7,891 14,972 8,162[1,109] - 654 31,679 1,574
Hitachi Construction Machinery Co., Ltd., Hitachinaka-Rinko Works (Hitachinaka, Ibaraki)
Construction Machinery
Manufacturing facilities for construction machinery
11,441 3,823 11,042[483] - 803 27,111 301
Hitachi Solutions, Ltd., Head Office (Shinagawa-ku, Tokyo)
Information & Telecommunication Systems
Other facilities 10,140 627 12,602[17] 1,038 312 24,719 2,465
Hitachi Building Systems Co., Ltd., Head Office (Chiyoda-ku, Tokyo)
Social Infrastructure & Industrial Systems
Other facilities 10,354 1,819 10,959[170] - 392 23,524 1,439
Hitachi Cable, Ltd., Hitaka Works (Hitachi, Ibaraki)
High Functional Materials & Components
Manufacturing facilities for wires, cables
11,598 3,793 4,809[1,056] - 380 20,582 1,712
Hitachi Chemical Co., Ltd., Shimodate Works (Chikusei, Ibaraki)
High Functional Materials & Components
Manufacturing facilities for circuit board materials, etc.
8,318 6,496 4,392[743] 19 323 19,550 1,589
Hitachi High-Technologies Corporation Naka Area (Hitachinaka, Ibaraki)
Electronic Systems & Equipment
Manufacturing facilities for semiconductor manufacturing equipment and test and measurement equipment, etc.
13,036 4,729 619[121] - 145 18,530 2,206
Hitachi Chemical Co., Ltd., Yamazaki Works (Hitachi, Ibaraki)
High Functional Materials & Components
Manufacturing facilities for semiconductor materials
6,726 6,371 788[485] 11 1,299 15,196 1,086
(Note) Except for the figures in the above table, there are ¥180,018 million of operating lease assets for leasing
business, mainly owned by Hitachi Capital Corporation.

-47-
(4) Overseas subsidiaries (As of March 31, 2012)
Facility (Main location) Segment
Details of major facilities and equipment
Book value (Millions of yen)
Number of employeesBuildings
Machinery and
equipment
Land [Area in
thousands of m2]
Lease assets Others Total
Telco Construction Equipment Company Limited (Bangalore, India)
Construction Machinery
Manufacturing facilities for construction machinery
5,703 6,548 558[1,141] - 2,128 14,937 1,877
Hitachi Data Systems Corporation (California, U.S.A.)
Information & Telecommuni-cation Systems
Other facilities - 14,260 -[-] - - 14,260 5,324
Hitachi Metals America, Ltd. (New York, U.S.A.)
High Functional Materials & Components
Manufacturing facilities for automobile components, etc.
3,117 9,323 377[2,561] - 1,192 14,009 2,075
Hitachi Automotive Systems Americas, Inc. (Kentucky, U.S.A.)
Automotive Systems
Manufacturing facilities for automotive equipment
3,434 6,046 280[1,231] - 3,811 13,571 2,170
Hitachi Construction Machinery (China) Co., Ltd. (Hefei, China)
Construction Machinery
Manufacturing facilities for construction machinery
4,737 5,428 -[-] - 1,308 11,473 2,200
(Notes) 1. The figures for Hitachi Data Systems Corporation and Hitachi Metals America, Ltd. are
presented in consolidated basis of each company. 2. Except for the figures in the above table, there are ¥56,741 million of operating lease assets for
leasing business.

-48-
3. Plans for Capital Investment, Disposals of Property, Plants and Equipment, etc.
The Hitachi Group (the Company and consolidated subsidiaries) engages in diverse operations in Japan and overseas, and has not decided on specific plans to newly install or expand each of facilities as of the end of the fiscal year. For this reason, it discloses amounts of capital investment by segment.
The amount of capital investment for the fiscal year ending March 31, 2013 will be ¥772.0 billion (new installation and expansions, based on the amount recorded as tangible fixed assets), and a breakdown by segment is as follows. Effective from April 1, 2012, the Components & Devices segment is abolished and businesses which were classified in the segment are reclassified in the Others segment. Figures shown below is presented on the basis of the new segmentation.
Segment Amount(Billions of yen) Main purpose of investment
Information & Telecommunication Systems
49.0 Antiseismic reinforcement, expand data centers, streamline development and production of other products
Power Systems 26.0 Antiseismic reinforcement, streamline development and production of products
Social Infrastructure & Industrial Systems
43.0 Antiseismic reinforcement, increase production of elevators and escalators, streamline development and production of other products
Electronic Systems & Equipment
31.0 Streamline development and production of products
Construction Machinery 93.0 Increase and streamline production of construction machinery
High Functional Materials & Components
94.0 Increase production of high grade metal products, magnetic materials/components, resins and circuit board materials, etc.
Automotive Systems 54.0 Increase production of automotive equipment, etc.
Digital Media & Consumer Products
20.0 Corresponding to the floods in Thailand, streamline development and production of products
Financial Services 315.0 Assets for leasing business
Others 52.0 Antiseismic reinforcement of welfare facilities
Subtotal 777.0 -
Eliminations & Corporate Items
(5.0) -
Total 772.0 - (Notes) 1. The figures in the above table include ¥330.0 billion of planned investment in assets for leasing
business. 2. The figures in the above table include the amount of the fixed assets leased under non-transferable
finance lease transactions. 3. These planned investments are expected to be mostly financed with the Hitachi Group’s own
capital. 4. There are no plans to dispose or sell principal facilities, with the exception of disposing and selling
facilities due to routine upgrading.

-49-
IV. Information on the Company
1. Information on the Company’s Stock, etc. (1) Total number of shares, etc.
1) Total number of shares
Class Total number of shares authorized to be issued (shares)
Common stock 10,000,000,000
Total 10,000,000,000
2) Issued shares
Class
Number of shares issued as of the end
of fiscal year (shares) (March 31, 2012)
Number of shares issued as of the
filing date (shares)(June 22, 2012)
Stock exchange on which the Company is listed Description
Common stock 4,637,785,317 4,637,807,397 Tokyo, Osaka, Nagoya
The number of shares per one unit of shares is 1,000 shares.
Total 4,637,785,317 4,637,807,397 - -
(Note) 1. The number of shares under the “Number of shares issued as of the filing date” column does not include shares issued through the exercise of stock acquisition rights from June 1, 2012 to the filing date.
2. The Company delisted its American Depositary Shares from the New York Stock Exchange on April 27, 2012 and its common stock from the Fukuoka Stock Exchange and Sapporo Securities Exchange on May 18, 2012, respectively.
(2) Information on the stock acquisition rights, etc.
The Company issues bonds with stock acquisition rights in accordance with the Companies Act.
Name of bonds
with stock acquisition rights
As of the end of
fiscal year (March 31, 2012)
As of the end of month preceding the filing date
(May 31, 2012)
Hitachi, Ltd. 130% call option attached unsecured convertible bond type-bonds with stock acquisition rights (8th series) (with inter-bond pari passu clause) (Note 1)
Balance of the bonds with stock acquisition rights ¥62,068 million ¥62,061 million
Number of the stock acquisition rights 62,068 62,061
Number of the stock acquisition rights held by the Company - -
Class of shares subject to the stock acquisition rights Common stock Common stock
Number of shares subject to the stock acquisition rights (Note 2) 195,798,107 shares 195,776,025 shares
Amount to be paid upon exercise of the stock acquisition rights (Notes 3, 4) ¥317 per share ¥317 per share
Exercise period of the stock acquisition rights (Note 5)
From January 4, 2010 to December 10, 2014
From January 4, 2010 to December 10, 2014
Issue price for shares issued through the exercise of the stock acquisition rights and the amount capitalized as common stock (Notes 4, 6)
Issue price: ¥317Amount capitalized as common stock: ¥159
Issue price: ¥317 Amount capitalized as common stock: ¥159
Terms and conditions for exercising the stock acquisition rights (Note 7) (Note 7)
Matters related to transfer of the stock acquisition rights (Note 8) (Note 8)
Matters related to contributions of bonds upon exercise of the stock acquisition rights in lieu of cash payment
(Note 9) (Note 9)
Matters related to the grant of stock acquisition rights accompanying reorganization acts
(Note 10) (Note 10)

-50-
(Note) 1. Referred to as the “Bonds with Stock Acquisition Rights,” of which the bonds are referred to as the “Bonds” and of which the stock acquisition rights are referred to as the “Stock Acquisition Rights.”
2. The number of the shares of the Company’s common stock to be delivered by the Company upon request to exercise the Stock Acquisition Rights shall be the number of which the aggregate amount of the Bonds to which the Stock Acquisition Rights relating to the exercise request are attached divided by the applicable conversion price as of the date of such exercise request (the price to be used in calculating the number of shares of the Company’s common stock to be delivered upon the exercise of each Stock Acquisition Right; provided, however, in case of note 10, the “conversion price” shall mean the price used in calculating the number of shares of the common stock of the succeeding company, etc. to be delivered upon the exercise of the Succeeded Stock Acquisition Rights as defined below 10 (1)), with any fraction less than one share resulting from such calculation, if any, being rounded down, and no cash adjustment will be made in respect thereof.
3. Upon the exercise of each Stock Acquisition Right, the Bond to which such Stock Acquisition Right is attached shall be contributed and the value of such Bond shall be an amount equal to the amount to be paid for such Bond.
4. The conversion price relating to the Bonds with Stock Acquisition Rights shall be initially 317 yen; provided, however, that the Conversion Price may be adjusted or reduced as below.
(1) (i) If there is or might be a change in the number of the shares of the Company’s common stock due to any of the events set forth in (ii) below after the issue of the Bonds with Stock Acquisition Rights, the Company shall adjust the Conversion Price using the following formula (the “Conversion Price Adjustment Formula”).
Conversion price after adjustment
= Conversion price before adjustment
×
Number of existing issued shares
+
Number of Shares to be delivered
× Amount to be paid per share
Current market price
Number of existing issued shares + Number of shares to be delivered
(ii) If any of the following events occur, the Conversion Price shall be adjusted in accordance with the Conversion Price Adjustment Formula and such adjusted conversion price will be applied to respective event as provided in the following each provision:
(a) In the event of an offer to subscribe for shares of the Company’s common stock with an amount to be paid that is less than the current market price (as defined in (2)(iii) below; the same applies hereinafter) (excluding offers for up to 1,090,000,000 shares of new shares to be issued by way of a public offer for subscription and up to 60,000,000 shares of new shares to be issued by way of a third-party allotment, each pursuant to a decision by the President and Chief Executive Officer of the Company made on 16 November 2009 pursuant to authority granted to him by a resolution of the Board of Directors of the Company at its meeting held on 29 October 2009):
The Conversion Price after adjustment will apply on and after the day immediately following the payment date (or, if there is a payment period for the offer for subscription, the last day of such payment period; the same applies hereinafter); provided, however, that if a record date for granting the right to receive allotment of shares to the shareholders of the Company’s common stock has been established, the Conversion Price after adjustment will apply on and after the day immediately following such record date.
(b) In the event of a stock split or a gratis allotment of shares of the Company’s common stock:
The Conversion Price after adjustment will apply, in the case of a stock split, on and after the day immediately following the record date for such stock split or, in the case of a gratis allotment, the day immediately following the effective date thereof; provided, however, that if, for the gratis allotment of shares of the Company’s common stock, a record date for granting the right to receive allotment of shares to the shareholders of the Company’s common stock has been established, the Conversion Price after adjustment will apply on and after the day immediately following such record date.
(c) In the case of an issuance of shares with put option, callable shares or callable stock acquisition rights (including those attached to bonds with stock acquisition rights) with provisions for delivery of shares of the Company’s common stock at a price less than the current market price, or stock acquisition rights (including those attached to bonds with stock acquisition rights) upon the exercise of which shares of the Company’s common stock will be delivered to the holders thereof at a price less than the current market price (collectively, the “Shares with Put Option, etc.”):
The Conversion Price after adjustment will be calculated by regarding all of the put options, the call provisions or the stock acquisition rights (including

-51-
those attached to bonds with stock acquisition rights) as having been exercised or applied under the initial terms and conditions thereof, and will be applied on and after the day immediately following the payment date (or, in the case of the stock acquisition rights or bonds with stock acquisition rights, the allotment date); provided, however, that if a record date for granting the right to receive allotment of shares to the shareholders of the Company’s common stock has been established, the Conversion Price after adjustment will apply on and after the day immediately following such record date.
(d) Notwithstanding the provisions set forth in (ii)(a) to (c) above, if shares of the Company’s common stock or the Shares with Put Option, etc. are to be allotted to the shareholders of the Company’s common stock and the record date for the allotment is a day preceding the day on which the allotment is approved at a meeting of shareholders, the board of directors meeting or by any other organ of the Company or on which the allotment is determined by the Executive Officer, then the Conversion Price after adjustment will apply on and after the day immediately following the date of such approval or determination; provided, however, that in such case, shares of the Company’s common stock will be delivered on or after the date of such approval or determination to the holders of the Bonds with Stock Acquisition Rights who have made a request to exercise the Stock Acquisition Rights during the period from the day immediately following the record date to the date of the approval or determination (the “Holders of Stock Acquisition Rights”) by means of the calculation described below. In such case, shares will be delivered to the Holders of Stock Acquisition Rights who made the exercise request by crediting the proprietary column of the transfer account book of a book-entry transfer institution or account management institution designated by the Holder of Stock Acquisition Rights with the increase of the number of the book-entry shares after such request comes into effect.
Number of shares =
(Conversion price before adjustment – Conversion price after adjustment
×Number of the shares delivered at
the conversion price before adjustment during such period
Conversion price after adjustment
Any fraction less than one share resulting from such calculation will be rounded down and no cash adjustment will be made in respect thereof.
(2) The Conversion Price shall be adjusted pursuant to the following provisions. (i) To the extent that the difference between the Conversion Price after
adjustment calculated by using the Conversion Price Adjustment Formula and the Conversion Price before adjustment is less than one yen, the Conversion Price shall not be adjusted; provided, however, that if any event subsequently occurs that requires another adjustment of the Conversion Price and the Conversion Price is calculated, in lieu of the Conversion Price before adjustment indicated in the Conversion Price Adjustment Formula, the Conversion Price before adjustment minus such difference shall be used.
(ii) In the calculation using the Conversion Price Adjustment Formula, figures in yen shall be calculated to the nearest second decimal place and rounded to the nearest first decimal place.
(iii) The “current market price” used in the Conversion Price Adjustment Formula shall be the average price (not counting days on which there is no closing price) of the daily closing prices (including quotation prices) of the shares of the Company’s common stock in regular trading on the Tokyo Stock Exchange, Inc. during 30 trading days commencing on the 45th trading day preceding the day on which the Conversion Price after adjustment is applied (in the case of (1)(ii)(d) above, the relevant record date). In calculating such average, figures in yen shall be calculated to the nearest second decimal place and rounded to the nearest first decimal place.
(iv) The “number of already issued shares” used in the Conversion Price Adjustment Formula shall be the number of the issued shares of the Company’s common stock as of the record date if a record date for granting the right to receive allotment of shares to the shareholders of the Company’s common stock has been established, or if there is no such record date, the corresponding day one month prior to the relevant day on which the Conversion Price after adjustment is applied, minus the number of the shares of the Company’s common stock held by the Company as of such date, plus the number of shares of the Company’s common stock that have not yet been delivered from among the shares of the Company’s common stock deemed as the number of shares to be delivered pursuant to (3) above or (5) below before adjustment of the Conversion Price. If shares of the Company’s common stock are to be split, the number of shares to be

-52-
delivered to be used in the Conversion Price Adjustment Formula will not include the number of shares of the Company’s common stock to be allotted to the shares of the Company’s common stock held by the Company as of the relevant record date.
(3) In addition to the provisions of (1) or (2), if the adjustment of the Conversion Price is required in the following cases, the Company will, after consultation with a bond administrator, make necessary adjustment to the Conversion Price:
(i) where carrying out consolidations of shares, decreases in the amount of stated capital or reserves, mergers (excluding a merger whereby the Company is extinguished), share exchanges or corporate splits;
(ii) in addition to (i) of this item, where an event occurs that will lead to or might lead to a change in number of the issued shares of the Company’s common stock;
(iii) where carrying out a gratis allotment of other classes of shares to the shareholders of the Company’s common stock; or
(iv) where two or more events requiring the adjustment of the Conversion Price occur consecutively and, in identifying the current market price used to calculate the Conversion Price after adjustment pursuant to one of the events, it is necessary to consider the effect of the other reason.
(4) In certain cases provided for in the Terms and Conditions for Bonds with Stock Acquisition Rights such as reorganization acts, the Conversion Price will be reduced, during the Conversion Price reduction period (as defined in the Terms and Conditions of Bonds with Stock Acquisition Rights), to the Conversion Price determined in accordance with the provisions of the Terms and Conditions for Bonds with Stock Acquisition Rights (in which case, the maximum deducted Conversion Price will be ¥238).
5. Holders of Stock Acquisition Rights may not exercise the Stock Acquisition Rights and request the Company to deliver the shares of the Company’s common stock during the following periods:
(i) on a record date of the shares of the Company’s common stock or its immediately preceding business day (meaning any day other than any day on which the book-entry transfer institution is closed; the same applies hereinafter),
(ii) on a business day immediately preceding the date of interest payment for the Bonds,
(iii) on days the book-entry transfer institution deems necessary, (iv) if the Bonds are redeemed on or before December 10, 2014 pursuant to the
provisions of the Terms and Conditions for Bonds with Stock Acquisition Rights, on or after a business day immediately preceding the date of principal payment for such redemption,
(v) if the Bonds lose the benefit of term, on or after the date the Bonds lose the benefit of term, or
(vi) if stock acquisition rights of a succeeding company, etc. are granted during reorganization acts and it is necessary to suspend requests to exercise the Stock Acquisition Rights, the period for which the Company suspends request to exercise the Stock Acquisition Rights (such period will not exceed one month) or any other period for which necessary information has been notified in advance in writing to the bond administrator and for which public notice of necessary information has been given one month before the commencement of such period.
6. The increases in common stock for shares issued by the Company upon request to exercise the Stock Acquisition Rights shall be the limit for increase in common stock, etc. calculated pursuant to Article 17 of the Regulations of Companies’ Financial Statement multiplied by 0.5, with any fraction less than ¥1 resulting from such calculation, if any, being rounded up. The increases in capital reserve for shares issued by the Company upon such request shall be the amount that is subtracted the increases in common stock from the limit for increase in common stock, etc.
7. Requests for any Stock Acquisition Right may not be partially exercised. 8. For the Bonds with the Stock Acquisition Rights, neither the Stock Acquisition Rights nor the
Bonds may not be separately transferred pursuant to Article 254, Paragraphs 2 and 3 of the Companies Act.
9. Upon the exercise of each Stock Acquisition Right, the Bond to which such Stock Acquisition Right is attached shall be contributed and the value of such Bond shall be an amount equal to the amount to be paid for such Bond.
10. Succession of the Bonds with Stock Acquisition Rights by a succeeding company, etc. in case of the Company’s reorganization acts
(1) In case of its business restructuring, provided, however, that the common stock of a succeeding company, etc. is delivered to its shareholders and redemption before maturity date takes place, the Company shall deliver Stock Acquisition Rights of the succeeding company, etc. (the “Succeeded Stock Acquisition Rights”) described in (2) below to Holders of unexercised Stock Acquisition Rights immediately prior to the

-53-
effective date of reorganization acts. In this case, the Stock Acquisition Rights shall lapse and obligation related to Bonds shall be taken over the succeeding company, etc., (the “Succeeded Bonds”) on the effective date of reorganization acts. At the same time, the Succeeded Stock Acquisition Rights shall become effective as stock acquisition rights attached to Succeeded Bonds and Holders of Stock Acquisition Rights shall become holders of the Succeeded Stock Acquisition Rights. In addition, provisions related to Stock Acquisition Rights in the guidance of the Stock Acquisition Rights shall mutatis mutandis apply to the Succeeded Stock Acquisition Rights.
(2) Matters of the Succeeded Stock Acquisition Rights are as follows. (i) Number of the Succeeded Stock Acquisition Rights
The number of the Succeeded Stock Acquisition Rights shall be equal to that of the unexercised Stock Acquisition Rights immediately prior to the effective date of reorganization acts.
(ii) Class of shares subject to the Succeeded Stock Acquisition Rights Common stock of a succeeding company, etc.
(iii) Method of calculation of the number of shares subject to the Succeeded Stock Acquisition Rights
The number of the shares of the Company’s common stock to be delivered by the Company upon request to exercise the Stock Acquisition Rights shall be the number of which the aggregate amount of the bonds to which the Succeeded Stock Acquisition Rights relating to the exercise request are attached divided by the conversion price defined in (iv), with any fraction less than one share resulting from such calculation, if any, being rounded down, and no cash adjustment will be made in respect thereof.
(iv) Conversion price relating to the bonds with the Succeeded Stock Acquisition Rights
The conversion price relating to the bonds with the Succeeded Stock Acquisition Rights is provided as the economic value gained by the Holders of Stock Acquisition Rights through the exercise of the Succeeded Stock Acquisition Rights immediately after the effective date of reorganization acts, which is equal to that gained by the Holders of Stock Acquisition Rights through the exercise of the Stock Acquisition Rights immediately prior to the effective date of reorganization acts, provided, however, that the conversion price relating to the bonds with the Succeeded Stock Acquisition Rights may be adjusted or reduced as provided in Note 4.
(v) The property to be contributed upon the exercise of the Succeeded Stock Acquisition Rights and its value
Upon the exercise of each Succeeded Stock Acquisition Right, the Succeeded Bond to which such Succeeded Stock Acquisition Right is attached shall be contributed and the value of such Succeeded Bond shall be an amount equal to the amount to be paid for such Bond.
(vi) Exercise period of the Succeeded Stock Acquisition Rights From the effective date of reorganization acts (if the Company suspends request to exercise the Stock Acquisition Rights in accordance with Note 5 (vi), the later day either the effective date of reorganization acts or the following bank business day of the end of the period for which the Company suspends such request) to the end of the Exercise period of the Stock Acquisition Rights
(vii) The increase in common stock and capital reserve in case of issuance of shares through the exercise of the Succeeded Stock Acquisition Rights
The increases in common stock for shares issued by the Company upon request to exercise the Succeeded Stock Acquisition Rights shall be the limit for increase in common stock, etc. calculated pursuant to Article 17 of the Regulations of Companies’ Financial Statement multiplied by 0.5, with any fraction less than ¥1 resulting from such calculation, if any, being rounded up. The increases in capital reserve for shares issued by the Company upon such request shall be the amount that is subtracted the increases in common stock from the limit for increase in common stock, etc.
(viii) Other terms and conditions for exercising the Succeeded Stock Acquisition Rights
Requests for any Succeeded Stock Acquisition Right may not be partially exercised.
(ix) Call attached to the Succeeded Stock Acquisition Rights The Succeeded Stock Acquisition Rights shall not be subject to Call.
(3) Information on moving strike convertible bonds, etc.
Not applicable.

-54-
(4) Information on shareholder right plans
Not applicable.
(5) Changes in the total number of issued shares and the amount of common stock and other
Date
Change in the total number
of issued shares
(shares)
Balance of the total number
of issued shares
(shares)
Change in common
stock (Millions of
yen)
Balance of common
stock (Millions of
yen)
Change in capital reserve
(Millions of yen)
Balance of capital reserve
(Millions of yen)
From April 1, 2007 to March 31, 2008 - 3,368,126,056 - 282,033 - 270,763
From April 1, 2008 to March 31, 2009 - 3,368,126,056 - 282,033 - 270,763
July 31, 2009 (Note 1) - 3,368,126,056 - 282,033 (270,763) -
December 14, 2009 (Note 2) 1,090,000,000 4,458,126,056 120,161 402,195 120,161 120,161
December 25, 2009 (Note 3) 60,000,000 4,518,126,056 6,614 408,809 6,614 126,776
From April 1, 2009 to March 31, 2010 (Note 4) 6,309 4,518,132,365 1 408,810 1 126,777
From April 1, 2010 to March 31, 2011 (Note 4) 2,012,599 4,520,144,964 319 409,129 319 127,096
From April 1, 2011 to March 31, 2012 (Note 4) 117,640,353 4,637,785,317 18,646 427,775 18,646 145,742
(Notes) 1. The capital reserve was reduced to zero and the reduced amount was transferred to “Others” under “Capital surplus,” pursuant to Article 448, Paragraph 1 of the Companies Act.
2. Changes due to issuance of new shares by way of onerous offering (a public offering conducted in Japan and an offering conducted overseas). Offer price: ¥230 per share Issue price: ¥220.48 per share Amount capitalized as common stock: ¥110.24 per share
3. Changes due to issuance of new shares by way of onerous third-party allotment (an issuance of new shares by way of third-party allotment related to secondary offering by way of over-allotment). Issue price: ¥220.48 per share Amount capitalized as common stock: ¥110.24 per share Shares allocated to: Nomura Securities Co., Ltd.
4. Changes due to conversion of stock acquisition rights into stocks. 5. As a result of conversion of stock acquisition rights into stocks during the period from April 1,
2012 to May 31, 2012, the number of issued shares, the mount of common stock and the amount of capital reserve increased 22,080 shares, ¥3.5 million and ¥3.5 million respectively.
(6) Shareholders composition
(As of March 31, 2012)
Class of shareholders
Status of shares (one unit of stock: 1,000 shares) Number of shares less than one
unit (shares)
Government and
municipality
Financial institution
Financial instruments
business operator
Other institution
Foreign corporations, etc. Individuals
and others Total Non-individuals Individuals
Number of shareholders 2 188 85 2,870 777 125 322,657 326,704 -
Share ownership (units)
46 1,452,630 79,754 95,773 1,752,149 510 1,229,141 4,610,003 27,782,317
Ownership percentage of shares (%)
0.00 31.51 1.73 2.08 38.01 0.01 26.66 100.00 -
(Notes) 1. Of 2,620,165 shares of treasury stock, 2,620 units are included in the “Individuals and others” column, while 165 shares are included in the “Number of shares less than one unit” column.
2. Of the shares registered in the name of Japan Securities Depository Center, Incorporated (account for managing stocks whose shareholders have not transferred titles), 26 units are included in the “Other institution” column and 827 shares are included in the “Number of shares less than one unit” column.
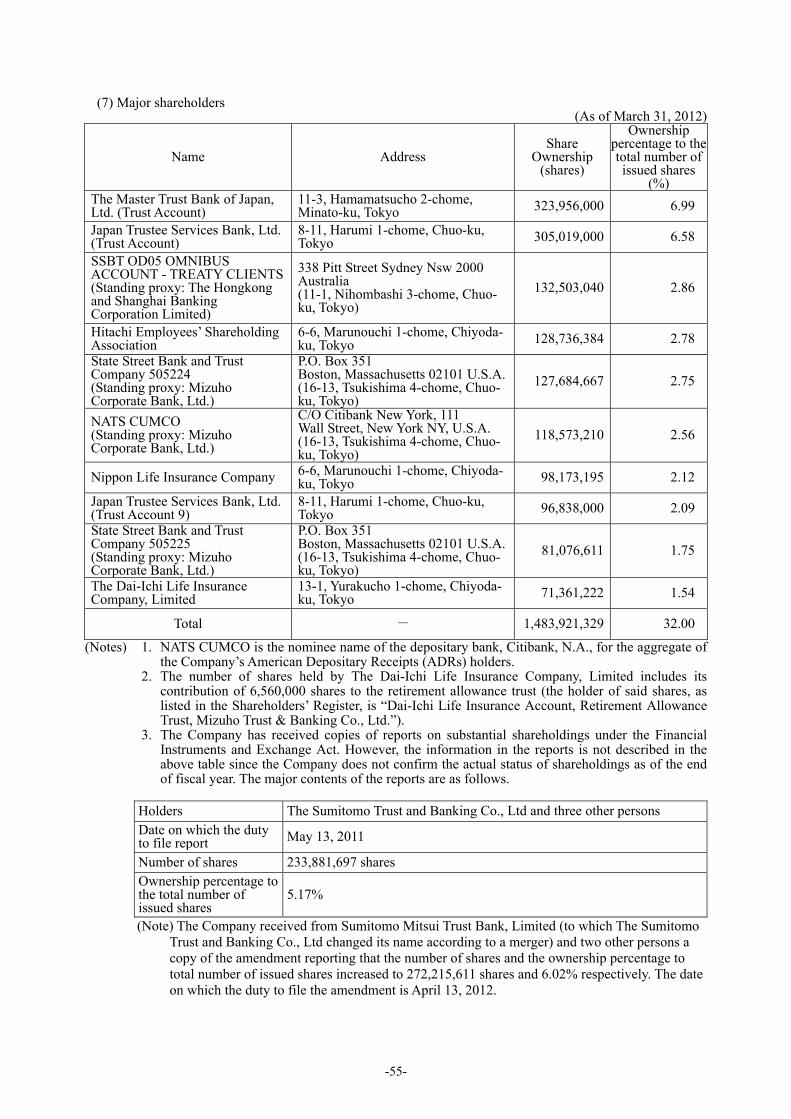
-55-
(7) Major shareholders (As of March 31, 2012)
Name Address Share
Ownership (shares)
Ownership percentage to the total number of issued shares
(%)The Master Trust Bank of Japan, Ltd. (Trust Account)
11-3, Hamamatsucho 2-chome, Minato-ku, Tokyo 323,956,000 6.99
Japan Trustee Services Bank, Ltd. (Trust Account)
8-11, Harumi 1-chome, Chuo-ku, Tokyo 305,019,000 6.58
SSBT OD05 OMNIBUS ACCOUNT - TREATY CLIENTS (Standing proxy: The Hongkong and Shanghai Banking Corporation Limited)
338 Pitt Street Sydney Nsw 2000 Australia (11-1, Nihombashi 3-chome, Chuo-ku, Tokyo)
132,503,040 2.86
Hitachi Employees’ Shareholding Association
6-6, Marunouchi 1-chome, Chiyoda-ku, Tokyo 128,736,384 2.78
State Street Bank and Trust Company 505224 (Standing proxy: Mizuho Corporate Bank, Ltd.)
P.O. Box 351 Boston, Massachusetts 02101 U.S.A. (16-13, Tsukishima 4-chome, Chuo-ku, Tokyo)
127,684,667 2.75
NATS CUMCO (Standing proxy: Mizuho Corporate Bank, Ltd.)
C/O Citibank New York, 111 Wall Street, New York NY, U.S.A. (16-13, Tsukishima 4-chome, Chuo-ku, Tokyo)
118,573,210 2.56
Nippon Life Insurance Company 6-6, Marunouchi 1-chome, Chiyoda-ku, Tokyo 98,173,195 2.12
Japan Trustee Services Bank, Ltd. (Trust Account 9)
8-11, Harumi 1-chome, Chuo-ku, Tokyo 96,838,000 2.09
State Street Bank and Trust Company 505225 (Standing proxy: Mizuho Corporate Bank, Ltd.)
P.O. Box 351 Boston, Massachusetts 02101 U.S.A. (16-13, Tsukishima 4-chome, Chuo-ku, Tokyo)
81,076,611 1.75
The Dai-Ichi Life Insurance Company, Limited
13-1, Yurakucho 1-chome, Chiyoda-ku, Tokyo 71,361,222 1.54
Total - 1,483,921,329 32.00
(Notes) 1. NATS CUMCO is the nominee name of the depositary bank, Citibank, N.A., for the aggregate of the Company’s American Depositary Receipts (ADRs) holders.
2. The number of shares held by The Dai-Ichi Life Insurance Company, Limited includes its contribution of 6,560,000 shares to the retirement allowance trust (the holder of said shares, as listed in the Shareholders’ Register, is “Dai-Ichi Life Insurance Account, Retirement Allowance Trust, Mizuho Trust & Banking Co., Ltd.”).
3. The Company has received copies of reports on substantial shareholdings under the Financial Instruments and Exchange Act. However, the information in the reports is not described in the above table since the Company does not confirm the actual status of shareholdings as of the end of fiscal year. The major contents of the reports are as follows.
Holders The Sumitomo Trust and Banking Co., Ltd and three other personsDate on which the duty to file report May 13, 2011
Number of shares 233,881,697 sharesOwnership percentage to the total number of issued shares
5.17%
(Note) The Company received from Sumitomo Mitsui Trust Bank, Limited (to which The Sumitomo Trust and Banking Co., Ltd changed its name according to a merger) and two other persons a copy of the amendment reporting that the number of shares and the ownership percentage to total number of issued shares increased to 272,215,611 shares and 6.02% respectively. The date on which the duty to file the amendment is April 13, 2012.

-56-
Holders Mitsubishi UFJ Trust and Banking Corporation, and three other personsDate on which the duty to file report May 23, 2011
Number of shares 237,294,613 sharesOwnership percentage to the total number of issued shares
5.24%
(8) Information on voting rights
1) Issued shares (As of March 31, 2012)
Classification Number of shares (shares) Number of voting rights Description
Shares without voting right - - -
Shares with restricted voting right (treasury stock, etc.) - - -
Shares with restricted voting right (others) - - -
Shares with full voting right (treasury stock, etc.) Common stock 2,914,000 - -
Shares with full voting right (others) Common stock 4,607,089,000 4,607,089 -
Shares less than one unit Common stock 27,782,317 - -
Number of issued shares 4,637,785,317 - -
Total number of voting rights - 4,607,089 -
(Note) The “Shares with full voting right (others)” column includes 26,000 shares registered in the name of Japan Securities Depository Center, Incorporated (account for managing stocks whose shareholders have not transferred titles) and 26 voting rights for those shares.
2) Treasury stock, etc.
(As of March 31, 2012)
Name of shareholder Address
Number of shares held
under own name (shares)
Number of shares held under the names of
others (shares)
Total shares held (shares)
Ownership percentage to
the total number of
issued shares (%)
Hitachi, Ltd. 6-6, Marunouchi 1-chome, Chiyoda-ku, Tokyo 2,620,000 - 2,620,000 0.06
Aoyama Special Steel Co., Ltd.
9-11, Shinkawa 2-chome, Chuo-ku, Tokyo 10,000 - 10,000 0.00
ISHII DENKOSHA Co., Ltd.
1-11, Oroshishinmachi 3-chome, Higashi-ku, Niigata-shi, Niigata
1,000 - 1,000 0.00
SAITA KOUGYOU CO., LTD.
5-3, Takinogawa 5-chome, Kita-ku, Tokyo 88,000 - 88,000 0.00
NIKKO SHOKAI CO., LTD.
9-5, Minami-Shinagawa 4-chome, Shinagawa-ku, Tokyo
5,000 - 5,000 0.00
Nitto Jidosha Kiki K.K.
3268, Nagaoka, Ibarakimachi, Higashiibaraki-gun, Ibaraki
52,000 - 52,000 0.00
Hitachi Koki Co., Ltd.
15-1, Konan 2-chome, Minato-ku, Tokyo 123,000 - 123,000 0.00
Mizuho Co., Inc. 4-1, Koishikawa 5-chome, Bunkyo-ku, Tokyo 15,000 - 15,000 0.00
Total - 2,914,000 - 2,914,000 0.06

-57-
(9) Details of stock option plans
Not applicable.
2. Information on Acquisition, etc. of Treasury Stock
Class of shares
Acquisition of common stock less than one unit shares due to purchase requests from shareholders under Article 155, Item 7 of the Companies Act and acquisition of common stock under Article 155, Item 13 of the Companies Act
(1) Acquisition of treasury stock resolved at the general meeting of shareholders
Not applicable.
(2) Acquisition of treasury stock resolved at the Board of Directors meetings
Not applicable.
(3) Details of acquisition of treasury stock not based on the resolutions of the general meeting of
shareholders or the Board of Directors meetings
Acquisition of stock less than one unit shares due to purchase requests from shareholders under Article 192, Paragraph 1 of the Companies Act
Classification Number of shares (shares) Total amount (yen)
Treasury stock acquired during the fiscal year ended March 31, 2012 281,695 125,685,180
Treasury stock acquired during the current period (Note) 32,691 16,927,074
(Note) The number of treasury stock acquired due to requests to purchase stock less than one unit shares from June 1, 2012 to filing date is not included.
Acquisition of treasury stock due to purchase requests from shareholders dissenting from the merger with Hitachi T&D, Ltd. under Article 797, Paragraph 1 of the Companies Act
Classification Number of shares (shares) Total amount (yen)
Treasury stock acquired during the fiscal year ended March 31, 2012 - -
Treasury stock acquired during the current period (Note) 4,141 1,681,246

-58-
(4) Status of the disposition and holding of acquired treasury stock
Classification Fiscal year ended March 31, 2012 Current period (Note)
Number of shares (shares)
Total disposition amount (yen)
Number of shares (shares)
Total disposition amount (yen)
Acquired treasury stock which was offered to subscribers - - - -
Acquired treasury stock which was canceled - - - -
Acquired treasury stock which was transferred due to merger, share exchange or company split
- - - -
Others (Acquired treasury stock which was sold due to requests from shareholders holding shares less than one unit shares to sell additional shares)
82,533 47,742,638 1,664 949,199
Total number of treasury stock held 2,620,165 - 2,655,333 -
(Note) The number of treasury stock which was sold due to requests from shareholders holding less than one unit shares to sell additional shares from June 1, 2012 to the filing date and that of treasury stock acquired due to purchase requests from shareholders holding shares less than one unit shares from June 1, 2012 to the filing date are not included. .

-59-
3. Dividend Policy The Company views enhancement of the long-term and overall interests of shareholders as an important
management objective. The industrial sector encompassing energy, information systems, social infrastracture and other primary
businesses of the Company is undergoing rapid technological innovation and changes in market structure. This makes vigorous upfront investment in R&D and plant and equipment essential for securing and maintaining market competitiveness and improving profitability. Dividends are therefore decided based on medium-to-long term business plans with an eye to ensuring the availability of internal funds for reinvestment and the stable growth of dividends, with appropriate consideration of a range of factors, including the Company’s financial condition, results of operations and dividend payout ratio.
The Company provides in its Articles of Incorporation that distribution of surplus will be made to shareholders of record as of March 31 and September 30 of each year and that the company may make further distribution of surplus to shareholders of record as of another record date for the purpose of distributing surplus. The company also provides in its Articles of Incorporation that the Company may make distribution of surplus by resolution of its Board of Directors, without resolution at the General Meeting of Shareholders.
The Company believes that the repurchase of its shares should be undertaken, when necessary, as part of its policy on distribution to shareholders to complement the dividend payout. In addition, the Company will repurchase its own shares on an ongoing basis in order to flexibly implement a capital strategy, including business restructuring, to maximize shareholder value so far as consistent with the dividend policy. Such action will be taken by the Company after considering its future capital requirement under its business plans, market conditions and other relevant factors.
Based on the above policy, annual dividends of ¥8 per share were paid for the fiscal year ended March 31, 2012. At the Board of Directors meeting held on November 1, 2011, it was resolved to pay interim dividends of ¥3 per share, resulting in the total amount of interim dividends of ¥13,553 million. In addition, at the Board of Directors meeting held on May 10, 2012, it was resolved to pay year-end dividends of ¥5 per share, resulting in the total amount of year-end dividends of ¥23,175 million.
4. Changes in Share Prices
(1) Highest and lowest share prices in each of the recent five fiscal years
Fiscal year 139th business term
140th business term
141st business term
142nd business term
143rd business term
Year end March 2008 March 2009 March 2010 March 2011 March 2012
Highest (yen) 947 843 404 523 547
Lowest (yen) 569 230 227 313 360
(2) Highest and lowest share prices in each of the recent six months
Month October 2011
November 2011
December 2011
January 2012
February 2012
March 2012
Highest (yen) 442 435 438 441 479 547
Lowest (yen) 360 392 400 406 398 454
(Note) The share prices are market prices on the first section of the Tokyo Stock Exchange.

-60-
5. Directors and Senior Management
The Company has adopted the Committee System pursuant to the Companies Act. Information on its Directors and Executive Officers is as follows.
(1) Directors
Position Responsibility Name Date of birth
Business experience, including experience in Hitachi, and functions
Term of office
Share ownership
(shares)
Chairman of the Board
Nominating Committee (Chair)
Takashi Kawamura
Dec. 19, 1939
4/1962 Joined Hitachi, Ltd.
(Note 1) 183,720
6/1992 General Manager, Hitachi Works
6/1995 Director6/1997 Executive Managing Director 4/1999 Executive Vice President and
Representative Director4/2003 Director (Retired in June 2007)
6/2003 Chairman of the Board and Representative Executive Officer, Hitachi Software Engineering Co., Ltd. (Currently Hitachi Solutions, Ltd.)
6/2005 Chairman of the Board, Hitachi Plant Engineering & Construction Co., Ltd. (Currently Hitachi Plant Technologies, Ltd.)
6/2006 Chairman of the Board, Hitachi Software Engineering Co., Ltd.
6/2007 Chairman of the Board, Hitachi Maxell, Ltd.
4/2009 Chairman, President and Chief Executive Officer, Hitachi, Ltd.
6/2009 Chairman, President, Chief Executive Officer and Director, Hitachi, Ltd.
4/2010 Chairman and Director, Hitachi, Ltd.
4/2011 Chairman of the Board, Hitachi, Ltd.
Director
Member of Nominating Committee and Audit Committee
Yoshie Ota Sep. 1, 1942
12/1991 Vice Governor of Ishikawa Prefecture
(Note 1) 28,000
7/1994 Director-General, Minister’s Secretariat, Ministry of Labour
6/1995 Director-General, Women’s Bureau, Ministry of Labour
7/1998 Chairman, Japan Institute of Workers’ Evolution
7/2005 Advisor, Japan Institute of Workers’ Evolution (Retired in March 2010)
6/2007 Director, Hitachi, Ltd.
Director
Member of Nominating Committee and Compensation Committee
Mitsuo Ohashi
Jan. 18, 1936
3/1997 President (CEO) and Representative Director, Showa Denko K.K.
(Note 1) 38,000
1/2005 Chairman of the Board and Representative Director, Showa Denko K.K.
3/2007 Chairman of the Board, Showa Denko K.K.
6/2007 Director, Hitachi, Ltd.3/2010 Advisor, Showa Denko K.K.
(Currently in office)

-61-
Position Responsibility Name Date of birth
Business experience, including experience in Hitachi, and functions
Term of office
Share ownership
(shares)
Director Member of Compensation Committee
Nobuo Katsumata
Dec. 5, 1942
4/2003 Representative Director, President and CEO, Member of the Board, Marubeni Corporation (Note 1) 12,0004/2008 Chairman, Member of the Board, Marubeni Corporation (Currently in office)
6/2011 Director, Hitachi, Ltd.
Director
George Buckley
Feb. 23, 1947
2/1993 Chief Technology Officer, Motors, Drives and Appliances, Emerson Electric Company
(Note 1) 0
9/1994 President, US Electrical Motors, Emerson Electric Company
7/1997 President, Mercury Marine Division and Corporate Vice President, Brunswick Corporation
4/2000 President and Chief Operating Officer, Brunswick Corporation
6/2000 Chairman and Chief Executive Officer, Brunswick Corporation
12/2005 Chairman of the Board, President and Chief Executive Officer, 3M Company
2/2012 Executive Chairman of the Board, 3M Company (Retired in May 2012)
6/2012 Director, Hitachi, Ltd.
Director
Member of Nominating Committee and Audit Committee
Harufumi Mochizuki
Jul. 26, 1949
7/2002 Director-General for Commerce and Distribution Policy, Minister’s Secretariat, Ministry of Economy, Trade and Industry of Japan (“METI”)
(Note 1) 0
7/2003 Director-General, Small and Medium Enterprise Agency, METI
7/2006 Director-General, Agency for Natural Resources and Energy, METI
7/2008 Vice-Minister of Economy, Trade and Industry of Japan
8/2010 Special Advisor to the Cabinet of Japan (Retired in September 2011)
10/2010 Senior Adviser to the Board, Nippon Life Insurance Company (currently in office)
6/2012 Director, Hitachi, Ltd.
Director
Member of Audit Committee and Compensation Committee
Tohru Motobayashi
Jan. 5, 1938
4/1963 Member of the Tokyo Bar Association
(Note 1) 46,750
7/1971 Partner, Mori Sogo Law Offices 4/2002 President of the Japan
Federation of Bar Associations (Retired in March 2004)
6/2006 Director, Hitachi, Ltd.4/2008 Partner, Ihara and Motobayashi
(Currently in office)

-62-
Position Responsibility Name Date of birth
Business experience, including experience in Hitachi, and functions
Term of office
Share ownership
(shares)
Director Philip Yeo Oct. 29, 1946
6/1970 Joined Ministry of Defense of Singapore
(Note 1) 0
9/1979 Permanent Secretary, Ministry of Defense of Singapore
1/1986 Chairman, Economic Development Board of Singapore
2/2001 Chairman, Agency for Science, Technology and Research of Singapore
4/2007 Senior Advisor for Science and Technology to the Ministry of Trade & Industry, Singapore (Retired in September 2008) Special Advisor in Economic Development, Prime Minister’s Office, Government of Singapore (Retired in August 2011) Chairman, SPRING Singapore (currently in office)
9/2011 Chairman, Singbridge International Pte Ltd (currently in office)
6/2012 Director, Hitachi, Ltd.
Director Member of Audit Committee
Michijiro Kikawa
Aug. 2, 1947
4/2006 Representative Executive Officer, President, Chief Executive Officer and Director, Hitachi Construction Machinery Co., Ltd. (Note 1) 0
4/2012 Director, Hitachi Construction Machinery Co., Ltd. (currently in office)
6/2012 Director, Hitachi, Ltd.
Director Stephen Gomersall
Jan. 17, 1948
9/1970 Joined U.K. Foreign and Commonwealth Office
(Note 1) 9,000
7/1999 British Ambassador to Japan (Retired in July 2004)
10/2004 Joined Hitachi, Ltd.11/2005 Chairman of the Board, Hitachi
Europe Ltd. (Currently in office)
10/2006 Senior Vice President and Executive Officer, Hitachi, Ltd. (Retired in March 2011)
6/2011 Director, Hitachi, Ltd.
Director Compensation Committee (Chair)
Hiroaki Nakanishi
Mar. 14,1946
4/1970 Joined Hitachi, Ltd.
(Note 1) 88,000
4/2003 General Manager, Global Business
6/2003 Vice President and Executive Officer
4/2004 Senior Vice President and Executive Officer
6/2005 Senior Vice President and Executive Officer, Hitachi, Ltd. Chairman and Chief Executive Officer, Hitachi Global Storage Technologies, Inc.
4/2006 Executive Vice President and Executive Officer, Hitachi, Ltd. (Retired in December 2006)
4/2009 Executive Vice President and Executive Officer, Hitachi, Ltd.
4/2010 President, Hitachi, Ltd.6/2010 President and Director, Hitachi,
Ltd.

-63-
Position Responsibility Name Date of birth
Business experience, including experience in Hitachi, and functions
Term of office
Share ownership (shares)
Director Takashi Hatchoji
Jan. 27, 1947
4/1970 Joined Hitachi, Ltd.
(Note 1) 70,000
4/2003 General Manager, Legal and Corporate Communications and General Manager, Corporate Auditing
6/2003 Vice President and Executive Officer
4/2004 Senior Vice President and Executive Officer
4/2006 Executive Vice President and Executive Officer (Retired in March 2007)
6/2007 President and Director, Hitachi Research Institute, Ltd.
4/2009 Executive Vice President and Executive Officer, Hitachi, Ltd. (Retired in March 2011)
4/2011 Chairman of the Board, Hitachi America, Ltd. (Currently in office)
6/2011 Director, Hitachi, Ltd.
Director
Audit Committee (Chair) (Standing)
Takashi Miyoshi
Sep. 25, 1947
4/1970 Joined Hitachi, Ltd.
(Note 1) 70,000
4/2003 General Manager, Finance6/2003 Executive Officer4/2004 Senior Vice President and
Executive Officer6/2004 Senior Vice President,
Executive Officer and Director 4/2006 Executive Vice President,
Executive Officer and Director 4/2007 Director (Retired in June 2007) 6/2007 Chairman of the Board, Hitachi
Global Storage Technologies, Inc.
4/2008 Executive Vice President and Executive Officer, Hitachi Systems & Services, Ltd. (Currently Hitachi Solutions, Ltd.)
6/2008 President, Chief Executive Officer and Director, Hitachi Systems & Services, Ltd.
4/2009 Executive Vice President and Executive Officer, Hitachi, Ltd.
6/2009 Executive Vice President, Executive Officer and Director, Hitachi, Ltd.
4/2012 Director, Hitachi, Ltd.Total 545,470
(Notes) 1. The term of office of the Directors starts upon the election at the Ordinary General Meeting of Shareholders on June 22, 2012 and expires at the close of the Ordinary General Meeting of Shareholders for the fiscal year ending March 31, 2013.
2. Ms. Yoshie Ota, Messrs. Mitsuo Ohashi, Nobuo Katsumata, George Buckley, Harufumi Mochizuki, Tohru Motobayashi and Philip Yeo are directors who fulfill the qualification requirements to be outside directors as provided for in Article 2, Item 15 of the Companies Act.

-64-
(2) Executive Officers
Position Responsibility Name Date of birth
Business experience, including experience in Hitachi, and functions
Term of office
Share ownership
(shares)Representative Executive Officer President
Overall management
Hiroaki Nakanishi
See “(1) Directors”
See “(1) Directors” (Note 2) 88,000
Representative Executive Officer Executive Vice President and Executive Officer
Research & development, environmental strategies and medical systems business
Shigeru Azuhata
Nov. 21, 1949
4/1975 Joined Hitachi, Ltd.
(Note 2) 49,000
4/2005 General Manager, Hitachi Research Laboratory
1/2008 General Manager, Environmental Strategy Office
4/2009 Vice President and Executive Officer
4/2011 Senior Vice President and Executive Officer
4/2012 Executive Vice President and Executive Officer
Representative Executive Officer Executive Vice President and Executive Officer
Power systems business and infrastructure systems business
Koji Tanaka
Jan. 22, 1952
4/1974 Joined Hitachi, Ltd.
(Note 2) 35,000
5/2006 General Manager, Hitachi Works, Power Systems
4/2007 Vice President and Executive Officer
4/2011 Executive Vice President and Executive Officer
Representative Executive Officer Executive Vice President and Executive Officer
Information & telecommunication systems business and information technology
Junzo Nakajima
Feb. 8, 1949
5/1972 Joined Hitachi, Ltd.
(Note 2) 36,000
4/2005 Chief Operating Officer, Information & Telecommunication Systems
4/2006 Vice President and Executive Officer
4/2009 Senior Vice President and Executive Officer
4/2011 Executive Vice President and Executive Officer
Representative Executive Officer Executive Vice President and Executive Officer
Management Strategies, finance and corporate pension system
Toyoaki Nakamura
Aug. 3, 1952
4/1975 Joined Hitachi, Ltd.
(Note 2) 38,000
1/2006 General Manager, Finance Department I
4/2007 Senior Vice President and Executive Officer
6/2007 Senior Vice President, Executive Officer and Director
6/2009 Senior Vice President and Executive Officer
4/2012 Executive Vice President and Executive Officer
Representative Executive Officer Executive Vice President and Executive Officer
High functional materials & components, quality assurance, production engineering, battery systems business and automotive systems business
Nobuo Mochida
Apr. 1, 1947
4/1970 Joined Hitachi Metals, Ltd.
(Note 2) 21,000
6/2006 President and Chief Executive Officer and Director, Hitachi Metals, Ltd.
4/2010 Executive Vice President and Executive Officer, Hitachi, Ltd. Chairman of the Board, Hitachi Metals, Ltd. (Currently in office)

-65-
Position Responsibility Name Date of birth
Business experience, including experience in Hitachi, and functions
Term of office
Share ownership
(shares)
Executive Vice President and Executive Officer
Hitachi group global business (Asia Pacific)
Kazuhiro Mori
Oct. 7, 1946
4/1969 Joined Hitachi, Ltd.
(Note 2) 54,000
2/1999 General Manager, Chubu Area Operation
6/2003 Executive Officer 4/2004 Vice President and
Executive Officer 4/2006 Senior Vice President and
Executive Officer 1/2007 Executive Vice President
and Executive Officer
Senior Vice President and Executive Officer
Information & telecommunication systems business
Shinjiro Iwata
Jun. 6, 1948
4/1972 Joined Hitachi, Ltd.
(Note 2) 31,000
10/2007 Executive Vice President, Hitachi Global Storage Technologies, Inc.
4/2009 Vice President and Executive Officer, Hitachi, Ltd.
4/2011 Senior Vice President and Executive Officer, Hitachi, Ltd.
Senior Vice President and Executive Officer
Cost structure reform and consumer business
Makoto Ebata
Feb. 23, 1947
4/1970 Joined Hitachi, Ltd.
(Note 2) 44,000
4/2000 General Manager, Procurement Division
2/2002 General Manager, Group Management Office
6/2003 Executive Officer 4/2004 Vice President and
Executive Officer (Retired in March 2008)
4/2008 Deputy Chairman, Hitachi Europe Ltd.
7/2009 Vice President and Executive Officer, Hitachi, Ltd.
4/2011 Senior Vice President and Executive Officer, Hitachi, Ltd.
Senior Vice President and Executive Officer
Human capital, legal and corporate communications, government & external relations, corporate brand and corporate auditing
Toshiaki Kuzuoka
Nov. 3, 1954
4/1978 Joined Hitachi, Ltd.
(Note 2) 170,000
4/2001 General Manager, Legal Division
4/2007 Vice President and Executive Officer
4/2011 Senior Vice President and Executive Officer
Senior Vice President and Executive Officer
Infrastructure systems business and medical systems business
Yutaka Saito
Dec. 11, 1954
4/1979 Joined Hitachi, Ltd.
(Note 2) 18,000
10/2009 President & CEO, Information & Control Systems Company
4/2010 Vice President and Executive Officer
4/2012 Senior Vice President and Executive Officer
Representative Executive Officer Senior Vice President and Executive Officer
Sales operations, Hitachi group global business and corporate export regulation
Masahide Tanigaki
Jan. 11, 1951
4/1975 Joined Hitachi, Ltd.
(Note 2) 26,400
10/2009 Deputy General Manager, Power Systems Sales Management Division, Power Systems Company
4/2010 Vice President and Executive Officer
4/2012 Senior Vice President and Executive Officer
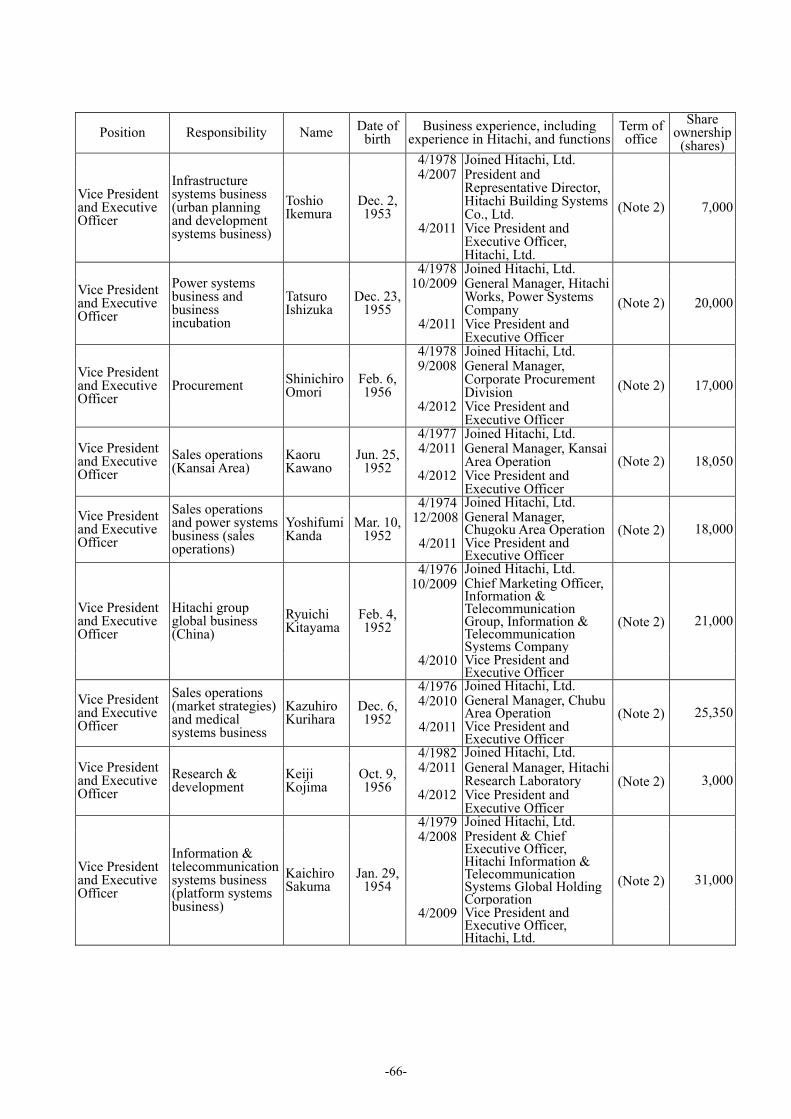
-66-
Position Responsibility Name Date of birth
Business experience, including experience in Hitachi, and functions
Term of office
Share ownership
(shares)
Vice President and Executive Officer
Infrastructure systems business (urban planning and development systems business)
Toshio Ikemura
Dec. 2, 1953
4/1978 Joined Hitachi, Ltd.
(Note 2) 7,000
4/2007 President and Representative Director, Hitachi Building Systems Co., Ltd.
4/2011 Vice President and Executive Officer, Hitachi, Ltd.
Vice President and Executive Officer
Power systems business and business incubation
Tatsuro Ishizuka
Dec. 23, 1955
4/1978 Joined Hitachi, Ltd.
(Note 2) 20,000
10/2009 General Manager, Hitachi Works, Power Systems Company
4/2011 Vice President and Executive Officer
Vice President and Executive Officer
Procurement Shinichiro Omori
Feb. 6, 1956
4/1978 Joined Hitachi, Ltd.
(Note 2) 17,000
9/2008 General Manager, Corporate Procurement Division
4/2012 Vice President and Executive Officer
Vice President and Executive Officer
Sales operations (Kansai Area)
Kaoru Kawano
Jun. 25, 1952
4/1977 Joined Hitachi, Ltd.
(Note 2) 18,0504/2011 General Manager, Kansai
Area Operation4/2012 Vice President and
Executive Officer
Vice President and Executive Officer
Sales operations and power systems business (sales operations)
Yoshifumi Kanda
Mar. 10, 1952
4/1974 Joined Hitachi, Ltd.
(Note 2) 18,00012/2008 General Manager,
Chugoku Area Operation 4/2011 Vice President and
Executive Officer
Vice President and Executive Officer
Hitachi group global business (China)
Ryuichi Kitayama
Feb. 4, 1952
4/1976 Joined Hitachi, Ltd.
(Note 2) 21,000
10/2009 Chief Marketing Officer, Information & Telecommunication Group, Information & Telecommunication Systems Company
4/2010 Vice President and Executive Officer
Vice President and Executive Officer
Sales operations (market strategies) and medical systems business
Kazuhiro Kurihara
Dec. 6, 1952
4/1976 Joined Hitachi, Ltd.
(Note 2) 25,3504/2010 General Manager, Chubu
Area Operation4/2011 Vice President and
Executive Officer
Vice President and Executive Officer
Research & development
Keiji Kojima
Oct. 9, 1956
4/1982 Joined Hitachi, Ltd.
(Note 2) 3,0004/2011 General Manager, Hitachi
Research Laboratory 4/2012 Vice President and
Executive Officer
Vice President and Executive Officer
Information & telecommunication systems business (platform systems business)
Kaichiro Sakuma
Jan. 29, 1954
4/1979 Joined Hitachi, Ltd.
(Note 2) 31,000
4/2008 President & Chief Executive Officer, Hitachi Information & Telecommunication Systems Global Holding Corporation
4/2009 Vice President and Executive Officer, Hitachi, Ltd.

-67-
Position Responsibility Name Date of birth
Business experience, including experience in Hitachi, and functions
Term of office
Share ownership
(shares)
Vice President and Executive Officer
Government & external relations
Yasuo Tanabe
Oct. 5, 1954
4/1978 Joined Ministry of International Trade and Industry
(Note 2) 5,000
8/2006 Deputy Director-General, Economic Affairs Bureau, Ministry of Foreign Affairs (Retired in March 2010)
6/2010 Joined Hitachi, Ltd. 4/2011 Vice President and
Executive Officer, Hitachi, Ltd.
Vice President and Executive Officer
Infrastructure systems business (transportation systems business)
Hiroshi Nakayama
Dec. 15, 1953
4/1977 Joined Hitachi, Ltd.
(Note 2) 25,0004/2011 President & CEO, Rail
Systems Company 4/2012 Vice President and
Executive Officer
Vice President and Executive Officer
Management strategies
Toshikazu Nishino
Jan. 9, 1955
4/1980 Joined Hitachi, Ltd.
(Note 2) 8,000
4/2010 Senior Manager, Strategy & Project Office, Supervisory Office for Management Reforms
4/2011 Vice President and Executive Officer
Vice President and Executive Officer
Power systems business (nuclear power systems business promotion)
Masaharu Hanyu
Feb. 20, 1951
4/1975 Joined Hitachi, Ltd.
(Note 2) 29,000
7/2007 President and Representative Director, Hitachi-GE Nuclear Energy, Ltd.
4/2011 Vice President and Executive Officer, Hitachi, Ltd.
Vice President and Executive Officer
Infrastructure systems business
Toshiaki Higashihara
Feb. 16, 1955
4/1977 Joined Hitachi, Ltd.
(Note 2) 30,000
4/2006 Chief Operating Officer, Information & Telecommunication Systems
4/2007 Vice President and Executive Officer (Retired in March 2008)
4/2008 President, Hitachi Power Europe GmbH
4/2010 President and Chief Executive Officer, Hitachi Plant Technologies, Ltd.
6/2010 President and Representative Director, Hitachi Plant Technologies, Ltd. (Currently in office)
4/2011 Vice President and Executive Officer, Hitachi, Ltd.
Vice President and Executive Officer
Human capital Naoki Mitarai
Oct. 30, 1952
4/1976 Joined Hitachi, Ltd.
(Note 2) 23,000
4/2010 General Manager, Corporate Administration Division, Human Capital Group
4/2011 Vice President and Executive Officer
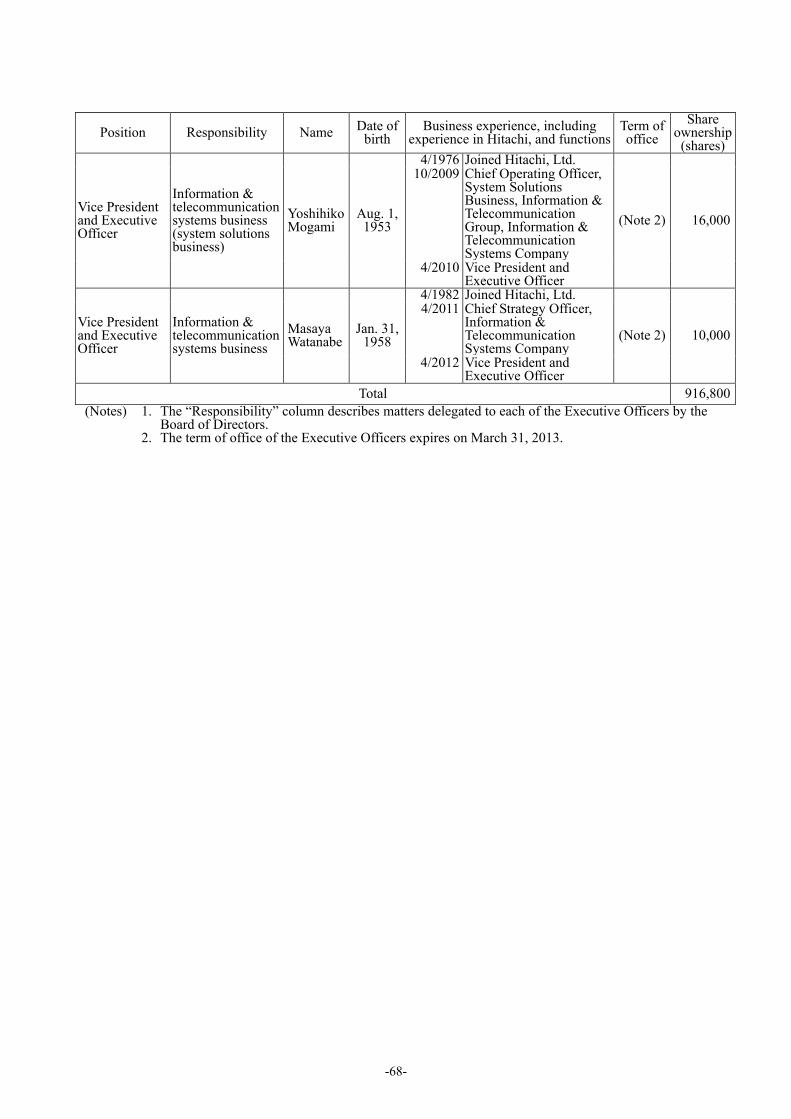
-68-
Position Responsibility Name Date of birth
Business experience, including experience in Hitachi, and functions
Term of office
Share ownership
(shares)
Vice President and Executive Officer
Information & telecommunication systems business (system solutions business)
Yoshihiko Mogami
Aug. 1, 1953
4/1976 Joined Hitachi, Ltd.
(Note 2) 16,000
10/2009 Chief Operating Officer, System Solutions Business, Information & Telecommunication Group, Information & Telecommunication Systems Company
4/2010 Vice President and Executive Officer
Vice President and Executive Officer
Information & telecommunication systems business
Masaya Watanabe
Jan. 31, 1958
4/1982 Joined Hitachi, Ltd.
(Note 2) 10,000
4/2011 Chief Strategy Officer, Information & Telecommunication Systems Company
4/2012 Vice President and Executive Officer
Total 916,800(Notes) 1. The “Responsibility” column describes matters delegated to each of the Executive Officers by the
Board of Directors. 2. The term of office of the Executive Officers expires on March 31, 2013.

-69-
6. Corporate Governance, etc.
(1) Corporate governance 1) Outline of corporate organizations The Company has adopted the Committee System under the Companies Act, aiming to establish a
framework for quick business operation and to realize highly transparent management by separating responsibilities for management oversight and those for execution of business operations.
Board of Directors
The Board of Directors approves basic management policy for the Hitachi Group and supervise the execution of the duties of executive officers and directors in order to sustainably enhance corporate value and the shareholders’ common interests. The basic management policy includes medium-term management plan and annual budget compilation. The Board of Directors focuses on strategic issues related to the basic management policy as well as other items to be resolved that are provided in laws, regulations, the Articles of Incorporation and Board of Directors Regulations. As of June 22, 2012, the Board of Directors was made up of 13 Directors, and seven of whom are outside Directors and one concurrently serves as an Executive Officer. The Chairman of the Board does not concurrently serve as an Executive Officer. Within the Board of Directors, there are three statutory committees of the Nominating Committee, the Audit Committee and the Compensation Committee with outside Directors accounting for the majority of members of each committee. The Board of Directors meetings were held 9 days during the fiscal year ended March 31, 2012, and the attendance rate of Directors at those meetings was 98%. The Nominating Committee was held 5 days, the Audit Committee was held 12 days, and the Compensation Committee was held 5 days during the fiscal year ended March 31, 2012.
The Nominating Committee has the authority to determine particular proposals submitted to the general meeting of shareholders for the election and dismissal of Directors, and consists of four Directors, three of whom are outside Directors.
The Audit Committee has the authority to audit the execution of duties of Directors and Executive Officers and to determine on proposals submitted to the general meeting of shareholders for the election and dismissal of accounting auditors, and consists of five Directors, including three outside Directors and one standing Audit Committee member. Mr. Takashi Miyoshi, the Chair of the Audit Committee, has considerable knowledge of finance and accounting due to his long experience as the General Manager of the Finance Department I of the Company and the Executive Officer in charge of accounting and financing of the Company for many years.
The Compensation Committee has the authority to determine remuneration policies for Directors and Executive Officers and remuneration for individuals based on them. The Compensation Committee consists of four Directors, three of whom are outside Directors.
With regard to the number of Directors and their election, the Company stipulates in its Articles of Incorporation that the Company shall have not more than twenty (20) Directors. With regard to the adoption of resolution for the election of Directors, the Company stipulates in its Articles of Incorporation that the presence of shareholders representing one-third or more of the voting, that resolutions for the election of Directors shall be approved by attending shareholders possessing one-third or more of all voting rights of the shareholders who are entitled to exercise their votes, and that the resolution shall not be made by cumulative voting.
Executive Officers
Executive Officers decide on matters delegated to them by the Board of Directors and execute the Company’s business affairs within the scope of assignments determined by the Board of Directors. As of June 22, 2012, the Company has 29 Executive Officers.
The Company stipulates in its Articles of Incorporation that the Company shall have not more than forty (40) Executive Officers.

-70-
Senior Executive Committee The Senior Executive Committee is a council to ensure that President deliberately decides on
important managerial matters, which may affect the Company or the Hitachi Group business, through discussing from diverse viewpoints. It consists of 9 members as of June 22, 2012; President, five Executive Vice President and Executive Officers and three Senior Vice President and Executive Officers.
2) Matters determined by resolution of the Board of Directors without resolution at the general meeting
of shareholders pursuant to the provisions of the Articles of Incorporation The Company stipulates in the Articles of Incorporation that it may, unless otherwise provided in
the applicable laws, determine on matters specified in each item of Article 459, Paragraph 1 of the Companies Act by the resolution of the Board of Directors, without resolution at the general meeting of shareholders.
For the repurchase of the company’s own its shares (Article 459, Paragraph 1, Item 1 of the Companies Act), the Board of Directors shall determine on the matter in order to enable timely implementation of capital strategies.
Regarding reduction of capital reserve or earned surplus reserve (Article 459, Paragraph 1, Item 2 of the Companies Act), appropriation of surplus (excluding dividends of surplus and disposal of the property of the Company) (Article 459, Paragraph 1, Item 3 of the Companies Act) and dividends of surplus (Article 459, Paragraph 1, Item 4 of the Companies Act), since the Company was a company with committees as of the date of enforcement of the Companies Act, it was deemed that its Articles of Incorporation had stipulations that the Board of Directors was able to decide the above matters without resolution at the general meeting of shareholders and that it should not stipulate that such matters shall be resolved at the resolution of the general meeting of shareholders, in accordance with Article 57 of the Act on Arrangement of Relevant Acts Incidental to Enforcement of the Companies Act (July 26, 2005, Act No. 87). Even after the enforcement of the Companies Act, the Company has made it a rule to timely decide on these important business judgments by the Board of Directors to enhance the shareholders’ common interests.
The Company has stipulated in its Articles of Incorporation that it may, by resolution of the Board of Directors, exempt any Director (including former Director) and Executive Officer (including former Executive Officer) from liabilities as provided Article 423, Paragraph 1 of the Companies Act to the extent as provided in laws or regulations.
3) Requirement for special resolution of the general meeting of shareholders
To enable to securely meet the quorum of the general meeting of shareholders under Article 309, Paragraph 2 of the Companies Act, the Company stipulates in its Articles of Incorporation that any resolution as provided in Article 309, Paragraph 2 of the Companies Act shall be adopted at a General Meeting of Shareholders where shareholders representing one-third or more of the voting rights of all the shareholders shall be present, by a majority of two-thirds or more of the voting rights of the shareholders who are present in such meeting and are entitled to vote.
4) Internal control system and risk management system
Outlines of the internal control system and the risk management system of the Company are as follows. In addition, these systems were resolved by the Board of Directors as the basic policy for internal control system under the Companies Act.
(a) When necessary, the Board of Directors may appoint one or more director(s), who does not serve concurrently as an executive officer, as a director responsible for assisting with the duties of the Audit Committee. In addition, the Board of Directors Office (the “Office”) shall be established specifically to assist with the duties of each Committee and the Board of Directors and staffed with personnel who are not subject to orders and instructions of Executive Officers.
(b) In order to ensure the independence of the Office personnel from Executive Officers, the Audit Committee shall be informed in advance of planned transfers of the Office personnel.
(c) Executive Officers and employees shall report without delay to the members of the Audit

-71-
Committee significant matters affecting the whole Company, results of internal audits, and the implementation status of reporting under the internal reporting system.
(d) In order to ensure the effectiveness of audits by the Audit Committee, standing Committee member(s) shall be appointed to the Audit Committee, and activity plans of the Audit Committee shall be prepared in coordination with the audit plans of Internal Auditing Office.
(e) A reporting system to Directors shall be established to ensure that the execution of duties by Executive Officers is in compliance with laws, regulations, and the Articles of Incorporation.
(f) Information pertaining to the execution of duties by Executive Officers shall be prepared and maintained in accordance with internal rules.
(g) A structure shall be established in which each relevant department shall establish regulations and guidelines, conduct training, prepare and distribute manuals, and carry out other such measures with respect to various risks. Efforts shall be made to identify possible new risks through such things as progress reports on business operations and, should it become necessary to respond to a new risk, an Executive Officer responsible for responding thereto shall be appointed promptly.
(h) Efficient performance of duties shall be ensured through the following business management systems.
- The Senior Executive Committee shall be established in order to deliberate on and facilitate the formulation of decisions based on due consideration of diverse factors regarding important issues that affect the Company and/or the Hitachi Group.
- Based on the management policy, medium-term business plans and annual budgets, on which performance management is based, shall be prepared in order to operate business in a planned and efficient manner.
- Internal audits shall be conducted by Internal Auditing Office to monitor and identify the status of business operations and to facilitate improvements.
- The Audit Committee shall receive the audit plans of the accounting auditors in advance, and the prior approval of the Audit Committee shall be required with respect to the fees to be paid to and non-audit services to be requested of the accounting auditors.
- Documented business processes shall be executed, and internal and external auditors shall examine said processes in order to ensure the reliability of financial reports.
(i) Continuous maintenance of a legal and regulatory compliance structure shall be ensured through the following business management systems.
- Internal audits shall be conducted, and various committees shall be established for legal and regulatory compliance activities. Furthermore, an internal reporting system shall be established and education on legal and regulatory compliance shall be provided.
- Various corporate rules and regulations shall be established, and efforts shall be made to ensure that the employees are aware of the internal control systems overall and that the systems are effective.
(j) The following measures shall be effective to ensure the adequacy of business operations within the Hitachi Group.
- Such fundamental policies as the emphasis of the social responsibilities of business enterprises shall be shared with the Group companies.
- A group-wide policy for compliance with applicable laws and regulations shall be established as necessary.
- Internal audits of Company departments and Group companies shall be conducted periodically, and Directors and Corporate Auditors shall be sent from the Company to Group companies. Each company shall execute documented business processes on matters that should be reflected in financial reports, and Corporate Auditors and others shall examine said processes.
- A structure for the adequate and efficient conduct of business operations common to Group companies shall be established.
- The policy on transactions within the Hitachi Group is to trade fairly based on market prices.

-72-
5) Internal audit and audit by the Audit Committee (a) Internal audit
The Internal Auditing Office is in charge of internal audit within Hitachi Group and audits in-house companies, corporate divisions of headquarters and subsidiaries and affiliates. The number of staff of the Internal Auditing Office is 36 as of March 31, 2012.
The Internal Auditing Office monitors and assesses whether overall business operations, including marketing, personnel management, labor management, procurement transactions, production, information system, accounting and financing activities, and property management of Hitachi Group are properly carried out pursuant to audit standards established by the Company, and points out items required to be improved based on the results of auditing and follows up their improvements. The Internal Auditing Office reports in advance its internal audit plan to the Audit Committee, and reports results of auditing to the President and the Audit Committee. Furthermore, relating to the internal control over financial reporting, the internal control division in the Internal Audit Office promotes to establish and maintain the internal control systems pursuant to the Company’s guideline, assesses its effectiveness, and reports the results to the President and the Audit Committee.
In addition, each division in charge of compliance, information security, environment and export regulations investigates and evaluates compliance with related laws and regulations, and instructs improvements if necessary.
(b) Audit by the Audit Committee
The Audit Committee conducts audits for whether corporate administration by Directors and Executive Officers are properly carried out under appropriate internal control systems.
The Audit Committee develops the audit policy and the audit plan, and periodically receives reports or conducts hearing for execution of duties from Directors and Executive Officers. In addition, the standing members of the Audit Committee investigate major facilities and receive reports from subsidiaries in order to check whether business transaction and property management are properly carried out, and then report the results to the Audit Committee. Furthermore, the standing members of the Audit Committee attend the important meetings including the budget meeting, inspect documents submitted to the Senior Executive Committee and audit reports from internal audit divisions, and provide internal audit divisions with instructions about divisions to be subject to auditing and items to be focused, if necessary.
The Audit Committee receives reports and explanations about the audit plan and results of the audit from the accounting auditor, and based on the reports, verifies results of financial audits and internal control audits. In addition, the Audit Committee receives reports and explanations of quality control systems of the accounting auditor. Furthermore, the Company makes it a rule to obtain the prior approval of the Audit Committee for remuneration to the accounting auditor and non-audit services to be provided by the accounting auditor.
6) Outside Directors
(a) Qualification for the outside Directors and criteria for the independency For electing an outside Director, the Nominating Committee of the Company considers, in
addition to the following criteria for the independency, whether the outside Director has the highest personal and professional ethics, integrity and insight, and distinguished records of leadership or experience at policy making levels in business, law, administration, accounting or education, etc.
For the independency of an outside Director, the Company considers the outside director to be independent unless:
- his or her immediate family member* is, or has been within the last three years, an executive director or an executive officer, of the Company or any of its subsidiaries;
- he or she is currently an executive director, an executive officer or an employee of a company that has made payments to, or received payments from, the Company for property or services in an amount which, in any of the last three fiscal years, exceeds 2% of any of the companies’ consolidated gross revenues;

-73-
- he or she has received during any of the last three fiscal years more than ¥10 million in direct compensation for his or her service as a specialist in law, accounting or tax, or as a consultant from the Company, other than director compensations; or
- he or she serves as an executive officer or director of a not-for-profit organization, and the Company’s discretionary charitable contributions to the organization in any of the last three fiscal years are more than ¥10 million and 2% of that organization’s annual gross revenues. * An “immediate family member” includes a person’s spouse, parents, children, siblings, grand-parents, grand-children, mothers and fathers-in-law, sons and daughters-in-law, spouses of siblings, grand-children-in-law, and brothers and sisters-in-law.
(b) Function of the outside Directors
Following the policy stated in “(a) Qualification for outside Directors and criteria for the independency,” the Company has elected seven persons; Ms. Yoshie Ota and Messrs. Mitsuo Ohashi, Nobuo Katsumata, George Buckley, Harufumi Mochizuki, Tohru Motobayashi and Philip Yeo, as outside Directors under Article 2, Item 15 of the Companies Act. Each outside Director is enhancing functions of the Company’s Board of Directors through supervising execution of duties of Executive Officers and others from an independent perspective, based on diverse experiences and insights in such areas as public administration in the cases of Ms. Yoshie Ota and Messrs. Harufumi Mochizuki and Philip Yeo, based on rich experiences and insights as top executive of major global companies in the cases of Messrs. Mitsuo Ohashi, Nobuo Katsumata and George Buckley, and based on rich experiences and insights as a legal expert in the case of Mr. Tohru Motobayashi.
(c) Supervising by the outside Directors
Outside Directors, comprising of majority of Directors, supervise execution of duties of Executive Officers from an independent perspective. As described in the item “5) Internal audit and audit by the Audit Committee” above, the Audit Committee, of which majority members are outside Directors, receives reports and explanations about results of internal audits, accounting audit and internal control audit, and verifies the matters reported or explained. In addition, the Audit Committee reports the results of its verification to the Board of Directors.
(d) Relationship between outside Directors and the Company
Each of outside Directors has no relationship with the Company regarding his or her independency as described in “(a) Qualification for the outside Directors and criteria for the independency.” In addition, there is no particular conflict of interest between each of outside Directors and the Company. Furthermore, Ihara and Motobayashi Law Office, of which Mr. Tohru Motobayashi is a partner, is not a legal counsel to the Company, and there is no contractual relationship between Mr. Tohru Motobayashi and the Company in relation to legal services.
The Company considers that all outside Directors are independent, and therefore has notified all seven outside Directors as independent directors to each of the Company’s listing stock exchanges in Japan.
The Company maintains a limited liability agreement (hereinafter referred to as “Agreement”) stipulated in Article 427, Paragraph 1 of the Companies Act with Ms. Yoshie Ota and Messrs. Mitsuo Ohashi, Nobuo Katsumata, George Buckley, Harufumi Mochizuki, Tohru Motobayashi and Philip Yeo. The general intent of the Agreement is to limit the liability of outside Directors to the aggregate amount of the sums stipulated in each item under Article 425, Paragraph 1 of the Companies Act.
In addition, the number of shares of the Company owned by each outside Director is described in “5. Directors and Senior Management.”

-74-
7) Status of accounting audit Certified public accountants (CPAs) who executed accounting audit of the Company are as follows.
In addition, other CPAs and staff belonging to Ernst & Young ShinNihon LLC assisted execution of accounting audit works as instructed by the three CPAs.
CPA having executed accounting audit woks
Audit corporation to which CPA belongs
Koichi Tsuji Ernst & Young ShinNihon LLC
Takashi Ouchida Ernst & Young ShinNihon LLC
Takahiro Saga Ernst & Young ShinNihon LLC
8) Compensation to Directors and Executive Officers
(a) Policy on the determination of Compensation of Directors and Executive Officers [Method of Determination of Policy]
The Company’s Compensation Committee sets forth the policy on the determination of the amount of compensation, etc. of each Director and Executive Officer pursuant to applicable provisions of the Companies Act concerning companies with the Committee System.
[Summary of Policy] (i) Matters relating to both Directors and Executive Officers
Compensation will be commensurate with the ability required of, and the responsibilities to be borne by, the Company’s Directors and Executive Officers, taking into consideration compensation packages at other companies.
(ii) Matters relating to Directors Compensation for Directors will consist of a monthly salary and a year-end
allowance. - Monthly salary will be decided by making adjustments to basic salary that
reflect full-time or part-time status, committee membership and position, travel from place of residence, etc.
- Year-end allowance will be a pre-determined amount equivalent to about twenty percent of the Director’s annual income based on monthly salary, although this amount may be reduced depending on Company performance. A Director concurrently serving as an Executive Officer will not be paid
compensation as a Director. (iii) Matters relating to Executive Officers
Compensation for Executive Officers will consist of a monthly salary and a performance-linked component.
- Monthly salary will be decided by adjusting a basic amount set in accordance with the relevant position to reflect the results of an assessment.
- The performance-linked component will be set within a range equivalent to about thirty percent of the Executive Officer’s annual income, adjusted based on Company and individual performance.
(iv) Miscellaneous It was decided at the Compensation Committee meetings held on December 18,
2007 and March 26, 2008 that the compensation structure for Directors and Executive Officers will be re-examined starting with the compensation for fiscal 2008 and that the retirement allowance will be abolished. The payment of retirement allowance to Directors and Executive Officers due to the abolition of the retirement allowance system will be in an amount determined by the Compensation Committee at the time of the retirement of a relevant Director or Executive Officer.
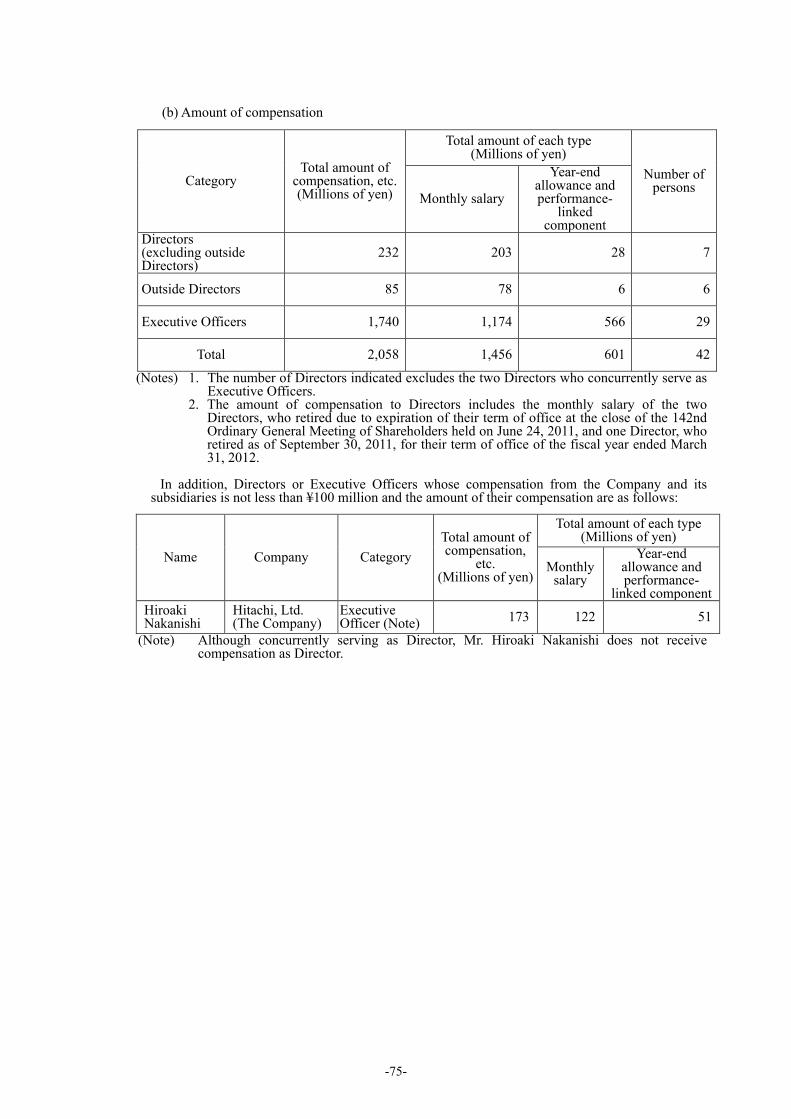
-75-
(b) Amount of compensation
Category Total amount of
compensation, etc. (Millions of yen)
Total amount of each type (Millions of yen)
Number of persons
Monthly salary
Year-end allowance and performance-
linked component
Directors (excluding outside Directors)
232 203 28 7
Outside Directors 85 78 6 6
Executive Officers 1,740 1,174 566 29
Total 2,058 1,456 601 42
(Notes) 1. The number of Directors indicated excludes the two Directors who concurrently serve as Executive Officers.
2. The amount of compensation to Directors includes the monthly salary of the two Directors, who retired due to expiration of their term of office at the close of the 142nd Ordinary General Meeting of Shareholders held on June 24, 2011, and one Director, who retired as of September 30, 2011, for their term of office of the fiscal year ended March 31, 2012.
In addition, Directors or Executive Officers whose compensation from the Company and its
subsidiaries is not less than ¥100 million and the amount of their compensation are as follows:
Name Company Category
Total amount of compensation,
etc. (Millions of yen)
Total amount of each type (Millions of yen)
Monthly salary
Year-end allowance and performance-
linked componentHiroaki Nakanishi
Hitachi, Ltd. (The Company)
Executive Officer (Note) 173 122 51
(Note) Although concurrently serving as Director, Mr. Hiroaki Nakanishi does not receive compensation as Director.

-76-
9) Information on shareholdings (a) Equity securities held for purposes other than pure investment
Number of stock names: 412 stock names Total amount recorded in the balance sheet: ¥195,450 million
(b) Stock name, number of shares, amount recorded in the balance sheet, and purpose of holding
regarding equity securities held for purposes other than pure investment (Fiscal year ended March 31, 2011)
Specified investment securities
Stock name Number of
shares (shares)
Balance sheet amount
(Millions of yen)Purpose of holding
Central Japan Railway Company 9,000 5,931 Maintaining and enhancing business
transactions
Yungtay Engineering Co., Ltd. 31,817,168 4,154 Maintaining and enhancing business relationship
East Japan Railway Company 790,000 3,653 Maintaining and enhancing business transactions
Electric Power Development Co., Ltd. 1,307,580 3,350 Maintaining and enhancing business
transactions
The Japan Steel Works, LTD. 5,050,000 3,287 Maintaining and enhancing business transactions
JX Holdings, Inc. 4,888,149 2,737 Maintaining and enhancing business transactions
NIPPON TELEGRAPH AND TELEPHONE CORPORATION
612,000 2,285 Maintaining and enhancing business transactions
Chubu Electric Power Co., Inc. 1,200,254 2,220 Maintaining and enhancing business transactions
The Chugoku Electric Power Co., Inc. 1,312,622 2,018 Maintaining and enhancing business
transactions
Shin-Etsu Chemical Co., Ltd. 471,000 1,947 Maintaining and enhancing business transactions
NGK INSULATORS, LTD. 1,214,483 1,805 Maintaining and enhancing business transactions
The Chiba Bank, Ltd. 3,269,000 1,523 Maintaining and enhancing business transactions
The Dai-ichi Life Insurance Company, Limited 12,100 1,518 Maintaining and enhancing business
transactions
Tohoku Electric Power Co., Inc. 1,010,000 1,419 Maintaining and enhancing business
transactions
ShinMaywa Industries, Ltd. 4,000,337 1,404 Maintaining and enhancing business transactions
Kyushu Electric Power Co. Inc. 790,000 1,283 Maintaining and enhancing business
transactions
Showa Denko K.K. 6,593,332 1,101 Maintaining and enhancing business transactions

-77-
Stock name Number of
shares (shares)
Balance sheet amount
(Millions of yen)Purpose of holding
NKSJ Holdings, Inc. 2,000,000 1,086 Maintaining and enhancing business transactions
Hokuriku Electric Power Company 576,000 1,085 Maintaining and enhancing business
transactions
JOYO BANK, Ltd. 2,956,000 966 Maintaining and enhancing business transactions
Sapporo Holdings Limited 2,988,000 926 Maintaining and enhancing business transactions
NIPPON CHEMI-CON CORPORATION 2,000,000 832 Maintaining and enhancing business
transactions TOYO ELECTRIC MFG. CO. LTD. 2,100,000 829 Maintaining and enhancing business
relationship
Panasonic Corporation 770,000 814 Maintaining and enhancing business transactions
Kintetsu Corporation 2,842,913 759 Maintaining and enhancing business transactions
WOWOW INC. 5,260 729 Maintaining and enhancing business transactions
Seiko Electric Company, Ltd. 1,630,320 725 Maintaining and enhancing business transactions
IBJ Leasing Company, Limited 360,000 720 Maintaining and enhancing business
transactions
The Kansai Electric Power Co., Inc. 390,000 706 Maintaining and enhancing business
transactions
TDK Corporation 143,000 702 Maintaining and enhancing business transactions
(Note) Since the number of stock of which balance sheet amount exceeds 1% of the amount of the Company’s common stock on the balance sheet is less than 30, the top 30 stocks in balance sheet amount are listed.

-78-
(Fiscal year ended March 31, 2012) Specified investment securities
Stock name Number of
shares (shares)
Balance sheet amount
(Millions of yen)Purpose of holding
Western Digital Corporation 25,000,000 85,046 Maintaining and enhancing business relationship
Central Japan Railway Company 9,000 6,138 Maintaining and enhancing business
transactions
Yungtay Engineering Co., Ltd. 31,817,168 4,179 Maintaining and enhancing business relationship
East Japan Railway Company 790,000 4,115 Maintaining and enhancing business transactions
Electric Power Development Co., Ltd. 1,307,580 2,934 Maintaining and enhancing business
transactions
The Japan Steel Works, LTD. 5,050,000 2,863 Maintaining and enhancing business transactions
The Chugoku Electric Power Co., Inc. 1,812,622 2,786 Maintaining and enhancing business
transactions
JX Holdings, Inc. 4,888,149 2,507 Maintaining and enhancing business transactions
NIPPON TELEGRAPH AND TELEPHONE CORPORATION
612,000 2,298 Maintaining and enhancing business transactions
Shin-Etsu Chemical Co., Ltd. 471,000 2,251 Maintaining and enhancing business transactions
Chubu Electric Power Co., Inc. 1,200,254 1,793 Maintaining and enhancing business
transactions
The Chiba Bank, Ltd. 3,269,000 1,726 Maintaining and enhancing business transactions
ShinMaywa Industries, Ltd. 4,000,337 1,648 Maintaining and enhancing business transactions
NGK INSULATORS, LTD. 1,214,483 1,434 Maintaining and enhancing business transactions
The Dai-ichi Life Insurance Company, Limited 12,100 1,383 Maintaining and enhancing business
transactions
Showa Denko K.K. 6,593,332 1,239 Maintaining and enhancing business transactions
JOYO BANK, Ltd. 2,956,000 1,120 Maintaining and enhancing business transactions
Tohoku Electric Power Co., Inc. 1,010,000 953 Maintaining and enhancing business
transactions
WOWOW INC. 5,260 944 Maintaining and enhancing business transactions
Kyushu Electric Power Co. Inc. 790,000 931 Maintaining and enhancing business
transactions

-79-
Stock name Number of
shares (shares)
Balance sheet amount
(Millions of yen)
Purpose of holding
NKSJ Holdings, Inc. 500,000 925 Maintaining and enhancing business transactions
Sapporo Holdings Limited 2,988,000 914 Maintaining and enhancing business transactions
Kintetsu Corporation 2,842,913 895 Maintaining and enhancing business transactions
Hokuriku Electric Power Company 576,000 861 Maintaining and enhancing business
transactions
Seiko Electric Company, Ltd. 1,630,320 831 Maintaining and enhancing business transactions
IBJ Leasing Company, Limited 360,000 771 Maintaining and enhancing business
transactions
TOHO GAS CO., LTD. 1,524,471 743 Maintaining and enhancing business transactions
West Japan Railway Company 215,000 714 Maintaining and enhancing business transactions
TOYO ELECTRIC MFG. CO. LTD. 2,100,000 686 Maintaining and enhancing business
relationship
NOF Corporation 1,700,000 685 Maintaining and enhancing business transactions
(Note) Since the number of stock of which balance sheet amount exceeds 1% of the amount of the Company’s common stock on the balance sheet is less than 30, the top 30 stocks in balance sheet amount are listed.
(c) Equity securities held for pure investment
None.
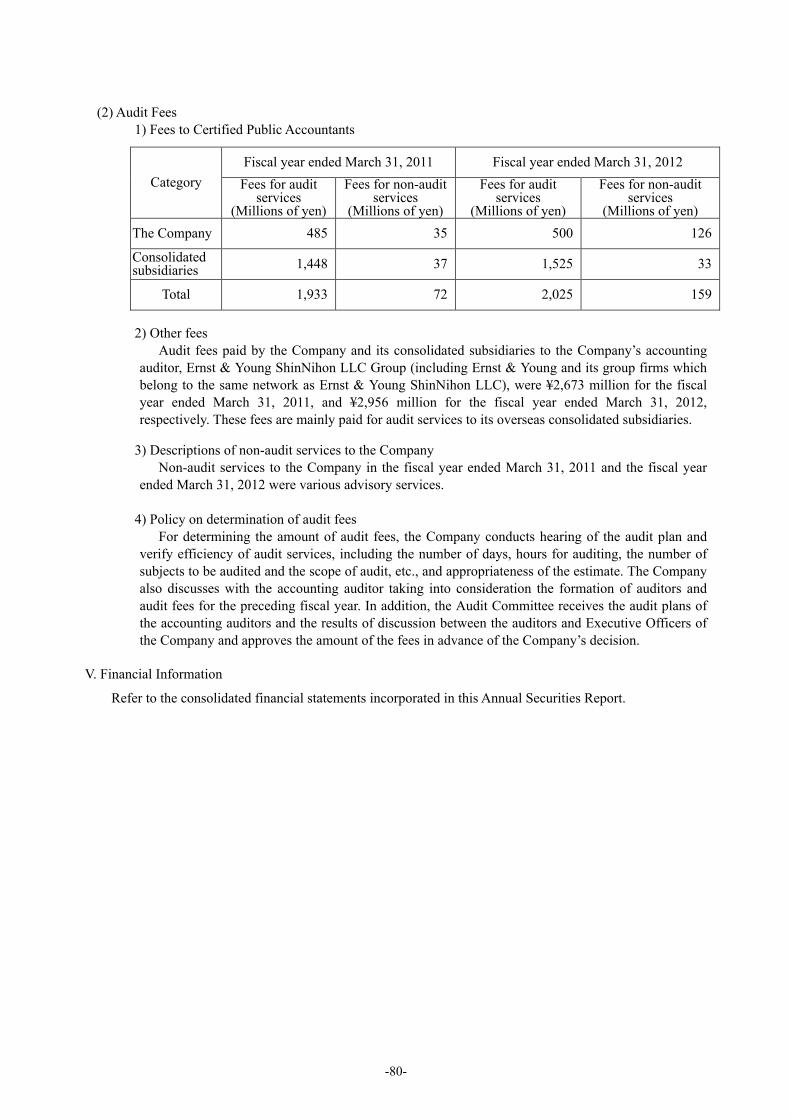
-80-
(2) Audit Fees 1) Fees to Certified Public Accountants
Category
Fiscal year ended March 31, 2011 Fiscal year ended March 31, 2012
Fees for audit services
(Millions of yen)
Fees for non-audit services
(Millions of yen)
Fees for audit services
(Millions of yen)
Fees for non-audit services
(Millions of yen)
The Company 485 35 500 126
Consolidated subsidiaries 1,448 37 1,525 33
Total 1,933 72 2,025 159
2) Other fees
Audit fees paid by the Company and its consolidated subsidiaries to the Company’s accounting auditor, Ernst & Young ShinNihon LLC Group (including Ernst & Young and its group firms which belong to the same network as Ernst & Young ShinNihon LLC), were ¥2,673 million for the fiscal year ended March 31, 2011, and ¥2,956 million for the fiscal year ended March 31, 2012, respectively. These fees are mainly paid for audit services to its overseas consolidated subsidiaries.
3) Descriptions of non-audit services to the Company
Non-audit services to the Company in the fiscal year ended March 31, 2011 and the fiscal year ended March 31, 2012 were various advisory services.
4) Policy on determination of audit fees
For determining the amount of audit fees, the Company conducts hearing of the audit plan and verify efficiency of audit services, including the number of days, hours for auditing, the number of subjects to be audited and the scope of audit, etc., and appropriateness of the estimate. The Company also discusses with the accounting auditor taking into consideration the formation of auditors and audit fees for the preceding fiscal year. In addition, the Audit Committee receives the audit plans of the accounting auditors and the results of discussion between the auditors and Executive Officers of the Company and approves the amount of the fees in advance of the Company’s decision.
V. Financial Information
Refer to the consolidated financial statements incorporated in this Annual Securities Report.
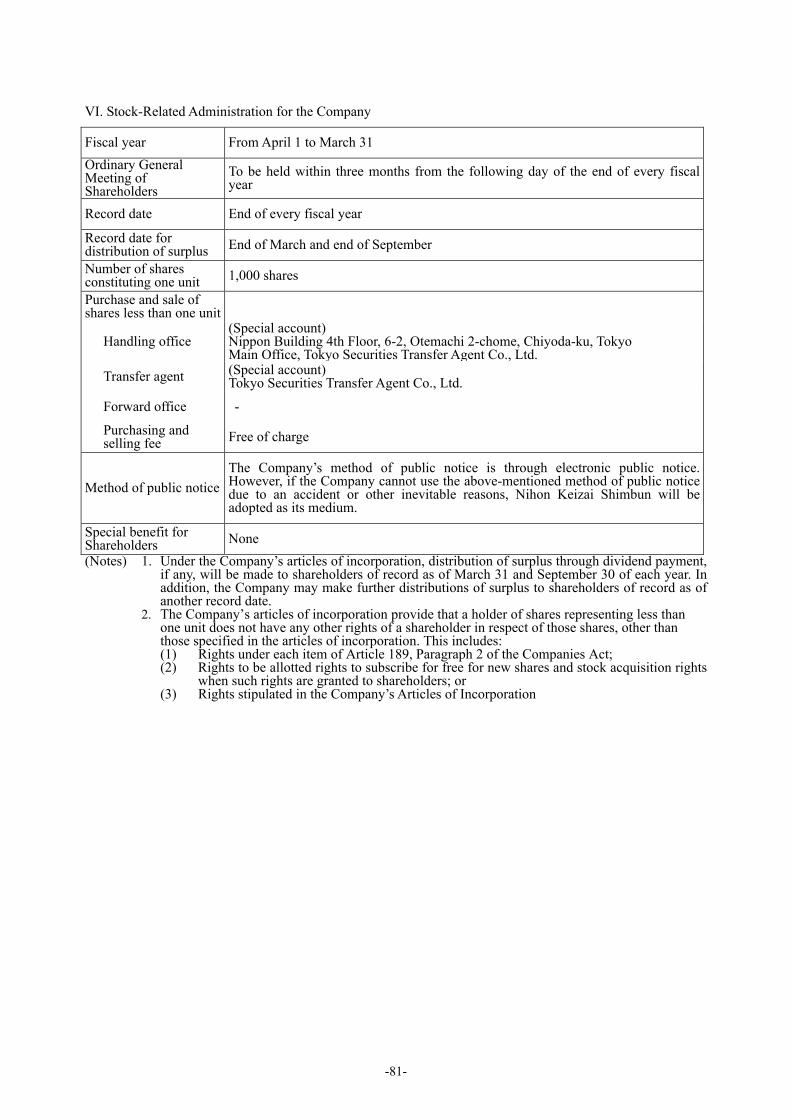
-81-
VI. Stock-Related Administration for the Company
Fiscal year From April 1 to March 31
Ordinary General Meeting of Shareholders
To be held within three months from the following day of the end of every fiscal year
Record date End of every fiscal year
Record date for distribution of surplus End of March and end of September
Number of shares constituting one unit 1,000 shares
Purchase and sale of shares less than one unit
Handling office (Special account) Nippon Building 4th Floor, 6-2, Otemachi 2-chome, Chiyoda-ku, Tokyo Main Office, Tokyo Securities Transfer Agent Co., Ltd.
Transfer agent (Special account) Tokyo Securities Transfer Agent Co., Ltd.
Forward office -
Purchasing and selling fee Free of charge
Method of public notice
The Company’s method of public notice is through electronic public notice. However, if the Company cannot use the above-mentioned method of public notice due to an accident or other inevitable reasons, Nihon Keizai Shimbun will be adopted as its medium.
Special benefit for Shareholders None
(Notes) 1. Under the Company’s articles of incorporation, distribution of surplus through dividend payment, if any, will be made to shareholders of record as of March 31 and September 30 of each year. In addition, the Company may make further distributions of surplus to shareholders of record as of another record date.
2. The Company’s articles of incorporation provide that a holder of shares representing less than one unit does not have any other rights of a shareholder in respect of those shares, other than those specified in the articles of incorporation. This includes: (1) Rights under each item of Article 189, Paragraph 2 of the Companies Act; (2) Rights to be allotted rights to subscribe for free for new shares and stock acquisition rights
when such rights are granted to shareholders; or (3) Rights stipulated in the Company’s Articles of Incorporation

-82-
VII. Reference Information on the Company
1. Information on a Parent Company, etc. of the Company The Company has no parent company.
2. Other Reference Information
The Company filed the following documents during the period from the commencing date of the fiscal year ended March 31, 2012 to the filing date of the Annual Securities Report.
(1) Annual Securities Report and documents attached, and Confirmation
Letter (The 142nd business term (from April 1, 2010 to March 31, 2011))
Filed with the Director of the Kanto Local Finance Bureau on June 24, 2011
(2) Internal Control Report Filed with the Director of the Kanto Local Finance Bureau on June 24, 2011
(3) Amendment to Annual Securities Report and Confirmation Letter(Amendment to Annual Securities Report (The 141st business term (from April 1, 2009 to March 31, 2010)))
Filed with the Director of the Kanto Local Finance Bureau on June 24, 2011
(4) Extraordinary Report (pursuant to Article 19, Paragraph 2, Item 9-2 of the Cabinet Office Ordinance Concerning Disclosure of Corporate Affairs, etc.)
Filed with the Director of the Kanto Local Finance Bureau on June 27, 2011
(5) Shelf Registration Statement (Debentures) and Documents Attached Filed with the Director of the Kanto Local Finance Bureau on July 15, 2011
(6) Quarterly Report and Confirmation Letter(The First Quarter of the 143rd business term (from April 1, 2011 to June 30, 2011))
Filed with the Director of the Kanto Local Finance Bureau on August 8, 2011
(7) Quarterly Report and Confirmation Letter(The Second Quarter of the 143rd business term (from July 1, 2011 to September 30, 2011))
Filed with the Director of the Kanto Local Finance Bureau on November 14, 2011
(8) Extraordinary Report (pursuant to Article 19, Paragraph 2, Item 12 of the Cabinet Office Ordinance Concerning Disclosure of Corporate Affairs, etc.)
Filed with the Director ofthe Kanto Local Finance Bureau on January 17, 2012
(9) Extraordinary Report (pursuant to Article 19, Paragraph 2, Item 9 of the Cabinet Office Ordinance Concerning Disclosure of Corporate Affairs, etc.)
Filed with the Director of the Kanto Local Finance Bureau on February 3, 2012
(10) Quarterly Report and Confirmation Letter(The Third Quarter of the 143rd business term (from October 1, 2011 to December 31, 2011))
Filed with the Director of the Kanto Local Finance Bureau on February 13, 2012
(11) Extraordinary Report (pursuant to Article 19, Paragraph 2, Items 3, 12 and 19 of the Cabinet Office Ordinance Concerning Disclosure of Corporate Affairs, etc.)
Filed with the Director of the Kanto Local Finance Bureau on March 9, 2012
(12) Amended Shelf Registration Statement(Amended Shelf Registration Statement concerning the Shelf Registration Statement (5) above)
Filed with the Director of the Kanto Local Finance Bureau on August 8, 2011 November 14, 2011 January 17, 2012 February 3, 2012 February 13, 2012 March 9, 2012

-83-
Part II Information on Guarantors, etc. for the Company
Not applicable.

F-1
Consolidated Financial Statements Page Number Reports of Independent Registered Public Accounting Firm F-2 Consolidated Financial Statements of Hitachi, Ltd. and Subsidiaries: Consolidated Balance Sheets as of March 31, 2012 and 2011 F-4 Consolidated Statements of Operations for the years ended March 31, 2012, 2011 and 2010 F-6 Consolidated Statements of Equity for the years ended March 31, 2012, 2011 and 2010 F-7 Consolidated Statements of Cash Flows for the years ended March 31, 2012, 2011 and 2010 F-10 Notes to Consolidated Financial Statements F-12

F-2
Report of Independent Registered Public Accounting Firm To the Stockholders and Board of Directors of Hitachi, Ltd.: We have audited the accompanying consolidated balance sheets of Hitachi, Ltd. and subsidiaries (the “Company”) as of March 31, 2012 and 2011, and the related consolidated statements of operations, equity, and cash flows for each of the three years in the period ended March 31, 2012. These financial statements are the responsibility of the Company’s management. Our responsibility is to express an opinion on these financial statements based on our audits. We conducted our audits in accordance with the standards of the Public Company Accounting Oversight Board (United States). Those standards require that we plan and perform the audit to obtain reasonable assurance about whether the financial statements are free of material misstatement. An audit includes examining, on a test basis, evidence supporting the amounts and disclosures in the financial statements. An audit also includes assessing the accounting principles used and significant estimates made by management, as well as evaluating the overall financial statement presentation. We believe that our audits provide a reasonable basis for our opinion. In our opinion, the financial statements referred to above present fairly, in all material respects, the consolidated financial position of Hitachi, Ltd. and subsidiaries at March 31, 2012 and 2011, and the consolidated results of their operations and their cash flows for each of the three years in the period ended March 31, 2012, in conformity with U.S. generally accepted accounting principles. As discussed in Note 2 (y), the Company changed its method of accounting for transfers of financial assets and consolidation of variable interest entities as a result of the adoption of the amendments to the Accounting Standards Codification resulting from Accounting Standards Update (ASU) 2009-16, “Accounting for Transfers of Financial Assets” and ASU 2009-17, “Improvements to Financial Reporting by Enterprises Involved with Variable Interest Entities” effective April 1, 2010. We also have audited, in accordance with the standards of the Public Company Accounting Oversight Board (United States), Hitachi, Ltd. and subsidiaries’ internal control over financial reporting as of March 31, 2012, based on criteria established in Internal Control-Integrated Framework issued by the Committee of Sponsoring Organizations of the Treadway Commission and our report dated June 22, 2012 expressed an unqualified opinion thereon. /s/ Ernst & Young ShinNihon LLC Tokyo, Japan June 22, 2012

F-3
Report of Independent Registered Public Accounting Firm
To the Stockholders and Board of Directors of Hitachi, Ltd.: We have audited Hitachi, Ltd. and subsidiaries’ internal control over financial reporting as of March 31, 2012, based on criteria established in Internal Control-Integrated Framework issued by the Committee of Sponsoring Organizations of the Treadway Commission (the COSO criteria). Hitachi, Ltd. and subsidiaries’ management is responsible for maintaining effective internal control over financial reporting, and for its assessment of the effectiveness of internal control over financial reporting included in the accompanying Management’s Report on Internal Control Over Financial Reporting. Our responsibility is to express an opinion on the company’s internal control over financial reporting based on our audit. We conducted our audit in accordance with the standards of the Public Company Accounting Oversight Board (United States). Those standards require that we plan and perform the audit to obtain reasonable assurance about whether effective internal control over financial reporting was maintained in all material respects. Our audit included obtaining an understanding of internal control over financial reporting, assessing the risk that a material weakness exists, testing and evaluating the design and operating effectiveness of internal control based on the assessed risk, and performing such other procedures as we considered necessary in the circumstances. We believe that our audit provides a reasonable basis for our opinion. A company’s internal control over financial reporting is a process designed to provide reasonable assurance regarding the reliability of financial reporting and the preparation of financial statements for external purposes in accordance with generally accepted accounting principles. A company’s internal control over financial reporting includes those policies and procedures that (1) pertain to the maintenance of records that, in reasonable detail, accurately and fairly reflect the transactions and dispositions of the assets of the company; (2) provide reasonable assurance that transactions are recorded as necessary to permit preparation of financial statements in accordance with generally accepted accounting principles, and that receipts and expenditures of the company are being made only in accordance with authorizations of management and directors of the company; and (3) provide reasonable assurance regarding prevention or timely detection of unauthorized acquisition, use or disposition of the company’s assets that could have a material effect on the financial statements. Because of its inherent limitations, internal control over financial reporting may not prevent or detect misstatements. Also, projections of any evaluation of effectiveness to future periods are subject to the risk that controls may become inadequate because of changes in conditions, or that the degree of compliance with the policies or procedures may deteriorate. In our opinion, Hitachi, Ltd. and subsidiaries maintained, in all material respects, effective internal control over financial reporting as of March 31, 2012, based on the COSO criteria. We also have audited, in accordance with the standards of the Public Company Accounting Oversight Board (United States), the accompanying consolidated balance sheets of Hitachi, Ltd. and subsidiaries as of March 31, 2012 and 2011, and the related consolidated statements of operations, equity, and cash flows for each of the three years in the period ended March 31, 2012, and our report dated June 22, 2012 expressed an unqualified opinion thereon. /s/ Ernst & Young ShinNihon LLC Tokyo, Japan June 22, 2012

F-4
HITACHI, LTD.
AND SUBSIDIARIES
Consolidated Balance Sheets
March 31, 2012 and 2011
Yen (millions) Assets 2012 2011 Current assets:
Cash and cash equivalents (note 6) 619,577 554,810 Short-term investments (note 3) 11,562 16,598
Trade receivables:
Notes (notes 6, 17 and 28) 119,162 101,524 Accounts (notes 6 and 28) 2,255,490 2,026,158 Allowance for doubtful receivables (note 28) (31,182) (36,763)
Net trade receivables 2,343,470 2,090,919
Investments in leases (notes 5, 6 and 28) 235,744 228,346 Current portion of financial assets transferred to consolidated securitization entities (notes 6 and 28)
86,071
183,559
Inventories (note 4) 1,413,252 1,341,768 Prepaid expenses and other current assets (notes 6 and 8) 452,510 484,029 Total current assets 5,162,186 4,900,029
Investments and advances, including affiliated companies (notes 3 and 6) 744,493 614,145 Property, plant and equipment (note 5): Land 464,093 471,155 Buildings 1,847,292 1,909,825 Machinery and equipment 5,109,865 5,528,889 Construction in progress 90,687 53,558 7,511,937 7,963,427 Less accumulated depreciation 5,486,399 5,852,157 Net property, plant and equipment 2,025,538 2,111,270 Intangible assets (note 7): Goodwill 214,707 171,500 Other intangible assets 395,255 356,518
Total intangible assets 609,962 528,018 Financial assets transferred to consolidated securitization entities (notes 6 and 28)
205,411
304,160
Other assets (notes 5, 6, 8, 10 and 28) 670,936 728,007 Total assets 9,418,526 9,185,629
See accompanying notes to consolidated financial statements.

F-5
HITACHI, LTD. AND SUBSIDIARIES
Consolidated Balance Sheets (continued)
March 31, 2012 and 2011
Yen (millions) Liabilities and Equity 2012 2011 Current liabilities:
Short-term debt (note 9) 531,446 472,588 Current portion of long-term debt (notes 5, 6 and 9) 384,110 338,218 Current portion of non-recourse borrowings of consolidated securitization entities (note 6)
97,004
190,868
Trade payables:
Notes 24,025 20,430 Accounts 1,301,759 1,236,758
Accrued expenses (notes 10 and 17) 896,096 933,918 Income taxes (note 8) 75,217 73,514 Advances received 362,895 395,605 Other current liabilities (notes 6 and 8) 438,321 426,925
Total current liabilities 4,110,873 4,088,824 Long-term debt (notes 5, 6 and 9) 1,248,851 1,300,311 Non-recourse borrowings of consolidated securitization entities (note 6)
135,043
219,566
Retirement and severance benefits (note 10) 890,977 891,815 Other liabilities (note 8) 258,787 243,724 Total liabilities 6,644,531 6,744,240 Commitments and contingencies (note 17) Equity:
Common stock 4,637,785,317 and 4,520,144,964 shares issued as of
March 31, 2012 and 2011, respectively (notes 9 and 11) 427,775 409,129 Capital surplus (notes 9, 11 and 12) 600,243 603,133 Legal reserve and retained earnings (notes 6 and 13) 1,242,110 922,036 Accumulated other comprehensive loss (notes 6 and 15) (496,896) (493,062) Treasury stock, at cost (note 14) (1,450) (1,371)
Total Hitachi, Ltd. stockholders’ equity 1,771,782 1,439,865 Noncontrolling interests 1,002,213 1,001,524 Total equity 2,773,995 2,441,389
Total liabilities and equity 9,418,526 9,185,629
See accompanying notes to consolidated financial statements.

F-6
HITACHI, LTD. AND SUBSIDIARIES
Consolidated Statements of Operations
Years ended March 31, 2012, 2011 and 2010
Yen (millions) 2012 2011 2010
Revenues: Product sales 8,528,292 8,376,287 8,044,971 Financial and other services 1,137,591 939,520 923,575 Total revenues 9,665,883 9,315,807 8,968,546 Cost of sales: Product sales (6,447,009) (6,292,555) (6,185,937) Financial and other services (831,962) (674,878) (663,318) Total cost of sales (7,278,971) (6,967,433) (6,849,255)Selling, general and administrative expenses (1,974,632) (1,903,866) (1,917,132) Impairment losses for long-lived assets (note 18) (31,841) (35,170) (25,196) Restructuring charges (note 19) (23,097) (5,757) (25,154) Interest income 12,653 13,267 12,017 Dividend income 5,551 4,240 5,799 Gains on sales of stock by affiliated companies - - 183 Other income (note 20) 228,906 69,730 186 Interest charges (28,141) (24,878) (26,252) Other deductions (note 20) (3,010) (13,597) (21,976) Equity in net loss of affiliated companies (15,571) (20,142) (58,186) Income before income taxes 557,730 432,201 63,580 Income taxes (note 8) (144,922) (129,075) (147,971) Net income (loss) 412,808 303,126 (84,391) Less net income attributable to noncontrolling interests 65,629 64,257 22,570 Net income (loss) attributable to Hitachi, Ltd. 347,179 238,869 (106,961) Net income (loss) attributable to Hitachi, Ltd. stockholders per share (note 21): Yen
Basic 76.81 52.89 (29.20) Diluted 71.86 49.38 (29.20) See accompanying notes to consolidated financial statements.

F-7
HITACHI, LTD. AND SUBSIDIARIES
Consolidated Statements of Equity
Years ended March 31, 2012, 2011 and 2010
Yen (millions)
2012 2011 2010Common stock (notes 9 and 11): Balance at beginning of year 409,129 408,810 282,033 Change in common stock: Issuance of common stock - - 126,776 Conversion of convertible bonds 18,646 319 1 Total change in common stock 18,646 319 126,777 Balance at end of year 427,775 409,129 408,810 Capital surplus (notes 9, 11 and 12): Balance at beginning of year 603,133 620,577 560,066 Change in capital surplus: Issuance of common stock - - 125,644 Conversion of convertible bonds 18,646 319 1 Equity transactions and other (21,527) (8,229) (64,998) Sales of treasury stock (9) (9,534) (136) Total change in capital surplus (2,890) (17,444) 60,511 Balance at end of year 600,243 603,133 620,577 Legal reserve and retained earnings (notes 6 and 13): Balance at beginning of year 922,036 713,479 820,440 Change in legal reserve and retained earnings:
Effect on retained earnings due to consolidation of securitization entities upon initial adoption of the amended provisions of ASC 810 - (7,732) -
Net income (loss) 347,179 238,869 (106,961) Dividends to Hitachi, Ltd. stockholders (27,105) (22,580) - Total change in legal reserve and retained earnings 320,074 208,557 (106,961) Balance at end of year 1,242,110 922,036 713,479 Accumulated other comprehensive loss (notes 6 and 15): Balance at beginning of year (493,062) (432,057) (586,351) Change in accumulated other comprehensive loss:
Effect on accumulated other comprehensive loss due to consolidation ofsecuritization entities upon initial adoption of the amended provisions of ASC 810 - (2,977) -
Equity transactions and other 210 (191) (14,132) Other comprehensive income (loss), net of reclassification adjustments (4,044) (57,837) 168,426 Total change in accumulated other comprehensive loss (3,834) (61,005) 154,294 Balance at end of year (496,896) (493,062) (432,057) Treasury stock, at cost (note 14): Balance at beginning of year (1,371) (26,151) (26,237) Change in treasury stock, at cost: Acquisition of treasury stock (126) (183) (115) Sales of treasury stock 47 24,963 201 Total change in treasury stock, at cost (79) 24,780 86 Balance at end of year (1,450) (1,371) (26,151) See accompanying notes to consolidated financial statements.

F-8
HITACHI, LTD. AND SUBSIDIARIES
Consolidated Statements of Equity (continued)
Years ended March 31, 2012, 2011 and 2010
Yen (millions)
2012 2011 2010Total Hitachi, Ltd. stockholders’ equity: Balance at beginning of year 1,439,865 1,284,658 1,049,951 Change in total Hitachi, Ltd. stockholders’ equity:
Effect on retained earnings due to consolidation of securitization entities upon initial adoption of the amended provisions of ASC 810 - (7,732) -Effect on accumulated other comprehensive loss due to consolidation ofsecuritization entities upon initial adoption of the amended provisions of ASC 810 - (2,977) -
Issuance of common stock - - 252,420 Conversion of convertible bonds 37,292 638 2 Equity transactions and other (21,317) (8,420) (79,130) Net income (loss) 347,179 238,869 (106,961) Other comprehensive income (loss), net of reclassification adjustments (4,044) (57,837) 168,426 Dividends to Hitachi, Ltd. stockholders (27,105) (22,580) - Acquisition of treasury stock (126) (183) (115) Sales of treasury stock 38 15,429 65 Total change in total Hitachi, Ltd. stockholders’ equity 331,917 155,207 234,707 Balance at end of year 1,771,782 1,439,865 1,284,658 Noncontrolling interests (notes 6 and 12): Balance at beginning of year 1,001,524 983,187 1,129,401 Change in noncontrolling interests:
Effect on retained earnings due to consolidation of securitization entities upon initial adoption of the amended provisions of ASC 810 - (5,225) -Effect on accumulated other comprehensive loss due to consolidation ofsecuritization entities upon initial adoption of the amended provisions of ASC 810 - (1,985) -
Equity transactions and other (26,464) (1,696) (174,675) Net income 65,629 64,257 22,570 Other comprehensive income (loss), net of reclassification adjustments (16,183) (16,830) 30,509 Dividends to noncontrolling interests (22,293) (20,184) (24,618) Total change in noncontrolling interests 689 18,337 (146,214) Balance at end of year 1,002,213 1,001,524 983,187 Total equity: Balance at beginning of year 2,441,389 2,267,845 2,179,352 Change in total equity:
Effect on retained earnings due to consolidation of securitization entities upon initial adoption of the amended provisions of ASC 810 - (12,957) -Effect on accumulated other comprehensive loss due to consolidation ofsecuritization entities upon initial adoption of the amended provisions of ASC 810 - (4,962) -
Issuance of common stock - - 252,420 Conversion of convertible bonds 37,292 638 2 Equity transactions and other (47,781) (10,116) (253,805) Net income (loss) 412,808 303,126 (84,391) Other comprehensive income (loss), net of reclassification adjustments (20,227) (74,667) 198,935 Dividends to Hitachi, Ltd. stockholders (27,105) (22,580) - Dividends to noncontrolling interests (22,293) (20,184) (24,618) Acquisition of treasury stock (126) (183) (115) Sales of treasury stock 38 15,429 65 Total change in total equity 332,606 173,544 88,493 Balance at end of year 2,773,995 2,441,389 2,267,845
See accompanying notes to consolidated financial statements.
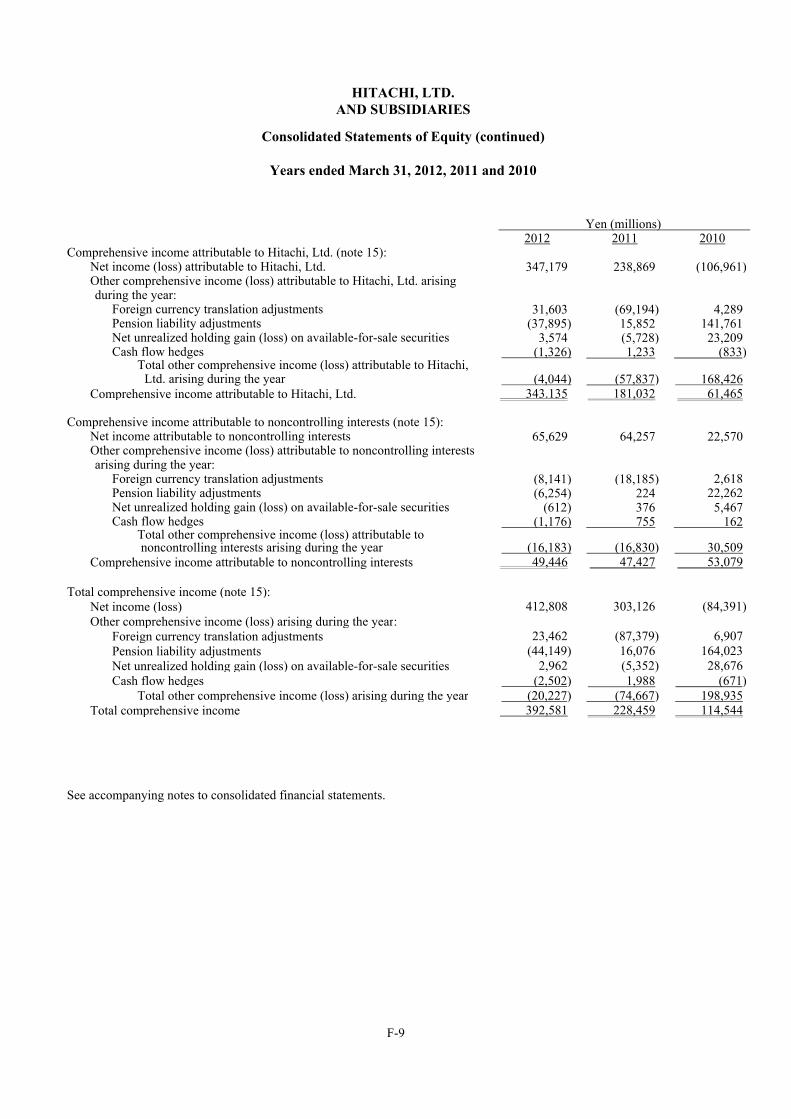
F-9
HITACHI, LTD. AND SUBSIDIARIES
Consolidated Statements of Equity (continued)
Years ended March 31, 2012, 2011 and 2010
Yen (millions)
2012 2011 2010Comprehensive income attributable to Hitachi, Ltd. (note 15): Net income (loss) attributable to Hitachi, Ltd. 347,179 238,869 (106,961) Other comprehensive income (loss) attributable to Hitachi, Ltd. arising
during the year: Foreign currency translation adjustments 31,603 (69,194) 4,289 Pension liability adjustments (37,895) 15,852 141,761 Net unrealized holding gain (loss) on available-for-sale securities 3,574 (5,728) 23,209 Cash flow hedges (1,326) 1,233 (833) Total other comprehensive income (loss) attributable to Hitachi, Ltd. arising during the year (4,044) (57,837) 168,426 Comprehensive income attributable to Hitachi, Ltd. 343.135 181,032 61,465 Comprehensive income attributable to noncontrolling interests (note 15): Net income attributable to noncontrolling interests 65,629 64,257 22,570 Other comprehensive income (loss) attributable to noncontrolling interests
arising during the year: Foreign currency translation adjustments (8,141) (18,185) 2,618 Pension liability adjustments (6,254) 224 22,262 Net unrealized holding gain (loss) on available-for-sale securities (612) 376 5,467 Cash flow hedges (1,176) 755 162 Total other comprehensive income (loss) attributable to
noncontrolling interests arising during the year (16,183) (16,830) 30,509 Comprehensive income attributable to noncontrolling interests 49,446 47,427 53,079 Total comprehensive income (note 15): Net income (loss) 412,808 303,126 (84,391) Other comprehensive income (loss) arising during the year: Foreign currency translation adjustments 23,462 (87,379) 6,907 Pension liability adjustments (44,149) 16,076 164,023 Net unrealized holding gain (loss) on available-for-sale securities 2,962 (5,352) 28,676 Cash flow hedges (2,502) 1,988 (671) Total other comprehensive income (loss) arising during the year (20,227) (74,667) 198,935 Total comprehensive income 392,581 228,459 114,544
See accompanying notes to consolidated financial statements.
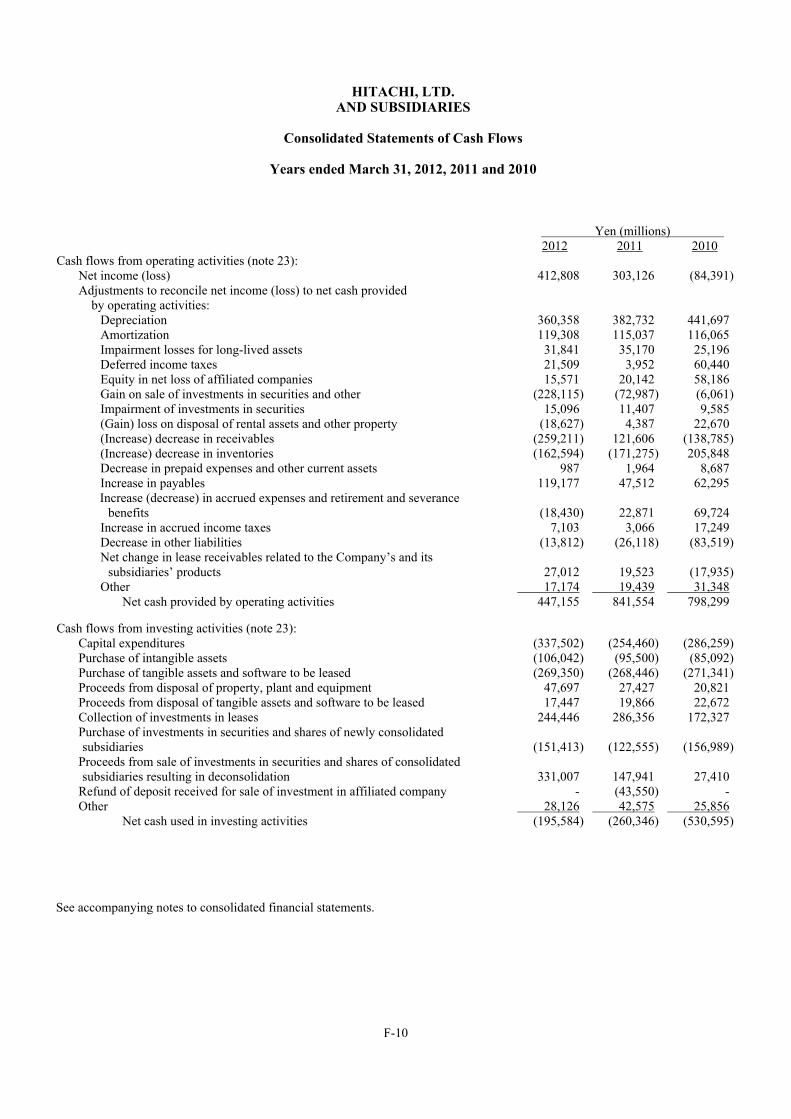
F-10
HITACHI, LTD. AND SUBSIDIARIES
Consolidated Statements of Cash Flows
Years ended March 31, 2012, 2011 and 2010
Yen (millions) 2012 2011 2010
Cash flows from operating activities (note 23): Net income (loss) 412,808 303,126 (84,391) Adjustments to reconcile net income (loss) to net cash provided by operating activities: Depreciation 360,358 382,732 441,697 Amortization 119,308 115,037 116,065 Impairment losses for long-lived assets 31,841 35,170 25,196 Deferred income taxes 21,509 3,952 60,440 Equity in net loss of affiliated companies 15,571 20,142 58,186 Gain on sale of investments in securities and other (228,115) (72,987) (6,061) Impairment of investments in securities 15,096 11,407 9,585 (Gain) loss on disposal of rental assets and other property (18,627) 4,387 22,670 (Increase) decrease in receivables (259,211) 121,606 (138,785) (Increase) decrease in inventories (162,594) (171,275) 205,848 Decrease in prepaid expenses and other current assets 987 1,964 8,687 Increase in payables 119,177 47,512 62,295 Increase (decrease) in accrued expenses and retirement and severance
benefits (18,430) 22,871 69,724 Increase in accrued income taxes 7,103 3,066 17,249 Decrease in other liabilities (13,812) (26,118) (83,519) Net change in lease receivables related to the Company’s and its
subsidiaries’ products 27,012 19,523 (17,935) Other 17,174 19,439 31,348 Net cash provided by operating activities 447,155 841,554 798,299 Cash flows from investing activities (note 23): Capital expenditures (337,502) (254,460) (286,259) Purchase of intangible assets (106,042) (95,500) (85,092) Purchase of tangible assets and software to be leased (269,350) (268,446) (271,341) Proceeds from disposal of property, plant and equipment 47,697 27,427 20,821 Proceeds from disposal of tangible assets and software to be leased 17,447 19,866 22,672 Collection of investments in leases 244,446 286,356 172,327 Purchase of investments in securities and shares of newly consolidated
subsidiaries (151,413) (122,555) (156,989) Proceeds from sale of investments in securities and shares of consolidated subsidiaries resulting in deconsolidation 331,007 147,941 27,410 Refund of deposit received for sale of investment in affiliated company - (43,550) - Other 28,126 42,575 25,856 Net cash used in investing activities (195,584) (260,346) (530,595) See accompanying notes to consolidated financial statements.
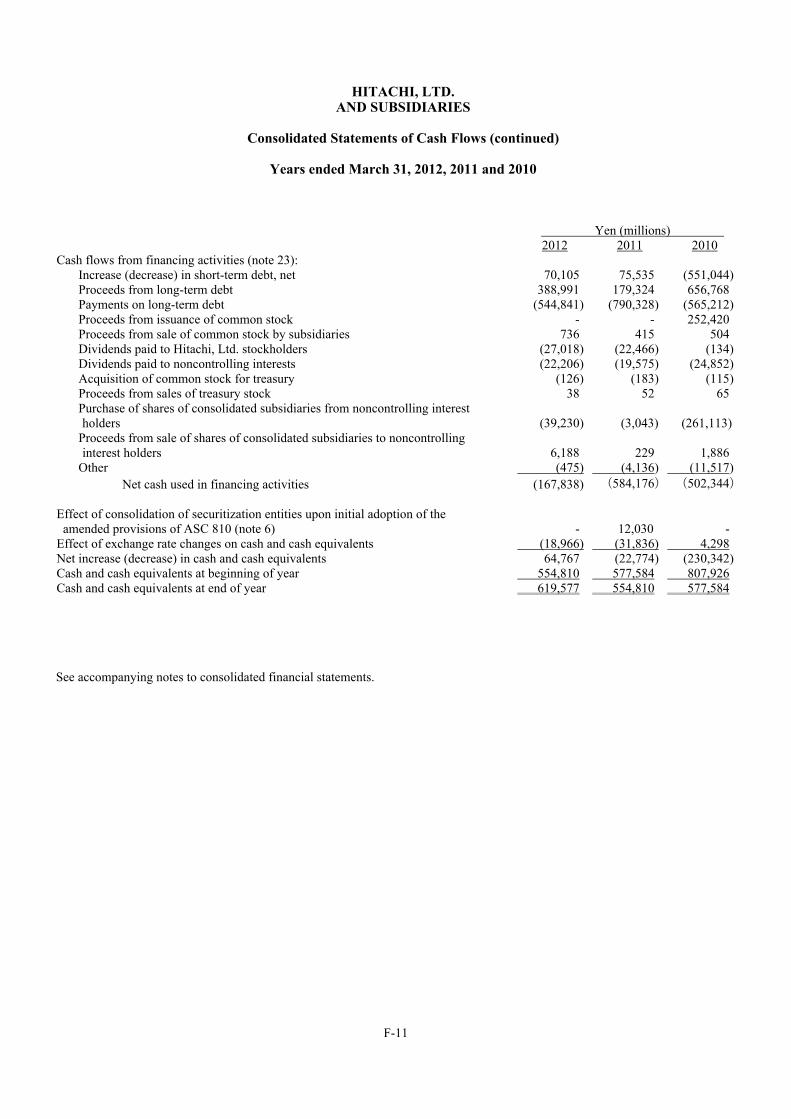
F-11
HITACHI, LTD. AND SUBSIDIARIES
Consolidated Statements of Cash Flows (continued)
Years ended March 31, 2012, 2011 and 2010
Yen (millions)
2012 2011 2010 Cash flows from financing activities (note 23): Increase (decrease) in short-term debt, net 70,105 75,535 (551,044) Proceeds from long-term debt 388,991 179,324 656,768 Payments on long-term debt (544,841) (790,328) (565,212) Proceeds from issuance of common stock - - 252,420 Proceeds from sale of common stock by subsidiaries 736 415 504 Dividends paid to Hitachi, Ltd. stockholders (27,018) (22,466) (134) Dividends paid to noncontrolling interests (22,206) (19,575) (24,852) Acquisition of common stock for treasury (126) (183) (115) Proceeds from sales of treasury stock 38 52 65 Purchase of shares of consolidated subsidiaries from noncontrolling interest holders (39,230) (3,043) (261,113) Proceeds from sale of shares of consolidated subsidiaries to noncontrolling interest holders 6,188 229 1,886 Other (475) (4,136) (11,517) Net cash used in financing activities (167,838) (584,176) (502,344) Effect of consolidation of securitization entities upon initial adoption of the amended provisions of ASC 810 (note 6) - 12,030 - Effect of exchange rate changes on cash and cash equivalents (18,966) (31,836) 4,298 Net increase (decrease) in cash and cash equivalents 64,767 (22,774) (230,342)Cash and cash equivalents at beginning of year 554,810 577,584 807,926 Cash and cash equivalents at end of year 619,577 554,810 577,584 See accompanying notes to consolidated financial statements.

HITACHI, LTD. AND SUBSIDIARIES
Notes to Consolidated Financial Statements
F-12 (Continued)
(1) Nature of Operations
Hitachi, Ltd. (the Company) is a Japanese corporation, whose principal office is located in Japan. The Company’s and its subsidiaries’ businesses are diverse, and include information and telecommunication systems, power systems, social infrastructure and industrial systems, electronic systems and equipment, construction machinery, high functional materials and components, automotive systems, components and devices, digital media and consumer products, financial services, and others including logistics services.
(2) Basis of Presentation and Summary of Significant Accounting Policies
(a) Basis of Presentation The Company and its domestic subsidiaries keep their books of account in accordance with the financial accounting standards of Japan, and its foreign subsidiaries in accordance with those of the countries of their domicile. The consolidated financial statements presented herein have been prepared to reflect the adjustments which are necessary to conform to accounting principles generally accepted in the United States of America. Management of the Company has made a number of estimates and assumptions relating to the reporting of assets and liabilities and the disclosure of contingent assets and liabilities to prepare these financial statements. Actual results could differ from those estimates.
(b) Principles of Consolidation The consolidated financial statements include the accounts of the Company, its majority-owned subsidiaries and all variable interest entities (VIEs) for which the Company or any of its consolidated entities is the primary beneficiary. The definition of a VIE is included in Accounting Standards Codification (ASC) 810, “Consolidation.” This guidance addresses how a business enterprise should evaluate whether it has a controlling financial interest in an entity through means other than voting rights and accordingly should consolidate the entity. The consolidated financial statements include accounts of certain subsidiaries whose closing dates differ from March 31 by 93 days or less to either comply with local statutory requirements or facilitate timely reporting. There have been no significant transactions, which would materially affect the Company’s financial position and results of operations, with such subsidiaries during the period from their closing dates to March 31. Intercompany accounts and significant intercompany transactions have been eliminated in consolidation. Investments in corporate joint ventures and affiliated companies, where the Company has the ability to exercise significant influence over operational and financial policies generally by holding 20 - 50% ownership, are accounted for under the equity method. Investments where the Company does not have significant influence are accounted for under the cost method.
(c) Cash Equivalents The Company considers all highly liquid investments with insignificant risk of changes in value which have original maturities of three months or less when purchased to be cash equivalents.

HITACHI, LTD. AND SUBSIDIARIES
Notes to Consolidated Financial Statements
F-13 (Continued)
(d) Allowance for Doubtful Receivables Allowance for doubtful receivables, including both trade receivables as well as investments in leases, is the Company’s and subsidiaries’ best estimate of the amount of our incurred losses (that is those amounts with regards to which collection is not probable based on current information). Assessing the ultimate realization of these receivables, based on historical experience and analyses, including the current creditworthiness of each customer, requires a considerable amount of judgment. Each company in our consolidated group considers factors which are relevant to its business and circumstances, including business practices that are unique to the respective country or region in which it operates within the context of our group policy. Such factors which have been present on a historical basis and have contributed to losses at our subsidiaries in the past include: historical credit loss experience; existence of overdue payments; extended payment terms; negative evaluation by third-party credit rating agencies; excessive debt; and evaluation of deteriorating financial position and operating results. Account balances are generally written off against the allowance only after all means of collection have been exhausted and the potential for recovery is considered remote. Write-offs generally occur only when a debtor enters bankruptcy or liquidation because at that time collection efforts will have been exhausted. This policy results in potentially long collection cycles.
(e) Foreign Currency Translation Foreign currency financial statements have been translated in accordance with ASC 830, “Foreign Currency Matters.” Under this guidance, the assets and liabilities of the Company’s subsidiaries located outside Japan are translated into Japanese yen at the rates of exchange in effect at the balance sheet date. Income and expense items are translated at the average exchange rates prevailing during the year. Gains and losses resulting from foreign currency transactions are included in other income (deductions), and those resulting from translation of financial statements are excluded from the consolidated statements of operations and included in accumulated other comprehensive loss.
(f) Investments in Securities and Affiliated Companies Equity securities that do not have readily determinable fair values, except for equity-method investments, are accounted for under the cost method. The Company classifies investments in equity securities that have readily determinable fair values and all investments in debt securities in three categories: held-to-maturity securities, trading securities and available-for-sale securities. Held-to-maturity securities are debt securities that the Company has the positive intent and ability to hold to maturity. Trading securities are debt and equity securities that are bought and held principally for the purpose of selling them in the near term. Available-for-sale securities are debt and equity securities not classified as either held-to-maturity securities or trading securities. Held-to-maturity securities are reported at amortized cost. Trading securities are reported at fair value, with unrealized gains and losses included in earnings. Available-for-sale securities are reported at fair value, with unrealized gains and losses excluded from earnings and reported in accumulated other comprehensive loss. On a periodic basis, but no less frequently than at the end of each quarter period, the Company evaluates available-for-sale securities, held-to-maturity securities and cost-method investments for possible impairment. If the fair value of any available-for-sale security, held-to-maturity security or cost-method investment is less than the cost basis or the amortized cost basis, the Company assesses whether the

HITACHI, LTD. AND SUBSIDIARIES
Notes to Consolidated Financial Statements
F-14 (Continued)
impairment is temporary or other-than-temporary. Fair value is determined based on quoted market prices, projected discounted cash flows or other valuation techniques as appropriate. For certain cost-method investments for which it is not practicable to estimate the fair value, if an event or change in circumstances has occurred that may have a significant adverse effect on the fair value of the investment, the Company estimates the fair value of such investments. Factors considered in determining whether an impairment of an equity security classified as available-for-sale or a cost-method investment is temporary or other-than-temporary include: the length of time and extent to which the fair value of the investment has been less than cost, the financial condition and near-term prospects of the issuer, and the intent and ability to retain the investment in the issuer for a period of time sufficient to allow for any anticipated recovery in fair value. A decline in fair value of an equity security classified as an available-for-sale security or cost-method investment below its cost basis that is deemed to be other-than-temporary results in a write-down of the cost basis to fair value as a new cost basis and the amount of the write-down is included in earnings. The new cost basis of the investment is not adjusted for subsequent recoveries in fair value. Factors considered in assessing whether an impairment of a debt security classified as either available-for-sale or held-to-maturity is temporary or other-than-temporary include: whether there is intent to sell the impaired debt security, it is more likely than not that the impaired debt security will be required to be sold before recovery, or the holder is not expected to recover the entire amortized cost basis of the security for any other reason. If the best estimate of the present value of cash flows expected to be collected is less than the amortized cost basis of the security, such a difference represents the credit loss component of the impairment. If an other-than-temporary impairment has occurred, the amount of the other-than-temporary impairment recognized in earnings depends on whether the Company intends to sell the security or it is more likely than not that the Company will be required to sell the security before recovery of its amortized cost basis less any current-period credit loss. If the Company does not intend to sell the security and it is not more likely than not that the Company will be required to sell the security before recovery of its amortized cost basis less any current-period loss, the component of the other-than-temporary impairment related to the credit loss is recognized in earnings and the component of the other-than-temporary impairment related to other factors is recognized in accumulated other comprehensive loss. The previous amortized cost basis less the other-than-temporary impairment recognized in earnings becomes the new amortized cost basis of the investment. That new amortized cost basis is not adjusted for subsequent recoveries in fair value. However, the new amortized cost basis is adjusted for accretion and amortization as if the debt security had been purchased on the date of the other-than temporary impairment at an amortized cost basis equal to the previous amortized cost basis less the other-than-temporary impairment recognized in earnings. On a periodic basis, but no less frequently than at the end of each quarter period, the Company evaluates the carrying amount of its ownership interests in equity-method investees for possible impairment. Factors considered in assessing whether an indication of other-than-temporary impairment exists include the achievement of business plan objectives and milestones including cash flow projections and the results of planned financing activities, the financial condition and prospects of each investee company, the fair value of the ownership interest relative to the carrying amount of the investment, the period of time during which the fair value of the ownership interest has been below the carrying amount of the investment and other relevant factors. Impairment to be recognized is measured based on the amount by which the

HITACHI, LTD. AND SUBSIDIARIES
Notes to Consolidated Financial Statements
F-15 (Continued)
carrying amount of the investment exceeds the fair value of the investment. Fair value is determined based on quoted market prices, projected discounted cash flows or other valuation techniques as appropriate. The cost of a security sold or the amount reclassified out of accumulated other comprehensive loss into earnings is determined by the average cost method.
(g) Securitizations The Company and certain subsidiaries have a number of securitization programs. Under those programs, certain financial assets such as lease receivables, trade receivables and others are sold to Special Purpose Entities (SPEs) which are mainly funded through the issuance of asset-backed securities to investors. When a transfer of financial assets is eligible to be accounted for as a sale under ASC 860, “Transfers and Servicing,” the transferred financial assets are derecognized. The Company and its subsidiaries recognize a gain or loss for the difference between the fair value of assets obtained and liabilities incurred in the sale and the carrying amount of the transferred financial assets when the transaction is consummated. Initially recorded at fair value in the period of securitizations, the amount of retained interests that can contractually be prepaid or otherwise settled in such a way that the holder would not recover all of its recorded interests is subsequently remeasured at fair value as of the balance sheet date in the same manner as available-for-sale securities.
Fair values are based on the present value of estimated future cash flows which take into consideration various factors such as expected credit loss and others.
(h) Inventories Inventories are stated at the lower of cost or market. Cost is determined by the specific identification method for job order inventories and generally by the average cost method for raw materials and other inventories.
(i) Property, Plant and Equipment Property, plant and equipment are stated at cost. Property, plant and equipment are principally depreciated using the declining-balance method, except for some assets which are depreciated using the straight-line method, mainly over the following estimated useful lives:
Buildings Buildings and building equipment 3 to 50 years Structures 7 to 60 years Machinery and equipment Machinery 4 to 15 years Vehicles 4 to 7 years Tools, furniture and fixtures 2 to 20 years
(j) Goodwill and Other Intangible Assets The Company tests goodwill and indefinite-lived intangible assets for impairment at least annually. The Company performs its annual impairment test mainly during the fourth quarter after the annual forecasting process is completed. Furthermore, goodwill is reviewed for impairment whenever events or changes in circumstances indicate that the carrying value may not be recoverable. The impairment test consists of two steps. In the first step, the Company compares the fair value of each reporting unit to its carrying value. The

HITACHI, LTD. AND SUBSIDIARIES
Notes to Consolidated Financial Statements
F-16 (Continued)
Company has certain operating segments and, in identifying the reporting unit for the purpose of testing goodwill for impairment, considers disaggregating those operating segments into economically dissimilar components based on specific facts and circumstances, especially the level at which performance of the operating segments are reviewed, how many businesses are included in the operating segments, and the economic similarity of those businesses. In assigning goodwill to reporting units, the Company considers which reporting units are expected to benefit from the synergies of the combination in a manner similar to how the amount of goodwill is recognized in a business combination. The Company determines the fair value of its reporting units mainly using an income approach (i.e., present value technique). When determining such fair value, the Company may, however, also use the fair value of that unit based on a comparison of comparable publicly traded companies or based on that unit’s stand-alone market capitalization. If the carrying value of the net assets assigned to the reporting unit exceeds the fair value of the reporting unit, then the Company performs the second step of the impairment test in order to determine the implied fair value of the reporting unit’s goodwill. If the carrying value of a reporting unit’s goodwill exceeds its implied fair value, the Company records an impairment loss equal to the difference. Intangible assets with finite useful lives are amortized over their respective estimated useful lives on either a straight-line basis or the method that reflects the pattern in which the economic benefits of the intangible assets are consumed or otherwise used up. The principal estimated useful lives are as follows:
Software 2 to 9 years Software for internal use 3 to 10 years Patents 4 to 8 years Other 3 to 25 years
(k) Capitalized Software Costs Costs incurred for computer software developed or obtained for internal use are capitalized and amortized on a straight-line basis over their estimated useful lives in accordance with ASC 350, “Intangibles – Goodwill and Other.” In addition, the Company and its subsidiaries develop certain computer software to be sold where related costs are capitalized after establishment of technological feasibility in accordance with ASC 985, “Software.” The annual amortization of such capitalized costs is the greater of the amount computed using the ratio of each software’s current year gross revenues to the total of current and anticipated future gross revenues or the straight-line method over the remaining estimated economic life of each software product.
(l) Impairment of Long-Lived Assets
The Company reviews the carrying value of long-lived assets or a related group of assets to be held and used, including intangible assets with finite useful lives, for impairment whenever events or circumstances occur that indicate that the carrying value of the assets may not be recoverable. The assets are considered to be impaired when estimated undiscounted cash flows expected to result from the use of the assets and their eventual disposition is less than their carrying values. The impairment losses are measured as the amount by which the carrying value of the asset or asset group exceeds the fair value. In determining the fair value, the Company uses available quoted market prices and present value techniques, if appropriate, based on the estimated future cash flows expected to result from the use of the assets and their eventual disposition.

HITACHI, LTD. AND SUBSIDIARIES
Notes to Consolidated Financial Statements
F-17 (Continued)
(m) Retirement and Severance Benefits The Company accounts for retirement and severance benefits in accordance with ASC 715, “Compensation – Retirement Benefits.” Actuarial gains and losses and prior service benefit and cost included in accumulated other comprehensive loss are amortized using the straight-line method over the average remaining service period of active employees.
(n) Environmental Liabilities The cost for environmental remediation liabilities is accrued when it is probable that the Company will incur environmental assessments or cleanup costs and the amounts can be reasonably estimated. The cost for liabilities is estimated based on the circumstances, the available information and current law, and the liabilities are not discounted to their present values.
(o) Derivative Financial Instruments
The Company accounts for derivative financial instruments in accordance with ASC 815, “Derivatives and Hedging.” This guidance requires that all derivative financial instruments, such as forward exchange and interest rate swap contracts, be recognized in the financial statements as either assets or liabilities and measured at fair value regardless of the purpose or intent for holding them. The Company designates and accounts for hedging derivatives as follows:
• “Fair value” hedge: a hedge of the fair value of a recognized asset or liability or of an unrecognized
firm commitment. The changes in fair value of the recognized assets or liabilities or unrecognized firm commitments and the related derivatives are both recorded in earnings if the hedge is considered highly effective.
• “Cash flow” hedge: a hedge of a forecasted transaction or of the variability of cash flows to be received
or paid related to a recognized asset or liability. The changes in the fair value of the derivatives designated as cash flow hedges are recorded as other comprehensive income (loss) if the hedge is considered highly effective. This treatment is continued until earnings are affected by the variability in cash flows or the unrecognized firm commitment of the designated hedged item, at which point changes in fair value of the derivative are recognized in income (loss).
• “Foreign currency” hedge: a hedge of foreign-currency fair value or cash flow. The changes in fair
value of the recognized assets or liabilities or unrecognized firm commitments and the derivatives are recorded as either earnings or other comprehensive income (loss) if the hedge is considered highly effective. Recognition as earnings or other comprehensive income (loss) is dependent on the treatment of foreign currency hedges as either fair value or cash flow hedges.
The Company follows the documentation requirements as prescribed by the guidance, which includes risk management objective and strategy for undertaking various hedge transactions. In addition, a formal assessment is made at the hedge’s inception and periodically on an ongoing basis, as to whether the derivative used in hedging activities is highly effective in offsetting changes in fair values or cash flows of hedged items. Hedge accounting is discontinued for ineffective hedges, if any. Subsequent changes in the fair value of derivatives related to discontinued hedges are recognized in earnings immediately.
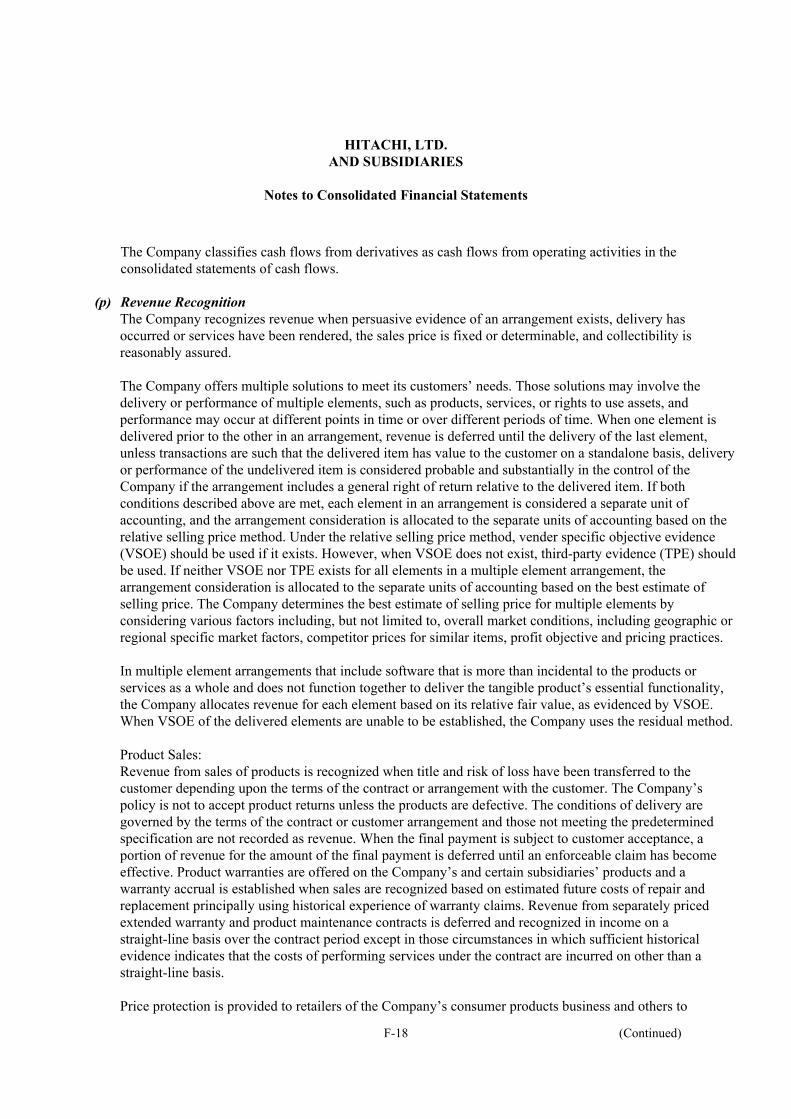
HITACHI, LTD. AND SUBSIDIARIES
Notes to Consolidated Financial Statements
F-18 (Continued)
The Company classifies cash flows from derivatives as cash flows from operating activities in the consolidated statements of cash flows.
(p) Revenue Recognition The Company recognizes revenue when persuasive evidence of an arrangement exists, delivery has occurred or services have been rendered, the sales price is fixed or determinable, and collectibility is reasonably assured.
The Company offers multiple solutions to meet its customers’ needs. Those solutions may involve the delivery or performance of multiple elements, such as products, services, or rights to use assets, and performance may occur at different points in time or over different periods of time. When one element is delivered prior to the other in an arrangement, revenue is deferred until the delivery of the last element, unless transactions are such that the delivered item has value to the customer on a standalone basis, delivery or performance of the undelivered item is considered probable and substantially in the control of the Company if the arrangement includes a general right of return relative to the delivered item. If both conditions described above are met, each element in an arrangement is considered a separate unit of accounting, and the arrangement consideration is allocated to the separate units of accounting based on the relative selling price method. Under the relative selling price method, vender specific objective evidence (VSOE) should be used if it exists. However, when VSOE does not exist, third-party evidence (TPE) should be used. If neither VSOE nor TPE exists for all elements in a multiple element arrangement, the arrangement consideration is allocated to the separate units of accounting based on the best estimate of selling price. The Company determines the best estimate of selling price for multiple elements by considering various factors including, but not limited to, overall market conditions, including geographic or regional specific market factors, competitor prices for similar items, profit objective and pricing practices. In multiple element arrangements that include software that is more than incidental to the products or services as a whole and does not function together to deliver the tangible product’s essential functionality, the Company allocates revenue for each element based on its relative fair value, as evidenced by VSOE. When VSOE of the delivered elements are unable to be established, the Company uses the residual method. Product Sales: Revenue from sales of products is recognized when title and risk of loss have been transferred to the customer depending upon the terms of the contract or arrangement with the customer. The Company’s policy is not to accept product returns unless the products are defective. The conditions of delivery are governed by the terms of the contract or customer arrangement and those not meeting the predetermined specification are not recorded as revenue. When the final payment is subject to customer acceptance, a portion of revenue for the amount of the final payment is deferred until an enforceable claim has become effective. Product warranties are offered on the Company’s and certain subsidiaries’ products and a warranty accrual is established when sales are recognized based on estimated future costs of repair and replacement principally using historical experience of warranty claims. Revenue from separately priced extended warranty and product maintenance contracts is deferred and recognized in income on a straight-line basis over the contract period except in those circumstances in which sufficient historical evidence indicates that the costs of performing services under the contract are incurred on other than a straight-line basis. Price protection is provided to retailers of the Company’s consumer products business and others to

HITACHI, LTD. AND SUBSIDIARIES
Notes to Consolidated Financial Statements
F-19 (Continued)
compensate the customer retailers for a decline in the product’s value due mainly to competition. Price protection granted to the customers is classified as a reduction of revenue in the consolidated statements of operations. In addition, it is the Company’s policy to accrue reasonably and reliably estimated price adjustments at the later of the date at which the related sales are recognized, or the date at which price protection is offered. The estimate is made based primarily upon historical experience or agreement on the adjustment rate and the number of units that are subject to such adjustment (e.g., units in distribution channels). Product revenues which are recognized upon delivery, installation or acceptance by the customer include information technology system products, construction equipment, displays, disk drives, televisions, air conditioners, batteries, magnetic tapes, high functional materials, cable products, automotive equipment, semiconductor manufacturing equipment, test and measurement equipment, railway vehicles, medical electronic devices, industrial machinery and equipment, elevators and escalators. Revenue from sales of tangible products under long-term construction type arrangements, in connection with the construction of nuclear, thermal and hydroelectric power plants, are recognized under the percentage-of-completion method. Under the percentage-of-completion method, revenue is recognized as a percentage of estimated total revenue that incurred costs to date bear to estimated total costs after giving effect to estimates of costs to complete based upon the most recent information. Any anticipated losses on fixed price contracts are charged to operations when such losses can be estimated. Provisions are made for contingencies in the period in which they become known pursuant to specific contract terms and conditions and are estimable. When reasonably dependable estimates of contract revenues and costs and the extent of progress toward completion do not exist, the completed-contract method of accounting is applied. A contract is complete when either acceptance by the customer is given or compliance with performance specifications is achieved, whichever is appropriate under the relevant contractual terms. The Company recognizes software revenue in accordance with the provisions of ASC 985, “Software.” Revenue from software consists primarily of software licensing, customized software development and post contract customer support. Revenues from software license arrangements are recognized upon delivery of the software if evidence of the arrangement exists, pricing is fixed or determinable and collectibility is reasonably assured. Revenue from a software arrangement that requires significant production, modification or customization of software is recognized using the percentage-of-completion method provided that reasonably dependable estimates related to contract revenue, cost and the extent of progress toward completion exist. Otherwise, the completed-contract method is applied. Customization of software is considered substantially completed when an acceptance by the customer occurs. Revenue from post contract customer support is amortized over the period of the post contract customer support. Consulting and training services revenues are recognized when the services are rendered. Service Revenues: Service revenues from maintenance and distribution services are recognized upon completion of service delivery. Revenue from time-based service contracts is recognized as services are rendered. Revenue from long-term fixed price service contracts such as support or maintenance contracts is recognized ratably over the contractual period. If historical data shows that the accrual of service cost is not fixed and the service is rendered in proportion to the accrual of the cost for the service, revenue is recognized based on the pattern of the cost accrual. Finance lease income is recognized at level rates of return over the term of the leases. Operating lease income is recognized on a straight-line basis over the term of the lease.
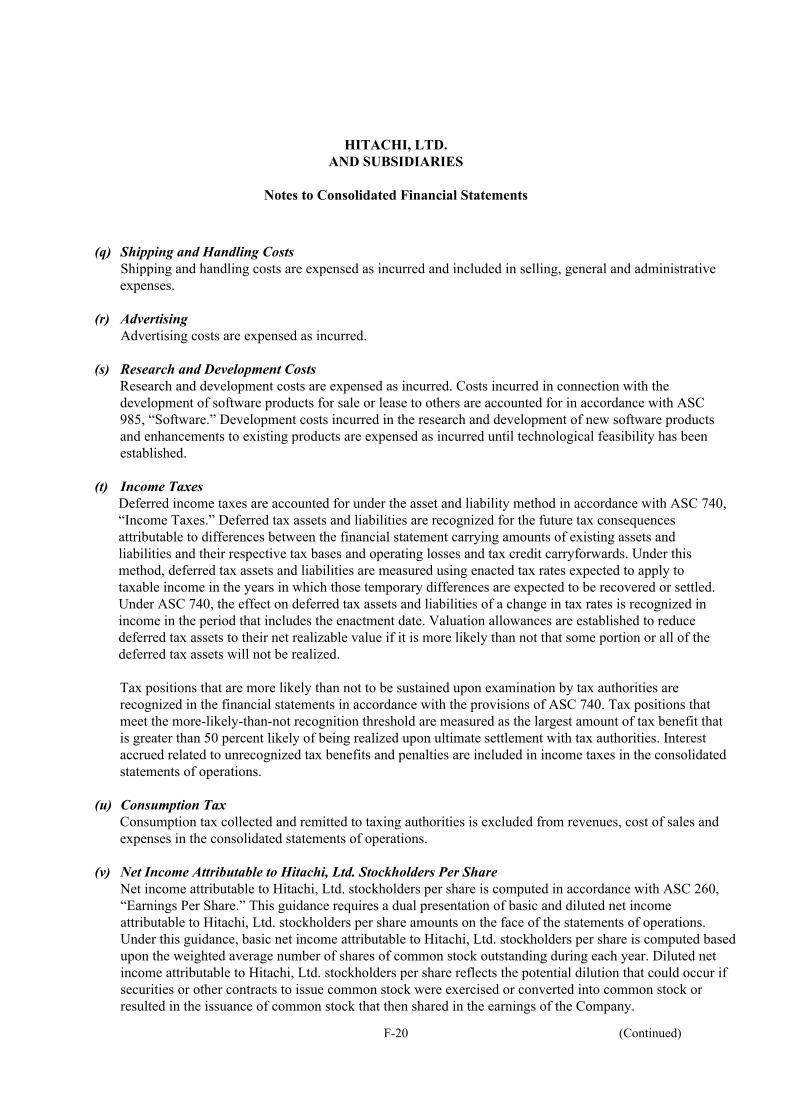
HITACHI, LTD. AND SUBSIDIARIES
Notes to Consolidated Financial Statements
F-20 (Continued)
(q) Shipping and Handling Costs Shipping and handling costs are expensed as incurred and included in selling, general and administrative expenses.
(r) Advertising Advertising costs are expensed as incurred.
(s) Research and Development Costs Research and development costs are expensed as incurred. Costs incurred in connection with the development of software products for sale or lease to others are accounted for in accordance with ASC 985, “Software.” Development costs incurred in the research and development of new software products and enhancements to existing products are expensed as incurred until technological feasibility has been established.
(t) Income Taxes Deferred income taxes are accounted for under the asset and liability method in accordance with ASC 740, “Income Taxes.” Deferred tax assets and liabilities are recognized for the future tax consequences attributable to differences between the financial statement carrying amounts of existing assets and liabilities and their respective tax bases and operating losses and tax credit carryforwards. Under this method, deferred tax assets and liabilities are measured using enacted tax rates expected to apply to taxable income in the years in which those temporary differences are expected to be recovered or settled. Under ASC 740, the effect on deferred tax assets and liabilities of a change in tax rates is recognized in income in the period that includes the enactment date. Valuation allowances are established to reduce deferred tax assets to their net realizable value if it is more likely than not that some portion or all of the deferred tax assets will not be realized. Tax positions that are more likely than not to be sustained upon examination by tax authorities are recognized in the financial statements in accordance with the provisions of ASC 740. Tax positions that meet the more-likely-than-not recognition threshold are measured as the largest amount of tax benefit that is greater than 50 percent likely of being realized upon ultimate settlement with tax authorities. Interest accrued related to unrecognized tax benefits and penalties are included in income taxes in the consolidated statements of operations.
(u) Consumption Tax Consumption tax collected and remitted to taxing authorities is excluded from revenues, cost of sales and expenses in the consolidated statements of operations.
(v) Net Income Attributable to Hitachi, Ltd. Stockholders Per Share Net income attributable to Hitachi, Ltd. stockholders per share is computed in accordance with ASC 260, “Earnings Per Share.” This guidance requires a dual presentation of basic and diluted net income attributable to Hitachi, Ltd. stockholders per share amounts on the face of the statements of operations. Under this guidance, basic net income attributable to Hitachi, Ltd. stockholders per share is computed based upon the weighted average number of shares of common stock outstanding during each year. Diluted net income attributable to Hitachi, Ltd. stockholders per share reflects the potential dilution that could occur if securities or other contracts to issue common stock were exercised or converted into common stock or resulted in the issuance of common stock that then shared in the earnings of the Company.

HITACHI, LTD. AND SUBSIDIARIES
Notes to Consolidated Financial Statements
F-21 (Continued)
(w) Guarantees
The Company recognizes, at the inception of the guarantee, a liability for the fair value of the obligation undertaken in issuing the guarantee in accordance with ASC 460, “Guarantees.”
(x) Subsequent Events The Company has evaluated up to June 22, 2012, the date on which its consolidated financial statements were available to be issued in accordance with the provisions of ASC855, "Subsequent Events."
(y) Accounting Changes The Company adopted the provisions of ASC 860, “Transfers and Servicing” amended by Accounting Standards Update (ASU) 2009-16, “Accounting for Transfers of Financial Assets” on April 1, 2010. These provisions remove the concept of a qualifying special-purpose entity and remove the exception from the application of variable interest accounting to qualifying special-purpose entities. These provisions modify the financial-components approach used to account for transfers of financial assets, limit the circumstances in which a transferor derecognizes a portion or component of a financial asset when the transferor has not transferred the original financial asset to an entity and/or when the transferor has continuing involvement with the financial asset, and establish the “participating interests” conditions for reporting a transfer. The provisions also require enhanced disclosures to provide financial statement users with greater transparency about transfers of financial assets and a transferor’s continuing involvement. The Company adopted the provisions of ASC 810, “Consolidation” amended by ASU 2009-17, “Improvements to Financial Reporting by Enterprises Involved with Variable Interest Entities” on April 1, 2010. These provisions establish how a company determines when an entity that is insufficiently capitalized or is not controlled through voting or similar rights should be consolidated. The determination of whether a company is required to consolidate an entity is based on qualitative information such as an entity’s purpose and design and a company’s ability to direct the activities of the entity that most significantly impact the entity’s economic performance. The provisions also require enhanced disclosures that will provide users of financial statements with more transparent information about an enterprise’s involvement in a variable interest entity. The effect of the adoption of the provisions amended by ASU 2009-16 and ASU 2009-17 is presented in note 6. The Company adopted the provisions of ASC 605-25, “Revenue Recognition – Multiple Element Arrangements,” amended by Accounting Standards Update (ASU) 2009-13, “Multiple-Deliverable Revenue Arrangements.” on April 1, 2011. The provisions supersede certain provisions regarding multiple element arrangements in ASC 605-25. The provisions require an entity to allocate arrangement consideration at the inception of an arrangement to all of its deliverables based on their relative selling prices (the relative selling price method) following an established selling price hierarchy for determining the selling price of a deliverable, and eliminating the use of the residual method for multiple element arrangements subject to ASC 605-25. The provisions require both ongoing disclosures regarding an entity’s multiple-deliverable revenue arrangements as well as certain transitional disclosures during periods after adoption. Entities may elect to adopt the provisions through either prospective application for revenue arrangements entered into, or materially modified, after the effective date or through retrospective application to all revenue arrangements for all periods presented.

HITACHI, LTD. AND SUBSIDIARIES
Notes to Consolidated Financial Statements
F-22 (Continued)
The Company adopted the provisions of ASC 985, “Software,” amended by ASU 2009-14, “Certain Revenue Arrangements That Include Software Elements.” on April 1, 2011. The provisions affect how entities account for revenue arrangements that contain both tangible products and software elements. Previously, arrangements containing both tangible products and software were accounted for based on the provisions regarding revenue recognition included in ASC 985, “Software,” if the software is considered more than incidental to the product or service. The provisions change revenue recognition for tangible products containing software elements and non-software elements that function together to deliver the tangible product’s essential functionality by eliminating them from the scope of ASC 985. An entity must select the same transition method and same period for the adoption for both this guidance and the revisions to the multiple-deliverable revenue arrangements guidance required by ASU 2009-13. For revenue arrangements entered into or materially modified after April 1, 2011, the Company recognizes revenue based on the new provisions. Most of the Company’s multiple element arrangements comprise a deliverable such as information technology system products, machinery and equipment, installation of software, service including maintenance and others. The Company had recognized revenue for each element when VSOE or TPE was established. If VSOE or TPE of any undelivered item was not established, revenue from the entire arrangements was deferred until the delivery of the last element. Under the new provisions, for non-software elements such as machinery or equipment, if VSOE or TPE is not established, arrangement consideration is allocated to each separate element based on the best estimate of the selling price and the Company recognizes revenue for each separate element. The effect of the adoption of these provisions is not material to our financial statements.

HITACHI, LTD. AND SUBSIDIARIES
Notes to Consolidated Financial Statements
F-23 (Continued)
(3) Investments in Securities and Affiliated Companies Short-term investments as of March 31, 2012 and 2011 are as follows:
Yen (millions) 2012 2011 Investments in securities: Available-for-sale securities Government debt securities 4,452 2,907 Corporate debt securities 6,954 11,041 Other securities 84 2,610 Held-to-maturity securities 72 40 11,562 16,598
Investments and advances, including affiliated companies as of March 31, 2012 and 2011 are as follows:
Yen (millions) 2012 2011 Investments in securities: Available-for-sale securities Equity securities 220,491 145,816 Government debt securities 329 325 Corporate debt securities 24,732 27,039 Other securities 7,467 6,697 Held-to-maturity securities 321 355 Cost-method investments 56,174 48,144Investments in affiliated companies 309,733 316,443Advances and other 125,246 69,326 744,493 614,145
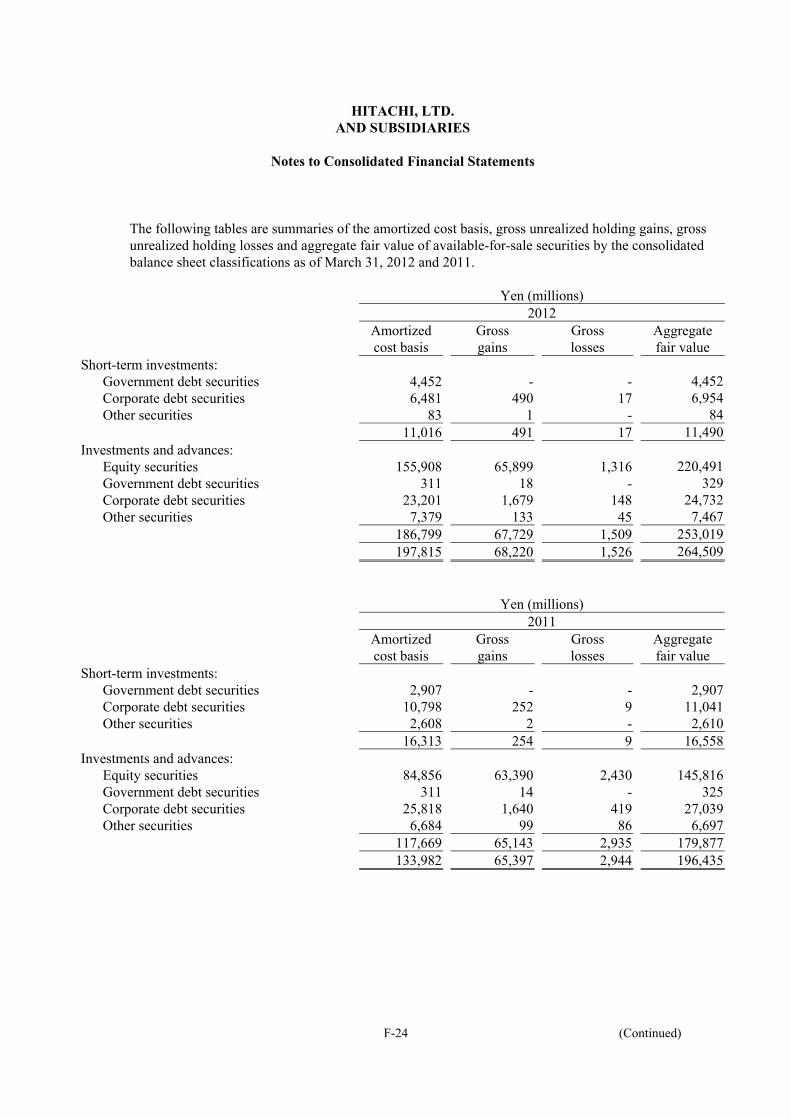
HITACHI, LTD. AND SUBSIDIARIES
Notes to Consolidated Financial Statements
F-24 (Continued)
The following tables are summaries of the amortized cost basis, gross unrealized holding gains, gross unrealized holding losses and aggregate fair value of available-for-sale securities by the consolidated balance sheet classifications as of March 31, 2012 and 2011.
Yen (millions) 2012
Amortized cost basis
Gross gains
Gross losses
Aggregate fair value
Short-term investments: Government debt securities 4,452 - - 4,452 Corporate debt securities 6,481 490 17 6,954 Other securities 83 1 - 84 11,016 491 17 11,490Investments and advances: Equity securities 155,908 65,899 1,316 220,491 Government debt securities 311 18 - 329 Corporate debt securities 23,201 1,679 148 24,732 Other securities 7,379 133 45 7,467 186,799 67,729 1,509 253,019 197,815 68,220 1,526 264,509 Yen (millions) 2011
Amortized cost basis
Gross gains
Gross losses
Aggregate fair value
Short-term investments: Government debt securities 2,907 - - 2,907 Corporate debt securities 10,798 252 9 11,041 Other securities 2,608 2 - 2,610 16,313 254 9 16,558Investments and advances: Equity securities 84,856 63,390 2,430 145,816 Government debt securities 311 14 - 325 Corporate debt securities 25,818 1,640 419 27,039 Other securities 6,684 99 86 6,697 117,669 65,143 2,935 179,877 133,982 65,397 2,944 196,435

HITACHI, LTD. AND SUBSIDIARIES
Notes to Consolidated Financial Statements
F-25 (Continued)
The following tables are summaries of gross unrealized holding losses on available-for-sale securities and the fair value of the related securities, aggregated by investment category and length of time that individual securities have been in a continuous unrealized loss position, as of March 31, 2012 and 2011.
Yen (millions) 2012 Less than 12 months 12 months or longer
Aggregate fair value
Gross losses
Aggregate fair value
Gross losses
Short-term investments: Corporate debt securities 2,847 9 1,691 8 Investments and advances: Equity securities 5,509 535 3,832 781 Corporate debt securities 7,227 118 2,770 30 Other securities - - 202 45 12,736 653 6,804 856 15,583 662 8,495 864 Yen (millions) 2011 Less than 12 months 12 months or longer
Aggregate fair value
Gross losses
Aggregate fair value
Gross losses
Short-term investments: Corporate debt securities 5,691 9 - - Investments and advances: Equity securities 9,378 1,183 4,381 1,247 Corporate debt securities 8,355 306 4,933 113 Other securities 100 40 215 46 17,833 1,529 9,529 1,406 23,524 1,538 9,529 1,406
Equity securities consist primarily of stocks issued by Japanese and the U.S. listed companies. Government debt securities consist primarily of Japan treasury bonds. Corporate debt securities consist primarily of structured bonds. Other securities consist primarily of investment funds.

HITACHI, LTD. AND SUBSIDIARIES
Notes to Consolidated Financial Statements
F-26 (Continued)
The following table represents the purchases, proceeds from the sale, gross realized gains on the sale, and gross realized losses on the sale of available-for-sale securities for the years ended March 31, 2012, 2011 and 2010.
Yen (millions) 2012 2011 2010 Purchases 24,641 26,490 59,038Proceeds from the sale 5,288 11,646 5,890Gross realized gains on the sale 2,224 3,556 1,124Gross realized losses on the sale 280 385 56
The contractual maturities of debt securities and other securities classified as investments and advances in the consolidated balance sheet as of March 31, 2012 are as follows: Yen (millions)
Held-to- maturity
Available- for-sale
Total
Due within five years 321 16,026 16,347Due after five years through ten years - 2,716 2,716Due after ten years - 13,786 13,786 321 32,528 32,849
Expected redemptions may differ from contractual maturities because some of these securities are redeemable at the option of the issuers. The aggregate carrying amounts of cost-method investments which were not evaluated for impairment as of March 31, 2012 and 2011 were ¥56,166 million and ¥43,797 million, respectively, mainly because it was not practicable to estimate the fair value of the investments due to lack of a market price and difficulty in estimating fair value without incurring excessive cost and the Company did not identify any events or changes in circumstances that might have had a significant adverse effect on their fair value. The aggregate fair values of investments in affiliated companies, for which quoted market prices were available, as of March 31, 2012 and 2011, were ¥88,532 million and ¥104,427 million, respectively. The aggregate carrying amounts of such investments as of March 31, 2012 and 2011 were ¥79,939 million and ¥99,299 million, respectively. As of March 31, 2012 and 2011, cumulative recognition of other-than-temporary declines in values of investments in certain affiliated companies resulted in the difference of ¥18,280 million and ¥17,837 million, respectively, between the carrying amount of the investment and the amount of underlying equity in net assets. In addition, as of March 31, 2012 and 2011, the carrying value of the investments in affiliated companies exceeded the Company's equity in the underlying net assets of such affiliated companies by ¥101,565 million and ¥111,917 million, respectively. The excess is attributed first to certain fair value adjustments on a net-of-tax basis at the time of the initial and subsequent investments in those companies with the remaining portion considered as equity-method goodwill.

HITACHI, LTD. AND SUBSIDIARIES
Notes to Consolidated Financial Statements
F-27 (Continued)
For the year ended March 31, 2012 and 2011, there were no affiliated companies accounted for by the equity method which were material to be disclosed separately. Summarized combined financial information relating to affiliated companies accounted for by the equity method as of and for the year ended March 31, 2012 and 2011 is as follows:
Yen (millions) 2012 2011
Current assets 1,512,351 1,305,406Non-current assets 1,021,152 835,964
Total assets 2,533,503 2,141,370Current liabilities 1,380,640 1,145,724Non-current liabilities 470,953 334,298
Total liabilities 1,851,593 1,480,022
Yen (millions) 2012 2011 Revenues 2,061,144 2,208,543Gross profit 463,136 588,095Net loss attributable to affiliated companies (73,204 ) (69,878)
Summarized financial information relating to Renesas Technology Corp. (Renesas), Casio Hitachi Mobile Communications Co., Ltd. (CHMC) and other affiliated companies accounted for by the equity method for the year ended March 31, 2010 is as follows:

HITACHI, LTD. AND SUBSIDIARIES
Notes to Consolidated Financial Statements
F-28 (Continued)
Yen (millions) 2010 Renesas CHMC Others Total Revenues 599,791 99,623 1,170,893 1,870,307Cost of sales (555,990) (110,381) (1,007,203 ) (1,673,574)
Gross profit (loss) 43,801 (10,758) 163,690 196,733Selling, general and administrative expenses (108,003) (14,448) (176,368 ) (298,819)Impairment losses for long-lived assets (4,551) - Restructuring charges (202) - Other deductions (net) (12,603) (12)
Loss before income taxes (81,558) (25,218) Income taxes (4,991) (4,150)
Net loss (86,549) (29,368) Less net loss attributable to noncontrolling interests (183) -
Net loss attributable to affiliated companies (86,366) (29,368) (51,729 ) (167,463)Percentage of ownership in equity investees 55.0% 49.0% Equity in net loss of affiliated companies, before consolidating and reconciling adjustments (47,501) (14,390)
Consolidation and reconciling adjustments (96) (1) Equity in net earning (loss) of affiliated companies (47,597) (14,391) 3,802
(58,186)
On April 1, 2003, Renesas, which focused on system LSI (Large Scale Integration) operations, was incorporated through a corporate split procedure, where the semiconductor and integrated circuits operations of the Company and Mitsubishi Electric Corporation were spun-off and contributed to a new company. Although the Company had owned 55.0% of the voting stock of Renesas since its foundation, the Company accounted for the investment under the equity method of accounting as Mitsubishi Electric Corp. had substantive participating rights under the joint venture agreement. Renesas increased its capital by ¥71,700 million during the years ended March 31, 2010. Renesas Electronics Corporation was established on April 1, 2010 when Renesas was combined with NEC Electronics Corporation. As a result, the Company received a 30.6% interest in Renesas Electronics Corporation and accounts for the investment under the equity method of accounting. On April 1, 2004, CHMC, which focused on mobile phone design, production and sales, was incorporated. The Company had owned 49.0% of the voting stock of CHMC since its foundation and accounted for the investment under the equity method of accounting. CHMC increased its capital by ¥44,000 million during the year ended March 31, 2010. On June 1, 2010, CHMC was merged into NEC CASIO Mobile Communications, Ltd. Consequently, the Company received a 16.7% interest in NEC CASIO Mobile Communications, Ltd. and accounts for the investment under the cost method of accounting. NEC CASIO Mobile Communications, Ltd. increased its capital by allocating new shares to shareholders other than the Company in June 2010, and as a result, the Company’s interest in NEC CASIO Mobile Communications, Ltd. decreased to 9.3%.

HITACHI, LTD. AND SUBSIDIARIES
Notes to Consolidated Financial Statements
F-29 (Continued)
The balances and transactions with affiliated companies accounted for by the equity method are as follows:
Yen (millions) 2012 2011 Trade receivables 107,844 77,484 Investments in leases 6,295 12,158 Trade payables 27,960 21,543 Yen (millions) 2012 2011 2010 Revenues 338,814 315,533 373,889 Purchases 128,675 131,686 226,012

F-30 (Continued)
HITACHI, LTD. AND SUBSIDIARIES
Notes to Consolidated Financial Statements
(4) Inventories Inventories as of March 31, 2012 and 2011 are summarized as follows:
Yen (millions) 2012 2011 Finished goods 538,634 533,724 Work in process 606,228 566,127 Raw materials 268,390 241,917 1,413,252 1,341,768
(5) Leases The Company and certain subsidiaries are lessors of certain assets such as manufacturing machinery and equipment under financing and operating lease arrangements with terms ranging mainly from 3 to 6 years, some of which are transacted with affiliated companies. The amount of leased assets at cost under operating leases and accumulated depreciation as of March 31, 2012 amounted to ¥2,014,463 million and ¥1,730,312 million, respectively. The leased assets are depreciated using the straight-line method over their estimated useful lives.
The following table shows the future minimum lease receivables of financing and non-cancelable operating
leases as of March 31, 2012 and the future minimum lease receivables of financing leases as of March 31, 2011: Yen (millions) 2012
Years ending March 31 Financing
leases Operating
leases 2013 333,750 37,5342014 204,969 22,0512015 112,217 13,5612016 61,656 7,2522017 32,420 3,190Thereafter 93,623 1,495Total minimum payments to be received 838,635 85,083Unguaranteed residual values 40,612 Amount representing executory costs (78,372) Unearned income (57,544) Allowance for doubtful receivables (7,680) Net investment in financing leases 735,651 Less current portion of net investment in financing leases, included in
investments in leases and current portion of financial assets transferred to consolidated securitization entities 302,770
Long-term net investment in financing leases, included in other assets and financial assets transferred to consolidated securitization entities 432,881

F-31 (Continued)
HITACHI, LTD. AND SUBSIDIARIES
Notes to Consolidated Financial Statements
Yen (millions) 2011
Financing
leases
Total minimum payments to be received 956,128 Unguaranteed residual values 52,036 Amount representing executory costs (67,396) Unearned income (67,631) Allowance for doubtful receivables (6,136) Net investment in financing leases 867,001 Less current portion of net investment in financing leases, included in
investments in leases and current portion of financial assets transferred to consolidated securitization entities 337,935
Long-term net investment in financing leases, included in other assets and financial assets transferred to consolidated securitization entities 529,066
The Company and certain subsidiaries lease certain buildings, manufacturing machinery and equipment used in their operations. The amount of leased assets at cost under capital leases as of March 31, 2012 and 2011 amounted to ¥25,641 million and ¥40,952 million, respectively, and accumulated depreciation as of March 31, 2012 and 2011 amounted to ¥11,995 million and ¥18,225 million, respectively. Amortization of assets under capital leases is included in depreciation expense. The following table shows the future minimum lease payments of capital and non-cancelable operating leases as of March 31, 2012: Yen (millions)
Years ending March 31 Capital leases
Operating leases
2013 8,472 17,430 2014 6,627 13,638 2015 4,262 11,762 2016 2,816 7,934 2017 2,103 5,962 Thereafter 4,247 25,158 Total minimum lease payments 28,527 81,884 Amount representing executory costs (45) Amount representing interest (2,197) Present value of net minimum lease payments 26,285 Less current portion of capital lease obligations 7,930 Long-term capital lease obligations 18,355

F-32 (Continued)
HITACHI, LTD. AND SUBSIDIARIES
Notes to Consolidated Financial Statements
(6) Securitizations The Company and certain subsidiaries securitize certain financial assets, such as lease, trade and mortgage loans receivable, and arrange other forms of asset-backed financing for the purpose of providing diversified and stable fund raising as part of their ongoing securitization activities. Historically, they have used Hitachi-supported and third-party Special Purpose Entities (SPEs) to execute securitization transactions funded with commercial paper and other borrowings. These securitization transactions are similar to those used by many financial institutions. Investors in these entities only have recourse to the assets owned by the entity and not to their general credit, unless noted below. The Company and certain subsidiaries do not provide non-contractual support to SPEs and do not have implicit support arrangements with any SPEs. The majority of their involvement with SPEs related to the securitization activities are assisting in the formation and financing of an entity, providing limited credit enhancements, servicing the assets and receiving fees for services provided. A portion of these lease, trade and mortgage loans receivable is transferred to SPEs sponsored by financial institutions, which operate those SPEs as a part of their businesses. Accordingly, the amount of assets transferred by the Company and its subsidiaries is considerably small compared to the total assets of the SPEs sponsored by these financial institutions that purchase a large amount of assets from entities other than the Company and its subsidiaries. In certain transactions, investors have recourse with a scope that is considerably limited. The transferred assets have similar risks and characteristics to the Company’s and certain subsidiaries’ receivables recorded on the consolidated balance sheets. Accordingly, the performance, such as collections or expected credit loss, of these transferred assets has been similar to the receivables recorded on the consolidated balance sheets for the Company and certain subsidiaries; however, the blended performance of the pools of transferred assets reflects the eligibility screening requirements that the Company and certain subsidiaries apply to determine which receivables are selected for transfer. Therefore, the blended performance may differ from receivables recorded on the consolidated balance sheets. Most of the transactions transferring lease and mortgage loans receivable utilize securitization trusts. In those transactions, certain subsidiaries initially transfer the receivables to trusts that had satisfied the conditions of Qualifying SPEs (QSPEs), which under guidance in effect through March 31, 2010 were excluded from the scope of consolidation provisions, and receive the beneficial interests in trusts originated from the transferred assets. Subsequently, the subsidiaries transfer the interests to and receive cash as consideration from SPEs that are not former QSPEs, as a part of securitization arrangements.

F-33 (Continued)
HITACHI, LTD. AND SUBSIDIARIES
Notes to Consolidated Financial Statements
The remaining financial assets, consisting mainly of trade receivables, were transferred to former QSPEs established by certain of the Company’s subsidiaries in the Cayman Islands. In those transactions, the Company and certain subsidiaries received cash as consideration from the former QSPEs that were funded through the issuance of asset-backed securities or other borrowings from investors that were secured by the transferred assets. The Company and certain subsidiaries retained subordinated interests in the transferred assets relating to these transactions, or otherwise investors had recourse with considerably limited scope. Furthermore, the Company and certain subsidiaries retained servicing responsibility, and certain of the Company’s subsidiaries provided credit facilities to the former QSPEs in accordance with the service agency business contracts from which temporary payments on behalf of the former QSPEs were made. As of March 31, 2010, the Company and its subsidiaries had three QSPEs with outstanding balances of transferred receivables and the total amount of their assets was ¥117,159 million. Since the Company and its subsidiaries terminated the transactions with the former QSPEs by March 31, 2011, there are no outstanding balances of transferred receivables to the former QSPEs as of March 31, 2011. The Company and its subsidiaries did not hold any of the voting shares issued by those former QSPEs, and none of the directors of those former QSPEs were executives or employees of the Company or its subsidiaries. Additionally, the former QSPEs also purchased receivables from third-party customers. In accordance with the new consolidation provisions effective April 1, 2010, the Company and certain subsidiaries are deemed to have a controlling financial interest and are the primary beneficiary of an SPE if it has both the power to direct the activities of the SPE that most significantly impact the SPE’s economic performance and the obligation to absorb losses or the right to receive benefits that could potentially be significant to the SPE. As a result of adoption of these provisions, the Company consolidated former QSPEs that were unconsolidated prior to April 1, 2010 using the carrying amounts of the SPEs’ assets and liabilities as of April 1, 2010.

F-34 (Continued)
HITACHI, LTD. AND SUBSIDIARIES
Notes to Consolidated Financial Statements
The incremental impact of adoption of these provisions on the Company’s consolidated balance sheet as of April 1, 2010 is set forth in the following table. A net reduction of total equity of ¥17,919 million was principally relating to the reversal of previously recognized gains on sales of financial assets as a cumulative effect adjustment.
Yen (millions) Net
increase (decrease)Cash and cash equivalents 12,030Current portion of financial assets transferred to consolidated securitization entities 339,875
Prepaid expenses and other current assets (33,283)Investments and advances, including affiliated companies (117,370)Financial assets transferred to consolidated securitization entities 457,104Other assets 12,202
Total assets 670,558 Current portion of long-term debt (4,898)Current portion of non-recourse borrowings of consolidated securitization entities 347,367
Other current liabilities (55,163)Long-term debt (2,081)Non-recourse borrowings of consolidated securitization entities 403,252
Total liabilities 688,477 Legal reserve and retained earnings (7,732)Accumulated other comprehensive loss (2,977)Noncontrolling interests (7,210)
Total equity (17,919)
Consolidated SPEs The Company consolidated SPEs mainly because the Company has both the power to direct the activities of the SPEs that most significantly impact the SPEs’ economic performance and the obligation to absorb losses or the right to receive benefits that could potentially be significant to the SPEs. The consolidated SPEs are mainly trusts for the securitizations of lease receivables and mortgage loans receivable.

F-35 (Continued)
HITACHI, LTD. AND SUBSIDIARIES
Notes to Consolidated Financial Statements
The tables below summarize the assets and liabilities of the consolidated SPEs as of March 31, 2012 and 2011 by type of transferred financial assets that those SPEs hold:
Yen (millions)
2012
Lease receivables
Mortgageloans
receivable
Others
Total Cash and cash equivalents 4,760 2,837 1,087 8,684Current portion of financial assets transferred to
consolidated securitization entities 67,026 10,401 8,644
86,071Financial assets transferred to consolidated
securitization entities 51,570 151,826 2,015
205,411
Current portion of non-recourse borrowings of consolidated securitization entities:
Loans, mainly from banks 42,207 - - 42,207Beneficial interests in trusts 32,672 13,928 8,197 54,797
74,879 13,928 8,197 97,004 Non-recourse borrowings of
consolidated securitization entities:
Loans, mainly from banks 3,943 - - 3,943Beneficial interests in trusts 4,117 126,008 975 131,100 8,060 126,008 975 135,043

F-36 (Continued)
HITACHI, LTD. AND SUBSIDIARIES
Notes to Consolidated Financial Statements
Yen (millions) 2011
Lease receivables
Mortgageloans
receivable
Others
Total Cash and cash equivalents 4,091 3,263 1,059 8,413Current portion of financial assets transferred to
consolidated securitization entities 109,589 11,236 62,734
183,559Financial assets transferred to consolidated
securitization entities 123,970 175,506 4,684
304,160
Current portion of non-recourse borrowings of consolidated securitization entities:
Loans, mainly from banks 75,539 - 16,512 92,051Beneficial interests in trusts 55,396 34,178 9,243 98,817
130,935 34,178 25,755 190,868 Non-recourse borrowings of
consolidated securitization entities:
Loans, mainly from banks 51,359 - - 51,359Beneficial interests in trusts 34,053 131,196 2,958 168,207 85,412 131,196 2,958 219,566
The aggregate annual maturities of non-recourse borrowings of consolidated securitization entities after March 31, 2013 are as follows:
Years ending March 31 Yen (millions) 2014 26,358 2015 16,810 2016 14,005 2017 11,848
Thereafter 66,022 135,043
The assets and liabilities of the consolidated SPEs on the table above exclude intercompany balances that are eliminated in consolidation. Substantially, all of the assets of the consolidated SPEs can only be used to settle obligations of those SPEs.

F-37 (Continued)
HITACHI, LTD. AND SUBSIDIARIES
Notes to Consolidated Financial Statements
Transfers to unconsolidated entities The following information is related to financial assets transferred to unconsolidated entities and accounted for as sales. Those financial assets are transferred mainly to SPEs sponsored by financial institutions. Securitizations of lease receivables: Hitachi Capital Corporation and certain other subsidiaries sold lease receivables to unconsolidated SPEs and other entities. Net gains recognized on the sale of these lease receivables for the years ended March 31, 2012, 2011 and 2010 were ¥6,853 million, ¥8,500 million and ¥10,017 million, respectively. The subsidiaries retained servicing responsibilities, but did not record a servicing asset or liability because the cost to service the receivables approximated the servicing income. The table below summarizes cash flows received from and paid to the SPEs and other entities during the years ended March 31, 2012, 2011 and 2010: Yen (millions) 2012 2011 2010 Proceeds from transfer of lease receivables 116,507 120,197 167,483 Servicing fees received - - 72 Purchases of delinquent or ineligible assets - - (60,983)
The amounts of the initial fair value of the subordinated interests for the years ended March 31, 2012 and 2011 were ¥18,061 million and ¥18,403 million, respectively. The subordinated interests relating to securitizations of lease receivables are initially classified as Level 3 assets within the fair value hierarchy. The initial fair value of the subordinated interests is determined based on economic assumptions including weighted-average life, expected credit risks, and discount rates.
Key economic assumptions used in measuring the initial fair value of the subordinated interests resulting from securitizations of lease receivables completed during the years ended March 31, 2012 and 2011 are as follows: 2012 2011 Weighted average life (in years) 4.1 4.2 Expected credit loss 0.02-0.03% 0.03-0.05% Discount rate 0.50-0.70% 0.38-0.80%

F-38 (Continued)
HITACHI, LTD. AND SUBSIDIARIES
Notes to Consolidated Financial Statements
Quantitative information about delinquencies, net credit losses, and components of lease receivables subject to transfer and other assets managed together as of and for the years ended March 31, 2012 and 2011 is as follows: Yen (millions) 2012
Total principal
amount ofreceivables
Principal amount of receivables 90 days or more past
due Net credit
loss Total assets managed or transferred: Lease receivables 955,565 412 588 Assets transferred (219,914) Assets held in portfolio 735,651
Yen (millions) 2011
Total principal
amount ofreceivables
Principal amount of receivables 90 days or more past
due Net credit
loss Total assets managed or transferred: Lease receivables 1,025,462 140 1,128 Assets transferred (158,461) Assets held in portfolio 867,001
As of March 31, 2012 and 2011, the amounts of the maximum exposures to losses were ¥60,723 million and ¥32,194 million, respectively. They mainly consist of the subordinated interests and the obligations to purchase assets with a scope that is considerably limited relating to these securitizations of lease receivables. As of March 31, 2012 and 2011, the amounts of the subordinated interests measured at fair value relating to these securitizations of lease receivables were ¥36,329 million and ¥18,941 million, respectively. Key economic assumptions used in measuring the fair value of the subordinated interests relating to securitizations of lease receivables as of March 31, 2012 and 2011 are as follows: 2012 2011 Weighted average life (in years) 3.7 3.5 Expected credit loss 0.02% 0.03% Discount rate 0.50-0.59% 0.70-0.80%

F-39 (Continued)
HITACHI, LTD. AND SUBSIDIARIES
Notes to Consolidated Financial Statements
The sensitivities of the current fair value of the Company’s interests to an immediate 10 and 20 percent adverse change in the assumptions as of March 31, 2012 and 2011 are as follows: Yen (millions) 2012 2011
Expected credit loss: Impact on fair value of 10% adverse change (62) (60) Impact on fair value of 20% adverse change (125) (121)
Discount rate: Impact on fair value of 10% adverse change (53) (47) Impact on fair value of 20% adverse change (106) (94)
These securitizations were designed to transfer the lease receivables through trusts that satisfied the conditions of former QSPEs. These trusts were not consolidated for the year ended March 31, 2010. Since almost all of those trusts were consolidated upon the adoption of the new consolidation provisions, the lease receivables transferred to the consolidated trusts were recognized on the Company’s consolidated balance sheet and classified as financial assets transferred to consolidated securitization entities on April 1, 2010. Securitizations of trade receivables: The Company and certain subsidiaries sold trade receivables mainly to unconsolidated SPEs and other entities. During the years ended March 31, 2012, 2011 and 2010, proceeds from the transfer of trade receivables were ¥593,001 million, ¥521,335 million and ¥737,820 million, respectively, and net gains and losses recognized on those transfers were a net loss of ¥158 million, a net gain of ¥140 million and a net loss of ¥1,853 million, respectively. The Company and certain subsidiaries retained servicing responsibilities, but did not record a servicing asset or liability because the cost to service the receivables approximated the servicing income. The amount of the initial fair value of the subordinated interests for the year ended March 31, 2012 was ¥29,095 million. The subordinated interests relating to securitizations of trade receivables are initially classified as Level 3 assets within the fair value hierarchy. The initial fair value of the subordinated interests is determined based on economic assumptions including weighted-average life, expected credit risks, discount rates, and prepayment rates. Key economic assumptions used in measuring the initial fair value of the subordinated interests resulting from securitizations of trade receivables completed during the year ended March 31, 2012 are as follows: 2012 Weighted average life (in years) 5.6 Expected credit loss 0.15-0.48% Discount rate 1.40-1.57%
Prepayment rate 4.98-12.24%
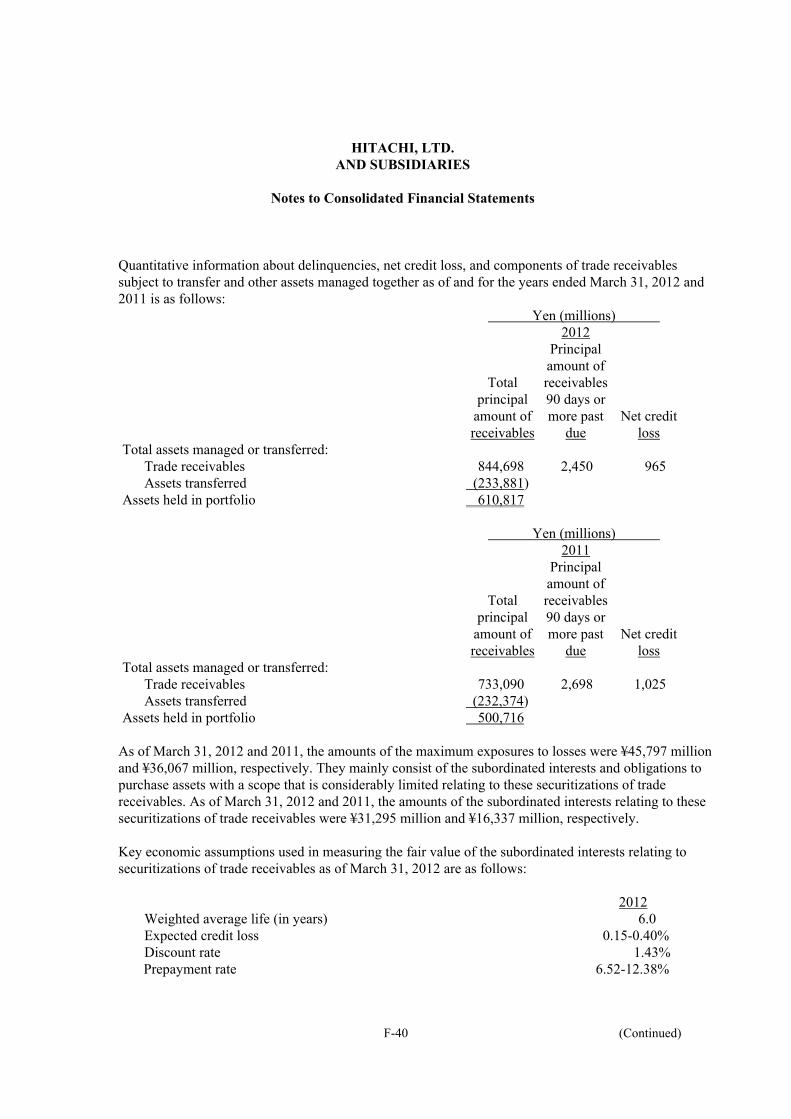
F-40 (Continued)
HITACHI, LTD. AND SUBSIDIARIES
Notes to Consolidated Financial Statements
Quantitative information about delinquencies, net credit loss, and components of trade receivables subject to transfer and other assets managed together as of and for the years ended March 31, 2012 and 2011 is as follows: Yen (millions) 2012
Total principal
amount ofreceivables
Principal amount of receivables 90 days or more past
due Net credit
loss Total assets managed or transferred: Trade receivables 844,698 2,450 965 Assets transferred (233,881) Assets held in portfolio 610,817
Yen (millions) 2011
Total principal
amount ofreceivables
Principal amount of receivables 90 days or more past
due Net credit
loss Total assets managed or transferred: Trade receivables 733,090 2,698 1,025 Assets transferred (232,374) Assets held in portfolio 500,716
As of March 31, 2012 and 2011, the amounts of the maximum exposures to losses were ¥45,797 million and ¥36,067 million, respectively. They mainly consist of the subordinated interests and obligations to purchase assets with a scope that is considerably limited relating to these securitizations of trade receivables. As of March 31, 2012 and 2011, the amounts of the subordinated interests relating to these securitizations of trade receivables were ¥31,295 million and ¥16,337 million, respectively. Key economic assumptions used in measuring the fair value of the subordinated interests relating to securitizations of trade receivables as of March 31, 2012 are as follows: 2012 Weighted average life (in years) 6.0 Expected credit loss 0.15-0.40% Discount rate 1.43%
Prepayment rate 6.52-12.38%

F-41 (Continued)
HITACHI, LTD. AND SUBSIDIARIES
Notes to Consolidated Financial Statements
The sensitivity of the current fair value of the Company’s interests to an immediate 10 and 20 percent adverse change in the assumptions as of March 31, 2012 is as follows: Yen (millions) 2012
Expected credit loss: Impact on fair value of 10% adverse change (321) Impact on fair value of 20% adverse change (643)
Discount rate: Impact on fair value of 10% adverse change (47) Impact on fair value of 20% adverse change (95)
Prepayment rate: Impact on fair value of 10% adverse change (649) Impact on fair value of 20% adverse change (1,298)
The sensitivities presented in this note are hypothetical and should be used with caution. As the figures indicate, changes in fair value based on a 10 percent variation in assumptions generally cannot be extrapolated because the relationship of the change in assumption to the change in fair value may not be linear. Also, in the above tables, the effect of a variation in a particular assumption of the fair value of the interest is calculated without changing any other assumption; in reality, changes in one factor may result in changes in another, which might magnify or counteract the sensitivities. A portion of these trade receivables was transferred to former QSPEs, which were established by certain of the Company’s subsidiaries, through March 31, 2011. During the years ended March 31, 2011, proceeds from the transfer of trade receivables to the former QSPEs and net losses recognized on those transfers were immaterial and there is no outstanding balance of transferred receivables in these former QSPEs as of March 31, 2011. During the year ended March 31, 2010, the proceed from the transfer of trade receivables to the former QSPEs was ¥362,147 million, and the net loss recognized on that transfer was ¥616 million.

F-42 (Continued)
HITACHI, LTD. AND SUBSIDIARIES
Notes to Consolidated Financial Statements
(7) Goodwill and Other Intangible Assets Intangible assets other than goodwill acquired during the years ended March 31, 2012, 2011 and 2010 amounted to ¥152,076 million, ¥143,156 million and ¥177,585 million, respectively, and related amortization expense during the years ended March 31, 2012, 2011 and 2010 amounted to ¥119,308 million, ¥115,037 million and ¥116,065 million, respectively. The main component of intangible assets subject to amortization was capitalized software. Amortization of capitalized costs for software to be sold, leased or otherwise marketed is charged to cost of sales. The amounts charged during the years ended March 31, 2012, 2011 and 2010 were ¥43,935 million, ¥38,899 million and ¥40,128 million, respectively. Intangible assets other than goodwill as of March 31, 2012 and 2011 are as follows:
Yen (millions) 2012 2011
Gross carrying Accumulated Net carrying Gross carrying Accumulated Net carrying amount amortization amount amount amortization amount Amortized intangible assets:
Software 774,641 637,462 137,179 727,016 612,361 114,655 Software for internal use 520,971 397,742 123,229 512,515 377,550 134,965 Patents 79,108 70,670 8,438 100,080 84,459 15,621 Other 213,866 101,407 112,459 181,362 106,422 74,940
1,588,586 1,207,281 381,305 1,520,973 1,180,792 340,181 Indefinite-lived
intangible assets 13,950 - 13,950 16,337 - 16,337
The following table shows the estimated aggregate amortization expense of intangible assets for the next five years.
Years ending March 31
Yen (millions)
2013 88,301 2014 68,377 2015 46,638 2016 27,312 2017 14,422

F-43 (Continued)
HITACHI, LTD. AND SUBSIDIARIES
Notes to Consolidated Financial Statements
The changes in the carrying amount of goodwill by reportable segment for the years ended March 31, 2012 and 2011 are as follows: Yen (millions) 2012
Information & Tele-
communication Systems
Construction Machinery
High Functional
Materials & Components
Components & Devices
Other ReportableSegments Total
Balance at beginning of year 42,418 34,147 58,520 9,099 27,316 171,500 Acquisition 35,872 - 1,913 - 20,921 58,706 Divestiture - - - (8,559) - (8,559)
Impairment loss - - (1,316) - (540) (1,856) Translation adjustment
and other 1,633 (4,251) (210) (540) (1,716) (5,084) Balance at end of year 79,923 29,896 58,907 - 45,981 214,707 Yen (millions) 2011
Information & Tele-
communication Systems
Construction Machinery
High Functional
Materials & Components
Components & Devices
Other ReportableSegments Total
Balance at beginning of year 37,443 37,967 56,675 10,294 23,207 165,586 Acquisition 9,211 - 1,849 - 9,931 20,991 Impairment loss - - - - (4,833) (4,833) Translation adjustment
and other (4,236) (3,820) (4) (1,195) (989) (10,244)Balance at end of year 42,418 34,147 58,520 9,099 27,316 171,500 The Company considers goodwill that has been fully impaired to be written-off. The company had accumulated impairment loss of ¥540 million related to the goodwill balances in the Other Reportable Segments as of March 31, 2012, and did not have any accumulated impairment losses related to the goodwill balances as of March 31, 2011.
The main components of goodwill acquired during the year ended March 31, 2012 were related to the acquisition of BlueArc Corporation in the Information & Tele-communication Systems segment and the acquisition of Vantec Corporation in the Other Reportable Segments to make them subsidiaries.

HITACHI, LTD. AND SUBSIDIARIES
Notes to Consolidated Financial Statements
F-44 (Continued)
(8) Income Taxes Components of income (loss) before income taxes and income taxes attributable to continuing operations
are as follows:
Yen (millions) 2012
Domestic Foreign Total
Income before income taxes Income taxes:
448,626 109,104 557,730
Current tax expense 77,743 45,670 123,413 Deferred tax expense (benefit) 22,263 (754) 21,509
100,006 44,916 144,922
Yen (millions) 2011
Domestic Foreign Total
Income before income taxes Income taxes:
270,001 162,200 432,201
Current tax expense 75,979 49,144 125,123 Deferred tax expense (benefit) 14,511 (10,559) 3,952
90,490 38,585 129,075
Yen (millions) 2010
Domestic Foreign Total
Income (loss) before income taxes Income taxes:
(16,083)
79,663
63,580
Current tax expense 60,428 27,103 87,531 Deferred tax expense (benefit) 63,493 (3,053) 60,440
123,921 24,050 147,971

HITACHI, LTD. AND SUBSIDIARIES
Notes to Consolidated Financial Statements
F-45 (Continued)
Significant components of income tax expense (benefit) attributable to continuing operations and other comprehensive income (loss), net of reclassification adjustments, for the years ended March 31, 2012, 2011 and 2010 are as follows:
Yen (millions) 2012 2011 2010 Continuing operations: Current tax expense 123,413 125,123 87,531
Deferred tax expense (benefit) (exclusive of the effects of other components listed below) 40,846 (4,653) (19,350)
Adjustments of deferred tax assets and liabilities for enacted changes in tax laws and rates in Japan 7,695 - -
Change in valuation allowance (27,032) 8,605 79,790 144,922 129,075 147,971 Other comprehensive income (loss), net of reclassification adjustments: Pension liability adjustments (10,079) 16,119 25,738 Net unrealized holding gain on available-for-sale securities 1,018 (4,740) 11,692 Cash flow hedges (1,372) 647 720 (10,433) 12,026 38,150 134,489 141,101 186,121
The Company and its domestic subsidiaries are subject to a national corporate tax of 30%, an inhabitant tax of between 17.3% and 20.7% of the national corporate tax and a combined deductible business tax and special local corporation tax between 3.8% and 10.1%, which in the aggregate resulted in a combined statutory income tax rate of approximately 40.6% for the years ended March 31, 2012, 2011 and 2010. The Company and certain subsidiaries have adopted the consolidated taxation systems. Under the consolidated taxation system in Japan, the Company and certain Japanese subsidiaries consolidated, for Japanese tax purpose, all wholly owned domestic subsidiaries. On December 2, 2011, amendments to corporation tax law and the special taxation measures law for Great East Japan Earthquake disaster reconstruction were enacted in Japan, resulting in the lower corporate tax rates. Those changes become effective on April 1, 2012. As a result, the aggregated statutory income tax rate for domestic companies will be approximately 37.9% for the period between April 1, 2012 through March 31, 2015 and approximately 35.5% for the years beginning on or after April 1, 2015. The effect of those changes on the Company’s deferred tax balances amounted to ¥7,695 million of additional expense recognized in the Consolidated Statements of Operations for the year ended March 31, 2012.

HITACHI, LTD. AND SUBSIDIARIES
Notes to Consolidated Financial Statements
F-46 (Continued)
Reconciliations between the combined statutory income tax rate and the effective income tax rate as a percentage of income (loss) before income taxes are as follows:
2012 2011 2010 Combined statutory income tax rate 40.6% 40.6% 40.6% Equity in net loss of affiliated companies 1.1 1.9 37.1 Impairment of investments in affiliated companies 0.0 0.0 9.7
Change in excess amounts over the tax basis of investments in subsidiaries and affiliated companies 2.1 (4.2) (0.9)
Tax expenses (benefits) on sale of investments in subsidiaries and affiliated companies (14.8) (5.6) (0.0)
Expenses not deductible for tax purposes 4.7 3.3 35.6 Enacted changes in tax laws and rates in Japan 1.4 - - Impairment of goodwill 0.1 0.4 4.6 Change in valuation allowance (4.8) 2.0 125.5 Difference in statutory tax rates of foreign subsidiaries (5.2) (8.8) (20.8) Other, net 0.8% 0.3% 1.3% Effective income tax rate 26.0% 29.9% 232.7%

HITACHI, LTD. AND SUBSIDIARIES
Notes to Consolidated Financial Statements
F-47 (Continued)
The tax effects of temporary differences and carryforwards that give rise to significant portions of the deferred tax assets and liabilities as of March 31, 2012 and 2011 are presented below:
Yen (millions) 2012 2011 Total gross deferred tax assets: Retirement and severance benefits 374,981 399,611 Accrued expenses 260,777 301,603 Property, plant and equipment, due to differences in
depreciation 49,299 62,030 Investment in securities 30,607 49,556 Net operating loss carryforwards 251,356 295,487 Other 162,448 218,621 1,129,468 1,326,908 Valuation allowance (881,028) (1,050,979) 248,440 275,929 Total gross deferred tax liabilities: Deferred profit on sale of properties (23,689) (25,547) Tax purpose reserves regulated by Japanese tax laws (7,011) (6,588) Other (100,230) (92,595) (130,930) (124,730) Net deferred tax asset 117,510 151,199
Components of deferred tax assets as of March 31, 2012 and 2011 are reflected in the accompanying
consolidated balance sheets under the following captions: Yen (millions)
2012 2011
Prepaid expenses and other current assets 123,475 130,733 Other assets 104,303 130,862 Other current liabilities (8,671) (8,526)Other liabilities (101,597) (101,870)Net deferred tax asset 117,510 151,199
A valuation allowance was recorded against deferred tax assets for deductible temporary differences, net operating loss carryforwards and tax credit carryforwards, taking into account the tax laws of various jurisdictions in which the Company and its subsidiaries operate. The net changes in the total valuation allowance for the years ended March 31, 2012 and 2011 were a decrease of ¥169,951 million and ¥25,869 million, respectively.
HITACHI, LTD. AND SUBSIDIARIES
Notes to Consolidated Financial Statements
F-48 (Continued)
In assessing the realizability of deferred tax assets, management of the Company considers whether it is more likely than not that some portion or all of the deferred tax assets will not be realized. The ultimate realization of deferred tax assets is dependent upon the generation of future taxable income in specific tax jurisdictions during the periods in which these deductible differences become deductible. Although realization is not assured, management considered the scheduled reversals of deferred tax liabilities and projected future taxable income, including the execution of certain available tax strategies if needed, in making this assessment. Based on these factors, management believes it is more likely than not the Company will realize the benefits of these deductible differences, net of the existing valuation allowance as of March 31, 2012. As of March 31, 2012, the Company and various subsidiaries have operating loss carryforwards of ¥690,317 million which are available to offset future taxable income, if any. Operating loss carryforwards of ¥430,017 million expire by March 31, 2017, ¥183,140 million expire by March 31, 2022, and ¥77,160 million expire in various years thereafter or do not expire.
Deferred tax liabilities have not been recognized for excess amounts over the tax basis of investments in foreign subsidiaries that are considered to be reinvested indefinitely, because such differences will not reverse in the foreseeable future and those undistributed earnings, if remitted, generally would not result in material additional Japanese income taxes because of non-taxable dividends from foreign subsidiaries. Determination of such liabilities is not practicable.

F-49 (Continued)
HITACHI, LTD. AND SUBSIDIARIES
Notes to Consolidated Financial Statements
(9) Short-term and Long-term Debt The components of short-term debt as of March 31, 2012 and 2011 are summarized as follows:
Yen (millions) 2012 2011 Borrowings, mainly from banks 404,846 395,856 Commercial paper 116,534 66,105 Borrowings from affiliates 10,066 10,627 531,446 472,588
The weighted average interest rates on short-term debt outstanding as of March 31, 2012 and 2011 were 0.4% and 0.3%, respectively.
The components of long-term debt as of March 31, 2012 and 2011 are summarized as follows:
Yen (millions) 2012 2011 Unsecured notes and debentures: Due 2013, interest 0.72% debenture 80,000 80,000 Due 2015, interest 1.56% debenture 49,989 49,989 Due 2012–2022, interest 0.38–3.75%, issued by subsidiaries 385,506 363,233 Unsecured convertible debentures: Due 2014, interest 0.1% debenture 62,068 99,360 Due 2019, zero coupon, issued by a subsidiary 4,495 20,105 Loans, principally from banks and insurance companies: Secured by various assets and mortgages on property, plant and equipment, maturing 2012–2016, interest 2.59–7.20% 18,667 19,041 Unsecured, maturing 2012–2028, interest 0.25–7.00% 1,005,951 970,483 Capital lease obligations 26,285 36,318 1,632,961 1,638,529 Less current portion 384,110 338,218 1,248,851 1,300,311

F-50 (Continued)
HITACHI, LTD. AND SUBSIDIARIES
Notes to Consolidated Financial Statements
The aggregate annual maturities of long-term debt after March 31, 2013 are as follows:
Years ending March 31 Yen (millions) 2014 261,264 2015 474,584 2016 149,706 2017 206,968
Thereafter 156,329 1,248,851
As is customary in Japan, both short-term and long-term bank loans are made under general agreements that provide that securities and guarantees for present and future indebtedness will be given upon request of the bank, and that the bank shall have the right, as the obligations become due, or in the event of their default, to offset cash deposits against such obligations. Generally, the mortgage debenture trust agreements and certain secured and unsecured loan agreements provide, among other things, that the lenders or trustees shall have the right to have any distribution of earnings, including the payment of dividends and the issuance of additional capital stock, submitted to them for prior approval and also grant them the right to request additional securities or mortgages on property, plant and equipment. In December 2009, the Company issued ¥100,000 million convertible bonds due 2014. The bondholders are entitled to stock acquisition rights effective from January 4, 2010 to December 10, 2014. The initial conversion price is ¥317 per share. Aside from the standard antidilution provisions, the conversion price shall be reduced for a certain period before the early redemption triggered upon the occurrence of a corporate event or delisting event. The reduction of the conversion price will be based on the premium which is based on the Company’s common stock price and the effective date of the reduction. The reduced price will range from ¥238 to ¥317. When each of the closing prices of the shares of the Company’s common stock at the Tokyo Stock Exchange on 20 continuous trading days are 130% or more of the conversion price of the bonds applicable on those trading days, the Company has the option to redeem all the remaining bonds on a specified redemption date after January 3, 2013 at a rate of ¥100 per ¥100 of each bond. The Company was not required to bifurcate any of the embedded features contained in these bonds for accounting purposes.

F-51 (Continued)
HITACHI, LTD. AND SUBSIDIARIES
Notes to Consolidated Financial Statements
In September 2007, Hitachi Metals Ltd. (the issuer), a subsidiary of the Company, issued ¥20,000 million Euroyen zero coupon convertible bonds due 2019 (“the Bonds”). The bondholders are entitled to stock acquisition rights effective from September 27, 2007 to August 30, 2019 and the initial conversion price is ¥2,042 per share. The closing price of the shares on August 28, 2007, as reported by Tokyo Stock Exchange, was ¥1,344 per share. The stock acquisition rights may be exercised by the holder of the Bonds during any particular calendar quarter only if the closing price of the shares for any 20 trading days in a period of 30 consecutive trading days ending on the last trading day of the immediately preceding calendar quarter is more than 120% of the conversion price. The Bonds also contain other embedded features, none of which were required to be bifurcated, such as the issuer’s call option, the issuer’s cash-settlement option, and the investors’ put option. By giving notice to the bondholders on or after September 13, 2014, the issuer may acquire from all bondholders all of the relevant bonds under the cash-settlement option, and upon reacquiring the Bonds, the issuer is required to pay the bondholders cash equal to 100% of the principal amount and deliver common shares of the issuer with a fair value equivalent to the fair value of the stock acquisition rights. As for the put option, the bondholders are entitled, at their option, to require the issuer to redeem the Bonds at a redemption price of 100% of the principal amount on September 13, 2011 and September 11, 2015.

F-52 (Continued)
HITACHI, LTD. AND SUBSIDIARIES
Notes to Consolidated Financial Statements
(10) Retirement and Severance Benefits (a) Defined benefit plans
The Company and its subsidiaries have a number of contributory funded defined benefit pension plans and unfunded lump-sum payment plans to provide retirement and severance benefits to substantially all employees. The Company and certain subsidiaries adopted cash balance plans, and certain subsidiaries amended certain of their defined benefit plans to cash balance plans during the years ended March 31, 2012, 2011 and 2010. Under the cash balance plans, each employee has a notional account which represents pension benefits. The balance in the notional account is based on principal credits, which are accumulated as employees render services, and interest credits, which are determined based on the market interest rates. Under unfunded lump-sum payment plans, employees are entitled to lump-sum payments based on their earnings and the length of service at retirement or termination of employment for reasons other than dismissal for cause.
Net periodic benefit cost for the funded benefit pension plans and the unfunded lump-sum payment plans for the years ended March 31, 2012, 2011 and 2010 consists of the following components:
Yen (millions) 2012 2011 2010 Service cost 72,219 71,881 71,777 Interest cost 51,812 54,036 55,352 Expected return on plan assets for the period (36,353) (35,741) (33,564) Amortization of prior service benefit (23,759) (23,614) (22,005) Amortization of actuarial loss 93,033 89,549 96,399 Transfer to defined contribution pension plan (250) 1,806 39 Curtailments (gain) loss (53) 1,082 (227) Settlements loss 48 - 603 Employees’ contributions (159) (162) (164) Net periodic benefit cost 156,538 158,837 168,210
The estimated prior service cost and actuarial loss for the defined benefit pension plans that will be amortized from accumulated other comprehensive income (loss) into net periodic benefit cost during the year ending March 31, 2013 are as follows:
Yen (millions)Prior service benefit (22,090)Actuarial loss 94,810

F-53 (Continued)
HITACHI, LTD. AND SUBSIDIARIES
Notes to Consolidated Financial Statements
Reconciliations of beginning and ending balances of the benefit obligation and the fair value of plan assets of the contributory funded defined benefit pension plans and the benefit obligation of unfunded lump-sum payment plans are as follows:
Yen (millions) 2012 2011 Change in benefit obligation: Benefit obligation at beginning of year 2,188,485 2,193,449 Service cost 72,219 71,881 Interest cost 51,812 54,036 Plan amendments 3,799 993 Actuarial loss 98,796 24,422 Benefits paid (146,576) (144,528) Acquisitions and divestitures (39,303) 3,329 Transfer to defined contribution pension plan (16,815) (9,355) Curtailments (410) 644
Settlements (159) - Foreign currency exchange rate changes (1,506) (6,386) Benefit obligation at end of year 2,210,342 2,188,485 Change in plan assets: Fair value of plan assets at beginning of year 1,275,725 1,269,133 Actual return on plan assets 6,534 3,539 Employers’ contributions 149,727 110,439 Employees’ cash contributions 155 162 Benefits paid (104,967) (106,084) Acquisitions and divestitures (27,864) 4,944
Transfer to defined contribution pension plan (1,120) (1,547) Settlements (204) -
Foreign currency exchange rate changes (778) (4,861) Fair value of plan assets at end of year 1,297,208 1,275,725 Funded status (913,134) (912,760)
Amounts recognized in the consolidated balance sheets as of March 31, 2012 and 2011 are as follows:
Yen (millions) 2012 2011 Other assets 7,708 9,785 Accrued expenses (29,865) (30,730) Retirement and severance benefits (890,977) (891,815) (913,134) (912,760)
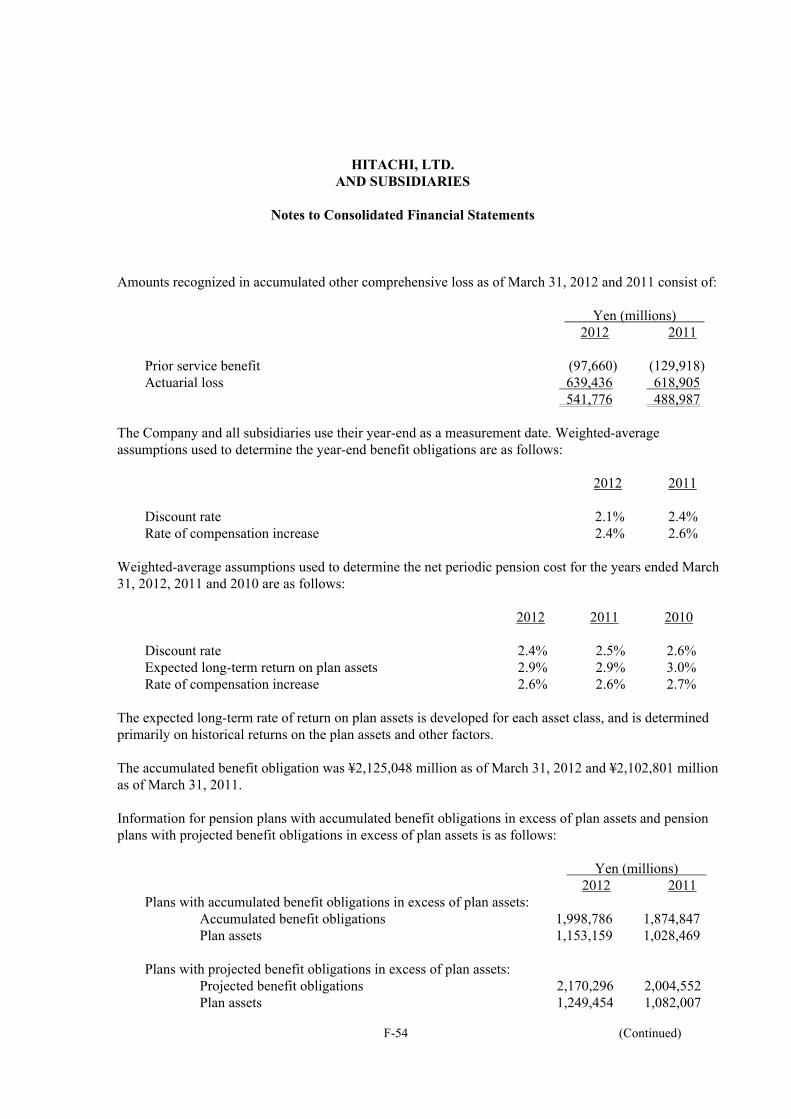
F-54 (Continued)
HITACHI, LTD.
AND SUBSIDIARIES
Notes to Consolidated Financial Statements
Amounts recognized in accumulated other comprehensive loss as of March 31, 2012 and 2011 consist of:
Yen (millions) 2012 2011 Prior service benefit (97,660) (129,918) Actuarial loss 639,436 618,905 541,776 488,987
The Company and all subsidiaries use their year-end as a measurement date. Weighted-average
assumptions used to determine the year-end benefit obligations are as follows: 2012 2011 Discount rate 2.1% 2.4% Rate of compensation increase 2.4% 2.6%
Weighted-average assumptions used to determine the net periodic pension cost for the years ended March 31, 2012, 2011 and 2010 are as follows:
2012 2011 2010 Discount rate 2.4% 2.5% 2.6% Expected long-term return on plan assets 2.9% 2.9% 3.0% Rate of compensation increase 2.6% 2.6% 2.7%
The expected long-term rate of return on plan assets is developed for each asset class, and is determined primarily on historical returns on the plan assets and other factors. The accumulated benefit obligation was ¥2,125,048 million as of March 31, 2012 and ¥2,102,801 million as of March 31, 2011.
Information for pension plans with accumulated benefit obligations in excess of plan assets and pension plans with projected benefit obligations in excess of plan assets is as follows:
Yen (millions) 2012 2011 Plans with accumulated benefit obligations in excess of plan assets: Accumulated benefit obligations 1,998,786 1,874,847 Plan assets 1,153,159 1,028,469
Plans with projected benefit obligations in excess of plan assets: Projected benefit obligations 2,170,296 2,004,552 Plan assets 1,249,454 1,082,007

F-55 (Continued)
HITACHI, LTD.
AND SUBSIDIARIES
Notes to Consolidated Financial Statements
The objective of the Company’s investment policy is to ensure a stable return from the plans’ investments over the long term, which allows the Company’s and certain subsidiaries’ pension funds to meet their future obligations, and the Company and certain subsidiaries attempt to maintain the pension funds in sound condition. In order to achieve the above objective, a target rate of return is established, taking into consideration the composition of participants, level of funded status, the Company’s and certain subsidiaries’ capacity to absorb risks and the current economic environment. Also, a target asset allocation is established to achieve a target rate of return, based on the expected rate of return by each asset class, the standard deviation of the rate of return and the correlation coefficient among the assets. The investments are diversified. Under the current target asset allocation, approximately 25 percent of plan assets are invested in equity securities and approximately 45 percent are invested in domestic and foreign government bonds and corporate bonds. The remaining 30 percent are invested in other assets, such as hedge funds, private equity funds and life insurance company general accounts. The Company and certain subsidiaries reduced the ratio of equity securities during the year ended March 31, 2012 in order to reduce the risks resulting from volatility in the equity markets. Rebalancing will occur if markets fluctuate in excess of certain levels. The Company and certain subsidiaries periodically review actual returns on assets, economic environments and their capacity to absorb risk and realign the target asset allocation if necessary. The Company and certain subsidiaries prioritize the use of observable inputs in markets over the use of unobservable inputs when measuring fair value as follows: Level 1 Quoted prices for identical assets in active markets. Level 2 Quoted prices for similar assets in active markets; quoted prices associated with transactions that are not distressed for identical or similar assets in markets that are not active; or, valuations whose significant inputs are derived from or corroborated by observable market data. Level 3 Valuations using inputs that are not observable.

F-56 (Continued)
HITACHI, LTD. AND SUBSIDIARIES
Notes to Consolidated Financial Statements
The following table presents the plan assets that are measured at fair value as of March 31, 2012 and 2011.
Yen (millions) 2012 Fair Value Measurements
Total Level 1 Level 2 Level 3 Equity securities (a) 86,248 84,229 2,019 - Government and municipal debt securities (b) 161,360 149,770 11,590 - Corporate and other debt securities (c) 69,705 - 38,482 31,223 Hedge funds (d) 53,871 - 11,412 42,459 Securitization products (e) 37,798 - - 37,798 Cash and cash equivalents 25,048 25,048 - - Life insurance company general accounts (f) 119,771 - 119,771 - Commingled funds (g) 702,652 - 666,198 36,454 Other 40,755 32,901 4,851 3,003 1,297,208 291,948 854,323 150,937
Yen (millions) 2011 Fair Value Measurements
Total Level 1 Level 2 Level 3 Equity securities (a) 112,808 108,888 3,920 - Government and municipal debt securities (b) 118,165 113,182 4,983 - Corporate and other debt securities (c) 62,148 - 31,048 31,100 Hedge funds (d) 55,359 - 13,014 42,345 Securitization products (e) 34,087 - - 34,087 Cash and cash equivalents 25,457 25,457 - - Life insurance company general accounts (f) 116,558 - 116,558 - Commingled funds (g) 703,279 - 666,127 37,152 Other 47,864 37,240 6,974 3,650 1,275,725 284,767 842,624 148,334
(a) Approximately 75 percent of equity securities are invested in Japan-listed stocks as of March 31, 2012
and 2011, respectively. Approximately 25 percent of equity securities are invested in stocks listed overseas as of March 31, 2012 and 2011, respectively. Equity securities are primarily valued at quoted market prices.
(b) Approximately 70 percent and 80 percent of government and municipal debt securities are invested in bonds issued in Japan and primarily consist of Japanese government bonds as of March 31, 2012 and 2011. Approximately 30 percent and 20 percent of government and municipal debt securities are invested in bonds issued in overseas markets and primarily consist of foreign government bonds as of March 31, 2012 and 2011. Government and municipal debt securities are primarily valued at prices provided by the securities industry, the industrial associations in each country, or prices which are calculated on the basis of market interest rates.

F-57 (Continued)
HITACHI, LTD. AND SUBSIDIARIES
Notes to Consolidated Financial Statements
(c) Approximately 20 percent and 25 percent of corporate and other debt securities are invested in bonds
issued in Japan as of March 31, 2012 and 2011, respectively. Approximately 80 percent and 75 percent of corporate and other debt securities are invested in bonds issued in overseas markets as of March 31, 2012 and 2011, respectively. Corporate and other debt securities are mainly valued at prices provided by the securities industry, the industrial associations in each country, or prices which are calculated on the basis of market interest rates. If these values are not available, corporate and other debt securities are valued at theoretical prices, taking into consideration the interest rates of government bonds of the related countries, swap interest rates and credit risks.
(d) Hedge funds are invested primarily in relative value strategy funds, event driven funds, equity long/short funds, and macroeconomic and Commodity Trading Advisor (CTA) funds. Hedge funds are valued using the Net Asset Value (NAV) provided by the administrator of the fund. The NAV is based on the value of the underlying assets owned by the fund, minus its liabilities, and then divided by the number of units outstanding.
(e) Securitization products are invested primarily in collateralized loan obligations. These investments are valued at prices provided by financial institutions. The Company corroborates the prices, taking into consideration primarily the market values of the underlying loans, the market values of similar debt securities, and the future expected default rates and recovery rates of the collateralized loans.
(f) Life insurance company general accounts are valued at conversion value at the end of the period. (g) Commingled funds represent pooled institutional investments. Approximately 30 percent and 35
percent of commingled funds are invested in listed stocks as of March 31, 2012 and 2011, respectively, 40 percent in government and municipal debt securities as of March 31, 2012 and 2011, 10 percent in corporate and other debt securities as of March 31, 2012 and 2011, and 20 percent and 15 percent in other assets as of March 31, 2012 and 2011, respectively. Commingled funds are valued at their NAV provided by the administrators of the funds, which are based on the value of the underlying assets owned by the funds, divided by the number of units outstanding.

F-58 (Continued)
HITACHI, LTD. AND SUBSIDIARIES
Notes to Consolidated Financial Statements
The following table presents the reconciliation of the beginning and ending balances of Level 3 assets for the year ended March 31, 2012 and 2011.
Yen (millions) 2012
Beginning balance at March 31,
2011
Actual return on
plan assets still held
at the reporting
date
Realized gain or loss
on plan assets
sold during the period
Purchases, sales, and
settlements,net
Transfers in and/or
out of Level 3
Foreign currencyexchange
Ending
balance at March 31,
2012 Corporate and other debt securities
31,100
(163) 24 675
- (413) 31,223
Hedge funds 42,345 (937) (353) 1,647 - (243) 42,459Securitization products 34,087 (1,742) 39 5,608 - (194) 37,798Commingled funds 37,152 (1,810) (295) 1,717 - (310) 36,454Other 3,650 (29) 364 (950) - (32) 3,003 148,334 (4,681) (221) 8,697 - (1,192) 150,937
Yen (millions) 2011
Beginning balance at March 31,
2010
Actual return on
plan assets still held
at the reporting
date
Realized gain or loss
on plan assets
sold during the period
Purchases, sales, and
settlements,net
Transfers in and/or
out of Level 3
Foreign currencyexchange
Ending
balance at March 31,
2011 Corporate and other debt securities
19,493
197 12 11,434
133 (169) 31,100
Hedge funds 49,386 2,082 (370) (8,723) - (30) 42,345Securitization products 29,262 7,283 1,090 (3,452) (71) (25) 34,087Commingled funds 37,482 (3,485) (375) 3,660 32 (162) 37,152Other 4,922 (463) 537 (1,339) - (7) 3,650 140,545 5,614 894 1,580 94 (393) 148,334

F-59 (Continued)
HITACHI, LTD. AND SUBSIDIARIES
Notes to Consolidated Financial Statements
The Company and its subsidiaries expect to contribute ¥82,441 million to their defined benefit plans for the year ending March 31, 2013. The following benefit payments, which reflect expected future service, as appropriate, are expected to be paid.
Years ending March 31 Yen (millions) 2013 137,558 2014 113,933 2015 119,100 2016 120,884 2017 121,193 2018-2022 613,703
(b) Defined contribution plans
The Company and certain subsidiaries have a number of defined contribution plans. The amounts of cost recognized for the Company’s and certain subsidiaries’ contributions to the plans for the years ended March 31, 2012, 2011 and 2010 were ¥20,188 million, ¥18,593 million and ¥18,758 million, respectively.

F-60 (Continued)
HITACHI, LTD. AND SUBSIDIARIES
Notes to Consolidated Financial Statements
(11) Common Stock
The Company has authorized issuance of 10 billion shares of common stock. The number of issued shares and the amount of common stock for the years ended March 31, 2012, 2011 and 2010 are as follows: Yen(millions) Issued shares Amount Balance as of March 31, 2009 3,368,126,056 282,033 Issuance of common stock 1,150,000,000 126,776 Conversion of convertible bonds 6,309 1 Balance as of March 31, 2010 4,518,132,365 408,810 Conversion of convertible bonds 2,012,599 319 Balance as of March 31, 2011 4,520,144,964 409,129 Conversion of convertible bonds 117,640,353 18,646 Balance as of March 31, 2012 4,637,785,317 427,775
The issuance of common stock for the year ended March 31, 2010 and the conversion of convertible bonds into common stock for the years ended March 31, 2012, 2011 and 2010 were accounted for in accordance with the provisions of the Japanese Company Law by crediting one-half of the issue price or the conversion price to each of the common stock accounts and the capital surplus accounts.

F-61 (Continued)
HITACHI, LTD. AND SUBSIDIARIES
Notes to Consolidated Financial Statements
(12) Capital Surplus
The changes in capital surplus include the effect of changes in the Company’s ownership interest in its consolidated subsidiaries. The net income (loss) attributable to Hitachi, Ltd. and transfers from (to) noncontrolling interests for the years ended March 31, 2012, 2011 and 2010 are as follows: Yen(millions) 2012 2011 2010 Net income (loss) attributable to Hitachi, Ltd. 347,179 238,869 (106,961) Transfers from (to) the noncontrolling interests Decrease in capital surplus for purchase of listed
subsidiaries’ ownership interests to convert them into wholly owned subsidiaries (18,822) (6,713) (58,175)
Other (2,705) (1,516) (6,823) Net transfers from (to) noncontrolling interests (21,527) (8,229) (64,998) Change from net income (loss) attributable to Hitachi, Ltd. and transfers from (to) noncontrolling interests 325,652 230,640 (171,959) For the year ended March 31, 2012, the purchase of listed subsidiaries’ ownership interests is related to the purchase of the noncontrolling interests of Shin-Kobe Electric Machinery Co., Ltd. by Hitachi Chemical Co., Ltd. and Hitachi Business Solution Co., Ltd. by Hitachi Solutions, Ltd. for the purpose of converting them into wholly owned subsidiaries. For the years ended March 31, 2011 and 2010, the purchase of listed subsidiaries’ ownership interests is related to the purchase of the noncontrolling interests of Hitachi Information Systems, Ltd., Hitachi Software Engineering Co., Ltd., Hitachi Systems & Services, Ltd., Hitachi Plant Technologies, Ltd. and Hitachi Maxell, Ltd. for the purpose of converting them into wholly owned subsidiaries. As a result, Hitachi Information Systems, Ltd., Hitachi Software Engineering Co., Ltd. and Hitachi Systems & Services, Ltd. had been converted into wholly owned subsidiaries during the year ended March 31, 2010, and Hitachi Plant Technologies, Ltd. and Hitachi Maxell, Ltd. had been converted into wholly owned subsidiaries during the year ended March 31, 2011. On October 1, 2011 when Hitachi Information Systems, Ltd. was merged into Hitachi Electronics Services Co., Ltd., Hitachi Systems, Ltd. was established. On October 1, 2010 when Hitachi Systems & Services, Ltd., was merged into Hitachi Software Engineering Co., Ltd., Hitachi Solutions, Ltd. was established. The total decreases in noncontrolling interests during the years ended March 31, 2012, 2011 and 2010 resulting from these equity transactions were ¥21,232 million, ¥8,667 million and ¥193,880 million, respectively.

F-62 (Continued)
HITACHI, LTD. AND SUBSIDIARIES
Notes to Consolidated Financial Statements
(13) Legal Reserve and Retained Earnings, and Dividends The Japanese Company Law (JCL) provides that earnings in an amount equal to 10 percent of appropriations of retained earnings to be paid as dividends should be appropriated as a capital surplus or a legal reserve until the total of capital surplus and legal reserve equals 25 percent of stated common stock. In addition to transfer from capital surplus to stated common stock, either capital surplus or legal reserve may be available for dividends by resolution of the shareholders’ meeting. Dividends during the years ended March 31, 2012 and 2011 represent dividends declared during those years. For the year ended March 31, 2010, the Company did not pay any dividends. On May 10, 2012, the Board of Directors approved a cash dividend for the second half of the year ended March 31, 2012 of ¥5.0 per share, aggregating ¥23,175 million. No provision has been made in the accompanying consolidated financial statements for this cash dividend.
Cash dividends per share for the years ended March 31, 2012 and 2011 were ¥8.0 based on dividends declared with respect to earnings for the periods.
(14) Treasury Stock
The JCL allows a company to acquire treasury stock upon shareholders’ approval to the extent that sufficient distributable funds are available. If the Board of Directors’ authority is stated in the articles of incorporation, a company is allowed to acquire treasury stock not upon shareholders’ approval but Board of Directors’ approval. Acquisition of treasury stock is allowed under the Company’s articles of incorporation. Pursuant to the provisions of the JCL, shareholders may request the company to acquire their shares representing less than a minimum trading lot as shares less than a minimum trading lot cannot be publicly traded and such a shareholder holding less than a minimum trading lot cannot exercise a voting right and other shareholder’s rights except as provided in the JCL or the articles of incorporation. The JCL also states that a shareholder holding shares less than a minimum trading lot may request the company to sell its treasury stock, if any, to the shareholder up to a minimum trading lot if entitled under the articles of incorporation. Sale of treasury stock is allowed under the Company’s articles of incorporation.

F-63 (Continued)
HITACHI, LTD. AND SUBSIDIARIES
Notes to Consolidated Financial Statements
The changes in treasury stock for the years ended March 31, 2012, 2011 and 2010 are summarized as follows: Yen (millions) Shares Amount Balance as of March 31, 2009 43,973,964 26,237
Acquisition for treasury 376,025 115 Sales of treasury stock (335,738) (201)
Balance as of March 31, 2010 44,014,251 26,151
Acquisition for treasury 456,705 183 Sales of treasury stock (41,926,879) (24,963)
Balance as of March 31, 2011 2,544,077 1,371
Acquisition for treasury 281,695 126 Sales of treasury stock (82,533) (47)
Balance as of March 31, 2012 2,743,239 1,450 Sales of treasury stock for the year ended March 31, 2011 includes exchange of treasury stock to noncontrolling interest holders in order to convert Hitachi Plant Technologies, Ltd. and Hitachi Maxell, Ltd. to wholly owned subsidiaries.

F-64 (Continued)
HITACHI, LTD. AND SUBSIDIARIES
Notes to Consolidated Financial Statements
(15) Accumulated Other Comprehensive Loss Accumulated other comprehensive loss, net of related tax effects, displayed in the consolidated statements
of equity is classified as follows: Yen (millions)
2012 2011 2010 Foreign currency translation adjustments: Balance at beginning of year (252,206) (182,783) (179,737) Other comprehensive income (loss), net of reclassification adjustments 31,603 (69,194) 4,289 Net transfer from (to) noncontrolling interests (12) (229) (7,335) Balance at end of year (220,615) (252,206) (182,783) Pension liability adjustments: Balance at beginning of year (256,566) (272,410) (405,082) Other comprehensive income (loss), net of reclassification adjustments (37,895) 15,852 141,761 Net transfer from (to) noncontrolling interests 209 (8) (9,089) Balance at end of year (294,252) (256,566) (272,410) Net unrealized holding gain on available-for-sale securities: Balance at beginning of year 16,905 25,564 12 Effect of consolidation of securitization entities upon
initial adoption of the amended provisions of ASC 810 - (2,977) - Other comprehensive income (loss), net of reclassification adjustments 3,574 (5,728) 23,209 Net transfer from (to) noncontrolling interests 12 46 2,343 Balance at end of year 20,491 16,905 25,564 Cash flow hedges: Balance at beginning of year (1,195) (2,428) (1,544) Other comprehensive income (loss), net of reclassification adjustments (1,326) 1,233 (833) Net transfer from (to) noncontrolling interests 1 - (51) Balance at end of year (2,520) (1,195) (2,428) Total accumulated other comprehensive loss: Balance at beginning of year (493,062) (432,057) (586,351) Effect of consolidation of securitization entities upon
initial adoption of the amended provisions of ASC 810 - (2,977) - Other comprehensive income (loss), net of reclassification adjustments (4,044) (57,837) 168,426 Net transfer from (to) noncontrolling interests 210 (191) (14,132) Balance at end of year (496,896) (493,062) (432,057)

F-65 (Continued)
HITACHI, LTD. AND SUBSIDIARIES
Notes to Consolidated Financial Statements
The following is a summary of reclassification adjustments by each classification of other comprehensive
income (loss) arising during the years ended March 31, 2012, 2011 and 2010 and the amounts of income tax expense or benefit allocated to each component of other comprehensive income (loss), including reclassification adjustments. The amounts include amounts attributable to noncontrolling interests.
Yen (millions) 2012
Before-tax
amount Tax benefit (expense)
Net-of-taxamount
Other comprehensive loss arising during the year: Foreign currency translation adjustments (20,065) - (20,065) Pension liability adjustments (129,071) 38,520 (90,551) Net unrealized holding gain on available-for-sale securities (996) 963 (33) Cash flow hedges (3,039) 734 (2,305) (153,171) 40,217 (112,954) Reclassification adjustments for realized net loss included in net income:
Foreign currency translation adjustments 43,527 - 43,527 Pension liability adjustments 76,099 (29,697) 46,402 Net unrealized holding gain on available-for-sale securities 4,980 (1,985) 2,995 Cash flow hedges (999) 802 (197) 123,607 (30,880) 92,727 Other comprehensive loss, net of reclassification adjustments: Foreign currency translation adjustments 23,462 - 23,462 Pension liability adjustments (52,972) 8,823 (44,149) Net unrealized holding gain on available-for-sale securities 3,984 (1,022) 2,962 Cash flow hedges (4,038) 1,536 (2,502) (29,564) 9,337 (20,227)

F-66 (Continued)
HITACHI, LTD. AND SUBSIDIARIES
Notes to Consolidated Financial Statements
Yen (millions) 2011
Before-tax
amount Tax benefit (expense)
Net-of-taxamount
Other comprehensive loss arising during the year: Foreign currency translation adjustments (90,643) - (90,643) Pension liability adjustments (55,048) 26,580 (28,468) Net unrealized holding gain on available-for-sale securities (10,045) 4,833 (5,212) Cash flow hedges 74 (177) (103) (155,662) 31,236 (124,426) Reclassification adjustments for realized net loss included in net income:
Foreign currency translation adjustments 3,264 - 3,264 Pension liability adjustments 78,505 (33,961) 44,544 Net unrealized holding gain on available-for-sale securities (244) 104 (140) Cash flow hedges 2,550 (459) 2,091 84,075 (34,316) 49,759 Other comprehensive loss, net of reclassification adjustments: Foreign currency translation adjustments (87,379) - (87,379) Pension liability adjustments 23,457 (7,381) 16,076 Net unrealized holding gain on available-for-sale securities (10,289) 4,937 (5,352) Cash flow hedges 2,624 (636) 1,988 (71,587) (3,080) (74,667)

F-67 (Continued)
HITACHI, LTD. AND SUBSIDIARIES
Notes to Consolidated Financial Statements
Yen (millions) 2010
Before-tax
amount Tax benefit (expense)
Net-of-taxamount
Other comprehensive income arising during the year: Foreign currency translation adjustments 8,487 - 8,487 Pension liability adjustments 116,184 3,979 120,163 Net unrealized holding gain on available-for-sale securities 40,295 (11,758) 28,537 Cash flow hedges (308) (1,173) (1,481) 164,658 (8,952) 155,706 Reclassification adjustments for realized net loss included in net loss:
Foreign currency translation adjustments (1,580) - (1,580) Pension liability adjustments 73,776 (29,916) 43,860 Net unrealized holding gain on available-for-sale securities 236 (97) 139 Cash flow hedges 258 552 810 72,690 (29,461) 43,229 Other comprehensive income, net of reclassification adjustments: Foreign currency translation adjustments 6,907 - 6,907 Pension liability adjustments 189,960 (25,937) 164,023 Net unrealized holding gain on available-for-sale securities 40,531 (11,855) 28,676 Cash flow hedges (50) (621) (671) 237,348 (38,413) 198,935
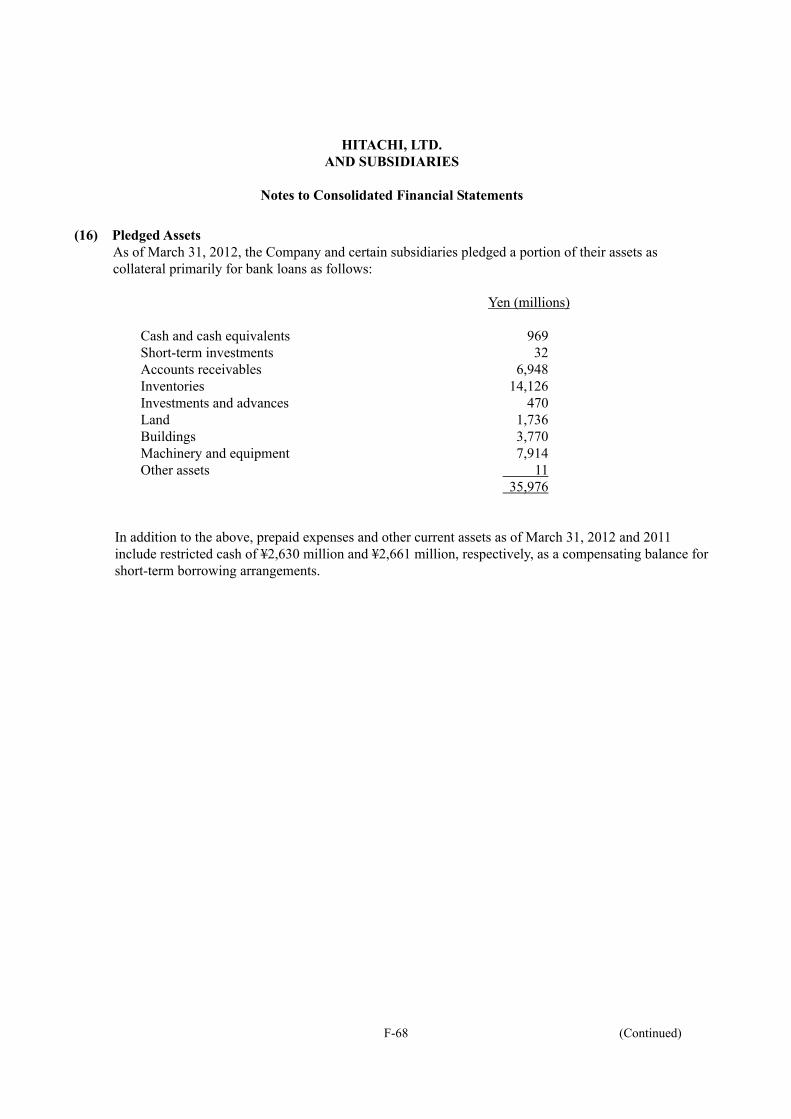
HITACHI, LTD. AND SUBSIDIARIES
Notes to Consolidated Financial Statements
F-68 (Continued)
(16) Pledged Assets As of March 31, 2012, the Company and certain subsidiaries pledged a portion of their assets as collateral primarily for bank loans as follows:
Yen (millions) Cash and cash equivalents 969 Short-term investments 32 Accounts receivables 6,948 Inventories 14,126 Investments and advances 470 Land 1,736 Buildings 3,770 Machinery and equipment 7,914 Other assets 11 35,976
In addition to the above, prepaid expenses and other current assets as of March 31, 2012 and 2011 include restricted cash of ¥2,630 million and ¥2,661 million, respectively, as a compensating balance for short-term borrowing arrangements.

HITACHI, LTD. AND SUBSIDIARIES
Notes to Consolidated Financial Statements
F-69 (Continued)
(17) Commitments and Contingencies The Company and its operating subsidiaries are contingently liable for loan guarantees to its affiliates and others in the amount of approximately ¥46,547 million as of March 31, 2012. Hitachi Capital Corporation (HCC) and certain other financial subsidiaries provide guarantees to financial institutions for extending loans to customers of the subsidiaries. As of March 31, 2012, the undiscounted maximum potential future payments under such guarantees amounted to ¥340,793 million. For providing these guarantees, the subsidiaries obtain collateral appropriate for the amount of the guarantees, and therefore, the Company considers the risk to be low. The Company accrued ¥12,398 million as an obligation to stand ready to perform over the term of the guarantees in the event the customer cannot make scheduled payments. The Company and HCC provide loan commitments to affiliates and others. The outstanding balance of loan commitments as of March 31, 2012 is as follows:
Yen (millions) Total commitment available 10,969 Less amount utilized 724 Balance available 10,245
The amount of total commitment available in the table above includes lines of credits which require an additional credit approval prior to funding, and it may not be fully utilized. The Company and certain subsidiaries have line of credit arrangements with banks in order to secure a financing source for business operations. The unused lines of credit as of March 31, 2012 amounted to ¥506,162 million, primarily related to unused lines of credit belonging to the Company. The Company maintains commitment line agreements with a number of banks and pays commitment fees as consideration. These commitment agreements generally provide a one-year term, and are subject to renewal at the end of the term. The unused availability under these agreements as of March 31, 2012 amounted to ¥200,000 million. The Company also maintains another commitment line agreement, whose three years and two months term ends in May 2013, with financing companies. The unused availability under this agreement as of March 31, 2012 amounted to ¥200,000 million. As of March 31, 2012, outstanding commitments for the purchase of property, plant and equipment were approximately ¥32,466 million.

HITACHI, LTD. AND SUBSIDIARIES
Notes to Consolidated Financial Statements
F-70 (Continued)
It is a common practice in Japan for companies, in the ordinary course of business, to receive promissory notes in the settlement of trade accounts receivable and to subsequently discount such notes to banks or to transfer them by endorsement to suppliers in the settlement of accounts payable. As of March 31, 2012 and 2011, the Company and subsidiaries were contingently liable for trade notes discounted and endorsed in the following amounts:
Yen (millions) 2012 2011 Notes discounted 3,937 3,593 Notes endorsed 2,800 1,851 6,737 5,444
A certain subsidiary is contingently liable for the transfer of export receivables with recourse. As of March 31, 2012, the amount of transfer of export receivables with recourse was ¥5,566 million.
The Company and its subsidiaries provide warranties for certain of their products. The accrued product warranty costs are based primarily on historical experience of actual warranty claims. The changes in accrued product warranty costs for the years ended March 31, 2012, 2011 and 2010 are summarized as follows:
Yen (millions) 2012 2011 2010 Balance at beginning of year 55,329 56,957 60,449Expense recognized upon issuance of warranties 16,281 20,755 20,806Usage (18,792) (19,219) (21,696)Acquisitions and divestitures (10,007) 410 0Other, including effect of foreign currency translation (1,455) (3,574) (2,602)Balance at end of year 41,356 55,329 56,957
On June 15, 2006, Hamaoka Nuclear Power Station No. 5 of Chubu Electric Power Co., Inc. shut down due to turbine damage. As a precautionary measure, on July 5, 2006, Shika Nuclear Power Station No. 2 of Hokuriku Electric Power Company, which uses the same type of turbines, was shut down for an examination of the turbines and the examination revealed damage to the turbine vanes. The Company accrued a provision for the repair costs. In September 2008, Chubu Electric Power Co., Inc. filed a lawsuit against the Company. Chubu Electric Power Co., Inc. sought compensation for consequential losses of ¥41,800 million mostly composed of the additional costs to switch to thermal power arising from the shutdown at Hamaoka Nuclear Power Station No.5. The lawsuit was settled in October 2011, and the Company paid a settlement in November 2011. The Company recognized a loss relating to such settlement for the year ended March 31, 2012. However, such loss has no material effect on the Company’s results of operations.

HITACHI, LTD. AND SUBSIDIARIES
Notes to Consolidated Financial Statements
F-71 (Continued)
In May 2009, Hokuriku Electric Power Company filed a lawsuit against the Company. Hokuriku Electric Power Company seeks compensation for consequential losses of ¥33,701 million mostly composed of the additional costs to switch to thermal power arising from the shutdown at Shika Nuclear Power Station No.2. The lawsuit was settled in February 2012, and the Company paid a settlement in March 2012. The Company recognized a loss relating to such settlement for the year ended March 31, 2012. However, such loss has no material effect on the Company’s results of operations. In January 2007, the European Commission ordered the Company and one of its affiliated companies to pay a fine for infringement of EC antitrust rules regarding alleged antitrust violations for the gas insulated switchgear equipment used at substations. In April 2007, the Company lodged an appeal with the Court of First Instance of the European Communities (currently the General Court of the European Union) requesting the court to annul the decision of the European Commission. In July 2011, the Court rejected the appeal. The Company and the affiliated company paid that fine in September 2011. In December 2006, the Company and a subsidiary in Europe received requests for information from the European Commission, and a former subsidiary in Japan received a grand jury subpoena in connection with the investigation conducted by the Antitrust Division of the U.S. Department of Justice, all in respect of alleged antitrust violations relating to liquid crystal displays. The former Japanese subsidiary paid the fine in relation to the investigation by the Antitrust Division of the U.S. Department of Justice in June 2009. In June 2007, the Company received requests for information from the European Commission in respect of alleged antitrust violations relating to dynamic random access memories. In May 2010, the European Commission ordered the Company to pay a fine for infringement of EC antitrust rules. The Company paid that fine in August 2010. In November 2007, a subsidiary of the Company in the U.S. received a grand jury subpoena in connection with the investigation conducted by the Antitrust Division of the U.S. Department of Justice in respect of alleged antitrust violations relating to cathode ray tubes. In addition, in November 2007, two subsidiaries in Asia and in Europe received requests for information from the European Commission. Furthermore, in November 2007, a subsidiary in Canada received requests for information from the Canadian Competition Bureau. In June 2009, a subsidiary of the Company in Japan received a grand jury subpoena in connection with the investigation conducted by the Antitrust Division of the U.S. Department of Justice and received requests for information from the European Commission, and a subsidiary of the Company in Korea was investigated in Singapore by the Competition Commission of Singapore, all in respect of alleged antitrust violations relating to optical disk drives. In September 2011, the Korean subsidiary received a notice of discontinuation of the investigation from the Competition Commission of Singapore. In October 2011, the Japanese subsidiary agreed to pay a fine in relation to the investigation from the Antitrust Division of the U.S. Department of Justice and in November 2011, it paid that fine.

HITACHI, LTD. AND SUBSIDIARIES
Notes to Consolidated Financial Statements
F-72 (Continued)
In July 2011, a subsidiary and an affiliated company of the Company in Japan received a statement of objections from the European Commission in respect of alleged antitrust violations relating to high-voltage power cables. These companies accrued the reasonably estimated amount for the loss. In July 2011, a subsidiary of the Company in Japan was investigated by the Fair Trade Commission of Japan, a subsidiary in the U.S. was investigated by and received a grand jury subpoena from the Antitrust Division of the U.S. Department of Justice, the Company and a subsidiary in Europe received requests for information from the European Commission, and a subsidiary in Canada received requests for information from the Canadian Competition Bureau, all in respect of alleged antitrust violations relating to automotive equipment. The Company and these companies (including a former subsidiary) have cooperated with the competent authorities in connection with the above matters. Depending upon the outcome of these matters, fines or surcharge payments, the amount of which is uncertain, may be imposed on them. In addition, subsequent to these actions by the competent authorities, civil disputes, including class action lawsuits, involving the Company and some of these companies (including a former subsidiary) have arisen in a number of countries, including in the U.S. and Canada. A reasonably estimated amount was accrued for the potential losses in relation to certain of these civil disputes. Depending upon the outcome of the above legal proceedings, there may be an adverse effect on the consolidated financial position or results of operations. Currently the Company is unable to estimate the adverse effect, if any, of many of these proceedings. Accordingly, except as otherwise stated, no accrual for potential loss has been made. The actual amount of fines, surcharge payments or any other payments resulting from these legal proceedings may be different from the accrued amounts. In addition to the above, the Company and certain subsidiaries are subject to several legal proceedings and claims which have arisen in the ordinary course of business and have not been finally adjudicated. These actions when ultimately concluded and determined will not, in the opinion of management, have a material adverse effect on the consolidated financial position or results of operations of the Company and subsidiaries.

HITACHI, LTD. AND SUBSIDIARIES
Notes to Consolidated Financial Statements
F-73 (Continued)
(18) Impairment Losses for Long-Lived Assets For the year ended March 31, 2012, the majority of the impairment losses were recorded on property, plant and equipment located in Japan. The High Functional Materials & Components segment recognized a loss of ¥19,483 million, primarily due to restructuring of its semiconductor package material businesses as a result of a recent decrease in demand of the market and integrating manufacturing facilities for electronics and IT devices business. The Information & Telecommunication Systems segment recognized a loss of ¥4,596 million primarily due to restructuring of its micro devices business as a result of lower-than-expected future income. The fair value estimates used to determine these losses were based primarily on discounted future cash flows.
For the year ended March 31, 2011, the majority of the impairment losses were recorded on property, plant and equipment located in Japan. The Components & Devices segment recognized a loss of ¥16,561 million, primarily due to its business manufacturing batteries for electronic products for which the Company has recognized losses for consecutive periods and projected lower-than-expected future income because of a reduction of production, and its liquid crystal display components business which was projected to have lower production as a result of a recent decrease in demand of the market. The High Functional Materials & Components segment recognized a loss of ¥10,956 million primarily due to its automotive related materials businesses whose profitabilities deteriorated because of the Great East Japan Earthquake on March 11, 2011. The fair value estimates used to determine these losses were based primarily on discounted future cash flows. For the year ended March 31, 2010, the majority of the impairment losses were recorded on property, plant and equipment located in Japan. The Components & Devices segment recognized a loss of ¥18,611 million, primarily due to 1) its battery business for which the Company has recognized losses for consecutive periods and lower-than-expected future income because of a reduction of production, 2) its liquid crystal display panel business which was projected to have lower production as a result of a recent decrease in demand of the market, and 3) a part of its record media products business whose profitability has deteriorated because of severe market conditions accompanied by falling prices. The fair value estimates used to determine these losses were based primarily on discounted future cash flows.

HITACHI, LTD. AND SUBSIDIARIES
Notes to Consolidated Financial Statements
F-74 (Continued)
(19) Restructuring Charges
Certain losses incurred in the reorganization of the Company’s operations are considered restructuring charges. Components and related amounts of the restructuring charges, before the related tax effects, for the years ended March 31, 2012, 2011 and 2010 are as follows:
The Company and certain subsidiaries provided special termination benefits to those employees voluntarily leaving the companies, and certain subsidiaries provided one-time termination benefits due to the subsidiaries’ liquidations. The accrued special termination benefits were recognized at the time voluntary termination was offered and benefits were accepted by the employees. The accrued one-time termination benefits were recognized at the time the subsidiaries communicated the plan to their employees. An analysis of the accrued special and one-time termination benefits for the years ended March 31, 2012, 2011 and 2010 is as follows:
The following represents the significant restructuring activities for the year ended March 31, 2012 by reportable segment: 1. The Components & Devices segment restructured in order to rationalize the workforce of its liquid
crystal display business. The accrued special termination benefits expensed during the year ended March 31, 2012 amounted to ¥7,094 million. The liabilities for special termination benefits amounting to ¥92 million as of March 31, 2012 will be paid by March 31, 2013. Total restructuring charges during the year ended March 31, 2012 consisted only of special termination benefits.
2. The High Functional Materials & Components segment restructured in order to reorganize its wires,
cables and other relevant products business, which has encountered severe deterioration in the business environment. The accrued special termination benefits expensed during the year ended March 31, 2012 amounted to ¥6,665 million. The liabilities for special termination benefits amounting to ¥372 million as of March 31, 2012 will be paid by March 31, 2013. Total restructuring charges during the year ended March 31, 2012 amounted to ¥6,706 million.
Yen (millions) 2012 2011 2010 Special and one-time termination benefits 22,999 5,653 24,191 Loss on fixed assets 98 104 963 23,097 5,757 25,154
Yen (millions) 2012 2011 2010 Balance at beginning of the year 3,358 8,170 7,543 New charges 22,999 5,653 24,191 Cash payments (12,690) (10,374) (23,548)Divestitures (6,233) - - Foreign currency exchange rate changes 53 (91) (16)Balance at end of the year 7,487 3,358 8,170

HITACHI, LTD. AND SUBSIDIARIES
Notes to Consolidated Financial Statements
F-75 (Continued)
3. The Electronic Systems & Equipment segment restructured in order to reorganize its LCDs
manufacturing equipment and electronic parts manufacturing system businesses to reduce costs and improve profitability. The accrued special termination benefits expensed during the year ended March 31, 2012 amounted to ¥4,892 million. The liabilities for special termination benefits amounting to ¥3,958 million as of March 31, 2012 will be paid by March 31, 2013. Total restructuring charges during the year ended March 31, 2012 amounted to ¥4,912 million.
4. The Digital Media & Consumer Products segment restructured in order to reorganize its TV business,
which has encountered severe deterioration in the business environment. The accrued special termination benefits expensed during the year ended March 31, 2012 amounted to ¥3,085 million. The liabilities for special termination benefits amounting to ¥2,005 million as of March 31, 2012 will be paid by March 31, 2013. Total restructuring charges during the year ended March 31, 2012 consisted only of special termination benefits.
The restructuring charges for the year ended March 31, 2011 mainly consist of special termination benefits for the early-terminated employees of subsidiaries for the purpose of reducing costs and improving profitability in the Components & Devices segment.
The following represents the significant restructuring activities for the year ended March 31, 2010 by reportable segment: 1. The Automotive Systems segment restructured in order to reorganize the automotive products
business, which encountered severe deterioration in the market. The accrued special termination benefits expensed and paid during the year ended March 31, 2010 amounted to ¥7,731 million. Total restructuring charges during the year ended March 31, 2010 consisted only of special termination benefits.
2. The High Functional Materials & Components segment restructured in order to reorganize its
high-grade metal products and materials business to reduce costs and improve profitability. The accrued special termination benefits expensed during the year ended March 31, 2010 amounted to ¥4,010 million. The liabilities for special termination benefits amounting to ¥787 million as of March 31, 2010 were paid by March 31, 2011. Total restructuring charges during the year ended March 31, 2010 amounted to ¥4,426 million.
3. The Components & Devices segment restructured in order to reorganize the liquid crystal display
business, which included several subsidiaries’ liquidations. The accrued special and one-time termination benefits expensed during the year ended March 31, 2010 amounted to ¥4,144 million. The liabilities for special and one-time termination benefits amounting to ¥3,054 million as of March 31, 2010 were paid by March 31, 2011. Total restructuring charges during the year ended March 31, 2010 amounted to ¥4,182 million.
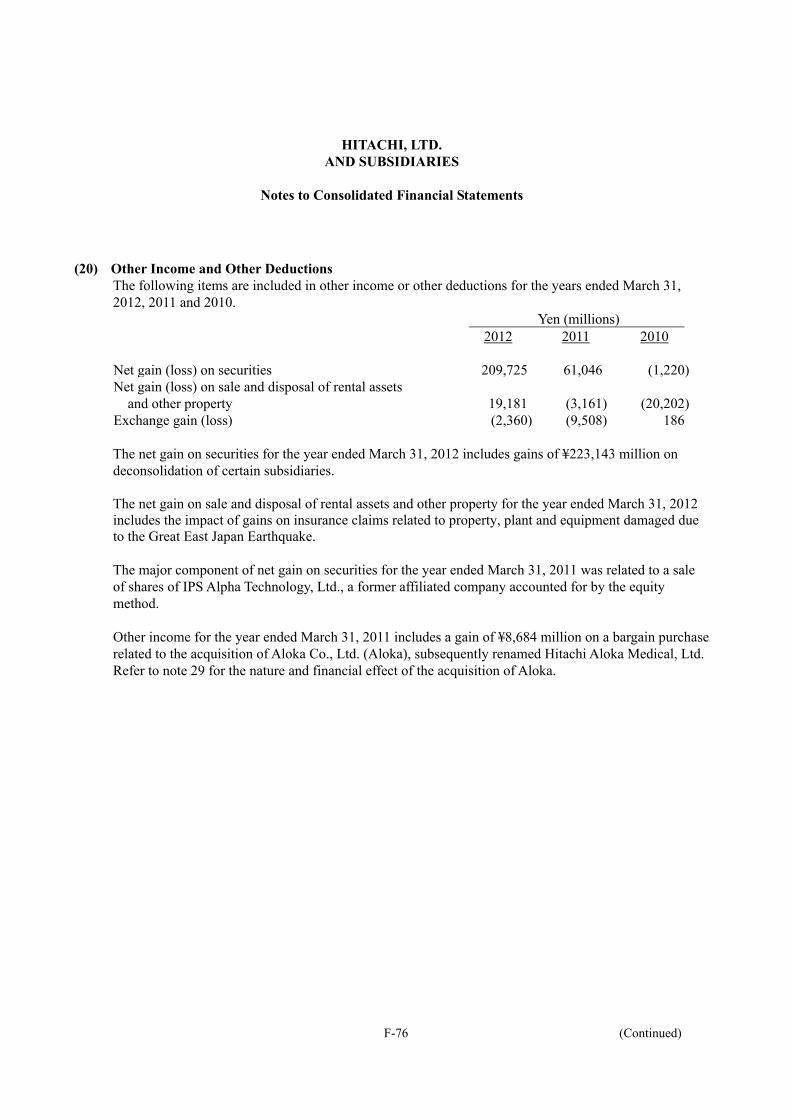
HITACHI, LTD. AND SUBSIDIARIES
Notes to Consolidated Financial Statements
F-76 (Continued)
(20) Other Income and Other Deductions The following items are included in other income or other deductions for the years ended March 31, 2012, 2011 and 2010. Yen (millions) 2012 2011 2010 Net gain (loss) on securities 209,725 61,046 (1,220)Net gain (loss) on sale and disposal of rental assets
and other property 19,181 (3,161) (20,202)Exchange gain (loss) (2,360) (9,508) 186 The net gain on securities for the year ended March 31, 2012 includes gains of ¥223,143 million on deconsolidation of certain subsidiaries. The net gain on sale and disposal of rental assets and other property for the year ended March 31, 2012 includes the impact of gains on insurance claims related to property, plant and equipment damaged due to the Great East Japan Earthquake. The major component of net gain on securities for the year ended March 31, 2011 was related to a sale of shares of IPS Alpha Technology, Ltd., a former affiliated company accounted for by the equity method. Other income for the year ended March 31, 2011 includes a gain of ¥8,684 million on a bargain purchase related to the acquisition of Aloka Co., Ltd. (Aloka), subsequently renamed Hitachi Aloka Medical, Ltd. Refer to note 29 for the nature and financial effect of the acquisition of Aloka.
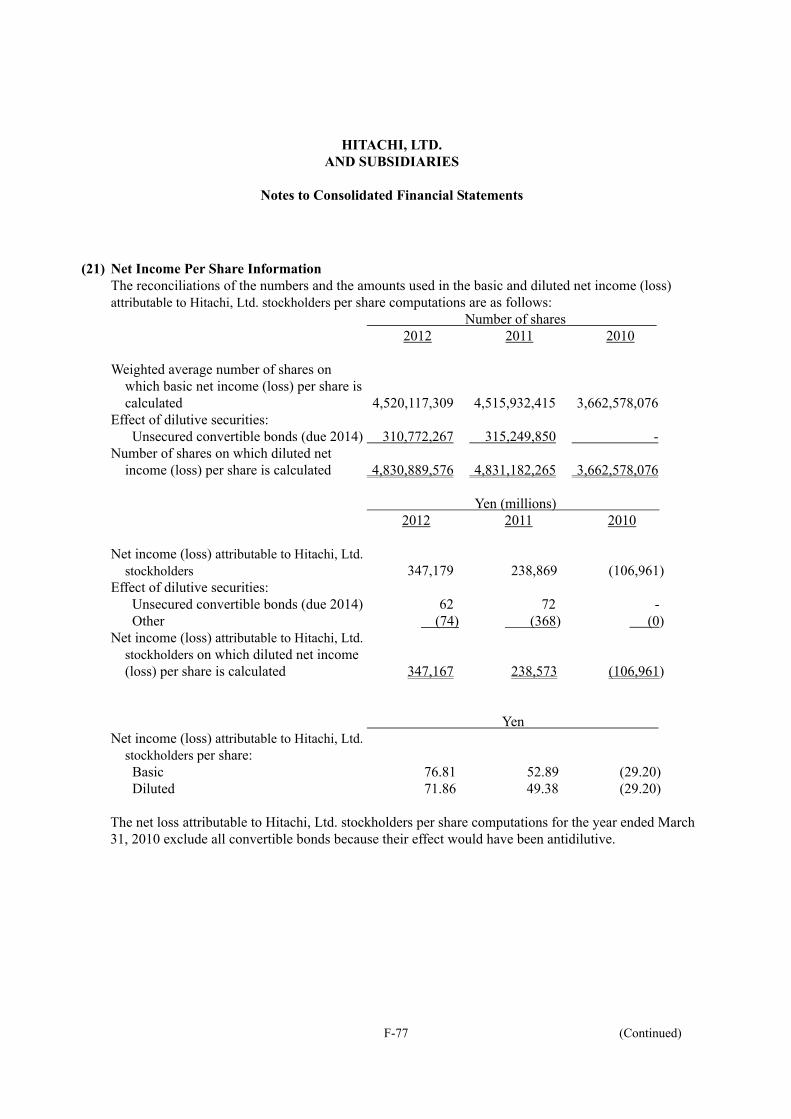
HITACHI, LTD. AND SUBSIDIARIES
Notes to Consolidated Financial Statements
F-77 (Continued)
(21) Net Income Per Share Information The reconciliations of the numbers and the amounts used in the basic and diluted net income (loss)
attributable to Hitachi, Ltd. stockholders per share computations are as follows: Number of shares
2012 2011 2010 Weighted average number of shares on which basic net income (loss) per share is
calculated 4,520,117,309 4,515,932,415 3,662,578,076 Effect of dilutive securities:
Unsecured convertible bonds (due 2014) 310,772,267 315,249,850 - Number of shares on which diluted net
income (loss) per share is calculated 4,830,889,576 4,831,182,265 3,662,578,076
Yen (millions) 2012 2011 2010 Net income (loss) attributable to Hitachi, Ltd.
stockholders 347,179 238,869 (106,961)Effect of dilutive securities:
Unsecured convertible bonds (due 2014) 62 72 - Other (74) (368) (0)
Net income (loss) attributable to Hitachi, Ltd. stockholders on which diluted net income (loss) per share is calculated 347,167 238,573 (106,961)
Yen Net income (loss) attributable to Hitachi, Ltd.
stockholders per share: Basic 76.81 52.89 (29.20)Diluted 71.86 49.38 (29.20)
The net loss attributable to Hitachi, Ltd. stockholders per share computations for the year ended March 31, 2010 exclude all convertible bonds because their effect would have been antidilutive.

HITACHI, LTD. AND SUBSIDIARIES
Notes to Consolidated Financial Statements
F-78 (Continued)
(22) Supplementary Income and Expense Information Yen (millions) 2012 2011 2010 Shipping and handling costs 147,551 140,240 124,019 Advertising expense 30,210 31,170 28,877 Maintenance and repairs 82,838 80,878 72,065 Rent 136,219 131,533 142,077 Research and development expense 412,514 395,180 372,470
(23) Supplementary Cash Flow Information
Yen (millions) 2012 2011 2010 Cash paid during the year for:
Interest 28,129 25,457 26,706 Income taxes 116,310 122,057 61,155
Noncash investing and financial activities:
Capitalized lease assets 5,783 13,807 5,956 Conversion of convertible bonds
issued by the Company 37,292 638
2
The payments for the purchase and the proceeds from the sale of securities classified as available-for-sale disclosed in note 3 are included in purchase of investments in securities and shares of newly consolidated subsidiaries and proceeds from sale of investments in securities and shares of consolidated subsidiaries resulting in deconsolidation on the consolidated statements of cash flows.
(24) Concentrations of Credit Risk The Company and its subsidiaries generally do not have significant concentrations of credit risk to any counterparties nor any regions because they are diversified and spread globally.
F-79 (Continued)
HITACHI, LTD. AND SUBSIDIARIES
Notes to Consolidated Financial Statements
(25) Derivative Instruments and Hedging Activities
Overall risk profile The major manufacturing bases of the Company and its subsidiaries are located in Japan and Asia. The selling bases are located globally, and the Company and its subsidiaries generated approximately 45% of their sales from overseas for the year ended March 31, 2012. These overseas sales are mainly denominated in the U.S. dollar or Euro. As a result, the Company and its subsidiaries are exposed to market risks from changes in foreign currency exchange rates.
The Company’s financing subsidiaries in the U.K., the U.S. and Singapore issue variable rate medium-term notes mainly through the Euro markets to finance their overseas long-term operating capital. As a result, the Company and its subsidiaries are exposed to market risks from changes in foreign currency exchange rates and interest rates. The Company and its subsidiaries are also exposed to credit-related losses in the event of non-performance by counterparties to derivative financial instruments, but it is not expected that any counterparties will fail to meet their obligations because most of the counterparties are internationally recognized financial institutions that are rated A or higher and contracts are diversified into a number of major financial institutions. The Company and its subsidiaries have an insignificant amount of derivative instruments containing credit-risk-related contingent features, such as provisions that require the Company’s debt to maintain an investment grade credit rating from each of the major credit rating agencies. Risk management policy The Company and its subsidiaries assess foreign currency exchange rate risk and interest rate risk by continually monitoring changes in these exposures and by evaluating hedging opportunities. It is the Company’s principal policy that the Company and its subsidiaries do not enter into derivative financial instruments for speculation purposes. Foreign currency exchange rate risk management The Company and its subsidiaries have assets and liabilities which are exposed to foreign currency exchange rate risk and, as a result, they enter into forward exchange contracts and cross currency swap agreements for the purpose of hedging these risk exposures. In order to fix the future net cash flows principally from trade receivables and payables recognized, which are denominated in foreign currencies, the Company and its subsidiaries on a monthly basis measure the volume and due date of future net cash flows by currency. In accordance with the Company’s policy, a certain portion of measured net cash flows is covered using forward exchange contracts, which principally mature within one year.
The Company and its subsidiaries enter into cross currency swap agreements with the same maturities as underlying debt to fix cash flows from long-term debt denominated in foreign currencies. The hedging relationship between the derivative financial instrument and its hedged item is highly effective in achieving offsetting changes in foreign currency exchange rates.

F-80 (Continued)
HITACHI, LTD. AND SUBSIDIARIES
Notes to Consolidated Financial Statements
Interest rate risk management The Company’s and certain subsidiaries’ exposure to interest rate risk is related principally to long-term debt obligations. Management believes it is prudent to minimize the variability caused by interest rate risk. To meet this objective, the Company and certain subsidiaries principally enter into interest rate swaps to manage fluctuations in cash flows. The interest rate swaps entered into are receive-variable, pay-fixed interest rate swaps. Under the interest rate swaps, the Company and certain subsidiaries receive variable interest rate payments on long-term debt associated with medium-term notes and make fixed interest rate payments, thereby creating fixed interest rate long-term debt.
Certain financing subsidiaries mainly finance a portion of their operations using long-term debt with a fixed interest rate and lend funds at variable interest rates. Therefore, such companies are exposed to interest rate risk. Management believes it is prudent to minimize the variability caused by interest rate risk. To meet this objective, certain financing subsidiaries principally enter into interest rate swaps converting the fixed rate to a variable rate to manage fluctuations in fair value resulting from interest rate risk. Under the interest rate swaps, certain financing subsidiaries receive fixed interest rate payments associated with long-term debt, including medium-term notes, and make variable interest rate payments, thereby creating variable-rate long-term debt. The hedging relationship between the interest rate swaps and its hedged item is highly effective in achieving offsetting changes in cash flows and fair value resulting from interest rate risk. Fair value hedge Changes in the fair value of both recognized assets and liabilities, and derivative financial instruments designated as fair value hedges of these assets and liabilities are recognized in other income (deductions). Derivative financial instruments designated as fair value hedges include forward exchange contracts associated with operating transactions, cross currency swap agreements and interest rate swaps associated with financing transactions.
Cash flow hedge Foreign currency exposure: Changes in the fair value of forward exchange contracts designated and qualifying as cash flow hedges of forecasted transactions are reported in accumulated other comprehensive income (AOCI). These amounts are reclassified into earnings in the same period as the hedged items affect earnings. It is expected that a net loss of approximately ¥515 million recorded in AOCI relating to existing forward exchange contracts will be reclassified into other income or other deductions during the year ending March 31, 2013. As of March 31, 2012, the maximum length of time over which the Company and its subsidiaries are hedging their exposure to the variability in future cash flows associated with foreign currency forecasted transactions is approximately 60 months.

F-81 (Continued)
HITACHI, LTD. AND SUBSIDIARIES
Notes to Consolidated Financial Statements
Interest rate exposure: Changes in fair values of interest rate swaps designated as hedging instruments for the variability of cash flows associated with long-term debt obligations are reported in AOCI. These amounts subsequently are reclassified into interest charges as a yield adjustment in the same period in which the hedged debt obligations affect earnings. It is expected that a net loss of approximately ¥303 million recorded in AOCI related to interest rate swaps will be reclassified into interest charges as a yield adjustment of the hedged debt obligations during the year ending March 31, 2013. The contract or notional amounts of derivative financial instruments held as of March 31, 2012 and 2011 are summarized as follows:
Yen (millions) 2012 2011 Forward exchange contracts:
To sell foreign currencies 175,505 228,088 To buy foreign currencies 102,684 122,653
Cross currency swap agreements: To sell foreign currencies 109,794 96,712 To buy foreign currencies 135,345 100,586
Interest rate swaps 345,143 280,951 Option contracts 3,205 7,221

F-82 (Continued)
HITACHI, LTD. AND SUBSIDIARIES
Notes to Consolidated Financial Statements
The following tables, “Effective portion of derivatives designated as hedging instruments and related hedged items” and “Ineffective portion and amount excluded from effectiveness test,” show the effects of derivative instruments for fair value hedges on the consolidated statement of operations for the year ended March 31, 2012:
Effective portion of derivatives designated as hedging instruments and related hedged items
Hedging instruments Related hedged items
Derivatives Location Yen
(millions)
Items LocationYen
(millions)Forward exchange contracts
Other income
(302) Accounts receivable and accounts payable
Other income
249
Cross currency swap agreements
Interest charges
(2,556) Long-term debt
Interest charges
2,531
(2,858) 2,780
Ineffective portion and amount excluded from effectiveness test
Derivatives Location Yen (millions)Forward exchange contracts Other income 1,150Cross currency swap agreements Other income (20)Interest rate swaps Interest charges 36 1,166

F-83 (Continued)
HITACHI, LTD. AND SUBSIDIARIES
Notes to Consolidated Financial Statements
The following tables, “Effective portion of derivatives designated as hedging instruments and related hedged items” and “Ineffective portion and amount excluded from effectiveness test,” show the effects of derivative instruments for fair value hedges on the consolidated statement of operations for the year ended March 31, 2011:
Effective portion of derivatives designated as hedging instruments and related hedged items
Hedging instruments Related hedged items
Derivatives Location Yen
(millions)
Items LocationYen
(millions)Forward exchange contracts
Other income
8,955 Accounts receivable and accounts payable
Other income
(8,576)
Cross currency swap agreements
Interest charges
2,693 Long-term debt
Interest charges
(3,010)
11,648 (11,586)
Ineffective portion and amount excluded from effectiveness test
Derivatives Location Yen (millions)Forward exchange contracts Other income (682)Cross currency swap agreements Other income 1,412Interest rate swaps Interest charges 54 784
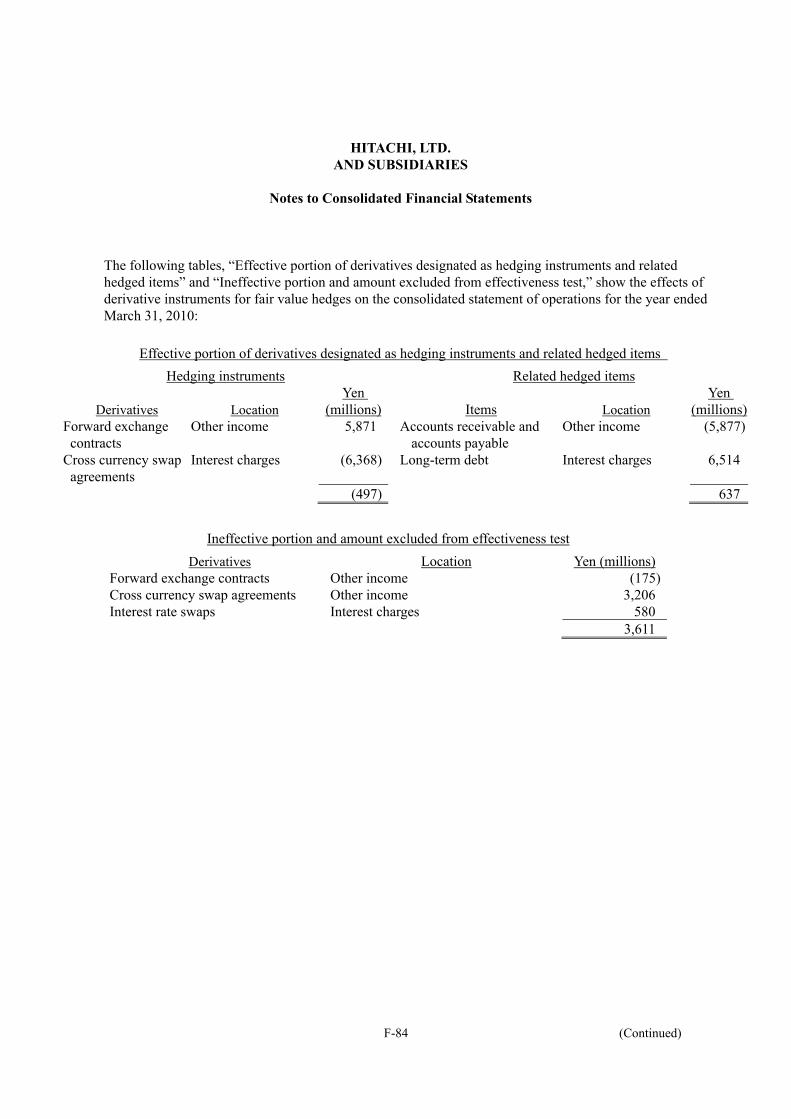
F-84 (Continued)
HITACHI, LTD. AND SUBSIDIARIES
Notes to Consolidated Financial Statements
The following tables, “Effective portion of derivatives designated as hedging instruments and related hedged items” and “Ineffective portion and amount excluded from effectiveness test,” show the effects of derivative instruments for fair value hedges on the consolidated statement of operations for the year ended March 31, 2010:
Effective portion of derivatives designated as hedging instruments and related hedged items
Hedging instruments Related hedged items
Derivatives Location Yen
(millions)
Items LocationYen
(millions)Forward exchange contracts
Other income
5,871 Accounts receivable and accounts payable
Other income
(5,877)
Cross currency swap agreements
Interest charges
(6,368) Long-term debt
Interest charges
6,514
(497) 637
Ineffective portion and amount excluded from effectiveness test
Derivatives Location Yen (millions)Forward exchange contracts Other income (175)Cross currency swap agreements Other income 3,206Interest rate swaps Interest charges 580 3,611

F-85 (Continued)
HITACHI, LTD. AND SUBSIDIARIES
Notes to Consolidated Financial Statements
The following tables, “Gain (loss) recognized in OCI, Effective portion of derivatives designated as hedging instruments,” “Gain (loss) reclassified from AOCI into consolidated statement of operations, Effective portion of derivatives designated as hedging instruments” and “Loss on derivatives designated as cash flow hedging instruments, Ineffective portion and amount excluded from effectiveness test” show the effect of derivative instruments for cash flow hedges on the consolidated statement of operations for the year ended March 31, 2012:
Gain (loss) recognized in OCI
Effective portion of derivatives designated as hedging instruments
Derivatives Yen (millions) Forward exchange contracts (2,531) Cross currency swap agreements 105Interest rate swaps 948Option contracts 819 (659)
Gain (loss) reclassified from AOCI into consolidated statement of operations
Effective portion of derivatives designated as hedging instruments
Derivatives Location Yen (millions)Forward exchange contracts Other income 122Cross currency swap agreements Other income (9,506)Interest rate swaps Interest charges (535)Option contracts Other income (878) (10,797)
Loss on derivatives designated as cash flow hedging instruments
Ineffective portion and amount excluded from effectiveness test
Derivatives Location Yen (millions)Forward exchange contracts Other income (113)Cross currency swap agreements Other income (43)Interest rate swaps Interest charges (120) (276)

F-86 (Continued)
HITACHI, LTD. AND SUBSIDIARIES
Notes to Consolidated Financial Statements
The following tables, “Gain (loss) recognized in OCI, Effective portion of derivatives designated as hedging instruments,” “Gain (loss) reclassified from AOCI into consolidated statement of operations, Effective portion of derivatives designated as hedging instruments” and “Gain on derivatives designated as cash flow hedging instruments, Ineffective portion and amount excluded from effectiveness test” show the effect of derivative instruments for cash flow hedges on the consolidated statement of operations for the year ended March 31, 2011:
Gain (loss) recognized in OCI
Effective portion of derivatives designated as hedging instruments
Derivatives Yen (millions) Forward exchange contracts (220) Cross currency swap agreements (153) Interest rate swaps 1,879Option contracts 781 2,287
Gain (loss) reclassified from AOCI into consolidated statement of operations
Effective portion of derivatives designated as hedging instruments
Derivatives Location Yen (millions)Forward exchange contracts Other income 166Cross currency swap agreements Other income (4,174)Interest rate swaps Interest charges (173)Option contracts Other income (701) (4,882)
Gain on derivatives designated as cash flow hedging instruments
Ineffective portion and amount excluded from effectiveness test
Derivatives Location Yen (millions)Forward exchange contracts Other income 269Cross currency swap agreements Other income 66Interest rate swaps Interest charges 67 402

F-87 (Continued)
HITACHI, LTD. AND SUBSIDIARIES
Notes to Consolidated Financial Statements
The following tables, “Gain (loss) recognized in OCI, Effective portion of derivatives designated as hedging instruments,” “Gain (loss) reclassified from AOCI into consolidated statement of operations, Effective portion of derivatives designated as hedging instruments” and “Gain (loss) on derivatives designated as cash flow hedging instruments, Ineffective portion and amount excluded from effectiveness test” show the effect of derivative instruments for cash flow hedges on the consolidated statement of operations for the year ended March 31, 2010:
Gain (loss) recognized in OCI
Effective portion of derivatives designated as hedging instruments
Derivatives Yen (millions) Forward exchange contracts 1,323Cross currency swap agreements 2,435Interest rate swaps (2,469) Option contracts 639 1,928
Gain (loss) reclassified from AOCI into consolidated statement of operations
Effective portion of derivatives designated as hedging instruments
Derivatives Location Yen (millions)Forward exchange contracts Other income (1,007)Cross currency swap agreements Other income (7,536)Interest rate swaps Interest charges 1,756Option contracts Other income (634) (7,421)
Gain (loss) on derivatives designated as cash flow hedging instruments
Ineffective portion and amount excluded from effectiveness test
Derivatives Location Yen (millions)Forward exchange contracts Other income 245Cross currency swap agreements Other income (3,378)Interest rate swaps Interest charges 589 (2,544)

F-88 (Continued)
HITACHI, LTD. AND SUBSIDIARIES
Notes to Consolidated Financial Statements
(26) Fair Value of Financial Instruments The following methods and assumptions are used to estimate the fair values of financial instruments:
Long-term debt and Non-recourse borrowings of consolidated securitization entities The fair value of long-term debt and non-recourse borrowings of consolidated securitization entities are estimated based on quoted market prices or the present value of future cash flows using the Company’s and its subsidiaries’ market interest rates for the same contractual terms.
Cash and cash equivalents, Trade receivables, Short-term debt and Trade payables The carrying amount approximates the fair value because of the short maturity of these instruments. Financial assets transferred to consolidated securitization entities For the portion related to transferred mortgage loans receivable, the fair value is estimated based on the present value of future cash flows. Investments in securities, Subordinated interests resulting from securitization and Derivatives Refer to note 27 for the methods and assumptions used to estimate the fair values.

F-89 (Continued)
HITACHI, LTD. AND SUBSIDIARIES
Notes to Consolidated Financial Statements
The carrying amounts and estimated fair values of the financial instruments as of March 31, 2012 and 2011 are as follows: Yen (millions) 2012 2011 Carrying
amounts Estimated fair values
Carrying amounts
Estimatedfair values
Investments in securities: Short-term investments 11,562 11,562 16,598 16,598Investments and advances 253,340 253,340 180,232 180,232
Financial assets transferred to consolidated securitization entities:
162,227
172,041
186,742 196,543
Derivatives (Effective portion in other current assets):
Forward exchange contracts 1,849 1,849 1,508 1,508Cross currency swap agreements 5,271 5,271 10,363 10,363Interest rate swaps 12 12 - -Option contracts 6 6 28 28
Derivatives (Ineffective portion in other current assets):
Forward exchange contracts 232 232 563 563Cross currency swap agreements 479 479 1,084 1,084Interest rate swaps - - - -Option contracts - - - -
Derivatives (Effective portion in other assets):
Forward exchange contracts 16 16 111 111Cross currency swap agreements 1,421 1,421 5,805 5,805Interest rate swaps 864 864 1,092 1,092Option contracts 15 15 66 66
Derivatives (Ineffective portion in other assets):
Forward exchange contracts 13 13 - -Cross currency swap agreements 713 713 1,437 1,437Interest rate swaps - - - -Option contracts - - - -
Subordinated interests resulting from securitization:
Other current assets 1,253 1,253 255 255Advances and other 65,060 65,060 33,811 33,811

F-90 (Continued)
HITACHI, LTD. AND SUBSIDIARIES
Notes to Consolidated Financial Statements
Yen (millions) 2012 2011 Carrying
amounts Estimated fair values
Carrying amounts
Estimatedfair values
Long-term debt
(1,632,961)
(1,691,886)
(1,638,529) (1,696,722)
Non-recourse borrowings of consolidated securitization entities:
(232,047)
(234,851)
(410,434) (413,519)
Derivatives (Effective portion in other current liabilities):
Forward exchange contracts (11,090) (11,090) (3,813) (3,813)Cross currency swap agreements (2,512) (2,512) (268) (268)Interest rate swaps (650) (650) (323) (323)Option contracts (34) (34) (5) (5)
Derivatives (Ineffective portion in other current liabilities):
Forward exchange contracts (990) (990) (547) (547)Cross currency swap agreements (34) (34) (8) (8) Interest rate swaps (54) (54) (13) (13)Option contracts - - - -
Derivatives (Effective portion in other liabilities):
Forward exchange contracts (72) (72) (86) (86)Cross currency swap agreements (1,568) (1,568) (305) (305)Interest rate swaps (2,261) (2,261) (2,915) (2,915)Option contracts - - - -
Derivatives (Ineffective portion in other liabilities):
Forward exchange contracts (12) (12) - -Cross currency swap agreements (2,578) (2,578) (2,625) (2,625)Interest rate swaps (123) (123) (80) (80)Option contracts - - - -
It is not practicable to estimate the fair value of investments in unlisted stock because of the lack of a market price and difficulty in estimating fair value without incurring excessive cost. The carrying amounts of these investments as of March 31, 2012 and 2011 totaled ¥56,174 million and ¥48,144 million, respectively.
As of March 31, 2012, the estimated fair values of the financial assets transferred to consolidated
securitization entities and the non-recourse borrowings of consolidated securitization entities are included in Level 3 of the fair value hierarchy and the estimated fair values of the long-term debts are included in Level 2 of the fair value hierarchy.
F-91 (Continued)
HITACHI, LTD. AND SUBSIDIARIES
Notes to Consolidated Financial Statements
(27) Fair Value
ASC 820 establishes a fair value hierarchy that prioritizes the use of observable inputs in markets over the use of unobservable inputs when measuring fair value as follows: Level 1 Quoted prices for identical assets or liabilities in active markets. Level 2 Quoted prices for similar assets or liabilities in active markets; quoted prices associated with transactions that are not distressed for identical or similar assets or liabilities in markets that are not active; or valuations whose significant inputs are derived from or corroborated by observable market data. Level 3 Valuations using inputs that are not observable. Investments in debt and equity securities Investment securities of which quoted market prices are available to determine their fair value are included in Level 1. Level 1 securities include available-for-sale securities such as listed stocks on exchange markets, debt securities such as Japan treasury bonds and U.S. treasury bonds and exchange traded funds. In the absence of an active market for investment securities, quoted prices for similar investment securities, quoted prices associated with transactions that are not distressed for identical or similar investment securities or other relevant information including market interest rate curves, referenced credit spreads or default rates, are used to determine fair value. These investments are included in Level 2. Level 2 securities include short-term investments and available-for-sale securities such as listed stocks traded over-the-counter, investment funds and debt securities traded over-the-counter. In infrequent circumstances, the significant inputs of fair value for investment securities are unobservable and such investment are included in Level 3. The Company uses price information provided by financial institutions to evaluate these investments while corroborating the information mainly with prices estimated using an income approach based on its own valuation models or a market approach such as comparison with prices of similar securities. Level 3 securities include available-for-sale securities such as subordinated debentures and structured bonds with little market activity. Derivatives Closing prices are used for derivatives included in Level 1, which are traded on active markets. The majority of derivatives are traded on over-the-counter markets, which the Company does not deem to represent active markets. Derivative assets and liabilities for which fair value is based on quoted prices associated with transactions that are not distressed, in markets that are not active, or based on models using interest rate curves and forward and spot prices for currencies and commodities are included in Level 2. Derivatives included in Level 2 primarily consist of interest rate swaps, cross-currency swaps and foreign currency and commodity forward and option contracts. In infrequent circumstances, the significant inputs of fair value are unobservable and the Company mainly uses an income or market approach to corroborate relevant information provided by financial institutions. These derivatives are included in Level 3.

F-92 (Continued)
HITACHI, LTD. AND SUBSIDIARIES
Notes to Consolidated Financial Statements
Subordinated interests resulting from securitization When fair value is determined using observable inputs, including prices of recent transactions in markets that are not distressed, subordinated interests are included in Level 2. When significant inputs are not observable, fair value is determined based on economic assumptions used in measuring the fair value of the subordinated interests, including weighted-average life, expected credit risks, and discount rates, and the subordinated interests are included in Level 3. The Company uses its own valuation models to evaluate these investments categorized within Level 3 and periodically reviews the appropriateness of consistent application of the models as well as updating of the inputs in consideration of recent changes in economic conditons. The Company also analyses that the sensitivity in the valuation of these investments does not have material adverse effects on the consolidated financial statements.
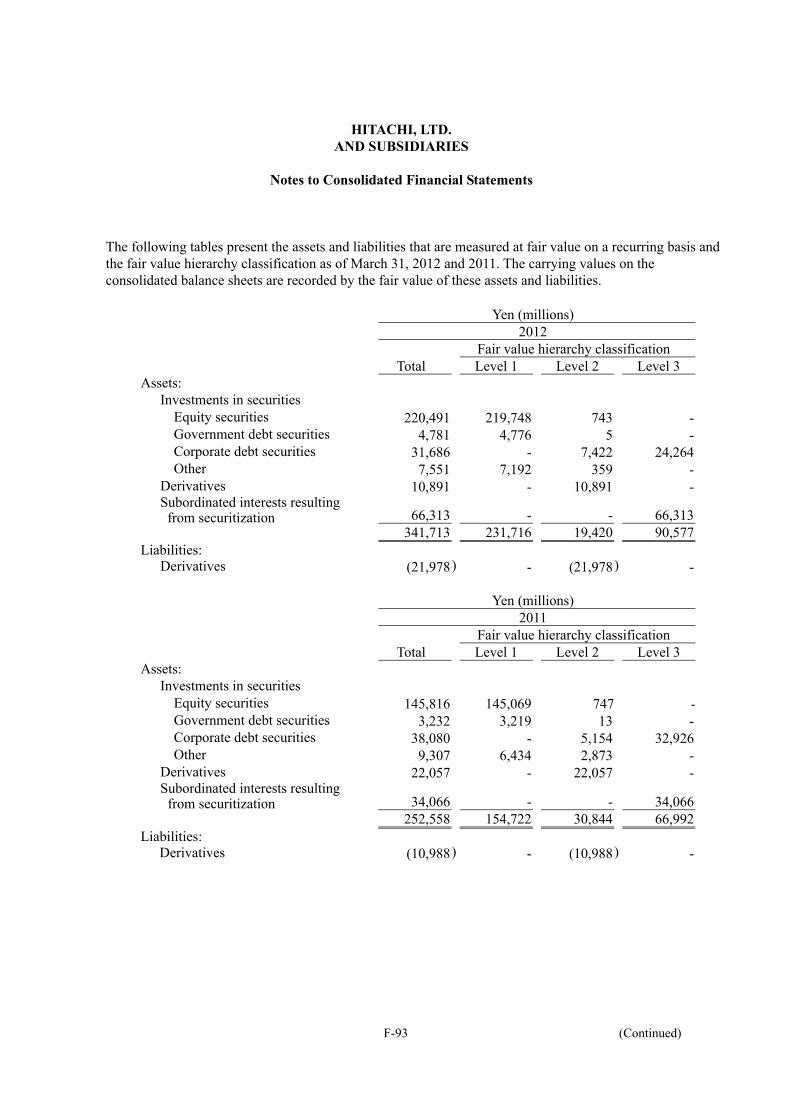
F-93 (Continued)
HITACHI, LTD. AND SUBSIDIARIES
Notes to Consolidated Financial Statements
The following tables present the assets and liabilities that are measured at fair value on a recurring basis and the fair value hierarchy classification as of March 31, 2012 and 2011. The carrying values on the consolidated balance sheets are recorded by the fair value of these assets and liabilities.
Yen (millions) 2012
Total Fair value hierarchy classification
Level 1 Level 2 Level 3 Assets:
Investments in securities Equity securities 220,491 219,748 743 -Government debt securities 4,781 4,776 5 -Corporate debt securities 31,686 - 7,422 24,264Other 7,551 7,192 359 -
Derivatives 10,891 - 10,891 -Subordinated interests resulting from securitization 66,313 - - 66,313
341,713 231,716 19,420 90,577Liabilities:
Derivatives (21,978) - (21,978 ) -
Yen (millions) 2011
Total Fair value hierarchy classification
Level 1 Level 2 Level 3 Assets:
Investments in securities Equity securities 145,816 145,069 747 -Government debt securities 3,232 3,219 13 -Corporate debt securities 38,080 - 5,154 32,926Other 9,307 6,434 2,873 -
Derivatives 22,057 - 22,057 -Subordinated interests resulting
from securitization 34,066 - - 34,066 252,558 154,722 30,844 66,992
Liabilities: Derivatives (10,988) - (10,988 ) -

F-94 (Continued)
HITACHI, LTD. AND SUBSIDIARIES
Notes to Consolidated Financial Statements
The following table presents the changes in Level 3 instruments measured on a recurring basis for the year ended March 31, 2012.
Yen (millons)
Corporate debt
securities
Subordinated interests resulting
from securitization
Total Balance at beginning of year 32,926 34,066 66,992Purchases 6,829 44,759 51,588Sales (1,492) - (1,492)Settlements (13,859) (13,111 ) (26,970)Total gains or losses (realized/unrealized)
Included in earnings (a) (1,127) 220 (907)Included in other comprehensive loss 987 379 1,366
Balance at end of year 24,264 66,313 90,577The amount of total gains or losses for the period included
in earnings attributable to the change in unrealized gains or losses relating to assets still held at the reporting date (1,089) - (1,089)
(a) Level 3 gains and losses (realized and unrealized) included in earnings for the year ended March 31,
2012 are reported in other income (deductions) for corporate debt securities and are reported in revenue for subordinated interests resulting from securitization.
The following table presents the changes in Level 3 instruments measured on a recurring basis for the year ended March 31, 2011.
Yen (millons)
Corporate debt
securities
Subordinated interests resulting
from securitization Total
Balance at beginning of year 28,933 115,417 144,350Effect of consolidation of securitization entities upon initial adoption of the amended provisions of ASC810 (a) - (113,651 ) (113,651)
Purchases, sales, issuances and settlements, net 2,046 32,300 34,346Total gains or losses (realized/unrealized)
Included in earnings (b) 546 - 546Included in other comprehensive loss 1,401 - 1,401
Balance at end of year 32,926 34,066 66,992The amount of total gains or losses for the period included
in earnings attributable to the change in unrealized gains or losses relating to assets still held at the reporting date - - -
(a) A portion of subordinated interests resulting from securitization was eliminated because of the
consolidation of securitization entities. (b) Level 3 gains and losses (realized and unrealized) included in earnings for the year ended March 31,
2011 are reported in other income (deductions) for corporate debt securities and are reported in revenue for subordinated interests resulting from securitization.

F-95 (Continued)
HITACHI, LTD. AND SUBSIDIARIES
Notes to Consolidated Financial Statements
Assets that are measured at fair value during the period on a non-recurring basis because they are deemed to be impaired are not included in the above tables. The Company writes down the carrying amount of equity-method and cost-method investments on the consolidated balance sheets when the Company deems the decline of fair value to be other-than-temporary. The fair value of the equity-method investments which are listed on an active market is included in Level 1. The fair value of equity-method investments determined using an income approach, based on discounted cash flows using unobservable inputs is included in Level 3. Also, a weighted-average fair value determined using both a market approach and an income approach, which incorporate both observable inputs, such as quoted market prices of comparable companies, and discounted cash flow using unobservable inputs, is included in Level 3. The Company calculates discounted cash flows of these equity-method investments based on business forecasts, market trends, and assumptions of projected business plans. The Company uses both a market approach and an income approach to determine the fair value of the cost-method investments. The fair value based on observable inputs such as quoted market prices of similar investments is included in Level 2. The fair value primarily based on discounted cash flows using unobservable inputs based on business forecasts, market trends, and assumptions of projected business plans is included in Level 3. The Company also writes down the carrying amount of long-lived assets on the consolidated balance sheets mainly when the Company deems the carrying amount of certain long-lived assets is not recoverable and exceeds its fair value. The Company mainly uses an income approach or a market approach to calculate the fair value of long-lived assets. These measurements are included in Level 3 since they are based primarily on discounted cash flows using unobservable inputs based on business forecasts, market trends, and assumptions of projected business plans.
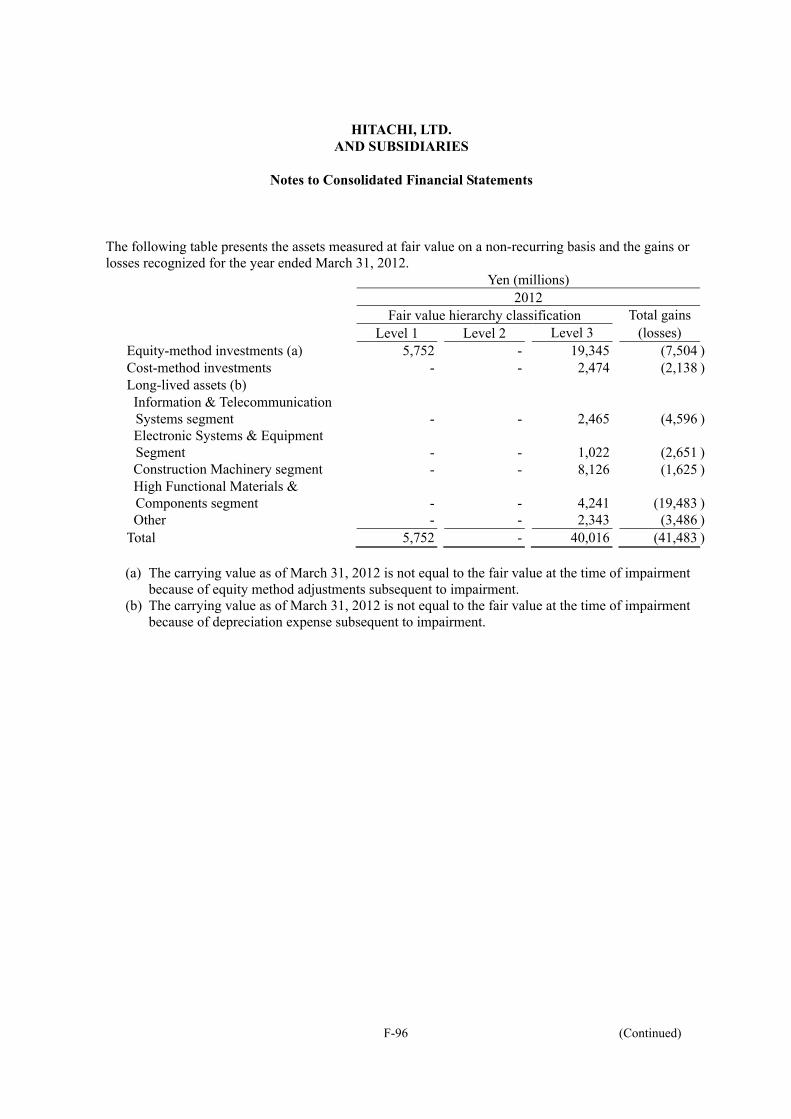
F-96 (Continued)
HITACHI, LTD. AND SUBSIDIARIES
Notes to Consolidated Financial Statements
The following table presents the assets measured at fair value on a non-recurring basis and the gains or losses recognized for the year ended March 31, 2012. Yen (millions) 2012 Fair value hierarchy classification Total gains Level 1 Level 2 Level 3 (losses)
Equity-method investments (a) 5,752 - 19,345 (7,504 )Cost-method investments - - 2,474 (2,138 )Long-lived assets (b) Information & Telecommunication Systems segment - - 2,465 (4,596 )Electronic Systems & Equipment Segment - - 1,022 (2,651 )Construction Machinery segment - - 8,126 (1,625 )High Functional Materials & Components segment - - 4,241 (19,483 )Other - - 2,343 (3,486 )
Total 5,752 - 40,016 (41,483 )
(a) The carrying value as of March 31, 2012 is not equal to the fair value at the time of impairment because of equity method adjustments subsequent to impairment.
(b) The carrying value as of March 31, 2012 is not equal to the fair value at the time of impairment because of depreciation expense subsequent to impairment.
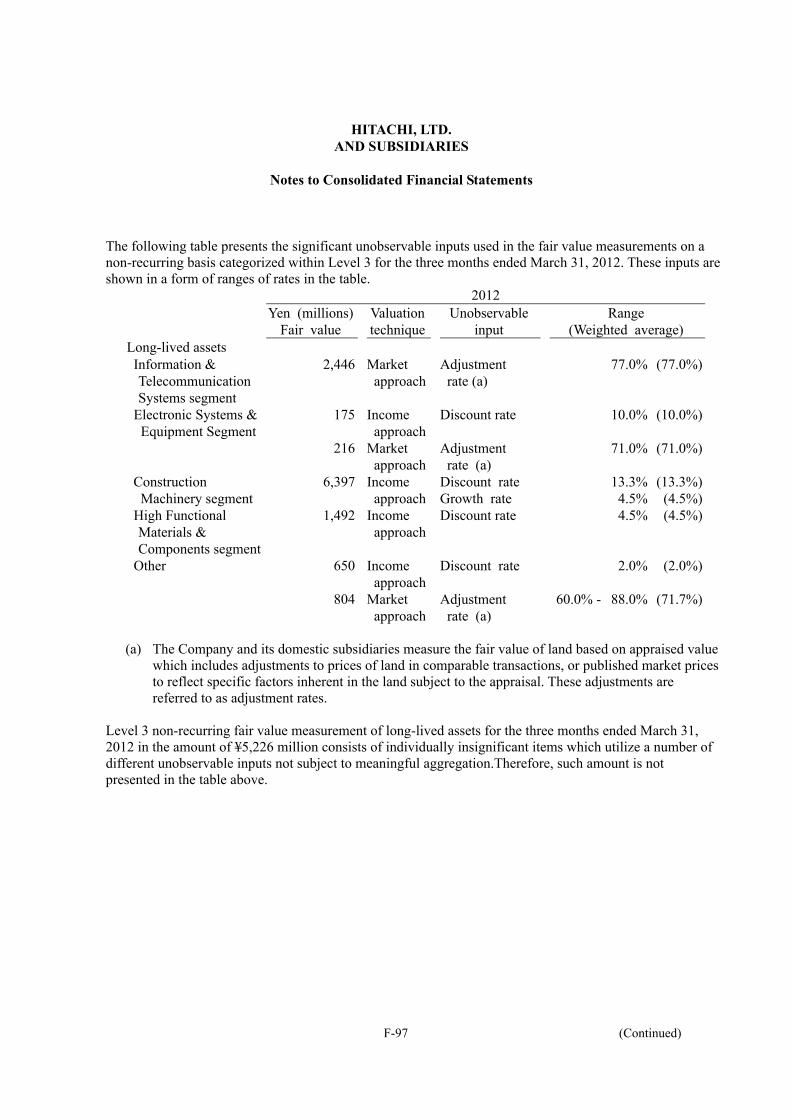
F-97 (Continued)
HITACHI, LTD. AND SUBSIDIARIES
Notes to Consolidated Financial Statements
The following table presents the significant unobservable inputs used in the fair value measurements on a non-recurring basis categorized within Level 3 for the three months ended March 31, 2012. These inputs are shown in a form of ranges of rates in the table. 2012
Yen (millions)Fair value
Valuationtechnique
Unobservable input
Range (Weighted average)
Long-lived assets Information & Telecommunication Systems segment
2,446 Market approach
Adjustment rate (a)
77.0%
(77.0%)
Electronic Systems & Equipment Segment
175
216
Income approach
Market approach
Discount rate Adjustment rate (a)
10.0%
71.0%
(10.0%)
(71.0%)
Construction Machinery segment
6,397 Income approach
Discount rate Growth rate
13.3%4.5%
(13.3%)(4.5%)
High Functional Materials & Components segment
1,492 Income approach
Discount rate 4.5% (4.5%)
Other 650
804
Income approach
Market approach
Discount rate Adjustment rate (a)
60.0%
-
2.0%
88.0%
(2.0%)
(71.7%)
(a) The Company and its domestic subsidiaries measure the fair value of land based on appraised value
which includes adjustments to prices of land in comparable transactions, or published market prices to reflect specific factors inherent in the land subject to the appraisal. These adjustments are referred to as adjustment rates.
Level 3 non-recurring fair value measurement of long-lived assets for the three months ended March 31, 2012 in the amount of ¥5,226 million consists of individually insignificant items which utilize a number of different unobservable inputs not subject to meaningful aggregation.Therefore, such amount is not presented in the table above.

F-98 (Continued)
HITACHI, LTD. AND SUBSIDIARIES
Notes to Consolidated Financial Statements
The following table presents the assets measured at fair value on a non-recurring basis and the gains or losses recognized for the year ended March 31, 2011. Yen (millions) 2011 Fair value hierarchy classification Total gains Level 1 Level 2 Level 3 (losses)
Equity-method investments (a) 1,712 - - (4,741 )Cost-method investments - - 8,066 (3,180 )Long-lived assets (b)
High Functional Materials & Components segment - - 7,755 (10,956 )Components & Devices segment - - 18,046 (16,561 )Other - - 1,716 (7,653 )
Total 1,712 - 35,583 (43,091 )
(a) The carrying value as of March 31, 2011 is not equal to the fair value at the time of impairment because of equity method adjustments subsequent to impairment.
(b) The carrying value as of March 31, 2011 is not equal to the fair value at the time of impairment because of depreciation expense subsequent to impairment.

F-99 (Continued)
HITACHI, LTD. AND SUBSIDIARIES
Notes to Consolidated Financial Statements
(28) Financing Receivables and Allowance for Doubtful Receivables
The Company classifies financing receivables aggregated and categorized as finance leases, installment loans, mortgage loans, and other, based on the nature of risks and characteristics as described below. Financing receivables from equipment leases, installment arrangements, mortgage loans, and other receivables with a contractual maturity of one year or more are subject to disclosure as reported in this note. Trade receivables from sale of products or services that have contractual maturities of one year or less are excluded from this note. Finance lease receivables are recorded based on the total minimum payments to be received and unguaranteed residual values less executory costs and unearned income. Installment loans, mortgage loans and other financing receivables are reported on the amortized cost basis. Finance leases are receivables from lease arrangements, including products manufactured by the Company and certain of its subsidiaries, such as information technology equipment, manufacturing machinery and equipment and construction machinery, typically secured by underlying assets. The primary locations of finance leases are Japan, United States, United Kingdom and China mainland. The lease term ranges mainly from three to six years. The non-specific allowance for doubtful receivables is collectively determined on the basis of past collection experience, consideration of current economic conditions and changes in our customer collection trends as well as other factors that may affect the customers’ ability to pay. Installment loans represent receivables from arrangements with customers and dealers to provide financing primarily for products manufactured by the Company and certain of its subsidiaries, such as manufacturing machinery. Installment loans are typically secured by underlying assets. The primary locations of installment loans are Japan, United States, United Kingdom and China mainland. The loan term is generally less than three years. The non-specific allowance is collectively determined on the basis of past collection experience, consideration of current economic conditions and changes in our customer collection trends as well as other factors that may affect the customers’ ability to pay. Mortgage loans are financing receivables from residential loan arrangements for individuals. Mortgage loans are usually arranged with collateral. The location of mortgage loans is Japan; more than fifty percent of mortgage loans are arranged for employees of the Company and its domestic subsidiaries. The term of mortgage loans is usually less than 30 years. The non-specific allowance is collectively determined on the basis of past collection experience, consideration of current economic conditions and changes in our customer collection trends as well as other factors that may affect the customers’ ability to pay. Other financing receivables are the financing service receivables provided by the subsidiaries in the financial services segment such as factoring, loan servicing, and other forms of commercial financing. The contractual maturities associated with those services generally range over one to three years. The non-specific allowance is collectively determined on the basis of past collection experience, consideration of current economic conditions and changes in our customer collection trends as well as other factors that may affect the customers’ ability to pay. In addition, common to all financing receivables, the Company and its subsidiaries individually evaluate collectability of financing receivables either by discounted cash flow analyses when they determine principal and interest of a financing receivable cannot be collected or by estimating the fair value of related collateral when applicable and further estimating the allowance for doubtful receivables. The Company and its subsidiaries have proprietary credit quality indicators appropriate to the unique characteristics of their operations and the nature of
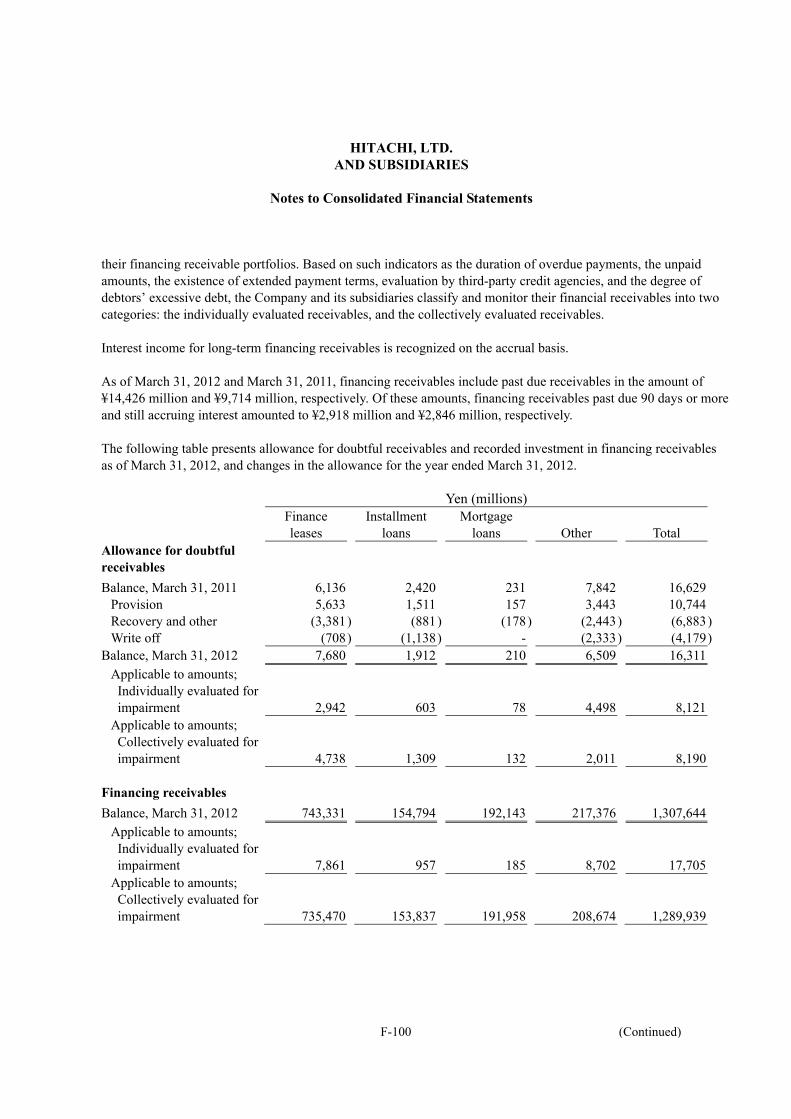
F-100 (Continued)
HITACHI, LTD. AND SUBSIDIARIES
Notes to Consolidated Financial Statements
their financing receivable portfolios. Based on such indicators as the duration of overdue payments, the unpaid amounts, the existence of extended payment terms, evaluation by third-party credit agencies, and the degree of debtors’ excessive debt, the Company and its subsidiaries classify and monitor their financial receivables into two categories: the individually evaluated receivables, and the collectively evaluated receivables. Interest income for long-term financing receivables is recognized on the accrual basis. As of March 31, 2012 and March 31, 2011, financing receivables include past due receivables in the amount of ¥14,426 million and ¥9,714 million, respectively. Of these amounts, financing receivables past due 90 days or more and still accruing interest amounted to ¥2,918 million and ¥2,846 million, respectively. The following table presents allowance for doubtful receivables and recorded investment in financing receivables as of March 31, 2012, and changes in the allowance for the year ended March 31, 2012.
Yen (millions)
Finance leases
Installmentloans
Mortgage loans Other Total
Allowance for doubtful receivables
Balance, March 31, 2011 6,136 2,420 231 7,842 16,629Provision 5,633 1,511 157 3,443 10,744Recovery and other (3,381) (881) (178) (2,443 ) (6,883)Write off (708) (1,138) - (2,333 ) (4,179)
Balance, March 31, 2012 7,680 1,912 210 6,509 16,311Applicable to amounts; Individually evaluated for impairment 2,942 603 78 4,498 8,121
Applicable to amounts; Collectively evaluated for impairment 4,738 1,309 132 2,011 8,190
Financing receivables
Balance, March 31, 2012 743,331 154,794 192,143 217,376 1,307,644Applicable to amounts; Individually evaluated for impairment 7,861 957 185 8,702 17,705
Applicable to amounts; Collectively evaluated for impairment 735,470 153,837 191,958 208,674 1,289,939

F-101 (Continued)
HITACHI, LTD. AND SUBSIDIARIES
Notes to Consolidated Financial Statements
The following table presents allowance for doubtful receivables and recorded investment in financing receivables as of March 31, 2011, and changes in the allowance for the three months ended March 31, 2011.
Yen (millions)
Finance leases
Installmentloans
Mortgage loans Other Total
Allowance for doubtful receivables
Balance, January 1, 2011 5,156 2,426 176 5,940 13,698Provision 1,531 293 102 3,709 5,635Recovery and other (340) (70) (47) (1,073 ) (1,530)Write off (211) (229) - (734 ) (1,174)
Balance, March 31, 2011 6,136 2,420 231 7,842 16,629Applicable to amounts; Individually evaluated for impairment 1,620 906 88 5,082 7,696
Applicable to amounts; Collectively evaluated for impairment 4,516 1,514 143 2,760 8,933
Financing receivables
Balance, March 31, 2011 873,137 126,957 218,222 217,515 1,435,831Applicable to amounts; Individually evaluated for impairment 4,515 1,252 1,113 9,718 16,598
Applicable to amounts; Collectively evaluated for impairment 868,622 125,705 217,109 207,797 1,419,233
In addition, as of March 31, 2012 and March 31, 2011, the amount of impaired loans relating to receivables which arose from sales of products or services are ¥42,729 million and ¥43,628 million, respectively.

F-102 (Continued)
HITACHI, LTD. AND SUBSIDIARIES
Notes to Consolidated Financial Statements
(29) Acquisitions and Divestitures
On September 2, 2011 Hitachi Data Systems Corporation (HDS), a subsidiary of the Company in the Information & Telecommunication Systems segment, purchased additional shares of BlueArc Corporation (BlueArc) for ¥42,923 million, resulting in a 97.8% increase of HDS ownership from 2.2% to 100%. Accordingly, HDS obtained control of BlueArc and it became a wholly owned subsidiary effective September 2, 2011 (the acquisition date). BlueArc operates a network storage business. HDS made the acquisition to increase its competitiveness in the storage solution business through creating synergy in a field of file storage. The following table summarizes the consideration paid for BlueArc, the assets acquired and liabilities assumed and recognized as of the acquisition date.
Yen (millions)Current assets 1,499 Non-current assets (excluding intangible assets) 4,749 Intangible assets Goodwill (not deductible for tax purposes) 33,002 Other intangible assets 11,014
50,264 Current liabilities (1,400) Non-current liabilities (5,059) (6,459) Previously acquired equity interest measured at fair value
(882)
Cash paid for acquisition (42,923) (43,805)
The following table shows the acquired intangible assets subject to amortization.
Yen (millions)
Weighted averageamortization period (year)
The acquired intangible assets subject to amortization
Existing technology 7,166 5 Customer relationships 2,874 5 In-process research and development 771 2 Trade name 203 2
11,014
F-103 (Continued)
HITACHI, LTD. AND SUBSIDIARIES
Notes to Consolidated Financial Statements
The Company recognized a gain of ¥747 million as a result of remeasuring its equity interest in BlueArc held before the business combination at the acquisition date fair value. The gain is included in other income in the Company’s consolidated statement of operations for the year ended March 31, 2012.
The fair value of the equity interest held before the business combination in BlueArc, a private entity, was estimated by applying the income approach. This fair value measurement is based on significant inputs that are not observable in the market and thus this fair value is included in Level 3. Key inputs include business forecasts, market trends, assumptions of projected business plans and adjustments because of the lack of control that market participants would consider when estimating the fair value of BlueArc. The results of operations of BlueArc for the period from the acquisition date to March 31, 2012 were not material. On a pro forma basis, revenue, net income attributable to Hitachi, Ltd. and the per share information of the Company with assumed acquisition date for BlueArc of April 1, 2010 would not differ materially from the amounts reported in the accompanying consolidated financial statements as of and for the years ended March 31, 2012 and 2011. On March 9, 2011, Hitachi Transport System, Ltd. (Hitachi Transport System), a subsidiary of the Company included in the Others category of segment information, announced its decision to purchase shares of Vantec Corporation (Vantec), through a tender offer to make Vantec its subsidiary. The tender offer price was ¥233,500 per share, which was determined by taking into consideration the market price of Vantec’s common stock, Vantec’s financial condition, future earnings prospects and a valuation of Vantec stock conducted by a third party appraiser. The price included a premium of approximately 93% over the average share price of Vantec’s common stock traded on the First Section of the Tokyo Stock Exchange for the three month period ended March 8, 2011. As a result, Hitachi Transport System purchased 209,550 shares in the tender offer, for ¥48,930 million in the period from March 10, 2011 through April 19, 2011, resulting in an acquisition of 90.12% of the voting rights. Accordingly, Hitachi Transport System obtained control of Vantec and it became a consolidated subsidiary effective April 26, 2011, the settlement date of the tender offer (the acquisition date). Vantec operates warehousing and transportation related business. Hitachi Transport System made the acquisition to realize synergy in the system logistics and global business and improve the enterprise value of Hitachi Transport System and Vantec.

F-104 (Continued)
HITACHI, LTD. AND SUBSIDIARIES
Notes to Consolidated Financial Statements
The following table summarizes the consideration paid for Vantec, the assets acquired and liabilities assumed and recognized as of the acquisition, as well as the fair value as of the acquisition date of the noncontrolling interest in Vantec.
Yen (millions)Current assets 35,551Non-current assets (excluding intangible assets) 28,090Intangible assets Goodwill (not deductible for tax purposes) 14,837Other intangible assets 29,197
107,675Current liabilities (31,493)Non-current liabilities (23,630)
(55,123)Cash paid for acquisition (48,930)Fair value of noncontrolling interests (3,622)
(52,552)
The following table shows the acquired intangible assets subject to amortization.
Yen (millions)
Weighted averageamortization period (year)
The acquired intangible assets subject to amortization
Customer relationships 29,197 17
The fair value of the noncontrolling interest in Vantec, a listed entity, was determined by quoted market price and included in Level 1.
The results of operations of Vantec for the period from the acquisition date to March 31, 2012 were not material.
On a pro forma basis, revenue, net income attributable to Hitachi, Ltd. and the per share information of the Company with assumed acquisition date for Vantec of April 1, 2010 would not differ materially from the amounts reported in the accompanying consolidated financial statements as of and for the years ended March 31, 2012 and 2011. On November 8, 2010, Hitachi Medical Corporation (Hitachi Medical), a subsidiary of the Company in the Electronic Systems & Equipment segment, announced its decision to purchase additional shares of Aloka Co., Ltd. (Aloka), through a tender offer to make Aloka its subsidiary. The tender offer price was ¥1,075 per share, which was determined by comprehensively taking into consideration the market price of Aloka’s common stock, Aloka’s financial condition, future earnings prospects and a valuation of Aloka stock conducted by a third party appraiser.

F-105 (Continued)
HITACHI, LTD. AND SUBSIDIARIES
Notes to Consolidated Financial Statements
As a result, Hitachi Medical purchased 23,157,518 shares in the tender offer, for ¥24,894 million in the period from November 9, 2010 through December 27, 2010, resulting in a 84.65% increase of Hitachi Medical’s ownership from 12.79% to 97.45%. Accordingly, Hitachi Medical obtained control of Aloka and it became a consolidated subsidiary effective January 5, 2011, the settlement date of the tender offer (the acquisition date). Further, Hitachi Medical converted Aloka into its wholly owned subsidiary through a share exchange effective March 3, 2011, and Aloka was subsequently renamed Hitachi Aloka Medical, Ltd. effective April 1, 2011. Aloka manufactures and sells medical instruments, general-purpose analysis devices and medical analysis devices. Hitachi Medical made the acquisition to strengthen its diagnostic ultrasound device businesses and increase its corporate value. This business combination was accounted for as a bargain purchase because the consideration paid for Aloka was less than the fair value of Aloka’s net assets. The following table summarizes the consideration paid for Aloka, the assets acquired and liabilities assumed and recognized as of the acquisition, as well as the fair value as of the acquisition date of the noncontrolling interest in Aloka.
Yen (millions)Current assets 43,346Non-current assets (excluding intangible assets) 9,585Intangible assets 1,811 54,742Current liabilities (13,740)Non-current liabilities (2,987) (16,727)Gain on the bargain purchase (8,684)Previously acquired equity interest measured at fair value
(3,699)
Cash paid for acquisition (24,894)Fair value of noncontrolling interests (738) (29,331)
The acquired intangible assets include patents and brands. The Company recognized a gain of ¥1,224 million as a result of remeasuring its equity interest in Aloka held before the business combination at the acquisition date fair value. The gain is included in other income in the Company’s consolidated statement of operations for the year ended March 31, 2011. The fair value of both the equity interest held before the business combination and the fair value of the noncontrolling interest in Aloka, a listed entity, were determined by quoted market price and included in Level 1.
The results of operations of Aloka for the period from the acquisition date to March 31, 2011 were not material.

F-106 (Continued)
HITACHI, LTD. AND SUBSIDIARIES
Notes to Consolidated Financial Statements
On a pro forma basis, revenue, net income (loss) attributable to Hitachi, Ltd. and the per share information of the Company with assumed acquisition dates for Aloka of April 1, 2010 and 2009 would not differ materially from the amounts reported in the accompanying consolidated financial statements as of and for the years ended March 31, 2011 and 2010. On March 30, 2010, Hitachi Construction Machinery Co., Ltd. (Hitachi Construction Machinery), a subsidiary of the Company in the Construction Machinery segment, agreed with Tata Motors Limited to purchase an additional 20% interest in Telco Construction Equipment Co., Ltd. (Telcon). As a result, Hitachi Construction Machinery purchased a total of 20,000,000 shares for ¥23,704 million on March 30, 2010, resulting in the percentage of Hitachi Construction Machinery’s ownership interests in Telcon increasing from 40.0% to 60.0%. Accordingly, Hitachi Construction Machinery obtained control over Telcon and it became a consolidated subsidiary effective March 30, 2010 (the acquisition date). Telcon manufactures and sells major construction machinery including hydraulic excavators, backhoe loaders and wheel loaders. Hitachi Construction Machinery decided to purchase an additional 20% interest to obtain a strong lead in the India market, which is expected to grow significantly.
The following table summarizes the consideration paid for Telcon, the assets acquired and liabilities assumed and recognized as of the acquisition, as well as the fair value as of the acquisition date of the noncontrolling interest in Telcon.
Yen (millions)Current assets 29,741Non-current assets (excluding intangible assets) 16,912Intangible assets Goodwill (not deductible for tax purposes) 32,981Other intangible assets 37,370
117,004Current liabilities (35,105)Non-current liabilities (14,095) (49,200)Previously acquired equity interest measured at fair value
(22,050)
Cash paid for acquisition (23,704)Fair value of noncontrolling interests (22,050) (67,804)

F-107 (Continued)
HITACHI, LTD. AND SUBSIDIARIES
Notes to Consolidated Financial Statements
The following table shows the acquired intangible assets subject to amortization and not subject to amortization.
Yen (millions)
Weighted averageamortization period (year)
The acquired intangible assets subject to amortization
Customer contracts and relationships 19,509 25 Dealer network 4,339 15 Technical know-how 3,056 6 Favorable lease agreements 1,027 5
27,931 The acquired intangible assets not subject to amortization
Brands 9,439 - 37,370
The Company recognized a gain of ¥14,923 million as a result of remeasuring to fair value its 40% equity interest in Telcon held before the business combination. The gain is included in other deductions in the Company’s consolidated statement of operations for the year ended March 31, 2010. The fair value of both the equity interest held before the business combination and the noncontrolling interest in Telcon, a private entity, were estimated by applying the income approach. These fair value measurements are based on significant inputs that are not observable in the market and thus represent Level 3 measurements. Key inputs include business forecasts, market trends, assumptions of projected business plans and adjustments because of the lack of control that market participants would consider when estimating the fair value of the noncontrolling interest in Telcon. The results of operations of Telcon for the period from the acquisition date to March 31, 2010 were not material. On a pro forma basis, revenue, net loss attributable to Hitachi, Ltd and the per share information of the Company with assumed acquisition date for Telcon of April 1, 2009 would not differ materially from the amounts reported in the accompanying consolidated financial statement as of and for the year ended March 31, 2010. The Company completed the sale of its LCDs business in the Components & Devices segment on March 30, 2012 by transferring all of its shares in Hitachi Displays, Ltd. (Hitachi Displays) to Japan Display Inc. in a cash and stock transaction. The Company also completed the sale of its hard disk drives business in the Components & Devices segment on March 8, 2012 by transferring all of its shares in Viviti Technologies, Ltd. (Viviti), a holding company of Hitachi Global Storage Technologies (subsequently renamed HGST) to Western Digital Corporation in a cash and stock transaction. As a result, the Company deconsolidated both Hitachi Displays and Viviti during the year ended March 31, 2012.

F-108 (Continued)
HITACHI, LTD. AND SUBSIDIARIES
Notes to Consolidated Financial Statements
(30) Segment Information
Business Segments The operating segments of the Company are the components for which separate financial information is available and for which segment profit or loss amounts are evaluated regularly by the chief operating decision maker in deciding how to allocate resources and in assessing performance. The Company has aggregated certain operating segments into reportable segments for reporting purpose, since such aggregation helps financial statement users better understand the Company’s performance. The reportable segments correspond to categories of activities classified primarily by markets, products and services. The Company discloses its business in eleven reportable segments: Information & Telecommunication Systems, Power Systems, Social Infrastructure & Industrial Systems, Electronic Systems & Equipment, Construction Machinery, High Functional Materials & Components, Automotive Systems, Components & Devices, Digital Media & Consumer Products, Financial Services, and Others. The primary products and services included in each segment are as follows: Information & Telecommunication Systems: Systems integration, Outsourcing services, Software, Disk array subsystems, Servers, Mainframes, Telecommunication equipment and ATMs Power Systems: Thermal power generation systems, Nuclear power generation systems, Hydroelectric power generation systems and Wind power generation systems Social Infrastructure & Industrial Systems: Industrial machinery and plants, Elevators, Escalators and Railway systems Electronic Systems & Equipment: Semiconductor and LCDs manufacturing equipment, Test and measurement equipment, Medical electronics equipment, Power tools and Electronic parts manufacturing system Construction Machinery: Hydraulic excavators, Wheel loaders and Mining dump trucks High Functional Materials & Components: Wires and cables, Copper products, Semiconductor and display related materials, Circuit boards and materials, Specialty steels, Magnetic materials and components and High grade casting components and materials

F-109 (Continued)
HITACHI, LTD. AND SUBSIDIARIES
Notes to Consolidated Financial Statements
Automotive Systems: Engine management systems, Electric powertrain systems, Drive control systems and Car information systems Components & Devices: Hard disk drives, LCDs, Information storage media and Batteries Digital Media & Consumer Products: Optical disk drives, Flat-panel TVs, LCD projectors, Room air conditioners, Refrigerators, Washing machines and Air-conditioning equipment Financial Services: Leasing and Loan guarantees Others: Logistics, Property management and others In March 2012, Hard disk drives and LCDs businesses in the Components & Devices segment were deconsolidated due to the sale of all shares of Viviti Technologies Ltd. and Hitachi Displays, Ltd. Accordingly, the assets of Hard disk drives and LCDs businesses are excluded from the Components & Devices segment assets as of March 31, 2012. Effective April 1, 2011, due to a change in management reporting, the Battery business for automotive applications, which was previously included in the Components & Devices segment, has been included in the Automotive Systems segment. The corresponding data for the years ended March 31, 2011 and 2010 have been restated to conform with the change. The following tables show business segment information for the years ended March 31, 2012, 2011 and 2010, and as of March 31, 2012, 2011 and 2010.

F-110 (Continued)
HITACHI, LTD. AND SUBSIDIARIES
Notes to Consolidated Financial Statements
Revenues from Outside Customers Yen (millions) 2012 2011 2010 Information & Telecommunication Systems 1,573,961 1,475,588 1,522,457 Power Systems 753,023 737,560 805,007 Social Infrastructure & Industrial Systems 991,839 932,299 1,044,208 Electronic Systems & Equipment 973,383 942,305 868,449 Construction Machinery 794,841 746,166 578,129 High Functional Materials & Components 1,353,781 1,329,234 1,176,292 Automotive Systems 808,031 733,910 633,399 Components & Devices 677,941 743,980 690,062 Digital Media & Consumer Products 787,305 882,834 863,091 Financial Services 309,972 325,341 327,072 Others 640,472 465,871 457,315 Subtotal 9,664,549 9,315,088 8,965,481
Corporate items 1,334 719 3,065 Total 9,665,883 9,315,807 8,968,546
Revenues from Intersegment Transactions Yen (millions) 2012 2011 2010 Information & Telecommunication Systems 190,286 176,452 183,130 Power Systems 79,385 75,647 77,128 Social Infrastructure & Industrial Systems 213,136 224,637 206,017 Electronic Systems & Equipment 128,401 137,050 130,183 Construction Machinery 3,944 5,221 5,507 High Functional Materials & Components 83,405 78,919 73,035 Automotive Systems 3,552 3,991 5,429 Components & Devices 90,124 64,255 62,554 Digital Media & Consumer Products 71,540 68,762 66,167 Financial Services 43,232 47,640 92,578 Others 311,216 301,592 306,350 Subtotal 1,218,221 1,184,166 1,208,078
Eliminations and Corporate items (1,218,221) (1,184,166) (1,208,078) Total - - -

F-111 (Continued)
HITACHI, LTD. AND SUBSIDIARIES
Notes to Consolidated Financial Statements
Total Revenues Yen (millions) 2012 2011 2010 Information & Telecommunication Systems 1,764,247 1,652,040 1,705,587 Power Systems 832,408 813,207 882,135 Social Infrastructure & Industrial Systems 1,204,975 1,156,936 1,250,225 Electronic Systems & Equipment 1,101,784 1,079,355 998,632 Construction Machinery 798,785 751,387 583,636 High Functional Materials & Components 1,437,186 1,408,153 1,249,327 Automotive Systems 811,583 737,901 638,828 Components & Devices 768,065 808,235 752,616 Digital Media & Consumer Products 858,845 951,596 929,258 Financial Services 353,204 372,981 419,650 Others 951,688 767,463 763,665 Subtotal 10,882,770 10,499,254 10,173,559
Eliminations and Corporate items (1,216,887) (1,183,447) (1,205,013) Total 9,665,883 9,315,807 8,968,546

F-112 (Continued)
HITACHI, LTD. AND SUBSIDIARIES
Notes to Consolidated Financial Statements
Segment Profit (Loss) Yen (millions) 2012 2011 2010 Information & Telecommunication Systems 101,732 98,641 94,592 Power Systems (33,986) 22,022 22,075 Social Infrastructure & Industrial Systems 49,181 39,952 42,086 Electronic Systems & Equipment 49,995 37,284 (5,218) Construction Machinery 63,129 49,192 17,649 High Functional Materials & Components 77,007 84,506 44,412 Automotive Systems 37,049 23,791 (10,994) Components & Devices 39,481 49,435 6,657 Digital Media & Consumer Products (10,947) 14,949 (7,206) Financial Services 30,222 14,255 8,518 Others 33,240 28,930 19,423 Subtotal 436,103 462,957 231,994
Eliminations and Corporate items (23,823) (18,449) (29,835) Total Segment profit 412,280 444,508 202,159
Impairment losses for long-lived assets (31,841) (35,170) (25,196) Restructuring charges (23,097) (5,757) (25,154) Interest income 12,653 13,267 12,017 Dividends income 5,551 4,240 5,799 Gains on sales of stock by subsidiaries or
affiliated companies - - 183 Other income 228,906 69,730 186 Interest charges (28,141) (24,878) (26,252) Other deductions (3,010) (13,597) (21,976) Equity in net loss of affiliated companies (15,571) (20,142) (58,186) Income before income taxes 557,730 432,201 63,580
Intersegment transactions are recorded at the same prices used in transactions with third parties. Corporate items include unallocated corporate expenses, such as leading edge R&D expenditures, and others.

F-113 (Continued)
HITACHI, LTD. AND SUBSIDIARIES
Notes to Consolidated Financial Statements
Total Assets Yen (millions) 2012 2011 2010 Information & Telecommunication Systems 1,345,392 1,289,099 1,261,016 Power Systems 955,809 919,676 1,067,072 Social Infrastructure & Industrial Systems 1,091,740 1,033,110 971,743 Electronic Systems & Equipment 903,283 867,741 820,700 Construction Machinery 1,140,332 1,000,793 927,482 High Functional Materials & Components 1,285,970 1,267,001 1,264,372 Automotive Systems 516,123 452,359 460,063 Components & Devices 162,924 591,621 584,218 Digital Media & Consumer Products 444,931 434,397 521,591 Financial Services 1,950,672 1,937,643 1,789,409 Others 1,508,926 1,344,356 1,374,882 Subtotal 11,306,102 11,137,796 11,042,548
Eliminations and Corporate assets (1,887,576) (1,952,167) (2,078,084) Total 9,418,526 9,185,629 8,964,464
Corporate assets consist of cash and cash equivalents and investments and advances. Depreciation & Amortization Yen (millions) 2012 2011 2010 Information & Telecommunication Systems 79,379 76,082 80,589 Power Systems 19,492 20,239 24,386 Social Infrastructure & Industrial Systems 27,454 27,941 32,383 Electronic Systems & Equipment 17,898 19,154 21,598 Construction Machinery 42,562 42,606 41,807 High Functional Materials & Components 69,096 75,371 85,092 Automotive Systems 31,067 32,825 41,915 Components & Devices 46,427 55,927 64,952 Digital Media & Consumer Products 25,839 27,149 34,567 Financial Services 74,972 75,076 81,049 Others 42,337 37,590 42,954 Subtotal 476,523 489,960 551,292
Eliminations and Corporate items 3,143 7,809 6,470 Total 479,666 497,769 557,762

F-114 (Continued)
HITACHI, LTD. AND SUBSIDIARIES
Notes to Consolidated Financial Statements
Impairment Losses for Long-Lived Assets Yen (millions) 2012 2011 2010 Information & Telecommunication Systems 4,596 473 353 Power Systems 35 - 136 Social Infrastructure & Industrial Systems 994 767 715 Electronic Systems & Equipment 2,651 4,605 624 Construction Machinery 1,625 3 119 High Functional Materials & Components 19,483 10,956 2,117 Automotive Systems 1,042 1,270 6,581 Components & Devices 161 15,482 12,205 Digital Media & Consumer Products 668 951 845 Financial Services - 368 - Others 586 295 1,501 Subtotal 31,841 35,170 25,196
Eliminations and Corporate items - - - Total 31,841 35,170 25,196
Capital Investment for Long-Lived Assets Yen (millions) 2012 2011 2010 Information & Telecommunication Systems 104,673 79,907 65,976 Power Systems 29,229 12,163 34,704 Social Infrastructure & Industrial Systems 32,665 24,729 32,005 Electronic Systems & Equipment 29,705 20,874 15,728 Construction Machinery 71,391 40,689 73,874 High Functional Materials & Components 71,520 66,795 55,038 Automotive Systems 46,116 22,740 20,074 Components & Devices 45,799 59,022 40,427 Digital Media & Consumer Products 23,868 19,487 20,399 Financial Services 303,565 330,292 351,298 Others 52,610 43,952 34,768 Subtotal 811,141 720,650 744,291
Eliminations and Corporate items (9,831) (20,621) (20,380) Total 801,310 700,029 723,911
Capital investment represents the additions to property, plant and equipment and other intangible assets including tangible assets and software to be leased on an accrual basis.
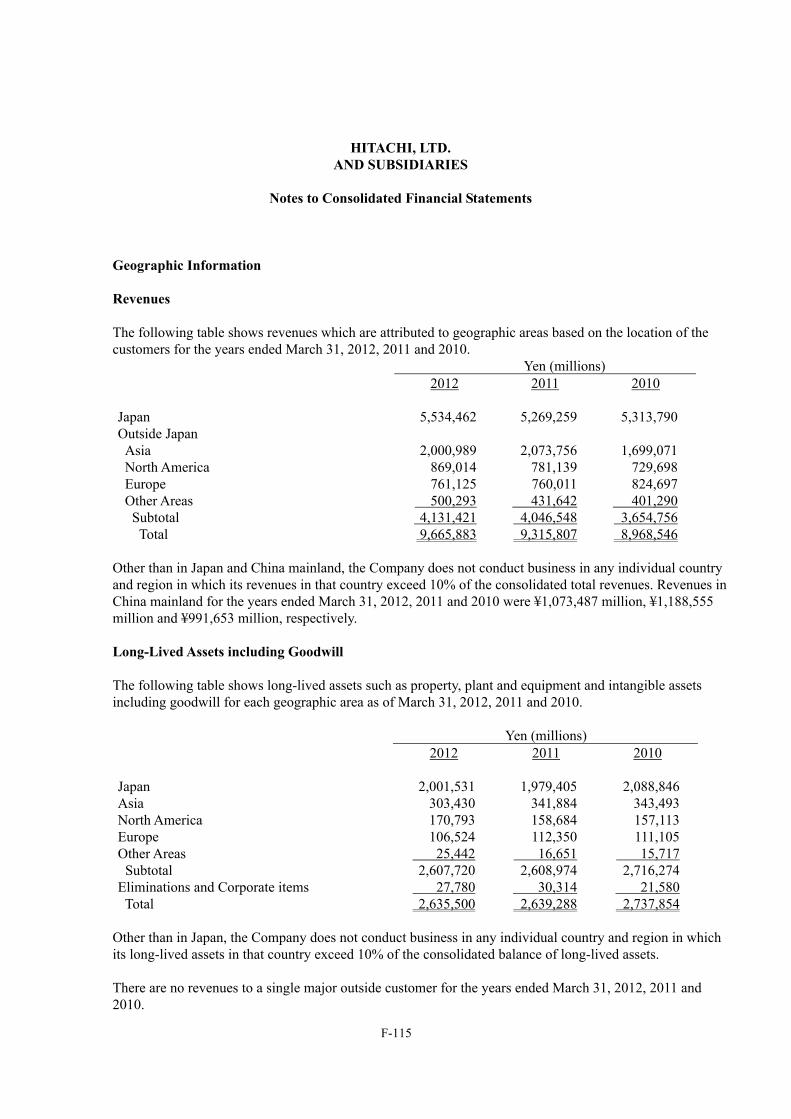
F-115 (Continued)
HITACHI, LTD. AND SUBSIDIARIES
Notes to Consolidated Financial Statements
Geographic Information Revenues The following table shows revenues which are attributed to geographic areas based on the location of the customers for the years ended March 31, 2012, 2011 and 2010. Yen (millions) 2012 2011 2010 Japan 5,534,462 5,269,259 5,313,790 Outside Japan Asia 2,000,989 2,073,756 1,699,071 North America 869,014 781,139 729,698 Europe 761,125 760,011 824,697
Other Areas 500,293 431,642 401,290 Subtotal 4,131,421 4,046,548 3,654,756 Total 9,665,883 9,315,807 8,968,546
Other than in Japan and China mainland, the Company does not conduct business in any individual country and region in which its revenues in that country exceed 10% of the consolidated total revenues. Revenues in China mainland for the years ended March 31, 2012, 2011 and 2010 were ¥1,073,487 million, ¥1,188,555 million and ¥991,653 million, respectively. Long-Lived Assets including Goodwill The following table shows long-lived assets such as property, plant and equipment and intangible assets including goodwill for each geographic area as of March 31, 2012, 2011 and 2010. Yen (millions) 2012 2011 2010 Japan 2,001,531 1,979,405 2,088,846 Asia 303,430 341,884 343,493 North America 170,793 158,684 157,113 Europe 106,524 112,350 111,105 Other Areas 25,442 16,651 15,717
Subtotal 2,607,720 2,608,974 2,716,274 Eliminations and Corporate items 27,780 30,314 21,580 Total 2,635,500 2,639,288 2,737,854
Other than in Japan, the Company does not conduct business in any individual country and region in which its long-lived assets in that country exceed 10% of the consolidated balance of long-lived assets. There are no revenues to a single major outside customer for the years ended March 31, 2012, 2011 and 2010.

A-1
[Cover]
[Document Filed] Internal Control Report
[Applicable Law] Article 24-4-4, Paragraph 1 of the Financial Instruments and Exchange Act of
Japan
[Filed to] Director, Kanto Local Finance Bureau
[Filing Date] June 22, 2012
[Company Name] Kabushiki Kaisha Hitachi Seisakusho
[Company Name in English] Hitachi, Ltd.
[Position and Name of
Representative]
Hiroaki Nakanishi, President
[Name and title of CFO] Toyoaki Nakamura, Executive Vice President and Executive Officer
[Address of Head Office] 6-6, Marunouchi 1-chome, Chiyoda-ku, Tokyo
[Place Where Available for
Public Inspection]
Tokyo Stock Exchange, Inc.
(2-1, Nihombashi Kabutocho, Chuo-ku, Tokyo)
Osaka Securities Exchange Co., Ltd.
(8-16, Kitahama 1-chome, Chuo-ku, Osaka)
Nagoya Stock Exchange, Inc.
(8-20, Sakae 3-chome, Naka-ku, Nagoya)
A-2
1. Matters Related to Basic Framework of Internal Control over Financial Reporting We prepared this Internal Control Report in accordance with the terms, form and procedures required
in the management’s report on internal control over financial reporting in the United States pursuant to Section 18 of the Cabinet Office Ordinance on the system for ensuring adequacy of the financial reporting and other information (the “Cabinet Office Ordinance on the Internal Control”).
Our management is responsible for establishing and maintaining adequate internal control over
financial reporting. Internal control over financial reporting is defined in Rule 13a-15(f) or 15d-15(f) promulgated under the Securities Exchange Act of 1934 as a process designed by, or under the supervision of, our principal executive and principal financial officers and effected by our Board of Directors, management and other personnel, to provide reasonable assurance regarding the reliability of financial reporting and the preparation of financial statements for external purposes in accordance with generally accepted accounting principles and includes those policies and procedures that:
pertain to the maintenance of records that, in reasonable detail, accurately and fairly reflect the transaction and dispositions of our assets;
provide reasonable assurance that transactions are recorded as necessary to permit preparation of financial statements in accordance with generally accepted accounting principles, and that our receipts and expenditures are being made only in accordance with authorizations of our management and directors; and
provide reasonable assurance regarding prevention or timely detection of unauthorized acquisition, use or disposition of our assets that could have a material effect on the financial statements.
Because of its inherent limitations, internal control over financial reporting may not prevent or detect misstatements. Projections of any evaluation of effectiveness to future periods are subject to the risk that controls may become inadequate because of changes in conditions, or that the degree of compliance with the policies or procedures may deteriorate.
2. Matters Related to Scope of Assessment, Record Date, and Assessment Procedure Our management assessed the effectiveness of our internal control over financial reporting as of
March 31, 2012. In making this assessment, our management used the criteria set forth by the Committee of Sponsoring Organizations of the Treadway Commission (“COSO”) in Internal Control-Integrated Framework.
3. Matters Related to Results of Assessment Based on its assessment, our management concluded that, as of March 31, 2012, our internal control
over financial reporting was effective based on those criteria.
4. Supplementary Matters Following is significant differences in case Section 18 of the Cabinet Office Ordinance on the Internal
Control is not applied when preparing the Internal Control Report. (1) In case we do not apply Section 18 of the Cabinet Office Ordinance on the Internal Control, the scope
of assessment includes financial statements and disclosures which materially affects on the reliability of financial statements. In the management’s report on internal control over financial reporting required in the U.S., the scope of assessment of internal control is only the consolidated financial statements as stated in the “Part I Information on the Company - V. Financial Information” of the Annual Securities Report.
(2) In case we do not apply Section 18 of the Cabinet Office Ordinance on the Internal Control, the scope of assessment includes the equity-method affiliates. The management’s report on internal control over financial reporting required in the U.S. does not include the equity-method affiliates in the scope of assessment of internal control.
5. Special Notes We prepared this Internal Control Report in accordance with the terms, form and procedures required
in the management’s report on internal control over financial reporting in the U.S. since we register our American Depositary Shares (“ADSs”) to the U.S. Securities and Exchange Commission (“SEC”). On April 27, 2012, we applied to the SEC for termination of registration of our ADSs. We anticipate that the registration will be terminated on July 26, 2012.

A-3
[Cover]
[Document Filed] Confirmation Letter
[Applicable Law] Article 24-4-2, Paragraph 1 of the Financial Instruments and Exchange Act of
Japan
[Filed to] Director, Kanto Local Finance Bureau
[Filing Date] June 22, 2012
[Company Name] Kabushiki Kaisha Hitachi Seisakusho
[Company Name in English] Hitachi, Ltd.
[Position and Name of
Representative]
Hiroaki Nakanishi, President
[Name and title of CFO] Toyoaki Nakamura, Executive Vice President and Executive Officer
[Address of Head Office] 6-6, Marunouchi 1-chome, Chiyoda-ku, Tokyo
[Place Where Available for
Public Inspection]
Tokyo Stock Exchange, Inc.
(2-1, Nihombashi Kabutocho, Chuo-ku, Tokyo)
Osaka Securities Exchange Co., Ltd.
(8-16, Kitahama 1-chome, Chuo-ku, Osaka)
Nagoya Stock Exchange, Inc.
(8-20, Sakae 3-chome, Naka-ku, Nagoya)

A-4
1. Matters Related to Adequacy of Statements Contained in the Annual Securities Report Mr. Hiroaki Nakanishi, President, and Mr. Toyoaki Nakamura, Executive Vice President and
Executive Officer, confirmed that statements contained in the Annual Securities Report for the 143rd fiscal year (from April 1, 2011 to March 31, 2012) were adequate under the Financial Instruments and Exchange Act.
2. Special Notes
None.