Annual Review 2014 - SIBUR – Investor...
241
Annual Review 2014 FROM VISION TO REALITY
Transcript of Annual Review 2014 - SIBUR – Investor...

Annual Review 2014FROM VISION TO REALITY

Introduction Value Chain Business Overview Sustainability Corporate Governance Financial information
02SIBUR 2014 Annual Review
EXCELLENT FINANCIALS
USD 9.4 bln
USD 2.7 bln
revenue
EBITDA
32.2%EBITDA margin(1)
GROWING FEEDSTOCK PROCESSING & PRODUCTION
2.6x
20.1%
PP production y-o-y increase to 395.3 kt
raw NGL fractionation volumes y-o-y increase to 6.3 mt
27.8%LPG production(2)
y-o-y increase to 5.1 mt
SIBUR is Russia’s largest integrated gas processing and petrochemicals company. We are building a strong, internationally competitive and resilient business with unique advantages and opportunities for profitable growth.
We process natural resources in an environmentally sustainable way to produce energy products and petrochemicals demanded by manufacturers to deliver high-quality goods to businesses and consumers. We are a major engine of employment and professional, technological and economic development in the regions and communities where we operate.
SIBUR is building a culture of excellence, integrity and teamwork. We continuously strive to adopt global standards and best practices, recognising that corporate governance, transparency and environmental and social responsibility are the foundations of a successful and sustainable business.
26 production sites in Russia
Over 25,000 employees
Over 1,400 large customersfrom 75 countries representing diverse range of end-customer industries
SIBUR plays a vital role in the country’s economic transformation and the modernisation of its industrial base. In 2014, we completed a major multi-year investment programme to scale our opportunities, drive the benefits of vertical integration and position the Company for its next leg of profitable growth. We have built an integrated value chain that brings together:
Unique feedstock advantages and partnership with oil and gas producers;
An extensive end-to-end transportation network;
World-class gas processing and petrochemicals production facilities;
Access to attractive end markets in Russia and internationally.
COMFORTABLE DEBT LEVEL
1.19x
1.74x
net debt to EBITDA as of 31 Dec’14(in USD terms)
net debt to EBITDA as of 31 Dec’14(in RR terms)
(1) Excluding naphtha trading operations via Ust-Luga transshipment facility, ceased in 2015.(2) Including production volumes under processing arrangements.
SIBUR in 2014

SIBUR in 2014
03SIBUR 2014 Annual Review
INTRODUCTION
Chairman StatementCEO Letter2014 Highlights
VALUE CHAIN
SIBUR’s Value Chain – From Vision to RealityGeographic FootprintBusiness Model
BUSINESS OVERVIEW
Production FlowsProducts and MarketsFeedstock SourcingTransportation and LogisticsSIBUR Production System
SUSTAINABILITY
Our CommitmentEnvironmentHealth & SafetyEmployeesCommunities and Society
CORPORATE GOVERNANCE
Board of DirectorsBoard CommitteesManagement BoardEquity-Settled Share-Based Payment PlansShare CapitalDividendsRisk Management
FINANCIAL INFORMATION
Management’s Discussion and Analysis of Financial Condition and Results of Operations (MD&A)IFRS Consolidated Financial Statements
ADDITIONAL INFO
04
060710
14
162628
30
3436545658
60
6263707278
82
87102104
108108109110
118
120
174
REVENUE SPLIT BY PRODUCT
Energy products
Petrochemicals
Other
60%37%3%
1
2
3
2
3
1
REVENUE SPLIT BY MARKET
2
4 53
1
Russia
Europe
Asia
CIS
OtherRevenue from trading operations, ceased in 2015
Revenue from trading operations, ceased in 2015
49%36%8%6%1%
1
2
3
4
5
VERTICALLY INTEGRATED BUSINESS MODEL
Petrochemical products
Intermediates
Plastics & organic synthesis plants
Synthetic rubber plants
Basic polymerplants
Railway loading racks
Steam cracker PDH facility
Transportation infrastructure
PipelinesLPG and naphtha
transshipment facilityRail cars and
tank wagons
Gas processing/fractionation
GPPs
Compressor stations
GFUs
External sourcing of hydrocarbon feedstockWeighted average maturity of our multi-year supply contracts:
16.4 years for APG
17.9 years for NGLs
FEEDSTOCK AND ENERGY
EBITDA: USD 2,299 mln
EBITDA margin(1): 41.8%
7 GPPs - 23 bcmpa of APG
3 GFUs - 8 mtpa of raw NGL
2,995 km pipelines
6 railway loading racks
23,719 rail cars and tankwagons
PETROCHEMICALS
EBITDA: USD 542 mlnEBITDA margin: 14.6%
2 basic polymer plants: 875 ktpa3 synthetic rubber plants:573 ktpa13 plastics & organic synthesis plants:1,045 ktpa
(1) Excluding naphtha trading operations via Ust-Luga transshipment facility, ceased in 2015.
OUR WEBSITE
http://investors.sibur.com
Oil-based feedstock(APG)
Gas-based feedstock(NGLs)

Introduction Value Chain Business Overview Sustainability Corporate Governance Financial information
04SIBUR 2014 Annual Review

Introduction
Chairman Statement
CEO Letter
2014 Highlights
Tobolsk-Polymer polypropylene production complex
Content
05SIBUR 2014 Annual Review

Introduction Value Chain Business Overview Sustainability Corporate Governance Financial information
06SIBUR 2014 Annual Review
Chairman Statement
LEONID MIKHELSON
Chairman of the Board of Directors
This was a pivotal year for our strategy to build a world-class integrated gas processing and petrochemicals leader. I am proud to report that we have delivered on all of our key objectives for the multi-year investment cycle completed in 2014 – and the results are evident in our performance.
Our vision for the past several years has been to monetise SIBUR’s most fundamental advantage – access to abundant, attractively priced supplies of Western Siberian feedstock.
Each of our investment projects was conceived as part of a strategic value chain, linking flows of feedstock raw materials to an extensive processing and
transportation infrastructure with the objective of expanding production volumes and profitable growth in domestic and international markets.
This vision is now a reality. The launch and ramp-up of our new pipeline, production and export facilities made possible by the successful completion of strategic projects in 2014 contributed significantly to our growth and profitability. And our increased scale and integration open up large new untapped opportunities for buildingour leadership and generating returns well above the petrochemicals industry average.
Our focus now is to reap the rewards of our investments in 2015 and beyond. The macro environment remains challenging but our performance demonstrates that we have the right business model, the right strategy and that our long-term perspective is paying off.
We also continue to take a longer term view of value creation through increased scale and integration across our business and opportunities to further monetise our feedstock advantage. To that end, in 2014 we approved the ZapSibNeftekhim (ZapSib-2) multi-year investment project to expand petrochemicals production at our world-class integrated complex in Tobolsk.
My number one message is therefore one of optimism and confidence. I would like to thank SIBUR’s management team and employees for delivering strong financial performance and attaining our strategic milestones. We are building a culture of excellence, integrity and teamwork, and are excited about our Company’s opportunities for the future.

Chairman Statement & CEO Letter
07SIBUR 2014 Annual Review
CEO Letter
DMITRY KONOV
CEO and Chairman of the Management Board
I am pleased to report that SIBUR delivered strong financial performance in 2014 despite a difficult external environment. The arising deterioration of the economic situation in Russia, substantial depreciation of the rouble and a steep decline in global energy prices were a critical test of our endurance.
The perfect storm proved our strategy right. We delivered the Group revenue growth of 34% to RR 361 billion in 2014, or 11% growth in US dollar terms. EBITDA grew by 30% to RR 103 billion, equivalent to an increase of 8% in US dollars. This resulted in an adjusted Group EBITDA margin of 32.2%(1), compared to a 29.2% EBITDA margin in 2013.
SIBUR’s healthy growth and sustained high margins demonstrated the power of our business model in action.
Our increased scale with the ramp-up of new production and transportation infrastructure from completed strategic projects drove our growth. At the same time, SIBUR’s vertically integrated business model enabled us to capture value while offsetting volatility in our key markets.
These trends are evident when looking at our two business segments. In our feedstock and energy business, we vastly increased our capacity to transport and process feedstock and grew LPG exports to newly accessible Western European markets. 2014 was also a breakthrough year for our petrochemicals business, which emerged as an important growth engine for the bottom line thanks to the successful ramp-up of our world-class production complex in Tobolsk.
Looking at SIBUR today, I see a business that is strongly positioned with unique competitive advantages,increasing scale and integration benefits and expanded opportunities for profitable growth. But it is also one that has proven its resilience in bad times. These themes were critical to our success in 2014, and they remain essential elements of our long-term strategy for value creation.
SIBUR’S VALUE CHAIN – FROM VISION TO REALITY
Our multi-year investment programme represents the largest expansion of Russia’s gas processing and petrochemicals infrastructure in decades. Its completion marks a fundamental evolution of our business as we turn to reaping the rewards of these investments. In 2014, SIBUR’s strategy to build an integrated gas processing and petrochemicals leader was validated by our robust financial performance, as the strong results of our expanded petrochemicals business offset the downward pressures on feedstock and energy profitability.
In 2014, we launched the several critical links of our value chain while ramping up commercial operations of other strategic projects that were completed in the previous year. In our feedstock and energy business, this included the opening of the new 1,100 km Purovsk–Pyt-Yakh–Tobolsk pipeline, which provides SIBUR with access to additional available volumes of raw NGL in the northern part of Western Siberia.
(1) Adjusted for low-marginal naphtha trading operations via Ust-Luga transshipment facility, ceased in 2015.
Introduction Value Chain Business Overview Sustainability Corporate Governance Financial information
08SIBUR 2014 Annual Review
The launch was synchronised with the opening of our second gas fractionation unit in Tobolsk, substantially expanding our capacity towards the end of the year.
For 2014 as a whole, SIBUR grew raw NGL feedstock processing volumes by 20%, which enabled a 28% increase in LPG production. These volumes then contributed to an increase in LPG exports to Western Europe through the Ust-Luga transshipment facility, opened in 2013 with the capacity to ship 2.5 million tonnes of light oils and 1.5 million tonnes of LPG per annum in accordance with European Union standards.
We expect continued growth in feedstock and energy production and sales volumes in the coming year as most of the new feedstock supplies and processing capacity came on stream only as of the fourth quarter of 2014. And I would like to underscore that thanks to our integrated Tobolsk complex, this substantial growth in feedstock volumes also powers our growth in petrochemicals.
The strategic progress of our petrochemicals business segment in 2014 was marked by the ramp-up of production at Tobolsk-Polymer, a major new polypropylene production facility with nameplate capacity of 500,000 tonnes per annum. Average capacity load for the year was 53% and utilisation reached 91% in the fourth quarter of 2014. This drove a nearly threefold increase in polypropylene production volumes, with more to come in 2015.
Growth of petrochemicals productionin 2014 also benefited from the launch and commercial ramp-up of several other strategic projects. These included steam cracker upgrade in Kstovo, PET capacity expansion in Blagoveshchensk, new BOPP-films production in Tomsk and Novokuybyshevsk, and SBS production in Voronezh.
EXCELLENCE IN STRATEGIC PROJECT EXECUTION
Our experience in executing strategic projects has resulted in a significant infusion of global best practices and technologies into the Russian market. Our Tobolsk complex is the largest and technologically most advanced project in the Russian petrochemicals industry of the last several years. Its successful launch demonstrated SIBUR’s engineering and project management expertise.
These skills were also on display in the construction and successful launch of the industry’s other major new facility in 2014, the RusVinyl PVC 50/50% joint venture with SolVin Holding Nederland B.V. located in Kstovo, Nizhniy Novgorod region. The new complex comprises a polyvinyl chloride (PVC) plant with an annual capacity of 330,000 of PVC and 225,000 of caustic soda. Feedstock for PVC production at the complex is supplied to the joint venture by SIBUR’s wholly owned steam cracker, which we upgraded to increase ethylene production capacity from 300,000 to 360,000 tonnes per annum.
In September, SIBUR’s Board of Directors approved a major new multi-year project – greenfield construction of the ZapSibNeftekhim(ZapSib-2) ethylene cracking unit and polyolefin production complex within the SIBUR’s Tobolsk petrochemical hub. Project parameters and timelines have been revised to reflect conservative macroeconomic forecasts and meet our financial thresholds. Major contractors were engaged to commence initial stages of construction and we also secured EUR 1.6 billion in committed credit lines for equipment purchases. Our team’s experience and know-how in executing large-scale projects like Tobolsk-Polymer and RusVinyl reinforces our confidence in proceeding with ZapSib-2.
PARTNERSHIP WITH OIL & GAS COMPANIES
Our partnership with major Russianoil and gas producers gives us significant competitive advantages to support our global growth strategy and ability to generate strong financial returns. We have continued to strengthen SIBUR’s access to feedstock through long-term supply contracts with our partners. At the end of 2014, feedstock contracts had weighted average maturities of more than 16 years for APG and nearly 18 years for NGLs.
In March 2014, we revised our format and terms of cooperation with Rosneft with a new agreement that delivers value and efficiency benefits for both companies.
CEO Letter(continued)

CEO Letter
09SIBUR 2014 Annual Review
SIBUR purchased Rosneft’s 49% stake in the Yugragazpererabotka joint venture, giving us full control of its gas processing plants in exchange for commitments by SIBUR to process APG from Rosneft fields and guaranteed supply of APG feedstock to SIBUR through 2032.
I want to underscore SIBUR’s positive impact across the oil and gas industry as a whole. Our extensive infrastructure gives our partners an efficient solution for handling feedstock by-products of oil and gas extraction and an environmentally beneficial alternative to on-field flaring. By processing APG into energy products and petrochemicals, SIBUR enables its partners to earn cash while preventing the release of nearly seven million tonnes of harmful emissions into the atmosphere.
ENVIRONMENTAL AND SOCIAL RESPONSIBILITY
Our goal is not just to operate as a responsible business and reduce risk, but to foster innovation, create a culture of excellence, and deliver benefits for employees, surrounding communities and business partners. A key focus of our modernisation programme has been to drive major improvements in environmental and safety performance.
At each of our production facilities,we have been implementing annualand long-term environmental protection programmes in order to reduce the impact of our operations. Replacement of obsolete equipment and infrastructure and our investments in world-class production facilities and environmental technologies has contributed to substantial improvements in water, air, waste and energy metrics as reported in the Sustainability section of this Annual Review.
We are building a culture where the safety of our employees and communities is everyone’s business. I am proud to say that we had zero fatalities or industrial accidents in 2014. Modern facilities and a focus on continuous improvement and training are prerequisites for delivering on our company-wide commitment to health and safety.
SIBUR is also building a corporate culture where every individual is expected to perform and everyone has opportunities for leadership. Our overarching goal is a workforce where people are determined to deliver success, strive for professional growth, share knowledge and work together as a team. This spirit makes us a stronger competitor and I would like to thank our more than 25,000 employees for their dedication and hard work to make this a successful year.
SIBUR’S NEXT LEG OF GROWTH
SIBUR’s strategy was validated by our strong financial performance last year. The notable trend was increased scale and integration across our business with growth opportunities for our feedstock and energy business coming on stream towards the end of the year and the emergence of petrochemicals as a powerful growth engine for the bottom line.
These achievements have set the stage for continued progress as we reap the gains of our investments during 2015. Looking to the future, we operate in cyclical commoditiesmarkets and are not immune to external shocks, to be sure, but 2014 results demonstrate we are building a more durable and valuable enterprise. With the completion of our investment cycle, our objective is to generate more value from our unique assets and deliver on SIBUR’s next leg of growth.

Introduction Value Chain Business Overview Sustainability Corporate Governance Financial information
10SIBUR 2014 Annual Review
2014 Highlights
SIBUR’S STRATEGY WAS VALIDATED BY OUR STRONG FINANCIAL PERFORMANCE THIS YEAR.
(1) Adjusted for foreign exchange loss due to the rouble depreciation and the respective revaluation of liabilities, gains on consolidation and deconsolidation of Yugragazpererabotka, and charges related to the equity-settled share-based payment plans.
(2) Source: Russian Federal State Statistics Service, Eurostat, National Bureau of Statistics of the People’s Republic of China.
adjusted profit(1) y-o-y increase
The notable trend was increased scale and integration across our Company with growth opportunities for our feedstock and energy business coming on stream towards the end of the year and the emergence of petrochemicals as a powerful growth engine for the bottom line.
MACRO ENVIRONMENT
In 2014, the macroeconomic environment substantially deteriorated on the back of the sharp decline in oil prices and the significant depreciation of the Russian rouble. The slowdown in the Russian economy continued, with GDP growth of 0.6%(2) compared to 1.3%(2) in 2013 according to government statistics, while consumer and producer price inflation rates nearly doubled year-on-year. Growth in our two main export markets was mixed, with European Union GDP improving but sluggish at 1.2%(2) and China’s economy slowing to a 7.4%(2)
growth rate.
SIBUR also experienced a declining price environment for most of its products. Global oil shocks triggered average energy product price declines in the high single digits to low double digits year-on-year depending on the product.
We benefited from higher natural gas selling prices in Russia due to the 7.4% year-on-year average indexation of regulated prices. In our petrochemicals business, prices for synthetic rubbers and plastics & organic synthesis products experienced sharp double digit declines, while prices for basic polymers were essentially flat.
In this environment SIBUR’s financial results were supported by the depreciation of Russian rouble. The rouble weakened relative to the US dollar by 20.6% on average over the course of 2014 and by 71.9% at the December year-end. Since SIBUR generally earns revenues from commodities priced in US dollars based on international benchmarks, while its operating costs are largely denominated in roubles, our underlying business performance largely benefited from rouble depreciation in 2014.
2014 FINANCIAL PERFORMANCE
Against this negative backdrop, SIBUR delivered strong financial performance in 2014. Group revenue increased 33.8% to RR 361 billion, or 10.9% growth in US dollar terms. If adjusted for the discontinued in 2015 low-marginal naphtha trading operations, total Group revenue increased 18.4% in Russian rouble terms.
30.3%
8.0%
EBITDA y-o-y increase in roubles
EBITDA y-o-y increase in US dollars
26.5%

2014 Highlights
11SIBUR 2014 Annual Review
EBITDA grew by 30.3% to RR 103 billion – the highest score in SIBUR history. This is an equivalent to a healthy increase of 8.0% in US dollars, which was driven by threefold growth in the EBITDA of our petrochemicals segment, as well as the higher contribution of our feedstock & energy segment.
This resulted in a total Group EBITDA margin of 28.5% in 2014, or 32.2% adjusted to exclude naphtha trading activities discontinued in 2015, compared to a 29.2% EBITDA margin in 2013.
SIBUR’s revenue and EBITDA growth in rouble terms benefited from the depreciation of the rouble in 2014. At the level of net profit,however, we recorded a 44.8% decrease year-on-year due to foreign exchange effects under IFRS reporting in Russian roubles. In particular, we recorded RR 85.4 billion in foreign exchange loss due to the revaluation of our liabilities primarily denominated in US dollars to match the currency structure of our revenues. Net of one-off non-cash factors(1) our net profit increased 26.5% to RR 69.3 billion.
FEEDSTOCK AND ENERGY SEGMENT
Our feedstock and energy segment remained by far the largest contributor to overall performance. Segment gross revenue grew by 47.4% to RR 253 billion. If adjusted for the low-marginal naphtha trading operations discontinued in 2015, segment revenue increased by 23.2%.
Growth was driven by a number of factors including higher hydrocarbonfeedstock processing volumes, as well as higher natural gas sales volumes due to the full consolidationof Yugragazpererabotka as of March 2014. In 2014, we processed 20.8(2)
billion cubic metres of APG, an increase of 6.3%(2) year-on-year. We also launched an expanded and upgraded integrated feedstock processing and transportation infrastructure in Western Siberia. This enabled a 20.1%(3) increase in raw NGL fractionation volumes to 6.3(3) million tonnes. These factors drove an increase in external sales volumes of LPG of 16.2% to 3.5 million tonnes and of natural gas sales volume of 35.2% year-on-year to 16.0 billion cubic metres.
Profitability, however, was impacted by lower energy product prices in US dollars. Feedstock and energy EBITDA increased 13.9% to RR 88.3 billion, but EBITDA margin declined from 45.2% in 2013 to 41.8%(4) in 2014.
(1) Foreign exchange loss due to the rouble depreciation and the respective revaluation of liabilities, gains on consolidation and deconsolidation ofYugragazpererabotka, and charges related to the equity-settled share-based payment plans.
(2) Including Rosneft’s share in processing volumes of Yugragazpererabotka in 2013 and the first quarter 2014.(3) Including fractionation volumes under processing arrangements. Approach to the treatment of raw NGL production and fractionation volumes at
Nyagan GPP was changed following the acquisition of control in Yugragazpererabotka in March 2014.(4) Excluding naphtha trading operations via Ust-Luga transshipment facility, ceased in 2015.
13.9%
41.8%
20.1%
feedstock & energy segmentEBITDA y-o-y increase
feedstock & energy segmentEBITDA margin(4)
raw NGL fractionation volumes(3)
y-o-y increase to 6.3 mt

Introduction Value Chain Business Overview Sustainability Corporate Governance Financial information
12SIBUR 2014 Annual Review
2014 Highlights2014 Highlights(continued)
PETROCHEMICALS SEGMENT
Petrochemicals gross segment revenue grew 10.9% year-on-year to RR 142.3 billion, while EBITDA nearly tripled to RR 20.8 billion and EBITDA margin improved from 5.9% in 2013 to 14.6% in 2014.
The main drivers were strong growth in volumes and sales from our expanded production capacity – which took market share in Russia by displacing more expensive imports. This strong performance was achieved despite a tough environment for synthetic rubbers, plastics and organic synthesis products and flat prices for polymers.
In particular, petrochemicals products sales volumes increased 5.6% to 2.2 million tonnes. This was achieved thanks to a nearly threefold increase in polypropylene production to 395,309 tonnes due to the ramp-up of Tobolsk-Polymer. Plastics & organic synthesis sales volumes increased 2.4%, benefiting from capacity expansions including a 45.2% increase in PET production to 279,920 tonnes and BOPP-film production growth of 25.6% to 120,386 tonnes. In intermediates, we began to supply ethylene to our RusVinyl joint venture, which we expect to become a reliable source of cash flow. However, these increases were offset by declines in glycols production due to extended shutdowns, and the divestment of Plastic and PVC cable compounds production. In addition, synthetic rubber sales volumes declined 16.3% to 360,038 tonnes due to challenging market conditions.
2.7X
14.6%
5.6%
petrochemicals segment EBITDA y-o-y increase
petrochemicals segment EBITDA margin
petrochemicals sales volumes y-o-y increase to 2.2 mt

2014 Highlights
13SIBUR 2014 Annual Review
Importantly, declining prices for our feedstock and energy products also resulted in lower input costs for our petrochemicals segment. This was one of the key drivers of petrochemicals EBITDA performance and provides a clear demonstration of the benefits of vertical integration.
FINANCIAL STRENGTH
SIBUR was strongly cash generative in 2014. Cash from operations increased 25.2% to RR 91.1 billion, equivalent to a 3.8% increase in US dollar terms. Before working capital changes, operating cash flow increased 35.2% year-on-year. Meanwhile capital expenditures decreased 3.3% to RR 67.7 billion as the result of completion of large-scale projects.
Debt reported on our balance sheet at 31 December 2014 was inflated by rouble depreciation effects. This resulted in a 93.1% increase in net debt to RR 178.6 billion and a net debt to EBITDA ratio of 1.74x compared to 1.17x as of 2013 year-end under IFRS reporting.
Looked at in US dollar terms, SIBUR’s net debt to EBITDA would have been 1.19x as of 2014 year-end, or virtually identical to our leverage ratio a year earlier. We believe this offers a truer picture of our financial position, since we generate EBITDA mainly based on products priced in US dollars, and in addition, a large portion of the Group’s debt is also US dollar-denominated.
The levels reported on the Group’s balance sheet remain well within the limits set by our financial policy. Our strong cash flow from operating activities, declining capital expenditures in US dollar terms and new EUR 1.6 billion line of credit for construction of ZapSibNeftekhim (ZapSib-2) make clear SIBUR’s financial strength.
Please refer to the Management’s Discussion and Analysis and Financial Statements sections of this Annual Review for detailed information on SIBUR’s 2014 performance.
25.2%operating cash flow
y-o-y increase
1.19x
net debt to EBITDA as of 31 Dec’14(in USD terms)

Introduction Value Chain Business Overview Sustainability Corporate Governance Financial information
14SIBUR 2014 Annual Review

Value Chain
SIBUR’s Value Chain – From Vision to Reality
Geographic Footprint
Business Model
Voronezhsintezkauchuk
Content
15SIBUR 2014 Annual Review

Introduction Value Chain Business Overview Sustainability Corporate Governance Financial information
16SIBUR 2014 Annual Review
From Vision to Reality SIBUR’s Value Chain
SIBUR’S VISION OVER THE PAST SEVERAL YEARS HAS BEEN TO SCALE OUR OPPORTUNITIES AND BUILD A VALUE CHAIN THAT
BRINGS TOGETHER FOUR KEY ELEMENTS:
THAT VISION IS NOW A REALITY.
Unique feedstock advantages
Extensive end-to-end transportation network
World-class gas processing and petrochemical facilities
Growth in attractive end markets
Over the past six years, we have invested RR 337 billion to build the key components of this integrated whole, and we are proud to say we delivered on all of our commitments. This section of our Annual Review discusses how we will reap the benefits of these investments to position SIBUR as a strong, fast-growing and resilient company.
As we drive near-term performance, we are also focused on longer term opportunities. To that end, SIBUR’s Board of Directors approved a major new multi-year project – the construction of the ZapSibNeftekhim (ZapSib-2) petrochemical facility at our flagship Tobolsk complex – to further monetise our feedstock advantage, leverage the benefits of our scale and integration, and sustain our opportunities for leadership and growth.
2014 has been a transformative year for SIBUR. The successful completion of our multi-year investment programme marks a fundamental evolution of our business and the beginning of our next leg of growth.
With the launch of several major strategic assets we have attained an important milestone in building an integrated value chain that over the coming years will enable:
Unmatched competitive advantages and growth opportunities in Russia and globally;
Expanded access to supplies of abundant, attractively priced feedstock from new sources in Western Siberia as the basic raw material for growing our business;
Significantly increased processing and production capacity to drive growth of production volumes and sales of energy and petrochemical products in both domestic and export markets;
Extensive infrastructure that provides major economies of scale and barriers to entry and positions SIBUR among the lowest cost operators in the world;
A balanced, flexible business able to generate financial returns well above the global petrochemicals industry average.
1
2
3
4

From Vision to Reality - SIBUR’s Value Chain
17SIBUR 2014 Annual Review
2. Extensive, upgraded transportation infrastructure to enable increased flows
Purovsk – Pyt-Yakh – Tobolsk pipeline with up to 8 mtpa annual capacity opened as part of upgraded 2,995 km pipeline network to increase feedstock flows to Tobolsk;
Ramp up of new Ust-Luga transshipment facility with capacity of 1.5 mpta of LPG and 2.5 mpta of light oils for growth of higher margin exports to European markets.
3. World-сlass Tobolsk integrated energy product and petrochemicals complex
Second GFU nearly doubles raw NGL processing capacity to enable vast increases in production of LPG for export growth and a feedstock for petrochemicals growth;
Launch of Tobolsk-Polymer, largest polypropylene complex in Russia, CIS and Eastern Europe, with annual capacity of 500,000 tonnes driving major growth in production;
Decision to proceed with ZapSibNeftekhim (ZapSib-2) greenfield ethylene, polyethylene and polypropylene production site in Tobolsk as part of longer term growth strategy.
4. Opportunities for growth and leadership in attractive end markets
Over 1,400 large customers from 75 countries in a wide range of industries;
Increased opportunities for higher margin exports of energy products and growth as a globally cost-competitive petrochemicals producer;
Growing share of the Russian domestic marketplace driven by import substitution and projected growth in consumption.
1. Access to abundant, attractively priced feedstock stranded in Western Siberia
Long-term supply contracts with the major Russian oil and gas producers for APG and NGLs feedstock;
Ability to monetise abundant new sources of raw NGL feedstock in northern parts of Western Siberia through newly launched transportation and processing infrastructure.
THE COMPLETION OF OUR MULTI-YEAR INVESTMENT CYCLE AND COMMERCIAL RAMP-UP OF STRATEGIC PROJECTS IN 2014
CREATES A POWERFUL INTEGRATED PLATFORM FOR MONETISING SIBUR’S ADVANTAGES.

Introduction Value Chain Business Overview Sustainability Corporate Governance Financial information
18SIBUR 2014 Annual Review
From Vision to Reality SIBUR’s Value Chain (continued)
1. Access to abundant, attractively priced feedstock stranded in Western Siberia
Our vision for the past several years has been to monetise SIBUR’s most fundamental advantage – access to abundant, attractively priced supplies of Western Siberian feedstock – as the basis for growing our energy products and petrochemicals business. We have invested in the most extensive infrastructure for transporting and processing APG and NGLs feedstock to secure this access and make SIBUR an essential partner for the major Russian oil and gas producers.
Western Siberia has abundant sources of hydrocarbon by-products of the oil and gas extraction process that are difficult for energy companies to use commercially and are thus effectively stranded in the region.
SIBUR has multi-year contracts with oil and gas partners to take these raw materials to produce energy products and petrochemicals. In addition to the cash they generate from supplying feedstock to SIBUR, processing of APG provides our partners with an alternative solution to harmful on-field flaring. In 2014, this prevented the release of more than seven million tonnes of pollutants into the atmosphere.
We continued to cement our long-term access to feedstock in 2014 by agreeing on a new format and terms of cooperation with Rosneft. SIBUR acquired from Rosneft a 49% interest in the joint venture Yugragazpererabotka to gain full ownership of its gas processing plants.
New contracts with an extended tenor through the end of 2032 were signed for APG supplies from Rosneft’s fields with guaranteed supply volumes of approximately 10 billion cubic metres per annum, and natural gas sales from the GPPs to Rosneft.
In addition, SIBUR captured major new flows of raw NGL feedstock from wet gas production in northern parts of Western Siberia in 2014 with the opening of new pipeline and processing capacity.

From Vision to Reality - SIBUR’s Value Chain
19SIBUR 2014 Annual Review
2014 KEY FACTS(1)
(1) As of 31 December 2014.(2) Including fractionation volumes under processing arrangements.
APG NGLs
Purovsk - Pyt-Yakh - Tobolsk raw NGL pipeline
7
20.8 bcm
GPPs
processed volumes
6.3 mt
raw NGL fractionated volumes(2)
Key suppliers:
Key suppliers:
92%
16.4 years
weighted average maturity of our multi-year APG supply contracts
Rosneft, Gazprom neft, RussNeft, LUKOIL
NOVATEK, Gazprom, LUKOIL
of our planned APG supplies for 2015 guaranteed under multi-year
supply contracts
17.9 YEARS
80%
weighted average maturity of our multi-year NGLs supply contracts
of our planned NGLs supplies for 2015 guaranteed under multi-year
supply contracts

Introduction Value Chain Business Overview Sustainability Corporate Governance Financial information
20SIBUR 2014 Annual Review
From Vision to Reality SIBUR’s Value Chain (continued)
2. Extensive, upgraded transportation infrastructure to enable increased flows
SIBUR operates the largest and most extensive feedstock transportation and processing infrastructure in Western Siberia. This gives us unmatched economies of scale and competitive barriers to entry. We operate 7 of the region’s 9 gas processing plants and our network includes thousands of kilometers of pipelines as well as railway facilities, loading racks and rolling stock needed to bring raw materials to our production facilities and products to end markets.
In 2014, we completed major enhancements to support the growth of our energy products and petrochemicals businesses. Most significant is the 1,100 kilometre Purovsk – Pyt-Yakh – Tobolsk pipeline opened in 2014. Built to coincide with major expansions of production capacity at our Tobolsk complex, the pipeline physically links Tobolsk with supplies of raw NGL feedstock that have risen significantly due to the growth in wet gas production in the northern regions of Western Siberia.
Transportation infrastructure opened in the past two years enabled increased production volumes and flows to end markets. In particular, our Ust-Luga transshipment facility, opened in 2013 with the capacity to ship 2.5 million tonnes of light oils and 1.5 million tonnes of LPG per annum in accordance with European Union standards accommodated a significant increase in exports to Western Europe made possible by the 28% growth in LPG production.

From Vision to Reality - SIBUR’s Value Chain
21SIBUR 2014 Annual Review
2014 KEY FACTS(1)
(1) As of 31 December 2014.
Ust-Luga transshipment facility
62,995 km
pipeline network for APG, natural gas and raw NGL supplies
railway loading racks
23,719rail cars and tank wagons under
management
Introduction Value Chain Business Overview Sustainability Corporate Governance Financial information
22SIBUR 2014 Annual Review
From Vision to Reality SIBUR’s Value Chain (continued)
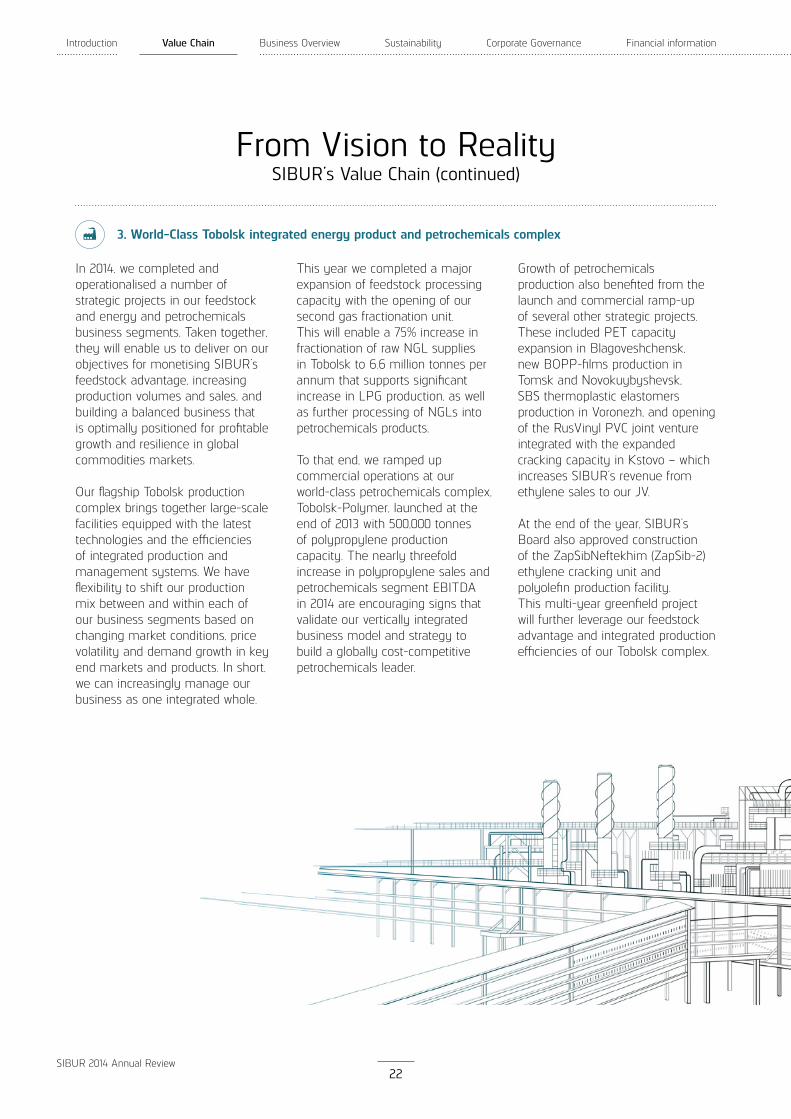
3. World-Class Tobolsk integrated energy product and petrochemicals complex
In 2014, we completed and operationalised a number of strategic projects in our feedstock and energy and petrochemicals business segments. Taken together, they will enable us to deliver on our objectives for monetising SIBUR’s feedstock advantage, increasing production volumes and sales, and building a balanced business that is optimally positioned for profitable growth and resilience in global commodities markets.
Our flagship Tobolsk production complex brings together large-scale facilities equipped with the latest technologies and the efficiencies of integrated production and management systems. We have flexibility to shift our production mix between and within each of our business segments based on changing market conditions, price volatility and demand growth in key end markets and products. In short, we can increasingly manage our business as one integrated whole.
This year we completed a major expansion of feedstock processing capacity with the opening of our second gas fractionation unit. This will enable a 75% increase in fractionation of raw NGL supplies in Tobolsk to 6.6 million tonnes per annum that supports significant increase in LPG production, as well as further processing of NGLs into petrochemicals products.
To that end, we ramped up commercial operations at our world-class petrochemicals complex, Tobolsk-Polymer, launched at the end of 2013 with 500,000 tonnes of polypropylene production capacity. The nearly threefold increase in polypropylene sales and petrochemicals segment EBITDA in 2014 are encouraging signs that validate our vertically integrated business model and strategy to build a globally cost-competitive petrochemicals leader.
Growth of petrochemicals production also benefited from the launch and commercial ramp-up of several other strategic projects. These included PET capacity expansion in Blagoveshchensk, new BOPP-films production in Tomsk and Novokuybyshevsk, SBS thermoplastic elastomers production in Voronezh, and opening of the RusVinyl PVC joint venture integrated with the expanded cracking capacity in Kstovo – which increases SIBUR’s revenue from ethylene sales to our JV.
At the end of the year, SIBUR’s Board also approved construction of the ZapSibNeftekhim (ZapSib-2) ethylene cracking unit and polyolefin production facility. This multi-year greenfield project will further leverage our feedstock advantage and integrated production efficiencies of our Tobolsk complex.

From Vision to Reality - SIBUR’s Value Chain
23SIBUR 2014 Annual Review
2014 KEY FACTS
(1) Including production volumes under processing arrangements.
27.8% 2.6x
25.6%
LPG production y-o-y increase to 5.1 mt(1)
PP production y-o-y increase to 395.3 kt
First ethylene supplies
from steam cracker facility in Kstovo to RusVinyl
5.6%petrochemicals products sales
volumes y-o-y increase to 2.2 mt
45.2%PET production
y-o-y increase to 279.9 ktBOPP-film production
y-o-y increase to 120.4 kt
Tobolsk-Polymer polypropylene production complex
Introduction Value Chain Business Overview Sustainability Corporate Governance Financial information
24SIBUR 2014 Annual Review
From Vision to Reality SIBUR’s Value Chain (continued)
4. Opportunities for growth and leadership in attractive end markets
(1) Excluding naphtha trading operations via Ust-Luga transshipment facility, ceased in 2015.(2) Source: IHS, Market Report, IISPR.
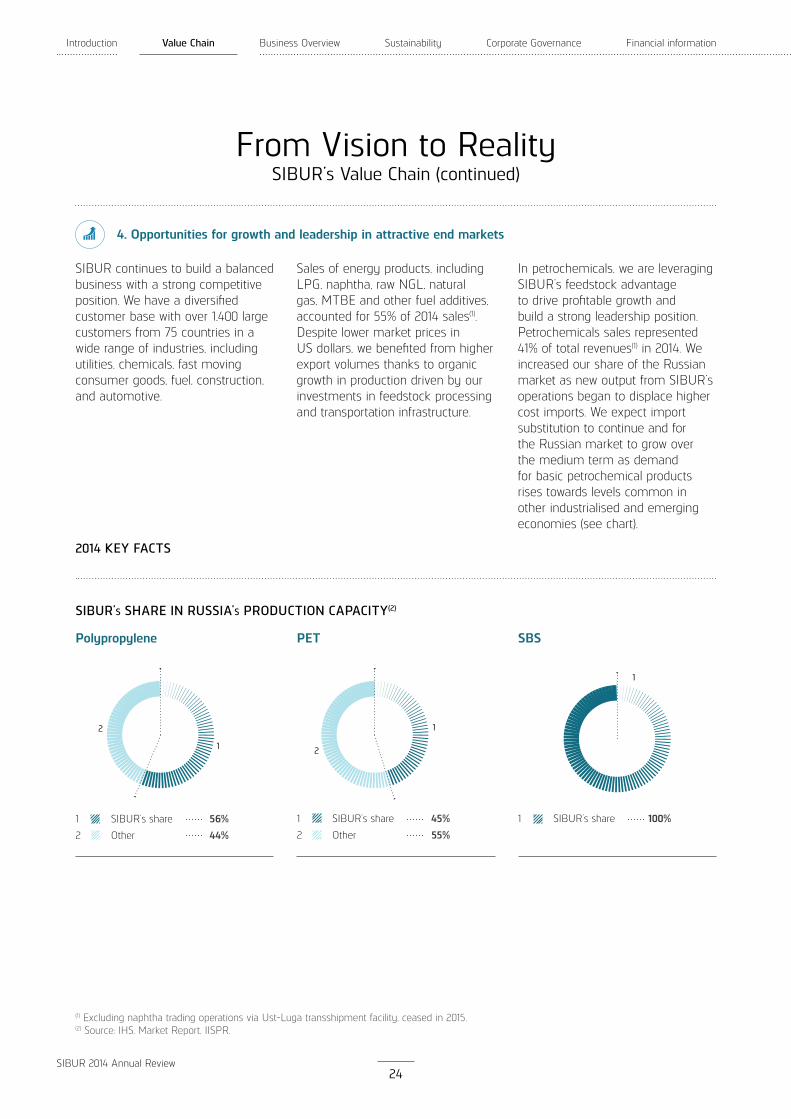
SIBUR continues to build a balanced business with a strong competitive position. We have a diversified customer base with over 1,400 large customers from 75 countries in a wide range of industries, including utilities, chemicals, fast moving consumer goods, fuel, construction, and automotive.
In petrochemicals, we are leveraging SIBUR’s feedstock advantage to drive profitable growth and build a strong leadership position. Petrochemicals sales represented 41% of total revenues(1) in 2014. We increased our share of the Russian market as new output from SIBUR’s operations began to displace higher cost imports. We expect import substitution to continue and for the Russian market to grow over the medium term as demand for basic petrochemical products rises towards levels common in other industrialised and emerging economies (see chart).
Sales of energy products, including LPG, naphtha, raw NGL, natural gas, MTBE and other fuel additives, accounted for 55% of 2014 sales(1). Despite lower market prices in US dollars, we benefited from higher export volumes thanks to organic growth in production driven by our investments in feedstock processing and transportation infrastructure.
SIBUR’s share1SIBUR’s share
Other
1
2
PET Polypropylene SBS
SIBUR’S SHARE IN RUSSIA’S PRODUCTION CAPACITY
2
1
1
SIBUR’s share
Other
1
2
2
1

From Vision to Reality - SIBUR’s Value Chain
25SIBUR 2014 Annual Review
2014 KEY FACTS(1)
(1) Excluding naphtha trading operations via Ust-Luga transshipment facility, ceased in 2015.(2) Source: IHS.
RUSSIA’S CONSUMPTION GROWTH OUTLOOK, CAGR 2013-2020(2)
9.7%
4.1%
4.9%
5.0%
2.4%
1.5%
3.1%
3.7%
MEG
IIR
PVC
LLDPE
PET
LDPE
HDPE
PP
EPS 3.9%
2
34 5
1
GEOGRAPHIC BALANCE (REVENUE SPLIT(1))
Russia
Europe
Asia
CIS
Other
55%28%9%7%1%
1
2
3
4
5
2
3
4
5
87
61
DIVERSE END-MARKETS (REVENUE SPLIT(1))
Utilities
Chemicals
FMCG
Traders
Fuels
Construction
Automotive
Other
21%20%15%13%12%6%6%7%
1
2
3
4
5
6
7
8
over1,400
75 countries
wide range of industries
number of large customers
customer base
utilities, chemicals, fast moving consumer goods, fuel, construction,
and automotive

Introduction Value Chain Business Overview Sustainability Corporate Governance Financial information
26SIBUR 2014 Annual Review
One Integrated Value ChainGeographic Footprint
Capturing growing domestic marketplace through import substitution
Increased scale and integration of gas processing and petrochemicalsbusinesses
Belgium
Sweden
Poland
Turkey
external sales
Strengthened access to abundant,low-cost feedstock stranded inWestern Siberia through longtermcooperation with oil & gas companies
oil & gasfields
feedstock flows
Extensive upgraded transportation infrastructure supporting increased feedstock volumes and growing export sales of energy products
transshipmentfacility
railway loadingrack
raw NGLpipeline
GPP
GFU
compressorstation
cracker
PDH
petrochemicalsproduction
(1) Based on 2014 numbers. Calculations exclude naphtha trading operations, ceased in 2015. Sales to other geographies totaled 1% in 2014.
Belarus
Finland
4 SALES & MARKETS3 PROCESSING & PRODUCTION
1 FEEDSTOCK SOURCING
4
2 TRANSPORTATION INFRASTRUCTURE
ILLUSTRATIVE
Sales distribution(1):
Russia: 55%Europe: 28%Asia: 9% CIS: 7%
Ukraine
Moscow
Netherlands

Geographic Footprint
27SIBUR 2014 Annual Review
India
China
Kazakhstan
South Korea
APG sourcing
Raw NGL sourcing
APG sourcing
SIBUR PETROCHEMICALSHUB IN TOBOLSK
INVESTMENT PROGRAMME2009 – 2014
Total
Other35
Petrochemicalsproduction
Feedstock processing
199
Transportationinfrastructure
103
337
RUSSIAN FEDERATION
2 3
1 2 3
Moscow

Introduction Value Chain Business Overview Sustainability Corporate Governance Financial information
28SIBUR 2014 Annual Review
One Integrated Value ChainBusiness Model(1)
FEEDSTOCK SOURCING
For more information on feedstock sourcing refer to Feedstock Sourcing in Business Overview (pp. 54-55)
APGStranded APG purchased from oil companies processed by SIBUR’s GPPs to produce natural gas and raw NGL
Raw NGLRaw NGL producedinternally or purchased from oil & gas companies fractionated at SIBUR GFUs into LPG and naphtha
NaphthaLPG and naphtha produced internally or purchased from oil & gas companies as petrochemical feedstock
Methanol & otherMTBE produced from reaction of methanol with isobutylene as an additive to gasoline
IntermediatesIntermediates polymerised or otherwise processed into higher value-added petrochemical products
LPG, naphtha and raw NGL processed at SIBUR’s crackers / PDH facility into a wide range of intermediate petrochemical products
LPG
PROCESSING & PRODUCTION
For more information on capacities refer to Products and Markets in Business Overview (pp. 39, 47, 49, 51, 53). For more information on production flows refer to Production Flows in Business Overview (pp. 34-35)
PETR
OCH
EMIC
ALS
FEED
STO
CK A
ND
EN
ERGY Oil
companies
Gas companies
Gas processing (GPPs)
18%
82% 52%
NGLs for petrochemicals 30%
Gas fractionation (GFUs)
Cracking/ dehydrogenation/ other chemical processing
40%
20%
1 2 3
(1) Based on 2014 numbers. Calculations exclude naphtha trading operations, ceased in 2015.
External feedstock purchasesInternal feedstock flowsExternal sales

Business Model
29SIBUR 2014 Annual Review
ILLUSTRATIVE
PROCESSING & PRODUCTION
For more information on capacities refer to Products and Markets in Business Overview (pp. 39, 47, 49, 51, 53). For more information on production flows refer to Production Flows in Business Overview (pp. 34-35)
SALES & MARKETS
For more information on products and sales refer to Products and Markets in Business Overview (pp. 36-53)
Natural gas
Raw NGL
LPG
Naphtha
MTBE
Intermediates
Basic polymers
Synthetic rubbers
Plastics & organic
synthesis
Other fuels &
fuel additives
80%
48%
10%
100%
90%
100%
80%
86%
60%
100%
100%NGLs for petrochemicals
30%Other processing
Polymerisation & other processing
Cracking/ dehydrogenation/ other chemical processing
40%
2 4
Share in external revenue; other revenue represented 4% of external revenue in 2014.x%
Utilities
Petrochemicals Fuels
FMCG Construction
Petrochemicals
Fuels Fuel additives and components
Automotive Construction
Petrochemicals UtilitiesFuels
Chemicals
FMCG ConstructionChemicals
12%
7%
24%
12%
3%
6%
9%
9%
14%

Introduction Value Chain Business Overview Sustainability Corporate Governance Financial information
30SIBUR 2014 Annual Review

Business Overview
Production Flows
Products and Markets
Feedstock Sourcing
Transportation and Logistics
SIBUR Production System
Belozerniy GPP
Content
31SIBUR 2014 Annual Review

Introduction Value Chain Business Overview Sustainability Corporate Governance Financial information
32SIBUR 2014 Annual Review
(1) Excluding naphtha trading operations via Ust-Luga transshipment facility, ceased in 2015.
Business Overview
ASSETS AND INFRASTRUCTURE
7 GPPs
5 compressor stations
3 GFUs
1 LPG and naphtha transshipment facility
6 railway loading racks
SIBUR is a uniquely positioned vertically integrated gas processing and petrochemicals company. We own and operate Russia’s largest gas processing business in terms of APG processing volumes and are a leader in the Russian petrochemicals industry.
We purchase by-products of the oil and gas extraction activities under long-term contracts from major Russian energy companies, and process them into energy products, including LPG, naphtha, natural gas and raw NGL, and into various petrochemical products, including basic polymers, synthetic rubbers, plastics and organic synthesis products, as well as intermediates and other chemicals.
SIBUR operates two business segments: feedstock & energy and petrochemicals. These business segments vary significantly in their end-user markets, supply and demand trends, value drivers, and consequently, near-term and long-term profitability. However, they are highly integrated, with most of feedstock for our petrochemicals segment supplied by our feedstock & energy segment.
20142013
171.5
2012
168.1
2011
149,5
88.377.674.868.1
FINANCIAL PERFORMANCE
42%(1)45%45%46%
Gross revenue, RR bln
EBITDA, RR bln
EBITDA margin
Revenue from trading operations, ceased in 2015
252.8
FEEDSTOCK & ENERGY SEGMENT
SIBUR owns and operates Russia’s largest and most extensive integrated infrastructure for processing and transportation of hydrocarbon feedstock.
SIBUR feedstock & energy segment comprises:
gathering APG from major Russian oil companies and processing it into natural gas and raw NGL at our GPPs;
transportation, fractionation and other processing of NGLs, that we produce internally or purchase from major Russian oil and gas companies;
production, marketing and sales of energy products.
Feedstock & energy segment supplies approximately 30% of NGLs available for sale as a feedstock for our petrochemicals segment.

Business Overview
33SIBUR 2014 Annual Review
ASSETS AND INFRASTRUCTURE
3 steam crackers
1 PDH facility
2 basic polymer production plants
3 syntetic rubber production plants
13 plastics & organic synthesis production plants
FINANCIAL PERFORMANCE
2014
15%12%18%
2013
128.3
20122011
134.2
20.87.624.3
Gross revenue, RR bln
EBITDA, RR bln
EBITDA margin
142.36%
135.6
16.1
PETROCHEMICALS SEGMENT
SIBUR is a leader in the Russian petrochemicals industry, operating an extensive production base across the country and constantly investing in capacity modernisation and expansion.
SIBUR’s petrochemicals segment produces and sells a wide range of petrochemical products:
basic polymers;
synthetic rubbers;
plastics and organic synthesis products;
intermediates and other chemicals.
Our petrochemicals segment benefits from integration with our feedstock & energy segment, which provides a reliable source of attractively priced raw materials.
Introduction Value Chain Business Overview Sustainability Corporate Governance Financial information
34SIBUR 2014 Annual Review
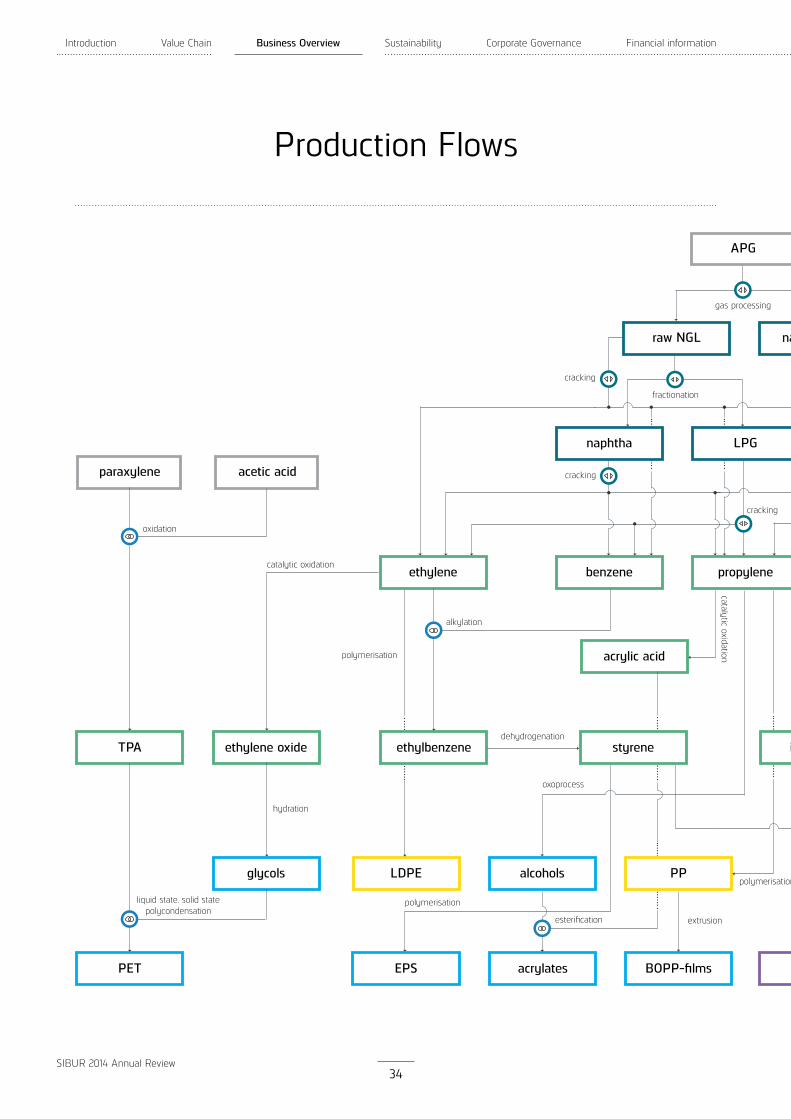
Production Flows
gas processing
paraxylene acetic acid
APG
raw NGL
acrylic acid
TPA
natural gas
ethylene oxide
glycols LDPE PP
PET EPS acrylates IRBOPP-films
LPG
propylene
naphtha
benzeneethylene
fractionation
dissolution
dehydrogenation
cracking
cracking
cracking
oxidation
alkylation
hydration
polymerisation
polymerisation
catalytic oxidation
liquid state, solid statepolycondensation
dehydrogenation
oxoprocess
polymerisation
extrusion
ethylbenzene isoprenestyrene
alcohols
catalytic oxidation
esterification

Production Flows
35SIBUR 2014 Annual Review
gas processing
APG
BRDMD
natural gas
nd-PBR
IR IIR ESBR SBS SSBR
LPG
propylene BIFmethanol butadieneIIF
BDF
separation
synthesis
dissolution
solution polymerisation
dehydrogenation
dehydrogenation
Energy products
Basic polymers
Synthetic rubbers
Separation Compounding
Plastics and organic synthesis products
Intermediates
Feedstock sourced by SIBUR externally
polymerisation
emulsion copolymerisation
esterification
esterification
hydration & dehydrogenation
emulsion copolymerisation
solution copolymerisation
solution copolymerisation
solution copolymerisation
solution copolymerisation
emulsioncopolymerisation
isoprene isobutylene
MTBE ESBR NBR
alpha-methylstyrene acrylonitrile

Introduction Value Chain Business Overview Sustainability Corporate Governance Financial information
36SIBUR 2014 Annual Review
Products and Markets
(1) Excluding naphtha trading operations via Ust-Luga transshipment facility, ceased in 2015.
ENERGY PRODUCTS
SIBUR’s energy products, including LPG, naphtha and natural gas are sold primarily to customers in the utilities, fuels and petrochemicals industries both in Russia and internationally. Majority of produced raw NGL is used internally as petrochemical feedstock and raw material for LPG and naphtha. We also produce fuel additives, including MTBE, which we sell to major oil refineries on the domestic market.
In 2014, our revenue from sales of energy products totaled RR 217,233 million, an increase of 50.1% year-on-year, representing 60.2% of total Group revenue for 2014. Domestic sales accounted for 36.5% of total revenue from energy product sales, while 63.5% was attributable to exports.
During 2014 SIBUR conducted naphtha trading operations following the launch of our Ust-Luga transshipment facility. Our revenuefrom sales of energy products adjusted for trading operations increased 21.4% year-on-year, representing 55.0% of the Group’s total revenue for 2014. Domestic sales accounted for 45.2% of total revenue from energy product sales, while 54.8% were derived from exports.
Energy products, such as LPG, naphtha and raw NGL are used as feedstock for internal processing into petrochemical products and sold externally.
KONSTANTIN BELKIN
Member of the Management Board and Managing Director, Hydrocarbon Feedstock Division
“This year we focused on sustaining the profitability of SIBUR’s Feedstock & Energy business amid volatile energy markets, primarily by optimising geographic mix and pursuing high margin distribution channels.”
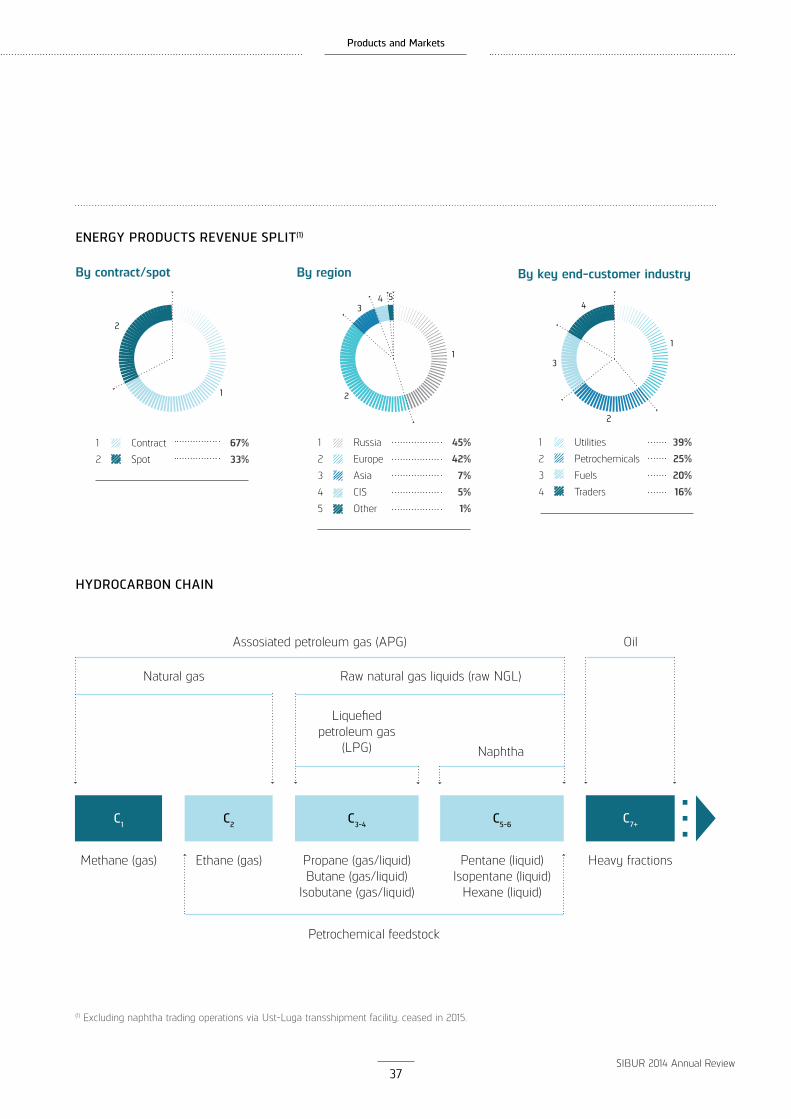
ENERGY PRODUCTS REVENUE SPLIT(1)
By product
LPG
Natural gas
Naphtha
MTBE
Raw NGL
Other fuels and fuel additives
44%22%16%11%5%2%
1
2
3
4
5
6
3
4
5 6
1
2
30%of NGLs supplied as feedstock to petrochemicals out of volumes
available for sale(1)
Products and Markets
37SIBUR 2014 Annual Review
(1) Excluding naphtha trading operations via Ust-Luga transshipment facility, ceased in 2015.
ENERGY PRODUCTS REVENUE SPLIT(1)
By contract/spot
2
1
Contract
Spot
67%33%
1
2
By region By key end-customer industry
Utilities
Petrochemicals
Fuels
Traders
39%25%20%16%
1
2
3
4
3
4
1
2
34 5
1
2
Russia
Europe
Asia
CIS
Other
45%42%7%5%1%
1
2
3
4
5
С1
Methane (gas) Ethane (gas) Propane (gas/liquid)Butane (gas/liquid)
Isobutane (gas/liquid)
Petrochemical feedstock
Oil
Raw natural gas liquids (raw NGL)Natural gas
Liquefied petroleum gas
(LPG) Naphtha
Assosiated petroleum gas (APG)
Pentane (liquid)Isopentane (liquid)
Hexane (liquid)
Heavy fractions
С2 С5-6C3-4 С7+
HYDROCARBON CHAIN
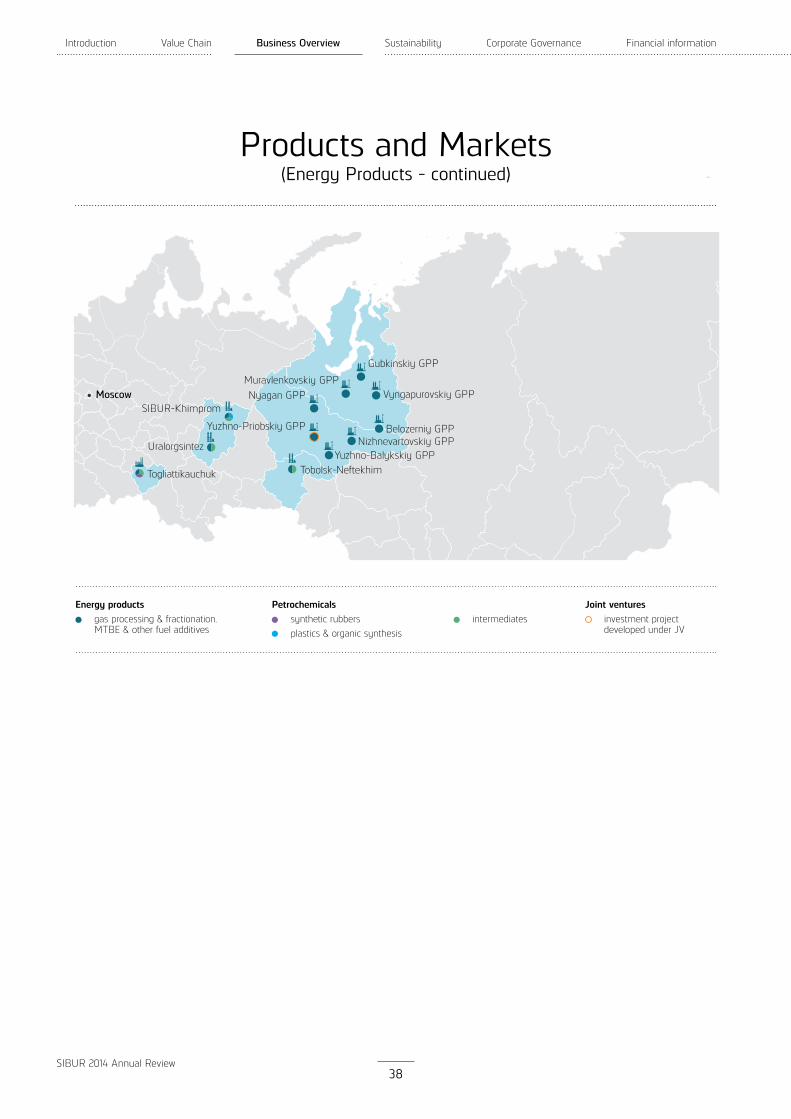
Gubkinskiy GPP
Moscow Vyngapurovskiy GPP
Belozerniy GPPNizhnevartovskiy GPP
Yuzhno-Balykskiy GPPTobolsk-Neftekhim
Nyagan GPP
Uralorgsintez
Yuzhno-Priobskiy GPP
Muravlenkovskiy GPP
SIBUR-Khimprom
Togliattikauchuk
Introduction Value Chain Business Overview Sustainability Corporate Governance Financial information
38SIBUR 2014 Annual Review
Products and Markets(Energy Products - continued)
Energy productsgas processing & fractionation,MTBE & other fuel additives
Joint venturesinvestment project developed under JV
Petrochemicalssynthetic rubbersplastics & organic synthesis
intermediates
Products and Markets
39SIBUR 2014 Annual Review
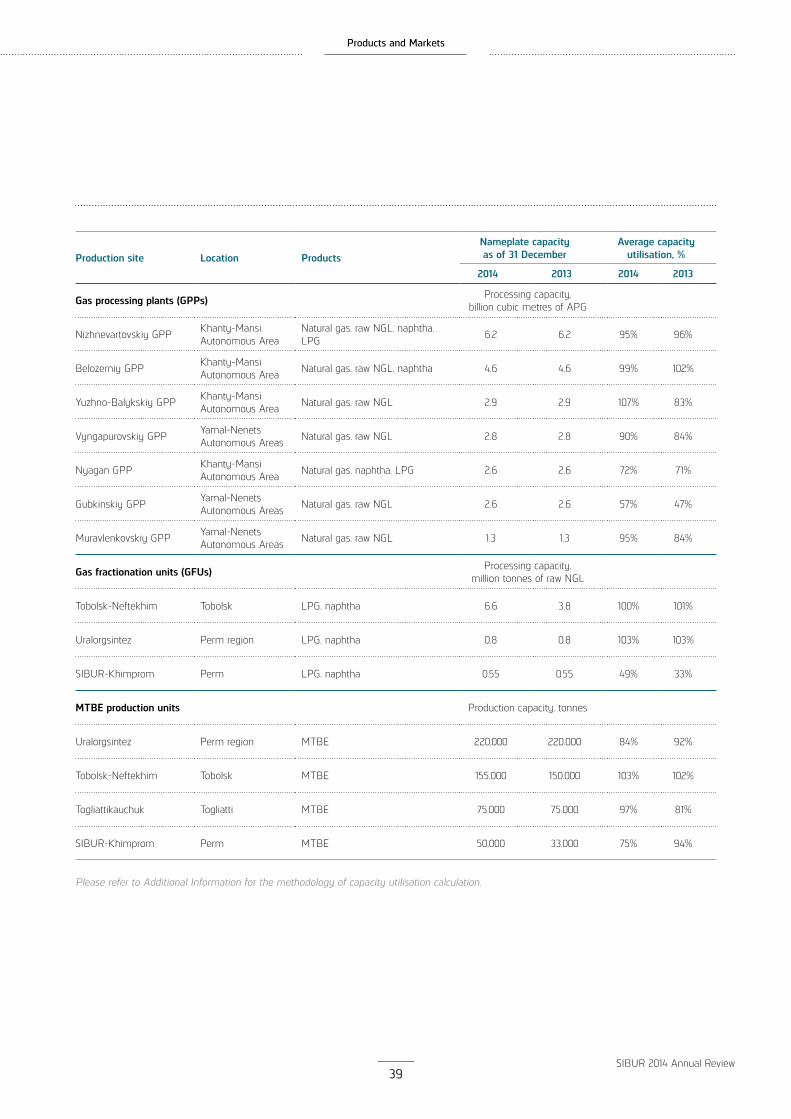
Production site Location ProductsNameplate capacity as of 31 December
Average capacity utilisation, %
2014 2013 2014 2013
Gas processing plants (GPPs) Processing capacity,billion cubic metres of APG
Nizhnevartovskiy GPP Khanty-Mansi Autonomous Area
Natural gas, raw NGL, naphtha, LPG 6.2 6.2 95% 96%
Belozerniy GPP Khanty-Mansi Autonomous Area Natural gas, raw NGL, naphtha 4.6 4.6 99% 102%
Yuzhno-Balykskiy GPP Khanty-Mansi Autonomous Area Natural gas, raw NGL 2.9 2.9 107% 83%
Vyngapurovskiy GPP Yamal-Nenets Autonomous Areas Natural gas, raw NGL 2.8 2.8 90% 84%
Nyagan GPP Khanty-Mansi Autonomous Area Natural gas, naphtha, LPG 2.6 2.6 72% 71%
Gubkinskiy GPP Yamal-Nenets Autonomous Areas Natural gas, raw NGL 2.6 2.6 57% 47%
Muravlenkovskiy GPP Yamal-Nenets Autonomous Areas Natural gas, raw NGL 1.3 1.3 95% 84%
Gas fractionation units (GFUs) Processing capacity,million tonnes of raw NGL
Tobolsk-Neftekhim Tobolsk LPG, naphtha 6.6 3.8 100% 101%
Uralorgsintez Perm region LPG, naphtha 0.8 0.8 103% 103%
SIBUR-Khimprom Perm LPG, naphtha 0.55 0.55 49% 33%
MTBE production units Production capacity, tonnes
Uralorgsintez Perm region MTBE 220,000 220,000 84% 92%
Tobolsk-Neftekhim Tobolsk MTBE 155,000 150,000 103% 102%
Togliattikauchuk Togliatti MTBE 75,000 75,000 97% 81%
SIBUR-Khimprom Perm MTBE 50,000 33,000 75% 94%
Please refer to Additional Information for the methodology of capacity utilisation calculation.
Introduction Value Chain Business Overview Sustainability Corporate Governance Financial information
40SIBUR 2014 Annual Review
Products and Markets(Energy Products - continued)
(1) Excluding naphtha trading operations via Ust-Luga transshipment facility, ceased in 2015.(2) Including production volumes under processing arrangements.
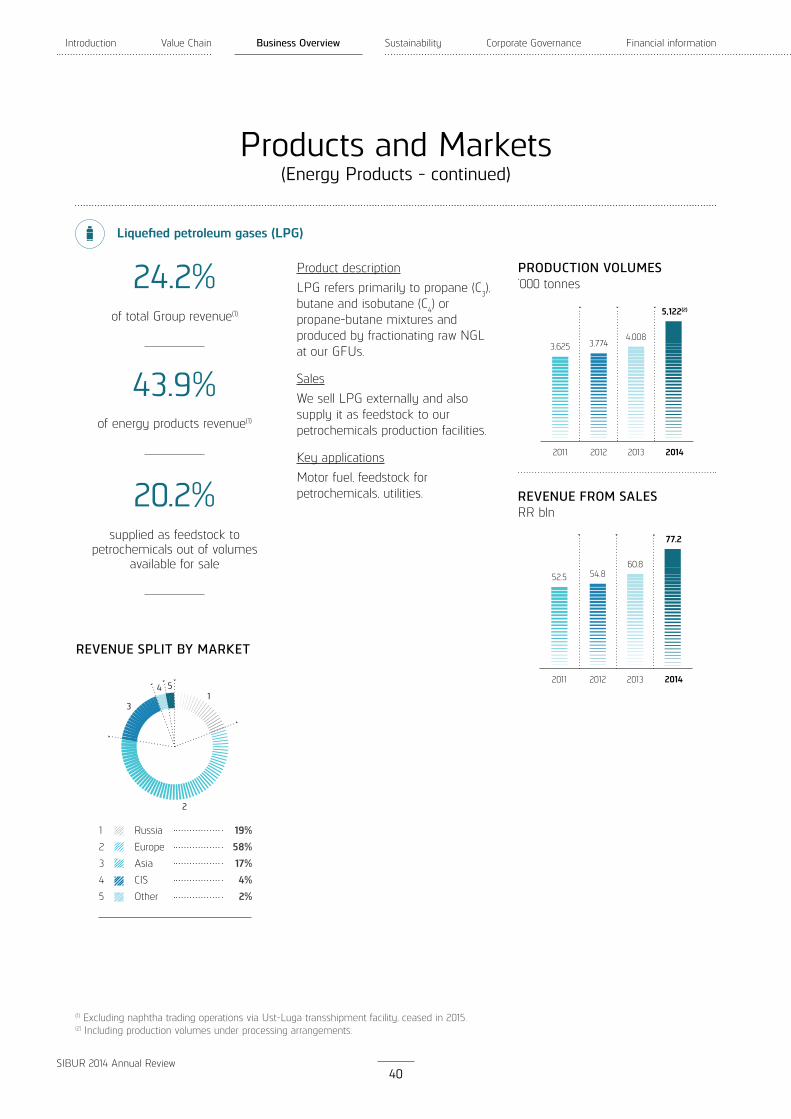
Product descriptionLPG refers primarily to propane (C3), butane and isobutane (C4) or propane-butane mixtures and produced by fractionating raw NGL at our GFUs.
SalesWe sell LPG externally and also supply it as feedstock to our petrochemicals production facilities.
Key applicationsMotor fuel, feedstock for petrochemicals, utilities.
2014
5,122(2)
2013
4,008
2012
3,774
2011
3,625
PRODUCTION VOLUMES‘000 tonnes
2014
77.2
2013
60.8
2012
54.8
2011
52.5
REVENUE FROM SALESRR bln
5
24.2%
43.9%
of total Group revenue(1)
of energy products revenue(1)
20.2%supplied as feedstock to
petrochemicals out of volumes available for sale
REVENUE SPLIT BY MARKET
3
41
2
Russia
Europe
Asia
CIS
Other
19%58%17%4%2%
1
2
3
4
5
Liquefied petroleum gases (LPG)
Products and Markets
41SIBUR 2014 Annual Review
(1) Excluding naphtha trading operations via Ust-Luga transshipment facility, ceased in 2015.
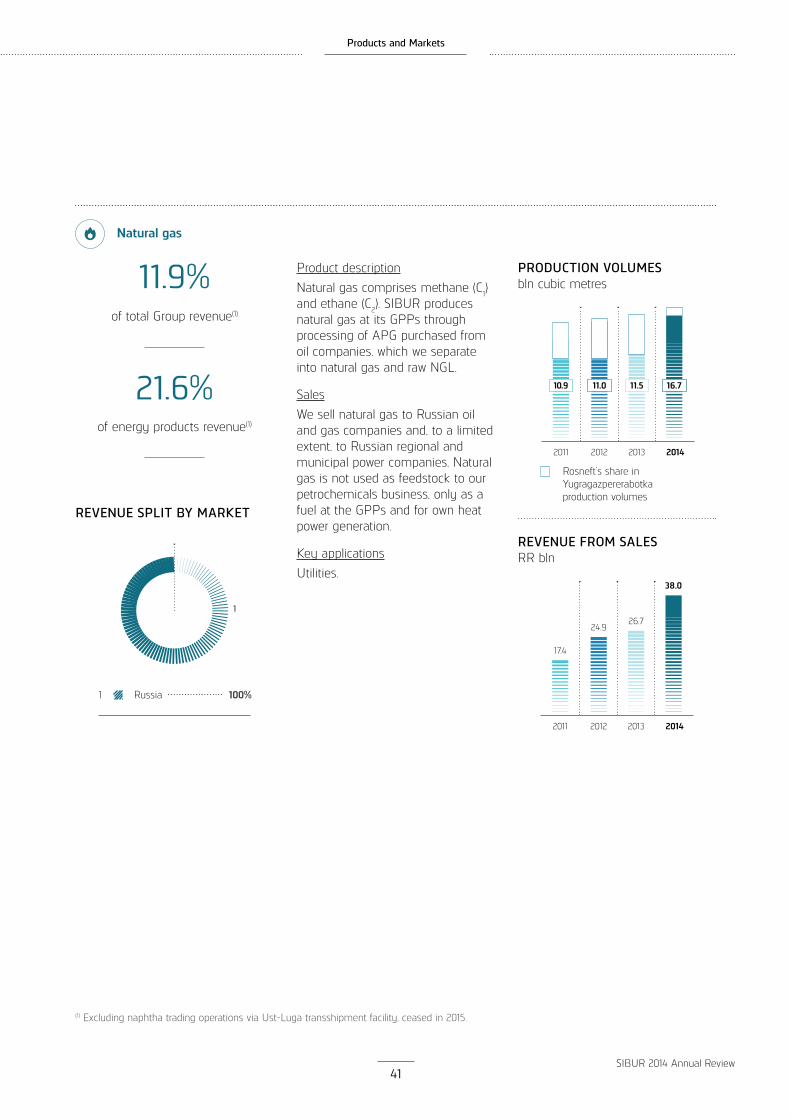
Product descriptionNatural gas comprises methane (C1) and ethane (C2). SIBUR produces natural gas at its GPPs throughprocessing of APG purchased from oil companies, which we separate into natural gas and raw NGL.
SalesWe sell natural gas to Russian oil and gas companies and, to a limited extent, to Russian regional and municipal power companies. Natural gas is not used as feedstock to our petrochemicals business, only as a fuel at the GPPs and for own heat power generation.
Key applicationsUtilities.
11.9%
21.6%
of total Group revenue(1)
of energy products revenue(1)
Rosneft’s share in Yugragazpererabotka production volumes
2014201320122011
PRODUCTION VOLUMESbln cubic metres
16.711.511.010.9
2014
38.0
2013
26.7
2012
24.9
2011
17.4
REVENUE FROM SALESRR bln
REVENUE SPLIT BY MARKET
Russia 100%1
1
Natural gas

Introduction Value Chain Business Overview Sustainability Corporate Governance Financial information
42SIBUR 2014 Annual Review
Products and Markets(Energy Products - continued)
(1) Excluding naphtha trading operations via Ust-Luga transshipment facility, ceased in 2015.
Product descriptionNaphtha (C5+) refers primarily to pentane, isopentane, hexane, heavier fraction hydrocarbons and produced by fractionating raw NGL at our GFUs.
SalesWe sell naphtha externally and supply it as feedstock to our petrochemicals production facilities.
Key applicationsFeedstock for energy and petrochemicals industries.
8.5%
15.5%
of total Group revenue(1)
of energy products revenue(1)
39.4%supplied as feedstock to
petrochemicals out of volumes available for sale(1)
2014
1,460
2013
1,362
2012
1,363
2011
1,295
PRODUCTION VOLUMES‘000 tonnes
Revenue from trading operations, ceased in 2015
2014201320122011
REVENUE FROM SALESRR bln
21.125.7 26.3
68.9
REVENUE SPLIT BY MARKET(1)
Russia
Europe
CIS
3%93%4%
1
2
3
3 1
2
Naphtha
Products and Markets
43SIBUR 2014 Annual Review
(1) Excluding naphtha trading operations via Ust-Luga transshipment facility, ceased in 2015.
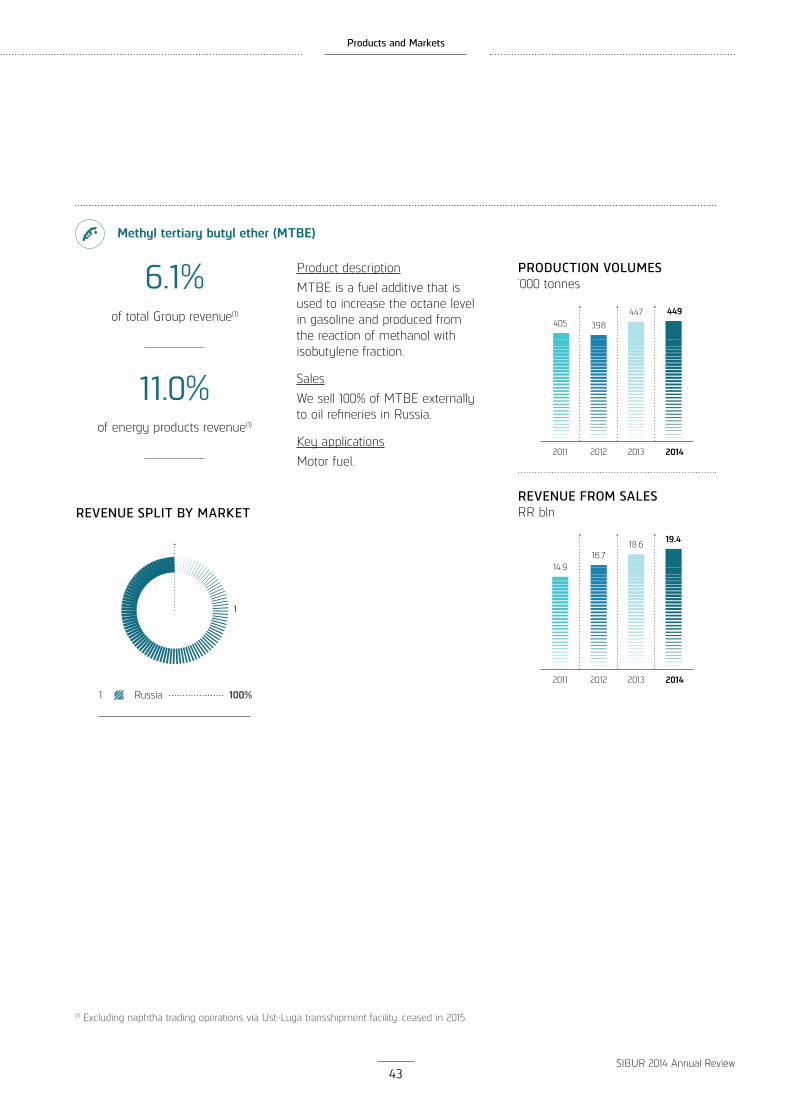
Product descriptionМТBE is a fuel additive that is used to increase the octane levelin gasoline and produced from the reaction of methanol with isobutylene fraction.
SalesWe sell 100% of MTBE externally to oil refineries in Russia.
Key applicationsMotor fuel.
6.1%
11.0%
of total Group revenue(1)
of energy products revenue(1)
REVENUE SPLIT BY MARKET
Russia 100%1
1
2014
449
2013
447
2012
398
2011
405
PRODUCTION VOLUMES‘000 tonnes
2014
19.4
2013
18.6
2012
16.7
2011
14.9
REVENUE FROM SALESRR bln
Methyl tertiary butyl ether (MTBE)
Introduction Value Chain Business Overview Sustainability Corporate Governance Financial information
44SIBUR 2014 Annual Review
Products and Markets(Energy Products - continued)
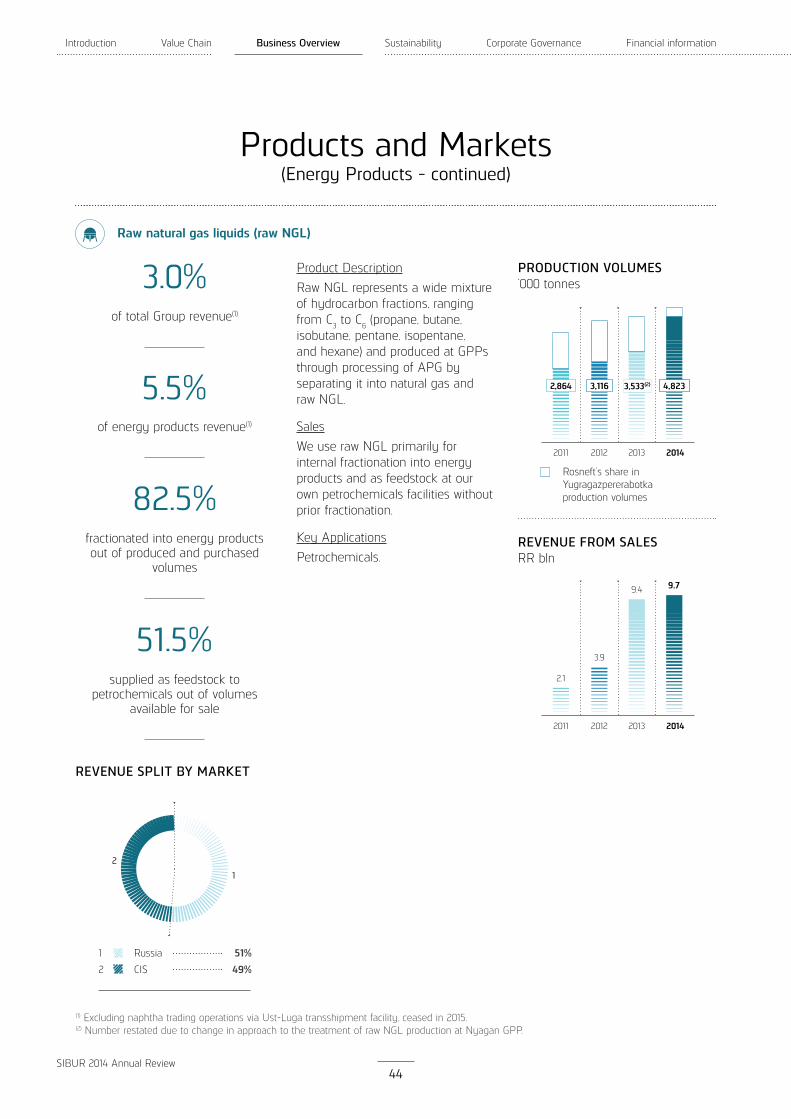
(1) Excluding naphtha trading operations via Ust-Luga transshipment facility, ceased in 2015.(2) Number restated due to change in approach to the treatment of raw NGL production at Nyagan GPP.
Product DescriptionRaw NGL represents a wide mixture of hydrocarbon fractions, ranging from C3 to C6 (propane, butane, isobutane, pentane, isopentane, and hexane) and produced at GPPs through processing of APG by separating it into natural gas and raw NGL.
SalesWe use raw NGL primarily for internal fractionation into energy products and as feedstock at our own petrochemicals facilities without prior fractionation.
Key ApplicationsPetrochemicals.
Raw natural gas liquids (raw NGL)
PRODUCTION VOLUMES‘000 tonnes
Rosneft’s share in Yugragazpererabotka production volumes
2014201320122011
4,8233,1162,864
2014
9.7
2013
9.4
2012
3.9
2011
2.1
REVENUE FROM SALESRR bln
3.0%
5.5%
of total Group revenue(1)
of energy products revenue(1)
82.5%
51.5%
fractionated into energy products out of produced and purchased
volumes
supplied as feedstock to petrochemicals out of volumes
available for sale
REVENUE SPLIT BY MARKET
Russia
CIS
51%49%
1
2
1
2
3,533(2)

Products and Markets
45SIBUR 2014 Annual Review
(1) Excluding naphtha trading operations via Ust-Luga transshipment facility, ceased in 2015.
PETROCHEMICALS
SIBUR’s petrochemical products comprise basic polymers, synthetic rubbers, plastics & organic synthesis products as well as intermediates & other chemicals. Each of these product groups has particular characteristics and distinct market fundamentals, however, all are sold to industrial customers in key end-markets, such as fast moving consumer goods (FMCG), construction, chemicals, automotive and other sectors.
In 2014, our revenue from sales of petrochemical products totaled RR 132,513 million, a 14.2% increase year-on-year, and accounted for 41.5% of the total Group revenue for 2014(1). Domestic sales accounted for 65.3% of total revenue from petrochemicals sales, while 34.7% was attributable to exports.
We use a large portion of intermediates & other chemicals internally for processing into higher value added petrochemical products.
SIBUR’s integrated business model enables us to change the composition of our feedstock and product mix to optimise purchasing, production, sales and logistics in order to maximise our blended margins.
PETROCHEMICAL PRODUCTS REVENUE SPLITBy product
Plastic and Organic Synthesis
Basic Polymers
Synthetic Rubbers
Intermediates & Other chemicals
35%
29%21%15%
1
2
3
4
3
4
1
2
By contract/spot
Contract
Spot
41%59%
1
2
1
2
By region
Russia
Europe
Asia
CIS
Other
65%12%11%10%2%
1
2
3
4
5
3
4 5
1
2
By key end-customer industry
FMCG
Construction
Chemicals
Automotive
Traders
Other
35%15%15%13%11%11%
1
2
3
4
5
6
3
4
5
6
1
2

Introduction Value Chain Business Overview Sustainability Corporate Governance Financial information
46SIBUR 2014 Annual Review
Products and Markets(Petrochemicals - continued)
Basic polymers
SERGEY KOMYSHAN
Member of the Management Board and Managing Director, Basic Polymers Division
“Our aim is to become a leading producer of basic polymers in Russia through organic production expansion and import substitution. The successful launch of Tobolsk-Polymer was a major step forward in executing this strategy.”
Product description SIBUR’s basic polymers products include polypropylene (PP) and polyethylene (LDPE), which are granulated thermoplastic polymers. PP and LDPE are derived from polymerisation of propylene and ethylene, respectively, that are produced internally.
SalesWe sell LDPE and PP to external clients in Russia and abroad and also use certain volumes internally in BOPP-films production.
Key PP applicationsGeneral-purpose consumer goods, packaging, BOPP-films, hygiene products, pipes, fibres and automotive components.
Key LDPE applicationsGeneral-purpose consumer goods, coating materials for electrotechnical and energy industry, film for agricultural industry, various packaging.
2014
656
2013
403
2012
386
2011
373
PRODUCTION VOLUMES‘000 tonnes
2014
38.4
2013
22.8
2012
22.2
2011
21.8
REVENUE FROM SALESRR bln
REVENUE SPLIT BY PRODUCT
PP
PE (LDPE)
60%40%
1
2
1
2
REVENUE SPLIT BY MARKET
3
4 5
1
2
Russia
Europe
Asia
CIS
Other
63%5%
23%8%1%
1
2
3
4
5

Products and Markets
47SIBUR 2014 Annual Review
(1) Excluding naphtha trading operations via Ust-Luga transshipment facility, ceased in 2015.(2) SIBUR’s non-consolidated JV with Gazprom Neft Group and Titan Group.(3) NPP Neftekhimia is the Group’s joint venture with the Gazprom Neft Group. SIBUR does not consolidate production volumes of NPP Neftekhimia, however it purchases all PP produced by the joint venture.
(4) SIBUR’s non-consolidated JV with SolVin Holding Nederland B.V.
Please refer to Additional Information for the methodology of capacity utilisation calculation.
Product Production site LocationNameplate capacity as of 31 December
Capacityutilisation, %
2014 2013 2014 2013
PP Tobolsk-Polymer Tobolsk 500,000 500,000 53% 19%
PP Tomskneftekhim Tomsk 130,000 130,000 99% 99%
PP Poliom (non-consolidated JV(2)) Omsk 210,000 180,000 82% 65%
PP NPP Neftekhimia (non-consolidated JV(3)) Moscow 120,000 120,000 85% 107%
PE (LDPE) Tomskneftekhim Tomsk 245,000 245,000 106% 102%
PVC RusVinyl (non-consolidated JV(4)) Nizhniy Novgorod region 330,000 - 75% -
Caustic soda RusVinyl (non-consolidated JV(4)) Nizhniy Novgorod region 225,000 - 70% -
12.0%
29.0%
of total Group revenue(1)
of petrochemicals revenue
17.3%out of produced and puchased volumes used in BOPP-films
production internally
Petrochemicalsbasic polymersintermediates
Joint venturesfacilities operated under JVs
RusVinyl
NPP Neftekhimia
Poliom
Tobolsk-PolymerTomskneftekhim
Moscow

Introduction Value Chain Business Overview Sustainability Corporate Governance Financial information
48SIBUR 2014 Annual Review
Products and Markets(Petrochemicals - continued)
Synthetic rubbers
REVENUE SPLIT BY PRODUCT
Commodity rubbers
Speciality rubbers
Thermoplasticelastomers
60%
27%13%
1
2
3
2
3
1
MIKHAIL GORDIN
Member of the Management Board and Managing Director, Synthetic Rubbers Division
“Synthetic rubbers business is facing a challenging external market environment. We are focused on improving operational efficiency and ensure competitive product quality to drive performance.”
Commodity rubbers comprise polyisoprene (IR), polybutadiene (BR) and styrene-butadiene (SBR) rubbers. These are butadiene or isoprene polymers as well asco-polymers of butadiene and styrene, which have elastic and other properties that are partially similar to natural rubbers.
Key applicationsTyres, mechanical rubber goods for automotive and machinebuilding industries, asbestos technical (frictional) goods and adhesives, footwear.
Specialty rubbers comprise co-polymers such as nitrile-butadiene rubber (NBR), which is a complex mixture of unsaturated co-polymers of acrylonitrile and butadiene, and butyl rubber (IIR), which is a co-polymer of isobutylene and a small amount of isoprene. In addition to basic rubber properties, such as elasticity, NBR is characterised by oil and petrol resistance, while IIR is characterised by gas impermeability.
Key applicationsTyre inner tubes and vulcanising diaphragms, mechanical rubber goods for asbestos technical (frictional) goods and adhesives, footwear.
Thermoplastic elastomers represent a mix of polymers (usually plastic and rubber), which consists of materials with both thermoplastic and elastomeric properties.
Key applicationsConstruction, healthcare, automotive and electronics.
SalesWe sell 100% of rubbers to external customers both in Russia and abroad.
2014
353
2013
418
2012
423
2011
426
PRODUCTION VOLUMES‘000 tonnes
2014
27.8
2013
32.4
2012
41.1
2011
51.0
REVENUE FROM SALESRR bln
REVENUE SPLIT BY MARKET
3
4
5
1
2
Russia
Europe
Asia
CIS
Other
36%28%20%9%7%
1
2
3
4
5

Products and Markets
49SIBUR 2014 Annual Review
(1) Excluding naphtha trading operations via Ust-Luga transshipment facility, ceased in 2015.
Please refer to Additional Information for the methodology of capacity utilisation calculation.
8.7%
21.0%
of total Group revenue(1)
of petrochemicals revenue
Product Production site LocationNameplate capacity as of 31 December
Capacityutilisation, %
2014 2013 2014 2013
Commodity rubbers
BR Voronezhsintezkauchuk Voronezh 91,000 91,000 75% 87%
IR Togliattikauchuk Togliatti 82,000 82,000 72% 81%
ESBR Voronezhsintezkauchuk Voronezh 80,000 80,000 59% 78%
ESBR Togliattikauchuk Togliatti 60,000 60,000 53% 89%
PBR-Nd Voronezhsintezkauchuk Voronezh 30,000 30,000 41% 36%
SSBR Voronezhsintezkauchuk Voronezh 23,000 23,000 50% 60%
Specialty rubbers
IIR Togliattikauchuk Togliatti 60,000 53,000 92% 104%
NBR Krasnoyarskiy ZSK Krasnoyarsk 42,500 42,500 76% 86%
Latexes Voronezhsintezkauchuk Voronezh 19,500 19,500 7% 14%
Thermoplastic elastomers
SBS Voronezhsintezkauchuk Voronezh 85,000 85,000 44% 77%
Petrochemicalssynthetic rubbersintermediates
Krasnoyarskiy ZSK
Voronezhsintezkauchuk
Togliattikauchuk
Energy ProductsMTBE & other fuel additives
Moscow

Introduction Value Chain Business Overview Sustainability Corporate Governance Financial information
50SIBUR 2014 Annual Review
Products and Markets(Petrochemicals - continued)
Plastics and organic synthesis products
PAVEL LYAKHOVICH
Member of the Management Board and Managing Director, Plastics and Organic Synthesis Division
“We are successively expanding capacity at our production sites to strengthen our leading positions on the competitive domestic market. Our goal is to meet consumption growth of petrochemicals in Russia being a key supplier of domestic raw materials.”
blocks, packaging materials as well as for decorative elements.Alcohols include 2-ethylhexanol, butyl alcohol and isobutyl alcohol.Key applicationsProduction of plasticisers, acetates, acrylates, oil additives, as solvents for plastics and varnish, as anti-foaming agent, as well as a component for perfume compounds.Glycols include mono-ethylene glycol, diethylene glycol and triethylene glycol.Key applicationsPET, polyester fiber, de-icing liquids, cooling and antifreezing liquids, extragent for aromatic hydrocarbons and reagent for natural gas drying.Acrylates include ethers of acrylic acid, butyl, methyl and ethyl.Key applicationsProduction of acrylic emulsions,superabsorbents, building mixes andadhesives used in the construction and textile industries.SalesWe sell these products to external customers in a variety of industriesin Russia and abroad with a strong focus on domestic market for
majority of the products and also use certain volumes internally, primarily in the production of higher value-added products.
SIBUR produces plastics and organic synthesis products primarilyfrom ethylene and propylene derivatives, as well as a wide range of intermediates, which we also produce as part of our value chain.
PET is a thermoplastic polymer resin of the polyester family.Key applicationsPET packaging for beverages and food, other containers.BOPP-films include coextruded,coated, non-heat sealable or homopolymer films in a variety of finishes.Key applicationsUsed by the retail industry for packaging and production of price tags, as well as labels and adhesive tapes.EPS is a granulated polymer, produced from styrene monomer.Key applicationsProduction of thermoinsulation
REVENUE SPLIT BY MARKET
2
43
1
Russia
Europe
Asia
CIS
78%10%3%9%
1
2
3
4
2014201320122011
900859845
607
PRODUCTION VOLUMES‘000 tonnes
2014
45.8
2013
41.6
2012
39.6
2011
24.7
REVENUE FROM SALESRR bln
REVENUE SPLIT BY PRODUCT
PET
BOPP-films
EPS
Alcohols
Glycols
Acrylates
30%24%15%13%11%7%
1
2
3
4
5
6
3
4
6
51
2

Products and Markets
51SIBUR 2014 Annual Review
(1) Excluding naphtha trading operations via Ust-Luga transshipment facility, ceased in 2015.
Please refer to Additional Information for the methodology of capacity utilisation calculation.
14.3%
34.5%
of total Group revenue(1)
of petrochemicals revenue
13.1%used in higer value-added
products internally
Product Production site LocationNameplate capacity as of 31 December
Capacityutilisation, %
2014 2013 2014 2013
PET Polief Blagoveshchensk (Bashkortostan) 210,000 140,700 104% 83%
PET SIBUR-PETF Tver 75,250 75,250 103% 105%
BOPP-films BIAXPLEN group of companies
Samara region Moscow region Kursk Nizhniy Novgorod region
182,450 152,000 71% 84%
EPS SIBUR-Khimprom Perm 100,000 100,000 97% 94%
Alcohols SIBUR-Khimprom Perm 164,700 154,700 97% 92%
Glycols SIBUR-Neftekhim Nizhniy Novgorod region 255,750 255,000 77% 98%
Acrylates SIBUR-Neftekhim Nizhniy Novgorod region 57,145 53,700 78% 92%
BIAXPLEN (Nizhniy Novgorod region)
SIBUR-Khimprom
SIBUR-PETFBIAXPLEN (Moscow region)
BIAXPLEN (Kursk)
BIAXPLEN (Samara region) Polief
SIBUR-Neftekhim
BIAXPLEN (Tomsk)
Energy productsfractionation, MTBE & other fuel additives
Petrochemicalsplastics & organic synthesisintermediates
Moscow
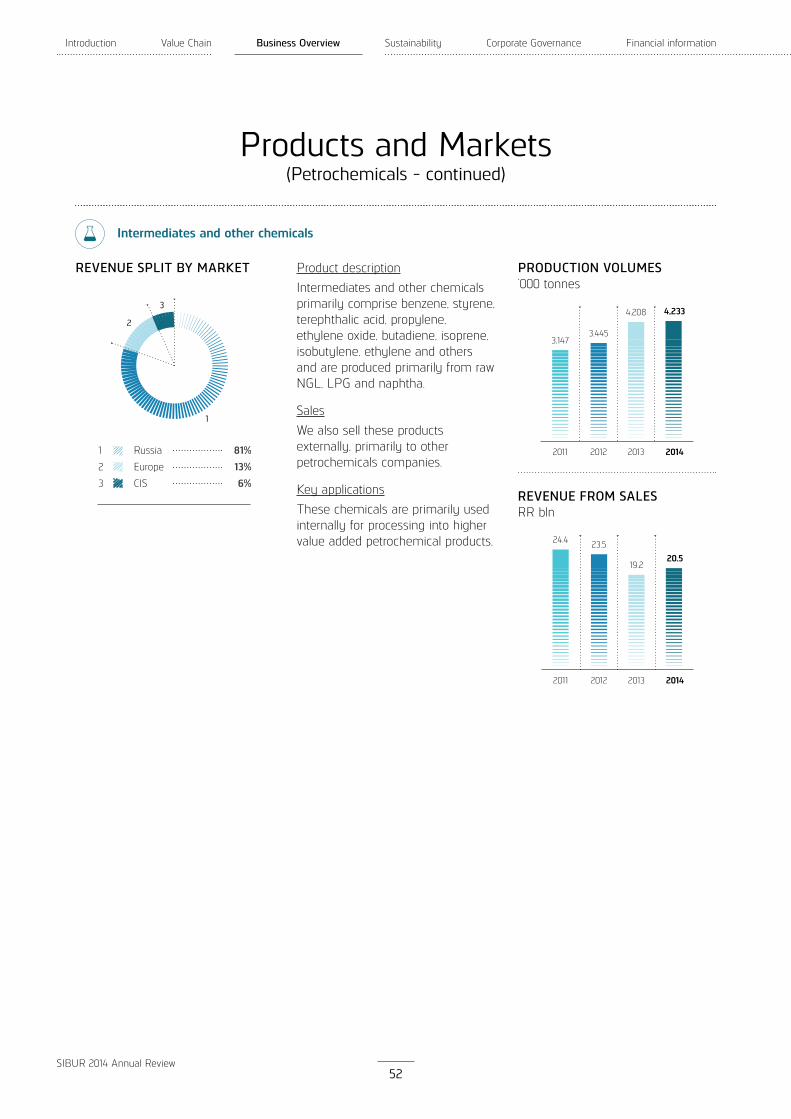
Introduction Value Chain Business Overview Sustainability Corporate Governance Financial information
52SIBUR 2014 Annual Review
Products and Markets(Petrochemicals - continued)
Intermediates and other chemicals
Product descriptionIntermediates and other chemicals primarily comprise benzene, styrene, terephthalic acid, propylene, ethylene oxide, butadiene, isoprene, isobutylene, ethylene and others and are produced primarily from raw NGL, LPG and naphtha.
SalesWe also sell these products externally, primarily to other petrochemicals companies.
Key applicationsThese chemicals are primarily used internally for processing into higher value added petrochemical products.
REVENUE SPLIT BY MARKET
3
2
1
Russia
Europe
CIS
81%13%6%
1
2
3
2014
20.5
2013
19.2
2012
23.5
2011
24.4
REVENUE FROM SALESRR bln
PRODUCTION VOLUMES‘000 tonnes
2014
4,233
2013
4,208
2012
3,445
2011
3,147

Products and Markets
53SIBUR 2014 Annual Review
SIBUR-KhimpromSIBUR-KstovoPlastik-Geosintetika
TogliattikauchukPolief Tobolsk-Polymer
SIBUR GEOSINT(Surgut)SIBUR-Neftekhim
SIBUR GEOSINT(Kemerovo)
Tomskneftekhim
Energy productsfractionation, MTBE & other fuel additives
Petrochemicalsbasic polymers synthetic rubbers
plastics & organic synthesisintermediatesother chemicals
(1) Excluding naphtha trading operations via Ust-Luga transshipment facility, ceased in 2015.(2) Plastic divested in December 2013 produces styrene for SIBUR under processing arrangement.
Please refer to Additional Information for the methodology of capacity utilisation calculation.
6.4%
15.5%
of total Group revenue(1)
of petrochemicals revenue
89.5%used in higher value-added
products internally
Product Production site LocationNameplate capacity as of 31 December
Capacityutilisation, %
2014 2013 2014 2013
Propylene
Tobolsk-Polymer Tomskneftekhim SIBUR-Kstovo SIBUR-Khimprom
Tobolsk Tomsk Nizhniy Novgorod regionPerm
925,500 894,500 61% 42%
EthyleneTomskneftekhim SIBUR-Khimprom SIBUR-Kstovo
Tomsk Perm Nizhniy Novgorod region
720,000 660,000 76% 81%
Butadiene Tobolsk-Neftekhim Togliattikauchuk
Tobolsk Togliatti 287,000 287,000 66% 80%
Isoprene Togliattikauchuk Togliatti 90,000 90,000 78% 87%
Benzene Uralorgsintez SIBUR-Kstovo
Perm region Nizhniy Novgorod region 176,000 176,000 71% 76%
Styrene SIBUR-Khimprom Plastic(2)
Perm Tula region 195,000 195,000 88% 82%
Ethylene oxide SIBUR-Neftekhim Nizhniy Novgorod region 300,000 264,000 72% 100%
Terephthalic acid Polief Blagoveshchensk (Bashkortostan) 269,220 269,220 94% 96%
Uralorgsintez
Moscow

Introduction Value Chain Business Overview Sustainability Corporate Governance Financial information
54 SIBUR 2014 Annual Review
Feedstock Sourcing
TO ENSURE SUFFICIENT FEEDSTOCK VOLUMES FOR OUR EXPANDED PROCESSING AND PRODUCTION CAPACITIES WE
CONTINUOUSLY WORK WITH ALL THE LARGEST OIL AND GAS PRODUCERS IN WESTERN SIBERIA.
We work with the view of extending tenors of the existing agreements and/or entering into new long-term supply contracts on both APG and NGLs supplies.Multi-year supply contracts increase the predictability of feedstock pricing and volumes and enable better operating expense planning.
KEY TYPES OF FEEDSTOCK
We primarily use two major types of hydrocarbon feedstock: APG and NGLs, including raw NGL, LPG and naphtha.
APG is a by-product of oil production and represents a key raw material for our feedstock & energy business. By processing APG at our gas processing plants we produce natural gas and raw NGL. NGLs, comprising raw NGL, LPG and naphtha, are used as a raw material for both the feedstock & energy business and for the petrochemicals business. Raw NGL is produced as a result of APG processing or through stabilisation of unstable gas condensate obtained from processing of wet gas extracted from gas fields. LPG and naphtha are produced through fractionation of raw NGL. We produce NGLs at our own GFUs and GPPs and also purchase them from third parties.
FEEDSTOCK SOURCING
A large portion of our hydrocarbon feedstock is obtained from Rosneft.In March 2014, we acquired Rosneft’s 49% interest in the Yugragazpererabotka joint venture, giving SIBUR full ownership of the Nizhnevartovskiy, Belozerniyand Nyagan GPPs. Following the new terms of cooperation, we ceased raw NGL purchases, while we pay for 100% of APG supplied from Rosneft’s oil-fields to these GPPs.
In addition to our arrangements with Rosneft, we purchase APG and NGLs from other major oil and gas companies in Western Siberia, including Gazprom neft, RussNeft, LUKOIL, NOVATEK and Gazprom, primarily under long-term contracts.
In 2014, SIBUR expanded its access to abundant raw NGL resources in Western Siberia by commissioning the raw NGL pipeline connecting NOVATEK’s Purovsky Gas Condensate Plant to our expanded gas fractionation capacity in Tobolsk, which enabled us to consolidate rising supplies of raw NGL. Our major external raw NGL suppliers are NOVATEK and Gazprom.
FEEDSTOCK PRICING
APG
For APG that we source from oil companies there is no market or
AS OF 31 DECEMBER 2014
APG
NGLs
16.4 YEARS
92%
weighted average maturity of our multi-year APG supply contracts
of our planned APG supplies for 2015 guaranteed under multi-year
supply contracts
17.9 YEARS
80%
weighted average maturity of our multi-year NGLs supply contracts
of our planned NGLs supplies for 2015 guaranteed under multi-year
supply contracts

Feedstock Sourcing
55SIBUR 2014 Annual Review
benchmark price given the limitedoptions for using APG and the lack of alternatives for evacuating it from oil fields. APG pricing is also not subject to government regulation. As a result, we purchase APG from oil companies at prices that are negotiated on a case-by-case basis and typically substantially differ from the FTS regulated natural gas prices.
The base price for APG depends on:
the quality and composition of APG in terms of target liquid fractions content;
distance of an APG source from our GPPs;
availability of collection and transportation infrastructure;
capital and operating expenditures needed to construct and maintain that infrastructure.
SIBUR has two types of APG purchase contracts:
under first contract type, APG purchase price once agreed upon in absolute terms, is typically regularly indexed to reflect changes in the FTS regulated prices for natural gas;
under the new arrangements with Rosneft for APG supplies to Nizhnevartovskiy, Belozerniy and Nyagan GPPs, the APG purchase price is indexed in line with changes in prices for APG derivatives: natural gas and raw NGL.
Additional volumes of APG that we source from oil companies (new volumes under new agreements or volumes under existing agreements
that exceed initially pre-agreed or guaranteed volumes) can besupplied at a higher price due to additional capital and operating expenses incurred by oil companies to produce and deliver such volumes.
NGLs
Our NGLs feedstock is typically priced with reference to international prices for LPG and naphtha, while prices for raw NGL, depending on its composition, are largely correlated with prices for LPG and naphtha. As the supply of NGLs significantly exceeds demand in Russia and particularly in Western Siberia, prices for NGLs are determined on an export netback basis, which reflects transportation costs and export duties.
The Group’s NGLs supply contractstypically contain a formula where prices are determined by the respective netbacks and reflect the fraction content of NGLs, need for and cost of fractionation, capital expenditures required to construct and maintain the respective infrastructure as well as the availability and quality of alternative selling channels that the oil or gas company supplying the NGLs has.
FEEDSTOCK TRENDS
APG volumes from oil fields located in Western Siberia are expected to increase only moderately given the maturity profile of the region’s oil fields, while concentration of liquid fractions in the APG may decline. We expect this trend to be partially offset by lower APG flaring rates and our efforts to increase the liquids recovery ratio at our GPPs.
We expect that supplies of NGLs
from gas fields in Western Siberia will grow substantially faster than supplies of APG or NGLs derived from APG. By launching our raw NGL transportation infrastructure we gained access to these substantial NGLs supplies from gas fields due to the growing production of natural gas and the increasing share of wet gas in gas production.
We expect NGLs derived from wet gas to be a growing source for the future development of our petrochemicals business, particularly for productions located in Western Siberia.
Rosneft’s share in APG purchases
2014201320122011
APGbln cubic metres
18.0 18.7 19.620.8
Purchases from Rosneft in JV
2014201320122011
NGLsmln tonnes
3.3 3.43.6
2.6
19.4
2.2
13.9
2.1
13.0
1.9
12.7
2.0

Introduction Value Chain Business Overview Sustainability Corporate Governance Financial information
56 SIBUR 2014 Annual Review
Transportation and Logistics
TRANSPORTATION AND LOGISTICS IS A VITAL COMPONENT OF OUR BUSINESS MODEL DUE TO THE EXTENSIVE GEOGRAPHICAL
SPREAD OF OUR OPERATIONS.
We use various means of transportation for delivery of feedstock and finished products, including pipelines, raiway, trucks, port facilities and multimodal transportation services. SIBUR’s own infrastructure represented by APG, natural gas and raw NGL pipelines, railway facilities, such as railway loading racks and rolling stock, as well as launched in the end of 2013 sea terminal in Ust-Luga meets significant part of our transportation needs.
PIPELINE TRANSPORTATION
APG pipelines
APG purchased from oil companies in Western Siberia is transported via point-to-point pipelines, which represent direct links between oil fields and oil clusters to our GPPs. These pipelines are typically owned and operated by the oil companies, but some are also owned by SIBUR.
Natural gas pipelines
SIBUR transports the natural gas it produces at its GPPs through its own gas pipelines primarily into the Unified Gas Supply System (the UGSS), which is owned and operated by Gazprom and, to a limited extent, to regional and municipal power companies.
Raw NGL pipelines
We transport a large portion of raw NGL to our GFUs via specialised raw NGL pipelines. At present, Russia does not have a nationwide raw NGL pipeline system. The group has developed its own pipeline network and in 2014 launched a new 1,100 kilometre Purovsk — Pyt-Yakh — Tobolsk pipeline with an annual capacity of up to 8 million tonnes. The new pipeline helps to secure our long-term access to abundant raw NGL resources in Western Siberia.
AS OF 31 DECEMBER 2014 SIBUR OWNED AND OPERATED
705km
239km
of APG pipelines
of natural gas pipelines
2,052km
23,719
of raw NGL pipelines
rail cars and tank wagons under management

Transportation and Logistics
57SIBUR 2014 Annual Review
RAIL TRANSPORTATION
SIBUR uses rail for transportation of its refined products, intermediates and feedstock. SIBUR’s subsidiary ZAO Sibur-Trans, a licensed railway operator, is responsible for handlingour rail logistics within Russia and for export deliveries, including purchasing of transportation services from Russian Railways. We own six railway loading racks used for loading and unloading NGLs into rail tank wagons and operate an extensive rail car fleet. Rail transportation is subject to tariffs for access to Russia’s main railway network and usage of locomotives, which is regulated by the Federal Tariffs Service (FTS), as well as operator fees and cost of leasing and contracting rolling stock.
TRUCK TRANSPORTATION
We use trucks to transport petrochemical products, primarily within Russia (for basic polymers, plastics & organic synthesis productsand synthetic rubbers) and to a limited extent for export. We do not operate our own truck fleet but use third-party services from a variety of providers.
PORT FACILITIES
We deliver LPG, naphtha and certain other products to export markets through ports in, among others, Ust-Luga transshipment facility (Russia), Hamina (Finland),Odessa (Ukraine), Ilyichevsk (Ukraine), Riga (Latvia), St.Petersburg (Russia), Nakhodka (Russia), Vladivostok (Russia).
MULTIMODAL TRANSPORTATION SERVICES
We use the services of Russia’s largest multimodal transportation operators to deliver certain volumes of the petrochemical products such as basic polymers and synthetic rubbers to export markets.
WAREHOUSES AND DISTRIBUTION CENTRES
We purchase warehouse services from professional operators to store our petrochemical products in close proximity to the production sites as well as near the facilities of key customers. SIBUR has its own international sales desks as well as wide regional trading network in Russia.

Introduction Value Chain Business Overview Sustainability Corporate Governance Financial information
58 SIBUR 2014 Annual Review
SIBUR Production System
TO ACHIEVE COMPETITIVENESS WITH WORLD LEADING PRODUCERS SIBUR HAS DEVELOPED ITS OWN PRODUCTION
SYSTEM (SPS) BASED ON CONTINUOUS EFFICIENCY IMPROVEMENTS AT SIBUR’S PRODUCTION SITES THROUGH
UNIFORM BUSINESS PROCESSES AND CULTURE.
In 2014, SIBUR successfully continued SPS implementation on its 20 production sites with more than 19,000 employees involved. We strive to align our employees with key instruments of SPS, while focusing on training programmes for management.
More than 55,000 ideas on “Continuous improvement” for new developments in OH&S, operational enhancement and loss minimisation were applied by SIBUR’s employees.
The SPS was implemented in cooperation with Du Pont, a global chemical industry leader in innovations and production efficiency.
DENIS SAMOKHVALOV
Director, SIBUR Production System
“SPS helps employees to develop their potential for identifying issues, solving problems, sharing knowledge and best practices, and making better decisions. Our goal is to motivate every employee to generate ideas for improving performance and driving quality in everything we do.”

SIBUR Production System
59SIBUR 2014 Annual Review
Productive time
SIBUR PRODUCTION SYSTEM KEY COMPONENTS
Losses detection and classification through matching actual and maximum
capacity utilisation
ISSUE DETECTION
Continuous Improvement
Involvement of all employees into ideas generation process by implementation of suggestions aimed to ensure continuous
improvement
Visual Efficiency Management
Visualisation of key information to size up a situation at the
production site
Best Practices Capture
Seeking and implementation of best practices at all production sites
Six Sigma
Implementation of key tools of the concept to drive quality
improvements
SOLUTIONS & DECISIONS
UNIFICATION OF DECISIONS

Introduction Value Chain Business Overview Sustainability Corporate Governance Financial information
60SIBUR 2014 Annual Review

Sustainability
Our Commitment
Environment
Health & Safety
Employees
Communities and Society
City of Tobolsk, Tyumen Region
Content
61SIBUR 2014 Annual Review
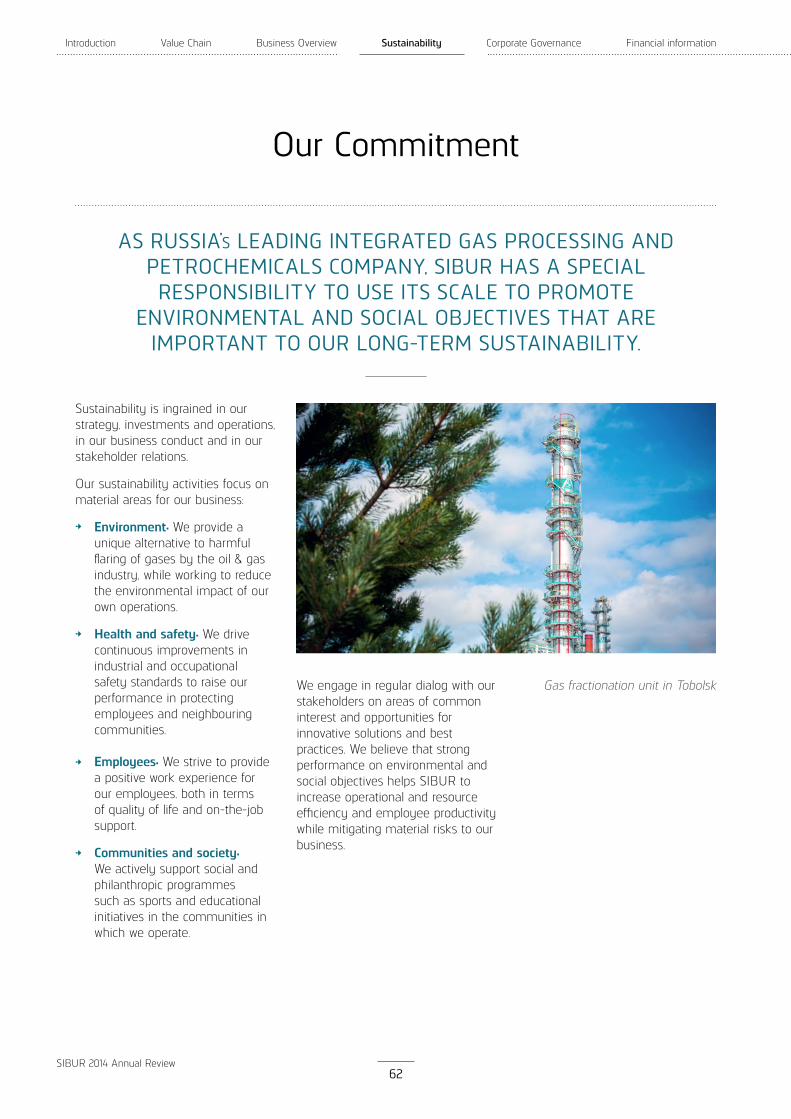
Introduction Value Chain Business Overview Sustainability Corporate Governance Financial information
62SIBUR 2014 Annual Review
Our Commitment
Sustainability is ingrained in our strategy, investments and operations, in our business conduct and in our stakeholder relations.
Our sustainability activities focus on material areas for our business:
Environment: We provide a unique alternative to harmful flaring of gases by the oil & gas industry, while working to reduce the environmental impact of our own operations.
Health and safety: We drive continuous improvements in industrial and occupational safety standards to raise our performance in protecting employees and neighbouring communities.
Employees: We strive to provide a positive work experience for our employees, both in terms of quality of life and on-the-job support.
Communities and society: We actively support social and philanthropic programmes such as sports and educational initiatives in the communities in which we operate.
We engage in regular dialog with our stakeholders on areas of common interest and opportunities for innovative solutions and best practices. We believe that strong performance on environmental and social objectives helps SIBUR to increase operational and resource efficiency and employee productivity while mitigating material risks to our business.
AS RUSSIA’S LEADING INTEGRATED GAS PROCESSING AND PETROCHEMICALS COMPANY, SIBUR HAS A SPECIAL RESPONSIBILITY TO USE ITS SCALE TO PROMOTE
ENVIRONMENTAL AND SOCIAL OBJECTIVES THAT ARE IMPORTANT TO OUR LONG-TERM SUSTAINABILITY.
Gas fractionation unit in Tobolsk

Our Commitment and Environment
63SIBUR 2014 Annual Review
Environment
Stakeholder groups
Employees
Governmental and localauthorities
NGOs
Customers
Capital markets
We continuosly invest in new technologies and reinforce our corporate environmental management system to reduce SIBUR’s environmental impact, comply with regulations and deliver on the Group’s commitments. We implement standarts and best practices in environmental management with the cooperation of international chemical companies, industry standarts bodies, non-profit organisations and govermental authorities.
SIBUR helps to reduce environmentally harmful on-field flaring of by-products of oil and gas extraction, primarily associated petroleum gas (APG). We process APG into a source of raw materials for basic polymers, synthetic rubbers and plastics — materials that provide substitutes for other natural resources consumed in industrial activity as an alternative to flaring.According to industry experts, flaring of one million cubic metres of APG releases into the atmosphere more than 300 tonnes of pollutants such as nitrogen dioxide, soot and carbon monoxide. In 2014, approximately 20.8 billion cubic metres of APG were processed by SIBUR, which is equivalent to preventing nearly seven million tonnes of harmful emissions.
PROTECTING THE ENVIRONMENT AND THE HEALTH AND SAFETY OF OUR EMPLOYEES AND NEIGHBOURS ARE FUNDAMENTAL OPERATING PRINCIPLES AT SIBUR AND PREREQUISITES FOR OUR SUSTAINABLE DEVELOPMENT.
ALBERT LYASKOVSKIY
Director, Environment, Health & Safety
“Our aim is a culture of continuous improvement, where every one of our employees follows best practices and seeks solutions that contribute to human health and safety and better environmental management.”
DECREASE WASTEWATER DISCHARGES
DECREASE AIR EMISSIONS
IMPROVE WASTE MANAGEMENT EFFICIENCY
IMPROVE ENERGY CONSUMPTION AND EFFICIENCY
OUR GOALS
7 preventedmln tonnes
of pollutants releases

Introduction Value Chain Business Overview Sustainability Corporate Governance Financial information
64SIBUR 2014 Annual Review
Environment(continued)
SIBUR’S ENVIRONMENTAL PROTECTION PROGRAMMES
At each of our production facilities,we have been implementing annualand long-term environmental protection programmes in order to reduce the impact of our operations.
Water
Wastewater discharges were reduced by 16% year-on-year. This was primarily a result of our initiatives to recycle waste water in industrial applications as well as decreased production of synthetic rubbers, a highly water-intensive activity.
2014
53.8
2013
63.9
2012
65.969.1
2011
426
WASTEWATER DISCHARGEmln cubic metres
In 2014, we focused on the followinginitiatives to decrease water usageand minimise the content ofpollutants in wastewater discharge volumes:
replacement of fresh water for recycled wastewater in the production process at Togliattikauchuk (Togliatti);
improvements in physical-chemical and biological treatment and reconstruction of sewage neutralisation unit at Voronezhsintezkauchuk (Voronezh) and SIBUR-Khimprom (Perm);
construction of local waterdisposal sewers and reconstruction of existing treatment facilities at SIBUR production sites.
Collection of water samples for analysis at Kama river

Environment
65SIBUR 2014 Annual Review
Air
Harmful emissions declined by nearly 5% compared to 2013 and by 12% over the past three years. The 2014 results are due primarily to lengthy maintenance shutdowns at our production sites in Kstovo, Nizhniy Novgorod and Blagoveschensk and the closure of an obsolete Caprolactam’s production site.
In 2014, we implemented air quality initiatives and installed pollution control equipment to reduce harmful emissions:
installation of gas feed system at Uralorgsintez (Perm region) that redirects emissions to flare tips;
purchase of ecomobiles and gas analysers for automated air quality monitoring at SIBUR-Kstovo (Kstovo) and Nizhnevartovskiy GPP (Nizhnevartovsk);
technical reconstruction of a closed system for gas usage to decrease ethylene emissions into the atmosphere at Tomskneftekhim (Tomsk).
Waste
We significantly improved waste management performance with a 44% reduction in solid waste generated by our facilities. This improvement was made possible by the dismantling of outdated facilities, completion of construction works and decline in volumes of processing wastes.
In 2014, our key waste management programme activities comprised the following:
removal of outdated catalysts at Uralorgsintez (Perm region) and Tobolsk-Neftekhim (Tobolsk);
collection programmes for used batteries and mercury lamps at Tomskneftekhim (Tomsk), SIBUR-Kstovo (Kstovo) and BIAXPLEN;
sludge reservoir cleaning at SIBUR-Khimprom (Perm);
renovation of a recycling facility to process polymer wastes from synthetic rubber production.
2014
55.9
2013
58.6
2012
61.2
2011
63.2
AIR POLLUTION‘000 tonnes
2014
74.0
2013
131.6
2012
123.9
2011
159.4
SANITARY WASTE GENERATION‘000 tonnes
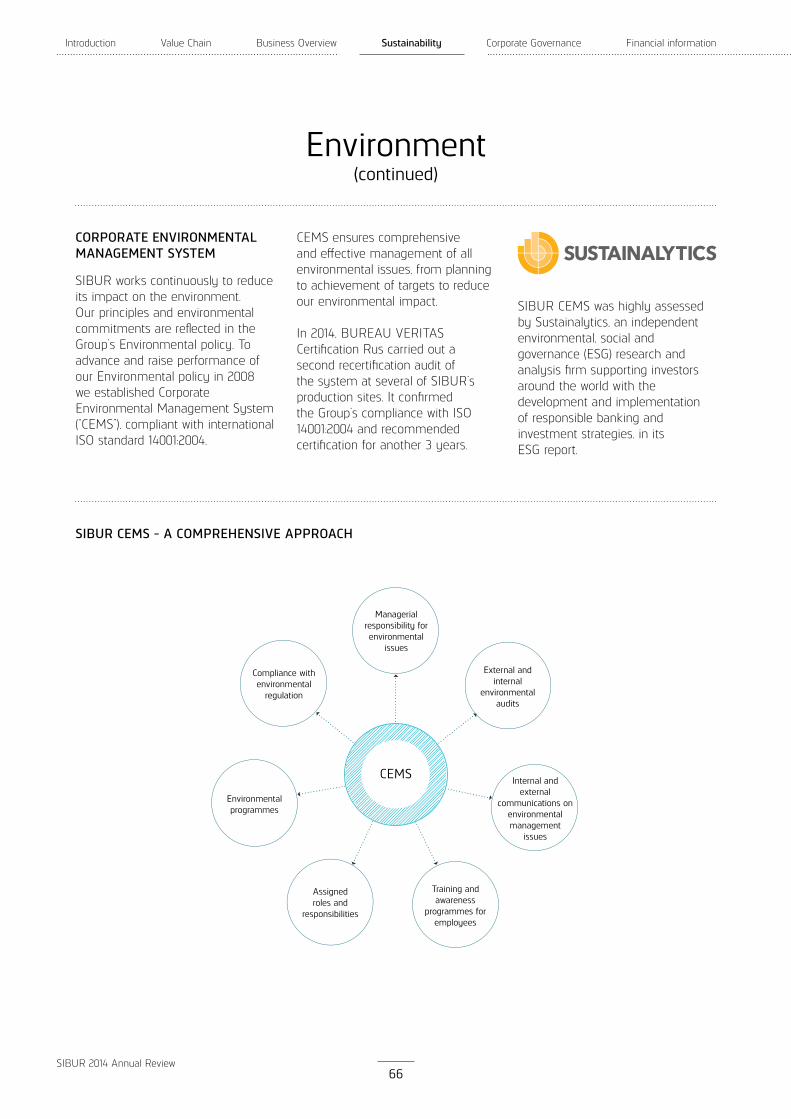
Introduction Value Chain Business Overview Sustainability Corporate Governance Financial information
66SIBUR 2014 Annual Review
Environment(continued)
CORPORATE ENVIRONMENTAL MANAGEMENT SYSTEM
SIBUR works continuously to reduce its impact on the environment. Our principles and environmental commitments are reflected in the Group’s Environmental policy. To advance and raise performance of our Environmental policy in 2008 we established Corporate Environmental Management System (“CEMS”), compliant with international ISO standard 14001:2004.
SIBUR CEMS - A COMPREHENSIVE APPROACH
CEMS ensures comprehensive and effective management of all environmental issues, from planning to achievement of targets to reduce our environmental impact.
In 2014, BUREAU VERITAS Certification Rus carried out a second recertification audit of the system at several of SIBUR’s production sites. It confirmed the Group’s compliance with ISO 14001:2004 and recommended certification for another 3 years.
SIBUR CEMS was highly assessed by Sustainalytics, an independent environmental, social and governance (ESG) research and analysis firm supporting investors around the world with the development and implementation of responsible banking andinvestment strategies, in its ESG report.
Managerialresponsibility forenvironmental
issues
Internal and external
communications on environmental management
issues
External and internal
environmental audits
Training and awareness
programmes for employees
Assigned roles and
responsibilities
Environmental programmes
Compliance with environmental
regulation
CEMS
Environment
67SIBUR 2014 Annual Review
RESPONSIBLE CARE
In 2014, SIBUR became a member of the chemical industry’s Responsible Care® programme — a voluntary global initiative that drives continuous improvement in occupational health & safety, industrial safety and environmental performance. As a member, SIBUR is required to regularly report on its environmental performance to a national industry association
(the Russian Chemists Union), carry out audits including those performed by international companies, implement social development projects and enhance its social responsibility.
In 2014, SIBUR made its first report to the Russian Chemists Union on its results for the prior year and provided a work plan for the programme to be implemented in 2015.
EQUATOR PRINCIPLES
SIBUR aims to comply with applicable international regulations. Our newly launched Tobolsk-Polymer and RusVinyl petrochemical complexes as well as ongoing ZapSib-2 project (ZapSibNeftekhim) —are in compliance with the Equator Principles, the credit risk management framework for
determining, assessing and managing environmental and social risks applied by the lenders in connection with the financing of those projects.
REACH REGULATION
SIBUR is in compliance with REACH Regulation, the European Union enacted regulation on Registration,
Evaluation, Authorisation and Restriction of Chemicals. All substances contained in products exported by SIBUR to the EuropeanUnion are registered with the European Chemicals Agency (ECHA). SIBUR developed and maintains safety data sheets (SDS) with up-to-date information for each relevant product.
Vienna Convention for the Protection of the Ozone Layer;
United Nations Framework Convention on Climate Change;
Convention on Long-range Transboundary Air Pollution adopted by the United Nations Economic Commission for Europe;
Montreal Protocol on Substances that Deplete the Ozone Layer (including provisions);
Basel Convention on the Control of Transboundary Movements of Hazardous Wastes and Their Disposal;
Stockholm Convention on Persistent Organic Pollutants.
SIBUR STRIVES TO ADHERE TO THE FOLLOWING INTERNATIONAL ENVIRONMENTAL CONVENTIONS AND PROTOCOLS:

Introduction Value Chain Business Overview Sustainability Corporate Governance Financial information
68SIBUR 2014 Annual Review
Environment(continued)
Ecological laboratory course at Gubkinskiy
“BUSINESS FOR ECOLOGY” CORPORATE PROGRAMME
SIBUR launched this philanthropic programme to mobilise financial and organisational support for non-profit environmental organisations in 2011. SIBUR supports projects focused on cultivating environmental conscience by encouraging volunteer participation and community involvement, including youth engagement.
In 2014, these initiatives sponsored by SIBUR were implemented in partnership with the Dront Ecological Centre, the All-Russian Society for the Protection of Nature, the Togliatti Community Foundation and other non-profit environmental groups.
28
>5,500
environmental projects implemented
participants
7
11
competitions raising ecological awareness
Russian regions served

Environment
69SIBUR 2014 Annual Review
ENERGY EFFICIENCY
SIBUR’s production processes are energy-intensive. Our objective is to conserve energy through efficient energy consumption management and projects to increase energy efficiency at our production sites.
In 2012, SIBUR established its corporate Energy Management System (“EnMS”) compliant with international ISO 50001 standard for the integrity of energy saving processes. In 2014, external auditors confirmed the compliance of EnMS with the standard at our headquarters in Moscow and at SIBUR-Khimprom (Perm). We aim to progress SIBUR’s EnMS to full certification at all production sites over the next three years, with five sites scheduled for 2015.
Since 2012, SIBUR operates an IT information management sytem that monitors and analyses our energy efficiency programme performance. The system enables planning and forecasting of energy consumption and knowledge sharing of best practices at our production sites.
As part of our sustainable business development strategy, every year we develop and implement Energy Conservation Programmes with projects designed to advance our energy savings goals throughout our extensive operations.
Electricity consumption volumes increased 38% year-on-year primarily due to full consolidation of Yugragazpererabotka following the acquisition in March 2014. Net of this effect, implementation of energy-saving initiatives enabled SIBUR to maintain energy consumption at 2013 levels despite the launch and commercial ramp-up of large-scale projects. A 7% increase in heat consumptionwas mainly attributable to the launch of Tobolsk-Polymer, which requires heat-intensive production processes.
In 2014, we implemented the following initiatives:
launch of an 18 MW power plant at SIBUR-Khimprom (Perm), which will enable us to meet approximately 40% of the site’s electric power needs;
adoption of a Corporate Energy policy to comply with ISO 50001;
efficiency improvements and optimisation solutions through better use of resources and fuels.
SIBUR won an award for promoting best practices in energy efficiency at the 3rd ENES All-Russia Energy Efficiency and Energy Savings Contest under the auspices of the Ministry of Energy of the Russian Federation in November 2014.
2014201320122011
ELECTRICITY CONSUMPTIONbln kW h
2014
18.4
2013
17.2
2012
17.9
2011
17.4
HEAT CONSUMPTIONmln Gcal
Yugragazpererabotka consumption volumes
Tobolsk-Polymerconsumption volumes
3.5
8.2
3.3
7.9
0.8
5.5 2.9
7.6
1.9

Introduction Value Chain Business Overview Sustainability Corporate Governance Financial information
70SIBUR 2014 Annual Review
Health & Safety
WE FACTOR THE SAFETY OF OUR EMPLOYEES, SURROUNDING COMMUNITIES AND THE ENVIRONMENT INTO ALL OF OUR
OPERATIONAL PLANNING AND MANAGEMENT. SIBUR OPERATES AN EXTENSIVE NETWORK OF INDUSTRIAL FACILITIES AND
ENSURING WORKPLACE SAFETY IS CORE TO EVERYTHING WE DO.
We are proud to report that company-wide efforts to improving safety resulted in zero fatalities and industrial accidents in 2014. This is a major achievement as compared to 2013, when unfortunately there was one fatality and two industrial accidents.
In 2014, we continued to implement initiatives targeting reductions in injuries and accidents among our employees and contractors. To improve industrial safety we distribute information sheets on corrective actions and hold behavioural audits. Before work is conducted we initiate a systematic preliminary risk assessment process. We have also been removing obsolete production lines to increase efficiency and help us meet our goal of reducing industrial hazards. In 2014, we closed a further 6 obsolete production lines, reducing the total targeted for removal to 197 down from 247 when this programme was launched in 2012.
Stakeholder groups
Employees
Governmental and local authorities
NGOs
Capital markets
LTIFR IMPROVEMENT
ZERO FATALITY
ABSENCE OF INDUSTRIAL ACCIDENTS
HAZARDS REDUCTION
OUR GOALS

Health & Safety
71SIBUR 2014 Annual Review
Key initiatives in 2014 also included:
adoption of a company-wide Environmental, Health and Safety (EHS) Management Compliance System;
new principles for developing and measuring EHS system effectiveness to enhance compliance with government regulations and corporate policies;
ongoing monitoring and evaluation of industrial risk mitigation policies and mechanisms;
new unified standard for hazards identification and risk assessment, now being deployed at industrial sites with obsolete production lines.
We believe that the most efficient way to promote industrial and occupational safety at our production facilities is to fully engage employees in corporate industrial and occupational safety management.
Since 2011, SIBUR holds a competition for the best maintenance of industrial areas and buildings. The Company also runs a contest for the best Maintenance and Operations team. Winners receive cash prizes and gift certificates. In 2014, SIBUR’s Leaders and Champions Programmeawarded the Leader title to 2,597 employees and recognised 169 as Champions for safety related achievements.
2014
197
2013
203
2012
247
2011
247
HAZARDOUS FACILITIESunits
2014
0.73
2013
0.76
2012
0.81
2011
0.81
LTIFR(1)
(1) Lost Time Frequency Rate (LTIFR) is the number of injured employees per million working hours.

Introduction Value Chain Business Overview Sustainability Corporate Governance Financial information
72SIBUR 2014 Annual Review
Employees
As of 31 December 2014, SIBUR had 25,580 employees, of which 25% were employed by the feedstock & energy segment, 55% by the petrochemical business and 20%in logistics, sales & marketing, administration and other centralised project management and support activities.
Our workforce gender profile is in line with the gas processing and petrochemicals industries, with men and women accounting for 63% and 37% of employees, respectively.
We recognise that attracting talentedyoung workers and retaining experienced, qualified professionals is essential to building a strong and productive workforce. In 2014, some 23% of our employees were under the age of 30, 30 to 40 year-olds accounted for 32%, employees ages 40 to 50 — 23% and 22% were over age 50. SIBUR’s average headcount in 2014 amounted to 25,926 employees. The decrease in average headcount was attributable to the divestment of plastic compounds division at SIBUR-Neftekhim and Oka Polymer industrial park as well as headcount optimisation at our production sites.
Stakeholder groups
Employees
Governmental and local authorities
PROFESSIONAL DEVELOPMENT OF EMPLOYEES
ATTRACTION AND RETAINING TALENTS
CULTIVATION OF GOOD WORKING ENVIRONMENT
OUR GOALS
EMPLOYEES By segment
Feedstock&energy
Petrochemicals
Logistics, marketing,administrative
25%55%20%
1
2
3
2
3
1
By age group
Under 30 years
From 30 to 40 years
From 40 to 50 years
Over 50 years
23%32%
23%
22%
1
2
3
4
3
4 1
2
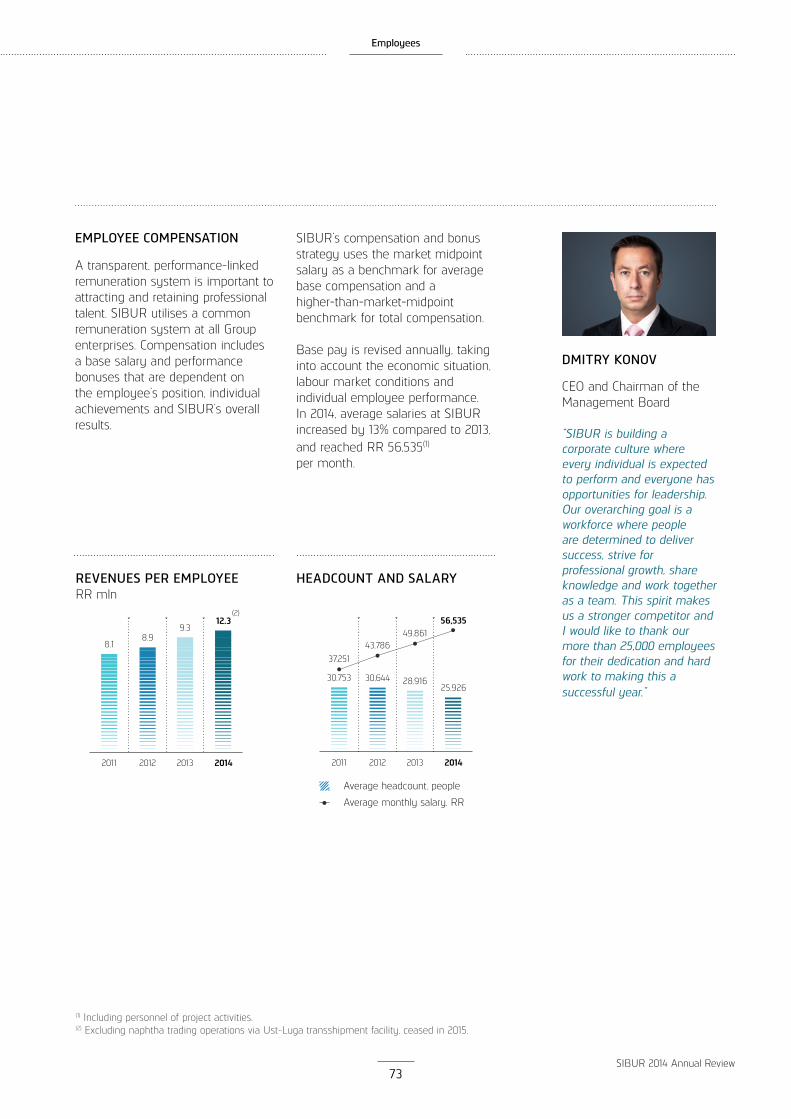
Employees
73SIBUR 2014 Annual Review
DMITRY KONOV
CEO and Chairman of the Management Board
“SIBUR is building a corporate culture where every individual is expected to perform and everyone has opportunities for leadership. Our overarching goal is a workforce where people are determined to deliver success, strive for professional growth, share knowledge and work together as a team. This spirit makes us a stronger competitor andI would like to thank our more than 25,000 employeesfor their dedication and hard work to making this a successful year.”
EMPLOYEE COMPENSATION
A transparent, performance-linked remuneration system is important to attracting and retaining professional talent. SIBUR utilises a common remuneration system at all Group enterprises. Compensation includes a base salary and performance bonuses that are dependent on the employee’s position, individual achievements and SIBUR’s overall results.
SIBUR’s compensation and bonus strategy uses the market midpoint salary as a benchmark for average base compensation and a higher-than-market-midpoint benchmark for total compensation.
Base pay is revised annually, taking into account the economic situation,labour market conditions and individual employee performance. In 2014, average salaries at SIBUR increased by 13% compared to 2013, and reached RR 56,535(1)
per month.
2014
56,535
2013
49,861
2012
43,786
2011
37,251
30,753 30,644 28,91625,926
HEADCOUNT AND SALARY
2014
12.3
2013
9.3
2012
8.9
2011
8.1
REVENUES PER EMPLOYEERR mln
(2)
Average headcount, people
Average monthly salary, RR
(1) Including personnel of project activities.(2) Excluding naphtha trading operations via Ust-Luga transshipment facility, ceased in 2015.

Introduction Value Chain Business Overview Sustainability Corporate Governance Financial information
74SIBUR 2014 Annual Review
Employees(continued)
HEALTH AND WELLNESS PROGRAMMES
We believe it is important not only to ensure a positive working environment for our employees, but also to help them and their families live healthy lives.
SIBUR’s employees receive medical benefits that go beyond mandatoryhealth insurance programme requirements. We are pleased to report that since 2011 all of SIBUR’s full-time employees are coveredby Voluntary Health Insurance (VHI). We also provide employees with free access to various sport facilities and health promotion activities.
Major corporate sporting events have become a tradition. In winter we run the SIBUR Ski Track, in summer we hold the SIBUR Spartakiada Games and in the autumn our employees participate in the Volga Autumn competition. SIBUR-Yug, the Company’s corporate resort in Anapa on the Black Sea coast offers medicaltreatment and summer holidays to our employees and their families at attractive rates.
As a responsible employer, SIBUR conducts and pays for 100% of regular routine medical examinations and compulsory health screenings for all employees preparing for or already working in hazardous labour conditions.
100%
642
of employees are coveredby VHI insurance
children of employees received medical treatment as part
of our “Mother and Child” programme
1,403
1,180
employees visited our corporate resort SIBUR-Yug
employees’ children spent summer vacations at the
SIBUR-Yug resort

Employees
75SIBUR 2014 Annual Review
ANDREY ZHVAKIN
Member of the Management Board andManaging Director, Organisational Development
“Beyond developing individual and professional skills, we aim to promote collaboration among our talented employees so that they share ideas, transfer knowledge and communicate more effectively in a variety of business situations.”
PERSONNEL TRAINING AND CAREER DEVELOPMENT
Corporate university
SIBUR believes that investing in the professional growth of our employees goes hand in hand with the sustainable growth of the Company. SIBUR’s Corporate University offers a structured process and tools for our employees professional development.
Key 2014 developments:
developed and implemented targeted programmes covering 2,277 employees to improve their functional effectiveness and management of strategic business issues;
extended focused trainings and programmes by safety experts on the topic of occupational safety for industrial employees;
continued development of internal coaching programme to strengthen training and managerial skills at all levels;
developed and implemented educational programmes for senior executives in cooperation with the IMD Business School.
Executive talent pool programme
SIBUR’s talent development programme involves our employees at all levels of the Company. The benefits of this programme are evident in the movementof employees across the entire enterprise to broaden their professional experience and develop technical skills.
This approach is also applied to nonproduction workers. The talent development programme has been successful in identifying opportunities for leadership. Out of the 500 employees who participated in 2013 and 2014, nearly one-third have been promoted or were assigned to key projects.
8,482
238
employees completed educational programmes
events conducted by in-house coaches
435
47
industrial employees completed OHS trainings
senior managers completed specially tailored IMD business
programmes

Introduction Value Chain Business Overview Sustainability Corporate Governance Financial information
76SIBUR 2014 Annual Review
Employees(continued)
Recruitment and development of entry-level professionals
SIBUR strives to recruit and retain best and brightest young employees. We tailor education programmes geared towards training young professionals in partnership with specialised schools, vocational and higher education institutions.
SIBUR’s induction programme for young new hires, established in 2012, aims to support recent graduates at the start of their careers at SIBUR. The two-year induction programme for young employees starting jobs at production sites includes personal
evaluations, personal development programmes and definition of career steps to promotion. During 2014, 173 recent graduates joined the programme.
We also offer final year students paid summer and autumn internships of three to six months. The internship selection process includes various tests, interviews, business case exercises and a final stage of the process at our assessment centre. The best performing students are offered a job at SIBUR upon graduation. In 2014, 39 students completed internships at SIBUR and 13 of them came to work full-time at the Company.
SIBUR’s fall internship - 2014
Employees
77SIBUR 2014 Annual Review
PARTNERSHIPS WITH HIGHER EDUCATION
SIBUR actively cooperates with educational institutions to promote scientific knowledge and advancements in chemistry and chemical engineering and support talented graduates. We partner with universities in Moscow, Tobolsk, Tyumen, Perm, Voronezh, Togliatti, Nizhniy Novgorod, Tomsk, Nizhnevartovsk, Krasnodar, Dzerzhinsk, Krasnoyarsk, Ufa, Kstovo, Novokuybyshevsk etc.
SIBUR supports the development of specialised departments within higher education institutions and on-site skills upgrading for university professors at our enterprises. Leading SIBUR specialists also lecture at educational institutions.
Key activities in cooperation with educational institutions in 2014:
vocational training to help graduates begin their careers at SIBUR, and apprenticeships at SIBUR’s production sites with more than 1,000 participants every year;
grants and scholarships for the best students and professors;
technical skills and knowledge transfer for university professors conducted at SIBUR’s enterprises;
more than 30 production site visits a year by classes from higher education institutions;
educational facility upgrades to promote chemistry research;
more than 70 events for students: career’s days, chemical industry days, academic conferences.
We currently have agreements with D. Mendeleev University of Chemical Technology of Russia and Tomsk Polytechnic University, where we established master programmes providing scholarships and access to SIBUR R&D centres for their studies. In 2014, the four best studentswere employed by SIBUR’s NIOST corporate R&D centre upon graduation.
SIBUR supports chemical engineering schools through opening new school chemistry labs in Togliatti, Perm, Voronezh, Tobolsk, Nizhnevartovsk, Noyabrsk, Gubkinskiy and Pyt-Yakh, giving lessons at schools and arranging production site visits.

Introduction Value Chain Business Overview Sustainability Corporate Governance Financial information
78SIBUR 2014 Annual Review
Communities and Society
SIBUR IS COMMITTED TO BETTERING THE LIVES OF PEOPLE AND COMMUNITIES IN REGIONS WHERE WE OPERATE. WE ARE
ENGAGED IN PHILANTHROPIC PROGRAMMES AND PARTNERSHIPS.
Our social commitments include investments in regional infrastructure and support for sports organisations, child and youth sports and ecological initiatives. We also support Russian science and professionaleducation in cooperation with leading chemical institutes, universities and schools.
REGIONAL DEVELOPMENT
As a major investor in the economic development of the regions where we operate, we have signed agreements with various regional governing bodies to address socially important issues. This includes support of local public initiatives and events, development of social infrastructure and quality of life improvements.
In 2014, our efforts saw the implementation in more than 40 community projects in the Khanty-Mansi and Yamalo-Nenets Autonomous Areas, Tomsk, Leningrad and Perm regions:
road reconstruction in the Khanty-Mansi Autonomous Area;
redevelopment of schools, nurseries and day care centres in the Khanty-Mansi Autonomous Area and the Leningrad region;
redevelopment of recreational centres for children in the Khanty-Mansi Autonomous Area;
construction and redevelopment of children’s playgrounds and sports fields in the Yamalo-Ne-nets Autonomous Area and the Perm region;
sponsorship of City Days and national festivals, events dedicated to the promotion of healthy lifestyle in the Tyumen,Tomsk, Nizhniy Novgorod, Samara and Perm regions, the Bashkortostan Republic, Yamalo-Nenets and Khanty-Mansi Autonomous
Stakeholder groups
Governmental and local authorities
NGOs
Employees
Media
SOCIAL AND ECONOMIC DEVELOPMENT IN THE REGIONS OF OPERATIONS
PROMOTION OF EDUCATION AND SCIENCE IN REGIONS OF OPERATIONS
PARTNERSHIP WITH LOCAL GOVERNMENTS AND COMMUNITIES
OUR GOALS

Communities and Society
79SIBUR 2014 Annual Review
ATHLETIC PROGRAMMES
As part of our aim to promote community activities and healthy lifestyles for youths and adults SIBUR supports professional sports organisations and local events. In 2014, we sponsored the Spartak Basketball Team (St. Petersburg) and Neftekhimik Basketball Team (Tobolsk), Khimik Football Club (Dzerzhinsk), Nizhniy Novgorod Basketball Club, Yugra Hockey Club (Khanty-Mansiysk), Samotlor Volleyball Club (Nizhnevartovsk), the Tyumen Football, Volleyball and Table Tennis Clubs, the Rubin Hockey Club (Tyumen region), the Centre for Training and Conducting Sport Events of the State Autonomous Enterprise of the Tyumen region, the Regional Specialised Children’s and Youth Sports School of Olympic Reserve (Tyumen), Children’s Hockey Sports School №24 (Voronezh), Krasnye Krylia Basketball Sports School №2 (Togliatti), Start and Vityaz Sports Schools (Perm region), Phoenix (Nizhnevartovsk) and Dolphin (Nyagan) Children’s and Youth Sports Schools, Children’s and Youth Sports School №1 (Tyumen) and the Modern Pentathlon, Table Tennis and Kick-boxing Federation of Russia, the Perm region Biathlon and Football Federations, Krasnodar region Combat Sports Association, Tchaikovsky Hockey and Table Tennis Federation, Pyt-Yakh Dance Sport Federation and Kstovo International Sambo Academy.
In 2014, SIBUR signed a three-year agreement with the National Basketball Association to provide free access to basketball facilities, grow the appeals of basketball in Russia, and promote active lifestyles. We also established a multi-year partnership with Student Basketball Association.
Basketball tournament in partnership with NBA
70
20
local sports events and competitions supported
sport facilities reconstructed
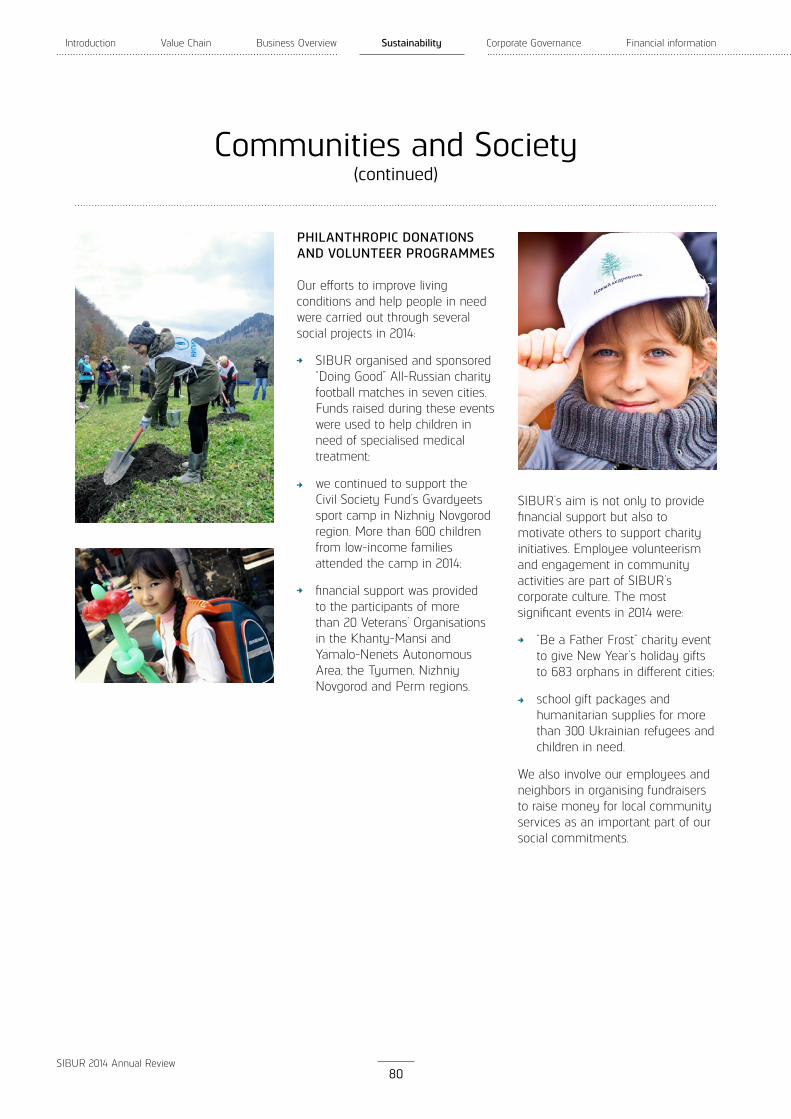
Introduction Value Chain Business Overview Sustainability Corporate Governance Financial information
80SIBUR 2014 Annual Review
Communities and Society(continued)
PHILANTHROPIC DONATIONS AND VOLUNTEER PROGRAMMES
Our efforts to improve living conditions and help people in need were carried out through several social projects in 2014:
SIBUR organised and sponsored “Doing Good” All-Russian charity football matches in seven cities. Funds raised during these events were used to help children in need of specialised medical treatment;
we continued to support the Civil Society Fund’s Gvardyeets sport camp in Nizhniy Novgorod region. More than 600 children from low-income families attended the camp in 2014;
financial support was provided to the participants of more than 20 Veterans’ Organisations in the Khanty-Mansi and Yamalo-Nenets Autonomous Area, the Tyumen, Nizhniy Novgorod and Perm regions.
SIBUR’s aim is not only to providefinancial support but also to motivate others to support charity initiatives. Employee volunteerism and engagement in community activities are part of SIBUR’s corporate culture. The most significant events in 2014 were:
“Be a Father Frost” charity event to give New Year’s holiday gifts to 683 orphans in different cities;
school gift packages and humanitarian supplies for more than 300 Ukrainian refugees and children in need.
We also involve our employees and neighbors in organising fundraisers to raise money for local community services as an important part of our social commitments.
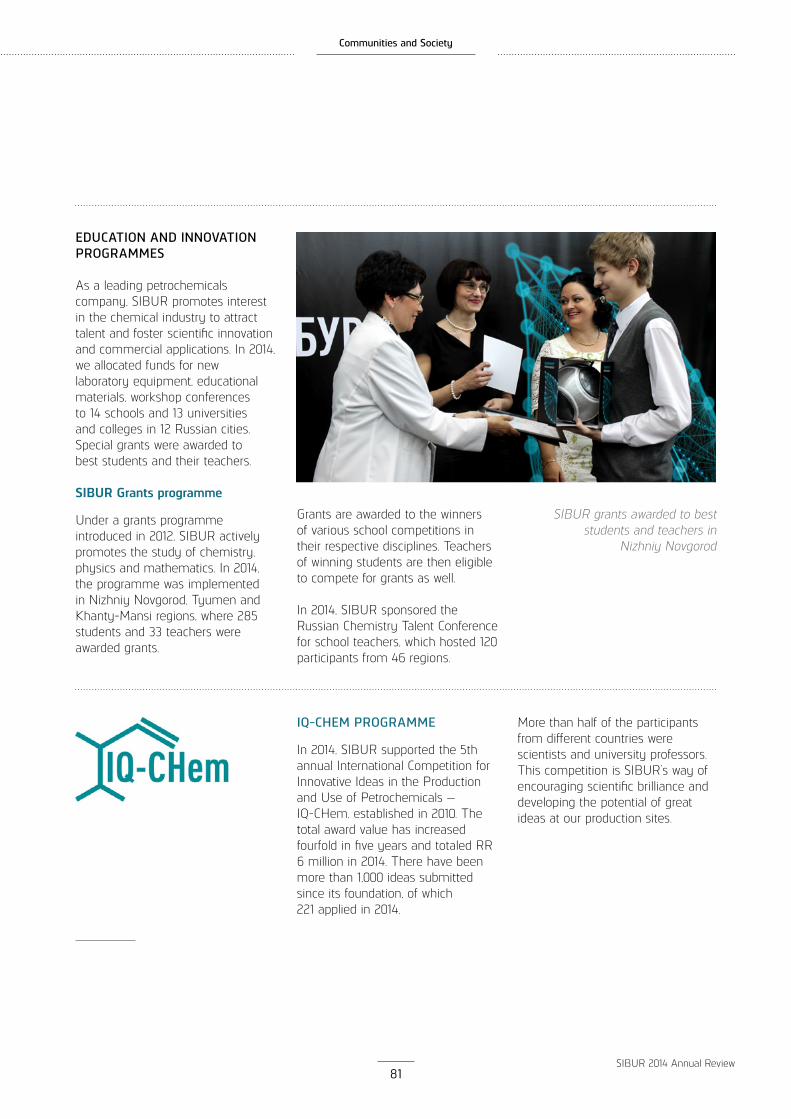
Communities and Society
81SIBUR 2014 Annual Review
EDUCATION AND INNOVATION PROGRAMMES
As a leading petrochemicals company, SIBUR promotes interest in the chemical industry to attract talent and foster scientific innovation and commercial applications. In 2014, we allocated funds for new laboratory equipment, educational materials, workshop conferencesto 14 schools and 13 universities and colleges in 12 Russian cities. Special grants were awarded to best students and their teachers.
SIBUR Grants programme
Under a grants programme introduced in 2012, SIBUR actively promotes the study of chemistry, physics and mathematics. In 2014, the programme was implemented in Nizhniy Novgorod, Tyumen and Khanty-Mansi regions, where 285 students and 33 teachers were awarded grants.
Grants are awarded to the winners of various school competitions in their respective disciplines. Teachers of winning students are then eligible to compete for grants as well.
In 2014, SIBUR sponsored the Russian Chemistry Talent Conference for school teachers, which hosted 120 participants from 46 regions.
SIBUR grants awarded to best students and teachers in
Nizhniy Novgorod
IQ-CHEM PROGRAMME
In 2014, SIBUR supported the 5th annual International Competition for Innovative Ideas in the Production and Use of Petrochemicals — IQ-CHem, established in 2010. The total award value has increased fourfold in five years and totaled RR 6 million in 2014. There have been more than 1,000 ideas submitted since its foundation, of which 221 applied in 2014.
More than half of the participants from different countries were scientists and university professors. This competition is SIBUR’s way of encouraging scientific brilliance and developing the potential of great ideas at our production sites.

Introduction Value Chain Business Overview Sustainability Corporate Governance Financial information
82SIBUR 2014 Annual Review

Corporate Governance
Board of Directors
Board Committees
Management Board
Equity-Settled Share-Based Payment Plans
Share Capital
Dividends
Risk Management
Vyngapurovskiy GPP
Content
83SIBUR 2014 Annual Review

Introduction Value Chain Business Overview Sustainability Corporate Governance Financial information
84SIBUR 2014 Annual Review
Corporate Governance
SIBUR(1) ESTABLISHES AND IMPLEMENTS CORPORATE GOVERNANCE POLICIES, FINANCIAL CONTROLS AND REPORTING TO PROTECT SHAREHOLDERS AND ENSURE A TRANSPARENT,
WELL-RUN COMPANY.
MARINA MEDVEDEVA
Director, Corporate Secretary / Administrative Services Director / Winner of “Director of the year” in 2014 / “Corporate Governance Director / Corporate Secretary” nomination
“We constantly review Russian and international best practices and develop policies with the goal of strengthening corporate governance at SIBUR and ensuring the effectiveness of our Board of Directors and executive bodies.”
(1) Hereinafter “we”, “SIBUR”, the “Company” or the “Group” jointly refer to PJSC SIBUR Holding.
The Company complies with the requirements of the Code ofCorporate Conduct, approved by the PJSC SIBUR Holding Board of Directors on 16 December 2014 (Revision No. 5), as well as with the revised Code of Corporate Conduct, approved by the Central Bank of the Russian Federation on 21 March 2014.
Adherence to the Code of Corporate Conduct at all levels of the Companymakes SIBUR a more robust, efficient, high-performing business and a more attractive long-term investment.
CORPORATE GOVERNANCE PRINCIPLES
Equal treatment of the Company’s shareholders
Real opportunity of shareholders to exercise their rights
Strategic management of the Company’s activities and effective supervision over the Company’s executive bodies by the Board of Directors
Active cooperation of the Company with the investors, creditors and other stakeholders
Reasonable and honest implementation by the executive bodies of the effective management of the Company’s current activities
Effective control over the financial and business activities of the Company
Timely disclosure of reliable information about the Company
Source: Code of Сorporate Conduct of PJSC SIBUR Holding (Revision No. 5), December 2014. Visit the Company’s website to see the document at http://investors.sibur.com/corporate-governance/corporate-documents

Corporate Governance
85SIBUR 2014 Annual Review
CORPORATE GOVERNANCE STRUCTURE
SIBUR’s management structure consists of the General Meeting of Shareholders, the Group’s Board of Directors, the Management Board, the Sole Executive Body, and the Audit Commission.
The General Meeting of Shareholders, which is the supreme governing body of SIBUR, is empowered to decide on the Group’s most critical issues and activities, expressly set forth in the Russian Federation Law “On Joint Stock Companies” and SIBUR’s Charter, including election of the Board of Directors.
The most recent Annual General Shareholders’ Meeting took place on 24 April 2015.
The revised version of the Charter of PJSC SIBUR Holding (Revision No. 14), approved by the resolution of the Extraordinary General Meeting of Shareholders of 13 October 2014, confirmed SIBUR’s status as Public Joint Stock Company authorised to make public offerings of equity securities. The revision became necessary due to changes in the Federal Law as of 5 May 2014 N 99-FZ, effective since 1 September 2014.
The Board of Directors is the governing body of SIBUR responsible for the strategic management of the Group’s activities, aimed at creating and enhancing shareholder value. The Board of Directors makes decisionson all general management issuesexcept for those that are the exclusive prerogative of the General Shareholders’ Meeting.
Board of Directors
Leonid Mikhelson(Chairman)
Management Board
Dmitry Konov(Chairman)
Audit Committee
Human Resources and Remuneration
Committee
Audit Commission
Sole Executive
Body
EXECUTIVE BODIES
Strategy and Investments Committee
GENERAL MEETING OF
SHAREHOLDERS

Introduction Value Chain Business Overview Sustainability Corporate Governance Financial information
86SIBUR 2014 Annual Review
Corporate Governance(continued)
All issues concerning the formation, responsibilities and activities of the Group’s governing and controlling bodies are stipulated in the Charter and relevant internal documents, including:
by-laws of the General Shareholders’ Meeting of PJSC SIBUR Holding;
by-laws of the Board of Directors of PJSC SIBUR Holding;
by-laws of the Management Board of PJSC SIBUR Holding;
by-laws of the Audit Commission of PJSC SIBUR Holding.
SIBUR’s Management Board is the Group’s collegial executive body, responsible for effective management of the Group and implementing resolutions made by the General Shareholders’ Meeting and the Group’s Board of Directors.
SIBUR’s Sole Executive Body is the Management Company OOO SIBUR as per a resolution of the General Shareholders’ Meeting. The rights and responsibilities of the Management Company are governed by the Federal Law “On Joint Stock Companies”, the Group’s Charter, and the agreement between PJSC SIBUR Holding and the Management Company.
The responsibilities of the Management Company include all day-to-day management issues except for those that are the exclusive prerogative of the General Shareholders’ Meeting, the Board of Directors and the Management Board.
In accordance with Russian law, the General Shareholders’ Meeting elects the Group’s Audit Commission to review the preparation of accurate financial and accounting statements, other information about the Group’s financial and operational activities,and the status of the Group’s assets. The Audit Commission is also tasked with enhancing asset management effectiveness, mitigating SIBUR’s financial and operational risks, and optimising internal controls.
An external independent auditor conducts an annual audit of the Group’s financial statements in accordance with Russian Accounting Standards (RAS) and consolidated financial statements in accordance with International Financial Reporting Standards (IFRS). The auditor is approved by the General Shareholders’ Meeting based on the recommendation of the Board of Directors.
Visit the Company’s website to find more information on these documents at http://investors.sibur.com/corporate-governance

Board of Directors
87SIBUR 2014 Annual Review
Board of Directors
BOARD ROLE AND RESPONSIBILITIES
The responsibilities of the Board of Directors include the strategic management of the Group’s business activities in compliance with the Federal Law “On Joint Stock Companies” and SIBUR’s Charter.
The Board of Directors determines SIBUR’s strategic priorities, approves annual and long-term business plans and annual investment programmes, oversees the Group’s financial activities andinternal controls, and offers recommendations on dividends payments.
BOARD COMPOSITION
The members of the Group’s Board of Directors are elected by the Annual General Meeting of Shareholders. They serve until the next Annual General Meeting of Shareholders unless the Board in its entirety is terminated prior to the expiration of its term based upon a decision of the Group’s shareholders.
The members of the Group’s Board of Directors were elected by the Annual General Meeting of Shareholders held on 24 April 2015. On 26 December 2014, the Board of Directors of the Company was re-elected in its new extended (10 persons) personal composition.
In accordance with the Charter, the minimum number of elected members of the Board of Directors is seven. The Group is committed to transparent election procedures for each member, which, among other provisions, entail the following:
the Group’s shareholders are entitled to nominate members of the Board of Directors;
the Group discloses information on the composition of the current Board of Directors and on prospective candidates in a timely manner;
cumulative voting is applied in the election of members of the Board of Directors.
SAFEGUARDING SHAREHOLDERS’ INTERESTS AND OVERSEEING CORPORATE STRATEGY ARE THE KEY PILLARS OF THE WORK OF
SIBUR’S BOARD OF DIRECTORS.

Introduction Value Chain Business Overview Sustainability Corporate Governance Financial information
88SIBUR 2014 Annual Review
Board of Directors(continued)
(1) Independent director in accordance with director independence criteria established by Russian law.
BOARD OF DIRECTORS COMPOSITION AS OF 31 DECEMBER 2014
“ * “ - BOARD OF DIRECTORS COMPOSITION CHANGES
Name Year of birth Title Year of appointment
Leonid Mikhelson 1955 Director, Chairman of the Board of Directors 2011
Ruben Vardanyan 1968 Independent Director(1), Chairman of the Human Resources and Remuneration Committee 2011
Alexander Dyukov 1967 Director, Deputy Chairman of the Board of Directors, Chairman of the Strategy and Investments Committee 2005
Dmitry Konov 1970 Director 2007
Denis Nikienko* 1976 Director, member of the Audit Committee 2014
Vladimir Razumov 1944 Director, member of the Strategy and Investments Committee 2013
Seppo Remes* 1955 Independent Director(1), Chairman of the Audit Committee, member of the Human Resources and Remuneration Committee 2007
Ilya Tafintsev 1985 Director, member of the Audit Committee and the Strategy and Investments Committee 2013
Gennady Timchenko 1952 Director, member of the Strategy and Investments Committee 2012
Kirill Shamalov* 1982 Director, member of the Human Resources and Remuneration Committee, member of the Strategy and Investments Committee 2014
Name Year of birth Title Date of change
Persons joined the Board of Directors
Kirill Dmitriev 1975 Independent Director(1), member of the Strategy and Investments Committee 24 April 2015
Denis Nikienko 1976 Director, member of the Audit Committee 26 December 2014
Kirill Shamalov 1982 Director, member of the Human Resources and Remuneration Committee, member of the Strategy and Investments Committee 26 December 2014
Persons left the Board of Directors
Oleg Golounin 1971 Director, member of the Audit Committee, member of the Human Resources and Remuneration Committee 26 December 2014
Seppo Remes 1955 Independent Director(1), Chairman of the Audit Committee, member of the Human Resources and Remuneration Committee 24 April 2015

Board of Directors
89SIBUR 2014 Annual Review
2014 ACTIVITIES REVIEW
In 2014, the Board of Directors held 10 meetings, including 7 meetings held remotely.
Strategic planning and investment activities:
review and approval of the report on 2013 annualinvestment programme execution;
decisions made in respect of the large-scale investment projects execution;
review and approval of regular reports on the progress of major investment projects.
Approval of large divestitures, acquisitions and partnerships with international and domestic petrochemical companies.
Corporate governance:
approval of revisions to SIBUR’s internal by-laws, in particular, by-laws of the Committees of the Board of Directors;
convening the General Shareholders’ Meeting to review and approve a revised version of the Charter.
Approval of PricewaterhouseCoopers as an independent auditor for SIBUR’s 2014 financial statements in accordance with RAS and IFRS.
Budget planning and financing activities:
review and preliminary approval of SIBUR’s 2013 annual report and financial statements with a recommendation for final approval by the Annual General Meeting of Shareholders;
review and approval of the report on 2013 annual business plan execution, including financial and operational performance;
approval of SIBUR’s Performance Contract(1) for 2015;
approval of SIBUR’s 2015 annual business plan;
approval of several financing transactions;
approval of the terms of the Addendum to the three-year agreement on transferring power of attorney between SIBUR and the Management Company.
BOARD REMUNERATION
As of 31 December 2014, the Group’s Board of Directors comprised ten individuals, including shareholders’ representatives. Members of the Board of Directors are entitled to annual compensation, as approved by the Annual General Shareholders’Meeting. In 2014 and 2013, the Group paid RR 80 million and RR 80 million net of social taxes, respectively, to Board of Directors members as compensation for the years ended 31 December 2014 and 2013, respectively.
10Board meetings in 2014
ISSUES CONSIDERED AT THE BOARD OF DIRECTORS MEETINGS IN 2014
Operational issues
Corporate governance
Financial management
Management of subsidiaries and dependent companies
Strategic issues
Other
32%21%
11%
7%
7%21%
1
2
3
4
5
6
3
4
5
61
2
(1) Performance Contract is a set of indicators and their target values against which the Company’s performance is evaluated.

Introduction Value Chain Business Overview Sustainability Corporate Governance Financial information
90SIBUR 2014 Annual Review
Board of Directors(continued)
EDUCATION
1977Graduated from the Kuybyshev Institute of Civil Engineering with a degree in Industrial Civil Engineering.
He was awarded the Order of the Badge of Honor of the Russian Federation, the Order of Merit for the Fatherland 2 degree and the title of honor “Honored man of the gas industry.”
PROFESSIONAL EXPERIENCE
Active employment as of 31 December 2014
Since 2002Member of the Board of Directors and Chairman of the Management Board of OAO NOVATEK, Executive Director
Past employment
Mr. Mikhelson began his career as a foreman of a construction and assembly company in Tyumen region, where he worked on the construction of the first section of Urengoi-Chelyabinsk gas pipeline. Mr. Mikhelson served as Chief Engineer of Ryazantruboprovodstroy, General Director of Kuibishevtruboprovodstroy,Managing Director of SNP NOVA and General Director of Novafininvest, was a member and chairman of the Board of Directors of OAO Stroytransgaz and OAO Yamal LNG, a member of the Board of Directors of OOO Art Finance and also a member of the Supervisory Board of OAO Russian Regional Development Bank.
LEONID MIKHELSON (1955)
Chairman of the Board of Directors Non-Executive Director
Election
Chairman of the Board of Directors since 2011

Board of Directors
91SIBUR 2014 Annual Review
PROFESSIONAL EXPERIENCE
Active employment as of 31 December 2014
Since 2005Managing Director of ZAO Sberbank CIB Since 2006Founding Partner and member of Coordination Council of Moscow School of Management SKOLKOVOSince 2007Member of the Board of Directors of ZAO AmeriaBankSince 2009Member of the Board of Directors of OAO KAMAZSince 2010Member of the Board of Directors of Joule Unlimited, IncSince 2011Member of the Board of Directors of OAO RosgosstrakhSince 2012Advisor to the Chairman of the Board and CEO of Sberbank of RussiaSince 2013Vice-Chairman of the International Advisory Board of Moscow School of Management SkolkovoSince 2014Member of the Board of Directors of OAO United Grain CompanyMember of the Investment Council under the Chairman of the State Duma of RussiaMember of the Strategic Council for Investments in New Industries under the Ministry of Industry and Trade of Russia
Member of the Economic Advisory Board at the International Finance Corporation (World Bank Group)Chairman of the Skolkovo Institute for Emerging Market StudiesChairman of the Expert Council of Wealth Transformation Center SkolkvoPartner and Founder of LLC Vardanyan, Broitman & Partners
Past employment
Mr. Vardanyan was chairman of the Board of Directors of ZAO Sukhoi Civil Aircraft, ZAO Sberbank CIB, OAO Russian Venture Company, ZAO AmeriaBank, a member of the Board of Directors of OAO NOVATEK, OAO AK BARS Bank, OAO URSA bank, ZAO RusSpecSteel, OAO Insurance company ZHASO, IG SEISMIC SERVICES LIMITED, OAO Sheremetyevo International Airport, OAO United Automotive Technologies, OAO AvtoVAZ, Standard Bank Plc and also was President of the Moscow School of Management Skolkovo.
Mr. Vardanyan is a member of the Russian Federation Presidential Council for the Implementation of Priority National Projects and Demographic Policy, and the President’s International Advisory Committee on Establishment of an International Financial Center in the Russian Federation. Mr. Vardanyan is also a member of the Russian government’s Competition and Entrepreneurship Council.
RUBEN VARDANYAN(1968)
Independent Director(1)
Election
Board Member since 2011Chairman of the Human Resources and Remuneration Committee in 2011 – May 2015Chairman of the Audit Committee since May 2015
EDUCATION
1992Graduated with honors from the Moscow State University with a degree in Economics1992Interned at Banca CRT in Italy, attended courses on emerging markets organised by Merrill Lynch in New York2000Completed executive management courses at INSEAD (Fontainebleau, France)2001, 2005Completed courses at the Harvard Business School (USA)2012, 2013Completed special programmes at Yale University and Stanford University Graduate School of Business
(1) In accordance with director independence criteria established by Russian law.

Introduction Value Chain Business Overview Sustainability Corporate Governance Financial information
92SIBUR 2014 Annual Review
Board of Directors(continued)
EDUCATION
1991Graduated from the Leningrad Shipbuilding Institute with a degree in Engineering2001Received an MBA from the International Management Institute of St. Petersburg
PROFESSIONAL EXPERIENCE
Career at SIBUR
2003–2005President of OAO AK SIBUR2005–2006President of OAO SIBUR Holding2005–2009Chairman of the Board of Directors of OAO SIBUR Russian Tyres2006CEO of the Management Company OOO SIBUR2006–2011Chairman of the Group’s Board of Directors
Active employment as of 31 December 2014
Since 2006President of OAO Gazprom NeftPresident and chairman of the Board of Directors of ZAO Football Club Zenit
Since 2007Member of the Board of Directors of ZAO Okhta Cultural and Business CenterMember of the Board of Directors of ZAO Hockey Club SKASince 2008CEO, Chairman of the Management Board and a member of the Board of Directors of OAO Gazprom NeftSince 2009Member of the Board of Directors of OOO National Oil ConsortiumChairman of the Board of Directors of ZAO Okhta Cultural and Business CenterSince 2012Member of the Board of Directors of OOO LIGA-TVMember of the Board of Directors of OOO Hockey City
Past employment
Mr. Dyukov served as Financial Director and General Director of Joint Venture ZAO Petersburg Oil Terminal, Director of Economics and Acting General Director of St. Petersburg Sea Port, was chairman of the Board of Directors of the Petersburg Oil Terminal and OAO NGK Slavneft, a member of the Board of Directors of OAO Moscow Oil and Gas company and OOO Gazprom gazomotornoye toplivo.
ALEXANDER DYUKOV (1967)
Deputy Chairman of the Board of Directors (since 2011)Non-Executive Director
Election
Board Member since 2005Chairman of the Strategy and Investments Committee since 2011Member of the Audit Committee since May 2015

Board of Directors
93SIBUR 2014 Annual Review
EDUCATION
1994Graduated from the Moscow State Institute of International Relations (MGIMO) with a degree in International Economic Relations2001Received an IMD MBA degree
PROFESSIONAL EXPERIENCE
Career at SIBUR
2004–2009Various positions at OAO AK SIBUR, including Advisor to the President, Vice President for Corporate Policy and Strategy, Senior Vice President for Corporate Policy and Strategy, President, member of the Board of Directors2005–2012Chairman of the Board of Directors of OAO SIBUR Russian Tyres2006–2011President of the Management Company OOO SIBUR2007–2010Member of the Board of Directors of OAO Polief2007–2010Chairman of the Board of Directors of ZAO Sibur-TransSince 2007Chairman of the Group’s Management Board2008–2011Chairman of the Board of Directors of OAO Sibur-Fertilizers
Since 2009Chairman of the Management Board of the Management Company OOO SIBUR2010–2013Member of the Board of Directors of OOO Tobolsk-PolymerSince 2011General Director of the Management Company OOO SIBUR
Active employment as of 31 December 2014
Since 2007Chairman of the Board of Directors of OOO RusVinylSince 2008Chairman of the Board of Directors of OOO SNHKSince 2014Chairman of the Board of Directors of OAO StroytransgazMember of the Board of Directors of OOO STGM, ZAO STGM
Past employment
Mr. Konov served in the Treasury Department of OAO NK YUKOS, held various positions at AKB Trust and Investment Bank, including Vice President – Head of the Investment Banking Department and Managing Director of Corporate Finance Department, was a member of the Board of Directors of OAO Gazprom neftekhim Salavat and OAO Gazprombank.
DMITRY KONOV(1970)
Executive Director
Election
Board Member since 2007Chairman of the Management Board since 2007

Introduction Value Chain Business Overview Sustainability Corporate Governance Financial information
94SIBUR 2014 Annual Review
Board of Directors(continued)
EDUCATION
2000Graduated from the Moscow State University with a degree in Civil Law2009Completed executive management courses at INSEAD (Fontainebleau, France), participated in Gazprom Neft Leading in Global Economy programme2010-2011Completed executive management courses at Skolkovo Moscow School of Management (Moscow, Russia)
PROFESSIONAL EXPERIENCE
Career at SIBUR
2009-2014Director of the Legal department, Director for legal support of the Management Company OOO SIBUR
Active employment as of 31 December 2014
Since 2012Member of the Board of Directors of KSP Capital AMSince 2013Member of the Board of Directors of SIBUR Investments AGSince 2014General Director of OOO Yudoga InvestmentsGeneral Director of OOO Ladoga ManagementGeneral Director of OOO OleFinInvest
DENIS NIKIENKO(1976)
Non-Executive Director
Election
Board Member since December 2014Member of the Audit Committee since December 2014

Board of Directors
95SIBUR 2014 Annual Review
EDUCATION
1967Graduated with honors from the Voronezh Technological Institute with a degree in Engineering1980Graduated from the Plekhanov Russian Academy of Economics, with a degree in Procurement1987–1989Studied at the Academy of the National Economy under the USSR Council of Ministers, specialising in Economics and Management of the National Economy
PROFESSIONAL EXPERIENCE
Career at SIBUR
1999–2002Served as Vice President in charge of Production of Synthetic Rubber and Tyres and Senior Vice President in charge of Petrochemical Production of OAO AK SIBUR2003–2005Re-joined OAO AK SIBUR, served as Advisor to the President, Vice President in charge of Production, Senior Vice President in charge of Production and Marketing 2005–2006Senior Executive Vice President at OAO SIBUR Holding2005–2008Member of the Board of Directors of OAO SIBUR-Russian Tyres2006–2008Board of Directors of OAO SIBUR-Neftekhim2006–2009Member of the Board of Directors of OAO Plastic
2006–2012Member of the Board of Directors of ZAO Sibur-Trans2006–2012Senior Executive Vice President at the Management Company OOO SIBURSince 2007Member of the Management Board of PJSC SIBUR HoldingSince 2009Member of the Management Board of the Management Company OOO SIBUR2010–2011Member of the Board of Directors of OAO SIBUR-FertilisersSince 2010Chairman of the Board of Directors of OOO Tobolsk-Polymer2012-2013Deputy Chairman of the Strategy and Investments Committee of the Board of Directors of PJSC SIBUR HoldingSince 2012Executive Director of the Management Company OOO SIBUR
Past employment
Mr. Razumov worked at Voronezh Synthetic Rubber Plant as an engineer, section manager, mechanic, shop manager and Deputy Director for Procurement and Marketing, was Director of the Volga Synthetic Rubber Plant, Head of the Main Procurement Department of the USSR Ministry of the Oil Refining and Petrochemicals Industry, USSR Deputy Minister of the Oil Refining and Petrochemicals Industry, Vice President and First Vice President of ZAO Korporatsiya Rosshina, Vice President of ZAO Roskhimneft, COO of OAO Avtotor Holding and a member of the Board of Directors of OAO VNIPIneft.
VLADIMIR RAZUMOV(1944)
Executive Director
Election
Board Member in 2011 – April 2012 and since 2013Member of the Strategy and Investments Committee since 2012Member of the Human Resources and Remuneration Committee since May 2015

Introduction Value Chain Business Overview Sustainability Corporate Governance Financial information
96SIBUR 2014 Annual Review
Board of Directors(continued)
EDUCATION
1976Graduated from the Leningradsky Mechanical University with a degree in Electromechanical Engineering
PROFESSIONAL EXPERIENCE
Active employment as of 31 December 2014
Since 2009Member of NOVATEK’s Board of DirectorsSince 2011Сhairman of the Economic Council of the Franco-Russian Chamber of CommerceSince 2011Chairman of the Board of Directors of the Ice Hockey Club SKA St. PetersburgSince 2012Chairman of the Board of Directors of the Continental Hockey League (KHL)Since 2012Member of the Board of Trustees of the All-Russian public organisation Russian Geographical Society
Since 2014Chairman of the Russian Council of the NPO Russian Chinese Business CouncilChairman of the Board to promote OCDVice-President of the Olympic Committee of the Russian Federation
Past employment
Mr. Timchenko began his career at Izhorsk plant in Leningrad, which specialise in engineering and production of equipment for the energy industry. Mr. Timchenko also was Senior Engineer at the Ministry of Foreign Trade, Vice President of Kirishineftekhimexport, worked for Urals Finland, was Managing Director of IPP OY Finland and IPP AB Sweden, Co-founder of Gunvor, a leading independent oil trading company, a member of the Board of Directors of OOO Transoil, Airfix Aviation OY, OOO BaltTransService and was also chairman of the Board of Directors of OOO Transoil.Mr. Timchenko has more than 20 years of experience in the Russian and international energy sectors. He has built interests in trading, logistics and transportation related companies.
GENNADY TIMCHENKO(1952)
Non-Executive Director
Election
Board Member since 2012Member of the Strategy and Investments Committee since 2012

Board of Directors
97SIBUR 2014 Annual Review
Since 2014Member of the Board of Directors of OOO Russian Cement Company
EDUCATION
2004Graduated from the St. Petersburg State University with a degree in Law
PROFESSIONAL EXPERIENCE
Career at SIBUR
2008–2011Vice-President for Business Administration of the Management Company OOO SIBURSince 2008Member of the Management Board of PJSC SIBUR HoldingSince 2009Member of the Management Board of the Management Company OOO SIBURSince 2012Deputy Chairman of the Management Board of the Management Company OOO SIBURSince December 2014Member of the Board of Directors of PJSC SIBUR Holding
Active employment as of 31 December 2014
Past employment
Mr. Shamalov was Chief Legal Counsel for foreign economic activity at OAO Gazprom, Expert in the regional department FGUP Rosoboronexport, Chief Lead Counsel in the legal department ZAO AB Gazprombank, Expert consultant in the Economics and Finance Department for the Russian Government, General Director of OAO TYRE Invest, chairman of the Board of Directors of OAO SMNG and a member of the Board of Directors of ZAO GEONOD razvedka.
KIRILL SHAMALOV(1982)
Non-Executive Director
Election
Board Member since December 2014Member of the Human Resources and Remuneration Committee since December 2014Member of the Strategy and Investments Committee since December 2014

Introduction Value Chain Business Overview Sustainability Corporate Governance Financial information
98SIBUR 2014 Annual Review
Board of Directors(continued)
EDUCATION
1984Graduated from the University of Oulu (Finland), where he majored in Economics1994Obtained a licentiate degree in Economics from the School of Economics and Business Administration in Turku (Finland)
PROFESSIONAL EXPERIENCE
Active employment as of 31 December 2014
Since 2003Member of the Board of Directors of Investor Protection AssociationSince 2004Member of the Board of Directors and chairman of the Audit Committee of OAO SOLLERSSince 2007Chairman of the Board of Directors of EOS RussiaSince 2008Member of the Board of Directors, chairman of the Audit Committee, member of the Strategy Committee and member of the Valuation Committee of OAO Russian GridsSince 2012Member of the Board of Directors and chairman of the Audit Committee of OAO Rosnano
Past employment
Mr. Remes was a member of the Board of Directors and a chairman of the Audit Committee of OAO OMZ, a member of the Board of Directors of Ponsse Oyj (Finland) and OAO Institute Energosetproject, a member of Investment Policy Committee of OAO Rosnano, a member of the Board of Directors, a chairman of the Audit Committee and a member of the Strategy and Investments Committee of OAO IDGS of the North-West, a member of the Board of Directors, a member of the Audit Committee and a member of the Strategy and Investments Committee of OAO Lenenergo and OAO RAO Energy System of East, a member of the Board of Directors, a member of the Strategy Committee and a chairman of the Audit Committee of OAO IDGS of Volga, and also a member of the Board of Directors and a member of the Audit Committee of OAO IDGS of Ural.Mr. Remes is Honourary Doctor of the Plekhanov Russian Academy of Economics and winner of the “Best Independent Director” category of the Director of the Year 2012 award.
SEPPO REMES(1955)
Independent Director(1)
(left the Board of Directors as of 24 April 2015)
Election
Board Member since 2007 to April 2015Chairman of the Audit Committee since 2007 to April 2015Member of the Human Resources and Remuneration Committee since 2007 to April 2015
(1) In accordance with director independence criteria established by Russian law.

Board of Directors
99SIBUR 2014 Annual Review
EDUCATION
2006Obtained a BA in Economics from the Higher School of Economics in Moscow2007Graduated from University of London, where he majored in Investment and Finance
PROFESSIONAL EXPERIENCE
Active employment as of 31 December 2014
Since 2013Strategic Projects Director of OAO NOVATEKSince 2014Chairman of the Board of Directors of OAO Yamal LNGFinance Director of OOO LEVIT
Past employment
Mr. Tafintsev also was Deputy Head of OAO NOVATEK’s Representative Office in London, held a position of a Director of Themis Holdings Limited, was an Advisor for Finance and Investment at United Bureau of Consultants Limited.
ILYA TAFINTSEV(1985)
Non-Executive Director
Election
Board Member since 2013Member of the Audit Committee in 2013 – May 2015Member of the Strategy and Investments Committee in 2013 – May 2015
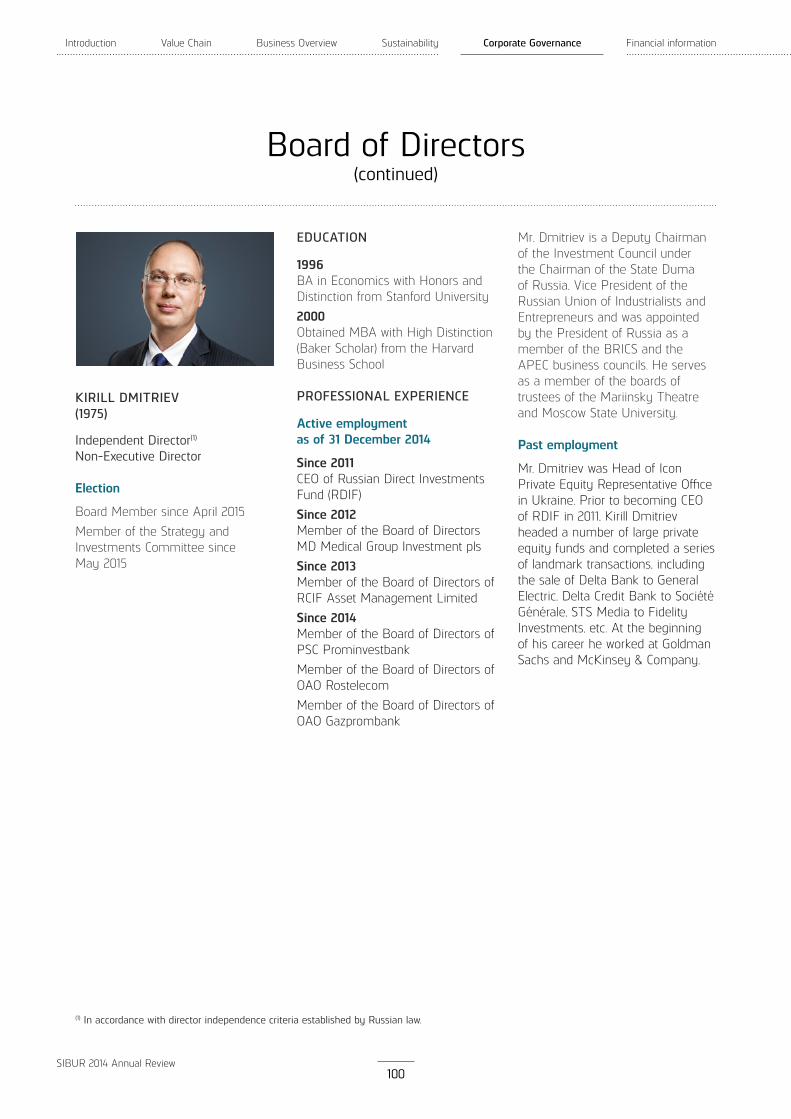
Introduction Value Chain Business Overview Sustainability Corporate Governance Financial information
100SIBUR 2014 Annual Review
Board of Directors(continued)
EDUCATION
1996BA in Economics with Honors and Distinction from Stanford University2000Obtained MBA with High Distinction (Baker Scholar) from the Harvard Business School
PROFESSIONAL EXPERIENCE
Active employment as of 31 December 2014
Since 2011CEO of Russian Direct Investments Fund (RDIF)Since 2012Member of the Board of Directors MD Medical Group Investment plsSince 2013Member of the Board of Directors of RCIF Asset Management LimitedSince 2014Member of the Board of Directors of PSC ProminvestbankMember of the Board of Directors of OAO RostelecomMember of the Board of Directors of OAO Gazprombank
Mr. Dmitriev is a Deputy Chairman of the Investment Council under the Chairman of the State Duma of Russia, Vice President of the Russian Union of Industrialists and Entrepreneurs and was appointedby the President of Russia as a member of the BRICS and the APEC business councils. He serves as a member of the boards of trustees of the Mariinsky Theatre and Moscow State University.
Past employment
Mr. Dmitriev was Head of Icon Private Equity Representative Office in Ukraine. Prior to becoming CEO of RDIF in 2011, Kirill Dmitriev headed a number of large private equity funds and completed a series of landmark transactions, including the sale of Delta Bank to General Electric, Delta Credit Bank to Société Générale, STS Media to Fidelity Investments, etc. At the beginning of his career he worked at Goldman Sachs and McKinsey & Company.
KIRILL DMITRIEV(1975)
Independent Director(1)
Non-Executive Director
Election
Board Member since April 2015Member of the Strategy and Investments Committee since May 2015
(1) In accordance with director independence criteria established by Russian law.

Board of Directors
101SIBUR 2014 Annual Review
EDUCATION
1994Graduated from the Samara State University with a degree in Law
PROFESSIONAL EXPERIENCE
Career at SIBUR
2011–2012Member of the Board of Directors of OAO SIBUR Russian Tyres
Active employment as of 31 December 2014Since 2010Chairman of the Board of Directors of OAO First United Bank (Pervobank)Since 2013Chairman of the Board of Directors of OOO NorthWest InvestManaging Director of OOO LEVIT
Past employment
Mr. Golounin was General Director of OAO Novafininvest, OOO NOVATEK-Polymer and ZAO Miracle, was a member of the Supervisory Board of OAO Novokuybyshevsk television, a member of the Board of Directors of OAO Samara national enterprise Nova and also Director of representative office of OOO LEVIT in Moscow.
OLEG GOLOUNIN(1971)
Non-Executive Director(left the Board of Directors as of 26 December 2014)
Election
Board Member since 2011 to December 2014Member of the Audit Committee since 2011 to December 2014Member of the Human Resources and Remuneration Committee since 2011 to December 2014

Introduction Value Chain Business Overview Sustainability Corporate Governance Financial information
102SIBUR 2014 Annual Review
Board Committees
IN ORDER TO ENSURE THE EFFICIENT FULFILMENT OF ITS FUNCTIONS, SIBUR’S BOARD OF DIRECTORS HAS ESTABLISHED
THREE BOARD COMMITTEES. THEY UNDERTAKE A MORE DETAILED REVIEW OF THE ISSUES WITHIN THEIR AREAS OF
RESPONSIBILITY AND MAKE RECOMMENDATIONS TO THE BOARD AS NECESSARY.
The Chairmen of the Audit Committee and the Human Resources and Remuneration Committee are independent directors of the Board, in accordance with the best practices.
Committee members are elected on the first Board of Directors meeting (the new composition) for a term lasting until the next Board election. 2014 changes in the Committees’ composition are due to the election of the new Board members in December 2014. The current Committee members have been elected by the Board on 5 May 2015.
AUDIT COMMITTEE
Committee role
Responsible for developing and making recommendations to the Board of Directors on:
conducting an annual independent external audit of the Group’s financial statements, including the IFRS financial statements;
independent external auditor’s qualifications, the quality of the services rendered by the auditor, and whether the auditor meets independence requirements;
improving internal controls and risk management functions;
assessing the effectiveness of internal controls and risk management functions and developing recommendations for further improvement;
dividend amounts and payout schedules.
Committee composition
Ruben Vardanyan (Chairman) (since 5 May 2015);
Denis Nikienko (since 26 December 2014);
Alexander Dyukov (since 5 May 2015);
until 26 December 2014 Oleg Golounin was a member of the Committee;
until 5 May 2015 Seppo Remes was Chairman of the Committee, and Ilya Tafintsev was a member of the Committee.
10Meetings of the Audit
Committee in 2014

Board Committees
103SIBUR 2014 Annual Review
HUMAN RESOURCES AND REMUNERATION COMMITTEE
Committee role
Responsible for developing and making recommendations to the Board of Directors on:
developing the key Group’s human resource policies;
reviewing the Group’s annual performance indicators and annual and semiannual results;
providing recommendations on the Group’s long-term incentive programmes;
policy of candidate selection to the management bodies;
determining the remuneration policy applicable to members of management bodies;
developing and overseeing the implementation of personnel policy for subsidiaries and affiliates.
The committee submits recommendations to the Group’s Board of Directors on improvements in Group and Management Company HR policies, and qualification criteria for Independent Directors.
Committee composition
Ilya Tafintsev (Chairman) (since 5 May 2015)
Vladimir Razumov (since 5 May 2015)
Kirill Shamalov (since 26 December 2014)
until 26 December 2014 Oleg Golounin was a member of the Committee
until 5 May 2015 Ruben Vardanyan was a Chairman of the Committee, and Seppo Remes was a member of the Committee
STRATEGY AND INVESTMENTS COMMITTEE
Committee role
Responsible for developing and making recommendations to the Board of Directors on:
defining SIBUR’s priority areas for development;
defining the Group’s long-term strategy (including financing strategy), objectives and tasks, as well as annual and long-term investment programmes;
evaluating the Group’s investment programme and strategic planning process as well as the Group’s policy on cooperation with investors and shareholders and proposing improvements;
issues related to the Group’s establishment of commercial organisations, as well as mergers, acquisitions, divestments or pledges of the Group’s assets;
issuance of bonds or other securities.
Committee composition
Alexander Dyukov (Chairman)
Vladimir Razumov
Kirill Dmitriev (since 5 May 2015)
Gennady Timchenko
Kirill Shamalov (since 26 December 2014)
until 5 May 2015 Ilya Tafintsev was a member of the Committee
5
6
Meetings of the Human Resources and Remuneration Committee
in 2014
Meetings of the Strategy and Investments Committee in 2014

Introduction Value Chain Business Overview Sustainability Corporate Governance Financial information
104SIBUR 2014 Annual Review
Management Board
MANAGEMENT BOARD ROLE AND RESPONSIBILITIES
SIBUR’s Management Board is the Group’s Collegial Executive Body. The Management Board is responsible for the effective management of the Group. The Management Board also participates in the development and execution of the Group’s strategy.
MANAGEMENT BOARD COMPOSITION AS OF 31 DECEMBER 2014
“ * “ - MANAGEMENT BOARD COMPOSITION CHANGES
The primary objectives of the Management Board include managing SIBUR assets to maximise their value and returns, improving the efficiency of internal controls and risk management functions, and ensuring the protection of shareholder rights and interests.
MANAGEMENT BOARD COMPOSITION
In accordance with the Group’s Charter, the Management Board is formed by the Board of Directors from the Group’s senior executives based on the recommendations of the Sole Executive Body. TheGroup’s Management Board consisted of five members as of 31 December 2014.
Name Year of birth Title Year of appointment
Dmitry Konov 1970 Chairman of the Management Board 2007
Mikhail Karisalov 1973 Member of the Management Board 2007
Pavel Malyi 1970 Member of the Management Board 2013
Vladimir Razumov 1944 Member of the Management Board 2007
Kirill Shamalov* 1982 Member of the Management Board 2008
Name Year of birth Title Date of change
Persons joined the Management Board
Aleksei Kozlov 1982 Member of the Management Board 23 March 2015
Persons left the Management Board
Kirill Shamalov 1982 Member of the Management Board 23 March 2015

Management Board
105SIBUR 2014 Annual Review
EDUCATION
1998Graduated from the Russian Civil Service Academy under the President of the Russian Federation, where he majored in State and Municipal Management2009Graduated from the West-Siberian Institute for the Humanities, where he majored in State and Municipal Management
2010Completed professional retraining course Chemical Technology of Natural Energy Sources and Carbon Materials at Tyumen State Oil and Gas University
PROFESSIONAL EXPERIENCE
Career at SIBUR
2003–2005Various positions at OAO AK SIBUR, including Advisor to the President, Director of Procurement, Head of Logistics and Capital Construction2005–2006Various positions at OAO SIBUR Holding, including Head of Logistics and Capital Construction and Head of Hydrocarbon Feedstock Department2006–2008General Director of OAO SiburTyumenGaz
2006–2011Vice-President – Head of Hydrocarbon Feedstock Department at the Management Company OOO SIBURSince 2007Member of the Management Board of PJSC SIBUR Holding2009–2012General Director of OOO Tobolsk-Polymer2011–2012Executive Director of the Management Company OOO SIBURSince 2012Deputy Chairman of the Management Board of the Mangement Company OOO SIBUR
Mr. Karisalov is a member of the Board of Directors of OOO Yuzhno-Priobskiy GPP and OOO Tobolsk-Polymer, a chairman of the Board of Directors of OAO NIPIgaspererabotka.
Active employment as for 31 December 2014
Mr. Karisalov is a chairman of the Board of Directors of OOO STGM.
Past employment
Mr. Karisalov was General Director of OOO Oblkonservprom.
DMITRY KONOV(1970)
Chairman of the Management Board of PJSC SIBUR HoldingChairman of the Management Board and General Director of the Management Company OOO SIBUR
See biography on page 93, Information of the Current Members of the Board of Directors section.
MIKHAIL KARISALOV(1973)
Member of the Management Board of PJSC SIBUR HoldingMember of the Management Board, Deputy Chairman of the Management Board, Executive Director of the Management Company OOO SIBUR

Introduction Value Chain Business Overview Sustainability Corporate Governance Financial information
106SIBUR 2014 Annual Review
Management Board(continued)
EDUCATION
1991Graduated from the Moscow State Institute of International Relations (MGIMO) with a degree in International Law1995Graduated with a Master’s degree from the University of Chicago Law School
PROFESSIONAL EXPERIENCE
Career at SIBUR
2011–2013Member of the Board of Directors of OAO SIBUR HoldingSince 2013Member of the Management Board of PJSC SIBUR Holding
Deputy Chairman of the Management Board of the Management Company OOO SIBUR
Chief Financial Officer of the Management Company OOO SIBUR
Past employment
Mr. Malyi held various positions at UBS Investment Bank, including Director, Executive Director, Managing Director and Head of UBS Investment Bank in the Russian Federation, Ukraine and Kazakhstan, was President of ZAO Miracle and Managing Director of OOO LEVIT.PAVEL MALYI
(1970)
Member of the Management Board of PJSC SIBUR HoldingMember of the Management Board, Deputy Chairman of the Management Board and Chief Financial Officer of the Management Company OOO SIBUR
See biography on page 95, Information of the Current Members of the Board of Directors section.
VLADIMIR RAZUMOV(1944)
Member of the Management Board of PJSC SIBUR HoldingMember of the Management Board, Deputy Chairman of the Management Board, Executive Director of the Management Company OOO SIBUR

Management Board
107SIBUR 2014 Annual Review
KIRILL SHAMALOV(1982)
Member of the Management Board of PJSC SIBUR Holding until April 2015Deputy Chairman of the Management Board of the Management Company OOO SIBUR until April 2015(left the Management Board as of 23 March 2015)
See biography on page 97, Information of the Current Members of the Board of Directors section.
EDUCATION
2004Graduated from the Moscow State Law University with a degree in Law
PROFESSIONAL EXPERIENCE
Career at SIBUR
Since April 2015Member of the Management Board of PJSC SIBUR Holding
Past employmentMr. Kozlov held various positions in the Russian Ministry for Economic Development, including Deputy Head of State Property Management, was a Chief Counselor at the Department of Priority National Projects and an Assistant to Deputy Chairman in the Government of the Russian Federation, was a Head of the Department of Social Development of the Government of the Russian Federation.
ALEKSEI KOZLOV(1982)
Member of the Management Board of PJSC SIBUR Holding since April 2015

Introduction Value Chain Business Overview Sustainability Corporate Governance Financial information
108SIBUR 2014 Annual Review
Equity-Settled Share-Based Payment Plans
Share Capital
The share capital of PJSC SIBUR Holding amounts to RR 21,784,791,000. As of 31 December 2014, the share capital consisted of 2,178,479,100 ordinary shares with a par value of RR 10 each.
The state registration number is 1-02-65134-D, with a registration date of 31 May 2012.
The amount of authorised shares totals 9,653,045,500 ordinary shares
and 2,500,000,000 preferred shares with a par value of RR 10 each. No preferred shares have been issued.
On 28 June 2013, a company beneficially owned by Mr. Mikhelson and Mr. Timchenko and not under the control of the Group granted equity-settled share-based payment plans to certain current and former Group directors and key management for current and past services.
Consequently, the indirectinterest beneficially owned by Mr. Mikhelson and Mr. Timchenkoin SIBUR’s share capital decreased
from 94.5% to 82.5% and the total combined equity interest held by the current and former members of the Group’s management increased from 5.5% to 17.5%.
The plan for one group of participants vests annually in tranches for services to the Group provided that the participant is continuously employed. For 2014, SIBUR recognised a RR 11,580 million non-cash charge under the first plan in accordance with IFRS rules.
The second plan for the other participants was immediately vested and there are no future charges under this plan.
For further information, please refer to the Appendix III in the Management’s Discussion and Analysis (MD&A) for 2014.

Corporate Governance
109SIBUR 2014 Annual Review
Dividends
DIVIDENDS ACCRUED AND PAID FOR 2005-2014
Our dividend policy is aimed at increasing SIBUR’s investment appeals and shareholder value.Our intention is to balance the Group’s objectives and the interests of its shareholders, while respecting shareholders’ rights and complying with Russian legislation and SIBUR charter documents.
The General Shareholders’ Meetingmakes decisions on dividendpayouts and the amount, timing
and the payment form, on the basis of the Board of Directors’ recommendations. The Board of Directors develops these recommendations based on SIBUR’s payout target of 25% of the net profit for the period based on the IFRS consolidated financial statements and adjusted for exceptional non-cash items(1).
25.0%
35.2%
RR 17.3 bln
SIBUR dividend payout ratio according to the policy
y-o-y increase in dividends paid
dividend payout on 2014 results
Dividend accrual period Dividend per share, RR Dividends accrued, RR
2005 4.59 184,460,000
2006 98.04 3,931,407,333
2007 138.81 5,566,285,720
9M 2008 230.67 9,249,874,843
2009 110.85 4,829,687,832
2010 - -
2011 1000.00 21,784,791,000
H1 2012 3.40 7,406,828,940
H2 2012 3.50 7,624,676,850
H1 2013 2.93 6,382,943,763
H2 2013 2.93 6,382,943,763
H1 2014 3.53 7,690,031,223
H2 2014 4.42 9,628,877,622
(1) Adjustment made since 2014.
2014
17.3
2013
12.8
2012
15.0
DIVIDENDS ACCRUED AND PAID FOR 2012-2014,RR bln
Visit the Company’s website to find more information on SIBUR dividend policy athttp://investors.sibur.com/stock-information/dividends

Introduction Value Chain Business Overview Sustainability Corporate Governance Financial information
110SIBUR 2014 Annual Review
Risk Management
VLADIMIR KREMENITSKIY
Director, Internal Audit
“Robust risk management systems, timely risk identification, risk prioritisation and development of appropriatemitigation actions provide the essential foundations for effective business management to build and protect Company value.”
KEY GOALS
Support for strategy implementation;
Preservation of asset value and increase in operational efficiency.
IMPROVEMENTS IMPLEMENTED
Classification of risks and risk factors at the time of risk identification;
Monitoring procedures for execution of risk mitigation actions;
Formalisation of risks in the description of the Company’s operating activities.
FURTHER DEVELOPMENTS
Analysis of possible integration with the Company’s goal setting process and business planning;
Creation of database on realised risks;
Involvement of the owners in risk management process.
RISK MANAGEMENT IS AN IMPORTANT ELEMENT OF SIBUR’S CORPORATE STRATEGY. IT INVOLVES A CONSTANT CYCLE OF
IDENTIFICATION, ASSESSMENT AND MITIGATION OF NEAR-TERM AND LONGER-TERM RISKS THAT COULD AFFECT OUR
PERFORMANCE, VALUE AND ABILITY TO CONDUCT BUSINESS.
RISK MANAGEMENT CYCLE
Every6 months
1Identification
4Execution & monitoring
2Evaluation
3Elaboration
of mitigation actions
1.Identification of risks that impact the Company’s operational performance.2.Evaluation of risks’ impact on the Company’s performance and business as a whole, risk prioritisation: estimation of risk probabilities and possible losses3.Elaboration of mitigation actions for each risk.4.Continuous monitoring of each particular risk in respect of timeliness and efficiency of mitigation actions.

Risk Management
111SIBUR 2014 Annual Review
We apply an integrated and unified approach to risk management. Implementation of the same policy across the entire risk universe provides holistic approach.
SIBUR employees at each level are responsible for the risks related to their functional and control areas. They monitor and manage risks, applying risk matrices and appropriate oversight procedures.
Risk management implies open discussion both internally and with key stakeholders. SIBUR employees take part in our risk management process, assessing risk probabilities and possible losses, providing input targeted at risk prevention and loss minimisation, which are openly discussed with managers and directors.
All management decisions are made taking into account information regarding risk probabilities and possible losses, received from internal and external sources. All possible additional risks arising while mitigating initial ones are taken into account as well.
By analysing past experience - the reasons for risk occurrences and lessons learned - and by sharing knowledge Group-wide we aim to prevent the same issues from being repeated in other Group entities. Knowledge and experience exchange in respect of realised risks allows us to optimise risk management processes Group-wide.
Flexibility requires constant assessment and preventive risk management in all business areas. A preventive approach allows us to take advantage of new ideas and technologies and translate them into opportunities, while mitigating negative impacts.
Risk management involves a constant cycle of interconnections and changes. All elements of our risk management system are interconnected and influence each other, and they are directly correlated with the Company’s business processes and updated to reflect major changes and business developments.
RISK MANAGEMENT PRINCIPLES
Integrated approach
Accountability
Open discussion
Decision making subject to risks
Learning lessons
Flexibility and openness to changes
Continuity
STRUCTURE OF RISK MANAGEMENT SYSTEM
Board of DirectorsKey risks(1)
Management BoardRisks at corporate level
Process ownersRisks at operational level
Production sitesRisks at production level
(1) Key risks are selected from the risks at corporate level.
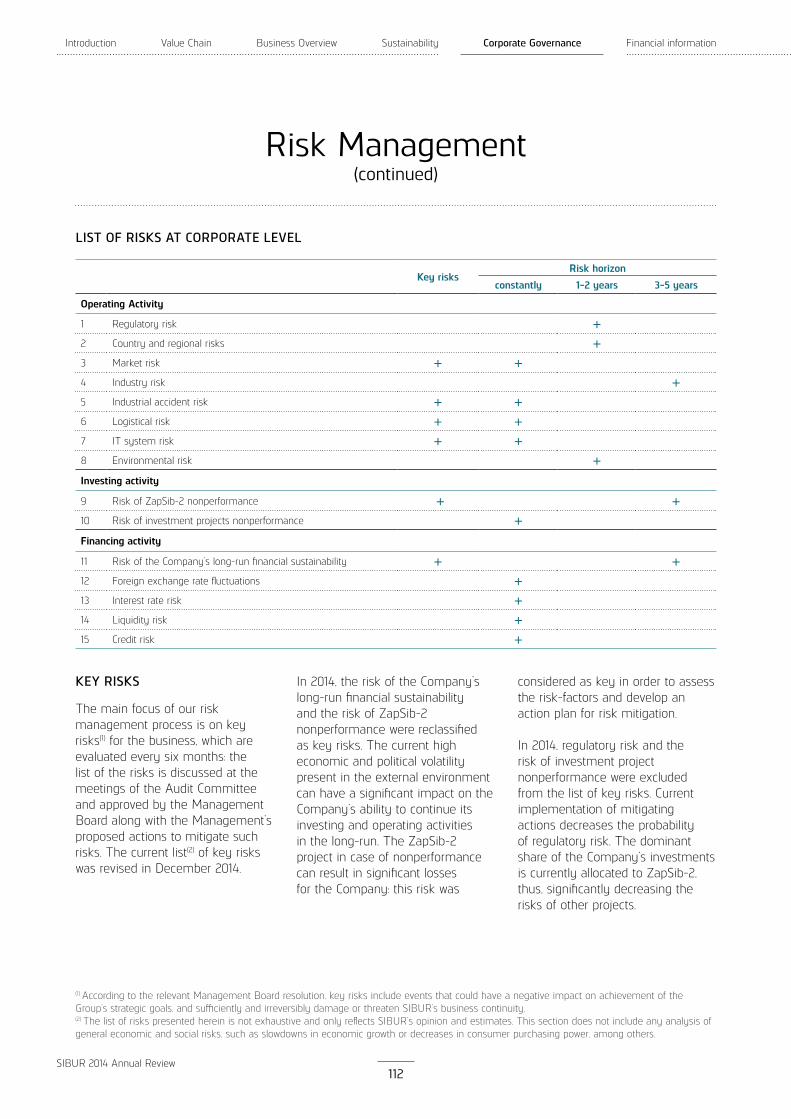
Introduction Value Chain Business Overview Sustainability Corporate Governance Financial information
112SIBUR 2014 Annual Review
Risk Management(continued)
(1) According to the relevant Management Board resolution, key risks include events that could have a negative impact on achievement of the Group’s strategic goals, and sufficiently and irreversibly damage or threaten SIBUR’s business continuity.(2) The list of risks presented herein is not exhaustive and only reflects SIBUR’s opinion and estimates. This section does not include any analysis of general economic and social risks, such as slowdowns in economic growth or decreases in consumer purchasing power, among others.
LIST OF RISKS AT CORPORATE LEVEL
Key risks Risk horizon
constantly 1-2 years 3-5 years
Operating Activity
1 Regulatory risk +2 Country and regional risks +3 Market risk + +4 Industry risk +5 Industrial accident risk + +6 Logistical risk + +7 IT system risk + +8 Environmental risk +Investing activity
9 Risk of ZapSib-2 nonperformance + +10 Risk of investment projects nonperformance +Financing activity
11 Risk of the Company’s long-run financial sustainability + +12 Foreign exchange rate fluctuations +13 Interest rate risk +14 Liquidity risk +15 Credit risk +
KEY RISKS
The main focus of our risk management process is on key risks(1) for the business, which are evaluated every six months: the list of the risks is discussed at the meetings of the Audit Committee and approved by the Management Board along with the Management’s proposed actions to mitigate such risks. The current list(2) of key risks was revised in December 2014.
In 2014, the risk of the Company’s long-run financial sustainability and the risk of ZapSib-2 nonperformance were reclassified as key risks. The current high economic and political volatility present in the external environment can have a significant impact on the Company’s ability to continue its investing and operating activitiesin the long-run. The ZapSib-2 project in case of nonperformance can result in significant losses for the Company: this risk was
considered as key in order to assess the risk-factors and develop an action plan for risk mitigation.
In 2014, regulatory risk and the risk of investment project nonperformance were excluded from the list of key risks. Current implementation of mitigating actions decreases the probability of regulatory risk. The dominant share of the Company’s investments is currently allocated to ZapSib-2, thus, significantly decreasing the risks of other projects.
Risk Management
113SIBUR 2014 Annual Review
OPERATING ACTIVITY
Regulatory risk
Substantive changes to the legal or regulatory framework may have a negative effect on the Group’s business and operations, particularly with respect to energy or transportation tariffs, export duties on energy products, import duties on production equipment.
Risk mitigation actionsSIBUR is monitoring the regulatory environment and analysing government initiatives, which should enable the Group to react in a timely manner to relevant legislative changes. SIBUR also plays an active role in discussions and development of draft legislative bills.
Country and regional risks
Political, economic and social risks
All SIBUR’s production assets are located in the Russian Federation, while substantial portion of our revenues is derived from countries outside of Russia. As Russia still has some features of an emergingmarket, there is a high level of uncertainty in its economic environment as well as social and political situation.
The political crisis in Ukraine and sanctions, imposed by the United States, the European Union and Russia on other countries had a negative impact on the Russian economy.
This resulted in a weakened Russian rouble, increased borrowing cost, and difficulties in raising funds from international sources, at the same time did not affect SIBUR’s operational activities. The existing threat of tightening of the sanctionson Russia may strengthen the negative impact on the Russian economy, SIBUR’s ability to carry out business activities in our key export markets and the Company’s financial position.
Risk mitigation actionsThough these risks are beyond the Group’s control, SIBUR aims to take measures to limit their negative impact:
establishment of JVs with leading world producers on growing markets to diversify its production base;
development of export sales to Asian markets;
participation in discussions with regulatory bodies on measures to support industry competitiveness, including customs and tax regime, as well as import substitution policy.
Risks related to Russian tax law
As all of our production assets are located in Russia, we are subject to a wide range of taxes, which we pay in the Russian Federation and which are imposed at the federal, regional, and local levels. Russian tax laws, regulations and court practice are subject to frequent changes, varying interpretations and inconsistent and selective enforcement.
These tax risks may impose additional burdens and costs on the Group’s operations, including management resources.
Risk mitigation actionsWe have not applied any tax minimisation schemes involving low tax jurisdictions either at the domestic or offshore levels. At the corporate level we are constantly monitoring changes in Russian tax legislation.
Market risk (Key risk)
SIBUR’s business and operational results may be negatively affected by drops in demand or decreased prices for its products, changes in consumers’ requirements as well as market share losses in its key markets.
Risk mitigation actionsTo manage its market risks, SIBUR focuses on the following key areas:
monitoring geopolitical external factors;
reviewing opportunities for entering new markets;
monitoring and analysis of existing markets;
concluding long-term agreements with both suppliers and customers;
developing sales channels for customers in end markets;
1
2
3

Introduction Value Chain Business Overview Sustainability Corporate Governance Financial information
114SIBUR 2014 Annual Review
Risk Management(continued)
active pre-marketing initiatives;
meeting our customers’ transportation, product quality and service requirements while ensuring strong compliance with regulatory requirements.
Industry risk
Risk related to imbalances between feedstock supply and demand for SIBUR’s petrochemicals business
Insufficient feedstock volumes or shortages of certain target hydrocarbon fractions may result in intensified competition for the feedstock and higher feedstock prices, which, in turn, could lead to lower rates of utilisation at the Group’s petrochemical plants and negatively affect SIBUR’s profitability.
Risk related to capacity additions by our competitors
The simultaneous completion of major petrochemical projects in Russia and abroad could result in overcapacity, intensified competition among petrochemicals producers,lower prices for petrochemical products, lower rates of utilisation at SIBUR’s petrochemical plants and reduction in profitability.
Risk related to drops or lower rates of growth in demand for petrochemical products
Drops or lower rates of growth in demand for petrochemical products due to a slowdown in economic activity in Russia or globally could
also result in lower prices for petrochemical products, lower rates of utilisation at SIBUR’s petrochemical plants and reduction in profitability.
Risk mitigation actionsSIBUR actively invests in the development of its feedstock gathering, processing and transportation infrastructure, aiming to consolidate hydrocarbon feedstock flows in Western Siberia and ensure reliable access to the region’s growing feedstock base. The Group’s strategy also implies construction of large-scale globally competitive petrochemical facilities, which will enable SIBUR to monetise stranded low-cost feedstock, further enhance competitiveness, and reduce the Group’s exposure to industry risks.
Industrial accident risk (Key risk)
SIBUR’s operational activity may be hampered by accidents at the Group’s production sites. Such factors as obsolescence of certain equipment, control systems failure, loss of containment and other factors may lead to fires, explosions, emission of toxic fumes and other hazardous conditions that could cause personnel injuries or death, property damage, environmental damage or interruption of operations.
Risk mitigation actionsSIBUR takes active steps to minimise the potential impact of such risks. These include continuous monitoring of assets to prevent emergencies and accidents;
introduction of advanced technologies and asset maintenance methods; promotion of an industrial safety culture among employees, and continuous training of personnel; as well as ensuring appropriate insurance coverage is in place, both for property damage and potential disruptions of operations.
Logistical risk (Key risk)
SIBUR may face difficulties in delivering its products to customers due to the limitations of the available transportation infrastructure in Russia. Insufficient rail transportation capacity and other logistical bottlenecks could negatively affect SIBUR’s ability to meet its contractual obligations related to delivery of intermediate or finished goods to customers and the Group’s operational and financial performance.
Risk mitigation actionsSIBUR is developing alternative transportation routes and its own logistical infrastructure, and is optimising its delivery schedules. The Group also works in cooperation with the Russian Government and SIBUR’s logistical partners, including Russian Railways (RZD), Russia’s state owned rail transportation monopoly, to develop long-term logistical solutions. We are considering rerouting of the current logistic chain to the alternative ones, in particular, via the sea port in Ust-Luga.
6
5
4
Risk Management
115SIBUR 2014 Annual Review
IT system risk(Key risk)
SIBUR’s business and operations may be negatively affected by failures of the Group’s key IT systems and equipment, unauthorised access to confidentialinformation, and distortion of information during data transfers. These factors may result in a lack of information or potential information inaccuracies that could cause disruptions in the Group’s decision-making process, as well as deterioration in the quality of SIBUR’s operational and financial reporting and the overall manageability of the Group. In particular, the risk relates to potential negative consequences that could arise in the process of migration to an SAP-based ERP system undertaken by the Company in 2015 and data consolidation on the basis of the new IT platform.
Risk mitigation actionsSIBUR is in the process of actively integrating its IT systems. To minimise IT-related risks, SIBUR has implemented and continues to develop back-up and informationprotection systems as well as conducting alarm exercises to test equipment in force-majeure situations. To minimise negative consequences that could arise in the process of migration to an SAP-based ERP system, SIBUR constantly monitors the process of ERP-system stabilisation, the schedule of integration of the new consolidation system with the Company’s accounting systems, as well as considers the back-up systems to prepare management and financial accounting data.
Environmental risk
SIBUR’s operations are subject to potential risks of harming or polluting the environment. The Group’s sustainable development focuses on maintaining environmental safety at productionfacilities, taking measures to decrease manmade impacts on the environment and increase workplace safety. SIBUR regularly monitors its operations to comply with applicable environmental laws and regulations. Compliance with these regulations may result in additional costs and obligations for SIBUR.
Risk mitigation actionsSIBUR has undertaken measures to decrease the environmental impact its production sites may have on nearby residential areas. These include implementation of advanced scientific technologies and expertise for mitigating adverse impacts, substantial investment in environmental management activities, and resettlement costs for moving residents to housing in environmentally safe areas.
The Group carries out safety education programmes for its employees on a regular basis, as well as engaging and communicating with community stakeholders and residents on the Group’s environmental activities. SIBUR also pursues international cooperation to develop environmentally sustainable, energy efficient and cost-effective technologies and equipment.
7 8SIBUR incurs and expects to continue to incur capital and operating costs to comply with environmental laws and regulations.
INVESTING ACTIVITY
Risk of ZapSib-2 nonperformance (Key risk)
The risk was reclassified from the risk of investment projects nonperformance. It represents the probability of the negative factors which can have an impact on ZapSib-2 timing, quality and total budget. The most significant impacts can involve external factors, such as sophisticated logistics and the seasonality of large-sized equipment delivery to the construction site, as well as difficultinterfaces between processing units of the complex, which will be designed and constructed by various contractors applying technologies provided by three licensors. We also distinguish the risk of upward project budget revision as a result of the possible increase in construction and procurement costs, as well as all other costs related to project realisation.
Risk mitigation actionsWe are to enter into turnkey contracts on separate processing units with a fixed budget for all types of work and indirect costs for the project lifespan. SIBUR is also developing an action plan to set up the transportation routes for large-sized and extra-heavy cargo to the construction site, including relocation of power network lines.
9

Introduction Value Chain Business Overview Sustainability Corporate Governance Financial information
116SIBUR 2014 Annual Review
Risk Management(continued)
Risk mitigation actionsTo minimise exposure to this risk, SIBUR undertakes regular monitoring of its key financial indicators. The Company works on capital expenditure, credit portfolio, and commercial cost management.
Foreign exchange rate fluctuations
Movements of the Russian rouble against the US dollar and the euro may have a significant effect on SIBUR’s financial performance. Our sales outside of Russia are mainly denominated in US dollars with a smaller portion denominated in euro. In many cases our domestic sales are linked to international benchmark prices quoted in US dollars and euros. At the same time, our expenses are primarily denominated in Russian roubles. As a result, depreciation of the Russian rouble relative to these currencies tends to have a positive effect on our operational results, while appreciation of the Russian rouble relative to these currencies tends to have a negative effect on our operational results. A significantpart of our borrowings is also denominated in foreign currencies, primarily in US dollars and, to a lesser extent, in euros. When the Russian rouble depreciates against the US dollar or euro, our liabilities denominated in these currencies increase in Russian rouble terms, as do interest costs on SIBUR’s foreign currency-denominated borrowings. Correspondingly, our financial expenses tend to increase as a result of foreign exchange losses recorded by the Group.
When the Russian rouble appreciates against the US dollar or euro, our liabilities denominatedin these currencies decrease in Russian rouble terms, as do interest costs on SIBUR’s foreign currency-denominated borrowings.Correspondingly, our financial income tends to increase as a result of foreign exchange gain recorded by the Group.
The Russian rouble on average significantly depreciated relative to the US dollar and the euro in 2014 compared to the average 2013 levels, which had a positive impact on our revenue. At the same time, the Russian rouble as of 31 December 2014 depreciated against the year-end level of 2013 relative to the US dollar, resulting in a substantial financial loss reported in SIBUR’s consolidated financial statements for 2014, which was largely attributable to the revaluation of our foreign currency-denominateddebt.
Risk mitigation actionsHigh historical correlation between RR/USD and RR/EUR exchange rates and oil prices helps SIBUR to mitigate currency risk; however, the magnitude of correlation can vary over time. When oil prices go up, the Russian rouble tends to appreciate against major world currencies and vice versa. Prices for a large portion of our products are linked to oil prices. Hence, rising oil prices tend to increase our revenues, mitigating the negative effect of a stronger Russian rouble on our export sales.
Risk of investment project nonperformance
SIBUR’s strategic objectives include constant expansion and modernisation of the Group’s production facilities and infrastructure. Actual costs related to any projects could exceed the planned levels, and any delays in completion of these projects could adversely affect our operations. Moreover, nonconforming procurements and deficit of skilled workers could decrease the efficiency of such projects and negatively affect our future operational performance.
Risk mitigation actionsSIBUR is actively developing mechanisms to make the contractor selection process more efficient, and the Group is also strengthening its in-house technical supervision capabilities to ensure adequate design and construction quality. Additionally, SIBUR aims to have proper insurance coverage for its large-scale investment projects.
FINANCING ACTIVITY
Risk of the Company’s long-term financial sustainability(Key risk)
The current high economic and political volatility in the external macro environment could affect the Company’s ability to conduct its operational activities with sufficient cash balances and profitability over the long run.
10
11
12

Risk Management
117SIBUR 2014 Annual Review
On the other hand, lower oil prices, while negatively impacting part of our sales, tend to lead to a weakerRussian rouble, which has a positive effect on SIBUR’s export revenue. This works as a natural hedge against foreign exchange rate fluctuations and oil price volatility. To minimise the effect of foreign exchange rate fluctuations on our foreign currency-denominatedborrowings, SIBUR aims to match the currency split of its liabilities with the currency structure of the Group’s revenues. Since 2014, SIBUR considers alternatives of using derivative instruments to hedge foreign exchange rate fluctuations’ impact on borrowings.
Interest rate risk
The Group’s interest rate risk arises primarily from long-term borrowings with floating interest rates.
Risk mitigation actionsSIBUR analyses its interest rate exposure on a regular basis. Financing decisions are made after careful consideration of various scenarios and may include alternative financing at fixed interest rates. Since 2014, SIBUR considers the use of derivative instruments to hedge its interest rate risk.
13
14 Liquidity risk
Risk that the Group would not be able to meet its financial obligations in a timely manner.
Risk mitigation actionsLiquidity risk management at SIBUR includes maintaining sufficient cash balances and ensuring access to sufficient amounts of debt financing. SIBUR monitors rolling forecasts of the Group’s liquidity on a weekly, monthly and annual basis. This is done on the basis of a minimum amount of cash and cash equivalent balances, and undrawn credit lines.
Credit risk
Credit risk arises from cash and cash equivalents (including short-term deposits with banks), issued loans as well as credit exposures to customers, including outstanding receivables and committed transactions.
Risk mitigation actionsThe collection of accounts receivable could be influenced by economic factors affecting the Group’s customers. SIBUR constantly monitors the status of trade receivables and the creditworthiness of customers.
A large part of the Group’s domestic receivables come from Russia’s largest companies, which SIBUR believes to be of high credit quality. For other domestic customers, SIBUR assesses credit quality taking into account financial position and past experience, alongside other factors. Regarding export customers, SIBUR sells to major market players based on prepayment terms and a standard delay of no more than 30 days. Most other export sales are primarily secured by a letter of credit or are prepaid.
Cash and cash equivalents are deposited only with banks that are considered by the Group at the time of deposit to have minimal risk of default within set credit limits. Loans are typically granted to joint ventures or subsidiaries and require approvals by the Strategy and Investment Committee and the Board of Directors.
15

Introduction Value Chain Business Overview Sustainability Corporate Governance Financial information
118SIBUR 2014 Annual Review
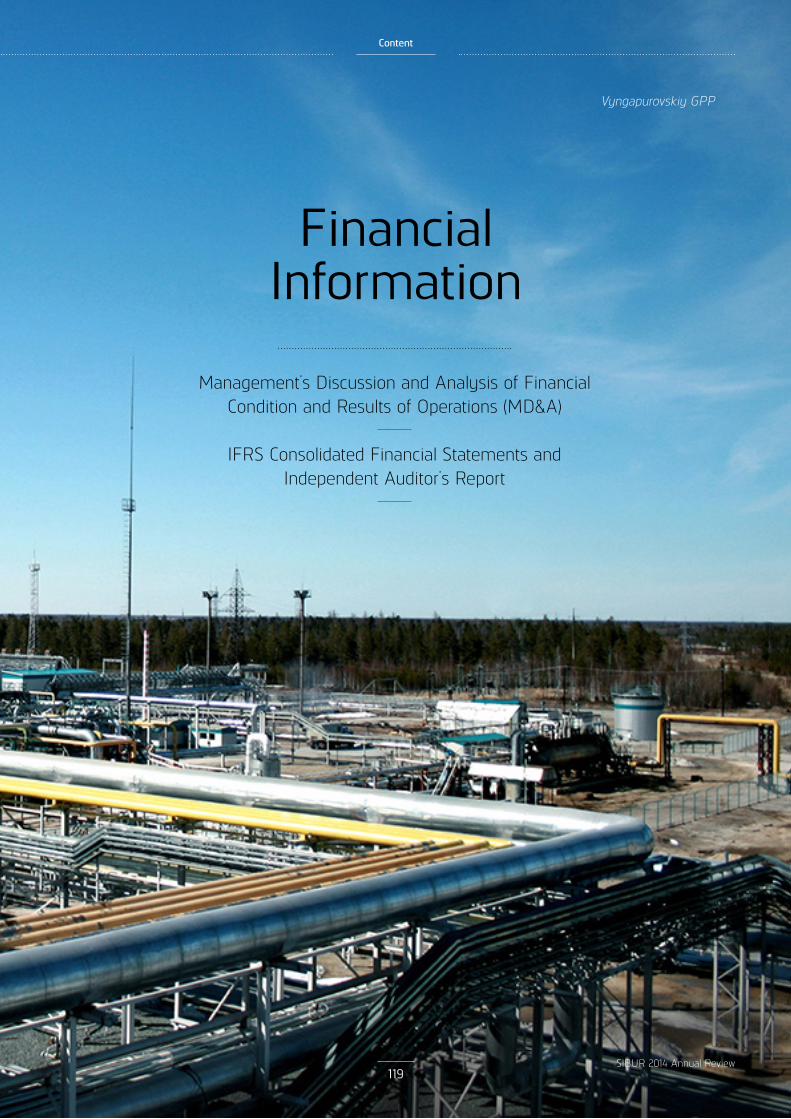
Financial Information
Management’s Discussion and Analysis of Financial Condition and Results of Operations (MD&A)
IFRS Consolidated Financial Statements andIndependent Auditor’s Report
Vyngapurovskiy GPP
Content
119SIBUR 2014 Annual Review

120
MANAGEMENT’S DISCUSSION AND ANALYSIS OF FINANCIAL CONDITION AND RESULTS OF OPERATIONS
You should read the following discussion and analysis of our financial condition and results of operations as of 31 December 2014 and for the year then ended (hereinafter referred to as “MD&A”) in conjunction with our audited consolidated financial statements as of and for the years ended 31 December 2014 and 2013 (hereinafter referred to as the “consolidated financial statements”). The audited consolidated financial statements have been prepared in accordance with International Financial Reporting Standards (IFRS).
The financial and operational information contained in this MD&A comprises information on PAO SIBUR Holding and its consolidated subsidiaries (hereinafter jointly referred to as “we”, “SIBUR”, “Company” or the “Group”).
SELECTED DATA(1)
Operating Results
The following table presents the Group’s key operational measures for the years ended 31 December 2014 and 2013:
Year ended 31 December Change
% Tonnes, except as stated 2014 2013
Processing and production volumes
APG processing(2) (thousand cubic metres) 20,834,647 19,600,139 6.3% APG processing, SIBUR's share(3) (thousand cubic metres) 19,397,321 13,869,949 39.9%
Natural gas production(2) (thousand cubic metres) 17,989,399 16,908,508 6.4% Natural gas production, SIBUR's share(3) (thousand cubic metres) 16,657,211 11,548,022 44.2%
Raw NGL fractionation(4)(5) 6,315,299 5,256,760 20.1% Raw NGL fractionation, SIBUR’s share 5,788,169 5,256,760 10.1%
Sales volumes Natural gas sales volumes (thousand cubic metres) 16,004,874 11,841,787 35.2% NGLs sales volumes 6,469,868 4,802,073 34.7% MTBE, other fuels & fuel additives sales volumes 603,830 630,966 (4.3%) Petrochemical products sales volumes 2,246,660 2,127,895 5.6%
Basic polymers 649,640 455,309 42.7% Synthetic rubbers 360,038 430,128 (16.3%) Plastics and organic synthesis products 787,920 769,414 2.4% Intermediates and other chemicals 449,062 473,044 (5.1%)
(1) In this and other tables of this MD&A, immaterial deviations in the calculation of percentage changes, subtotals and totals are explained by rounding.
(2) Including Rosneft’s share in the processing / production volumes of OOO Yugragazpererabotka in 2013 and the first quarter of 2014. (3) Excluding Rosneft’s share in the processing / production volumes of OOO Yugragazpererabotka in 2013 and the first quarter of 2014. (4) Following the acquisition of control in OOO Yugragazpererabotka, we changed our approach to the treatment of raw NGL production and
fractionation volumes at Nyagan GPP. (5) Including fractionation volumes under processing arrangements.

121
Financial Results
The following table presents the Group's key financial measures for the years ended 31 December 2014 and 2013:
Year ended 31 December Change
% RR millions, except as stated 2014 2013
Income statement highlights Revenue (net of VAT and export duties) 361,000 269,814 33.8% EBITDA 102,767 78,862 30.3%
EBITDA margin, % 28.5% 29.2% EBITDA margin adjusted for naphtha trading(1), % 32.2% 29.2%
Profit for the reporting period 25,071 45,458 (44.8%) Profit margin, % 6.9% 16.8%
Adjusted profit for the reporting period(2) 69,311 54,809 26.5%
Cash flow highlights Net cash from operating activities, including 91,052 72,741 25.2%
Operating cash flows before working capital changes 105,313 77,916 35.2% Net cash used in investing activities, including (97,370) (70,384) 38.3%
Purchase of property, plant and equipment (67,707) (70,010) (3.3%) Acquisition of interest in subsidiaries, net of cash acquired (20,666) (1,742) n/m
Net cash from / (used in) financing activities, including 24,093 (7,928) n/m Dividends paid to SIBUR shareholders (14,073) (14,008) 0.5%
As of 31 December 2014
As of 31 December 2013
Key ratios Net debt(3) / EBITDA 1.74x 1.17x EBITDA / Interest(4) 16x 17x
In 2014, SIBUR delivered strong results despite the challenging environment. We recorded a 30.3% increase in EBITDA, which was driven by threefold growth in the EBITDA of our petrochemicals segment, as well as the higher contribution of our feedstock & energy segment. During 2014, our Tobolsk-Polymer Plant gradually ramped up operations, which enabled us to increase production and sales volumes of polypropylene. We launched our new integrated transportation and feedstock processing system. The new Purovsk–Pyt-Yakh–Tobolsk pipeline provides SIBUR with access to additional available volumes of raw NGL in the northern part of Western Siberia, which are processed at the expanded fractionation capacity in Tobolsk, thus enabling SIBUR to increase its overall production volumes of energy products. We also benefited from the Russian rouble depreciation, as our sales are primarily linked to international commodity benchmark prices quoted in US dollars or euros, which supported our revenues as prices turned downward, while our operating expenses are largely denominated in Russian roubles.
The acquisition from Rosneft of a 49% stake in our JV OOO Yugragazpererabotka in March 2014 had a neutral effect on the processing and production volumes at our GPPs. At the same time, consolidation of this JV and the new cooperation terms with Rosneft resulted in higher revenue from natural gas sales and lower expenses related to raw NGL purchases, which were largely offset by higher expenses related to APG purchases.
In 2014, our revenue increased by 33.8% to RR 361,000 million compared to RR 269,814 million in 2013. We saw solid performance of our energy product group, which was primarily attributable to (i) higher sales volumes on expanded trading activities(5) following the launch of the Ust-Luga transshipment facility in the end of 2013, (ii) higher LPG and naphtha production following the launch of new transportation and fractionation capacities, and (iii) higher sales of natural gas following the acquisition from Rosneft of a 49% stake in the JV OOO Yugragazpererabotka. We also saw strong performance in our basic polymers revenues, which was attributable to higher polypropylene production following the launch of Tobolsk-Polymer Plant. The growth in revenues from sales of plastics & organic
(1) Estimated EBITDA margin excludes naphtha trading via the Ust-Luga transshipment facility. (2) Profit for the reporting period net of the foreign exchange loss / gain, the equity-settled share-based payment plans, and the non-cash gains on
deconsolidation of OOO Yugragazpererabotka in March 2013 and its acquisition in March 2014. (3) Net debt represents total debt less cash and cash equivalents. (4) Interest represents accrued interest, i.e. includes interest expense and capitalised interest. (5) Trading operations via the Ust-Luga transshipment facility were ceased starting 2015.

122
synthesis products was mainly attributable to capacity expansions in PET and BOPP-films. However, our revenue from sales of synthetic rubbers declined owing to the persistently weak market environment.
Our EBITDA for the period amounted to RR 102,767 million, a growth of 30.3% from RR 78,862 million in 2013. Our EBITDA margin totaled 28.5% compared to 29.2% reported a year earlier. Our estimated EBITDA margin, adjusted for low-marginal naphtha trading activities via the Ust-Luga transshipment facility(1), totaled 32.2% in 2014.
The solid growth in the Group’s EBITDA was driven by the strong performance of our petrochemicals segment, as well higher EBITDA of the feedstock & energy segment. Our petrochemicals segment recorded threefold growth in EBITDA reaching RR 20,806 million in 2014 from RR 7,623 million in 2013. The segment also demonstrated strong improvement in EBITDA margin to 14.6% in 2014 from 5.9% in 2013. The increase in EBITDA and the respective margin was mainly attributable to the contribution of Tobolsk-Polymer Plant, as well as lower feedstock costs for petrochemical production on the back of declining prices for energy products. Our feedstock & energy segment also posted a healthy growth in EBITDA of 13.9% despite the downward pricing trend, which was attributable to the segment’s expansion, as well as higher APG processing volumes.
Our profit in 2014 decreased by 44.8% to RR 25,071 million from RR 45,458 million a year earlier. The decrease was mainly attributable to RR 85,433 million in foreign exchange loss due to the dramatic Russian rouble depreciation and the respective revaluation of our liabilities. This was partially offset by a RR 52,773 million non-cash gain on acquisition of a 49% stake in OOO Yugragazpererabotka. Adjusted for one-off non-cash factors, such as foreign exchange loss, gains on consolidation and deconsolidation of OOO Yugragazpererabotka, and charges related to the equity-settled share-based payment plans, our profit for the period increased by 26.5% to RR 69,311 million in 2014 from RR 54,809 million a year earlier.
Our cash from operating activities before working capital changes increased by 35.2% to RR 105,313 million from RR 77,916 million in 2014 and 2013, respectively. This was primarily attributable to a 30.3% growth in EBITDA.
For a detailed discussion on SIBUR’s operational and financial performance see “Results of Operations” and “Liquidity and Capital Resources”.
The following table provides a reconciliation of EBITDA to profit for the years ended 31 December 2014 and 2013:
Year ended 31 December RR millions 2014 2013
Profit for the reporting period 25,071 45,458
Income tax (benefit) / expense (2,054) 9,844 Share of net (income) / loss of joint ventures and associates 3,827 (794) Gain on disposal of subsidiary (18) (335) Gain on deconsolidation of subsidiary - (2,413) Gain on acquisition of subsidiary (52,773) - Net finance expenses 89,765 4,844 Equity-settled share-based payment plans 11,580 7,894 Impairment of PPE and write-off of advances for capital construction 1,048 887 Depreciation and amortisation 26,321 13,477
EBITDA 102,767 78,862
(1) Trading operations via the Ust-Luga transshipment facility were ceased starting 2015.

123
OVERVIEW
SIBUR is a uniquely positioned vertically integrated gas processing and petrochemicals company. We own and operate Russia’s largest gas processing business in terms of associated petroleum gas processing volumes and are a leader in the Russian petrochemicals industry.
We have two operating and reportable segments: feedstock & energy and petrochemicals. SIBUR's feedstock & energy segment comprises (i) gathering and processing of associated petroleum gas (APG) that we purchase from major Russian oil companies, (ii) transportation, fractionation and other processing of natural gas liquids (NGLs) that we produce internally or purchase from major Russian oil and gas companies, and (iii) production, marketing and sales of energy products, such as natural gas, liquefied petroleum gases (LPG), naphtha, methyl tertiary butyl ether (MTBE) and other fuels and fuel additives. We sell these energy products on the Russian and international markets and use some of them as feedstock for our petrochemicals segment. Our petrochemicals segment produces a wide range of petrochemical products, including basic polymers, synthetic rubbers, plastics and products of organic synthesis, as well as intermediates & other chemicals.
As of 31 December 2014, SIBUR operated 26 production sites across Russia and employed more than 25,000 personnel(1). We serve over 1,400 large customers operating in the energy, automotive, construction, fast moving consumer goods (FMCG), chemical and other industries in approximately 70 countries.
RECENT DEVELOPMENTS
In January 2015, SIBUR paid the second installment for the acquisition of a 49% interest in OOO Yugragazpererabotka to Rosneft in the amount of RR 32,797 million (equivalent to USD 500 million). The remaining outstanding amount of USD 500 million is payable in April 2015.
In January 2015, SIBUR signed an agreement for the organisation of the sale of the Ust-Luga liquefied petroleum gas and naphtha transhipment terminal with a consortium of investors including Russia Direct Investment Fund (RDIF), Gazprombank and several foreign investors. The closing is expected within the year.
In December 2014, SIBUR signed agreements with a consortium of European banks for ECA-backed long-term financing of the German content manufacturing for ZapSibNeftekhim (ZapSib-2). Committed credit lines in the amount of EUR 1,575 million covered by Euler Hermes, the German export credit agency, will be open for the Group in order to finance expenditures related to the contracts with Linde AG (Germany) and ThyssenKrupp Industrial Solutions (Germany). The facility is payable in equal installments semi-annually in ten years after the project’s completion (see “Capital Expenditures” and “Borrowings” below for further details).
In November 2014, SIBUR changed its registered office and form of incorporation to a public joint stock company. The Company’s official name in Russian is «Публичное акционерное общество «СИБУР Холдинг» (ПАО «СИБУР Холдинг»); its official name in English is Public Joint-Stock Company SIBUR Holding (PAO SIBUR Holding). The Group's holding company is registered in Tobolsk. The office of OOO SIBUR (SIBUR Holding's management company) remains in Moscow.
In October 2014, SIBUR expanded its exports of biaxially oriented polypropylene films (BOPP-film) to the European markets. The first lots were shipped to Spain and Bosnia and Herzegovina.
In October 2014, SIBUR paid RR 7,690 million in dividends for the first half of 2014 calculated as 25% of net profit for the first half of 2014 based on its IFRS consolidated financial statements and adjusted for exceptional non-cash items.
(1) Excluding the personnel of non-consolidated joint ventures.

124
In September 2014, SIBUR and SolVin announced the launch of RusVinyl polyvinyl chloride (PVC) production in Kstovo (Nizhny Novgorod Region). RusVinyl is a greenfield project with investments exceeding RR 60 billion. It is one of the largest PVC producers in Russia with an annual production capacity of 330,000 tonnes of PVC and 225,000 tonnes of caustic soda. It will benefit from the nearby supply of ethylene, a key raw material for PVC, from our steam cracker in Kstovo with the capacity expanded to 360,000 tonnes per annum for the launch RusVinyl. Salt, the other feedstock for PVC production, will be supplied from Belarus and from the Astrakhan Region of Russia. SIBUR will not exercise operational control over RusVinyl, thus will not consolidate its results. At the same time, we will record revenues from sales of ethylene.
In September 2014, SIBUR's Board of Directors approved the expansion of the total Company’s 2014 budget for the purpose of ZapSibNeftekhim (ZapSib-2) by RR 21 billion (see “Capital Expenditures” below for further details).
In September 2014, Mr. Kirill Shamalov acquired 17% in SIBUR Holding from Mr. Gennady Timchenko. As a result, Mr. Kirill Shamalov’s ownership in SIBUR Holding increased to 21.3%, while Mr. Gennady Timchenko’s stake decreased to 15.3%.
In June 2014, SIBUR and NOVATEK announced the launch of integrated raw NGL production, transportation and processing capacities. SIBUR launched its second gas fractionation unit (GFU) in Tobolsk and was at the advanced stage of construction of a 1,100 km raw NGL pipeline connecting NOVATEK’s Gas Condensate Plant in Purovsk, SIBUR’s main pumping station near Pyt-Yakh and SIBUR’s Tobolsk production site. The entire pipeline was put into commercial operation at the end of 2014. With the launch of the second GFU, SIBUR can now process up to 6.6 million tonnes of raw NGL per annum (for a full year of operation) at the Tobolsk production site, inter alia supplied from Purovsky GCP.
In May 2014, SIBUR launched a new biaxially oriented polypropylene films (BOPP-films) production line with an annual nameplate production capacity of 30,500 tonnes of BOPP-films at our production site in Novokuybyshevsk, thus increasing the plant’s production capacity to 55,500 tonnes per year. Total capital expenditures on the project amounted to approximately RR 1.9 billion (net of VAT).
In May 2014, SIBUR, Gazprom Neft and Titan Group signed an agreement to establish a joint venture based on Omsk Polypropylene Plant (OOO Poliom). As part of the deal, Sibgazpolimer, a joint venture of SIBUR and Gazprom Neft (each with a 50% stake), acquired a 50% stake in OOO Poliom from Titan Group for a total consideration of RR 4,428 million (partially contingent). According to the agreement, Gazprom Neft will supply feedstock (propane-propylene fraction from Omsk Refinery) to OOO Poliom. The working capital price adjustment was paid in September 2014. In October 2014, OOO Poliom passed a capacity test and confirmed the increase in its annual nameplate capacity to 210,000 from 180,000 tonnes. Following this, Sibgazpolimer paid the remaining price adjustment to Titan Group.
In May 2014, SIBUR and SINOPEC signed a contract to establish a JV for the construction of a 50,000 tonnes per annum butadiene nitrile rubber (NBR) plant in the Shanghai Chemical Industry Park. Under the terms of this contract, SINOPEC will hold 74.9% of the shares in the newly formed entity, while SIBUR will hold 25.1% of the shares. The parties also signed a technology license agreement for the use of SIBUR's NBR production technology at the new facility.
In May 2014, SIBUR paid RR 6,383 million in dividends for the second half of 2013 calculated as 25% of net profit for the second half of 2013 based on its IFRS consolidated financial statements and adjusted for exceptional non-cash items.
In April 2014, SIBUR completed expansion of its polyethylene terephthalate (PET) capacity at our production site in Blagoveshchensk to 210,000 tonnes from 140,000 tonnes per annum. Total capital expenditures on the project amounted to approximately RR 1.9 billion (net of VAT).
125
In April 2014, SIBUR divested its PVC cable compounds production, previously operated by SIBUR-Neftekhim, a SIBUR’s subsidiary. Following the divestment, SIBUR now does not feature plastic compounds in its product portfolio.
In March 2014, SIBUR approved an expansion project for Vyngapurovskiy GPP to accommodate APG supplies from Russneft's fields. In 2013, SIBUR and Russneft signed an agreement for supplies of APG from Varieganneft's fields to SIBUR, with SIBUR to process the supplied volumes. The project is designed to increase the annual APG processing capacity of Vyngapurovskiy GPP from 2.8 to 4.2 billion cubic metres.
In March 2014, SIBUR and Rosneft agreed on a new format and terms of cooperation. SIBUR acquired from Rosneft a 49% interest in OOO Yugragazpererabotka, a joint venture that owned the Nizhnevartovskiy, Belozerniy and Nyagan GPPs, thereby gaining full control over the assets. New contracts with an extended tenor through the end of 2032 were signed for (i) APG supplies from Rosneft's fields to OOO Yugragazpererabotka’s GPPs with guaranteed supply volumes of approximately 10 billion cubic metres per annum, and (ii) natural gas sales from these GPPs to Rosneft (see Appendix II for further details).
In February 2014, SIBUR divested its 100% interest in the Oka Polymer industrial park located in Dzerzhinsk, Nizhny Novgorod Region, as a non-core asset, to Tosol-Sintez, a resident of the park. Oka Polymer industrial park was established in the process of transformation of the production site of Caprolactam, an obsolete chlorine and caustic soda production facility that was decommissioned in April 2013.
126
CERTAIN FACTORS AFFECTING OUR RESULTS OF OPERATIONS
Macroeconomic and Other Economic Trends
Overall economic conditions in Russia and globally have significantly impact our operations as demand for our products is driven by consumers across a diverse range of industries, which are dependent on the state of the global economy and the economies of their respective countries.
Current Macroeconomic Situation
In 2014, the macroeconomic environment substantially deteriorated on the back of the sharp decline in oil prices and the material Russian rouble depreciation. Also, the political crisis in Ukraine and the respective negative reaction from United States of America, European Union and other aligned countries resulted in the imposition of sanctions against certain Russian individuals and legal entities, which has constrained access to liquidity from international capital markets and banks for some Russian banks and corporate borrowers. SIBUR currently is not subject to any of the above sanctions. SIBUR management believes that sanctions imposed on other Russian entities have had no material effect on SIBUR's operational and financial performance. At the same time, the management closely monitors the situation and takes preventive measures to mitigate negative effects of the changes in macroeconomic parameters.
GDP Growth
One of the key factors that drive demand for our products or otherwise affect our results of operations is GDP growth globally. SIBUR is also subject to economic risks specific to the Russian Federation as all of our production assets are located in Russia.
The following table contains selected data on year-on-year GDP growth for the years ended 31 December 2014 and 2013:
Year ended 31 December 2014 2013
European Union (EU-15) 1.2% (0.0%) United States 2.4% 2.2% China 7.4% 7.7% Russia 0.6%(1) 1.3%
Source: Eurostat, U.S. Bureau of Economic Analysis, National Bureau of Statistics of the People's Republic of China, Russian Federal State Statistics Service
Foreign Exchange Rate Fluctuations
The movements of the Russian rouble against the US dollar and the euro may have a significant impact on our financial performance.
The following table presents selected data on exchange rate movements for the years ended 31 December 2014 and 2013:
Year ended 31 December 2014 2013
RR/USD rate at the end of the preceding period 32.7292 30.3727 RR/USD rate at the end of the reporting period 56.2584 32.7292 Average RR/USD rate 38.4217 31.8480 RR/EUR rate at the end of the preceding period 44.9699 40.2286 RR/EUR rate at the end of the reporting period 68.3427 44.9699 Average RR/EUR rate 50.8150 42.3129
Source: CBR
SIBUR's functional and reporting currency is the Russian rouble. Our sales to countries outside of Russia (51.2% and 42.8% of total revenue in 2014 and 2013, respectively) are primarily denominated in US dollars and, to a lesser extent, in euros. In many cases our domestic sales are linked to international benchmark prices quoted in US dollars and euros. At the same time, our expenses are primarily
(1) Preliminary data.
127
denominated in Russian roubles. As a result, depreciation of the Russian rouble relative to the US dollar or the euro positively affects our operational results, while appreciation of the Russian rouble relative to these currencies tends to have a negative effect on our operational results.
A significant part of our borrowings is also denominated in foreign currencies, primarily in US dollars and, to a lesser extent, in euros. When the Russian rouble depreciates against the US dollar or euro, our liabilities denominated in these currencies increase in Russian rouble terms, as do interest costs on SIBUR's foreign currency-denominated borrowings. Correspondingly, our financial expenses tend to increase as a result of foreign exchange losses recorded by the Group. When the Russian rouble appreciates against the US dollar or euro, our liabilities denominated in these currencies decrease in Russian rouble terms, as do interest costs on SIBUR's foreign currency-denominated borrowings. Correspondingly, our financial income tends to increase as a result of foreign exchange gain recorded by the Group.
The Russian rouble on average depreciated by 20.6% relative to the US dollar and by 20.1% relative to the euro in 2014 compared to the average 2013 levels, which had a positive impact on our revenue. At the same time, the Russian rouble as of 31 December 2014 depreciated against the year-end level of 2013 by 71.9% relative to the US dollar, resulting in a substantial financial loss reported in SIBUR’s consolidated financial statements for 2014, which was largely attributable to the revaluation of our foreign currency-denominated debt.
Inflation
Historically Russia has reported higher inflation rates compared to developed markets. Increases in inflation may significantly affect our financial results because of an increase in operating expenses, which are linked to the general price level in Russia, such as staff costs, rent and others.
The following table presents selected data on inflation rates for the years ended 31 December 2014 and 2013:
Year ended 31 December 2014/2013 2013/2012
Consumer price index (CPI) 11.4% 6.5% Producer price index (PPI) 5.9% 3.7%
Source: Russian Federal State Statistics Service
Crude Oil, Naphtha, Raw NGL and LPG Prices
Prices for a large portion of our feedstock and processed goods are directly or indirectly linked to oil or oil derivative prices. Growth in prices for oil or oil derivatives generally has a net positive effect on our financial results because our position as a net seller of energy products allows us to mitigate the negative effect that growth in oil and oil derivative prices has on our cost base. Decline in prices for oil or oil derivatives generally has a net negative effect on our financial results, which is partially offset by decrease in our cost base.
Crude oil prices typically influence prices for raw NGL, LPG and naphtha, which we purchase from third parties as feedstock. This correlation, however, is not perfect, as prices for LPG and naphtha are also influenced by supply and demand trends and other factors in their own markets, while prices for raw NGL, depending on its composition, largely correlate with prices for LPG and naphtha.
Oil prices have a significant impact on the Russian rouble exchange rate fluctuations. Historically, the Russian rouble has typically, though not consistently, appreciated in real terms against the US dollar and the euro when oil prices increased, and depreciated against these currencies when oil prices decreased. The negative effect of declining oil prices tends to reduce our revenue, while mitigated by the positive effect of the weakening Russian rouble on export sales or domestic sales linked to the US dollar or the euro (see “Foreign Exchange Rate Fluctuations” above).

128
Oil and oil derivative prices have historically been volatile and dependent on a variety of factors including, among others, market supply and demand balances, geopolitical developments affecting the principal producing nations and force majeure events.
The following table presents average benchmark international market prices for crude oil, naphtha and LPG for the years ended 31 December 2014 and 2013:
Year ended 31 December Change
% USD per tonne except as stated 2014 2013 Brent crude oil (USD per bbl) 99.5 108.8 (8.5%) Naphtha (CIF NWE) 836.6 903.2 (7.4%) LPG DAF Brest 715.1 699.4 2.2% LPG Sonatrach for Bethioua 728.8 825.5 (11.7%) LPG Argus cif ara (large) 712.3 837.0 (14.9%)
Source: (1) Bloomberg (2) Argus
Export and Excise Duties
The LPG and naphtha (excluding pentane and isopentane) that we export are subject to export duties, which are set monthly by the Russian Government. Export sales to member states of the Customs Union (Republic of Belarus and Republic of Kazakhstan) are not subject to export duties.
The export duty on LPG (excluding butane and isobutane) is formula-based and depends on the international benchmark price of LPG (LPG DAF Brest). When the market price for LPG is below USD 490 per tonne, no export duty is levied. Effective 1 January 2015, the Russian Government imposed an export duty on butane and isobutane, which is calculated as the percentage of the export duty on LPG grades excluding butane and isobutane and is set at 10% of that level for 2015 with successive annual increases by 10% until 2022 inclusively.
The export duty on naphtha is calculated as a percentage of export duties on crude oil (Urals). On 1 July 2012, the export duty on naphtha was set at 90% of the crude oil export duty. Effective 1 January 2015, the Russian Government decreased the export duty on naphtha to 85% of the crude oil export duty and announced successive decreases in this rate to 71% for 2016 and 55% for 2017 and further. The decrease in export duty rates for naphtha is implemented as part of the tax maneuver in the Russian oil industry.
The following table presents export duties on LPG and naphtha for the periods and as of the dates indicated:
1 quarter 2 quarter 3 quarter 4 quarter 12 months Change, %
Export duties, USD per tonne 2014 2013 2014 2013 2014 2013 2014 2013 2014 2013 2014 / 2013
LPG (excl. butane and isobutane) At the end of the period 169.1 131.4 86.0 72.2 221.0 75.5 124.8 203.5 124.8 203.5 (38.7%) Average for the period 189.3 176.8 101.1 71.4 152.7 53.7 131.9 159.7 143.8 115.4 24.6%
Naphtha (excl. pentane and isopentane) At the end of the period 345.9 378.6 346.5 323.3 330.8 360.6 249.7 347.1 249.7 347.1 (28.1%) Average for the period 351.5 365.9 344.4 341.8 342.3 344.9 281.6 359.4 330.0 353.0 (6.5%)
Source: Russian Government
As Russia's domestic prices for raw NGL, LPG and naphtha are based on export netback prices, higher export duties reduce the domestic price for these products, while declining export duties support domestic prices. Increase in export duties negatively affect our export and domestic sales of LPG and naphtha, at the same time reducing our feedstock purchasing costs. Decrease in export duties as a result of declining prices for LPG and naphtha supports our external export and domestic sales of these products.
In November 2014, the Russian Government approved a series of changes in taxation of the oil and gas industry (the “tax maneuver”), introducing increases in the unified natural resources production tax rates with a simultaneous decrease in excise taxes and export duties. In particular, the law defines a procedure for calculation of excise duties and tax deductions with respect to domestic sales and processing of naphtha, benzene and paraxylene. According to the procedure an excise duty is incurred at the production of these products. An incremental tax deduction is applicable if the product is processed into non-
129
excisible petrochemical products. For naphtha the incremental factor was set at 1.37 for 2015, 1.60 for 2016 and 1.94 for 2017. For benzene and paraxylene the incremental factor was set at 2.88 for 2015, 2.84 for 2016 and 3.40 for 2017. A tax deduction is not applicable for naphtha if it is sold to entities that do not convert excisable goods into non-excisable petrochemical products. A tax deduction with a factor of 1 is applied in all other cases. The tax maneuver and the respective changes in the excise duties will have a mixed impact on SIBUR. SIBUR does not produces oil and gas, so not exposed to the unified natural resources production tax increase. SIBUR produces naphtha internally, purchases it from third-parties, uses it internally for petrochemicals production and sells it externally. SIBUR produces benzene, purchases it from third parties, uses it for petrochemicals production and sells externally. SIBUR purchases paraxylene from third parties and utilises it internally for petrochemicals production. Overall we expect the tax maneuever to have a slightly positive effect on SIBUR’s financial results.
Natural Gas Prices
The prices at which we purchase a large portion of feedstock and sell natural gas as well as our utility costs are significantly impacted by changes in regulated domestic gas prices at which Gazprom, the major Russian gas producer, sells natural gas on the domestic market. This price regulation is executed by the Russian Government, through the Federal Tariff Service (FTS). Although this price regulation does not apply to independent gas producers, the regulated price significantly influences domestic market conditions and our effective selling prices.
In 2013, natural gas prices for sales to end-customers on the domestic market (excluding residential customers) were set by the FTS using a price formula. The price formula provided for quarterly changes of natural gas prices, as well as the possibility of adjusting natural gas prices within the quarter in case there was a significant deviation (more than 5%) of natural gas prices calculated using a price formula in the previous quarter from the annual wholesale price changes set by the Russian Federation government. In 2013, natural gas prices for sales to end-customers on the domestic market (excluding residential customers) were decreased by an average of 3.0% from 1 April and subsequently increased by an average of 15.0%, 3.1% and 1.9% from 1 July, 1 August and 1 October, respectively. Effective from 1 January 2014, the FTS set natural gas prices back to the August-September levels of 2013, decreasing them by an average of 1.9% from the December 2013 price levels.
In March 2014, the FTS made changes to the “Statement of Gas Price Formula Definition”, which effectively abandoned the quarterly wholesale price calculation based on the natural gas price formula. As a result, natural gas prices in 2014 for sales to all customer categories on the domestic market (excluding residential customers) were calculated using a price formula based on parameters set by FTS in December 2013 and did not change during 2014 (effectively remained at the same price level as the August-September 2013 prices).
Based on the Ministry of Economic Development Forecast published in September 2014, wholesale natural gas prices for sales to all customer categories (excluding residential customers) in July 2015, 2016 and 2017 will be increased by 7.5%, 5.5% and 3.6%, respectively. The Russian Federation government continues to debate various policies relating to the natural gas industry development and natural gas prices growth rate on the Russian domestic market.
The following table presents information on regulated natural gas price changes: Regulated natural gas
price changes Effective date of increase %
1 January 2011 15.0% 1 July 2012 15.0% 1 April 2013 (3.0%) 1 July 2013 15.0% 1 August 2013 3.1% 1 October 2013 1.9% 1 January 2014 (1.9%)

130
Although we are not subject to the Russian Government's regulation of prices for natural gas that we produce from APG, our effective average selling prices for natural gas are close to the regulated gas prices and are typically also indexed in line with the regulated price changes. SIBUR is a net seller of natural gas and historically our financial results have been positively impacted by increases in domestic natural gas prices.
Prices for APG, one of our key feedstock, are not regulated by the Russian Government. There is also no benchmark market price for APG. Prices at which we purchase APG from oil companies are negotiated on a case-by-case basis and depend on a variety of factors (see “Feedstock Sourcing and Mix” below). We typically purchase APG at a price that substantially differs from the regulated domestic natural gas prices because of the significant capital expenditures required to develop and maintain the processing and transportation infrastructure. At the same time, some of our supply contracts regularly index APG prices to reflect changes in the regulated domestic gas prices. Such indexations, however, are not always synchronised with the respective changes in the regulated domestic gas prices. Additionally, there are other factors that influence our APG purchase prices; hence there may be certain discrepancies between movements in our APG purchase prices and the regulated domestic gas prices (see “Feedstock Sourcing and Mix” below for further details).
Cyclicality of the Petrochemicals Industry
Prices for petrochemical products are subject to significant fluctuations as they are influenced by trends in global and domestic supply and demand, including differences in supply and demand between domestic and export markets. Demand is generally linked to economic activity, while supply is linked to long-term investments in capacity expansion and structural changes in feedstock supply, such as, for example, the discovery and commercialisation of new feedstock sources. When significant new capacity becomes available and is not matched by corresponding growth in demand, average industry operating margins typically fall. At the same time, capacity additions require substantial lead times and when growth in demand is not matched by respective capacity expansions, average industry operating margins typically rise. As a result, the petrochemicals industry experiences periods of tight supply, leading to high capacity utilisation rates and margins, followed by periods of oversupply, leading to reduced capacity utilisation rates and margins, and, accordingly, the profit margins of petrochemical producers historically have been cyclical.
As the Group is vertically integrated into the feedstock & energy business and is a net seller of energy products, which are not dependent on the cyclicality of the petrochemicals industry, this partially protects the Group against margin pressures in the periods of oversupply in the petrochemicals industry. Additionally, the Group's access to attractively priced feedstock, its diversified mix as well as a diversified product portfolio puts the Group in a more advantaged position compared to majority of other petrochemical companies during market downturns in the petrochemicals industry.
Feedstock Sourcing and Mix
Types of Hydrocarbon Feedstock
To operate our business successfully we must obtain sufficient quantities of feedstock in a timely manner and at acceptable prices. Therefore, our access to feedstock and its mix have a material impact on our financial results. We use two major types of hydrocarbon feedstock: associated petroleum gas (APG) and natural gas liquids (NGLs), primarily raw NGL, as well as LPG and naphtha.
APG is a by-product of oil production. We process APG at our gas processing plants (GPPs) to produce natural gas and raw NGL. Following the changes in the terms of cooperation with Rosneft and the acquisition of Yugragazpererabotka in March 2014, APG accounted for 44.3% and 26.9% of our expenses related to third-party hydrocarbon feedstock purchases in 2014 and 2013, respectively. As a percentage of total feedstock and materials costs, APG accounted for 26.3% and 14.0% in 2014 and 2013, respectively (see Appendix II for further details).
131
NGLs are used as raw material for both the feedstock & energy business and for the petrochemicals business. Raw NGL is produced as a result of APG processing or through stabilisation of unstable gas condensate which is obtained from the processing of wet gas extracted from gas fields. LPG and naphtha are produced through fractionation of raw NGL. We also produce NGLs at our own GPPs and GFUs and also purchase them from third parties. Following the changes in the terms of cooperation with Rosneft and the acquisition of Yugragazpererabotka in March 2014, NGLs accounted for 55.7% and 73.1% of our expenses related to third-party hydrocarbon feedstock purchases in 2014 and 2013, respectively. As a percentage of total feedstock and materials costs, NGLs accounted for 33.1% and 38.1% in 2014 and 2013, respectively (see Appendix II for further details).
Feedstock Sourcing
A large portion of our hydrocarbon feedstock is obtained from Rosneft and particularly from its subsidiary RN Holding (formerly TNK-BP Holding; renamed RN Holding as of 30 July 2013 following its acquisition by Rosneft). In addition to our arrangements with Rosneft and its subsidiary RN Holding, we purchase APG and NGLs from other major oil and gas companies in Western Siberia, including Gazprom Neft, RussNeft, LUKOIL, NOVATEK and Gazprom, primarily under long-term contracts.
In 2014, SIBUR expanded its access to abundant raw NGL resources in Western Siberia through commissioning of a raw NGL pipeline connecting NOVATEK’s Purovsky Gas Condensate Plant to our expanded gas fractionation capacities in Tobolsk, which enabled us to consolidate rising supplies of raw NGL. Our major external raw NGL suppliers are NOVATEK and Gazprom.
In March 2014, SIBUR acquired from Rosneft a 49% interest in OOO Yugragazpererabotka. The transaction had a neutral effect on the processing and production volumes at our GPPs, while the parties entered into new contracts with extended tenor through 2032 for (i) APG supplies from Rosneft's fields to OOO Yugragazpererabotka’s GPPs with guaranteed supply volumes increased to approximately 10 billion cubic metres per annum, and (ii) dry gas sales from OOO Yugragazpererabotka’s GPPs to Rosneft. Following the acquisition, SIBUR pays for 100% of APG supplied to the GPPs of OOO Yugragazpererabotka with Rosneft remaining the major supplier and retains 100% of raw NGL and natural gas produced at the GPPs. As a result, in 2014 Rosneft’s share (including RN Holding) in our APG supplies increased to 68.6% from 62.9% of SIBUR’s total APG supplies in volume terms in 2013. The raw NGL supplies from Rosneft (including RN Holding) in 2014 decreased to 15.1% from 41.8% in SIBUR’s total NGLs supplies in volume terms in 2013 (see Appendix II for further details).
As of 31 December 2014, approximately 92% of our planned APG supplies for 2015 were guaranteed under multi-year supply contracts. Overall, as of 31 December 2014, our multi-year APG supply contracts had a weighted average maturity of 16.4 years.
As of 31 December 2014, approximately 80% of our planned NGLs supplies for 2015 were guaranteed under multi-year supply contracts. Overall, as of 31 December 2014, our multi-year NGLs supply contracts had a weighted average maturity of 17.9 years.
We continuously work with all the largest oil and gas producers in Western Siberia with the view of extending tenors of the existing agreements and/or entering into new long-term supply contracts on both APG and NGLs supplies. Multi-year supply contracts and joint venture arrangements enhance predictability of feedstock pricing and volumes and allow better planning of the Group's future operating expenses and investments, which is particularly important given the capital-intensive nature of the Group's investment programme.
Pricing
Oil companies produce APG as a by-product of oil extraction and by law must evacuate it from the field or otherwise utilise it. Failure to do so can result in increasingly high fines and potentially jeopardise an oil company’s license to operate the field. Most oil companies in Western Siberia do not own gas processing facilities and have been reluctant to develop such facilities as this requires substantial capital investments, while oil companies prefer to invest in their core oil exploration and production business.

132
Apart from being processed into hydrocarbon feedstock at a GPP, only limited volumes of APG can be used productively, mostly for power generation or for re-injection into the reservoir.
The Russian Government has consistently increased incentives for oil companies to utilise APG. Based on the Russian Government’s resolution issued in November 2012, penalties for APG flaring exceeding permitted thresholds (currently set at 5% of APG production volumes) have been substantially increased and become material for oil companies: effective 1 January 2013, the penalty has been increased from 4.5x the standard emission charge in 2012 to 12x the standard emission charge in 2013 and 25x the standard emission charge starting from 2014. The standard emission charges depend on the type of pollutant and are regularly indexed. According to the preliminary estimates of CDU TEK, the total volume of flared APG in Russia in 2014 was 12.2 billion cubic metres or 16% of total produced volumes, while APG utilisation level totaled 84% as a percentage of produced volumes.
SIBUR provides oil companies with an attractive solution for APG utilisation, therefore, we are able to source APG at advantageous prices. Given the limited options for using APG and the lack of alternatives for evacuating it from oil fields, there is no market or benchmark price for APG. APG pricing is also not subject to government regulation. As a result, we purchase APG from oil companies at prices that are negotiated on a case-by-case basis and typically substantially differ from the FTS regulated natural gas prices. The magnitude of the difference and the absolute price for APG is dependent on the following key factors: the quality and composition of APG in terms of target liquid fractions content, distance of an APG source from our GPPs, availability of collection and transportation infrastructure and capital and operating expenditures needed to construct, expand and maintain that infrastructure. The price is also dependent on the potential capital expenditures that the oil company would need to incur to construct its own gas processing capacity as an alternative to selling APG to SIBUR.
Currently SIBUR has two types of APG purchase contracts: Under first contract type, APG purchase price once agreed upon in absolute terms, is typically
regularly indexed to reflect changes in the FTS regulated prices for natural gas. Under the new arrangements with Rosneft for APG supplies to Nizhnevartovskiy, Belozerniy and
Nyagan GPPs, the APG purchase price is indexed in line with changes in prices for APG derivatives:natural gas and raw NGL (see “Crude Oil, Naphtha, Raw NGL and LPG Prices” and “Natural GasPrices” above).
Additional volumes of APG that we source from oil companies (new volumes under new agreements or volumes under existing agreements that exceed initially pre-agreed or guaranteed volumes) can be supplied at a higher price due to additional capital and operating expenses incurred by oil companies to produce and deliver such volumes. Also, modification of terms of the existing agreements, both at expiry or as a result of renegotiation, may cause material changes in our APG pricing levels.
Our NGLs feedstock is typically priced with reference to international prices for LPG and naphtha, while prices for raw NGL, depending on its composition, are largely correlated with prices for LPG and naphtha. As the supply of NGLs significantly exceeds demand in Russia and particularly in Western Siberia, prices for NGLs are determined on an export netback basis, which reflects transportation costs and export duties. Transportation of NGLs out of Western Siberia is costly, with transportation costs consistently rising, reducing the prices at which NGLs are available for purchase in Western Siberia. Therefore, the domestic prices for NGLs feedstock in Western Siberia are substantially lower than those available to the majority of SIBUR's international petrochemical peers. The Group's NGLs supply contracts typically contain a formula where prices are determined by the respective netbacks and reflect the fraction content of NGLs, need for and cost of fractionation, capital expenditures required to construct and maintain the respective infrastructure as well as the availability and quality of alternative selling channels that the oil or gas company supplying the NGLs has.
Feedstock Trends
APG volumes from oil fields located in Western Siberia are expected to increase only moderately given the maturity profile of the region's oil fields, while concentration of liquid fractions in the APG may

133
decline. We expect this trend to be partially offset by lower APG flaring rates and our efforts to increase the liquids recovery ratio at our GPPs.
We expect that supplies of NGLs from gas fields in Western Siberia will grow substantially faster than supplies of APG or NGLs derived from APG, due to the steadily growing production of natural gas and the increasing share of wet gas in gas production, according to IHS CERA. We expect NGLs derived from wet gas to be a growing source for the future development of our petrochemicals business, particularly for projects located in Western Siberia.
Transportation Tariffs
We incur substantial transportation costs due to the geographic spread of our operations. For the transportation services we use railway, port facilities and trucks. While we operate our own gas and raw NGL pipelines and railway carrier fleet, we also use third-party transportation services. Third-party transportation services accounted for 14.7% and 18.3% of our total operating expenses in 2014 and 2013, respectively. Changes in transportation tariffs and prices for third-party services have a significant effect on our operating expenses.
Railway Transportation Tariffs
We use rail for transportation of refined products, intermediates and feedstock, including 100% of our LPG, naphtha and MTBE, certain volumes of raw NGL and a major part of our petrochemical products.
Our rail transportation costs comprise a transportation tariff charged for access to Russia's main railway and usage of locomotives (the “Railway Tariff”), which accounts for the majority of our total rail transportation costs. The Railway Tariff is charged by Russian Railways, Russia's state-owned monopoly, and is regulated by the FTS. The Railway Tariff is specific to types of products, types of carriers and their tonnage, transportation routes and the volume of a delivery. The FTS reviews the Railway Tariff on an annual basis. The average increase in the Railway Tariff was 7.0% in 2013 and remained unchanged in 2014 for the majority of products, while effective 9 August 2014, Russian Railways increased railroad transportation tariffs within the Russian Federation territory for LPG deliveries to the export markets by 13.4%. Effective 1 January 2015, the FTS increased railroad transportation tariffs by 10% in accordance with the Ministry of Economic Development Forecast published in September 2014. Additionally, effective 29 January 2015, Russian Railways expanded a 13.4% increase in tariffs for export deliveries for all types of products.
In 2013, the FTS has granted Russian Railways the authority to increase or decrease the Railway Tariff applied to individual customers for deliveries of particular products from/to particular geographies based on the economic rationale for Russian Railways (within limits set by the FTS) and subject to approval by the FTS and the Russian Government.
Electricity and Heat Tariffs
Our business is energy-intensive. Electricity and heat account for the largest portion of our energy costs. As a result, changes in tariffs for electric power and heat have a significant effect on our operating expenses.
Electricity
We make electricity purchases on a centralised basis. In addition to purchases of electricity for internal needs, we also buy electricity for further resale to third parties, which, inter alia, include other companies located at our production sites. Revenue from sales of electricity to third parties is reported under “Other sales” in the consolidated financial statements.
The Russian electricity market has been liberalised gradually over the past few years. However, maximum levels of electricity prices remain under the supervision of the Federal Antimonopoly Service

134
(FAS) and regional regulatory authorities. One of the most important factors that influence electricity prices is fuel cost (primarily natural gas and coal), and increases in natural gas prices tend to result in higher electricity prices. We also own and continue to expand our own electric power generating capacity in order to reduce our exposure to higher electricity prices from third-party suppliers. In 2014, SIBUR launched an 18 MW power plant at the Perm production site, which will enable us to meet approximately 40% of the site’s electric power needs. At the Group's level, internal electric power generation accounts for an insignificant share in total electricity consumption.
Heat Energy
We source heat energy in the form of steam and hot water from regional suppliers at regulated prices. Heat energy prices are also largely dependent on prices for natural gas. In order to minimise dependence on third-party providers, we generate a substantial portion of heat energy (approximately 53% of the total heat consumed in 2014) at our own production sites.
The following table presents volumes purchased and effective average prices for electricity and heat tariffs for the years ended 31 December 2014 and 2013:
Year ended 31 December Change % 2014 2013
Volume Average
tariff Volume Average
tariff Volume Average
tariff
Electricity (millions of kw∙hour or RR per kw∙hour) 8,363 2.14 6,470 2.17 29.3% (1.1%) Heat (thousands of gigacalories or RR per gigacalorie) 8,842 771 9,072 756 (2.5%) 2.0%
SIBUR's ability to sell natural gas enables it to balance its exposure to growth in electricity and heat costs, which to a large extent are influenced by increases in natural gas prices.

135
RESULTS OF OPERATIONS FOR THE YEARS ENDED 31 DECEMBER 2014 AND 2013
The following table presents selected data on our results of operations for the years ended 31 December 2014 and 2013:
Year ended 31 December Change
% RR millions, except as stated 2014 % of revenue 2013 % of revenue
Revenue 361,000 100.0% 269,814 100.0% 33.8%
Energy products 217,233 60.2% 144,716 53.6% 50.1% Petrochemical products 132,513 36.7% 116,018 43.0% 14.2% Other 11,254 3.1% 9,080 3.4% 23.9%
Operating expenses before equity-settled share-based payment plans (285,602) (79.1%) (205,316) (76.1%) 39.1% Equity-settled share-based payment plans (11,580) (3.2%) (7,894) (2.9%) 46.7%
Operating expenses (297,182) (82.3%) (213,210) (79.0%) 39.4%
Operating profit 63,818 17.7% 56,604 21.0% 12.7%
Net finance expenses (89,765) (24.9%) (4,844) (1.8%) n/m Gain on acquisition of subsidiary 52,773 14.6% - - n/m Gain on deconsolidation of subsidiary - - 2,413 0.9% (100.0%) Gain on disposal of subsidiary 18 0.0% 335 0.1% (94.6%) Share of net income / (loss) of joint ventures and associates (3,827) (1.1%) 794 0.3% n/m
Profit before income tax 23,017 6.4% 55,302 20.5% (58.4%)
Income tax gain / (expense) 2,054 0.6% (9,844) (3.6%) n/m Profit for the reporting period 25,071 6.9% 45,458 16.8% (44.8%)
Profit for the reporting period, including attributable to: 25,071 6.9% 45,458 16.8% (44.8%)
Non-controlling interest 67 0.0% (140) (0.1%) n/m Shareholders of SIBUR 25,004 6.9% 45,598 16.9% (45.2%)
Revenue
The following table presents a breakdown of our revenue by product group for the years ended 31 December 2014 and 2013:
Year ended 31 December Change
% RR millions, except as stated 2014 % of revenue 2013 % of revenue
Energy products LPG 77,165 21.4% 60,823 22.5% 26.9% Naphtha 68,877 19.1% 26,256 9.7% 162.3% Natural gas 38,007 10.5% 26,673 9.9% 42.5% MTBE 19,364 5.4% 18,596 6.9% 4.1% Raw NGL 9,709 2.7% 9,405 3.5% 3.2% Other fuels and fuel additives 4,111 1.1% 2,963 1.1% 38.7% Total energy products sales 217,233 60.2% 144,716 53.6% 50.1%
Petrochemical products Plastics and organic synthesis products 45,777 12.7% 41,583 15.4% 10.1% Basic polymers 38,393 10.6% 22,818 8.5% 68.3% Synthetic rubbers 27,847 7.7% 32,432 12.0% (14.1%) Intermediates and other chemicals 20,496 5.7% 19,185 7.1% 6.8% Total petrochemical products sales 132,513 36.7% 116,018 43.0% 14.2%
Sales of processing services 979 0.3% 1,393 0.5% (29.7%) Other sales 10,275 2.8% 7,687 2.8% 33.7% Total revenue 361,000 100.0% 269,814 100.0% 33.8%
In 2014, our revenue increased by 33.8% year-on-year to RR 361,000 million from RR 269,814 million in 2013 on higher sales of energy products and basic polymers.
Energy Products
In 2014, our revenue from sales of energy products increased by 50.1% to RR 217,233 million from RR 144,716 million in 2013 primarily on a significant increase in sales volumes, as well as an increase in the effective average selling prices across the product group.

136
Our energy products sales volumes were affected by the following key factors: (i) Substantial expansion of trading activities following the launch of the Ust-Luga
transshipment facility in the end of 2013, which resulted in a significant increase in naphtha trading volumes;
(ii) Organic increase in LPG and naphtha production following the launch of integrated transportation and fractionation capacities, which enabled SIBUR to process increased volumes of available raw NGL feedstock;
(iii) Acquisition from Rosneft of a 49% stake in OOO Yugragazpererabotka (JV) in March 2014, which resulted in consolidation of 100% of natural gas volumes produced at the GPPs of the JV, and therefore, in higher sales of natural gas (see Appendix II for further details).
Substantial Russian rouble depreciation supported our effective average selling prices across the product range despite volatile market prices for most products. Longer delivery basis for the trading volumes also contributed to the average price increase, which was offset by higher transportation costs.
In 2014, 36.5% of total external energy product sales was derived from the domestic market compared to 48.6% in 2013, while export sales accounted for 63.5% versus 51.4% in 2014 and 2013, respectively. The increase in export volumes was attributable to higher naphtha and LPG seaborne sales following the launch of the Ust-Luga transshipment facility.
In 2015, SIBUR ceased naphtha trading operations via the Ust-Luga terminal and replaced them with transshipment services maintaining the facility’s capacity load.
Liquefied Petroleum Gases (LPG)
In 2014, our revenue from LPG sales increased by 26.9% to RR 77,165 million from RR 60,823 million in 2013 on a 16.2% increase in sales volumes, as well as a 9.2% increase in the effective average selling price. The increase in our external LPG sales volumes on a 14.8% production growth was a result of higher fractionation volumes primarily due to the launch of the second GFU in Tobolsk and expanded access to the additional volumes of raw NGL via the newly launched pipeline. This was partially offset by higher volumes supplied to our petrochemicals business following the launch of Tobolsk-Polymer Plant that consumes propane as feedstock. Our effective average selling price increased by 9.2% in Russian rouble terms (a decrease of 9.5% in US dollar terms) reflecting the negative dynamics of international market prices coupled with higher export duties that on average increased by 24.6% in US dollar terms. The negative dynamics in US dollar terms was mitigated by the Russian rouble depreciation. In 2014, domestic sales accounted for 19.2% of total LPG revenue, while 80.8% was attributable to export sales.
Naphtha
In 2014, our revenue from naphtha sales surged 162.3% to RR 68,877 million from RR 26,256 million in 2013 primarily on a 111.8% increase in sales volumes, as well as on a 23.9% growth in the effective average selling price. Our external naphtha sales volumes surged on substantial expansion of trading activities initiated following the launch of the Ust-Luga transshipment facility in the end of 2013. Our effective average selling price increased by 23.9% in Russian rouble terms (almost flat in US dollar terms) on lower international market prices, which was more than offset by lower export duties (in US dollar terms), Russian rouble depreciation and longer delivery basis for trading operations. In 2014, our share of export sales increased to 98.6% of total naphtha revenue from 77.8% in 2013, while 1.4% and 22.2%, respectively, were derived from domestic sales. The change in the mix was primarily attributable to the expansion of international trading operations following the launch of the Ust-Luga transshipment facility.
Starting 2015, SIBUR changed the terms of cooperation with its naphtha trading suppliers and ceased purchases of the product for resale, instead providing transshipment services via the Ust-Luga transshipment facility to the partners. This is expected to result in a reduction in purchasing and export sales volumes from 2015.

137
Natural Gas
In 2014, our revenue from natural gas sales increased by 42.5% to RR 38,007 million from RR 26,673 million in 2013 on a 35.2% increase in sales volumes and a 5.4% increase in the effective average selling price. The growth in natural gas sales volumes was largely attributable to the OOO Yugragazpererabotka transaction in March 2014 and the subsequent consolidation of 100% of natural gas produced at the GPPs of the JV, while previously we were entitled to 51% of the JV’s production volumes (see Appendix II for further details). This was partially offset by the relatively flat dynamics in inventories in 2014 versus a material decrease in inventories a year earlier, as we sold the volumes of natural gas accumulated in the UGSS in the first quarter of 2013. The effective average selling price increased by 5.4% largely reflecting an indexation of the regulated natural gas prices of 7.4% year-on-year. The slower price growth relative to the tariff indexation was attributable to the new pricing arrangements with the existing customers. We sell 100% of our natural gas in Russia.
Methyl Tertiary Butyl Ether (MTBE)
In 2014, our revenue from MTBE sales increased by 4.1% to RR 19,364 million from RR 18,596 million in 2013 on an 11.2% increase in the effective average selling price despite a 6.3% decrease in sales volumes. The effective average selling price increased by 11.2% in Russian rouble terms (a decrease of 7.8% in US dollar terms) reflecting the negative dynamics in international market prices fully mitigated by the Russian rouble depreciation. The decrease in sales volumes on flat production was largely attributable to the purchases for resale and substantial inventory sales in 2013, while in 2014 we did not purchase MTBE from third parties and only moderately increased stock. In 2014, we sold 100% of our MTBE in Russia, while in 2013 domestic sales accounted for 92.1% of total MTBE revenue and 7.9% was attributable to export sales.
Raw NGL
In 2014, our revenue from raw NGL sales increased by 3.2% to RR 9,709 million from RR 9,405 million in 2013 on a 15.8% increase in the effective average selling price despite a 10.8% decrease in sales volumes. Our effective average selling price increased on higher netbacks in line with international market prices for LPG and naphtha net of export duties in Russian rouble terms. In 2014, we increased production of raw NGL by 6.6% at our GPPs on higher APG processing. We also increased third-party purchases outside of OOO Yugragazpererabotka on additional raw NGL volumes available in Western Siberia, inter alia from NOVATEK following the expansion of Purovsky GCP. Additional available volumes were fully utilised internally following the fractionation capacity expansion in Tobolsk in the first quarter of 2014. As a result, our external raw NGL sales volumes decreased year-on-year.
New cooperation terms with Rosneft had a neutral impact on availability of raw NGL for external sales and internal usage. Following the transaction, we consolidate 100% of raw NGL production at the GPPs of OOO Yugragazpererabotka, and as a result we recorded higher production volumes. At the same time, we terminated raw NGL purchases from Rosneft, which resulted in a corresponding decrease in third-party purchases (see Appendix II for further details).
In 2014, domestic sales accounted for 50.7% of total raw NGL revenue, while 49.3% was attributable to export sales.
Other Fuels and Fuel Additives
In 2014, our revenue from other fuels and fuel additives sales increased by 38.7% to RR 4,111 million from RR 2,963 million in 2013 on a 35.9% increase in the effective average selling price and a 2.1% increase in sales volumes. Our effective average selling price increased due to the changes in product mix. The increase in sales volumes was attributable to inventory sales in 2014, while in 2013 our stock level did not significantly change. At the same time, we decreased production volumes by 25.9% and correspondingly decreased internal use following the changes in product mix and the subsequent termination of a certain intermediate production. In 2014, domestic sales accounted for 29.5% of total fuel and fuel additives revenue, while 70.5% was attributable to export sales.

138
Petrochemical Products
In 2014, our revenue from sales of petrochemical products increased by 14.2% to RR 132,513 million from RR 116,018 million a year earlier mainly on higher revenue from sales of basic polymers and plastics & organic synthesis products, which was offset by lower revenue from sales of synthetic rubbers. The growth in revenue from sales of basic polymers was primarily attributable to higher PP production following the launch of Tobolsk-Polymer Plant in the second half of 2013. The growth in revenue from sales of plastics & organic synthesis products was mainly attributable to capacity expansions in PET and BOPP-films. Our revenue from sales of synthetic rubbers continued to decline in a persistently weak market environment in 2014.
Basic Polymers
In 2014, our revenue from sales of basic polymers increased by 68.3% to RR 38,393 million from RR 22,818 million in 2013. The increase was largely attributable to higher PP sales volumes following the launch of Tobolsk-Polymer Plant in the second half of 2013, as well as higher selling prices for PP and LDPE due to the Russian rouble depreciation.
Polypropylene (PP)
In 2014, our revenue from sales of PP increased by 113.4% to RR 23,067 million from RR 10,809 million in 2013 on an 86.5% increase in sales volumes and a 14.4% increase in the effective average selling price. Our PP sales volumes growth was primarily attributable to a 159.5% increase in PP production following the launch of Tobolsk-Polymer Plant (annual nameplate production capacity of 500,000 tonnes) in the second half of 2013. This was partially offset by (i) lower purchases for resale from third parties and (ii) lower purchases from NPP Neftekhimia, our JV with Gazprom Neft in Moscow, as a result of a temporary feedstock shortage. We also recorded higher internal use following the capacity expansion at BOPP-film production sites in Tomsk and Novokuybyshevsk. Our export selling prices increased by 20.2% reflecting largely flat international market prices and the Russian rouble depreciation. Our domestic selling prices grew at a lower rate of 12.4% due to the ongoing adjustment of our domestic end customers to the movements in the foreign exchange rates. In 2014, our share of export sales increased to 39.2% of the total PP revenue from 25.4% in 2013, while domestic sales decreased to 60.8% from 74.6% in 2013.
Low Density Polyethylene (LDPE)
In 2014, our revenue from sales of LDPE increased by 27.6% to RR 15,326 million from RR 12,009 million in 2013 on a 21.8% increase in the effective average selling price and a 4.8% growth in sales volumes. The increase in the effective average selling price for LDPE reflected largely flat international market prices supported by the Russian rouble depreciation. The increase in LDPE sales volumes was largely attributable to a 3.7% growth in production volumes due to a shorter maintenance shutdown at our production site in Tomsk. In 2014, domestic sales accounted for 67.5% of total LDPE revenue, while 32.5% was attributable to export sales.
Synthetic Rubbers
In 2014, our revenue from synthetic rubber sales decreased by 14.1% to RR 27,847 million from RR 32,432 million in 2013 due to the continuing weak market performance throughout 2014. The decrease was attributable to lower revenue from sales of commodity rubbers and specialty rubber sales, while the revenue from thermoplastic elastomers sales increased.
139
Commodity Rubbers
In 2014, our revenue from sales of commodity rubbers decreased by 23.1% to RR 16,678 million from RR 21,676 million in 2013 on a 26.1% decrease in sales volumes partially compensated by a 4.1% increase in the effective average selling price. Our sales volumes of commodity rubbers declined on a 20.1% decrease in production on the back of the unfavorable market environment. The decrease in sales volumes was also attributable to moderate inventory accumulation as compared to substantial destocking in 2013. Additionally, we reduced product purchases under third-party manufacturing arrangements. The growth in the effective average selling price for commodity rubbers of 4.1% in Russian rouble terms (a decrease of 13.7% in US dollar terms) reflected the negative dynamics in European and Asian market prices fully mitigated by the Russian rouble depreciation. In 2014, domestic sales accounted for 41.7% of total commodity rubber revenue, while 58.3% was attributable to export sales.
Specialty Rubbers
In 2014, our revenue from sales of specialty rubbers decreased by 5.0% to RR 7,516 million from RR 7,912 million in 2013 on a 7.6% decrease in effective average selling price despite a 2.8% growth in sales volumes. Our effective average selling price for specialty rubbers decreased by 7.6% in Russian rouble terms (a decrease of 23.4% in US dollar terms) following the decline in Asian market prices for nitrile-butadiene rubber (NBR) and butyl rubber (IIR). Our specialty rubber sales volumes increased by 2.8% on inventory sales in 2014 compared to marginal inventory accumulation in 2013. In 2014, we decreased production of specialty rubbers by 2.9%, which was attributable to lower NBR production in the persistently unfavorable pricing environment. This was partially compensated by higher IIR production volumes on the expanded production capacity following completion of an investment project at our production site in Togliatti in the end of 2013 (increase in the annual IIR nameplate production capacity to 60,000 tonnes from 48,000 tonnes). In 2014, domestic sales accounted for 13.8% of total specialty rubber revenue, while 86.2% was attributable to export sales.
Thermoplastic Elastomers
In 2014, our revenue from sales of thermoplastic elastomers (SBS) increased by 28.5% to RR 3,653 million from RR 2,844 million in 2013 on a 22.8% increase in sales volumes and a 4.6% growth in the effective average selling price. Our sales volumes of thermoplastic elastomers increased by 22.8% on inventory sales in 2014 compared to a substantial inventory accumulation in 2013, partially offset by a 10.7% decrease in production due to the ongoing product homologation following the launch of the new production facility in Voronezh in the end of 2013 (annual nameplate production capacity of 50,000 tonnes). Our effective average selling price for thermoplastic elastomers increased reflecting the negative dynamics for butadiene prices and positive dynamics for styrene prices (butadiene and styrene are key feedstock for SBS), supported by the Russian rouble depreciation. In 2014, domestic sales accounted for 59.2% of total thermoplastic elastomers revenue, while 40.8% was attributable to export sales.
Plastics and Organic Synthesis Products
In 2014, our revenue from sales of plastics and organic synthesis products increased by 10.1% to RR 45,777 million from RR 41,583 million in 2013. The increase was primarily attributable to higher sales volumes of PET and BOPP-films following the capacity expansions, as well as to higher revenue from sales of acrylates, alcohols and expandable polystyrene. This was partially offset by lower sales of glycols due to lengthy shutdowns at our production sites in Kstovo and Dzerzhinsk in the first half of 2014. Additionally, we deconsolidated PVC cable compounds and ABS Plastics from our product portfolio following the divestments of the respective production sites in April 2014 and December 2013. We observed declining market prices for the vast majority of products, which was more than compensated by material Russian Rouble depreciation.

140
Polyethylene Terephthalate (PET)
In 2014, our revenue from PET sales increased by 40.0% to RR 13,627 million from RR 9,734 million on a 40.1% increase in sales volumes and relatively flat effective average selling price. The increase in sales volumes was primarily attributable to a 45.2% growth in production volumes following the completion of a PET capacity expansion project at our production site in Blagoveshchensk (increase in annual nameplate production capacity from 140,000 tonnes to 210,000 tonnes). This was partially offset by a substantial inventory accumulation in line with the production expansion. Our effective average selling price largely reflected negative dynamics in the international market prices, which was substantially compensated by Russian rouble depreciation, though we could not fully pass changes in foreign exchange rates to our customers in the domestic market. In 2014, domestic sales accounted for 99.7% of total PET revenue, while 0.3% was attributable to export sales.
BOPP-films
In 2014, our revenue from BOPP-film sales increased by 32.8% to RR 10,756 million from RR 8,100 million in 2013 on a 23.7% growth in sales volumes and a 7.3% increase in the effective average selling price. Higher sales volumes were largely attributable to a 25.6% increase in production following the launch of a new BOPP-film production facility in Tomsk in the second half of 2013 (annual nameplate production capacity of 38,500 tonnes) and the completion of a capacity expansion project in Novokuybyshevsk in May 2014 (increase in the annual nameplate production capacity to 55,500 tonnes from 30,500 tonnes). The increase in the effective average selling price reflected largely flat international market prices supported by the Russian rouble depreciation, which was somewhat negated by a substantial increase in export volumes and increased competition in the domestic market. In 2014, domestic sales accounted for 74.9% of total BOPP-film revenue, while 25.1% was attributable to export sales.
Expandable Polystyrene
In 2014, our revenue from sales of expandable polystyrene increased by 5.5% to RR 6,938 million from RR 6,577 million in 2013 on a 10.7% increase in the effective average selling price despite a 4.7% decrease in sales volumes. The increase in the effective average selling price reflected lower international market prices mitigated by the Russian rouble depreciation. The decrease in our sales volumes of expandable polystyrene was attributable to a 4.8% decline in production related to the divestment of Plastic, an expandable polystyrene producer. In 2014, domestic sales accounted for 70.0% of total expandable polystyrene revenue, while 30.0% was attributable to export sales.
Alcohols
In 2014, our revenue from sales of alcohols increased by 9.0% to RR 6,087 million from RR 5,583 million in 2013 on a 6.9% increase in sales volumes and a 2.0% increase in the effective average selling price. The increase in alcohols sales volumes was attributable to an 11.1% increase in production due to the biennial maintenance shutdown in 2013 at our Perm production site in line with the two-year maintenance cycle, as well as propylene feedstock shortage in 2013. This was partially offset by higher internal use of alcohols as a result of higher internal use of propylene (feedstock for certain alcohols) mostly for polypropylene production in 2013 and moderate inventory accumulation versus inventory sales in 2013. The movements in the export and domestic effective average selling prices of alcohols were a result of changes in our sales mix, as we redirected substantial volumes of isobutanol sales to the domestic market. In 2014, our share of domestic sales increased to 58.5% of the total alcohols revenue from 47.9% in 2013, while 41.5% and 52.1% were derived from export markets in 2014 and 2013, respectively.

141
Glycols
In 2014, our revenue from sales of glycols decreased by 30.4% to RR 4,795 million from RR 6,893 million a year earlier as a result of a 34.3% decrease in sales volumes despite a 5.9% growth in the effective average selling price. The decrease in sales volumes was largely attributable to a 20.6% decrease in production volumes due to the shutdowns at our production sites in Kstovo and Dzerzhinsk in the first half of 2014. Additionally, we recorded higher internal use following the PET production capacity expansion, which utilises glycols as raw material. These factors were only partially compensated by (i) higher third-party purchases to meet contractual obligations during the lengthy shutdowns and (ii) moderate inventory sales versus stock build-up in 2013 when we accumulated inventories pending completion of the PET capacity expansion at our production site in Blagoveshchensk. Higher effective average selling price reflected the decrease in the European market prices for monoethylene glycol mitigated by the Russian rouble depreciation. In 2014, domestic sales accounted for 74.7% of total glycols revenue, while 25.3% was attributable to export sales.
Acrylates
In 2014, our revenue from acrylates sales increased by 21.8% to RR 3,409 million from RR 2,800 million in 2013 on an 11.9% increase in sales volumes and an 8.8% increase in the effective average selling price. Our sales volumes increased on a 5.6% increase in production, which was attributable to longer maintenance shutdowns in 2013 and inventory sales as compared to inventory accumulation a year earlier. Higher effective average selling price reflected the decrease in the market prices mitigated by the Russian rouble depreciation. In 2014, we increased the share of domestic sales of acrylates to 48.7% of total revenue from 41.7% in 2013, while 51.3% and 58.3% was attributable to export sales in 2014 and 2013, respectively. In 2014, we specifically continued to keep focus on the more attractive domestic market, where prices are higher than on export markets.
Plastic Compounds (including ABS plastics and PVC cable compounds)
In 2014, our revenue from sales of plastic compounds dropped by 91.3% to RR 165 million from RR 1,896 million in 2013 as a result of the divestment of Plastic, ABS plastics producer, in December 2013 and subsequent divestment of PVC cable compounds division at SIBUR-Neftekhim in April 2014. Following these divestments SIBUR does not consolidate plastic compounds in its product portfolio.
Intermediates and Other Chemicals
In 2014, our revenue from sales of intermediates and other chemicals increased by 6.8% to RR 20,496 million from RR 19,185 million in 2013. The increase was primarily attributable to (i) higher revenue from sales of styrene as a result of lower internal use due to the divestment of Plastic that consumed styrene for polystyrene and ABS plastics production and (ii) higher revenue from sales of propylene due to the increase in production inter alia following the expansion of the cracking capacity in Kstovo in 2014. These factors were partially offset by lower revenue from sales of terephthalic acid as a result of higher internal use following the PET capacity expansion. In 2014, we also recorded revenue from sales of ethylene, which marked the launch of RusVinyl, our JV for PVC production with SolVin Holding Nederland B.V., that consumes ethylene as a key feedstock.
Out of 4.2 million tonnes of intermediates and other chemicals produced in 2014, approximately 89.5% was used internally for further intercompany processing compared to 89.2% in 2013.
Other Revenue
In 2014, other revenue increased by 23.9% year-on-year to RR 11,254 million from RR 9,080 million in 2013. The growth was mainly attributable to the launch of liquid hydrocarbon transportation services provided to NOVATEK, which was also reflected in transportation expenses. This was partially compensated by the ceased sales of processing services following the deconsolidation of OOO Yugragazpererabotka in March 2013 (see Appendix II for further details).
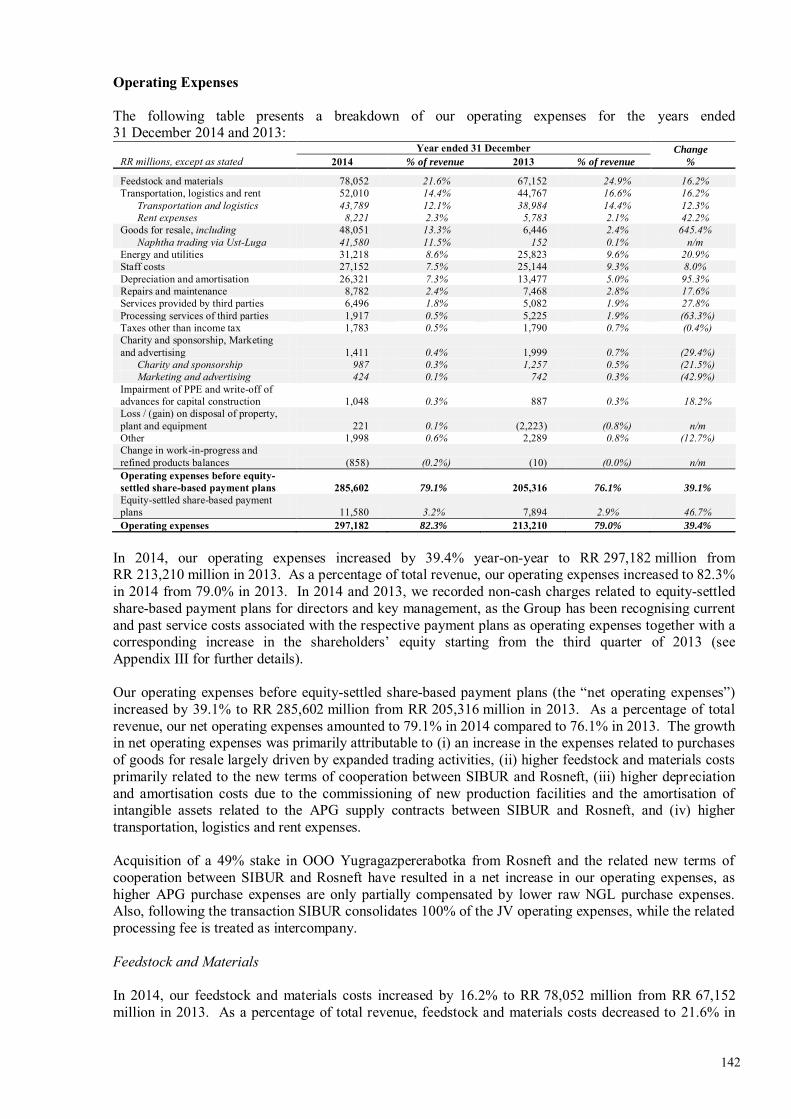
142
Operating Expenses
The following table presents a breakdown of our operating expenses for the years ended 31 December 2014 and 2013:
Year ended 31 December Change
% RR millions, except as stated 2014 % of revenue 2013 % of revenue
Feedstock and materials 78,052 21.6% 67,152 24.9% 16.2% Transportation, logistics and rent 52,010 14.4% 44,767 16.6% 16.2%
Transportation and logistics 43,789 12.1% 38,984 14.4% 12.3% Rent expenses 8,221 2.3% 5,783 2.1% 42.2%
Goods for resale, including 48,051 13.3% 6,446 2.4% 645.4% Naphtha trading via Ust-Luga 41,580 11.5% 152 0.1% n/m
Energy and utilities 31,218 8.6% 25,823 9.6% 20.9% Staff costs 27,152 7.5% 25,144 9.3% 8.0% Depreciation and amortisation 26,321 7.3% 13,477 5.0% 95.3% Repairs and maintenance 8,782 2.4% 7,468 2.8% 17.6% Services provided by third parties 6,496 1.8% 5,082 1.9% 27.8% Processing services of third parties 1,917 0.5% 5,225 1.9% (63.3%) Taxes other than income tax 1,783 0.5% 1,790 0.7% (0.4%) Charity and sponsorship, Marketing and advertising 1,411 0.4% 1,999 0.7% (29.4%)
Charity and sponsorship 987 0.3% 1,257 0.5% (21.5%) Marketing and advertising 424 0.1% 742 0.3% (42.9%)
Impairment of PPE and write-off of advances for capital construction 1,048 0.3% 887 0.3% 18.2% Loss / (gain) on disposal of property, plant and equipment 221 0.1% (2,223) (0.8%) n/m Other 1,998 0.6% 2,289 0.8% (12.7%) Change in work-in-progress and refined products balances (858) (0.2%) (10) (0.0%) n/m Operating expenses before equity-settled share-based payment plans 285,602 79.1% 205,316 76.1% 39.1%
Equity-settled share-based payment plans 11,580 3.2% 7,894 2.9% 46.7% Operating expenses 297,182 82.3% 213,210 79.0% 39.4%
In 2014, our operating expenses increased by 39.4% year-on-year to RR 297,182 million from RR 213,210 million in 2013. As a percentage of total revenue, our operating expenses increased to 82.3% in 2014 from 79.0% in 2013. In 2014 and 2013, we recorded non-cash charges related to equity-settled share-based payment plans for directors and key management, as the Group has been recognising current and past service costs associated with the respective payment plans as operating expenses together with a corresponding increase in the shareholders’ equity starting from the third quarter of 2013 (see Appendix III for further details).
Our operating expenses before equity-settled share-based payment plans (the “net operating expenses”) increased by 39.1% to RR 285,602 million from RR 205,316 million in 2013. As a percentage of total revenue, our net operating expenses amounted to 79.1% in 2014 compared to 76.1% in 2013. The growth in net operating expenses was primarily attributable to (i) an increase in the expenses related to purchases of goods for resale largely driven by expanded trading activities, (ii) higher feedstock and materials costs primarily related to the new terms of cooperation between SIBUR and Rosneft, (iii) higher depreciation and amortisation costs due to the commissioning of new production facilities and the amortisation of intangible assets related to the APG supply contracts between SIBUR and Rosneft, and (iv) higher transportation, logistics and rent expenses.
Acquisition of a 49% stake in OOO Yugragazpererabotka from Rosneft and the related new terms of cooperation between SIBUR and Rosneft have resulted in a net increase in our operating expenses, as higher APG purchase expenses are only partially compensated by lower raw NGL purchase expenses. Also, following the transaction SIBUR consolidates 100% of the JV operating expenses, while the related processing fee is treated as intercompany.
Feedstock and Materials
In 2014, our feedstock and materials costs increased by 16.2% to RR 78,052 million from RR 67,152 million in 2013. As a percentage of total revenue, feedstock and materials costs decreased to 21.6% in
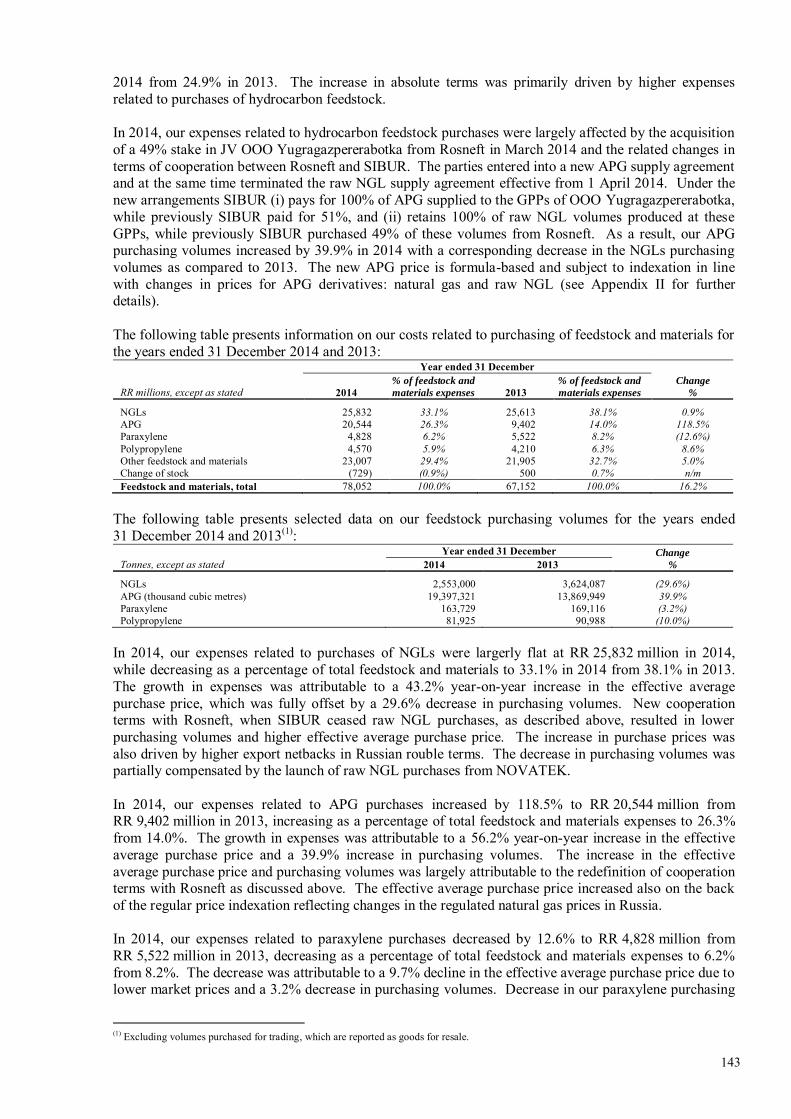
143
2014 from 24.9% in 2013. The increase in absolute terms was primarily driven by higher expenses related to purchases of hydrocarbon feedstock.
In 2014, our expenses related to hydrocarbon feedstock purchases were largely affected by the acquisition of a 49% stake in JV OOO Yugragazpererabotka from Rosneft in March 2014 and the related changes in terms of cooperation between Rosneft and SIBUR. The parties entered into a new APG supply agreement and at the same time terminated the raw NGL supply agreement effective from 1 April 2014. Under the new arrangements SIBUR (i) pays for 100% of APG supplied to the GPPs of OOO Yugragazpererabotka, while previously SIBUR paid for 51%, and (ii) retains 100% of raw NGL volumes produced at these GPPs, while previously SIBUR purchased 49% of these volumes from Rosneft. As a result, our APG purchasing volumes increased by 39.9% in 2014 with a corresponding decrease in the NGLs purchasing volumes as compared to 2013. The new APG price is formula-based and subject to indexation in line with changes in prices for APG derivatives: natural gas and raw NGL (see Appendix II for further details).
The following table presents information on our costs related to purchasing of feedstock and materials for the years ended 31 December 2014 and 2013:
Year ended 31 December Change
% RR millions, except as stated 2014 % of feedstock and
materials expenses 2013 % of feedstock and
materials expenses
NGLs 25,832 33.1% 25,613 38.1% 0.9% APG 20,544 26.3% 9,402 14.0% 118.5% Paraxylene 4,828 6.2% 5,522 8.2% (12.6%) Polypropylene 4,570 5.9% 4,210 6.3% 8.6% Other feedstock and materials 23,007 29.4% 21,905 32.7% 5.0% Change of stock (729) (0.9%) 500 0.7% n/m Feedstock and materials, total 78,052 100.0% 67,152 100.0% 16.2%
The following table presents selected data on our feedstock purchasing volumes for the years ended 31 December 2014 and 2013(1):
Year ended 31 December Change
% Tonnes, except as stated 2014 2013
NGLs 2,553,000 3,624,087 (29.6%) APG (thousand cubic metres) 19,397,321 13,869,949 39.9% Paraxylene 163,729 169,116 (3.2%) Polypropylene 81,925 90,988 (10.0%)
In 2014, our expenses related to purchases of NGLs were largerly flat at RR 25,832 million in 2014, while decreasing as a percentage of total feedstock and materials to 33.1% in 2014 from 38.1% in 2013. The growth in expenses was attributable to a 43.2% year-on-year increase in the effective average purchase price, which was fully offset by a 29.6% decrease in purchasing volumes. New cooperation terms with Rosneft, when SIBUR ceased raw NGL purchases, as described above, resulted in lower purchasing volumes and higher effective average purchase price. The increase in purchase prices was also driven by higher export netbacks in Russian rouble terms. The decrease in purchasing volumes was partially compensated by the launch of raw NGL purchases from NOVATEK.
In 2014, our expenses related to APG purchases increased by 118.5% to RR 20,544 million from RR 9,402 million in 2013, increasing as a percentage of total feedstock and materials expenses to 26.3% from 14.0%. The growth in expenses was attributable to a 56.2% year-on-year increase in the effective average purchase price and a 39.9% increase in purchasing volumes. The increase in the effective average purchase price and purchasing volumes was largely attributable to the redefinition of cooperation terms with Rosneft as discussed above. The effective average purchase price increased also on the back of the regular price indexation reflecting changes in the regulated natural gas prices in Russia.
In 2014, our expenses related to paraxylene purchases decreased by 12.6% to RR 4,828 million from RR 5,522 million in 2013, decreasing as a percentage of total feedstock and materials expenses to 6.2% from 8.2%. The decrease was attributable to a 9.7% decline in the effective average purchase price due to lower market prices and a 3.2% decrease in purchasing volumes. Decrease in our paraxylene purchasing
(1) Excluding volumes purchased for trading, which are reported as goods for resale.
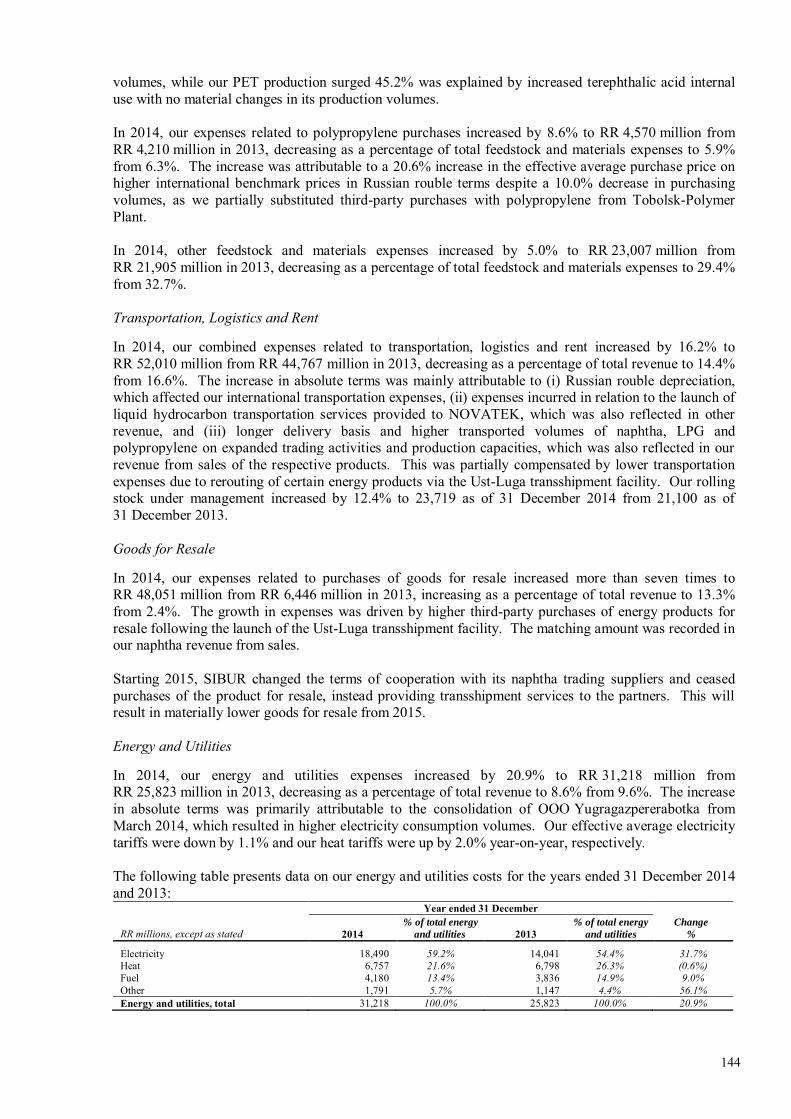
144
volumes, while our PET production surged 45.2% was explained by increased terephthalic acid internal use with no material changes in its production volumes.
In 2014, our expenses related to polypropylene purchases increased by 8.6% to RR 4,570 million from RR 4,210 million in 2013, decreasing as a percentage of total feedstock and materials expenses to 5.9% from 6.3%. The increase was attributable to a 20.6% increase in the effective average purchase price on higher international benchmark prices in Russian rouble terms despite a 10.0% decrease in purchasing volumes, as we partially substituted third-party purchases with polypropylene from Tobolsk-Polymer Plant.
In 2014, other feedstock and materials expenses increased by 5.0% to RR 23,007 million from RR 21,905 million in 2013, decreasing as a percentage of total feedstock and materials expenses to 29.4% from 32.7%.
Transportation, Logistics and Rent
In 2014, our combined expenses related to transportation, logistics and rent increased by 16.2% to RR 52,010 million from RR 44,767 million in 2013, decreasing as a percentage of total revenue to 14.4% from 16.6%. The increase in absolute terms was mainly attributable to (i) Russian rouble depreciation, which affected our international transportation expenses, (ii) expenses incurred in relation to the launch of liquid hydrocarbon transportation services provided to NOVATEK, which was also reflected in other revenue, and (iii) longer delivery basis and higher transported volumes of naphtha, LPG and polypropylene on expanded trading activities and production capacities, which was also reflected in our revenue from sales of the respective products. This was partially compensated by lower transportation expenses due to rerouting of certain energy products via the Ust-Luga transshipment facility. Our rolling stock under management increased by 12.4% to 23,719 as of 31 December 2014 from 21,100 as of 31 December 2013.
Goods for Resale
In 2014, our expenses related to purchases of goods for resale increased more than seven times to RR 48,051 million from RR 6,446 million in 2013, increasing as a percentage of total revenue to 13.3% from 2.4%. The growth in expenses was driven by higher third-party purchases of energy products for resale following the launch of the Ust-Luga transshipment facility. The matching amount was recorded in our naphtha revenue from sales.
Starting 2015, SIBUR changed the terms of cooperation with its naphtha trading suppliers and ceased purchases of the product for resale, instead providing transshipment services to the partners. This will result in materially lower goods for resale from 2015.
Energy and Utilities
In 2014, our energy and utilities expenses increased by 20.9% to RR 31,218 million from RR 25,823 million in 2013, decreasing as a percentage of total revenue to 8.6% from 9.6%. The increase in absolute terms was primarily attributable to the consolidation of OOO Yugragazpererabotka from March 2014, which resulted in higher electricity consumption volumes. Our effective average electricity tariffs were down by 1.1% and our heat tariffs were up by 2.0% year-on-year, respectively.
The following table presents data on our energy and utilities costs for the years ended 31 December 2014 and 2013:
Year ended 31 December Change
% RR millions, except as stated 2014 % of total energy
and utilities 2013 % of total energy
and utilities
Electricity 18,490 59.2% 14,041 54.4% 31.7% Heat 6,757 21.6% 6,798 26.3% (0.6%) Fuel 4,180 13.4% 3,836 14.9% 9.0% Other 1,791 5.7% 1,147 4.4% 56.1% Energy and utilities, total 31,218 100.0% 25,823 100.0% 20.9%

145
Staff Costs
In 2014, our staff costs increased by 8.0% to RR 27,152 million from RR 25,144 million in 2013, decreasing as a percentage of total revenue to 7.5% from 9.3%. The growth in absolute terms was primarily attributable to (i) higher bonus provisions and related growth in social taxes, and (ii) growth in payroll on higher average salary despite lower headcount. Our average headcount totaled 25,926 employees, decreasing by 10.3% year-on-year as a result of decommissioning of Caprolactam completed in April 2013 and divestment of Plastic in the end of 2013, as well as headcount optimisation at our production sites, which was partially compensated by consolidation of OOO Yugragazpererabotka and launch of new production facilities.
Depreciation and Amortisation
In 2014, our depreciation and amortisation expenses increased by 95.3% to RR 26,321 million from RR 13,477 million in 2013, increasing as a percentage of total revenue to 7.3% from 5.0%. The growth in expenses was attributable to (i) commissioning of new production facilities, including Purovsk – Pyt-Yakh – Tobolsk Pipeline launched in 2014, Tobolsk-Polymer Plant launched in October 2013, as well as the second GFU with certain elements of related infrastructure in Tobolsk launched in March 2014, and (ii) amortisation of intangible assets related to the APG supply contracts between SIBUR and Rosneft (see Appendix II for further details).
Repairs and Maintenance
In 2014, our repairs and maintenance expenses increased by 17.6% to RR 8,782 million from RR 7,468 million in 2013, decreasing as a percentage of total revenue to 2.4% in 2014 from 2.8% in 2013. The increase in expenses in absolute terms was primarily attributable to (i) deconsolidation of OOO Yugragazpererabotka from the second quarter of 2013 to March 2014, (ii) higher expenses related to the maintenance works during the shutdowns at our production sites in Kstovo and Dzerzhinsk, as well as (iii) maintenance of the Purovsk – Pyt-Yakh – Tobolsk Pipeline launched in 2014.
Services Provided by Third Parties
In 2014, our expenses related to services provided by third parties increased by 27.8% to RR 6,496 million from RR 5,082 million in 2013, decreasing as a percentage of total revenue to 1.8% from 1.9%. The increase in expenses in absolute terms was primarily attributable to services of subcontractors in relation to Yuzhno-Priobskiy GPP construction, where SIBUR acts as a general contractor.
Processing Services of Third Parties
In 2014, our expenses related to third-party processing services decreased by 63.3% to RR 1,917 million from RR 5,225 million in 2013, decreasing as a percentage of total revenue to 0.5% from 1.9%. The decline in expenses was primarily attributable to the consolidation of OOO Yugragazpererabotka from March 2014, when we started reporting our payments for APG processing as intercompany expenses, while before (March 2013 – February 2014) they were treated as external payments for APG processing to OOO Yugragazpererabotka (see Appendix II for further details). This was partially compensated by payments for styrene processing to Plastic, initiated following the divestment of the asset in the end of 2013.
Taxes other than Income Tax
In 2014, our taxes other than income tax remained broadly flat at RR 1,783 million, decreasing as a percentage of total revenue to 0.5% from 0.7%.

146
Charity and Sponsorship, Marketing and Advertising
In 2014, our combined expenses related to charity and sponsorship, marketing and advertising decreased by 29.4% to RR 1,411 million from RR 1,999 million in 2013, decreasing as a percentage of total revenue to 0.4% from 0.7%. The decline in expenses was related to the changes in the respective activities.
Impairment of Property, Plant and Equipment and Write-off of Advances for Capital Construction
In 2014, we recognised an impairment charge of RR 1,048 million, attributable to a minor investment project termination. In 2013, we recognised an impairment charge of RR 887 million, primarily attributable to materials and equipment related to construction in progress.
Loss / (Gain) on Disposal of Property, Plant and Equipment
In 2014, we recorded a loss of RR 221 million on disposal of property, plant and equipment compared to a gain of RR 2,223 million reported in 2013, which was attributable to divestments of non-core assets.
Equity-Settled Share-Based Payment Plans
In 2014, our charge related to equity-settled share-based payment plans increased by 46.7% to RR 11,580 million from RR 7,894 million in 2013, as we recognised the charge for full year in 2014 versus half year in 2013 (see Appendix III for further details).
Operating Profit
In 2014, our operating profit increased by 12.7% year-on-year to RR 63,818 million from RR 56,604 million inter alia due to the non-cash charges associated with the share-based equity-settled payment plans of RR 11,580 million and RR 7,894 million in 2014 and 2013, respectively (see Appendix III for further details). Our operating margin totaled 17.7% in 2014 compared to 21.0% in 2013.
Net of the non-cash charge related to the equity-settled share-based payment plans, our operating profit increased by 16.9% to RR 75,398 million in 2014 from RR 64,498 million in 2013. The increase in net operating profit was attributable to the launch of our strategic large-scale investment projects and positive impact of the foreign exchange rate fluctuations on our revenues. The corresponding operating margin totaled 20.9% and 23.9% in 2014 and 2013, respectively.
Net Finance Expense
In 2014, we reported a net finance expense of RR 89,765 million compared to RR 4,844 million in 2013, which was primarily attributable to a dramatically surged foreign exchange loss in 2014 compared to 2013 on substantial Russian rouble depreciation.
The following table presents data on our finance income and expenses for the years ended 31 December 2014 and 2013:
Year ended 31 December Change
% RR millions, except as stated 2014 2013
Interest income 632 745 (15.2%) Interest expense (3,541) (1,538) 130.2% Foreign exchange loss (85,433) (3,870) n/m Other finance expense (1,423) (181) n/m Total finance expense (89,765) (4,844) n/m
In 2014, our interest expenses increased by 130.2% to RR 3,541 million from RR 1,538 million in 2013. The increase was attributable to (i) the growth in total debt in Russian rouble terms, (ii) completion of certain investment projects, for which interest on borrowings was previously capitalised, and (iii) higher interest expense on US dollar-denominated debt (in Russian rouble terms) due to Russian rouble depreciation (see “Borrowings” below for further details). Our weighted average interest rate on Russian rouble-denominated borrowings was 10.1% and 7.7% as of 31 December 2014 and 2013. Our weighted average interest rate on US dollar-denominated borrowings was 3.0% and 3.1% as of 31 December 2014

147
and 2013. Our weighted average interest rate on euro-denominated borrowings was 1.5% and 1.7% as of 31 December 2014 and 2013.
In 2014, our net foreign exchange loss surged to RR 85,433 million from RR 3,870 million reported in 2013. The loss recorded in 2014 was attributable to the revaluation of US dollar-denominated debt and USD 1 billion in payables related to the acquisition of OOO Yugragazpererabotka, as RR/USD rate increased by 71.9% to 56.2584 as of 31 December 2014 from 32.7292 as of 31 December 2013. The foreign exchange loss recorded in 2013 was attributable to the Russian rouble depreciation and the respective revaluation of our US dollar-denominated debt, as RR/USD rate increased by 7.8% to 32.7292 as of 31 December 2013 from 30.3727 as of 31 December 2012.
Gain on Acquisition of Subsidiary
In 2014, we recorded a non-cash gain on acquisition of subsidiary in the amount of RR 52,773 million following the acquisition of a 49% stake in OOO Yugragazpererabotka from Rosneft in March 2014. The gain was attributable to the difference between the fair value of SIBUR’s interest in the JV following the transaction and SIBUR’s share in the JV accounted for at historical cost before the transaction (see Appendix II for further details).
Gain on Deconsolidation of Subsidiary
In 2013, we recorded a gain of RR 2,413 million on deconsolidation of OOO Yugragazpererabotka, our JV with RN Holding (see Appendix II for further details).
Gain on Disposal of Subsidiary
In 2014, we recognised a gain of RR 18 million on disposal of OAO OKA-Polimer in January of 2014. In 2013, we recognised a gain of RR 335 million on disposal of OAO Plastic in the end of 2013.
Share of Net Income / (Loss) of Joint Ventures and Associates
In 2014, our share of net loss of joint ventures totaled RR 3,827 million, which was attributable to the foreign exchange loss of OOO RusVinyl due to the Russian rouble depreciation.
In 2013, our share of net income of joint ventures totaled RR 794 million. It was primarily attributable to the servicing of RusVinyl debt and was compensated by income of NPP Neftekhimia.
Income Tax Benefit / (Expense)
In 2014, our income tax benefit amounted to RR 2,054 million compared to an income tax expense of RR 9,844 million a year earlier. The tax benefit in 2014 was attributable to the pre-tax loss, calculated as our pre-tax results for the year adjusted for the non-cash charge related to the equity-settled share-based payment plans and non-cash gain on acquisition of subsidiary. The pre-tax loss was recorded due to the foreign exchange loss.
Profit for the Reporting Period and Profit Attributable to Shareholders of SIBUR
In 2014, our profit decreased by 44.8% to RR 25,071 million from RR 45,458 million in 2013. The decrease was largely attributable to the foreign exchange loss despite higher operating profit, which was partially compensated by a non-cash gain on the acquisition of a 49% stake in OOO Yugragazpererabotka. Our net margin totaled 6.9% and 16.8% in 2014 and 2013, respectively. In 2014, profit attributable to shareholders of SIBUR decreased by 45.2% to RR 25,004 million from RR 45,598 million in 2013.
SEGMENT INFORMATION
In 2014, our feedstock and energy segment’s gross revenue increased by 47.4% to RR 252,813 million from RR 171,464 million in 2013. EBITDA contribution of the feedstock and energy segment increased

148
by 13.9% to RR 88,346 million in 2014 from RR 77,587 million in 2013. The increase of the segment’s contribution was attributable to (i) launch of the raw NGL pipeline connecting the Purovsky Gas Condensate Plant of NOVATEK and our Tobolsk production site, as well as the second gas fractionation facility in Tobolsk in 2014, and (ii) 6.3% growth in APG processing volumes at our GPPs. EBITDA margin of the segment declined to 34.9% in 2014 from 45.2% in 2013 due to low-margin naphtha trading operations via the Ust-Luga transshipment facility performed in 2014.
In 2014, our petrochemicals segment’s gross revenue increased by 10.9% to RR 142,308 million from RR 128,333 million in 2013. EBITDA contribution of the petrochemicals segment increased almost three times to RR 20,806 million in 2014 from RR 7,623 million in 2013. EBITDA margin of the segment increased to 14.6% in 2014 from 5.9% in 2013. The increase in EBITDA and EBITDA margin of the petrochemicals segment was largerly attributable to the launch of Tobolsk-Polymer in the second half of 2013, as well as lower feedstock prices due to decreasing prices for energy products.
The following table presents data on our segments’ revenue and EBITDA contribution for the years ended 31 December 2014 and 2013:
Year ended 31 December 2014 2013
RR millions, except as stated
Feedstock & Energy
Petro- chemicals Unallocated Total
Feedstock & Energy
Petro- chemicals Unallocated Total
Total segment revenue 252,813 142,308 14,192 409,313 171,464 128,333 15,058 314,855 Inter-segment transfers (29,686) (10,408) (8,219) (48,313) (27,757) (8,463) (8,821) (45,041) External revenue 223,127 131,900 5,973 361,000 143,707 119,870 6,237 269,814 EBITDA 88,346 20,806 (6,385) 102,767 77,587 7,623 (6,348) 78,862 EBITDA margin 34.9% 14.6% 28.5% 45.2% 5.9% 29.2%

149
LIQUIDITY AND CAPITAL RESOURCES
Cash Flow
The following table presents selected data on our net cash flows for years ended 31 December 2014 and 2013:
Year ended 31 December Change
% RR millions, except as stated 2014 2013
Net cash from operating activities 91,052 72,741 25.2% Operating cash flows before working capital changes 105,313 77,916 35.2% Changes in working capital 2,016 7,059 (71.4%) Income tax paid (16,277) (12,234) 33.0%
Net cash used in investing activities, including (97,370) (70,384) 38.3% Purchase of property, plant and equipment (67,707) (70,010) (3.3%) Acquisition of interest in subsidiaries, net of cash acquired (20,666) (1,742) n/m Additional contribution to the share capital of joint ventures (5,875) (6,299) (6.7%) Loans issued (4,801) (946) 407.5% Proceeds from sale of property, plant and equipment 1,374 5,134 (73.2%) Other 305 3,479 (91.2%)
Net cash from / (used in) financing activities, including 24,093 (7,928) n/m Dividends paid to the Company's shareholders (14,073) (14,008) 0.5% Net proceeds from debt 34,346 4,513 n/m
Effect of exchange rate changes on cash and cash equivalents 1,944 (51) n/m Net increase / (decrease) in cash and cash equivalents 19,719 (5,622) n/m
Net Cash from Operating Activities
In 2014, our net cash from operating activities increased by 25.2% to RR 91,052 million from RR 72,741 million in 2013. Operating cash flows before working capital changes increased by 35.2% year-on-year to RR 105,313 million from RR 77,916 million in 2013 on the back of higher EBITDA that was up by 30.3%. In 2014, changes in working capital had a positive impact on our net cash from operating activities in the amount of RR 2,016 million compared to a positive impact of RR 7,059 million in 2013. In 2014, positive impact of working capital changes was primarily attributable to advances received in relation to Yuzhno-Priobskiy GPP construction, where SIBUR acts as a general contractor. Income tax paid increased by 33.0% and totaled RR 16,277 million as compared to RR 12,234 million a year earlier, which was attributable to substantial advance tax payments.
The following table presents data on changes in working capital for the years ended 31 December 2014 and 2013:
Year ended 31 December RR millions, except as stated 2014 2013
Decrease in trade and other receivables 959 649 Decrease in prepayments and other current assets 117 2,226 Increase in inventories (1,369) (954) Increase in trade and other payables 1,764 5,571 Increase / (decrease) in taxes payable 545 (433) Changes in working capital 2,016 7,059
SIBUR’s management monitors its liquidity and operational efficiency on the basis of the adjusted working capital (see Appendix I for further details). Our adjusted working capital was positive at RR 37,205 as of 31 December 2014 and RR 31,277 million as of 31 December 2013. Our working capital days decreased to 38 in 2014 from 42 in 2013.
Our net working capital balance may fluctuate from period to period due to factors within or outside our control, such as market conditions, our tactical marketing initiatives in response to changes in market conditions, logistical constraints as well as completion of major investment projects, which could require substantial inventory accumulation.

150
Net Cash Used in Investing Activities
In 2014, our net cash used in investing activities increased by 38.3% year-on-year to RR 97,370 million from RR 70,384 million a year earlier, which was largely attributable to (i) the payment of the first tranche for the acquisition of a 49% stake in OOO Yugragazpererabotka from Rosneft in the amount of RR 20,547 million, (ii) a five times increase in loans issued to the total amount of RR 4,801 million in 2014 compared to RR 946 million in 2013, related to the launch of Yuzhno-Priobskiy GPP construction and stake acquisition in OOO Poliom, and (iii) lower proceeds from sale of property, plant and equipment. Our capital expenditures decreased by 3.3% to RR 67,707 million in 2014 from RR 70,010 million a year earlier, as we completed several large-scale projects in 2013 and early 2014, while started financing ZapSibNeftekhim (ZapSib-2) in the end of 2014.
Net Cash from / (Used in) Financing Activities
In 2014, our net cash received from financing activities amounted to RR 24,093 million compared to the net cash used in financing activities in the amount of RR 7,928 million in 2013. In 2014, our net cash flow from financing activities was primarily related to (i) the new borrowings to fund the first tranche for the acquisition of a 49% stake in the OOO Yugragazpererabotka and (ii) grants and subsidies received in the amount of RR 10,227 million. A payment of RR 14,073 million in 2014 represents dividends paid to the Group’s shareholders. In 2013, our net cash used in financing activities related primarily to RR 14,008 million paid in dividends to the Group’s shareholders and interest payment of RR 3,718 million.

151
Capital Expenditures
In 2014, our capital expenditures decreased by 3.3% to RR 67,707 million compared to RR 70,010 million in 2013 (net of VAT). The decrease was attributable to the completion of several large-scale investment projects in 2013 and early 2014, while we started financing ZapSibNeftekhim (ZapSib-2) in the end of 2014.
The following table presents data on our key ongoing investment projects for the years ended 31 December 2014 and 2013:
RR millions, except as stated Year ended
31 December Completion Location Description 2014 2013
Feedstock and Energy
Transportation infrastructure development Western Siberia Purovsk – Pyt-Yakh – Tobolsk pipeline 11,168 19,789 Completed Tobolsk Expansion of railway infrastructure 2,194 1,030 2015 Gas fractionation capacity modernisation and expansion
Yamal-Nenets Autonomous Area
APG processing capacity expansion at Vyngapurovskiy GPP 6,102 2,443 2015
Tobolsk Second GFU 3,229 6,726 Completed Petrochemicals Tobolsk ZapSibNeftekhim (ZapSib-2)(1) 21,135 2,838 2020(2) Tomsk Expansion of PP and LDPE production 2,292 689 2016 Dzerzhinsk Reconstruction of ethylene oxide production
capacity 2,243 555 Completed
Kstovo Steam cracker upgrade 1,812 2,015 Completed Novokuybyshevsk Expansion of BOPP-film production 402 715 Completed Tobolsk Propane purification facility to reduce
methanol content 340 843 Completed
Blagoveshchensk Expansion of PET production 261 759 Completed
In 2014, we completed implementation of a number of investment projects in both feedstock & energy and petrochemicals businesses and commenced implementation of the large-scale petrochemical project ZapSibNeftekhim (ZapSib-2) in line with SIBUR’s strategic objectives. Description of our key investment projects is presented below.
Feedstock & Energy
Completed
Second Gas Fractionation Unit (GFU) in Tobolsk
In March 2014, SIBUR launched the second gas fractionation unit in Tobolsk, thus expanding overall raw NGL fractionation capacity at the site to 6.6 million tonnes per annum from 3.8 million tonnes per annum. The project is aimed at handling the growing volumes of raw NGL supplies. Total capital expenditures on the project amounted to approximately RR 14 billion (net of VAT).
Purovsk – Pyt-Yakh – Tobolsk Pipeline
SIBUR finalised construction of a 1,100 km raw NGL pipeline connecting NOVATEK’s GCP in Purovsk, Pyt-Yakh and Tobolsk, where SIBUR's flagship GFU is located (Purovsk – Pyt-Yakh – Tobolsk pipeline). The pipeline's throughput capacity between Purovsk and SIBUR's loading rack in Noyabrsk is up to 4 million tonnes per annum, between Noyabrsk and Pyt-Yakh – approximately 5.5 million tonnes per annum, and between Pyt-Yakh and Tobolsk – approximately 8 million tonnes per annum. The launch of the new pipeline is expected to result in a substantial extension of SIBUR's raw NGL transportation infrastructure, an increase in its throughput capacity and reliability. The project is aimed at securing our long-term access to abundant raw NGL resources of Western Siberia, and particularly its northern parts, where projected growth in wet gas production is expected to support rising supplies of raw NGL. We
(1) Includes financing of FEED stage. (2) The project implementation timeline is currently under review.
152
expect the expansion and upgrade of the infrastructure for transportation of raw NGL to our flagship GFU to create a secure foundation for further development of our petrochemicals business in Tobolsk.
Petrochemicals
Completed
Reconstruction of Ethylene Oxide Production Capacity in Dzerzhinsk
In September 2014, SIBUR completed reconstruction and expansion of existing ethylene oxide capacity at the production site in Dzerzhinsk from 264,000 to 300,000 tonnes per annum. Total capital expenditures on the project amounted to approximately RR 3.3 billion (net of VAT).
Steam Cracker Upgrade in Kstovo
In September 2014, SIBUR completed the upgrade of a steam cracker facility in Kstovo, the Nizhniy Novgorod region, thus expanding the facility’s nameplate capacity from 300,000 to 360,000 tonnes of ethylene per annum. Additional ethylene volumes produced at the expanded capacity are supplied as feedstock for PVC production at OOO RusVinyl, our joint venture with SolVin Holding Nederland B.V. launched in September 2014. Total capital expenditures on the project amounted to approximately RR 8.8 billion (net of VAT).
Expansion of BOPP-film Production in Novokuybyshevsk
In May 2014, SIBUR launched a new BOPP-film production capacity of 30,500 tonnes per annum at its existing BOPP-film production site in Novokuybyshevsk, thus increasing SIBUR’s total BOPP-film production capacity to 180,250 tonnes per annum. Total capital expenditures on the project amounted to approximately RR 1.9 billion (net of VAT).
Propane Purification Facility to Reduce Methanol Content in Tobolsk
In December 2014, SIBUR completed the construction of propane purification facility in Tobolsk of 2 million tonnes per annum to reduce methanol content. This will ensure compliance with EU quality requirements for LPG and enable increased exports to European countries. Total capital expenditures on the project amounted to approximately RR 1.2 billion (net of VAT).
Expansion of PET Production in Blagoveshchensk
In April 2014, SIBUR completed the expansion of its PET capacity in Blagoveshchensk from 140,000 tonnes to 210,000 tonnes per annum, thus increasing overall PET production capacity to 285,950 tonnes per annum. Total capital expenditures on the project amounted to approximately RR 1.9 billion (net of VAT).
Ongoing
ZapsibNeftekhim (ZapSib-2)
ZapSibNeftekhim (ZapSib-2) is designed to operate (i) a world-scale ethylene cracking unit with an annual capacity of 1.5 million tonnes, that will also produce 525,000 tonnes of propylene and 100,000 tonnes of crude C4 (technology provided by Linde), and (ii) polyolefin units with an annual capacity of 1.5 million tonnes of polyethylene (technology provided by INEOS) and 500,000 tonnes of polypropylene (technology provided by LyondellBasell). This is a greenfield construction near our Tobolsk production site, and the facility will have direct access to the existing fractionation capacity. SIBUR believes that the investment will enable us to achieve economies of scale, further strengthen our vertically integrated business model and provide us with the first-mover advantage in establishing large-scale petrochemicals production capacities in Western Siberia.

153
SIBUR is currently at an advanced stage of the site preparation works. We have signed contracts for detailed engineering and procurement of equipment and materials (EP contracts) with the three major contractors: (i) Linde AG (Germany) for the ethylene cracking facility, (ii) ThyssenKrupp Industrial Solutions (Germany) for the polypropylene production unit, and (iii) Technip (France) for the polyethylene production unit. In December 2014, SIBUR signed an agreement with a consortium of European banks for ECA-backed long-term financing in the amount of EUR 1,575 million for the contracts with Linde AG and ThyssenKrupp Industrial Solutions (see “Borrowings” below for further details). We also received the in-principal approval from Coface, a French export credit agency, for the contract with Technip.
SIBUR’s management is currently revising the previously announced budget (around USD 9.5 billion in total net of VAT) and timeline (5 – 5.5 years) for the project. The project implementation parameters are currently reviewed under new macroeconomic assumptions and will be revised to assure compliance with our financial policy.
***
We expect that we will finance the approved capital expenditures through a combination of cash and cash equivalents, cash flows from operations as well as new borrowings within the limits of our financial policy.
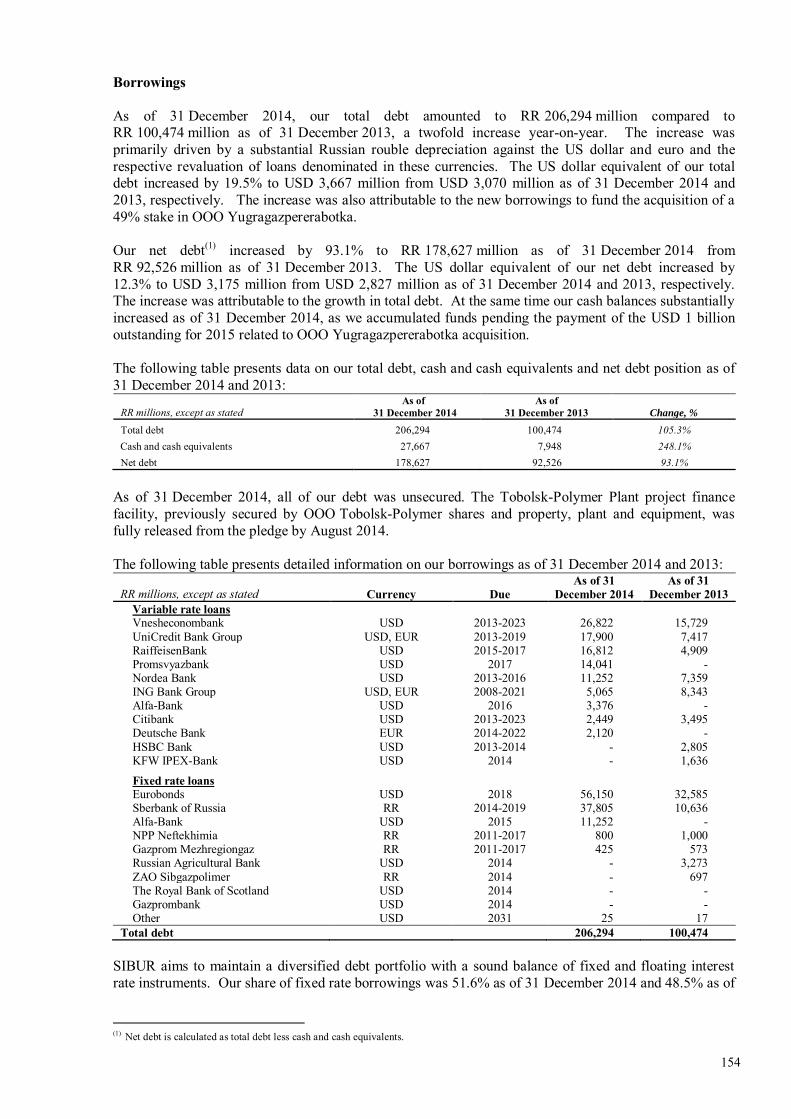
154
Borrowings
As of 31 December 2014, our total debt amounted to RR 206,294 million compared to RR 100,474 million as of 31 December 2013, a twofold increase year-on-year. The increase was primarily driven by a substantial Russian rouble depreciation against the US dollar and euro and the respective revaluation of loans denominated in these currencies. The US dollar equivalent of our total debt increased by 19.5% to USD 3,667 million from USD 3,070 million as of 31 December 2014 and 2013, respectively. The increase was also attributable to the new borrowings to fund the acquisition of a 49% stake in OOO Yugragazpererabotka.
Our net debt(1) increased by 93.1% to RR 178,627 million as of 31 December 2014 from RR 92,526 million as of 31 December 2013. The US dollar equivalent of our net debt increased by 12.3% to USD 3,175 million from USD 2,827 million as of 31 December 2014 and 2013, respectively. The increase was attributable to the growth in total debt. At the same time our cash balances substantially increased as of 31 December 2014, as we accumulated funds pending the payment of the USD 1 billion outstanding for 2015 related to OOO Yugragazpererabotka acquisition.
The following table presents data on our total debt, cash and cash equivalents and net debt position as of 31 December 2014 and 2013:
RR millions, except as stated As of
31 December 2014 As of
31 December 2013 Change, %
Total debt 206,294 100,474 105.3% Cash and cash equivalents 27,667 7,948 248.1% Net debt 178,627 92,526 93.1%
As of 31 December 2014, all of our debt was unsecured. The Tobolsk-Polymer Plant project finance facility, previously secured by OOO Tobolsk-Polymer shares and property, plant and equipment, was fully released from the pledge by August 2014.
The following table presents detailed information on our borrowings as of 31 December 2014 and 2013:
RR millions, except as stated Currency Due As of 31
December 2014 As of 31
December 2013 Variable rate loans Vnesheconombank USD 2013-2023 26,822 15,729 UniCredit Bank Group USD, EUR 2013-2019 17,900 7,417 RaiffeisenBank USD 2015-2017 16,812 4,909 Promsvyazbank USD 2017 14,041 - Nordea Bank USD 2013-2016 11,252 7,359 ING Bank Group USD, EUR 2008-2021 5,065 8,343 Alfa-Bank USD 2016 3,376 - Citibank USD 2013-2023 2,449 3,495 Deutsche Bank EUR 2014-2022 2,120 - HSBC Bank USD 2013-2014 - 2,805 KFW IPEX-Bank USD 2014 - 1,636
Fixed rate loans Eurobonds USD 2018 56,150 32,585 Sberbank of Russia RR 2014-2019 37,805 10,636 Alfa-Bank USD 2015 11,252 - NPP Neftekhimia RR 2011-2017 800 1,000 Gazprom Mezhregiongaz RR 2011-2017 425 573 Russian Agricultural Bank USD 2014 - 3,273 ZAO Sibgazpolimer RR 2014 - 697 The Royal Bank of Scotland USD 2014 - - Gazprombank USD 2014 - - Other USD 2031 25 17
Total debt 206,294 100,474
SIBUR aims to maintain a diversified debt portfolio with a sound balance of fixed and floating interest rate instruments. Our share of fixed rate borrowings was 51.6% as of 31 December 2014 and 48.5% as of
(1) Net debt is calculated as total debt less cash and cash equivalents.

155
31 December 2013, while the share of variable rate borrowings amounted to 48.4% as of 31 December 2014 and 51.5% as of 31 December 2013.
The following table presents scheduled maturities of our outstanding debt as of 31 December 2014 and 2013:
RR millions, except as stated As of 31
December 2014 % of total
borrowings
As of 31 December 2013
% of total
borrowings Change, %
Due for repayment: Within one year 56,240 27.3% 42,743 42.5% 31.6% Between one and two years 31,500 15.3% 6,344 6.3% 396.5% Between two and five years 105,062 50.9% 42,454 42.3% 147.5% After five years 13,492 6.5% 8,933 8.9% 51.0%
Total debt 206,294 100.0% 100,474 100.0% 105.3%
As of 31 December 2014, the share of long-term debt increased to 72.7% from 57.5% as of 31 December 2013, while the portion of short-term debt decreased to 27.3% from 42.5% as of 31 December 2013.
The following table presents the currency split of our outstanding debt as of 31 December 2014 and 2013:
RR millions, except as stated As of 31
December 2014
% of total
borrowings
As of 31
December 2013
% of total
borrowings Change, %
Denominated in: Russian rouble 39,030 18.9% 11,270 11.2% 246.3% Euro 8,112 3.9% 3,950 3.9% 105.4% US Dollar 159,152 77.2% 85,254 84.9% 86.7%
Total debt 206,294 100.0% 100,474 100.0% 105.3%
As of 31 December 2014, the Russian rouble-denominated debt as a percentage of total borrowings increased to 18.9% from 11.2% as of 31 December 2013. The growth in Russian rouble borrowings was mainly attributable to obtaining RR-denominated financing to fund the acquisition of OOO Yugragazpererabotka. Russian rouble equivalent of USD-denominated debt increased in absolute terms largely due to the Russian rouble depreciation (in USD equivalent increase to USD 2,829 million from USD 2,605 million as of 31 December 2014 and 2013), while decreased as a percentage of total borrowings.
The following table presents our key liquidity and credit ratios as of 31 December 2014 and 2013: As of 31 December
2014 As of 31 December
2013
Current ratio 0.66x 0.84x Debt / EBITDA 2.01x 1.27x Net debt(1) / EBITDA 1.74x 1.17x EBITDA / Interest(2) 16x 17x
As of 31 December 2014, our net debt to EBITDA ratio was 1.74x compared to 1.17x as of 31 December 2013. The EBITDA to interest(2) ratio was at 16x as of 31 December 2014 and 17x as of 31 December 2013.
As of 31 December 2014, SIBUR had RR 135,313 million available under its existing credit facilities denominated in Russian roubles, US dollars and euros, both short- and long-term, of which an equivalent of RR 53,000 million was committed.
In December 2014, SIBUR signed agreements with a consortium of European banks for ECA-backed long-term financing of the German content manufacturing for ZapSibNeftekhim (ZapSib-2). Committed credit lines in the amount of EUR 1,575 million covered by Euler Hermes, the German export credit agency, will be open for the Group to finance expenditures related to the contracts with Linde AG (Germany) and ThyssenKrupp Industrial Solutions (Germany). The funds can be claimed for the actual
(1) Net debt is calculated as total debt less cash and cash equivalents. (2) Interest represents accrued interest, i.e. includes interest expense and capitalised interest.

156
payments to the respective contractors. The facility is payable in equal installments semi-annually in ten years after the project’s completion. As of 31 Decemeber 2014, we did not withdraw any funds under these lines.
Management considers SIBUR to have a strong financial position, supported by robust internal cash generation and sustainable access to external financing. These resources enable us to finance capital expenditure needs, while meeting our debt and other obligations.
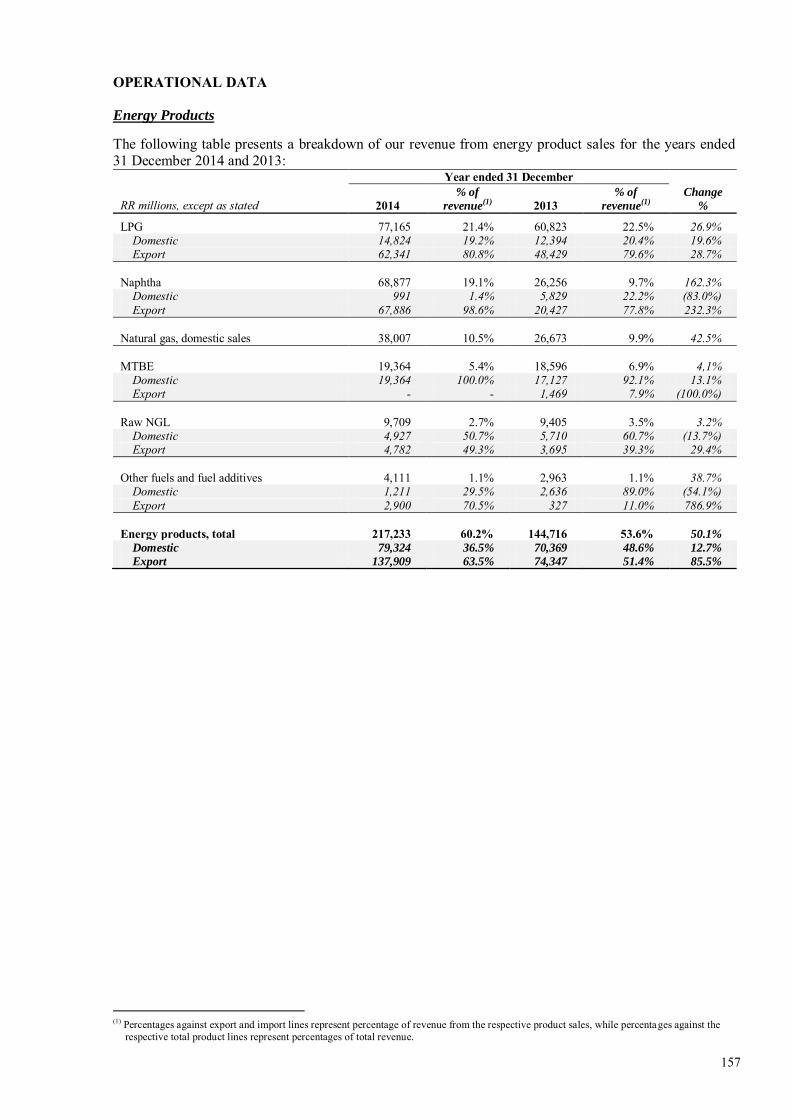
157
OPERATIONAL DATA
Energy Products
The following table presents a breakdown of our revenue from energy product sales for the years ended 31 December 2014 and 2013:
Year ended 31 December Change
% RR millions, except as stated 2014 % of
revenue(1)
2013 % of
revenue(1)
LPG 77,165 21.4% 60,823 22.5% 26.9% Domestic 14,824 19.2% 12,394 20.4% 19.6% Export 62,341 80.8% 48,429 79.6% 28.7%
Naphtha 68,877 19.1% 26,256 9.7% 162.3% Domestic 991 1.4% 5,829 22.2% (83.0%) Export 67,886 98.6% 20,427 77.8% 232.3%
Natural gas, domestic sales 38,007 10.5% 26,673 9.9% 42.5%
MTBE 19,364 5.4% 18,596 6.9% 4,1% Domestic 19,364 100.0% 17,127 92.1% 13.1% Export - - 1,469 7.9% (100.0%)
Raw NGL 9,709 2.7% 9,405 3.5% 3.2% Domestic 4,927 50.7% 5,710 60.7% (13.7%) Export 4,782 49.3% 3,695 39.3% 29.4%
Other fuels and fuel additives 4,111 1.1% 2,963 1.1% 38.7% Domestic 1,211 29.5% 2,636 89.0% (54.1%) Export 2,900 70.5% 327 11.0% 786.9%
Energy products, total 217,233 60.2% 144,716 53.6% 50.1%
Domestic 79,324 36.5% 70,369 48.6% 12.7%
Export 137,909 63.5% 74,347 51.4% 85.5%
(1) Percentages against export and import lines represent percentage of revenue from the respective product sales, while percentages against the respective total product lines represent percentages of total revenue.

158
The following table present data on production, purchases and sales volumes of our energy products for the years ended 31 December 2014 and 2013:
Year ended 31 December Change
% Tonnes, except as stated 2014 2013
LPG Production(1) 5,121,538 4,007,997 27.8% Production, SIBUR's share 4,602,315 4,007,997 14.8%
Purchases from third parties, including 242,282 164,909 46.9% Purchases for resale 163,801 55,456 195.4%
Total production and purchases 4,844,597 4,172,906 16.1%
(Internal use)(2) (453,270) (476,581) (4.9%) (Increase) / decrease in stock (42,641) (51,501) (17.2%)
Gross sales, including 4,348,686 3,644,824 19.3% Intercompany sales to petrochemical business 880,426 659,047 33.6% External sales 3,468,260 2,985,777 16.2%
Domestic 909,656 852,512 6.7%
Export 2,558,604 2,133,265 19.9%
Naphtha Production 1,460,179 1,362,014 7.2% Purchases from third parties, including 1,602,261 490,663 226.6%
Purchases for resale 1,323,708 63,985 1,968.8% Total production and purchases 3,062,440 1,852,677 65.3%
(Internal use)(2) (3,834) (5,430) (29.4%) (Increase) / decrease in stock 20,272 (75,341) n/m
Gross sales, including 3,078,878 1,771,906 73.8% Intercompany sales to petrochemical business 691,633 644,709 7.3% External sales 2,387,245 1,127,197 111.8%
Domestic 36,611 281,017 (87.0%)
Export 2,350,634 846,180 177.8%
Natural gas (thousands of cubic metres) Production(3) 17,989,399 16,908,508 6.4% Production, SIBUR's share(4) 16,657,211 11,548,022 44.2%
Purchases from third parties 937,375 845,337 10.9% Total production and purchases 17,594,586 12,393,359 42.0%
(Internal use)(5) (1,587,111) (1,350,916) 17.5% (Increase) / decrease in stock (2,601) 799,344 n/m
External sales 16,004,874 11,841,787 35.2%
Domestic 16,004,874 11,841,787 35.2%
Export - - n/m
MTBE Production 448,981 447,178 0.4% Purchases from third parties - 10,275 (100.0%) Total production and purchases 448,981 457,453 (1.9%)
(Internal use)(2) (791) (424) 86.4% (Increase) / decrease in stock (721) 20,742 n/m
External sales 447,469 477,771 (6.3%)
Domestic 447,469 438,540 2.0%
Export - 39,231 (100.0%)
(1) Including production volumes under processing arrangements. (2) Including internal use at the segment’s production facilities and immaterial natural losses. (3) Including Rosneft’s share in production volumes of OOO Yugragazpererabotka for 2013 and the first quarter of 2014. (4) Excluding Rosneft’s share in production volumes of OOO Yugragazpererabotka for 2013 and the first quarter of 2014.(5) Including internal use at our production facilities and immaterial natural losses.

159
Year ended 31 December Change
% Tonnes, except as stated 2014 2013
Raw NGL Production(1)(2) 5,150,165 4,829,786 6.6% Production, SIBUR's share(3) 4,822,694 3,532,795 36.5%
Purchases from third parties, including 2,195,966 3,087,956 (28.9%) Purchases for resale - - n/m
Total production and purchases 7,018,660 6,620,751 6.0%
(Fractionation)(2)(4) (6,315,299) (5,256,760) 20.1% (Fractionation, SIBUR's share) (5,788,169) (5,256,760) 10.1% (Increase) / decrease in stock 37,350 (4,758) n/m
Gross sales, including 1,267,841 1,359,234 (6.7%) Intercompany sales to petrochemical business 653,477 670,134 (2.5%) External sales 614,364 689,100 (10.8%)
Domestic 350,590 433,960 19.2%)
Export 263,774 255,140 3.4%
Other fuels and fuel additives Production 207,439 280,031 (25.9%) Purchases from third parties 2,772 537 416.2% Total production and purchases 210,211 280,568 (25.1%)
(Internal use)(5) (59,662) (126,616) (52.9%) (Increase) / decrease in stock 5,813 (756) n/m
External sales 156,362 153,196 2.1%
Domestic 60,957 136,544 (55.4%)
Export 95,405 16,652 472.9%
(1) Including Rosneft’s share in production volumes of OOO Yugragazpererabotka for 2013 and the first quarter of 2014. (2) Following the acquisition of control in OOO Yugragazpererabotka, we changed our approach to the treatment of raw NGL production and
fractionation volumes at Nyagan GPP. (3) Excluding Rosneft’s share in production volumes of OOO Yugragazpererabotka for 2013 and the first quarter of 2014. (4) Including fractionation volumes under processing arrangements. (5) Including internal use at the segment’s production facilities and immaterial natural losses.

160
Basic Polymers
The following table presents data on our revenue from basic polymer sales for the years ended 31 December 2014 and 2013:
Year ended 31 December Change
% RR millions, except as stated 2014 % of
revenue(1)
2013 % of
revenue(1)
PP 23,066 6.4% 10,810 4.0% 113.4% Domestic 14,018 60.8% 8,062 74.6% 73.9% Export 9,048 39.2% 2,748 25.4% 229.3%
PE (LDPE) 15,327 4.2% 12,008 4.5% 27.6% Domestic 10,348 67.5% 6,912 57.6% 49.7% Export 4,979 32.5% 5,097 42.4% (2.3%)
Basic polymers, total 38,393 10.6% 22,818 8.5% 68.3%
Domestic 24,366 63.5% 14,973 65.6% 62.7%
Export 14,027 36.5% 7,845 34.4% 78.8%
The following table presents data on our basic polymer production, purchases and sales volumes for the years ended 31 December 2014 and 2013:
Year ended 31 December Change
% Tonnes, except as stated 2014 2013
Production 655,590 403,251 62.6% PP 395,309 152,359 159.5% PE (LDPE) 260,281 250,891 3.7%
Purchases from third parties 141,203 180,693 (21.9%) Total production and purchases 796,793 583,944 36.5%
(Internal use)(2) (137,891) (115,642) 19.2% (Increase) / decrease in stock (9,262) (12,993) (28.7%)
External sales PP 393,719 211,087 86.5%
Domestic 239,498 154,790 54.7% Export 154,221 56,297 173.9%
PE (LDPE) 255,921 244,222 4.8% Domestic 171,830 139,627 23.1% Export 84,091 104,595 (19.6%)
External sales 649,640 455,309 42.7%
Domestic 411,328 294,417 39.7%
Export 238,312 160,892 48.1%
(1) Percentages against export and import lines represent percentage of revenue from the respective product sales, while percentages against the respective total product lines represent percentages of total revenue.
(2) Including internal use at the segment’s production facilities and immaterial natural losses.

161
Synthetic Rubbers
The following table presents a breakdown of revenue from our synthetic rubber sales for the years ended 31 December 2014 and 2013:
Year ended 31 December Change
% RR millions, except as stated 2014 % of revenue(1) 2013 % of revenue
(1)
Commodity rubbers 16,679 4.6% 21,676 8.0% (23.1%) Domestic 6,956 41.7% 9,644 44.5% (27.9%) Export 9,723 58.3% 12,032 55.5% (19.2%)
Specialty rubbers 7,516 2.1% 7,912 2.9% (5.0%) Domestic 1,035 13.8% 1,272 16.1% (18.6%) Export 6,481 86.2% 6,640 83.9% (2.4%)
Thermoplastic elastomers 3,652 1.0% 2,844 1.1% 28.4% Domestic 2,161 59.2% 2,308 81.2% (6.4%) Export 1,491 40.8% 536 18.8% 178.2%
Synthetic rubbers, total 27,847 7.7% 32,432 12.0% (14.1%)
Domestic 10,152 36.5% 13,224 40.8% (23.2%)
Export 17,695 63.5% 19,208 59.2% (7.9%)
The following table presents data on our synthetic rubber production, purchases and sales volumes for the years ended 31 December 2014 and 2013:
Year ended 31 December Change
% Tonnes, except as stated 2014 2013
Production 353,257 418,147 (15.5%) Commodity rubbers 229,127 286,913 (20.1%) Specialty rubbers 86,700 89,313 (2.9%) Thermoplastic elastomers 37,430 41,921 (10.7%)
Purchases from third parties 3,310 7,394 (55.2%) Total production and purchases 356,567 425,541 (16.2%)
(Internal use)(2) (1,283) (1,534) (16.4%) (Increase) / decrease in stock 4,754 6,121 (22.3%)
External sales
Commodity rubbers 227,758 308,007 (26.1%) Domestic 97,376 130,003 (25.1%) Export 130,382 178,004 (26.8%)
Specialty rubbers 90,705 88,256 2.8% Domestic 11,759 13,277 (11.4%) Export 78,946 74,979 5.3%
Thermoplastic elastomers 41,575 33,865 22.8% Domestic 24,500 27,234 (10.0%) Export 17,075 6,631 157.5%
External sales 360,038 430,128 (16.3%)
Domestic 133,635 170,514 (21.6%)
Export 226,403 259,614 (12.8%)
(1) Percentages against export and import lines represent percentage of revenue from the respective product sales, while percentages against the respective total product lines represent percentages of total revenue.
(2) Including internal use at the segment’s production facilities and immaterial natural losses.

162
Plastics and Organic Synthesis Products
The following table presents a breakdown of revenue from sales of our plastics and organic synthesis products for the years ended 31 December 2014 and 2013:
Year ended 31 December Change
% RR millions, except as stated 2014 % of
revenue(1)
2013 % of
revenue(1)
PET 13,627 3.8% 9,734 3.6% 40.0% Domestic 13,584 99.7% 9,703 99.7% 40.0% Export 43 0.3% 31 0.3% 38.7%
BOPP-films 10,755 3.0% 8,100 3.0% 32.8% Domestic 8,057 74.9% 6,512 80.4% 23.7% Export 2,698 25.1% 1,588 19.6% 69.9%
Expandable polystyrene 6,938 1.9% 6,577 2.4% 5.5% Domestic 4,856 70.0% 4,336 65.9% 12.0% Export 2,082 30.0% 2,241 34.1% (7.1%)
Alcohols (including 2-ethylhexanol) 6,088 1.7% 5,583 2.1% 9.0% Domestic 3,559 58.5% 2,675 47.9% 33.0% Export 2,529 41.5% 2,908 52.1% (13.0%)
Glycols 4,795 1.3% 6,899 2.6% (30.4%) Domestic 3,580 74.7% 4,825 70.0% (25.8%) Export 1,215 25.3% 2,069 30.0% (41.3%)
Acrylates 3,409 0.9% 2,799 1.0% 21.8% Domestic 1,662 48.8% 1,168 41.7% 42.3% Export 1,747 51.2% 1,631 58.3% 7.1%
Plastic compounds(2) 165 0.0% 1,896 0.7% (91.3%) Domestic 161 97.6% 1,727 91.1% (90.7%) Export 4 2.4% 169 8.9% (97.6%)
Plastics and organic synthesis products, total 45,777 12.7% 41,583 15.4% 10.1%
Domestic 35,459 77.5% 30,946 74.4% 14.6%
Export 10,318 22.5% 10,637 25.6% (3.0%)
(1) Percentages against export and import lines represent percentage of revenue from the respective product sales, while percentages against the respective total product lines represent percentages of total revenue.
(2) Including ABS plastics and PVC cable compounds.
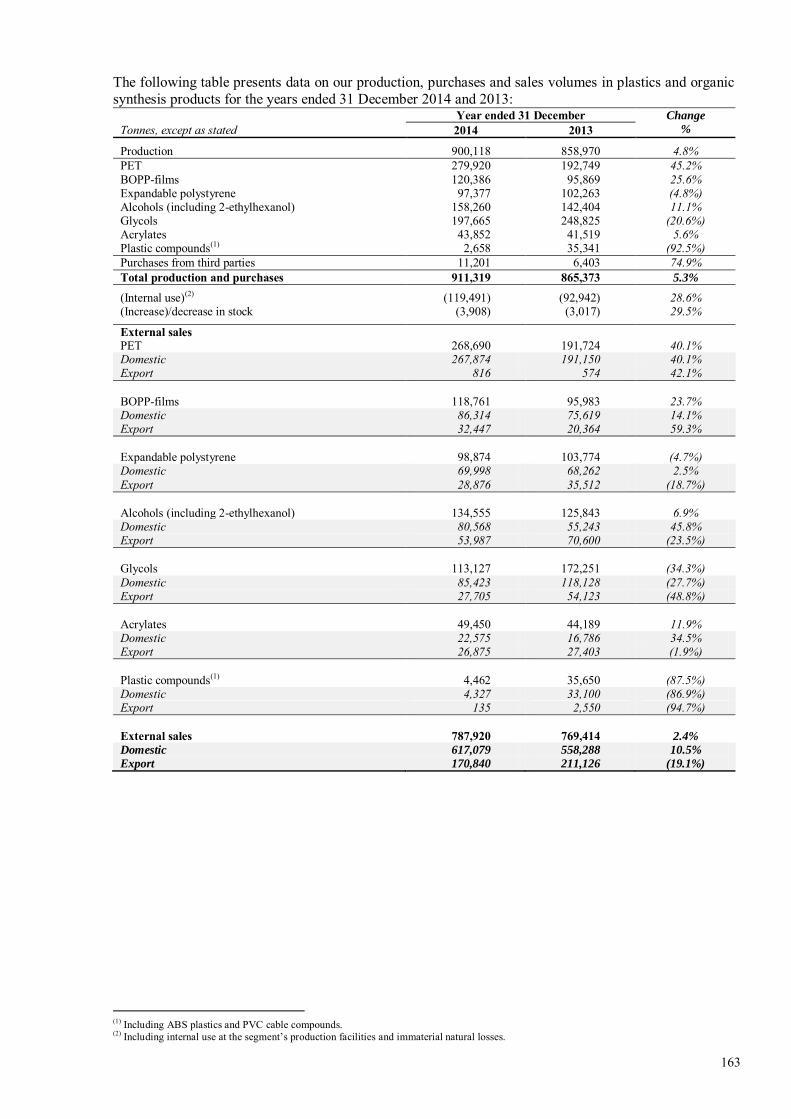
163
The following table presents data on our production, purchases and sales volumes in plastics and organic synthesis products for the years ended 31 December 2014 and 2013:
Year ended 31 December Change
% Tonnes, except as stated 2014 2013
Production 900,118 858,970 4.8% PET 279,920 192,749 45.2% BOPP-films 120,386 95,869 25.6% Expandable polystyrene 97,377 102,263 (4.8%) Alcohols (including 2-ethylhexanol) 158,260 142,404 11.1% Glycols 197,665 248,825 (20.6%) Acrylates 43,852 41,519 5.6% Plastic compounds(1) 2,658 35,341 (92.5%) Purchases from third parties 11,201 6,403 74.9% Total production and purchases 911,319 865,373 5.3%
(Internal use)(2) (119,491) (92,942) 28.6% (Increase)/decrease in stock (3,908) (3,017) 29.5%
External sales PET 268,690 191,724 40.1% Domestic 267,874 191,150 40.1% Export 816 574 42.1%
BOPP-films 118,761 95,983 23.7% Domestic 86,314 75,619 14.1% Export 32,447 20,364 59.3%
Expandable polystyrene 98,874 103,774 (4.7%) Domestic 69,998 68,262 2.5% Export 28,876 35,512 (18.7%)
Alcohols (including 2-ethylhexanol) 134,555 125,843 6.9% Domestic 80,568 55,243 45.8% Export 53,987 70,600 (23.5%)
Glycols 113,127 172,251 (34.3%) Domestic 85,423 118,128 (27.7%) Export 27,705 54,123 (48.8%)
Acrylates 49,450 44,189 11.9% Domestic 22,575 16,786 34.5% Export 26,875 27,403 (1.9%)
Plastic compounds(1) 4,462 35,650 (87.5%) Domestic 4,327 33,100 (86.9%) Export 135 2,550 (94.7%)
External sales 787,920 769,414 2.4%
Domestic 617,079 558,288 10.5%
Export 170,840 211,126 (19.1%)
(1) Including ABS plastics and PVC cable compounds. (2) Including internal use at the segment’s production facilities and immaterial natural losses.

164
Intermediates and Other Chemicals
The following table presents a breakdown of revenue from sales of our intermediates and other chemicals for the years ended 31 December 2014 and 2013:
Year ended 31 December Change
% RR millions, except as stated 2014 % of
revenue(1)
2013 % of
revenue(1)
Benzene 1,679 0.5% 1,760 0.7% (4.6%) Domestic 1,679 100.0% 1,760 100.0% (4.6%) Export - -% - -% n/m
Styrene 3,078 0.9% 1,826 0.7% 68.6% Domestic 2,767 89.9% 1,495 81.9% 85.1% Export 311 10.1% 331 18.1% (6.0%)
Terephthalic acid 1,366 0.4% 2,625 1.0% (48.0%) Domestic 724 53.0% 2,288 87.2% (68.4%) Export 642 47.0% 337 12.8% 90.5%
Propylene 1,506 0.4% 319 0.1% 372.1% Domestic 756 50.2% 146 45.8% 417.8% Export 750 49.8% 173 54.2% 333.5%
Ethylene oxide 2,826 0.8% 2,993 1.1% (5.6%) Domestic 2,287 80.9% 2,661 88.9% (14.1%) Export 539 19.1% 332 11.1% 62.3%
Butadiene 115 0.0% 71 0.0% 62.0% Domestic 115 100.0% 71 100.0% 62.0% Export - -% - -% n/m
Isoprene 891 0.2% 813 0.3% 9.6% Domestic 10 1.1% 13 1.6% (23.1%) Export 881 98.9% 800 98.4% 10.1%
Isobutylene 437 0.1% 415 0.2% 5.3% Domestic 437 100.0% 394 94.9% 10.9% Export - -% 21 5.1% (100.0%)
Ethylene 579 0.2% - -% n/m Domestic 579 100.0% - n/m n/m Export - -% - n/m n/m
Other intermediates 2,472 0.7% 2,830 1.0% (12.7%) Domestic 1,844 74.6% 1,681 59.4% 9.7% Export 628 25.4% 1,149 40.6% (45.3%)
Total intermediates 14,949 4.1% 13,652 5.1% 9.5% Domestic 11,198 74.9% 10,509 77.0% 6.6% Export 3,751 25.1% 3,143 23.0% 19.3%
Other chemicals 5,547 1.5% 5,533 2.1% 0.2% Domestic 5,319 95.9% 5,349 96.7% (0.6%) Export 228 4.1% 184 3.3% 23.9%
Intermediate and other chemicals, total 20,496 5.7% 19,185 7.1% 6.8%
Domestic 16,517 80.6% 15,858 82.7% 4.2%
Export 3,979 19.4% 3,327 17.3% 19.6%
(1) Percentages against export and import lines represent percentage of revenue from the respective product sales, while percentages against the respective total product lines represent percentages of total revenue.

165
The following table presents data on our production, purchases and sales volumes in intermediates and other chemicals for the years ended 31 December 2014 and 2013:
Year ended 31 December
Change
%
Tonnes, except as stated 2014 2013 Production(1) 4,232,671 4,207,925 0.6%
Intermediates, including 3,520,928 3,451,009 2.0% Benzene 125,164 134,162 (6.7%) Styrene 171,525 159,717 7.4% Terephthalic acid 252,391 259,710 (2.8%) Propylene 608,589 310,385 96.1% Ethylene oxide 204,665 262,741 (22.1%) Butadiene 189,428 230,392 (17.8%) Isoprene 70,068 77,890 (10.0%) Isobutylene 161,665 128,173 26.1% Ethylene 516,724 533,330 (3.1%) Other intermediates 1,220,709 1,354,509 (9.9%)
Other chemicals 711,743 756,916 (6.0%) Purchases from third parties 11,362 4,867 133.4% Total production and purchases 4,244,033 4,212,792 0.7%
(Internal use)(1)(2) (3,787,482) (3,752,040) 0.9% (Increase) / decrease in stock (7,489) 12,292 n/m
External sales Benzene 40,873 58,995 (30.7%)
Domestic 40,873 58,995 (30.7%) Export - - n/m
Styrene 58,149 35,242 65.0% Domestic 53,223 28,698 85.5% Export 4,926 6,544 (24.7%)
Terephthalic acid 39,475 75,372 (47.6%) Domestic 21,999 66,098 (66.7%) Export 17,476 9,274 88.4%
Propylene 35,322 10,355 241.1% Domestic 20,423 5,902 246.0% Export 14,899 4,453 234.6%
Ethylene oxide 64,669 84,276 (23.3%) Domestic 54,228 76,326 (29.0%) Export 10,441 7,950 31.3%
Butadiene 2,094 1,211 72.9% Domestic 2,094 1,211 72.9% Export - - n/m
Isoprene 10,695 8,716 22.7% Domestic 118 152 (22.4%) Export 10,577 8,564 23.5%
Isobutylene 6,460 6,765 (4.5%) Domestic 6,460 6,379 1.3% Export - 386 (100.0%)
Ethylene 20,581 - n/m Domestic 20,581 - n/m Export - - n/m
Other intermediates 87,014 95,958 (9.3%) Domestic 60,229 37,080 62.4% Export 26,785 58,878 (54.5%)
Total intermediates 365,332 376,890 (3.1%) Domestic 280,228 280,841 (0.2%) Export 85,104 96,049 (11.4%)
Other chemicals 83,730 96,154 (12.9%) Domestic 80,047 92,895 (13.8%) Export 3,683 3,259 13.0%
External sales 449,062 473,044 (5.1%)
Domestic 360,275 373,736 (3.6%)
Export 88,787 99,308 (10.6%)
(1) In 2014, we changed approach to the treatment of production and internal use volumes for intermediates and other chemicals and reflect gross production volumes and the respective increase in internal use.
(2) Including internal use at the segment’s production facilities and immaterial natural losses.

166
DESCRIPTION OF SELECTED OPERATIONAL AND FINANCIAL ITEMS
Revenue
Revenue, unless otherwise stated, represents revenue from sales to third parties, which excludes any inter-segment transfers. It is reported net of VAT, excise taxes and export duties and includes transportation costs incurred in relation to the delivery of respective refined products to the customers.
Operating Expenses
Feedstock and materials. Feedstock and materials include purchases from third-party suppliers of various types of feedstock and intermediates, which are used for further processing into higher value-added products, and materials. Our key raw materials are represented by hydrocarbon feedstock, such as APG and NGLs, which comprise raw NGL, LPG and naphtha, as well as paraxylene, which is used in the production of terephthalic acid (PTA) and polypropylene, which is used in the production of BOPP-films. We also purchase other feedstock and materials. Other feedstock includes methanol, which is used in the production of MTBE and certain intermediate chemicals such as butadiene, benzene and others. We purchase intermediates in addition to our own production of intermediates primarily for further processing into higher value-added petrochemical products. Materials primarily include supplementary raw materials, spare parts, materials for auxiliary workshops and other operating supplies.
Transportation and logistics. Transportation and logistics comprise expenses related to transportation of feedstock, materials and refined products by railway, via pipelines that are not owned and operated by SIBUR, by trucks and marine vessels, as well as through multimodal transportation operators. These costs also include transshipment and storage services, as well as charges for rail cars/tankers used by SIBUR under short-term transportation contracts.
Rent expenses. Rent expenses primarily represent rental of rolling stock for transportation of raw NGL and LPG, as we rent specialised rail cars and tank wagons, as well as general purpose rail cars. Rent expenses also include lease payments for land plots on which our facilities are located.
Goods for resale. Goods for resale include purchases of products from third parties for further resale externally, including refined products and intermediates.
Energy and utilities. Energy and utilities costs primarily comprise expenses associated with purchases of electric power, heat and fuel from third-party suppliers.
Staff costs. Staff costs comprise primarily salaries, bonuses and other personnel incentives, severance payments, pension expenses and related social taxes.
Depreciation and amortisation. Depreciation comprises depreciation of property, plant and equipment calculated on a straight-line basis to allocate the cost of property, plant and equipment to their respective residual values over their respective estimated useful lives. Amortisation comprises amortisation of intangible assets calculated using a straight-line method to allocate the cost of relevant intangible assets over their estimated useful lives.
Repairs and maintenance. Repairs and maintenance comprise services for repairs and maintenance of the Group's production facilities provided by third parties. These expenses include inter alia expenses incurred in relation to implementation of one-off targeted programmes.
Processing services of third parties. Processing services represent services we obtain from other manufacturers, including our non-consolidated joint ventures, to process our feedstock / intermediates into higher value-added products. Our decision to use such services depends on existing agreements, market trends, logistical issues and shortages of our own capacity.
167
Services provided by third parties. Services provided by third parties comprise services related to environmental and industrial safety, R&D, design and engineering, security expenses as well as legal, audit, consulting services, etc.
Taxes other than income tax. Taxes other than income tax primarily include land tax and property tax.
Charity and sponsorship. SIBUR places a very high degree of importance on social responsibility. As a major investor in the economic development of the regions where we operate, we have signed mutually beneficial agreements with a number of regional authorities, including agreements on social-economic cooperation. As part of our social initiatives, we implement a range of humanitarian projects and programmes in several regions, including Western Siberia, the Tomsk and the Nizhny Novgorod regions, St. Petersburg and other areas, where we are implementing our strategic investment projects. This includes investments in regional infrastructure, improvement of people’s life quality, ecological initiatives, support of sports organisations, promotion of child and youth sports, etc. We also actively promote Russia’s chemical science and professional education in cooperation with leading chemical institutions, universities and schools.
Marketing and advertising. Marketing and advertising costs are associated with the promotion of SIBUR’s corporate brand and are aimed at enhancing SIBUR’s profile among our customers, suppliers, partners and general public. The majority of our marketing and advertising expenses relate to corporate sponsorships of leading Russian and regional football, hockey, basketball and volleyball teams in different regions of Russia, including Tyumen, Nizhny Novgorod, and St.Petersburg, which positions us as an active promoter of Russian sports both nationally and in the regions where we operate.
Additionally, marketing and advertising costs include promotion of SIBUR’s corporate brand and selected products at industrial exhibitions, conferences and forums, as well as via TV, print media and the Internet.
Change in work-in-progress and refined products balances. The change in work-in-progress and refined product balances represents an adjustment to expenses associated with the production of refined products to reflect changes in inventory balances of such products. When inventory balances of refined products increase at the end of a reporting period compared to the beginning of the respective period, operating expenses are reduced by an amount, which represents the cost of production of such refined products incurred in the reporting period, while revenue from sale of these products will be recognised in the future. When inventory balances of refined products decrease at the end of a reporting period compared to the beginning of the respective period, operating expenses are increased by an amount, which represents the cost of production of such refined products incurred in the preceding periods, while revenue from the sale of these products is recognised in the reporting period.
Our volumes of refined product balances fluctuate from period to period depending on market conditions, changes in marketing and distribution strategy, as well as logistical constraints. They also tend to increase in the periods of completion of our major investment projects, which may trigger substantial inventory accumulation.
Equity-settled share-based payment plans represent respective grants to certain current and former directors and members of the key management of the Group. In accordance with IFRS 2 “Share-based Payment”, the Group has to recognise current and past service costs associated with the plans as operating expenses in the statement of profit or loss, and also record the corresponding amounts as an increase in equity in the statement of changes in equity and the statement of financial position (see Appendix III for further details).
Net operating expenses represent total operating expenses less operating expenses related to equity-settled share-based payment plans.
168
Operating Profit
Operating profit represents revenue less operating expenses.
EBITDA
EBITDA represents profit / loss for the reporting period adjusted for income tax expense, finance income and expenses, share of net income / loss of joint ventures, depreciation and amortisation, impairment of property, plant and equipment, gain / loss on disposal of investments, equity-settled share-based payment plans and exceptional items.
Finance Income and Expenses
Finance income includes primarily interest income on bank deposits and loans issued and foreign exchange gains. Finance expenses include primarily interest expense on debt, bank charges and foreign exchange losses.
Share of Net Income / (Loss) of Joint Ventures
Share of net income / loss of joint ventures represents our share of post-acquisition profit or loss of joint ventures as recognised under equity accounting method.
Income Tax Expense
We do not pay corporate income tax on a consolidated basis since, for taxation purposes, the members of the Group are assessed individually. The statutory corporate income tax rate in Russia was set at 20% for the periods under review. The difference between our effective and statutory tax rates is typically attributable to certain non-deductible expenses and (or) non-taxable income as well as tax benefits that we may obtain in certain regions where we operate.
Effective Income Tax Rate
Effective income tax rate represents share of income tax expense in the adjusted profit for the period.
Adjusted Profit / (Loss)
Adjusted profit / loss represents net profit / loss for the period adjusted for exceptional non-cash items.

169
APPENDIX I: Net Working Capital
SIBUR’s net working capital position takes into account trade receivables net of advances from customers; inventory balances of refined products, goods for resale, feedstock and materials; VAT balance; trade payables net of prepayments and advances to suppliers; payables to employees; and other assets and liabilities listed in the table below.
The following table presents detailed calculation of our net working capital position as of 31 December 2014 and 2013:
RR millions, except as stated As of
31 December 2014 As of
31 December 2013 Current assets 105,667 68,544 Current liabilities (159,205) (81,480) Working capital (53,538) (12,936) Adjustmets to assets, including: (30,124) (10,756) Loans receivable (1,245) (1,735) Cash and cash equivalents (27,667) (7,948) Restricted cash (910) (1,106) Prepaid borrowing cost (310) - Recoverable VAT related to assets under construction(1) 8 33 Adjustmets to liabilities, including: 120,867 54,969 Accounts payable to contractors and suppliers of property, plant and equipment 6,803 10,424 Payables for acquisition of subsidiaries 56,032 819 Short term promissory notes payable - 1 Interest payable 1,477 982 Derivative financial instruments 315 - Short-term debt and current portion of long-term borrowings 56,240 42,743 Adjusted working capital 37,205 31,277
(1) Represents non-current portion.

170
APPENDIX II: OOO Yugragazpererabotka
Establishment of OOO Yugragazpererabotka in 2007
In 2007, SIBUR and TNK-BP Holding (renamed RN Holding as of 30 July 2013 following the acquisition by Rosneft) established a joint venture (JV) OOO Yugragazpererabotka. SIBUR owned a 51% stake in the JV, while RN Holding’s share was 49%. OOO Yugragazpererabotka owned and operated three GPPs with total APG processing capacity of 13.4 billion cubic metres per annum (Nizhnevartovskiy GPP, Belozerniy GPP and Nyagan GPP), three compressor stations and APG pipelines from compressor stations to the GPPs. SIBUR and RN Holding operated within a contractual network, under which RN Holding supplied APG to OOO Yugragazpererabotka for processing into raw NGL and natural gas. In addition to volumes from RN Holding, dominant supplier of APG to the JV, OOO Yugragazpererabotka also processed APG supplied from other oil companies. SIBUR and RN Holding owned the feedstock and refined products, while paying a processing fee to OOO Yugragazpererabotka. SIBUR paid for 51% of the total APG volumes supplied for processing to OOO Yugragazpererabotka and obtained 51% of the total NGLs and dry gas volumes produced by the JV. RN Holding obtained the remaining volumes. Subsequently SIBUR purchased RN Holding’s share of NGLs and sold to RN Holding its share of natural gas.
Deconsolidation of OOO Yugragazpererabotka in 2013
In March 2013, SIBUR’s call options that had entitled the Group to purchase RN Holding’s share in OOO Yugragazpererabotka were terminated, and the term of the JV was extended to indefinite. Following the termination of the call options, we started accounting for our investment in OOO Yugragazpererabotka as an investment in joint ventures, while previously OOO Yugragazpererabotka was consolidated as a wholly owned subsidiary and RN Holding’s contribution was accounted for as interest-bearing long-term loans. As a result of the deconsolidation, we recognised a gain of RR 2,413 million (post-tax) in the first quarter of 2013, which was attributable to higher carrying amount of newly recognised balance sheet items of OOO Yugragazpererabotka compared to carrying amount of deconsolidated balance sheet items.
The following table presents calculation of the post-tax gain recognised on deconsolidation of OOO Yugragazpererabotka in the first half of 2013:Income from derecognition of RN Holding’s share previously recognised as long-term debt 4,949 (1) Share of net assets recognised as investment in joint ventures (based on net assets of RR 5,176 million and a 51% ownership) 2,640 Total income from deconsolidation of a subsidiary 7,589 Less: Net assets deconsolidated (5,176) Post-tax gain on deconsolidation of a subsidiary 2,413
Acquisition of control in OOO Yugragazpererabotka and new supply and purchase contracts in 2014
On 6 March 2014, SIBUR acquired from Rosneft Group a 49% interest in OOO Yugragazpererabotka, gaining full control over the three GPPs and related infrastructure, at the same time the parties entered into new APG supply and natural gas purchase contracts. The deal value totaled USD 1.567 billion in cash with USD 0.567 billion (RR 20,547 million) paid in March 2014 and USD 0.5 billion in January 2015. The remaining amount equivalent to USD 0.5 billion is payable in April 2015.
New contracts replaced a number of supply and purchase contracts for APG, raw NGL and dry gas supplied to and produced at the GPPs of OOO Yugragazpererabotka, under which the parties previously operated. The new contracts are effective from 1 April 2014. Tenor of the APG and natural gas contracts was extended from 2026 to 2032 (inclusive). Rosneft increased guaranteed volumes of APG to be supplied to the three GPPs to approximately 10 billion cubic metres per annum from 6.6 billion cubic metres per annum. Under new arrangements, SIBUR pays for 100% of APG supplied to the GPPs of
(1) Includes principal amounts of debt owed by SIBUR to RN Holding and accrued interest. Excludes debt owed by OOO Yugragazpererabotka to RN Holding.
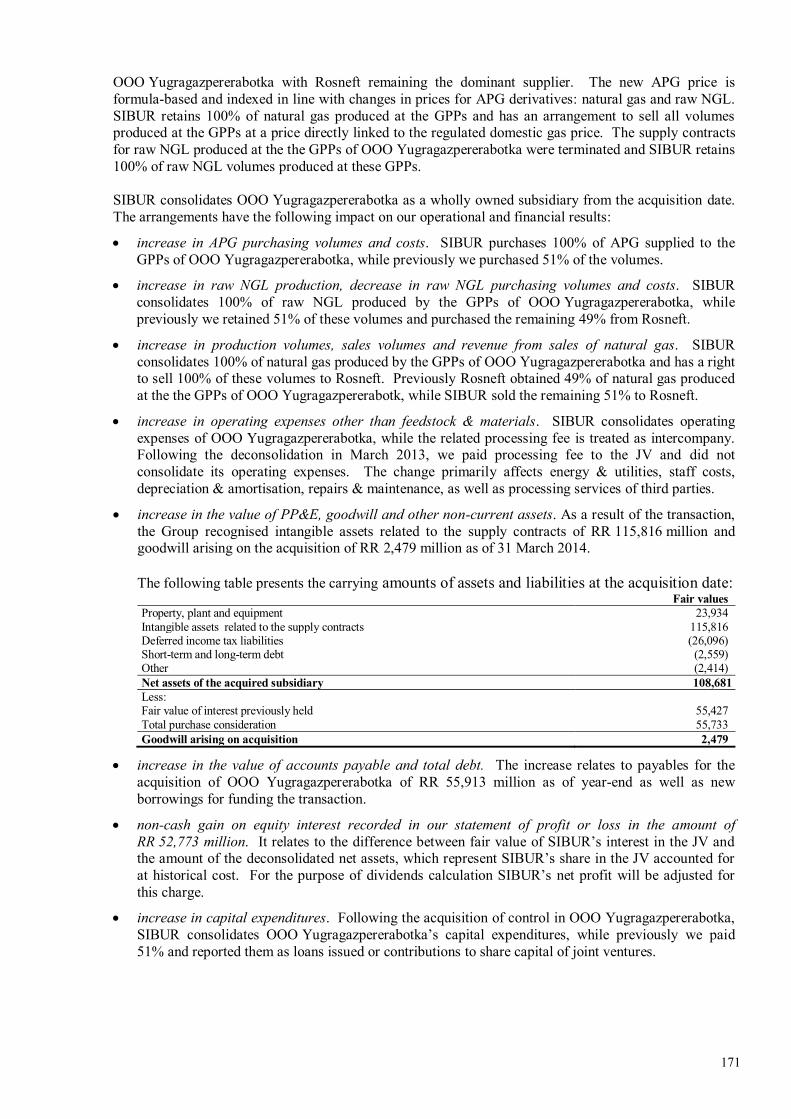
171
OOO Yugragazpererabotka with Rosneft remaining the dominant supplier. The new APG price is formula-based and indexed in line with changes in prices for APG derivatives: natural gas and raw NGL. SIBUR retains 100% of natural gas produced at the GPPs and has an arrangement to sell all volumes produced at the GPPs at a price directly linked to the regulated domestic gas price. The supply contracts for raw NGL produced at the the GPPs of OOO Yugragazpererabotka were terminated and SIBUR retains 100% of raw NGL volumes produced at these GPPs.
SIBUR consolidates OOO Yugragazpererabotka as a wholly owned subsidiary from the acquisition date. The arrangements have the following impact on our operational and financial results:
increase in APG purchasing volumes and costs. SIBUR purchases 100% of APG supplied to theGPPs of OOO Yugragazpererabotka, while previously we purchased 51% of the volumes.
increase in raw NGL production, decrease in raw NGL purchasing volumes and costs. SIBURconsolidates 100% of raw NGL produced by the GPPs of OOO Yugragazpererabotka, whilepreviously we retained 51% of these volumes and purchased the remaining 49% from Rosneft.
increase in production volumes, sales volumes and revenue from sales of natural gas. SIBURconsolidates 100% of natural gas produced by the GPPs of OOO Yugragazpererabotka and has a rightto sell 100% of these volumes to Rosneft. Previously Rosneft obtained 49% of natural gas producedat the the GPPs of OOO Yugragazpererabotk, while SIBUR sold the remaining 51% to Rosneft.
increase in operating expenses other than feedstock & materials. SIBUR consolidates operatingexpenses of OOO Yugragazpererabotka, while the related processing fee is treated as intercompany.Following the deconsolidation in March 2013, we paid processing fee to the JV and did notconsolidate its operating expenses. The change primarily affects energy & utilities, staff costs,depreciation & amortisation, repairs & maintenance, as well as processing services of third parties.
increase in the value of PP&E, goodwill and other non-current assets. As a result of the transaction,the Group recognised intangible assets related to the supply contracts of RR 115,816 million andgoodwill arising on the acquisition of RR 2,479 million as of 31 March 2014.
The following table presents the carrying amounts of assets and liabilities at the acquisition date: Fair values
Property, plant and equipment 23,934 Intangible assets related to the supply contracts 115,816 Deferred income tax liabilities (26,096) Short-term and long-term debt (2,559) Other (2,414) Net assets of the acquired subsidiary 108,681 Less: Fair value of interest previously held 55,427 Total purchase consideration 55,733 Goodwill arising on acquisition 2,479
increase in the value of accounts payable and total debt. The increase relates to payables for theacquisition of OOO Yugragazpererabotka of RR 55,913 million as of year-end as well as newborrowings for funding the transaction.
non-cash gain on equity interest recorded in our statement of profit or loss in the amount ofRR 52,773 million. It relates to the difference between fair value of SIBUR’s interest in the JV andthe amount of the deconsolidated net assets, which represent SIBUR’s share in the JV accounted forat historical cost. For the purpose of dividends calculation SIBUR’s net profit will be adjusted forthis charge.
increase in capital expenditures. Following the acquisition of control in OOO Yugragazpererabotka,SIBUR consolidates OOO Yugragazpererabotka’s capital expenditures, while previously we paid51% and reported them as loans issued or contributions to share capital of joint ventures.

172
APPENDIX III: Equity-Settled Share-Based Payment Plans
On 28 June 2013, a company beneficially owned by Mr. Mikhelson and Mr. Timchenko granted equity- settled share-based payment plans to certain current and former Group’s directors and key management. Consequently, the indirect interest beneficially owned by Mr. Mikhelson and Mr. Timchenko in the Company's share capital decreased from 94.5% to 82.5%. Furthermore, the total combined equity interest held by the current and former members of the Group’s management increased from 5.5% to 17.5%.
The transactions resulting in this change in ownership were made through companies that are not under the control of the Group but through a company jointly and beneficially held by the major shareholders. Thus, at the Group level, there are no current or future cash payments or liabilities under two plans, terms and conditions of which vary for different Participants. However, under IFRS 2 “Share-Based Payment”, the Group must recognise current and past service costs in its statement of profit or loss with corresponding amounts recorded in a statement on changes in equity.
The final terms of the plans, which cover certain members of the directors and key management (the "Participants") of the Group, were approved by the Group's shareholders in July 2013.
The First Plan - The plan for one group of Participants (the "First Plan") requires that the Participants provide services to the Group within a certain time period. If the services are terminated before the vesting date, the First Plan Participants retain their rights under the First Plan pro rata to the period of service provided. The granted shares are vested to each Participant annually in tranches. Each tranche comes to 20% of the total shares granted provided that the participant is continuously employed by the Company from the grant date until the applicable vesting date. Each tranche is accounted as a separate arrangement and expensed, together with a corresponding increase in shareholders’ equity, on a straight–line basis over the vesting periods.
The Second Plan - The plan for the other participants (the "Second Plan") was immediately vested and there are no future charges under this plan.
In 2014, the Group recognised RR 11,580 million within equity reserves and a corresponding increase in operating expenses and RR 7,894 million in 2013.
The equity-settled share awards under the plans are measured at the fair value for the underlying shares calculated at the grant date using a valuation model.
As of the grant date, the calculation of the Group’s equity value uses pre-tax cash flow projections based on a five-year financial forecast. Cash flows beyond the five-year period are extrapolated based on an estimated growth rate of 2.35%, which is the long-term average growth rate for the industry in which the Group operates. The following key assumptions are used in the equity value calculation: a pre-tax discount rate of 16.63%, oil price of USD 89-99 per bbl and Russian Federation Consumer Price Index of 5.0 – 6.5%.


PAO SIBUR Holding
International Financial Reporting Standards Consolidated Financial Statements and Independent Auditor’s Report
31 December 2014
174

175

176
The accompanying notes on pages 181 to 233 are an integral part of these consolidated financial statements.

PAO SIBUR HOLDINGIFRS CONSOLIDATED STATEMENT OF PROFIT OR LOSS(In millions of Russian roubles, unless otherwise stated)
The accompanying notes on pages 181 to 233 are an integral part of these consolidated financial statements.
177
Year ended 31 DecemberNotes 2014 2013
25 Revenue 361,000 269,81426 Operating expenses before equity-settled share-based payment plans (285,602) (205,316)34 Equity-settled share-based payment plans (11,580) (7,894)
Operating profit 63,818 56,60427 Finance income 1,157 1,19827 Finance expenses (90,922) (6,042)4 Gain on acquisition of subsidiary 52,773 -4 Gain on deconsolidation of subsidiary - 2,4134 Gain on disposal of subsidiary 18 3358 Share of net income/(loss) of joint ventures and associates (3,827) 794
Profit before income tax 23,017 55,30228 Income tax benefit/(expense) 2,054 (9,844)
Profit for the reporting period 25,071 45,458
Profit for the year, including attributable to: 25,071 45,45823 Non-controlling interest 67 (140)
Shareholders of the parent company 25,004 45,598
24Basic and diluted earnings per share(in Russian roubles per share) 11.5 20.9
22, 24 Weighted average number of shares outstanding (in thousands) 2,178,479 2,178,479

PAO SIBUR HOLDING IFRS CONSOLIDATED STATEMENT OF COMPREHENSIVE INCOME (In millions of Russian roubles, unless otherwise stated)
The accompanying notes on pages 181 to 233 are an integral part of these consolidated financial statements.
178
Year ended 31 December 2014 2013
Profit for the year 25,071 45,458 Other comprehensive loss after tax that will not be reclassified to profit or loss: Actuarial gain/(loss) on post-employment benefit obligations 249 (171) Total comprehensive income for the year 25,320 45,287 Total comprehensive income for the year, including attributable to: 25,320 45,287
Non-controlling interest 70 (138) Shareholders of the parent company 25,250 45,425

PAO SIBUR HOLDING IFRS CONSOLIDATED STATEMENT OF CASH FLOWS (In millions of Russian roubles, unless otherwise stated)
The accompanying notes on pages 181 to 233 are an integral part of these consolidated financial statements.
179
Year ended 31 December Notes 2014 2013
Operating activities 29 Cash from operating activities before income tax payment 107,329 84,975 28 Income tax paid (16,277) (12,234) 29 Net cash from operating activities 91,052 72,741
Investing activities Purchase of property, plant and equipment (67,707) (70,010)
10, 34 Loans issued (4,801) (946) 15 Transfers from/(to) restricted cash for investing activities 538 (216)
Repayment of loans and notes receivable 1,932 2,011 Proceeds from sale of property, plant and equipment 1,374 5,134 Proceeds from sale of investments - 156
4 Proceeds from disposal of subsidiaries, net of cash disposed 138 573 4 Acquisition of interest in subsidiaries, net of cash acquired (20,666) (1,742) 8 Additional contribution to the share capital of joint ventures (5,875) (6,299)
Interest received 571 760 Dividends received 969 600 Settlement of receivables from Amtel Group - 557 Purchase of intangible assets and other non-current assets (3,843) (962)
Net cash used in investing activities (97,370) (70,384) Financing activities
Proceeds from debt 141,340 64,769 Repayment of debt (106,994) (60,256) Repayment of promissory notes - (633)
23 Proceeds from sale of non-controlling interest - 439 Acquisition of non-controlling interest in subsidiary - (156) Interest paid (5,710) (3,718)
22 Dividends paid (14,073) (14,008) Payment of bank fees (697) (336)
17 Grants and subsidies received 10,227 5,971 Net cash from/(used in) financing activities 24,093 (7,928)
Effect of exchange rate changes on cash and cash equivalents 1,944 (51) Net increase/(decrease) in cash and cash equivalents 19,719 (5,622)
Cash and cash equivalents, at the beginning of the reporting year 7,948 13,570 Cash and cash equivalents, at the end of the reporting year 27,667 7,948

PAO SIBUR HOLDING IFRS CONSOLIDATED STATEMENT OF CHANGES IN EQUITY (In millions of Russian roubles, unless otherwise stated)
The accompanying notes on pages 181 to 233 are an integral part of these consolidated financial statements.
180
Attributable to the shareholders of the parent company
Notes Share
capital
Equity-settled
share-based payment
plans Share
premium Retained earnings Total
Non-control-
ling interest
Total equity
Balance as of 31 December 2012 21,784 - 9,357 163,624 194,765 991 195,756
Profit for the year - - - 45,598 45,598 (140) 45,458 Actuarial loss on post-employment benefit obligations - - - (173) (173) 2 (171) Total comprehensive income for the reporting period - - - 45,425 45,425 (138) 45,287
34
Equity-settled share-based payment plans - 7,894 - - 7,894 - 7,894
23
Sale of non-controlling interest in subsidiaries - - - 337 337 102 439
23
Acquisition of non-controlling interest in subsidiaries - - - (109) (109) (105) (214)
22 Dividends paid - - - (14,008) (14,008) - (14,008) Balance as of 31 December 2013 21,784 7,894 9,357 195,269 234,304 850 235,154
Profit for the year - - - 25,004 25,004 67 25,071 Actuarial gain on post-employment benefit obligations - - - 246 246 3 249 Total comprehensive income for the reporting period - - - 25,250 25,250 70 25,320
34
Equity-settled share-based payment plans - 11,580 - - 11,580 - 11,580 Redemption of treasury shares of subsidiaries - - - (44) (44) 44 -
22 Dividends paid (14,073) (14,073) - (14,073) Balance as of 31 December 2014 21,784 19,474 9,357 206,402 257,017 964 257,981

PAO SIBUR HOLDING NOTES TO THE IFRS CONSOLIDATED FINANCIAL STATEMENTS (In millions of Russian roubles, unless otherwise stated)
181
1 NATURE OF OPERATIONS
PAO SIBUR Holding (hereinafter, the “Company”) and its subsidiaries (jointly referred to as the “Group”) form a vertically integrated gas processing and petrochemicals business. The Group purchases and processes raw materials (primarily associated petroleum gas and natural gas liquids), produces and markets energy and petrochemical products, both domestically and internationally. The Group’s production facilities are located in the Russian Federation.
As of 31 December 2014 and 2013 the Group’s ultimate controlling shareholder was Mr Leonid V. Mikhelson. The Company’s parent company is Sibur Limited.
In the third quarter of 2014 OOO Yauza 12 (a company wholly owned by Mr Kirill N. Shamalov, Deputy Chairman of the Management Board of the Company) effectively acquired a 17 percent stake in the Company, which had previously been beneficially owned by entities under the control of Mr Gennady N. Timchenko. Following this transaction, Mr Shamalov’s ownership stake in the PAO SIBUR Holding increased to 21.3 percent.
In October 2014 the Company changed its registration from St. Petersburg to Tobolsk, Tyumen Region. At the same time the Company changed its legal form of incorporation from Open Joint Stock Company (OAO) to Public Joint Stock Company (PAO).
2 BASIS OF PREPARATION AND SIGNIFICANT ACCOUNTING POLICIES
Basis of preparation. These consolidated financial statements have been prepared in accordance with International Financial Reporting Standards (IFRS) and interpretations issued by the IFRS Interpretations Committee (IFRS IC). Most of the Group’s companies maintain their accounting records in Russian roubles (RR) and prepare their statutory financial statements in accordance with the Regulations on Accounting and Reporting of the Russian Federation (RAR). The financial statements are based on the statutory records of Group’s companies, with adjustments and reclassifications recorded to ensure fair presentation in accordance with IFRS.
The consolidated financial statements have been prepared under the historical cost convention, as modified by the revaluation of available-for-sale financial assets, and financial assets and financial liabilities (including derivative instruments) at fair value through profit or loss. The preparation of consolidated financial statements under IFRS requires certain critical accounting estimates. It also requires management to exercise judgement when applying the Group’s accounting policies. Those areas involving a higher degree of judgement or complexity, or where assumptions and estimates are significant to the consolidated financial statements are disclosed in Note 3.
The principal accounting policies applied in the preparation of these consolidated financial statements are set out below. These policies have been consistently applied to all the periods presented, unless otherwise stated.
Consolidated financial statements. Subsidiaries are those investees, including structured entities, that the Group controls because the Group has (i) the power to direct relevant activities of the investees that significantly affect their returns, (ii) exposure, or rights, to variable returns from its involvement with the investees, and (iii) the ability to use its power over the investees to affect the amount of an investor’s returns. The existence and effect of substantive rights, including substantive potential voting rights, are considered when assessing whether the Group has power over another entity. For a right to be substantive, the holder must have the practical ability to exercise that right when decisions about the direction of the relevant activities of the investee need to be made. The Group may have power over an investee even when it holds less than a majority of voting power in an investee. In such cases, the Group assesses the size of its voting rights relative to the size and dispersion of holdings of the other vote holders to determine if it has de-facto power over the investee. Protective rights of other investors, such as those that relate to fundamental changes in an investee’s activities or apply only in exceptional circumstances, do not prevent the Group from controlling an investee. Subsidiaries are consolidated from the date on which control is transferred to the Group (acquisition date) and are deconsolidated from the date on which such control ceases.
PAO SIBUR HOLDING NOTES TO THE IFRS CONSOLIDATED FINANCIAL STATEMENTS (In millions of Russian roubles, unless otherwise stated)
182
2 BASIS OF PREPARATION AND SIGNIFICANT ACCOUNTING POLICIES (CONTINUED)
The acquisition method of accounting is used to account for the acquisition of subsidiaries. Identifiable assets acquired, as well as liabilities and contingent liabilities assumed in a business combination are measured at their fair values at the acquisition date, regardless of the extent of any non-controlling interest.
The Group measures non-controlling interest on a transaction-by-transaction basis, either at: a) fair value, or b) the non-controlling interest's proportionate share of the acquiree’s net assets.
Goodwill is measured by deducting the acquiree’s net assets from the aggregate amount of the consideration transferred for the acquiree, as well as the amount of non-controlling interest in the acquiree and the fair value of the interest in the acquiree held immediately before the acquisition date. Any negative amount (“negative goodwill”) is recognised in profit or loss after management reassesses whether it identified all the assets acquired, all liabilities and contingent liabilities assumed, and reviews the appropriateness of their measurement.
The consideration transferred for the acquiree is measured at the fair value of the assets released, equity instruments issued, and liabilities incurred or assumed, including the fair values of assets or liabilities from contingent consideration arrangements, but excludes acquisition-related costs such as fees for advisory, legal, valuation and similar professional services. Transaction costs related to an acquisition and incurred for issuing equity instruments are deducted from equity; transaction costs incurred for issuing debt as part of a business combination are deducted from the carrying amount of the debt and all other transaction costs associated with the acquisition are expensed.
Intercompany transactions, balances and unrealised gains on transactions between Group companies are eliminated. In addition, unrealised losses are also eliminated unless the relevant cost cannot be recovered. The Company and all of its subsidiaries use uniform accounting policies that are consistent with the Group’s policies.
Non-controlling interest is the part of a subsidiary’s net results and equity that is attributable to interests that the Company does not own, either directly or indirectly. Non-controlling interest forms a separate component of the Group’s equity.
Purchases of subsidiaries from parties under common control. Purchases of subsidiaries from parties under common control are accounted for using the acquisition method of accounting. Identifiable assets acquired, as well as liabilities and contingent liabilities assumed in a business combination are measured at their fair values at the acquisition date, regardless of the extent of any non-controlling interest.
Assets and disposal groups classified as held for sale. Assets and disposal groups (which may include both non-current and current assets) are classified in the statement of financial position as “assets classified as held for sale” if their carrying amount will be recovered principally through a sale transaction (including loss of control over the subsidiary holding the assets) within 12 months after the reporting period and a sale is considered highly probable. They are stated at the lower of carrying amount and fair value less costs to sell.
Non-current assets or disposal groups classified as held for sale in the current period’s statement of financial position are not reclassified or presented again in the comparative statement of financial position to reflect the classification at the end of the current period.
Property, plant and equipment. Property, plant and equipment items are stated at cost, restated to the equivalent purchasing power of the Russian rouble as of 31 December 2002 for assets acquired prior to 1 January 2003, less accumulated depreciation and provision for impairment, wherever required.

PAO SIBUR HOLDING NOTES TO THE IFRS CONSOLIDATED FINANCIAL STATEMENTS (In millions of Russian roubles, unless otherwise stated)
183
2 BASIS OF PREPARATION AND SIGNIFICANT ACCOUNTING POLICIES (CONTINUED)
Costs for minor repairs and day-to-day maintenance are expensed when incurred. The cost for replacing major parts or components of property, plant and equipment items is capitalised when it is probable that future economic benefits will flow to the Group, the cost of the item can be measured reliably, and the replaced part has been taken out of commission and derecognised. Gains and losses on disposals determined by comparing proceeds with carrying amounts are recognised in profit or loss.
An asset’s carrying amount is immediately recorded to its recoverable amount if the asset’s carrying amount is greater than its estimated recoverable amount.
Depreciation. Depreciation of property, plant and equipment items is calculated using the straight-line method to allocate their cost to their residual values over their estimated useful lives (except for depreciation of catalysers, which are depreciated using the unit-of-production method):
Useful lives in years Buildings 20-60 Facilities 10-50 Machinery and equipment 5-30 Transport vehicles and other 5-20
The useful lives are reviewed annually with due consideration of the nature of the assets, existing practices regarding their repair and maintenance , their intended use and technological evolution. A change in the useful life of a property, plant and equipment item is handled as a change in accounting estimate and is accounted for on a prospective basis.
The residual value of an asset is the estimated amount that the Group would currently obtain from disposal of the asset less the estimated costs of disposal if the asset was already of the age and in the condition expected at the end of its useful life. The residual value of an asset is assumed to be nil if the Group expects to use the asset until the end of its physical life. The residual values and useful lives of assets are reviewed, and adjusted if appropriate, at each reporting date.
Operating leases. Where the Group is a lessee in a lease that does not substantially transfer all the risks and rewards incidental to ownership from the lessor to the Group, the total lease payments are charged to profit or loss for the year on a straight-line basis over the lease term. The lease term is the non-cancellable period for which the lessee has contracted to lease the asset together with any further terms for which the lessee has the option to continue to lease the asset, with or without further payment, when at the inception of the lease it is reasonably certain that the lessee will exercise the option.
Intangible assets
a) Goodwill represents the excess of the cost of an acquisition over the fair value of the Group’s share ofthe net identifiable assets of the acquired subsidiary at the acquisition date. Goodwill is tested annually for impairment and carried at cost less accumulated impairment losses, if any. Impairment losses on goodwill are not reversed. Gains and losses on the disposal of an entity include the carrying amount of goodwill with respect to the entity sold.
Goodwill is allocated to cash-generating units for impairment testing. The allocation is made to those cash-generating units, or groups of cash-generating units, which are expected to benefit from the business combination where the goodwill arose, as identified according to operating segment.
b) Development costs directly associated with identifiable and unique software controlled by the Groupare recorded as intangible assets if an inflow of incremental economic benefits exceeding costs is probable. Capitalised costs include staff costs of the software development team and an appropriate portion of relevant overheads. All other costs associated with computer software, e.g. its maintenance, are expensed when incurred. Development costs are carried at cost less accumulated depreciation.

PAO SIBUR HOLDING NOTES TO THE IFRS CONSOLIDATED FINANCIAL STATEMENTS (In millions of Russian roubles, unless otherwise stated)
184
2 BASIS OF PREPARATION AND SIGNIFICANT ACCOUNTING POLICIES (CONTINUED)
c) Other intangible assets with finite useful lives are carried at cost less accumulated amortisation.Amortisation is calculated using the straight-line method to allocate the cost of intangible assets over their estimated useful lives. Gas supply contract is amortised during the contract maturity (Note 4). The useful lives are reviewed annually taking into consideration the nature of the intangible assets. Annually, at each reporting date, management assesses whether there is any indication of impairment of intangible assets. If impaired, the carrying amount of intangible assets is written down to the higher of value in use and fair value less costs to sell.
Impairment of non-financial assets. Assets with an indefinite useful life, goodwill for example, are not subject to amortisation and are tested annually for impairment. Assets subject to depreciation or amortisation are reviewed for impairment whenever events or changes in circumstances indicate that the carrying amount may not be recoverable. An impairment loss is recognised for the amount by which the asset’s carrying amount exceeds its recoverable amount. The recoverable amount is the higher of an asset’s fair value less costs to sell and value in use. For the purposes of assessing impairment, assets are grouped at the lowest levels for which there are separately identifiable cash flows (cash-generating units). Non-financial assets other than goodwill that has suffered impairment are reviewed for possible reversal of the impairment at each reporting date.
Investments in joint ventures. Joint ventures are entities over which the Group exercises joint control. Investments in joint ventures are accounted for by the equity method of accounting and are initially recognised at cost. Dividends received from joint ventures reduce the carrying value of the investment in joint ventures. The carrying amount of joint ventures includes goodwill identified on acquisition less accumulated impairment losses, if any. The Group’s share of the post-acquisition profit or loss of joint ventures is recorded in profit or loss for the year as a share of the net income of joint ventures. The Group’s share of other post-acquisition comprehensive income of joint ventures is recognised in the Group’s other comprehensive income.
When the Group’s share of losses in a joint venture equals or exceeds its interest in the joint venture, including any other unsecured receivables, the Group does not recognise any further losses, unless it has incurred obligations or made payments on behalf of the joint venture.
Unrealised gains on transactions between the Group and its joint ventures are eliminated to the extent of the Group’s interest in the joint ventures. In addition, unrealised losses are also eliminated unless the transaction provides evidence of an impairment of the asset transferred.
Associates. Associates are entities over which the Group has significant influence (directly or indirectly), but not control, generally resulting from a shareholding of between 20 and 50 percent of voting rights. Investments in associates are accounted for using the equity method of accounting and are initially recognised at cost. Dividends received from associates reduce the carrying value of investments in associates. The carrying amount of associates includes goodwill identified on acquisition less accumulated impairment losses, if any. The Group’s share of the post-acquisition profit or loss of associates is recorded in profit or loss for the year as a share of the net income of associates. The Group’s share of other post-acquisition comprehensive income of associates is recognised in the Group’s other comprehensive income.
When the Group’s share of the losses of an associate equals or exceeds its interest in an associate, including any other unsecured receivables, the Group does not recognise any further losses, unless it has incurred obligations or made payments on behalf of the associate.
Unrealised gains on transactions between the Group and its associates are eliminated to the extent of the Group’s interest in the associates. In addition, unrealised losses are also eliminated unless the transaction provides evidence of an impairment of the asset transferred.

PAO SIBUR HOLDING NOTES TO THE IFRS CONSOLIDATED FINANCIAL STATEMENTS (In millions of Russian roubles, unless otherwise stated)
185
2 BASIS OF PREPARATION AND SIGNIFICANT ACCOUNTING POLICIES (CONTINUED)
Loans and receivables. Loans and receivables are recognised initially at fair value plus transaction costs and subsequently measured at amortised cost using the effective interest method amount less a provision made for impairment of these receivables.
Prepayments. Prepayments are carried at cost less provision for impairment. A prepayment is classified as non-current when the goods or services relating to the prepayment are expected to be obtained after one year, or when the prepayment relates to an asset which will itself be classified as non-current upon initial recognition. Prepayments to acquire assets are transferred to the carrying amount of an asset once the Group has obtained control of the asset and it is probable that future economic benefits associated with the asset will flow to the Group. Other prepayments are written off to profit or loss when the goods or services relating to the prepayments are received. If there is an indication that the assets, goods or services relating to a prepayment will not be received, the carrying value of the prepayment is recorded accordingly and a corresponding impairment loss is recognised in profit or loss for the year.
Inventories. Inventories are recorded at the lower of cost and net realisable value. The cost of inventory is assigned on a weighted average basis. The cost of finished goods and work in progress comprises raw material, direct labour, other direct costs and related production overheads, but nonetheless excludes borrowing costs. Net realisable value is the estimated selling price in the ordinary course of business, less the cost of completion and selling expenses.
Cash and cash equivalents. Cash and cash equivalents include cash in hand, deposits held on call with banks, and other short-term, highly liquid investments with original maturities of three months or less. Cash and cash equivalents are carried at amortised cost using the effective interest method. Restricted balances are excluded from cash and cash equivalents for the purposes of the cash flow statement. Balances restricted from being exchanged or used to settle a liability for at least 12 months after the reporting period are included in other non-current assets. Foreign exchange gains and losses from deposits held on call with banks are classified as foreign exchange gains or losses from financing activities.
Trade and other payables. Trade payables are accrued when a single counterparty has performed its obligations under a relevant contract, and are recognised initially at fair value plus transaction costs and subsequently carried at amortised cost using the effective interest method.
Provisions for liabilities and charges. Provisions for liabilities and charges are recognised when the Group has a present legal or constructive obligation as a result of past events, and it is probable that an outflow of resources will be required to settle the obligation and so that a reliable estimate of the relevant amount can be made. Where there are a number of similar obligations, the likelihood that an outflow will be required in settlement is determined by considering the class of obligations as a whole. A provision is recognised even if there is little likelihood of an outflow connected to any item included in the same class of obligations. Where the Group expects a provision to be reimbursed, under an insurance contract for example, the reimbursement is recognised as a separate asset but only when reimbursement is virtually certain. Provisions are reassessed at each reporting date and changes in the provisions are reflected in the profit or loss.
Provisions are measured at the present value of the expenditures expected to be required in order to settle the obligation using a pre-tax rate that reflects current market assessments of the time value of money and the risks specific to the obligation. The increase in a provision due to passage of time is recognised as interest expense.
Value added tax. Output value added tax (VAT) related to sales is payable to the relevant tax authorities upon the earlier of a) collection of receivables from customers or b) delivery of goods or services to customers. Input VAT is generally recoverable against output VAT upon receipt of the relevant VAT invoice. The Russian tax authorities permit the settlement of VAT on a net basis. VAT related to sales and purchases that have not been settled at the reporting date (VAT recoverable and payable) is recognised on a gross basis and disclosed separately as a current asset and current liability, respectively. Where a provision has been made for impairment of receivables, an impairment loss is recorded for the

PAO SIBUR HOLDING NOTES TO THE IFRS CONSOLIDATED FINANCIAL STATEMENTS (In millions of Russian roubles, unless otherwise stated)
186
2 BASIS OF PREPARATION AND SIGNIFICANT ACCOUNTING POLICIES (CONTINUED)
gross amount of the debtor, including VAT. The related VAT liability is maintained until the debt is written off for tax purposes.
Grants and subsidies. Grants and subsidies are recognised at their fair value where there is a reasonable assurance that the grant will be received and the Group will comply with all accompanying conditions. Grants and subsidies related to the purchase of property, plant and equipment are included in non-current liabilities as deferred income and are credited to the profit or loss: a) on a straight-line basis over the expected lives of the related assets, or b) in full when the assets are sold. Grants and subsidies received as compensation for non-capital expense are credited to profit or loss reducing the corresponding expense.
Where grants are seen as a mechanism to finance acquisition of property, plant and equipment the cash inflows are shown as a financing activity.
Debt. Debt is recognised initially at fair value, net of transaction costs incurred. Debt is subsequently carried at amortised cost. Any difference between the proceeds (net of transaction costs) and the redemption value is recognised in the statement of profit or loss over the period of the debt using the effective interest method.
Fees paid for the establishment of loan facilities are recognised as transaction costs of the loan to the extent that it is probable that some or all of the facility will be drawn down. In this case, the fee is deferred until the draw-down occurs and presented as prepaid borrowing costs.
To the extent there is no evidence of the probability that some or all of the facility will be drawn down, the fee is capitalised as a pre-payment for liquidity services and amortised over the period of the relevant facility.
Capitalisation of borrowing costs. Borrowing costs directly attributable to the acquisition, construction or production of assets that require considerable time to be prepared for their intended use or sale (qualifying assets) are capitalised as part of the costs for such assets if the commencement date for capitalisation occurred on or after 1 January 2009.
Capitalisation of borrowing costs continues up to the date when the assets are substantially ready for their use or sale.
The Group capitalises borrowing costs that could have been avoided if it had not made capital expenditures on qualifying assets. Capitalised borrowing costs are calculated at the Group’s average funding cost (the weighted average interest cost is applied to the expenditures on the qualifying assets), except to the extent that funds are borrowed specifically for the purpose of obtaining a qualifying asset. Where this occurs, actual borrowing costs incurred, less any investment income on the temporary investment of the borrowings, are capitalised.
Share capital. Ordinary shares are classified as equity. Incremental costs directly attributable to the issue of new shares are shown in equity as a deduction, net of tax, from the proceeds. Any excess of the fair value of consideration received over the par value of shares issued is presented as share premium.
Where the Group companies purchase the Company’s equity share capital, the consideration paid including any attributable transaction costs net of income taxes is deducted from total shareholders’ equity until the equity instruments are cancelled, sold or reissued. Where such shares are subsequently sold or reissued, any consideration received net of any directly attributable incremental transaction costs and the related income tax effects is included in shareholders’ equity. The gains (losses) arising from treasury shares transactions are recognised in the consolidated statement of changes in shareholders’ equity, net of associated costs including taxation.
Earnings per share. Earnings per share are determined by dividing the profit or loss attributable to equity holders of the Company by the weighted average number of participating shares outstanding during the reporting year.

PAO SIBUR HOLDING NOTES TO THE IFRS CONSOLIDATED FINANCIAL STATEMENTS (In millions of Russian roubles, unless otherwise stated)
187
2 BASIS OF PREPARATION AND SIGNIFICANT ACCOUNTING POLICIES (CONTINUED)
Dividends. Dividends are recognised as a liability and deducted from equity at the reporting date only if they are declared before or on the reporting date. Dividends are disclosed when declared after the reporting date but before the financial statements are authorised for issue.
Purchases and sales of non-controlling interests. The Group applies the economic entity model to account for transactions with owners of non-controlling interests. The Group recognises the difference between the purchase consideration and the carrying amount of non-controlling interests acquired and records it as a capital transaction directly in equity. Any difference between the sales consideration and carrying amount of non-controlling interests sold is also recognised as a capital transaction in the statement of changes in equity.
Current and deferred income tax. Income taxes are covered in the consolidated financial statements in accordance with Russian law as enacted, or substantively enacted, by the reporting date. The income tax charge or credit comprises current tax and deferred tax, and is recognised in profit or loss, unless it is recognised in other comprehensive income or directly in equity because it relates to transactions that are recognised, in the same or a different period, in other comprehensive income or directly in equity.
Current income tax is the amount expected to be paid to or refunded by the tax authorities on taxable profits or losses for the current and prior periods. Deferred income tax is recognised using the balance sheet liability method for tax loss carry-forwards and temporary differences arising between the tax bases of assets and liabilities and their carrying amounts for financial reporting purposes. Under the initial recognition exemption, deferred taxes are not recorded for temporary differences on initial recognition of an asset or liability in a transaction other than a business combination if the transaction, when initially recorded, affects neither accounting nor taxable profit.
Deferred tax assets and liabilities are netted only within individual Group companies. Deferred tax assets for deductible temporary differences and tax loss carry-forwards are recorded only to the extent that there are sufficient taxable temporary differences, or that it is probable there will be future taxable profit against which the deductions can be utilised.
The Group controls the reversal of temporary differences relating to taxes chargeable on dividends from subsidiaries or on gains at their disposal. The Group does not recognise deferred tax liabilities on such temporary differences except to the extent that management expects the temporary differences to reverse in the foreseeable future.
Taxes other than income tax, including VAT, excise tax and export duties are recorded within operating expenses.
Post-employment obligations. Some Group companies provide retirement benefits to their retired employees. Entitlement to these benefits is usually conditional on the employee remaining in service up to retirement age and the completion of a minimum service period. The expected costs of such benefits are accrued over the period of employment using the same accounting methodology used for defined benefit pension plans. Actuarial gains and losses arising from experience adjustments and changes in actuarial assumptions are charged or credited to equity in other comprehensive income in the period in which they arise. These obligations are valued annually by independent qualified actuaries.
Employee benefits. Wages, salaries and contributions to the Russian Federation state pension and social insurance funds, paid annual leave and sick leave, bonuses, and non-monetary benefits (such as health services and kindergarten services) are accrued in the year in which the associated services are rendered by the Group’s employees. The Group has no legal or constructive obligation to make carry out pension or similar benefit payments beyond social tax payments and payments to the statutory defined contribution scheme.
Equity-settled share-based payment plans. The share option programme allows the Group’s management to hold shares in the Company. The fair value of the options is measured at the grant date and is spread over the period during which the employees become unconditionally entitled to the options. The fair value of the options granted is measured at the fair value for the underlying shares
PAO SIBUR HOLDING NOTES TO THE IFRS CONSOLIDATED FINANCIAL STATEMENTS (In millions of Russian roubles, unless otherwise stated)
188
2 BASIS OF PREPARATION AND SIGNIFICANT ACCOUNTING POLICIES (CONTINUED)
calculated at the grant date using a valuation model that takes into account the terms and conditions of the options granted. Each tranche is accounted for as a separate arrangement and expensed, together with a corresponding increase in shareholder’s equity, on a straight-line basis over the vesting periods.
Revenue recognition. Revenues from sales of goods are recognised for financial reporting purposes at the point of transfer of ownership risks and rewards, normally when the goods are shipped. If the Group agrees to transport goods to a specified location, revenue is recognised when the goods are delivered to the customer at the destination point.
Sales are shown net of VAT, excise tax and other similar mandatory payments. Revenues are measured at the fair value of the consideration received or receivable.
Interest income is recognised on a time-proportion basis using the effective interest method.
Classification of financial assets. The Group classifies its financial assets in the following categories: at fair value through profit or loss, loans and receivables, and available for sale. The classification depends on the purpose for which the financial assets were acquired. Management determines the classification of its financial assets at initial recognition.
a) Financial assets at fair value through profit or loss
Financial assets at fair value through profit or loss are financial assets held for trading. A financial asset is classified in this category if it was acquired principally for the purpose of selling in the short term. Derivatives are also categorised as financial assets at fair value through profit or loss. Assets in this category are classified as current assets as they are expected to be settled within 12 months from the reporting date. Gains or losses arising from changes in the fair value of the “financial assets at fair value through profit or loss” category are presented in the profit or loss within finance income and finance expenses in the period in which they arise.
b) Loans and receivables
Loans and receivables are non-derivative financial assets with fixed or determinable payments that are not quoted on an active market. They are included in current assets, except for maturities greater than 12 months after the reporting date, which are classified as non-current assets. The Group’s loans and receivables include trade and other receivables, loans and notes receivable, and cash and cash equivalents in the statement of financial position.
c) Available-for-sale financial assets
Available-for-sale financial assets are non-derivatives that are either designated in this category or not classified in any of the other categories. They are included in non-current assets unless management intends to dispose of the investment within 12 months from the reporting date.
Classification of financial liabilities. Financial liabilities have the following measurement categories: a) held for trading, which also includes financial derivatives, and b) other financial liabilities. Liabilities held for trading are carried at fair value with changes in value recognised in profit or loss for the year (as finance income or finance expenses) in the period in which they arise. Other financial liabilities are carried at amortised cost.
Financial instruments – key measurement terms. Depending on their classification financial instruments are carried at fair value or amortised cost as described below.
Fair value is the price that would be received from selling an asset or paid to transfer a liability in an orderly transaction between market participants at the measurement date. The best evidence of fair value is a price quoted in an active market. An active market is one where transactions for the asset or liability

PAO SIBUR HOLDING NOTES TO THE IFRS CONSOLIDATED FINANCIAL STATEMENTS (In millions of Russian roubles, unless otherwise stated)
189
2 BASIS OF PREPARATION AND SIGNIFICANT ACCOUNTING POLICIES (CONTINUED)
take place with sufficient frequency and volume to provide pricing information on an ongoing basis.
The fair value of financial instruments traded in an active market is measured as the product of the quoted price for the individual asset or liability and the quantity held by the entity. This is the case even if a market’s normal daily trading volume is insufficient to absorb the quantity held and placing orders to sell the position in a single transaction might affect the quoted price.
A portfolio of other financial assets and liabilities that are not traded in an active market is measured at the fair value of a group of financial assets and financial liabilities on the basis of the price that would be received from selling a net long position (i.e. an asset) for a particular risk exposure or paid to transfer a net short position (i.e. a liability) for a particular risk exposure in an orderly transaction between market participants at the measurement date. This is applicable for assets carried at fair value on a recurring basis if the Group: (a) manages the group of financial assets and financial liabilities on the basis of the entity’s net exposure to a particular market risk (or risks) or to the credit risk of a particular counterparty in accordance with the entity’s documented risk management or investment strategy; (b) it provides information on that basis about the group of assets and liabilities to the entity’s key management personnel; and (c) the market risks, including duration of the entity’s exposure to a particular market risk (or risks) arising from the financial assets and financial liabilities is substantially the same.
Valuation techniques such as discounted cash flow models or models based on recent arm’s length transactions or consideration of the investees’ financial data are used to measure the fair value of certain financial instruments for which external market pricing information is unavailable. Fair value measurements are analysed according to their levels in the fair value hierarchy as follows: (i) level one are measurements based on quoted prices (unadjusted) in active markets for identical assets or liabilities, (ii) level two measurements are valuation techniques with all material inputs observable for the given asset or liability, either directly (that is, as prices) or indirectly (that is, derived from prices), and (iii) level three measurements are valuations not based on solely observable market data (that is, the measurement requires significant unobservable inputs). No transfers between the levels of the fair value hierarchy are deemed to have occurred during the reporting period.
Transaction costs are incremental costs that are directly attributable to the acquisition, issue or disposal of a financial instrument. An incremental cost is one that would not have been incurred if the transaction had not taken place. Transaction costs include fees and commissions paid to agents (including employees acting as selling agents), advisers, brokers and dealers, levies by regulatory agencies and securities exchanges, and transfer taxes and duties. Transaction costs do not include debt premiums or discounts, financing costs or internal administrative or holding costs.
Amortised cost is the amount at which the financial instrument was recognised at initial recognition less any principal repayments, plus accrued interest, and for financial assets less any write-down for incurred impairment losses. Accrued interest includes amortisation of transaction costs deferred at initial recognition and of any premium or discount to maturity amount using the effective interest method. Accrued interest income and accrued interest expense, including both accrued coupon and amortised discount or premium (including fees deferred at origination, if any), are not presented separately and are, instead, included in the carrying values of related items in the statement of financial position.
The effective interest method is a method for allocating interest income or interest expense over the relevant period, so as to achieve a constant periodic rate of interest (effective interest rate) on the carrying amount. The effective interest rate is the rate that exactly discounts estimated future cash payments or receipts (excluding future credit losses) through the expected life of the financial instrument or a shorter period, if appropriate, to the net carrying amount of the financial instrument. The effective interest rate discounts cash flows of variable interest instruments to the next date for establishing a new interest price, except for the premium or discount which reflects the credit spread over the floating rate specified in the instrument, or other variables that are not reset to market rates. Such premiums or discounts are amortised over the whole expected life of the instrument. The present
PAO SIBUR HOLDING NOTES TO THE IFRS CONSOLIDATED FINANCIAL STATEMENTS (In millions of Russian roubles, unless otherwise stated)
190
2 BASIS OF PREPARATION AND SIGNIFICANT ACCOUNTING POLICIES (CONTINUED)
value calculation includes all fees paid or received between parties to the contract which are an integral part of the effective interest rate.
Derivative financial instruments, including interest rate futures, forward rate agreements, currency and interest rate swaps, currency and interest rate options are carried at their fair value. All derivative instruments are carried as assets when fair value is positive and as liabilities when fair value is negative. Changes in the fair value of derivative instruments are included in profit or loss for the year. The Group does not apply hedge accounting. Impairment of financial assets carried at amortised cost. Impairment losses are recognised in profit or loss when incurred as a result of one or more events (hereinafter “loss events”) that occurred after the initial recognition of the financial asset and which have an impact on the amount or timing of the estimated future cash flows of the financial asset or group of financial assets that can be reliably estimated. If the Group determines that no objective evidence exists that impairment was incurred for an individually assessed financial asset, whether significant or not, it includes the given asset in a group of financial assets with similar credit risk characteristics, and then collectively assesses them for impairment. The primary factors that the Group considers in determining whether a financial asset is impaired are its overdue status and the realisability of related collateral, if any. The following other principal criteria are also used to determine whether there is objective evidence that an impairment loss has occurred:
any portion or instalment is overdue and the late payment cannot be attributed to a delay causedby settlement systems;
the counterparty experiences a significant financial difficulty as evidenced by its financialinformation which the Group has obtained;
the counterparty is considering bankruptcy or a financial reorganisation;
there is an adverse change in the payment status of the counterparty as a result of changes innational or local economic conditions that impact the counterparty; or
the value of collateral, if any, significantly decreases as a result of deteriorating marketconditions.
If the terms of an impaired financial asset held at amortised cost are renegotiated or otherwise modified because of the counterparty’s financial difficulties, impairment is measured using the original effective interest rate before the modification of terms. Impairment losses are always recognised through an allowance account to write down the asset’s carrying amount to the present value of expected cash flows (which exclude future credit losses that have not been incurred) discounted at the original effective interest rate of the asset. The calculation of the present value of the estimated future cash flows of a collateralised financial asset reflects the cash flows that may result from foreclosure less costs for obtaining and selling the collateral, whether or not foreclosure is probable.
If, in a subsequent period, the amount of the impairment loss decreases and the decrease can be related objectively to an event occurring after the impairment was recognised (such as an improvement in the debtor’s credit rating), the previously recognised impairment loss is reversed by adjusting the allowance account through profit or loss.
Uncollectible assets are written off against the related impairment loss provision after all necessary procedures for recovering the asset have been completed and the amount of the loss has been determined. Subsequent recoveries of amounts previously written off are credited to the impairment loss account within the profit or loss for the year.
Foreign currency transactions. The functional currency of each of the Group’s consolidated entities is the currency of the primary economic environment in which the given entity operates. The functional currency of the Company and its subsidiaries, and the Group’s presentation currency, is the national currency of the Russian Federation, the Russian rouble (RR).
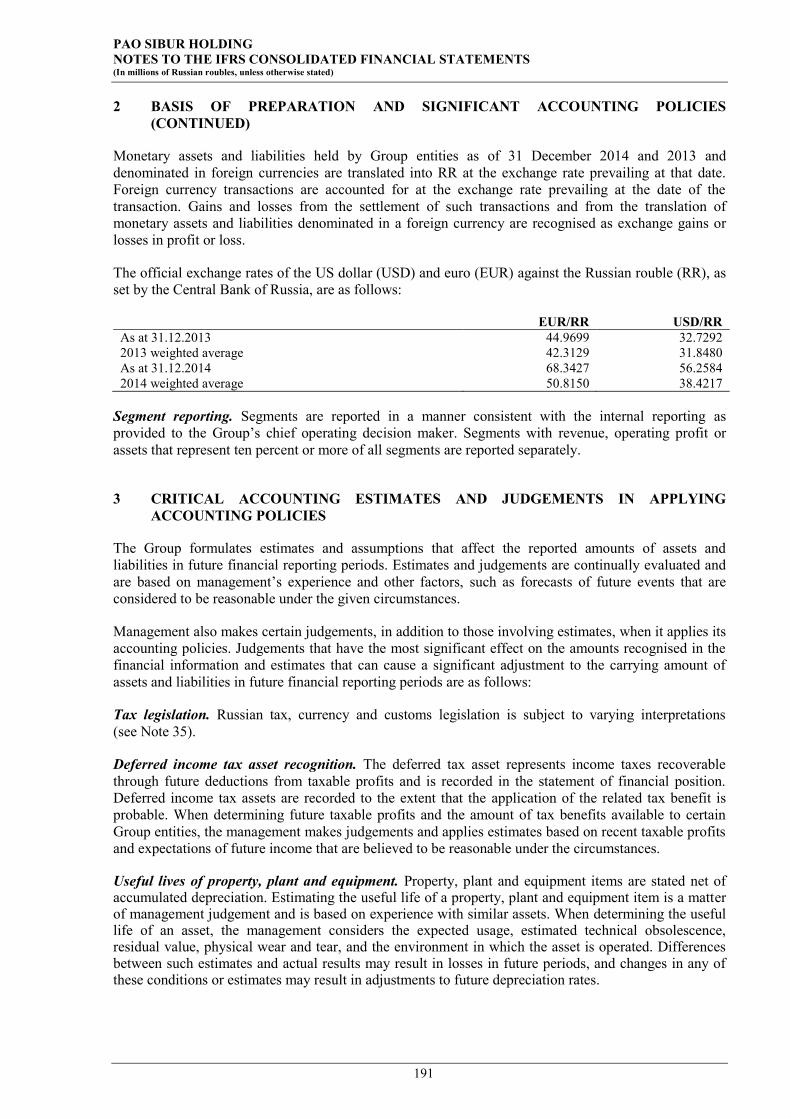
PAO SIBUR HOLDING NOTES TO THE IFRS CONSOLIDATED FINANCIAL STATEMENTS (In millions of Russian roubles, unless otherwise stated)
191
2 BASIS OF PREPARATION AND SIGNIFICANT ACCOUNTING POLICIES (CONTINUED)
Monetary assets and liabilities held by Group entities as of 31 December 2014 and 2013 and denominated in foreign currencies are translated into RR at the exchange rate prevailing at that date. Foreign currency transactions are accounted for at the exchange rate prevailing at the date of the transaction. Gains and losses from the settlement of such transactions and from the translation of monetary assets and liabilities denominated in a foreign currency are recognised as exchange gains or losses in profit or loss.
The official exchange rates of the US dollar (USD) and euro (EUR) against the Russian rouble (RR), as set by the Central Bank of Russia, are as follows:
EUR/RR USD/RR As at 31.12.2013 44.9699 32.7292 2013 weighted average 42.3129 31.8480 As at 31.12.2014 68.3427 56.2584 2014 weighted average 50.8150 38.4217
Segment reporting. Segments are reported in a manner consistent with the internal reporting as provided to the Group’s chief operating decision maker. Segments with revenue, operating profit or assets that represent ten percent or more of all segments are reported separately.
3 CRITICAL ACCOUNTING ESTIMATES AND JUDGEMENTS IN APPLYING ACCOUNTING POLICIES
The Group formulates estimates and assumptions that affect the reported amounts of assets and liabilities in future financial reporting periods. Estimates and judgements are continually evaluated and are based on management’s experience and other factors, such as forecasts of future events that are considered to be reasonable under the given circumstances.
Management also makes certain judgements, in addition to those involving estimates, when it applies its accounting policies. Judgements that have the most significant effect on the amounts recognised in the financial information and estimates that can cause a significant adjustment to the carrying amount of assets and liabilities in future financial reporting periods are as follows:
Tax legislation. Russian tax, currency and customs legislation is subject to varying interpretations (see Note 35).
Deferred income tax asset recognition. The deferred tax asset represents income taxes recoverable through future deductions from taxable profits and is recorded in the statement of financial position. Deferred income tax assets are recorded to the extent that the application of the related tax benefit is probable. When determining future taxable profits and the amount of tax benefits available to certain Group entities, the management makes judgements and applies estimates based on recent taxable profits and expectations of future income that are believed to be reasonable under the circumstances.
Useful lives of property, plant and equipment. Property, plant and equipment items are stated net of accumulated depreciation. Estimating the useful life of a property, plant and equipment item is a matter of management judgement and is based on experience with similar assets. When determining the useful life of an asset, the management considers the expected usage, estimated technical obsolescence, residual value, physical wear and tear, and the environment in which the asset is operated. Differences between such estimates and actual results may result in losses in future periods, and changes in any of these conditions or estimates may result in adjustments to future depreciation rates.

PAO SIBUR HOLDING NOTES TO THE IFRS CONSOLIDATED FINANCIAL STATEMENTS (In millions of Russian roubles, unless otherwise stated)
192
3 CRITICAL ACCOUNTING ESTIMATES AND JUDGEMENTS IN APPLYING ACCOUNTING POLICIES (CONTINUED)
Estimated impairment of goodwill. The Group tests whether goodwill has suffered any impairment on an annual basis. The recoverable amounts of cash-generating units are the higher of their fair value less costs to sell and their value-in-use calculations. These calculations require the use of estimates (see Note 7).
Estimated impairment of property, plant and equipment and intangible assets excluding goodwill. Property, plant and equipment and intangible assets excluding goodwill are reviewed for impairment whenever events or changes in circumstances indicate that the carrying amount may not be recoverable. For the purposes of assessing impairment, assets are grouped at the lowest levels for which there are separately identifiable cash flows (cash-generating units or CGU). The recoverable amount of a CGU is the higher of its fair value less costs to sell and its value-in-use calculations, which require the estimation of discounted cash flows. The estimation of cash flows and assumptions consider all information available at the year-end on the future development of the operating business and may deviate from actual future developments. An impairment charge is the difference between the carrying amount and the recoverable CGU amount.
Equity-settled share-based payment plans for directors and key management. The Group’s management applied estimates and judgments in its financial statements with respect to equity-settled share-based payment plans for the Group’s directors and key management (see Note 34).
The equity-settled share awards under the plans were measured at the fair value for the underlying shares as calculated at the grant date using a valuation model.
Grants and subsidies. As a major investor in infrastructure and social projects in the regions where it operates, the Group has signed cooperation agreements with several regional authorities, including investment and financial support agreements, under which the Group is entitled to a partial refund of capital expenditures incurred in the respective regions subject to certain conditions set for the period up to 2018 inclusive, including amounts of regional investments in business and social infrastructure, local income taxes paid, and number of jobs created and safeguarded. Such reimbursements are made after supporting documents have been submitted to the relevant authority either in the form of an income tax rebate or a direct grant of public funds. Quarterly, at each reporting date, management assesses whether there is a reasonable assurance that the Group is able to comply with the required conditions. The management believes that the Company will be able to comply with the conditions stipulated by the agreements.
Operating leases: The Group has a number of contracts with third parties for the rental of tank wagons (railway cars) with terms of 5-10 years each. At their inception minimum lease payments for some of the contracts were close to the market value of the wagons. At the same time this situation resulted from a shortage of rail cars on the market and the strong negotiating position of service providers. Based on that, and on the fact that the rewards are not substantially transferred to the Company because at the end of the lease period cars will be capable of generating significant cash flow (even if they are subsequently sold or rented at significant discounts), the rented cars are presented as an operating lease in the financial statements.
In 2012, the Group entered into arrangements with the shipping companies Sovcomflot and Navigator for freight of four vessels with terms of 15 and 10 years, respectively. At the inception date, the minimum lease payments for contracts were 80-85 percent of the value of the vessels and the economic useful life amounted to approximately 30 years. Based on that, and on the fact that the rewards are not substantially transferred to the Company because at the end of the lease period vessels will be capable for generating significant cash flow, the rented vessels are presented as an operating lease in these consolidated financial statements.

PAO SIBUR HOLDING NOTES TO THE IFRS CONSOLIDATED FINANCIAL STATEMENTS (In millions of Russian roubles, unless otherwise stated)
193
4 ACQUISITION AND DECONSOLIDATION OF SUBSIDIARIES
OOO Yugragazpererabotka
In 2007, SIBUR and the TNK-BP Group, which was subsequently acquired by the Rosneft Group, established a joint venture, OOO Yugragazpererabotka, in which SIBUR owned a 51 percent stake, while TNK-BP’s stake was 49 percent. In March 2013, the Group and the TNK-BP Group signed several agreements regarding their joint venture OOO Yugragazpererabotka. Under these agreements, the duration of the joint venture arrangement, which was previously set to expire in 2016, has become indefinite and the call options that had entitled the Group to purchase TNK-BP’s stake in OOO Yugragazpererabotka have been terminated. Therefore, since 12 March 2013, the Group has started accounting for its investment in OOO Yugragazpererabotka in accordance with IFRS 11, Joint Arrangements, as a joint venture in its financial statements as opposed to the previously used approach, wherein OOO Yugragazpererabotka had been consolidated as a wholly owned subsidiary of the Group and TNK-BP’s contribution was accounted for as interest-bearing long-term loans.
The carrying amounts of assets and liabilities at the deconsolidation date are summarised in the table below:
Carrying amounts as of 31 March 2013
Property, plant and equipment 7,688 Deferred income tax assets 92 Inventories 558 Cash and cash equivalents 1 Trade and other receivables 1,262 Other assets 407 Short-term and long-term debt (2,602) Trade and other payables (1,800) Deferred income tax liabilities (288) Other liabilities (142) Net assets deconsolidated 5,176
The post-tax gain recognised upon the deconsolidation of OOO Yugragazpererabotka, and included as a gain on deconsolidation of a subsidiary in the consolidated statement of profit or loss, was calculated as follows:
Income from derecognition of the Rosneft Group’s (formerly TNK-BP’s) stake previously recognised as long-term debt 4,949 Share of net assets recognised as an investment in a joint venture (based on net assets of RR 5,176 and 51 percent ownership) 2,640 Total income from deconsolidation of subsidiary 7,589 Less: Net assets deconsolidated (5,176) Post-tax gain on deconsolidation of subsidiary 2,413
On 6 March 2014, the Group acquired the remaining 49 percent stake in OOO Yugragazpererabotka from the Rosneft Group (formerly the TNK-BP Group) for a cash consideration of RR 55,733 (equivalent to USD 1,567 million). As a result, the Group has acquired control over OOO Yugragazpererabotka and its production subsidiaries.
In March 2014, under the terms of the share purchase agreement, the Group paid RR 20,547 (equivalent to USD 567 million). In January 2015 the Group paid a further RR 32,797 (equivalent to USD 500 million). The remaining amount, which is equivalent to USD 500 million, is payable in April 2015.

PAO SIBUR HOLDING NOTES TO THE IFRS CONSOLIDATED FINANCIAL STATEMENTS (In millions of Russian roubles, unless otherwise stated)
194
4 ACQUISITION AND DECONSOLIDATION OF SUBSIDIARIES (CONTINUED)
In addition to the share purchase agreement, the Group and the Rosneft Group have agreed to increase guaranteed supplies of associated petroleum gas from the Rosneft Group’s oil fields to OOO Yugragazpererabotka's processing facilities to the level of 10 billion cubic metres per annum for the period through 2032. Furthermore, the parties agreed that the Group will sell to the Rosneft Group all dry gas produced at the Nizhnevartovskiy, Belozerniy and Nyagan gas processing plants from associate petroleum gas received from the Rosneft Group. Accordingly, the gas processing arrangement between OOO Yugragazpererabotka and the Rosneft Group that had been in effect before 6 March 2014 was cancelled. As a result, the Group recognised intangible assets related to the relevant associated petroleum gas supply contracts of RR 115,816.
The fair values of assets and liabilities at the acquisition date are summarised in the table below:
Fair values Property, plant and equipment (see Note 6) 23,934 Deferred income tax assets 577 Intangible assets (see Note 7) 115,816 Other non-current assets 41 Inventories 440 Trade and other receivables 1,837 Prepayments and other current assets 769 Cash and cash equivalents 1 Short-term and long-term debt (2,559) Deferred income tax liabilities (26,096) Trade and other payables (5,808) Other current liabilities (271)
Net assets of the acquired subsidiary 108,681 Less: Fair value of interest previously held 55,427 Total purchase consideration 55,733
Goodwill arising on acquisition 2,479
As of the acquisition date, the Group remeasured its previously held interest in OOO Yugragazpererabotka at fair value. As a result, a RR 52,773 gain was recognised in the consolidated statement of profit and loss.
The acquired subsidiary contributed RR 524 in revenue and RR 9 in loss to the Group for the period from the acquisition date until 31 December 2014. If the acquisition had occurred on 1 January 2014, Group revenue and profit for the year ended 31 December 2014 would have been RR 361,922 and RR 25,339, respectively.
The Group’s management believes that the acquired goodwill of RR 2,479 mainly represents expected cost savings and utilisation of the Group’s feedstock advantage.
Total purchase consideration 55,733 Less: Cash and cash equivalents of acquired subsidiary (1) Payables for acquisition of subsidiary (35,185)
Outflow of cash and cash equivalents on acquisition 20,547
Transactions during the period until the consolidation date with OOO Yugragazpererabotka are disclosed in Note 34.
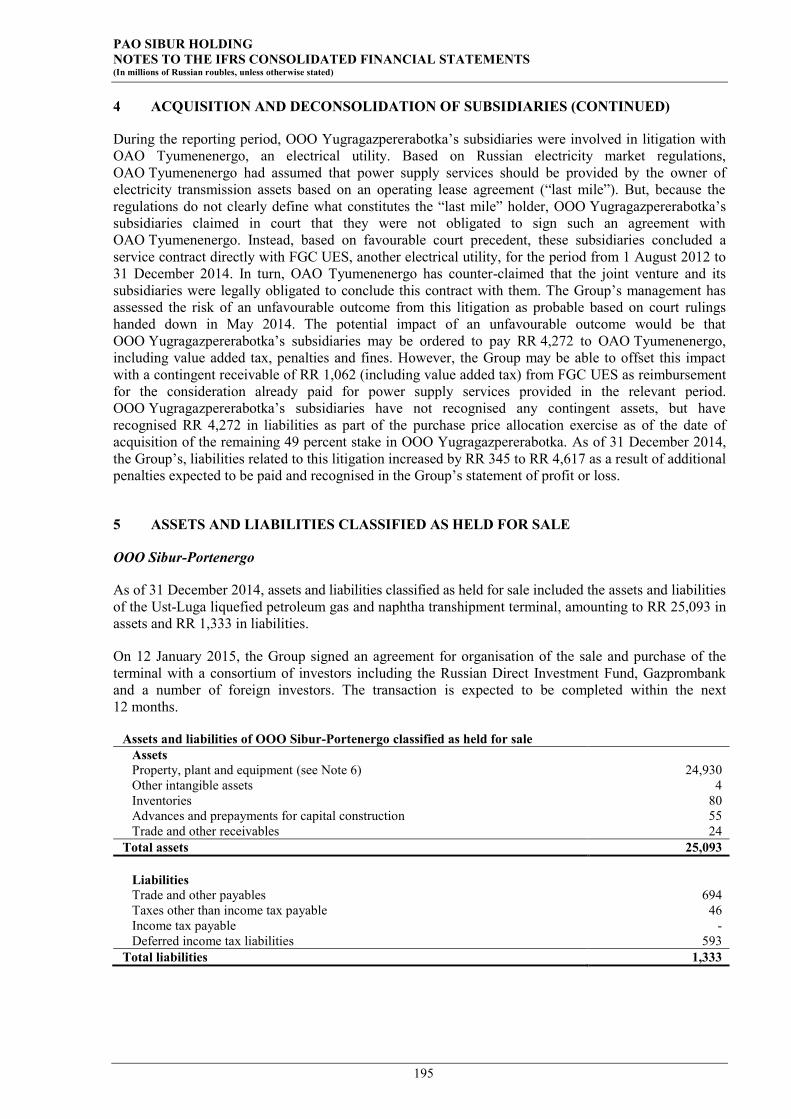
PAO SIBUR HOLDING NOTES TO THE IFRS CONSOLIDATED FINANCIAL STATEMENTS (In millions of Russian roubles, unless otherwise stated)
195
4 ACQUISITION AND DECONSOLIDATION OF SUBSIDIARIES (CONTINUED)
During the reporting period, OOO Yugragazpererabotka’s subsidiaries were involved in litigation with OAO Tyumenenergo, an electrical utility. Based on Russian electricity market regulations, OAO Tyumenenergo had assumed that power supply services should be provided by the owner of electricity transmission assets based on an operating lease agreement (“last mile”). But, because the regulations do not clearly define what constitutes the “last mile” holder, OOO Yugragazpererabotka’s subsidiaries claimed in court that they were not obligated to sign such an agreement with OAO Tyumenenergo. Instead, based on favourable court precedent, these subsidiaries concluded a service contract directly with FGC UES, another electrical utility, for the period from 1 August 2012 to 31 December 2014. In turn, OAO Tyumenenergo has counter-claimed that the joint venture and its subsidiaries were legally obligated to conclude this contract with them. The Group’s management has assessed the risk of an unfavourable outcome from this litigation as probable based on court rulings handed down in May 2014. The potential impact of an unfavourable outcome would be that OOO Yugragazpererabotka’s subsidiaries may be ordered to pay RR 4,272 to OAO Tyumenenergo, including value added tax, penalties and fines. However, the Group may be able to offset this impact with a contingent receivable of RR 1,062 (including value added tax) from FGC UES as reimbursement for the consideration already paid for power supply services provided in the relevant period. OOO Yugragazpererabotka’s subsidiaries have not recognised any contingent assets, but have recognised RR 4,272 in liabilities as part of the purchase price allocation exercise as of the date of acquisition of the remaining 49 percent stake in OOO Yugragazpererabotka. As of 31 December 2014, the Group’s, liabilities related to this litigation increased by RR 345 to RR 4,617 as a result of additional penalties expected to be paid and recognised in the Group’s statement of profit or loss.
5 ASSETS AND LIABILITIES CLASSIFIED AS HELD FOR SALE
OOO Sibur-Portenergo
As of 31 December 2014, assets and liabilities classified as held for sale included the assets and liabilities of the Ust-Luga liquefied petroleum gas and naphtha transhipment terminal, amounting to RR 25,093 in assets and RR 1,333 in liabilities.
On 12 January 2015, the Group signed an agreement for organisation of the sale and purchase of the terminal with a consortium of investors including the Russian Direct Investment Fund, Gazprombank and a number of foreign investors. The transaction is expected to be completed within the next 12 months.
Assets and liabilities of OOO Sibur-Portenergo classified as held for sale Assets Property, plant and equipment (see Note 6) 24,930 Other intangible assets 4 Inventories 80 Advances and prepayments for capital construction 55 Trade and other receivables 24
Total assets 25,093
Liabilities Trade and other payables 694 Taxes other than income tax payable 46 Income tax payable - Deferred income tax liabilities 593
Total liabilities 1,333

PAO SIBUR HOLDING NOTES TO THE IFRS CONSOLIDATED FINANCIAL STATEMENTS (In millions of Russian roubles, unless otherwise stated)
196
5 ASSETS AND LIABILITIES CLASSIFIED AS HELD FOR SALE (CONTINUED)
OOO ITSK
As of 31 December 2014, assets classified as held for sale included an investment of RR 795 in OOO ITSK, a joint venture of the Group. The Group expects to withdraw from OOO ITSK before 31 March 2015 and receive a cash consideration of RR 795.
ZAO Spetstransoperator
As of 31 December 2013, assets and liabilities classified as held for sale included part of the Group’s rail car fleet worth RR 5,715. Due to market conditions in the last quarter of 2014, the potential buyer made a decision to withdraw from the deal for purchase and sale of the rail car fleet. As a result, as of 31 December 2014 related assets and liabilities ceased to be classified as held for sale. Depreciation of the rail car fleet of RR 339 for the period in which it was classified as held for sale has been charged to profit and loss in these consolidated financial statements.
OAO OKA-Polimer
As of 31 December 2013, the Group classified RR 170 of property, plant and equipment related to OAO OKA-Polimer as assets held for sale. In January 2014, the Group sold a 100 percent stake in OAO OKA-Polimer.
Results of the companies mentioned above are reported in the ‘Unallocated’ segment (see Note 32).

PAO SIBUR HOLDING NOTES TO THE IFRS CONSOLIDATED FINANCIAL STATEMENTS (In millions of Russian roubles, unless otherwise stated)
197
6 PROPERTY, PLANT AND EQUIPMENT Movements in the net book value of property, plant and equipment were as follows:
Buil-dings Facilities
Machinery and
equipment Trans-
port
Assets under
construc-tion Other Total
Net book value as of 31 December 2012 23,529 43,191 37,989 8,109 90,341 4,496 207,655
Depreciation charge (872) (4,028) (7,539) (679) - (949) (14,067) Additions 77 25 25 7 105,903 1,310 107,347 Reclassification to assets held for sale (see Note 5) (124) (1,951) (12) (5,719) - - (7,806) Disposal of subsidiaries (1,395) (3,076) (3,063) (1) (421) (149) (8,105) Reclassifications 47 (1,786) 1,739 - - - - Transfers 7,788 38,450 61,681 234 (108,367) 214 - Disposals (137) (31) (107) (238) (1,399) (27) (1,939) Impairment - (2) - (1) (884) - (887) Historical cost as of 31 December 2013 35,337 85,793 116,385 3,155 85,173 6,144 331,987 Accumulated depreciation (6,424) (15,001) (25,672) (1,443) - (1,249) (49,789)
Net book value as of 31 December 2013 28,913 70,792 90,713 1,712 85,173 4,895 282,198
Depreciation charge (1,672) (7,859) (12,362) (605) - (494) (22,992) Additions - - - - 54,639 1,057 55,696 Acquisition of subsidiary (see Note 4) 4,693 16,438 2,192 3 482 126 23,934 Transfers 7,713 70,121 28,154 295 (106,499) 216 - Disposals (296) (278) (468) (45) (494) (39) (1,620) Impairment - - - - (120) - (120) Reclassification to assets held for sale (see Note 5) (2,282) (12,461) (10,055) - (127) (5) (24,930) Reclassification from assets held for sale (see Note 5) - - - 5,715 - - 5,715 Reclassifications to intangible assets - - - - (698) - (698) Historical cost as of 31 December 2014 44,860 159,667 134,913 10,766 32,356 7,453 390,015 Accumulated depreciation (7,791) (22,914) (36,739) (3,691) - (1,697) (72,832)
Net book value as of 31 December 2014 37,069 136,753 98,174 7,075 32,356 5,756 317,183
Transfers for the year ended 31 December 2014 include the construction of a natural gas liquids pipeline connecting the Purovsky Gas Condensate Plant, the Yuzhno-Balykskaya Main Pumping Station and the Tobolsk production site in the Tyumen Region, a second gas fractionation facility at Tobolsk-Neftekhim and the reconstruction of an ethylene oxide production facility in Dzerzhinsk, Nizhny Novgorod Region.
For 2014 and 2013, the Group capitalised borrowing costs of RR 5,226 and RR 6,019, respectively. Borrowing costs included foreign exchange losses from financing activities in the amount of RR 2,224 and RR 2,856 for the year ended 31 December 2014 and 31 December 2013, respectively. The capitalisation rates, excluding the effects of capitalised foreign exchange losses from financing activities, were 3.66 percent and 3.31 percent, respectively.
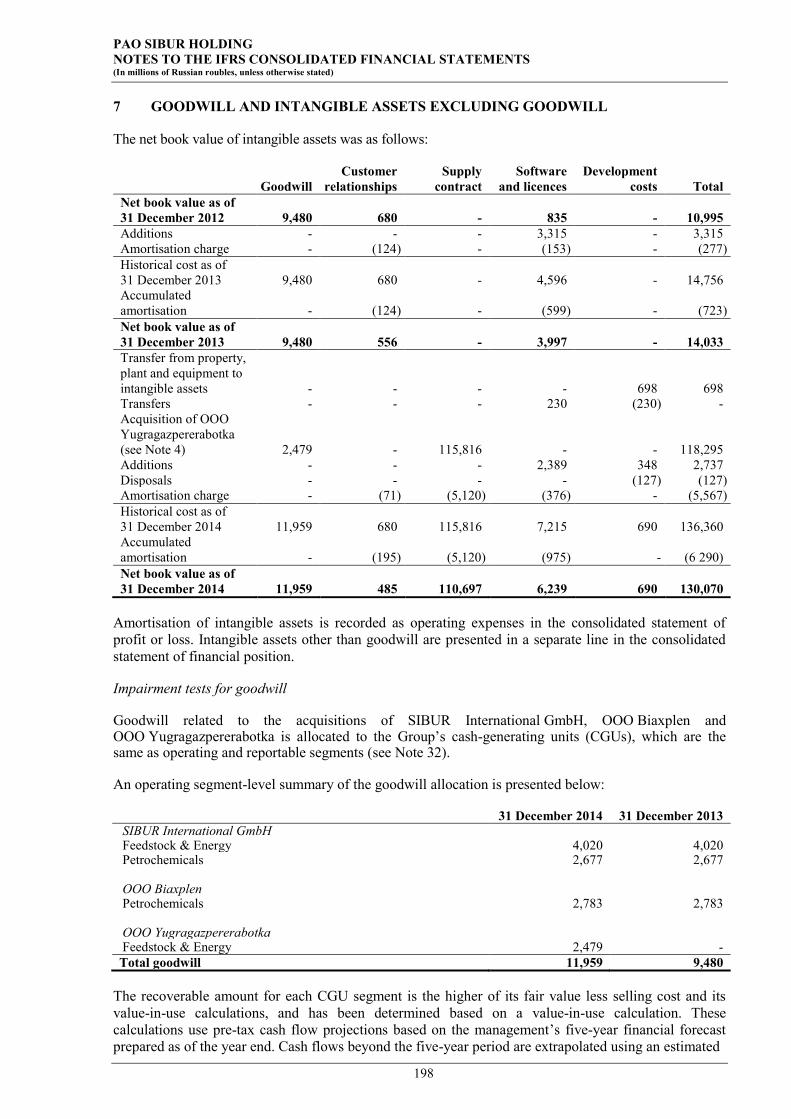
PAO SIBUR HOLDING NOTES TO THE IFRS CONSOLIDATED FINANCIAL STATEMENTS (In millions of Russian roubles, unless otherwise stated)
198
7 GOODWILL AND INTANGIBLE ASSETS EXCLUDING GOODWILL
The net book value of intangible assets was as follows:
Goodwill Customer
relationships Supply
contract Software
and licences Development
costs Total Net book value as of 31 December 2012 9,480 680 - 835 - 10,995 Additions - - - 3,315 - 3,315 Amortisation charge - (124) - (153) - (277) Historical cost as of 31 December 2013 9,480 680 - 4,596 - 14,756 Accumulated amortisation - (124) - (599) - (723) Net book value as of 31 December 2013 9,480 556 - 3,997 - 14,033 Transfer from property, plant and equipment to intangible assets - - - - 698 698 Transfers - - - 230 (230) - Acquisition of OOO Yugragazpererabotka (see Note 4) 2,479 - 115,816 - - 118,295 Additions - - - 2,389 348 2,737 Disposals - - - - (127) (127) Amortisation charge - (71) (5,120) (376) - (5,567) Historical cost as of 31 December 2014 11,959 680 115,816 7,215 690 136,360 Accumulated amortisation - (195) (5,120) (975) - (6 290) Net book value as of 31 December 2014 11,959 485 110,697 6,239 690 130,070
Amortisation of intangible assets is recorded as operating expenses in the consolidated statement of profit or loss. Intangible assets other than goodwill are presented in a separate line in the consolidated statement of financial position.
Impairment tests for goodwill
Goodwill related to the acquisitions of SIBUR International GmbH, OOO Biaxplen and OOO Yugragazpererabotka is allocated to the Group’s cash-generating units (CGUs), which are the same as operating and reportable segments (see Note 32).
An operating segment-level summary of the goodwill allocation is presented below:
31 December 2014 31 December 2013 SIBUR International GmbH Feedstock & Energy 4,020 4,020 Petrochemicals 2,677 2,677
OOO Biaxplen Petrochemicals 2,783 2,783
OOO Yugragazpererabotka Feedstock & Energy 2,479 - Total goodwill 11,959 9,480
The recoverable amount for each CGU segment is the higher of its fair value less selling cost and its value-in-use calculations, and has been determined based on a value-in-use calculation. These calculations use pre-tax cash flow projections based on the management’s five-year financial forecast prepared as of the year end. Cash flows beyond the five-year period are extrapolated using an estimated

PAO SIBUR HOLDING NOTES TO THE IFRS CONSOLIDATED FINANCIAL STATEMENTS (In millions of Russian roubles, unless otherwise stated)
199
7 GOODWILL AND INTANGIBLE ASSETS EXCLUDING GOODWILL (CONTINUED)
growth rate of three percent. The growth rate does not exceed the long-term average growth rate for the business in which the CGUs operate. The following key assumptions are used in the value-in-use calculation: a discount rate of 17.9 percent, an exchange rate of RR 55 to USD 1, an oil price of USD 70 per bbl, and a Consumer Price Index of 5.0-16.9 percent. The discount rates used are pre-tax and reflect specific risks relating to the CGUs’ operating activity. Management intends to reassess its five-year financial forecast during 2015, after the current uncertainty and volatility in the Russian economy ease and oil prices and the exchange rate of RR to USD stabilise.
8 INVESTMENTS IN JOINT VENTURES AND ASSOCIATES
31 December 2014 31 December 2013 OOO RusVinyl 17,623 16,990 OOO Yuzhno-Priobsky GPZ 4,806 1,955 OOO NPP Neftekhimia 3,593 3,743 ZAO Sibgazpolimer 557 1,416 OOO ITSK - 586 Reliance Sibur Elastomers Private Limited 181 175 ООО SNHK 1 1 OOO Yugragazpererabotka (see Note 4) - 2,655 Total investments in joint ventures and associates 26,761 27,521
The table below summarises the movements in the carrying amount of the Group’s investment in associates and joint ventures all of which are unlisted.
2014 2013
Associates Joint
Ventures Associates Joint
Ventures Investments in joint ventures and associates as of the beginning of the year 175 27,346 169 17,519
Share of profit of associates and joint ventures 6 (3,833) 6 788 Additions - 7,623 - 9,639 Transfer of joint ventures and associates to subsidiaries - (2,792) - - Transfer to assets held for sale - (795) - - Dividends received from associates and joint ventures - (969) - (600)
Investments in joint ventures and associates as of the end of the year 181 26,580 175 27,346
In 2014 and 2013, the Group received dividends from OOO NPP Neftekhimia of RR 969 and RR 600, respectively.
All individually material associates and joint ventures are private companies and, thus, there are no quoted prices for their shares. All of these entities have share capital consisting solely of ordinary shares, which is held directly by the Group.
The nature of the Group’s relationship with and the financial information of each individually material associate and joint venture are described and provided below.
OOO RusVinyl. In June 2007, the Group formed a joint venture, OOO RusVinyl, with SolVin Holding Nederland B.V. (which is ultimately controlled by Solvay SA) for the construction of a polyvinyl chloride production complex in the Nizhny Novgorod Region. During the year ended 31 December 2014, the Group and SolVin Holding Nederland B.V. each additionally contributed RR 4,750 to the share capital of OOO RusVinyl; the Group’s ownership share remained unchanged. In September 2014, OOO RusVinyl was put in operation.
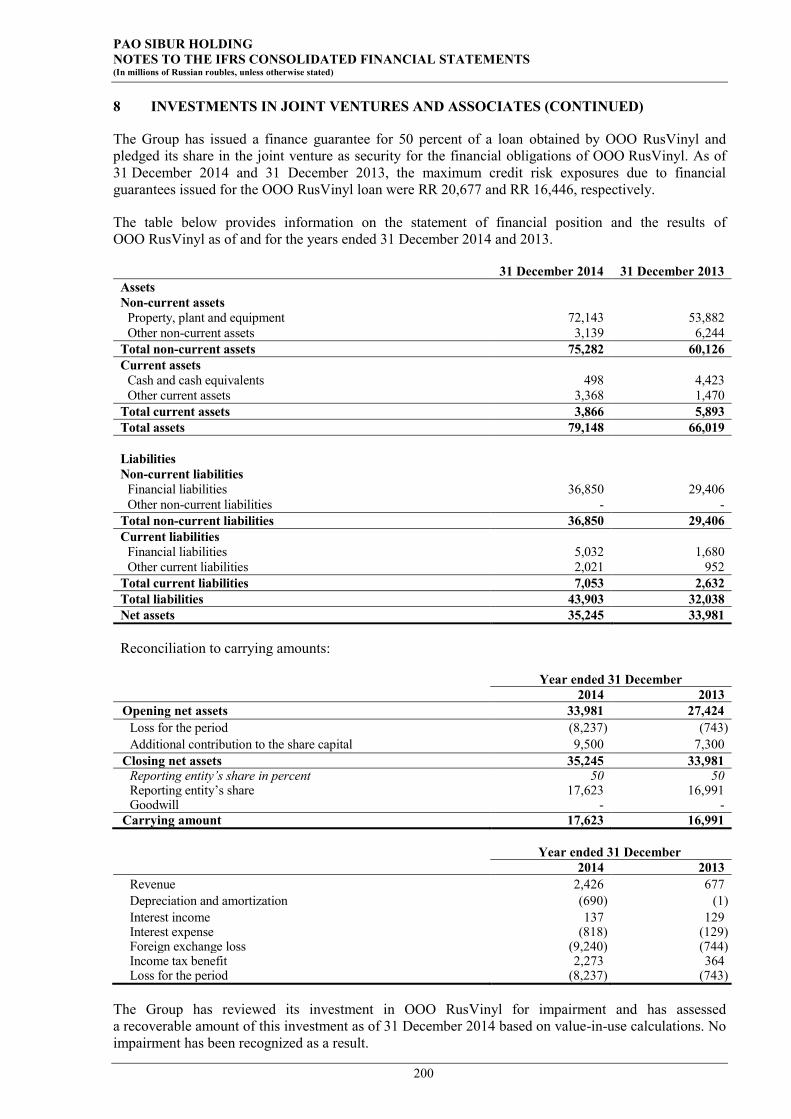
PAO SIBUR HOLDING NOTES TO THE IFRS CONSOLIDATED FINANCIAL STATEMENTS (In millions of Russian roubles, unless otherwise stated)
200
8 INVESTMENTS IN JOINT VENTURES AND ASSOCIATES (CONTINUED)
The Group has issued a finance guarantee for 50 percent of a loan obtained by OOO RusVinyl and pledged its share in the joint venture as security for the financial obligations of OOO RusVinyl. As of 31 December 2014 and 31 December 2013, the maximum credit risk exposures due to financial guarantees issued for the OOO RusVinyl loan were RR 20,677 and RR 16,446, respectively.
The table below provides information on the statement of financial position and the results of OOO RusVinyl as of and for the years ended 31 December 2014 and 2013.
31 December 2014 31 December 2013 Assets Non-current assets
Property, plant and equipment 72,143 53,882 Other non-current assets 3,139 6,244
Total non-current assets 75,282 60,126 Current assets
Cash and cash equivalents 498 4,423 Other current assets 3,368 1,470
Total current assets 3,866 5,893 Total assets 79,148 66,019
Liabilities Non-current liabilities
Financial liabilities 36,850 29,406 Other non-current liabilities - -
Total non-current liabilities 36,850 29,406 Current liabilities
Financial liabilities 5,032 1,680 Other current liabilities 2,021 952
Total current liabilities 7,053 2,632 Total liabilities 43,903 32,038 Net assets 35,245 33,981
Reconciliation to carrying amounts:
Year ended 31 December 2014 2013
Opening net assets 33,981 27,424 Loss for the period (8,237) (743) Additional contribution to the share capital 9,500 7,300
Closing net assets 35,245 33,981 Reporting entity’s share in percent 50 50 Reporting entity’s share 17,623 16,991 Goodwill - -
Carrying amount 17,623 16,991
Year ended 31 December 2014 2013
Revenue 2,426 677 Depreciation and amortization (690) (1) Interest income 137 129 Interest expense (818) (129) Foreign exchange loss (9,240) (744) Income tax benefit 2,273 364 Loss for the period (8,237) (743)
The Group has reviewed its investment in OOO RusVinyl for impairment and has assessed a recoverable amount of this investment as of 31 December 2014 based on value-in-use calculations. No impairment has been recognized as a result.

PAO SIBUR HOLDING NOTES TO THE IFRS CONSOLIDATED FINANCIAL STATEMENTS (In millions of Russian roubles, unless otherwise stated)
201
8 INVESTMENTS IN JOINT VENTURES AND ASSOCIATES (CONTINUED)
ZAO Sibgazpolimer. In 2013, the Group established a joint venture, ZAO Sibgazpolimer, with Gazprom Neft Group to invest in OOO Poliom, an independent producer of polypropylene located in the Omsk Region.
In May 2014, ZAO Sibgazpolimer acquired a 50 percent stake in OOO Poliom from Titan Group for a cash consideration of RR 2,297, and a contingent consideration of RR 2,131. Also, ZAO Sibgazpolimer acquired accounts receivable from OOO Poliom, with a nominal value of RR 1,344 and a fair value of RR 888, from Titan Group.
The contingent consideration as of the transaction date included a working capital price adjustment of RR 281 and production capacity price adjustment of RR 1,850. The production capacity price adjustment related to the increase in production capacity at OOO Poliom’s polypropylene plant from 180,000 to 210,000 tonnes. The working capital adjustment was paid to Titan Group in September 2014. As of October 2014, after the polypropylene plant had passed the capacity test, the contingent consideration was fully paid to Titan Group.
The table below provides information on the fair values of OOO Poliom’s assets and liabilities as of the transaction date:
Fair values Property, plant and equipment 10,572 Deferred income tax assets 352 Other non-current assets 264 Inventories 711 Trade and other receivables 271 Prepayments and other current assets 263 Cash and cash equivalents 34 Short-term and long-term debt (12,305) Deferred income tax liabilities (702) Trade and other payables (2,512) Other current liabilities (11)
Net liability of OOO Poliom (3,063) ZAO Sibgazpolimer’s share in percent 50 ZAO Sibgazpolimer’s share in net liability of OOO Poliom (1,532) Goodwill 5,960
ZAO Sibgazpolimer’s investment in OOO Poliom as of the transaction date 4,428
The table below provides a reconciliation of ZAO Sibgazpolimer’s investment in OOO Poliom as of 31 December 2014:
ZAO Sibgazpolimer’s investment in OOO Poliom as of the transaction date 4,428 ZAO Sibgazpolimer’s share in OOO Poliom’s loss from the transaction date to 31 December 2014, including share in foreign exchange loss of RR 2,538 (1,339)
ZAO Sibgazpolimer’s investment in OOO Poliom as of 31 December 2014 3,089
The table below provides information on the carrying values of ZAO Sibgazpolimer’s assets and liabilities as of 31 December 2014:
Carrying values Investment in OOO Poliom 3,089 Accounts receivable from OOO Poliom 402 Other 47 Loans payable to shareholders (2,423)
Net assets of ZAO Sibgazpolimer 1,115 Reporting entity’s share in percent 50 Reporting entity’s share 557 Goodwill -
Carrying amount 557

PAO SIBUR HOLDING NOTES TO THE IFRS CONSOLIDATED FINANCIAL STATEMENTS (In millions of Russian roubles, unless otherwise stated)
202
8 INVESTMENTS IN JOINT VENTURES AND ASSOCIATES (CONTINUED)
OOO Yuzhno-Priobsky GPZ. In the year 2007 the Group and Gazprom Neft Group established a 50/50 joint venture in Khanty-Mansiisk region to construct a gas processing plant based on the Yuzhno-Priobskaya compressor station.
In September 2014 Gazprom Neft Group made an additional contribution to the joint venture share capital of RR 4,800. According to the shareholders’ agreement, both shareholders are obliged to finance the joint venture on a parity basis. Thus, the contribution made by Gazprom Neft Group requires the Group to provide equivalent funding to the joint venture or compensate Gazprom Neft Group for 50 percent of the contribution made. As a result, the Group recognized a liability for contribution to the share capital of OOO Yuzhno-Priobsky GPZ in the amount of RR 2,400 (see Note 18) with a corresponding increase in Investments in joint ventures and associates.
Simultaneously, the Group paid RR 2,053 in cash to Gaprom Neft Group which was recognized as loan receivable as of 31 December 2014 (see Note 10). The remaining amount should be paid to Gazprom Neft Group in 2015.
Following the contribution made by Gazprom Neft Group, the Group’s nominal ownership in the joint venture temporarily decreased to 27.3 percent. The Group has to settle the liability for making a contribution to the share capital of OOO Yuzhno-Priobsky GPZ no later than 1 July 2016, or upon the completion of the investment project if earlier than that date. At the same time, Gazprom Neft Group will also settle the loan receivable. According to the agreement with Gazprom Neft Group the Group’s share in the joint venture will be increased back to 50 percent upon the transfer of a portion of shares currently owned by Gazprom Neft Group.
According to the shareholders’ agreement a unanimous decision is required in order to approve key financial and operating policy decisions with respect to the joint venture business activities. The Group's economic interest in the joint venture remained unchanged and the Group continues to account for its investment in OOO Yuzhno-Priobsky GPZ as a joint venture under the equity method.
The table below provides information on the statement of financial position and the results of OOO Yuzhno-Priobsky GPZ as of and for the years ended 31 December 2014 and 2013.
31 December 2014 31 December 2013 Assets Non-current assets
Property, plant and equipment 5,914 4,849 Other non-current assets 2,361 107
Total non-current assets 8,275 4,956 Current assets
Cash and cash equivalents 1,261 5 Other current assets 763 77
Total current assets 2,024 82 Total assets 10,299 5,038
Liabilities Non-current liabilities
Financial liabilities - - Other non-current liabilities 346 104
Total non-current liabilities 346 104 Current liabilities
Financial liabilities - 858 Other current liabilities 341 166
Total current liabilities 341 1,024 Total liabilities 687 1,128 Net assets 9,612 3,910

PAO SIBUR HOLDING NOTES TO THE IFRS CONSOLIDATED FINANCIAL STATEMENTS (In millions of Russian roubles, unless otherwise stated)
203
8 INVESTMENTS IN JOINT VENTURES AND ASSOCIATES (CONTINUED)
Reconciliation to carrying amounts:
Year ended 31 December 2014 2013
Opening net assets 3,910 13 Profit/(loss) for the period 42 (3) Additional contribution to the share capital 5,660 3,900
Closing net assets 9,612 3,910 Reporting entity’s share in percent 50 50 Reporting entity’s share 4,806 1,955 Goodwill - -
Carrying amount 4,806 1,955
Year ended 31 December 2014 2013
Revenue 864 - Depreciation and amortization (599) - Interest income 63 - Interest expense (10) - Foreign exchange loss - - Income tax benefit - - Profit/(loss) for the period 42 (3)
OOO NPP Neftekhimia. In September 2010, the Group created a joint venture, OOO NPP Neftekhimia, with OAO Moskovskiy NPZ (later renamed as OAO Gazprom Neft – MNPZ), a member of the Gazprom Neft Group, in order to boost its presence in the polypropylene market. The joint venture is a polypropylene producer located in Moscow, and the Group purchases substantially all of its production volumes.
The table below provides information of the statement on financial position and the results of OOO NPP Neftekhimia as of and for the year ended 31 December 2014 and 2013.
31 December 2014 31 December 2013 Assets Non-current assets
Property, plant and equipment 1,804 1,890 Other non-current assets 66 43
Total non-current assets 1,870 1,933 Current assets
Cash and cash equivalents 74 167 Other current assets 2,394 2,603
Total current assets 2,468 2,770 Total assets 4,338 4,703
Liabilities Non-current liabilities
Other non-current liabilities 11 8 Total non-current liabilities 11 8 Current liabilities
Other current liabilities 285 352 Total current liabilities 285 352 Total liabilities 296 360 Net assets 4,042 4,343
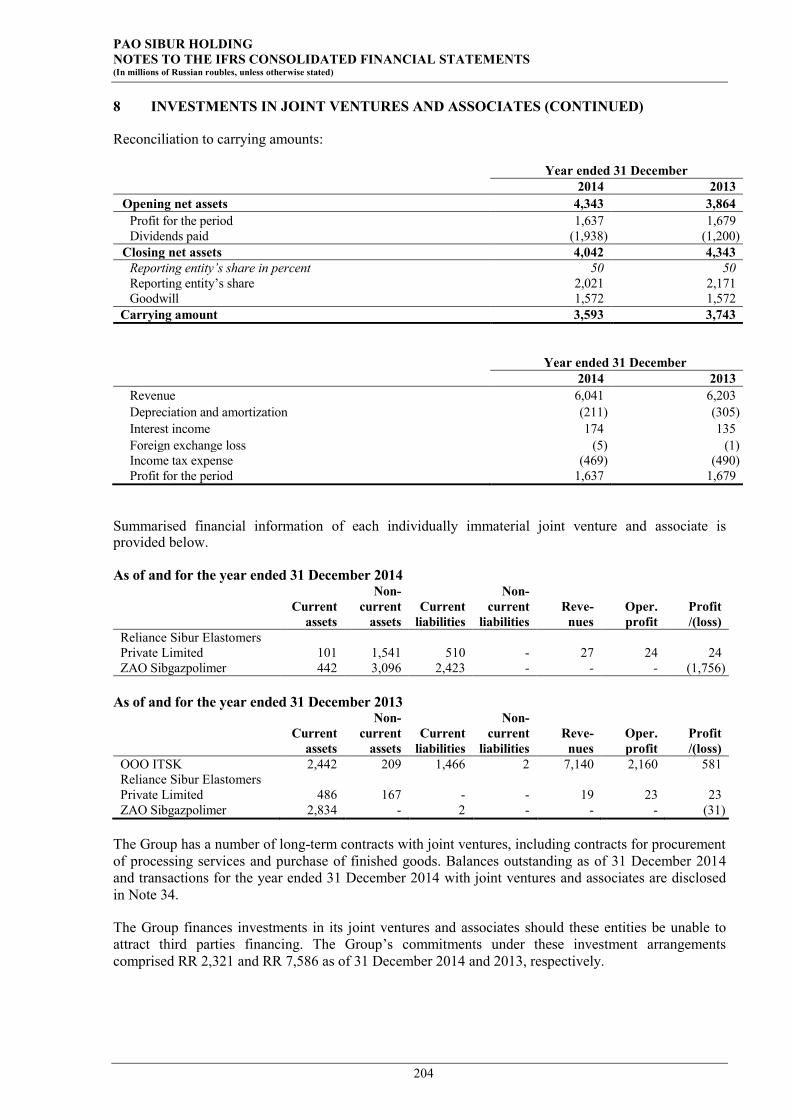
PAO SIBUR HOLDING NOTES TO THE IFRS CONSOLIDATED FINANCIAL STATEMENTS (In millions of Russian roubles, unless otherwise stated)
204
8 INVESTMENTS IN JOINT VENTURES AND ASSOCIATES (CONTINUED)
Reconciliation to carrying amounts:
Year ended 31 December 2014 2013
Opening net assets 4,343 3,864 Profit for the period 1,637 1,679 Dividends paid (1,938) (1,200)
Closing net assets 4,042 4,343 Reporting entity’s share in percent 50 50 Reporting entity’s share 2,021 2,171 Goodwill 1,572 1,572
Carrying amount 3,593 3,743
Year ended 31 December 2014 2013
Revenue 6,041 6,203 Depreciation and amortization (211) (305) Interest income 174 135 Foreign exchange loss (5) (1) Income tax expense (469) (490) Profit for the period 1,637 1,679
Summarised financial information of each individually immaterial joint venture and associate is provided below.
As of and for the year ended 31 December 2014
Current assets
Non-current
assets Current
liabilities
Non-current
liabilities Reve-
nues Oper. profit
Profit /(loss)
Reliance Sibur Elastomers Private Limited 101 1,541 510 - 27 24 24 ZAO Sibgazpolimer 442 3,096 2,423 - - - (1,756)
As of and for the year ended 31 December 2013
Current assets
Non-current
assets Current
liabilities
Non-current
liabilities Reve-
nues Oper. profit
Profit /(loss)
OOO ITSK 2,442 209 1,466 2 7,140 2,160 581 Reliance Sibur Elastomers Private Limited 486 167 - - 19 23 23 ZAO Sibgazpolimer 2,834 - 2 - - - (31)
The Group has a number of long-term contracts with joint ventures, including contracts for procurement of processing services and purchase of finished goods. Balances outstanding as of 31 December 2014 and transactions for the year ended 31 December 2014 with joint ventures and associates are disclosed in Note 34.
The Group finances investments in its joint ventures and associates should these entities be unable to attract third parties financing. The Group’s commitments under these investment arrangements comprised RR 2,321 and RR 7,586 as of 31 December 2014 and 2013, respectively.

PAO SIBUR HOLDING NOTES TO THE IFRS CONSOLIDATED FINANCIAL STATEMENTS (In millions of Russian roubles, unless otherwise stated)
205
8 INVESTMENTS IN JOINT VENTURES AND ASSOCIATES (CONTINUED)
The table below summarises information about the Group’s major investments in joint ventures and associates.
Interest held (percent) as of Country of incorporation and principal place of business Nature of operations
31 December 2014
31 December 2013
Joint ventures: OOO RusVinyl* Russia Polyvinyl chloride production 50 50 OOO NPP Neftekhimia Russia Polypropylene production 50 50 ZAO Sibgazpolimer** Russia Investments in Omsk
polypropylene plant, OOO “Poliom” (50 percent share)
50 50
OOO ITSK*** Russia IT and metrology services 50 50 OOO Yuzhno-Priobsky GPZ*
Russia Associated petroleum gas processing
27 50
OOO SNHK Russia Production of plastics and synthetic resins
50 50
OOO Yugragazpererabotka (see Notes 4, 29)
Russia Associated petroleum gas processing
- 51
Associates: Reliance Sibur Elastomers Private Limited*
India Butyl rubber production 25 25
*Investment projects**Special purpose vehicle formed for investing in production entities. ***As of 31 December 2014 classified as assets held for sale (see Note 5)
The voting and ownership percentage in joint ventures and associates are the same, except for OOO Yuzhno-Priobsky GPZ (see above).
9 ADVANCES AND PREPAYMENTS FOR CAPITAL CONSTRUCTION
The major part of the advances and prepayments as of 31 December 2014 is related to the capital construction of a ZapSibNeftekhim (ZapSib-2) project (see Note 35). Other significant advances and prepayments for capital construction were paid to the Group’s contractors for the construction of a natural gas liquids pipeline connecting the Purovsky Gas Condensate Plant (the “Purovsky Pipeline”), and expansion of APG processing facilities as of 31 December 2014, and for the Purovsky Pipeline, the Yuzhno-Balykskaya Main Pumping Station and the Tobolsk production site in the Tyumen Region, and gas infrastructure assets in the St Petersburg area as of 31 December 2013.
The Group’s most significant advances and prepayments related to capital construction projects were paid to the following contractors: Linde AG Engineering Division, Technip France, OOO Lenniihimmash, and OOO NGSK (Moscow) as of 31 December 2014 and OOO Lenniihimmash, OOO NGSK (Moscow), and ZAO Stroytransgaz as of 31 December 2013.
A large portion of the advances and prepayments made to major contractors for the provision of construction and other services and supplies has been secured by bank guarantees and letters of credit. For less significant contractors, the Group requires collateral against the advance payment made or a mix of collateral and bank guarantees from third party banks. On a regular basis, management reviews and monitors the status of work performed under each service supply agreement. Management believes that a risk of loss related to advances and prepayments made by the Group is not significant.

PAO SIBUR HOLDING NOTES TO THE IFRS CONSOLIDATED FINANCIAL STATEMENTS (In millions of Russian roubles, unless otherwise stated)
206
10 LOANS RECEIVABLE
31 December 2014 31 December 2013 Gazprom Neft Group (RR 2,053 (see Note 8) less a discount of RR 232) 1,821 - ZAO Sibgazpolimer 1,179 - OOO Yugragazpererabotka (see Note 4) - 1,288 OOO Yuzhno-Priobskiy GPZ - 414 Other 80 33
Total loans receivable 3,080 1,735 Less: non-current portion (1,835) -
1,245 1,735
The fair value of loans receivable approximates its carrying value.
11 TRADE AND OTHER RECEIVABLES
31 December 2014 31 December 2013 Trade receivables (net of impairment provisions of RR 280 and RR 199 as of 31 December 2014 and 31 December 2013, respectively) 15,776 13,552 Other receivables (net of impairment provisions of RR 534 and RR 205 as of 31 December 2014 and 31 December 2013, respectively) 1,952 1,464
Total trade and other receivables 17,728 15,016 Less non-current portion: other receivables (897) (455)
16,831 14,561
The fair value of trade receivables approximates its carrying value. As of 31 December 2014 and 2013, respectively, RR 3,103 and RR 1,841 in trade receivables were secured by collateral, mainly bank guarantees. All non-current receivables are due within five years from the end of the reporting period.
The aging analysis of receivables that are past due but not impaired is as follows:
Trade receivables Other receivables Total As of 31 December 2014 Up to three months 721 187 908 Three to twelve months 306 47 353 Total 1,027 234 1,261 As of 31 December 2013 Up to three months 266 1,157 1,423 Three to twelve months 107 - 107 Total 373 1,157 1,530
Movements in the Group’s provision for impairment of receivables are as follows:
Trade receivables Other receivables Total As of 31 December 2012 327 18 345 Written off during the year as uncollectible (123) (6) (129) Reversal as result of disposal of subsidiary (77) - (77) Unused amounts reversed (6) (3) (9) Impairment for receivables 78 196 274 As of 31 December 2013 199 205 404 Written off during the year as uncollectible (64) (9) (73) Reversal as result of disposal of subsidiary - - - Unused amounts reversed (185) (2) (187) Impairment for receivables 330 340 670 As of 31 December 2014 280 534 814

PAO SIBUR HOLDING NOTES TO THE IFRS CONSOLIDATED FINANCIAL STATEMENTS (In millions of Russian roubles, unless otherwise stated)
207
11 TRADE AND OTHER RECEIVABLES (CONTINUED)
The impairment provision was accrued on trade and other receivables that are more than 365 days past due. Accrual and release of the impairment provision have been recognised as other operating expenses in the profit and loss, except for impairment of accounts receivable that do not relate to the Group’s operating activity. Amounts charged to the allowance account are generally written off, when there is no expectation of recovering additional cash. The individually impaired receivables mainly relate to wholesalers, which are facing unexpectedly difficult economic circumstances.
12 OTHER NON-CURRENT ASSETS
31 December 2014 31 December 2013 Raw natural gas liquids in pipelines 2,182 488 Prepaid borrowing costs 156 - Advances issued 228 949 Recoverable VAT related to assets under construction 8 33 Other 203 128
Total other non-current assets 2,777 1,598
13 INVENTORIES
31 December 2014 31 December 2013 Refined products and work in progress 15,340 14,482 Materials and supplies 9,607 8,398 Goods for resale 1,173 1,560
Total inventories 26,120 24,440
As of 31 December 2014 and 31 December 2013 inventory write-downs amounted to RR 515 and RR 661, respectively. No significant reversals of previous inventory write-downs were made during the years ended 31 December 2014 and 31 December 2013.
14 PREPAYMENTS AND OTHER CURRENT ASSETS
31 December 2014 31 December 2013 Non-financial assets
Prepayments and advances to suppliers 5,989 4,103 VAT receivable 4,467 5,289 Recoverable VAT 3,365 3,295 Other prepaid taxes and custom duties 911 1,510 Recoverable excise 383 354 Prepaid borrowing costs 310 - Other current assets 259 225
Total prepayments and other current assets 15,684 14,776 Less: Non-current portion of recoverable VAT related to assets under construction (8) (33)
15,676 14,743
15 CASH AND CASH EQUIVALENTS AND RESTRICTED CASH
Cash and cash equivalents include deposits held with banks, which are readily convertible to cash and have an original maturity of less than three months, of RR 16,652 and RR 3,374 as of 31 December 2014 and 31 December 2013, respectively.
Restricted cash included OAO Vnesheconombank letters of credit worth RR 910 and RR 1,106 as of 31 December 2014 and 31 December 2013, respectively. These letters of credit were opened to finance capital expenditures for the construction of a polypropylene plant in Tobolsk, Tyumen Region.
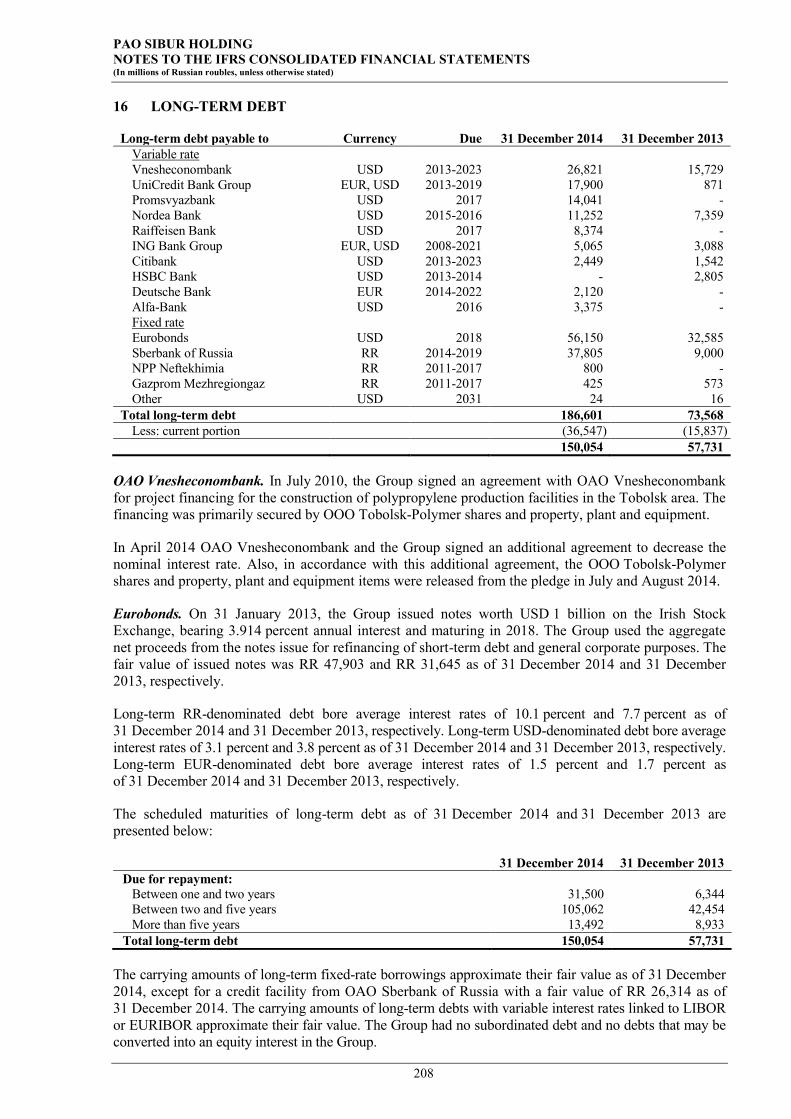
PAO SIBUR HOLDING NOTES TO THE IFRS CONSOLIDATED FINANCIAL STATEMENTS (In millions of Russian roubles, unless otherwise stated)
208
16 LONG-TERM DEBT
Long-term debt payable to Currency Due 31 December 2014 31 December 2013 Variable rate Vnesheconombank USD 2013-2023 26,821 15,729 UniCredit Bank Group EUR, USD 2013-2019 17,900 871 Promsvyazbank USD 2017 14,041 - Nordea Bank USD 2015-2016 11,252 7,359 Raiffeisen Bank USD 2017 8,374 - ING Bank Group EUR, USD 2008-2021 5,065 3,088 Citibank USD 2013-2023 2,449 1,542 HSBC Bank USD 2013-2014 - 2,805 Deutsche Bank EUR 2014-2022 2,120 - Alfa-Bank USD 2016 3,375 - Fixed rate Eurobonds USD 2018 56,150 32,585 Sberbank of Russia RR 2014-2019 37,805 9,000 NPP Neftekhimia RR 2011-2017 800 - Gazprom Mezhregiongaz RR 2011-2017 425 573 Other USD 2031 24 16
Total long-term debt 186,601 73,568 Less: current portion (36,547) (15,837)
150,054 57,731
OAO Vnesheconombank. In July 2010, the Group signed an agreement with OAO Vnesheconombank for project financing for the construction of polypropylene production facilities in the Tobolsk area. The financing was primarily secured by OOO Tobolsk-Polymer shares and property, plant and equipment.
In April 2014 OAO Vnesheconombank and the Group signed an additional agreement to decrease the nominal interest rate. Also, in accordance with this additional agreement, the OOO Tobolsk-Polymer shares and property, plant and equipment items were released from the pledge in July and August 2014.
Eurobonds. On 31 January 2013, the Group issued notes worth USD 1 billion on the Irish Stock Exchange, bearing 3.914 percent annual interest and maturing in 2018. The Group used the aggregate net proceeds from the notes issue for refinancing of short-term debt and general corporate purposes. The fair value of issued notes was RR 47,903 and RR 31,645 as of 31 December 2014 and 31 December 2013, respectively.
Long-term RR-denominated debt bore average interest rates of 10.1 percent and 7.7 percent as of 31 December 2014 and 31 December 2013, respectively. Long-term USD-denominated debt bore average interest rates of 3.1 percent and 3.8 percent as of 31 December 2014 and 31 December 2013, respectively. Long-term EUR-denominated debt bore average interest rates of 1.5 percent and 1.7 percent as of 31 December 2014 and 31 December 2013, respectively.
The scheduled maturities of long-term debt as of 31 December 2014 and 31 December 2013 are presented below:
31 December 2014 31 December 2013 Due for repayment:
Between one and two years 31,500 6,344 Between two and five years 105,062 42,454 More than five years 13,492 8,933
Total long-term debt 150,054 57,731
The carrying amounts of long-term fixed-rate borrowings approximate their fair value as of 31 December 2014, except for a credit facility from OAO Sberbank of Russia with a fair value of RR 26,314 as of 31 December 2014. The carrying amounts of long-term debts with variable interest rates linked to LIBOR or EURIBOR approximate their fair value. The Group had no subordinated debt and no debts that may be converted into an equity interest in the Group.

PAO SIBUR HOLDING NOTES TO THE IFRS CONSOLIDATED FINANCIAL STATEMENTS (In millions of Russian roubles, unless otherwise stated)
209
16 LONG-TERM DEBT (CONTINUED)
As of 31 December 2014 and 31 December 2013, the Group had the following committed long-term credit facilities:
Credit limit Undrawn amount As of 31 December 2014
EUR-denominated (in millions of EUR) - - RR-denominated (in millions of RR) 64,000 53,000
As of 31 December 2013 EUR-denominated (in millions of EUR) 81 37 RR-denominated (in millions of RR) 28,000 19,000
On 28 November 2014, the Company has entered into new five years committed credit facility of RR 42,000 with OAO Sberbank of Russia payable on 27 November 2019. As of 31 December 2014, the Company drew down RR 11,000 from this credit facility.
In December 2014 the Group signed an agreement with a consortium of European banks to raise ECA-backed long-term finance in the amount of EUR 1,575 million to cover the part of capital expenditures related to ZapSib-2 investment project. The facility will be repaid in the years 2019-2029. As of 31 December 2014 this credit facility was not yet available for drawing down and is not included in credit limits disclosed in the table above.
As of 31 December 2014 and 31 December 2013, the total rouble equivalent of the Group’s undrawn committed long-term credit facilities were RR 53,000 and RR 20,674, respectively.
17 GRANTS AND SUBSIDIES
As a major investor in infrastructure and social projects in the regions where it operates, the Group has signed cooperation agreements with a number of regional authorities, including investment and financial support agreements, under which the Group is entitled to a partial refund of capital expenditures and finance expenses incurred in the respective regions subject to certain conditions, including amounts of regional investments in business and social infrastructure and local income taxes paid. Such refunds are made after supporting documents have been submitted to the relevant authority either in the form of an income or property tax rebate or a direct grant of public funds.
2014 2013 Balance as of 1 January 34,966 31,080
Less: current portion - (578) Non-current portion of grants and subsidies as of 1 January 34,966 30,502
Grants and subsidies received 10,227 5,971 Recognised in profit or loss (depreciation) (2,046) (2,085) Recognised in profit or loss (interest expense) (400) -
Non-current portion of grants and subsidies as of 31 December 42,747 34,966
18 OTHER NON-CURRENT LIABILITIES
31 December 2014 31 December 2013 Financial liabilities
Payables for acquisition of subsidiaries and joint ventures 3,767 1,596 Accounts payable to contractors and suppliers of production licences 361 - Derivative financial instruments 229 - Promissory notes payable - 5
Total financial non-current liabilities 4,357 1,601 Non-financial liabilities
Post-employment obligations 1,722 1,741 Payables to employees 1,242 1,035 Other liabilities 57 2
Total non-financial non-current liabilities 3,021 2,778 Total other non-current liabilities 7,378 4,379
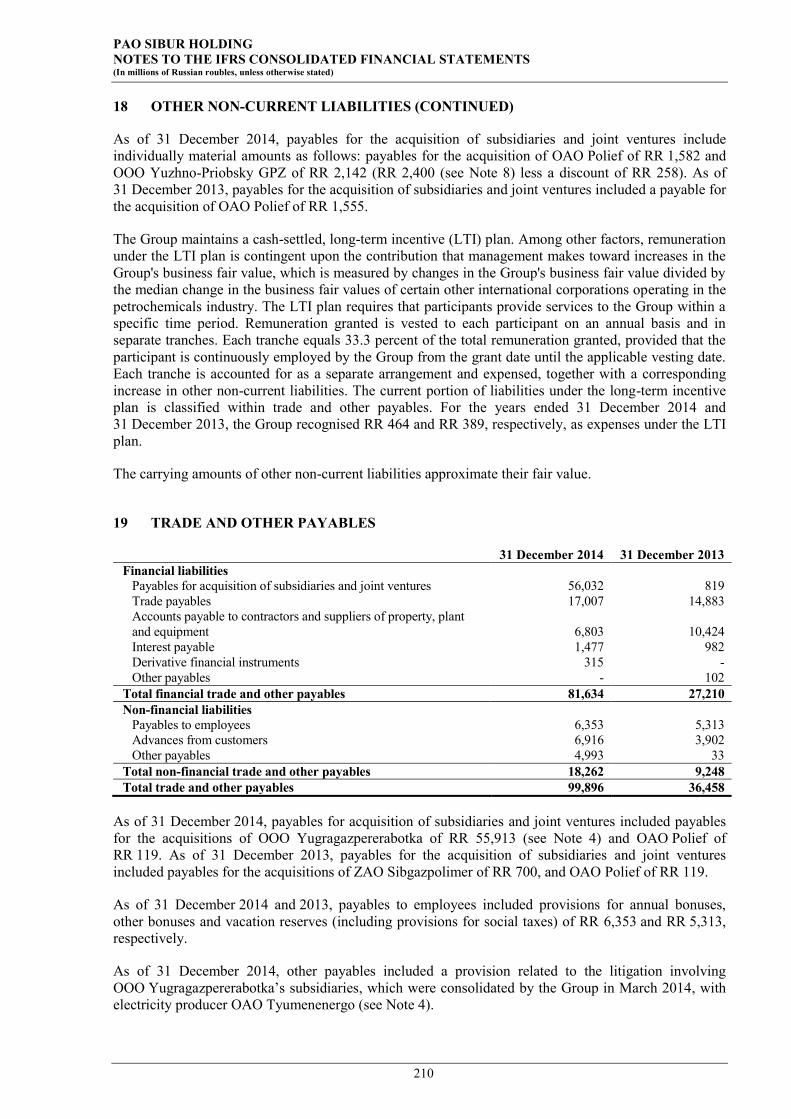
PAO SIBUR HOLDING NOTES TO THE IFRS CONSOLIDATED FINANCIAL STATEMENTS (In millions of Russian roubles, unless otherwise stated)
210
18 OTHER NON-CURRENT LIABILITIES (CONTINUED)
As of 31 December 2014, payables for the acquisition of subsidiaries and joint ventures include individually material amounts as follows: payables for the acquisition of OAO Polief of RR 1,582 and OOO Yuzhno-Priobsky GPZ of RR 2,142 (RR 2,400 (see Note 8) less a discount of RR 258). As of 31 December 2013, payables for the acquisition of subsidiaries and joint ventures included a payable for the acquisition of OAO Polief of RR 1,555.
The Group maintains a cash-settled, long-term incentive (LTI) plan. Among other factors, remuneration under the LTI plan is contingent upon the contribution that management makes toward increases in the Group's business fair value, which is measured by changes in the Group's business fair value divided by the median change in the business fair values of certain other international corporations operating in the petrochemicals industry. The LTI plan requires that participants provide services to the Group within a specific time period. Remuneration granted is vested to each participant on an annual basis and in separate tranches. Each tranche equals 33.3 percent of the total remuneration granted, provided that the participant is continuously employed by the Group from the grant date until the applicable vesting date. Each tranche is accounted for as a separate arrangement and expensed, together with a corresponding increase in other non-current liabilities. The current portion of liabilities under the long-term incentive plan is classified within trade and other payables. For the years ended 31 December 2014 and 31 December 2013, the Group recognised RR 464 and RR 389, respectively, as expenses under the LTI plan.
The carrying amounts of other non-current liabilities approximate their fair value.
19 TRADE AND OTHER PAYABLES
31 December 2014 31 December 2013 Financial liabilities
Payables for acquisition of subsidiaries and joint ventures 56,032 819 Trade payables 17,007 14,883 Accounts payable to contractors and suppliers of property, plant and equipment 6,803 10,424 Interest payable 1,477 982 Derivative financial instruments 315 - Other payables - 102
Total financial trade and other payables 81,634 27,210 Non-financial liabilities
Payables to employees 6,353 5,313 Advances from customers 6,916 3,902 Other payables 4,993 33
Total non-financial trade and other payables 18,262 9,248 Total trade and other payables 99,896 36,458
As of 31 December 2014, payables for acquisition of subsidiaries and joint ventures included payables for the acquisitions of OOO Yugragazpererabotka of RR 55,913 (see Note 4) and OAO Polief of RR 119. As of 31 December 2013, payables for the acquisition of subsidiaries and joint ventures included payables for the acquisitions of ZAO Sibgazpolimer of RR 700, and OAO Polief of RR 119.
As of 31 December 2014 and 2013, payables to employees included provisions for annual bonuses, other bonuses and vacation reserves (including provisions for social taxes) of RR 6,353 and RR 5,313, respectively.
As of 31 December 2014, other payables included a provision related to the litigation involving OOO Yugragazpererabotka’s subsidiaries, which were consolidated by the Group in March 2014, with electricity producer OAO Tyumenenergo (see Note 4).

PAO SIBUR HOLDING NOTES TO THE IFRS CONSOLIDATED FINANCIAL STATEMENTS (In millions of Russian roubles, unless otherwise stated)
211
20 SHORT-TERM DEBT AND CURRENT PORTION OF LONG-TERM DEBT
31 December 2014 31 December 2013 Short-term debt:
RR-denominated debt - 1,697 USD-denominated debt 19,693 25,091 EUR-denominated borrowings - 118
Total short-term debt 19,693 26,906 Current portion of long-term debt 36,547 15,837
56,240 42,743
Short-term RR-denominated debt bore an average interest rate of 7.7 percent as of 31 December 2013. Short-term USD-denominated debt bore average interest rates of 2.0 percent and 1.6 percent as of 31 December 2014 and 31 December 2013, respectively. Short-term EUR-denominated debt bore an average interest rate of 1.7 percent as of 31 December 2013.
The carrying amount of short-term debt approximates its fair value.
As of 31 December 2014 and 31 December 2013, the Group had no committed short-term credit facilities.
21 TAXES OTHER THAN INCOME TAX PAYABLE 31 December 2014 31 December 2013
VAT 1,850 1,345 Social taxes 289 292 Property tax 387 277 Other taxes 86 113
Total taxes other than income tax payable 2,612 2,027
22 SHAREHOLDERS’ EQUITY
Share capital. The share capital of PAO SIBUR Holding (authorised, issued and paid-in) was RR 21,784 as of 31 December 2014 and 31 December 2013, and consisted of 2,178,479,100 ordinary shares, each with a par value of ten Russian roubles.
Dividends. During the year ended 31 December 2014, dividends in the total amount of RR 6,383 (two Russian roubles and ninety-three kopecks per share) and RR 7,690 (three Russian roubles and fifty-three kopecks per share) for the six months ended 31 December 2013 and for the six months ended 30 June 2014, respectively, were paid out. In 2013 the Group made dividend pay outs for the six month periods ended 31 December 2012 and 30 June 2013 of RR 7,625 (three Russian roubles and fifty kopecks per share) and RR 6,383 (two Russian roubles and ninety-three kopecks per share), respectively.
Equity-settled share-based payment plans for directors and key management. On 28 June 2013, a company beneficially owned by Mr Leonid V. Mikhelson and Mr Gennady N. Timchenko granted equity-settled share-based payment plans to certain current and former members of the Group’s key management (see Note 34). For the year ended 31 December 2014, the Group recognised RR 11,580 within equity reserves and a corresponding increase in operating expenses.

PAO SIBUR HOLDING NOTES TO THE IFRS CONSOLIDATED FINANCIAL STATEMENTS (In millions of Russian roubles, unless otherwise stated)
212
23 NON-CONTROLLING INTEREST
The following table provides information about each subsidiary with a non-controlling interest that is material to the Group:
Place of business
Proportion of non-
controlling interest, percent
Proportion of non-
controlling interest’s
voting rights held, percent
Profit or loss attributable
to non-controlling
interest
Accumulated non-
controlling interest in the
subsidiary Year ended 31 December 2014 OAO Polief Russia 17 17 50 412 OAO NIPIgazpererabotka Russia 11 11 45 334 OOO PlasticGeosintetika Russia 33 33 (34) 128 OAO Krasnoyarsk Synthetic Rubbers Plant Russia 25 25 5 90
66 964 Year ended 31 December 2013 OAO Polief Russia 17 17 (226) 363 OAO NIPIgazpererabotka Russia 10 10 103 240 OAO Siburenergomenedgment* Russia - - 25 - OOO PlasticGeosintetika Russia 33 33 (25) 162 OAO Krasnoyarsk Synthetic Rubbers Plant Russia 25 25 (17) 85
(140) 850 *In December 2013, a 52 percent non-controlling interest share was acquired by the Group.
The Group’s subsidiaries with a non-controlling interest did not distribute dividends during the years ended 31 December 2014 and 2013.
During the year ended 31 December 2013, the Group sold a 25 percent stake in OAO Krasnoyarsk Synthetic Rubbers Plant (see Note 33). The difference between the cash consideration of RR 439 and the carrying amount of non-controlling interest acquired has been recorded in equity.
During the year ended 31 December 2013 the Group acquired an additional 52 percent stake in OAO Siburenergomenedgment for RR 214 and, as a result, increased the Group’s ownership in this subsidiary to 100 percent.
24 EARNINGS PER SHARE
The basic and diluted earnings per share ratio (EPS) has been calculated by dividing the profit for the reporting year attributable to equity holders by the weighted average number of shares outstanding during the year, excluding treasury shares. The weighted average number of ordinary shares outstanding for the year ended 31 December 2014 and 2013 was 2,178,479,100 and 2,178,479,100, respectively.

PAO SIBUR HOLDING NOTES TO THE IFRS CONSOLIDATED FINANCIAL STATEMENTS (In millions of Russian roubles, unless otherwise stated)
213
25 REVENUE
Year ended 31 December 2014 2013
Energy products: Liquefied petroleum gas 77,165 60,823 Naphtha 68,877 26,256 Natural gas 38,007 26,673 MTBE 19,364 18,596 Raw natural gas liquids 9,709 9,405 Other fuels and fuel additives 4,111 2,963
Petrochemical products: Plastics and organic synthesis products 45,777 41,583 Basic polymers 38,393 22,818 Synthetic rubbers 27,847 32,432 Intermediates and other chemicals 20,496 19,185
Total energy and petrochemical products (net of excise tax, customs duties and VAT) 349,746 260,734
Sales of processing services 979 1,393 Other sales 10,275 7,687
Total revenue 361,000 269,814
26 OPERATING EXPENSES BEFORE EQUITY-SETLLED SHARE BASED PAYMENT PLANS
Year ended 31 December 2014 2013
Feedstock and materials 78,052 67,152 Goods for resale 48,051 6,446 Transportation and logistics 43,789 38,984 Energy and utilities 31,218 25,823 Staff costs 27,152 25,144 Depreciation and amortisation 26,321 13,477 Repairs and maintenance 8,782 7,468 Rent expenses 8,221 5,783 Services provided by third parties 6,496 5,082 Processing services of third parties 1,917 5,225 Taxes other than income tax 1,783 1,790 Charity and sponsorship 987 1,257 Marketing and advertising 424 742 Impairment of property, plant and equipment and write-off of advances for capital construction 1,048 887 Loss/(gain) on disposal of property, plant and equipment 221 (2,223) Change in WIP and refined products balances (858) (10) Other 1,998 2,289
Total operating expenses before equity-settled share based payment plans 285,602 205,316
Staff costs for the years ended 31 December 2014 and 31 December 2013 include statutory pension and other social security contributions of RR 4,874 and RR 4,486 respectively.
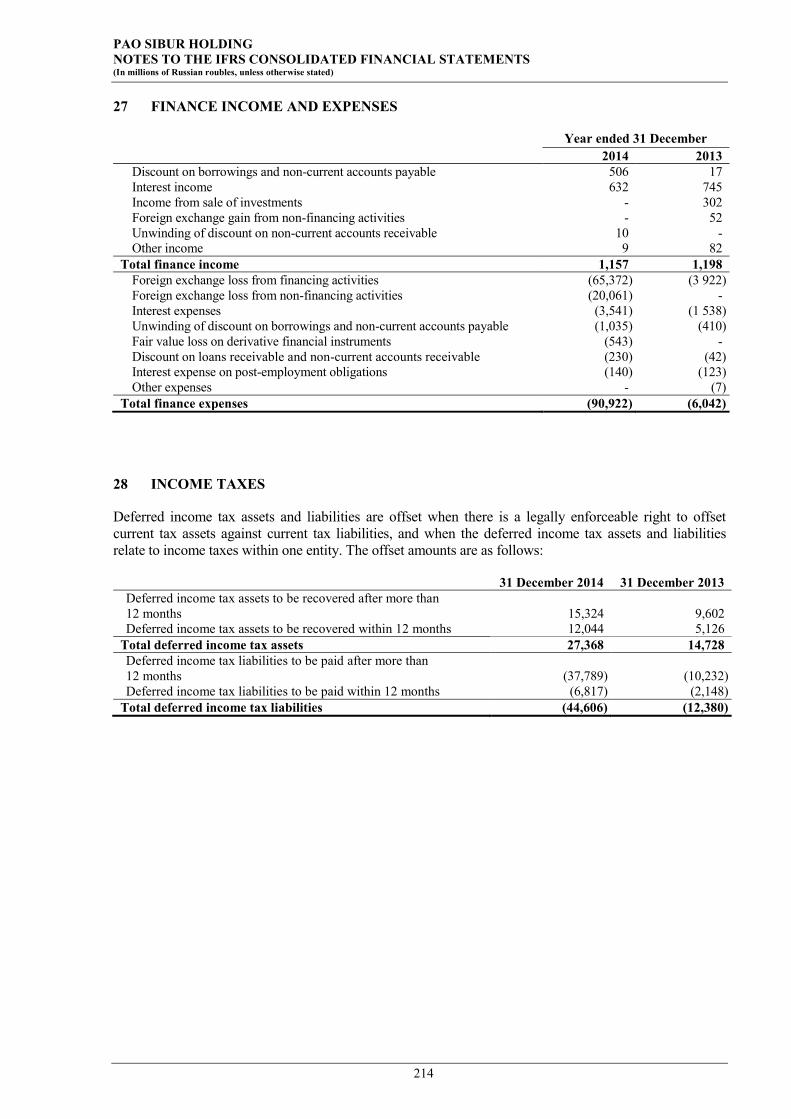
PAO SIBUR HOLDING NOTES TO THE IFRS CONSOLIDATED FINANCIAL STATEMENTS (In millions of Russian roubles, unless otherwise stated)
214
27 FINANCE INCOME AND EXPENSES
Year ended 31 December 2014 2013
Discount on borrowings and non-current accounts payable 506 17 Interest income 632 745 Income from sale of investments - 302 Foreign exchange gain from non-financing activities - 52 Unwinding of discount on non-current accounts receivable 10 - Other income 9 82
Total finance income 1,157 1,198 Foreign exchange loss from financing activities (65,372) (3 922) Foreign exchange loss from non-financing activities (20,061) - Interest expenses (3,541) (1 538) Unwinding of discount on borrowings and non-current accounts payable (1,035) (410) Fair value loss on derivative financial instruments (543) - Discount on loans receivable and non-current accounts receivable (230) (42) Interest expense on post-employment obligations (140) (123) Other expenses - (7)
Total finance expenses (90,922) (6,042)
28 INCOME TAXES
Deferred income tax assets and liabilities are offset when there is a legally enforceable right to offset current tax assets against current tax liabilities, and when the deferred income tax assets and liabilities relate to income taxes within one entity. The offset amounts are as follows:
31 December 2014 31 December 2013 Deferred income tax assets to be recovered after more than 12 months 15,324 9,602 Deferred income tax assets to be recovered within 12 months 12,044 5,126
Total deferred income tax assets 27,368 14,728 Deferred income tax liabilities to be paid after more than 12 months (37,789) (10,232) Deferred income tax liabilities to be paid within 12 months (6,817) (2,148)
Total deferred income tax liabilities (44,606) (12,380)
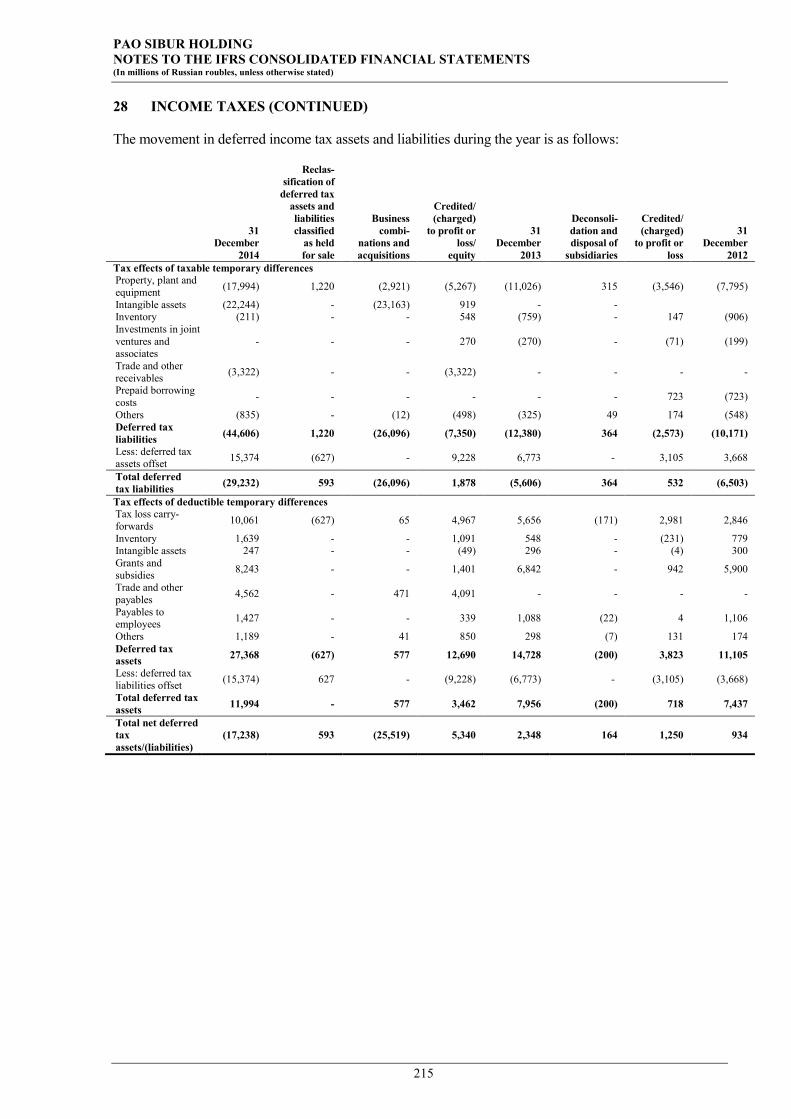
PAO SIBUR HOLDING NOTES TO THE IFRS CONSOLIDATED FINANCIAL STATEMENTS (In millions of Russian roubles, unless otherwise stated)
215
28 INCOME TAXES (CONTINUED)
The movement in deferred income tax assets and liabilities during the year is as follows:
31 December
2014
Reclas- sification of
deferred tax assets and liabilities classified
as held for sale
Business combi-
nations and acquisitions
Credited/ (charged)
to profit or loss/
equity
31 December
2013
Deconsoli-dation and disposal of
subsidiaries
Credited/ (charged)
to profit or loss
31 December
2012 Tax effects of taxable temporary differences Property, plant and equipment (17,994) 1,220 (2,921) (5,267) (11,026) 315 (3,546) (7,795)
Intangible assets (22,244) - (23,163) 919 - - Inventory (211) - - 548 (759) - 147 (906) Investments in joint ventures and associates
- - - 270 (270) - (71) (199)
Trade and other receivables (3,322) - - (3,322) - - - -
Prepaid borrowing costs - - - - - - 723 (723)
Others (835) - (12) (498) (325) 49 174 (548) Deferred tax liabilities (44,606) 1,220 (26,096) (7,350) (12,380) 364 (2,573) (10,171)
Less: deferred tax assets offset 15,374 (627) - 9,228 6,773 - 3,105 3,668
Total deferred tax liabilities (29,232) 593 (26,096) 1,878 (5,606) 364 532 (6,503)
Tax effects of deductible temporary differences Tax loss carry-forwards 10,061 (627) 65 4,967 5,656 (171) 2,981 2,846
Inventory 1,639 - - 1,091 548 - (231) 779 Intangible assets 247 - - (49) 296 - (4) 300 Grants and subsidies 8,243 - - 1,401 6,842 - 942 5,900
Trade and other payables 4,562 - 471 4,091 - - - -
Payables to employees 1,427 - - 339 1,088 (22) 4 1,106
Others 1,189 - 41 850 298 (7) 131 174 Deferred tax assets 27,368 (627) 577 12,690 14,728 (200) 3,823 11,105
Less: deferred tax liabilities offset (15,374) 627 - (9,228) (6,773) - (3,105) (3,668)
Total deferred tax assets 11,994 - 577 3,462 7,956 (200) 718 7,437
Total net deferred tax assets/(liabilities)
(17,238) 593 (25,519) 5,340 2,348 164 1,250 934

PAO SIBUR HOLDING NOTES TO THE IFRS CONSOLIDATED FINANCIAL STATEMENTS (In millions of Russian roubles, unless otherwise stated)
216
28 INCOME TAXES (CONTINUED)
Differences between recognition criteria under Russian tax regulations and under IFRS have given rise to temporary differences between the carrying value of certain assets and liabilities for financial reporting and income tax purposes. The tax effect of changes in these temporary differences is recorded at the statutory tax rate.
Deferred income tax assets are recognised for tax loss carry-forwards to the extent that the realisation of the related tax benefits through future taxable profits is probable. Under the Russian Tax Code, a tax loss can be carried forward for ten years from its origination date, after which it expires.
Year ended 31 December 2014 2013
Current income tax: Current income tax on profits for the year 3,618 11,335 Adjustments for prior years (272) (239)
Total current income tax 3,346 11,096 Deferred income tax:
Accrual/(reversal) of temporary differences (5,400) (1,252) Total deferred income tax (5,400) (1,252) Total income tax (benefit)/expense (2,054) 9,844
The tax on the Group’s profit before income tax differs from the theoretical amount that would arise if the Russian statutory tax rate applicable to the consolidated entities’ profits were used as follows:
Year ended 31 December 2014 2013
Profit before income tax and non-controlling interest 23,017 55,302 Theoretical income tax expense at statutory rate of 20 percent (4,603) (11,061) Tax effect of items which are not deductible or assessable for taxation purposes: Non-deductible expenses (5,013) (2,271) Non-taxable income from acquisition of subsidiary (see Note 4) 10,555 - Other non-taxable income 1,115 3,488
Total income tax benefit/(expense) 2,054 (9,844)
As of 31 December 2014 and 2013 the Group prepaid income tax of RR 17,218 and RR 4,011. This prepayment may not be utilised by the Group within 12 months as it depends on the Group's profit earned within 12 months. The Group did not classify this portion of prepaid income tax as non-current asset as it expects to realise this asset in its normal operating cycle.
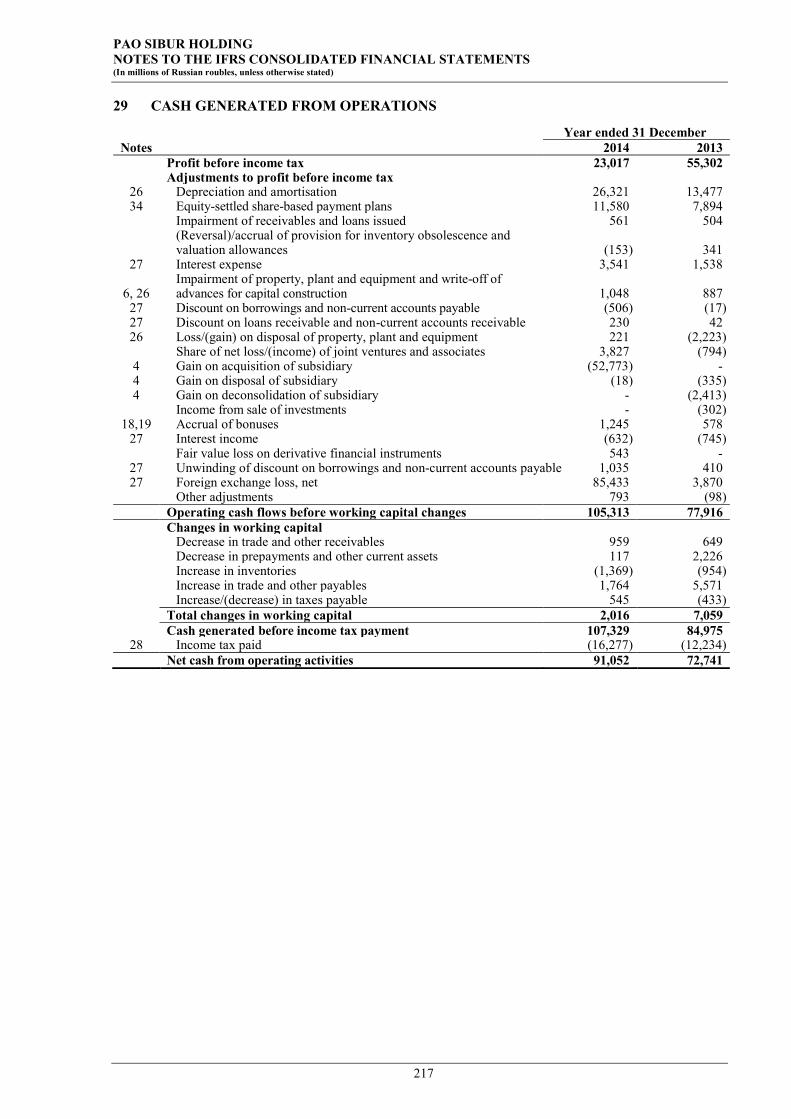
PAO SIBUR HOLDING NOTES TO THE IFRS CONSOLIDATED FINANCIAL STATEMENTS (In millions of Russian roubles, unless otherwise stated)
217
29 CASH GENERATED FROM OPERATIONS
Year ended 31 December Notes 2014 2013
Profit before income tax 23,017 55,302 Adjustments to profit before income tax
26 Depreciation and amortisation 26,321 13,477 34 Equity-settled share-based payment plans 11,580 7,894
Impairment of receivables and loans issued 561 504 (Reversal)/accrual of provision for inventory obsolescence and valuation allowances (153) 341
27 Interest expense 3,541 1,538
6, 26 Impairment of property, plant and equipment and write-off of advances for capital construction 1,048 887
27 Discount on borrowings and non-current accounts payable (506) (17) 27 Discount on loans receivable and non-current accounts receivable 230 42 26 Loss/(gain) on disposal of property, plant and equipment 221 (2,223)
Share of net loss/(income) of joint ventures and associates 3,827 (794) 4 Gain on acquisition of subsidiary (52,773) - 4 Gain on disposal of subsidiary (18) (335) 4 Gain on deconsolidation of subsidiary - (2,413)
Income from sale of investments - (302) 18,19 Accrual of bonuses 1,245 578
27 Interest income (632) (745) Fair value loss on derivative financial instruments 543 -
27 Unwinding of discount on borrowings and non-current accounts payable 1,035 410 27 Foreign exchange loss, net 85,433 3,870
Other adjustments 793 (98) Operating cash flows before working capital changes 105,313 77,916 Changes in working capital
Decrease in trade and other receivables 959 649 Decrease in prepayments and other current assets 117 2,226 Increase in inventories (1,369) (954) Increase in trade and other payables 1,764 5,571 Increase/(decrease) in taxes payable 545 (433)
Total changes in working capital 2,016 7,059 Cash generated before income tax payment 107,329 84,975
28 Income tax paid (16,277) (12,234) Net cash from operating activities 91,052 72,741
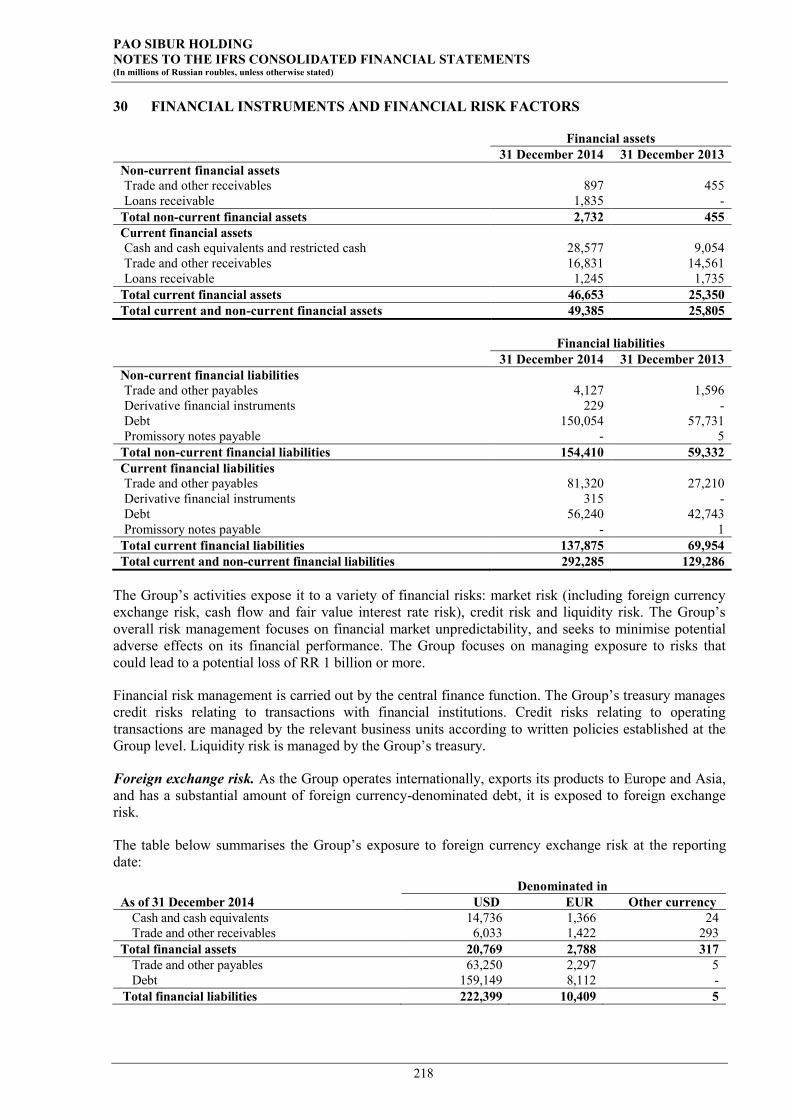
PAO SIBUR HOLDING NOTES TO THE IFRS CONSOLIDATED FINANCIAL STATEMENTS (In millions of Russian roubles, unless otherwise stated)
218
30 FINANCIAL INSTRUMENTS AND FINANCIAL RISK FACTORS
Financial assets 31 December 2014 31 December 2013
Non-current financial assets Trade and other receivables 897 455 Loans receivable 1,835 -
Total non-current financial assets 2,732 455 Current financial assets Cash and cash equivalents and restricted cash 28,577 9,054 Trade and other receivables 16,831 14,561 Loans receivable 1,245 1,735
Total current financial assets 46,653 25,350 Total current and non-current financial assets 49,385 25,805
Financial liabilities 31 December 2014 31 December 2013
Non-current financial liabilities Trade and other payables 4,127 1,596 Derivative financial instruments 229 - Debt 150,054 57,731 Promissory notes payable - 5
Total non-current financial liabilities 154,410 59,332 Current financial liabilities Trade and other payables 81,320 27,210 Derivative financial instruments 315 - Debt 56,240 42,743 Promissory notes payable - 1
Total current financial liabilities 137,875 69,954 Total current and non-current financial liabilities 292,285 129,286
The Group’s activities expose it to a variety of financial risks: market risk (including foreign currency exchange risk, cash flow and fair value interest rate risk), credit risk and liquidity risk. The Group’s overall risk management focuses on financial market unpredictability, and seeks to minimise potential adverse effects on its financial performance. The Group focuses on managing exposure to risks that could lead to a potential loss of RR 1 billion or more.
Financial risk management is carried out by the central finance function. The Group’s treasury manages credit risks relating to transactions with financial institutions. Credit risks relating to operating transactions are managed by the relevant business units according to written policies established at the Group level. Liquidity risk is managed by the Group’s treasury.
Foreign exchange risk. As the Group operates internationally, exports its products to Europe and Asia, and has a substantial amount of foreign currency-denominated debt, it is exposed to foreign exchange risk.
The table below summarises the Group’s exposure to foreign currency exchange risk at the reporting date:
Denominated in As of 31 December 2014 USD EUR Other currency
Cash and cash equivalents 14,736 1,366 24 Trade and other receivables 6,033 1,422 293
Total financial assets 20,769 2,788 317 Trade and other payables 63,250 2,297 5 Debt 159,149 8,112 -
Total financial liabilities 222,399 10,409 5

PAO SIBUR HOLDING NOTES TO THE IFRS CONSOLIDATED FINANCIAL STATEMENTS (In millions of Russian roubles, unless otherwise stated)
219
30 FINANCIAL INSTRUMENTS AND FINANCIAL RISK FACTORS (CONTINUED)
Denominated in As of 31 December 2013 USD EUR Other currency
Cash and cash equivalents 286 1,073 52 Trade and other receivables 3,369 941 -
Total financial assets 3,655 2,014 52 Trade and other payables 2,418 3,109 2 Debt 85,254 3,950 -
Total financial liabilities 87,672 7,059 2
The sensitivity analysis given in the table below reflects the hypothetical gain/(loss) that would occur assuming the Russian rouble had weakened/strengthened by 20 percent against the US dollar and euro and that there were no changes in the securities portfolio and other variables as of 31 December 2014 and 2013, respectively.
Increase in exchange rate 31 December 2014 31 December 2013 Effect on profit before income tax
RR / USD 20 percent (40,326) (16,804) RR / EUR 20 percent (1,524) (1,010)
Decrease in exchange rate 31 December 2014 31 December 2013 Effect on profit before income tax
RR / USD 20 percent 40,326 16,804 RR / EUR 20 percent 1,524 1,010
Cash flow and fair value interest rate risk. The Group’s interest rate risk arises from short- and long-term debt. Debt issued at variable rates exposes the Group to cash flow interest rate risk. Debt issued at fixed rates exposes the Group to fair value interest rate risk. During 2014 and 2013, the Group’s debt at floating rates was denominated in Russian roubles, US dollars and euro (see Notes 16 and 20). The Group’s interest-bearing assets primarily included loans receivable and cash deposits as of 31 December 2014 and 2013.
The Group analyses its interest rate exposure on a regular basis. Financing decisions are made after careful consideration of various scenarios and may include refinancing, renewing existing positions or alternative financing.
The Group’s financial results are sensitive to changes in interest rates on the floating portion of its debt portfolio. If the interest rates applicable to floating rate debt were higher/lower, assuming all other variables remain constant, it is estimated that the Group’s profit before income tax would change by the amounts shown below:
Increase in floating rates by 31 December 2014 31 December 2013 Effect on profit before income tax USD-denominated debt 10 percent (23) (13) EUR-denominated debt 10 percent (2) (2)
Decrease in floating rates by 31 December 2014 31 December 2013 Effect on profit before income tax USD-denominated debt 10 percent 23 13 EUR-denominated debt 10 percent 2 2
Credit risk. Credit risk arises from cash and cash equivalents (including short-term deposits with banks), as well as from loans issued and credit exposures to customers, including outstanding receivables and committed transactions.

PAO SIBUR HOLDING NOTES TO THE IFRS CONSOLIDATED FINANCIAL STATEMENTS (In millions of Russian roubles, unless otherwise stated)
220
30 FINANCIAL INSTRUMENTS AND FINANCIAL RISK FACTORS (CONTINUED)
Cash and cash equivalents are deposited only with banks that the Group considers at the time of deposit to have minimal risk of default within set credit limits.
With regard to customers, a large portion of the Group’s domestic receivables comes from Russia’s largest companies, including Rosneft and NOVATEK Group, which the Group has assessed as having high credit quality. Regarding export customers, the Group has also prioritised selling to key market players including Aygaz A.S. Group, Trafigura Pte Ltd., Borealis AG, SHV Gas Supply & Risk Management Group, and Continental Group, among others. Export sales are made on a prepayment basis or secured by letters of credit as well as on a credit basis. In assessing the credit quality of its customers, the Group takes into account the market segment, the relevant company’s financial position and its market share and past experience, alongside other factors. Although collection of accounts receivable could be influenced by economic factors affecting these customers, management believes that there is no significant risk of loss to the Group beyond the provisions already recorded.
The maximum credit risk exposure for accounts receivable is RR 17,728 and RR 15,016 as of 31 December 2014 and 2013, respectively.
The Group estimates the fair value of its financial liabilities as a close-out amount that does not incorporate changes in its credit risk.
The credit risk posed by off-balance sheet financial instruments is defined as the possibility of sustaining a loss as a result of another party to a financial instrument failing to adhere to the relevant contract. The Group uses the same credit policies in assuming conditional obligations as it does for on-balance sheet financial instruments, through established credit approvals, risk control limits and monitoring procedures.
The table below shows the credit limit and balance of cash and cash equivalents and restricted cash of the Group’s major counterparty groups as of the reporting date.
As of and for the year ended 31 December 2014
Bank equity Rating Credit limit for one bank Balance Major banks >= 25,000 B+/B2 USD 200 mln 22,183 Secondary banks >= 5,000 B+/B2 RR 5,000 mln 4,842 Other banks Not set Not set Individually set 1,552 Total cash and cash equivalents and restricted cash 28,577
As of and for the year ended 31 December 2013
Bank equity Rating Credit limit for one bank Balance Major banks >= 25,000 B+/B2 USD 200 mln 5,933 Secondary banks >= 5,000 B+/B2 RR 5,000 mln 2,516 Other banks Not set Not set Individually set 605 Total cash and cash equivalents and restricted cash 9,054
No credit limits were exceeded during the reporting period, and management does not expect any losses resulting from these counterparties’ non-performance. The maximum credit risk exposure for cash and cash equivalents is RR 28,577 and RR 9,054 as of 31 December 2014 and 2013, respectively.

PAO SIBUR HOLDING NOTES TO THE IFRS CONSOLIDATED FINANCIAL STATEMENTS (In millions of Russian roubles, unless otherwise stated)
221
30 FINANCIAL INSTRUMENTS AND FINANCIAL RISK FACTORS (CONTINUED)
Liquidity risk and capital risk management. Liquidity risk management includes maintaining sufficient cash balances, available funding from an adequate amount of committed credit facilities, and the ability to close out market positions. Due to the dynamic nature of the underlying businesses, the Group’s management maintains funding flexibility by ensuring funds availability under committed credit lines and expected cash flows from operating activities. Management monitors rolling forecasts of the Group’s liquidity reserve, comprising the undrawn debt facilities (see Notes 16 and 20), and cash and cash equivalents on the basis of expected cash flow. This is carried out at the Group level on a monthly and annual basis. In addition, the Group's liquidity management policy involves projecting cash flows in major currencies and considering the level of liquid assets necessary to meet cash requirements while maintaining debt financing plans.
The table below analyses the Group’s non-derivative financial liabilities in relevant maturity groupings based on the remaining period at the reporting date up to the contractual maturity date.
As of 31 December 2014 Less than one year
Between one and two years
Between two and five years Over five years
Debt 64,765 37,708 116,781 15,845 Trade and other payables 81,320 2,246 1,881 - Total 146,085 39,954 118,662 15,845 As of 31 December 2013 (restated) Debt 45,700 8,420 46,690 9,721 Trade and other payables 27,210 105 706 785 Total 72,910 8,525 47,396 10,506
Guarantees issued by the Group as of 31 December 2014 and 31 December 2013 are disclosed in Notes 8 and 34.
As the amounts in the table represent contractual undiscounted cash flows, they may not reconcile with those disclosed in the consolidated statements of financial position on debt, derivative financial instruments, and trade and other payables.
In November 2014 the Group signed an agreement with Sberbank of Russia, in accordance with its conditions, the Group swaps 1) principal payments payable by the Group to Sberbank of Russia in Russian roubles to US dollars at fixed rate, and 2) interest accrued on corresponding amounts. A notional amount of this agreement is RR 2,000. The Group recognised the agreement as a derivative financial instrument at fair value through profit or loss, using Level 2 measurements. Non-current and current portions of this instrument are RR 229 and RR 315 respectively (see Notes 18 and 19). Unrealised loss for the period recognised in profit or loss for the instrument is RR 543.
The following table represents the maturity profile of the Group’s derivative based on undiscounted cash flows:
At 31 December 2014 Less than one year Between one and two years Total
Cash inflows 1,470 676 2,146 Cash outflows* (1,640) (804) (2,444) Net cash flows (170) (128) (298)
* Cash outflows are calculated using exchange rate as at the end of the reporting period.
In 2014 and 2013, the Group monitored liquidity on the basis of the net debt to EBITDA ratio, which was calculated as net debt divided by EBITDA. Net debt is calculated as total debt less cash and cash
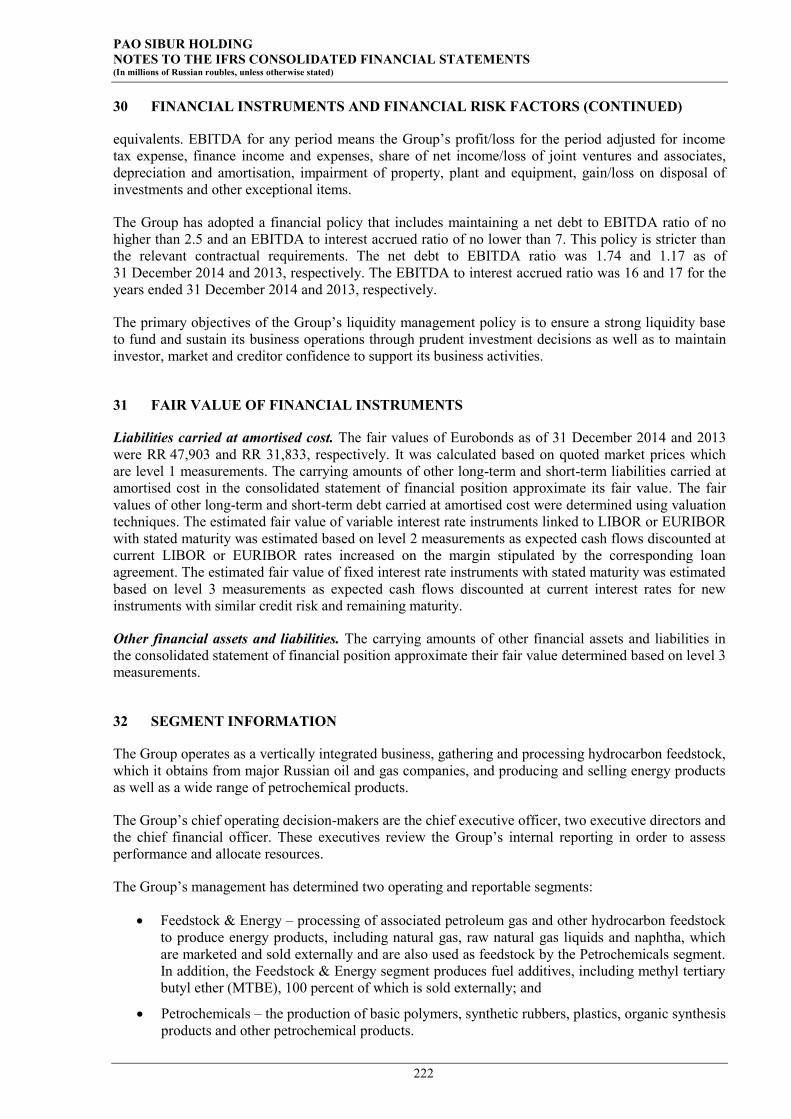
PAO SIBUR HOLDING NOTES TO THE IFRS CONSOLIDATED FINANCIAL STATEMENTS (In millions of Russian roubles, unless otherwise stated)
222
30 FINANCIAL INSTRUMENTS AND FINANCIAL RISK FACTORS (CONTINUED)
equivalents. EBITDA for any period means the Group’s profit/loss for the period adjusted for income tax expense, finance income and expenses, share of net income/loss of joint ventures and associates, depreciation and amortisation, impairment of property, plant and equipment, gain/loss on disposal of investments and other exceptional items.
The Group has adopted a financial policy that includes maintaining a net debt to EBITDA ratio of no higher than 2.5 and an EBITDA to interest accrued ratio of no lower than 7. This policy is stricter than the relevant contractual requirements. The net debt to EBITDA ratio was 1.74 and 1.17 as of 31 December 2014 and 2013, respectively. The EBITDA to interest accrued ratio was 16 and 17 for the years ended 31 December 2014 and 2013, respectively.
The primary objectives of the Group’s liquidity management policy is to ensure a strong liquidity base to fund and sustain its business operations through prudent investment decisions as well as to maintain investor, market and creditor confidence to support its business activities.
31 FAIR VALUE OF FINANCIAL INSTRUMENTS
Liabilities carried at amortised cost. The fair values of Eurobonds as of 31 December 2014 and 2013 were RR 47,903 and RR 31,833, respectively. It was calculated based on quoted market prices which are level 1 measurements. The carrying amounts of other long-term and short-term liabilities carried at amortised cost in the consolidated statement of financial position approximate its fair value. The fair values of other long-term and short-term debt carried at amortised cost were determined using valuation techniques. The estimated fair value of variable interest rate instruments linked to LIBOR or EURIBOR with stated maturity was estimated based on level 2 measurements as expected cash flows discounted at current LIBOR or EURIBOR rates increased on the margin stipulated by the corresponding loan agreement. The estimated fair value of fixed interest rate instruments with stated maturity was estimated based on level 3 measurements as expected cash flows discounted at current interest rates for new instruments with similar credit risk and remaining maturity.
Other financial assets and liabilities. The carrying amounts of other financial assets and liabilities in the consolidated statement of financial position approximate their fair value determined based on level 3 measurements.
32 SEGMENT INFORMATION
The Group operates as a vertically integrated business, gathering and processing hydrocarbon feedstock, which it obtains from major Russian oil and gas companies, and producing and selling energy products as well as a wide range of petrochemical products.
The Group’s chief operating decision-makers are the chief executive officer, two executive directors and the chief financial officer. These executives review the Group’s internal reporting in order to assess performance and allocate resources.
The Group’s management has determined two operating and reportable segments:
Feedstock & Energy – processing of associated petroleum gas and other hydrocarbon feedstockto produce energy products, including natural gas, raw natural gas liquids and naphtha, whichare marketed and sold externally and are also used as feedstock by the Petrochemicals segment.In addition, the Feedstock & Energy segment produces fuel additives, including methyl tertiarybutyl ether (MTBE), 100 percent of which is sold externally; and
Petrochemicals – the production of basic polymers, synthetic rubbers, plastics, organic synthesisproducts and other petrochemical products.
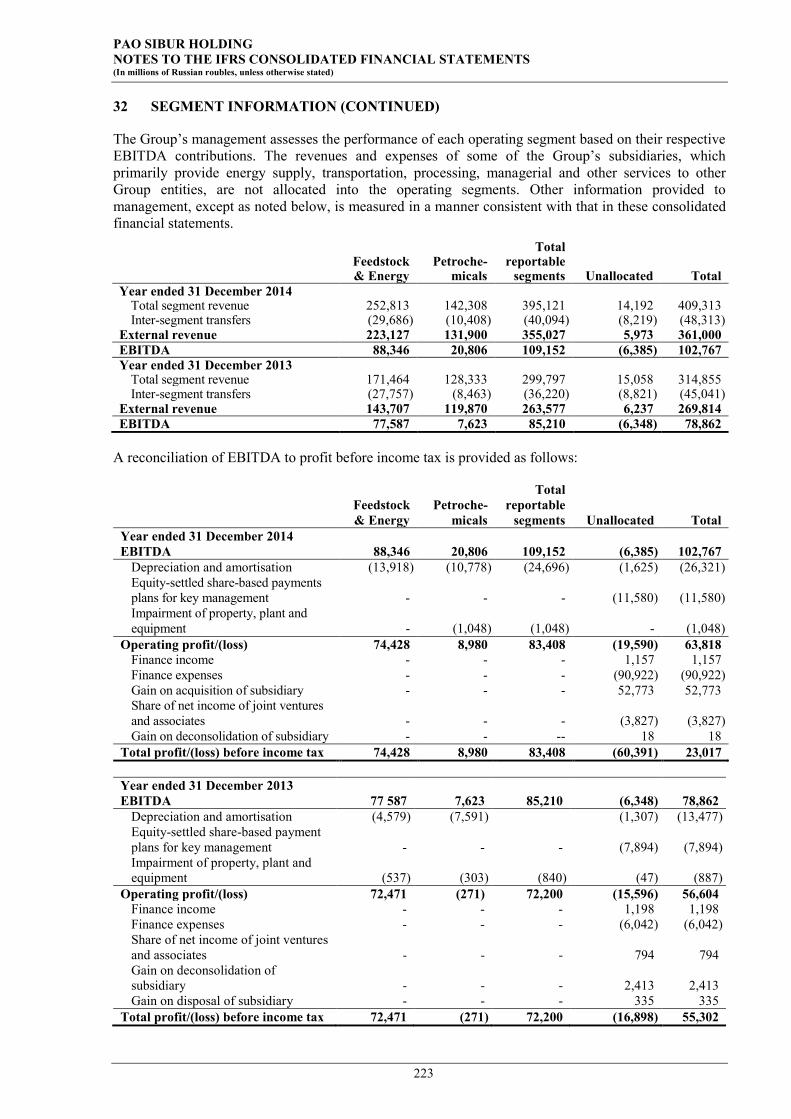
PAO SIBUR HOLDING NOTES TO THE IFRS CONSOLIDATED FINANCIAL STATEMENTS (In millions of Russian roubles, unless otherwise stated)
223
32 SEGMENT INFORMATION (CONTINUED)
The Group’s management assesses the performance of each operating segment based on their respective EBITDA contributions. The revenues and expenses of some of the Group’s subsidiaries, which primarily provide energy supply, transportation, processing, managerial and other services to other Group entities, are not allocated into the operating segments. Other information provided to management, except as noted below, is measured in a manner consistent with that in these consolidated financial statements.
Feedstock & Energy
Petroche-micals
Total reportable
segments Unallocated Total Year ended 31 December 2014
Total segment revenue 252,813 142,308 395,121 14,192 409,313 Inter-segment transfers (29,686) (10,408) (40,094) (8,219) (48,313)
External revenue 223,127 131,900 355,027 5,973 361,000 EBITDA 88,346 20,806 109,152 (6,385) 102,767 Year ended 31 December 2013
Total segment revenue 171,464 128,333 299,797 15,058 314,855 Inter-segment transfers (27,757) (8,463) (36,220) (8,821) (45,041)
External revenue 143,707 119,870 263,577 6,237 269,814 EBITDA 77,587 7,623 85,210 (6,348) 78,862
A reconciliation of EBITDA to profit before income tax is provided as follows:
Feedstock & Energy
Petroche-micals
Total reportable
segments Unallocated Total Year ended 31 December 2014 EBITDA 88,346 20,806 109,152 (6,385) 102,767
Depreciation and amortisation (13,918) (10,778) (24,696) (1,625) (26,321) Equity-settled share-based payments plans for key management - - - (11,580) (11,580) Impairment of property, plant and equipment - (1,048) (1,048) - (1,048)
Operating profit/(loss) 74,428 8,980 83,408 (19,590) 63,818 Finance income - - - 1,157 1,157 Finance expenses - - - (90,922) (90,922) Gain on acquisition of subsidiary - - - 52,773 52,773 Share of net income of joint ventures and associates - - - (3,827) (3,827) Gain on deconsolidation of subsidiary - - -- 18 18
Total profit/(loss) before income tax 74,428 8,980 83,408 (60,391) 23,017
Year ended 31 December 2013 EBITDA 77 587 7,623 85,210 (6,348) 78,862
Depreciation and amortisation (4,579) (7,591) (1,307) (13,477) Equity-settled share-based payment plans for key management - - - (7,894) (7,894) Impairment of property, plant and equipment (537) (303) (840) (47) (887)
Operating profit/(loss) 72,471 (271) 72,200 (15,596) 56,604 Finance income - - - 1,198 1,198 Finance expenses - - - (6,042) (6,042) Share of net income of joint ventures and associates - - - 794 794 Gain on deconsolidation of subsidiary - - - 2,413 2,413 Gain on disposal of subsidiary - - - 335 335
Total profit/(loss) before income tax 72,471 (271) 72,200 (16,898) 55,302

PAO SIBUR HOLDING NOTES TO THE IFRS CONSOLIDATED FINANCIAL STATEMENTS (In millions of Russian roubles, unless otherwise stated)
224
32 SEGMENT INFORMATION (CONTINUED)
Geographical information. All of the Group’s production facilities are located in the Russian Federation.
The breakdown of revenues by geographical regions is as follows:
Year ended 31 December 2014 2013
Russia 176,050 154,450 Europe 131,784 64,685 Asia 28,086 25,760 CIS 21,493 22,729 Other 3,587 2,190
Total revenue 361,000 269,814
The change in comparative figures for the year ended 31 December 2013 is explained by change in the Group’s accounting policy regarding the allocation of revenue to geographical segments. Sales to Europe mainly cover the following countries: the Netherlands, Belgium, Poland, Sweden, Finland, Hungary, France, Estonia, the United Kingdom and Germany. Sales to Asia mainly cover the following countries: Turkey, China, India and Korea. Sales to the CIS mainly cover the following countries: Belarus, Ukraine and Kazakhstan.
33 PRINCIPAL SUBSIDIARIES
Principal wholly owned operating subsidiaries of the Group
OOO Biaxplen OAO SiburTyumenGaz OOO Biaxplen-T OOO Tobolsk-Neftekhim OOO SIBUR GEOSINT OOO Tobolsk-Polymer SIBUR International GmbH OOO Togliattikauchuk ZAO Sibur-Khimprom OOO Tomskneftekhim OAO Sibur-Neftekhim OAO Uralorgsintez OAO Sibur-PETF AO Voronezhsintezkauchuk OOO SIBUR-Portenergo OAO Siburenergomenedgment ZAO SIBUR-Trans OOO Belozerniy GPK OOO SIBUR-Kstovo OOO Nizhnevartovskiy GPK OOO Zapsibtransgaz OOO Nyagangazpererabotka
Other principal operating subsidiaries of the Group:
Effective percent of share capital held by the Group as of
31 December 2014 31 December 2013 OAO NIPIgazpererabotka 89 90 OAO Polief 83 83 OAO Krasnoyarskiy ZSK 75 75 OOO PlasticGeosintetika 67 67
As of 31 December 2014 and 31 December 2013 the voting and ownership percentage in the Group’s subsidiaries with a non-controlling interest are the same.
Operating subsidiaries of the Group are incorporated and located in the Russian Federation, except for SIBUR International GmbH, an export trading company of the Group which is incorporated in Austria.

PAO SIBUR HOLDING NOTES TO THE IFRS CONSOLIDATED FINANCIAL STATEMENTS (In millions of Russian roubles, unless otherwise stated)
225
34 RELATED PARTIES
For the purposes of these consolidated financial statements, parties are generally considered to be related if one party is part of the Group’s key management or Board of Directors, has the ability to control or jointly control the other party, they are under common control, or if one party can exercise significant influence over the other party in the financial and operational decision-making process. In considering each possible related-party relationship, attention is paid to the substance of the relationship, not merely the entities’ legal form. Related parties may enter into transactions that unrelated parties may not enter into, and transactions between related parties may not be effected on the same terms, conditions and amounts as transactions between unrelated parties.
The nature of the related-party relationships for those related parties with which the Group entered into significant transactions during the year ended 31 December 2014 and 2013, or had significant balances outstanding as of 31 December 2014 and 31 December 2013, are presented below.
a) Significant transactions with parties under Mr Leonid V. Mikhelson’s control, joint controlor significant influence
During the years ended 31 December 2014 and 2013, the Group engaged in transactions with OAO NOVATEK and its subsidiaries (jointly the “NOVATEK Group”). The Group’s transactions and balances with the NOVATEK Group during the relevant periods are set out below:
Year ended 31 December 2014 2013
Operating activities Purchases of natural gas 3,171 2,790 Purchases of liquefied petroleum gas 625 482 Purchases of raw natural gas liquids 5,954 - Purchases of services 755 - Natural gas sales 14,408 12,928 Liquid hydrocarbons sales 768 - Sales of processing services 483 - Sales of other work and services 1,542 159
31 December 2014 31 December 2013 Trade and other receivables 209 265 Advances and prepayments 2 16 Trade and other payables (including payables for the acquisition of subsidiaries) 948 117 Advances received 184 14
During the years ended 31 December 2014 and 2013, the Group engaged in transactions with OOO Nova related to the construction of a natural gas liquids pipeline connecting the Purovsky Gas Condensate Plant, the Yuzhno-Balykskaya Main Pumping Station and the Tobolsk production site in the Tyumen Region.
The Group’s transactions and balances with OOO Nova as of the end of and during the relevant periods are set out below:
Year ended 31 December 2014 2013
Investing activities Purchases of other goods and services 14 4,111 Sales of other goods and services 12 36
31 December 2014 31 December 2013 Advances and prepayments for capital construction 7 8 Trade and other payables - 454

PAO SIBUR HOLDING NOTES TO THE IFRS CONSOLIDATED FINANCIAL STATEMENTS (In millions of Russian roubles, unless otherwise stated)
226
34 RELATED PARTIES (CONTINUED)
As of 31 December 2014 and 31 December 2013, the Group had contractual capital expenditure commitments with OOO Nova of RR nil and RR 448, respectively.
During the year ended 31 December 2014 and 2013, the Group deposited cash in OAO Pervobank.
The Group’s transactions and balances with OAO Pervobank as of the end of and during the relevant periods are set out below:
Year ended 31 December 2014 2013
Finance income and expense Interest income on cash and cash equivalents 200 122 Other expense 104 -
31 December 2014 31 December 2013 Cash and cash equivalents 4,842 2,516
b) Significant transactions with parties under Mr Gennady N. Timchenko’s control or jointcontrol
In October 2011, the Gunvor Group, which is jointly controlled by Mr Timchenko, became a related party of the Group. The Group’s primary transactions with the Gunvor Group entailed sales of energy products. In March 2014 it was announced that Mr Timchenko had sold his share in the Gunvor Group and, as a result, it ceased to be a related party of the Group.
The Group’s transactions and balances with the Gunvor Group during the relevant periods are set out below:
Year ended 31 December 2014 2013
Operating activities Sales of energy products 1,139 2,112
31 December 2014 31 December 2013 Trade and other receivables - 6
During the year ended 31 December 2014 and 2013, the Group entered into transactions with OAO Stroytransgaz and its subsidiary, OOO Stroytransgaz-M (jointly, the “Stroytransgaz companies”). The transactions primarily included purchases by the Group from the Stroytransgaz companies of construction, repair and maintenance services.
The Group’s transactions and balances with the Stroytransgaz companies as of the end of and during the relevant periods are set forth below:
Year ended 31 December 2014 2013
Operating and investing activities Purchases of construction and repair and maintenance services 1,911 3,260 Sales of other goods and services 10 14
31 December 2014 31 December 2013 Advances and prepayments for capital construction 360 210 Trade and other payables 89 224
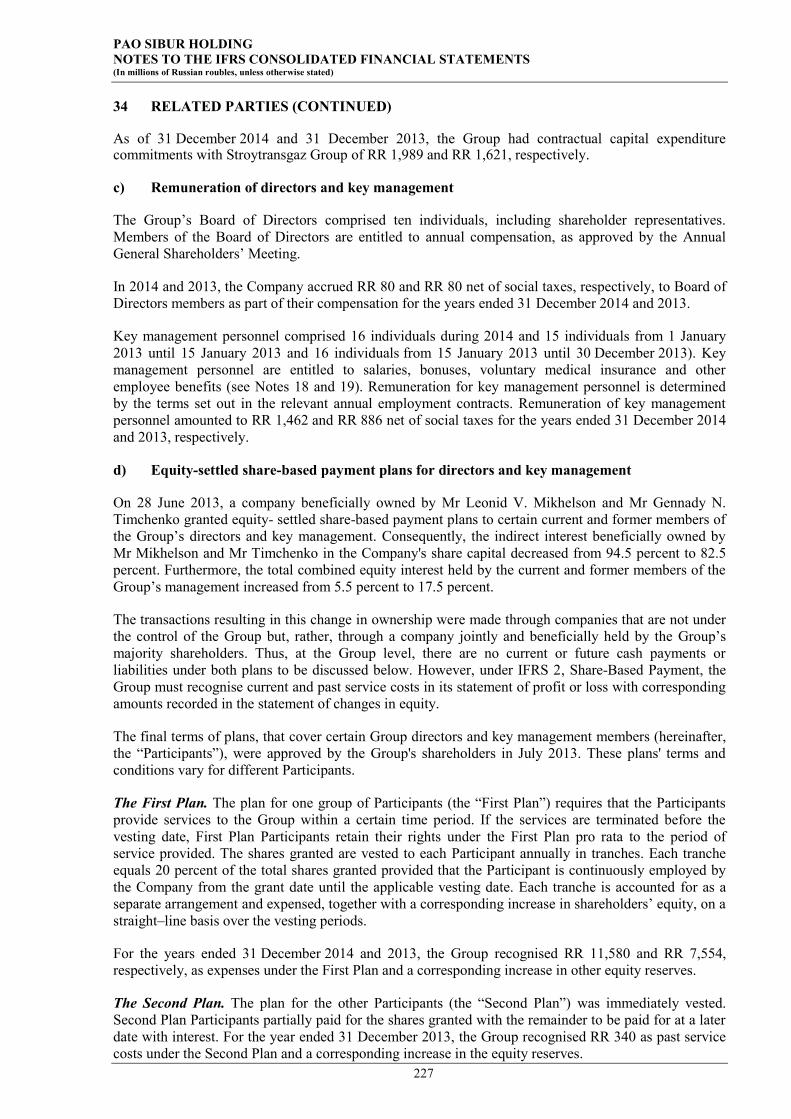
PAO SIBUR HOLDING NOTES TO THE IFRS CONSOLIDATED FINANCIAL STATEMENTS (In millions of Russian roubles, unless otherwise stated)
227
34 RELATED PARTIES (CONTINUED)
As of 31 December 2014 and 31 December 2013, the Group had contractual capital expenditure commitments with Stroytransgaz Group of RR 1,989 and RR 1,621, respectively.
c) Remuneration of directors and key management
The Group’s Board of Directors comprised ten individuals, including shareholder representatives. Members of the Board of Directors are entitled to annual compensation, as approved by the Annual General Shareholders’ Meeting.
In 2014 and 2013, the Company accrued RR 80 and RR 80 net of social taxes, respectively, to Board of Directors members as part of their compensation for the years ended 31 December 2014 and 2013.
Key management personnel comprised 16 individuals during 2014 and 15 individuals from 1 January 2013 until 15 January 2013 and 16 individuals from 15 January 2013 until 30 December 2013). Key management personnel are entitled to salaries, bonuses, voluntary medical insurance and other employee benefits (see Notes 18 and 19). Remuneration for key management personnel is determined by the terms set out in the relevant annual employment contracts. Remuneration of key management personnel amounted to RR 1,462 and RR 886 net of social taxes for the years ended 31 December 2014 and 2013, respectively.
d) Equity-settled share-based payment plans for directors and key management
On 28 June 2013, a company beneficially owned by Mr Leonid V. Mikhelson and Mr Gennady N. Timchenko granted equity- settled share-based payment plans to certain current and former members of the Group’s directors and key management. Consequently, the indirect interest beneficially owned by Mr Mikhelson and Mr Timchenko in the Company's share capital decreased from 94.5 percent to 82.5 percent. Furthermore, the total combined equity interest held by the current and former members of the Group’s management increased from 5.5 percent to 17.5 percent.
The transactions resulting in this change in ownership were made through companies that are not under the control of the Group but, rather, through a company jointly and beneficially held by the Group’s majority shareholders. Thus, at the Group level, there are no current or future cash payments or liabilities under both plans to be discussed below. However, under IFRS 2, Share-Based Payment, the Group must recognise current and past service costs in its statement of profit or loss with corresponding amounts recorded in the statement of changes in equity.
The final terms of plans, that cover certain Group directors and key management members (hereinafter, the “Participants”), were approved by the Group's shareholders in July 2013. These plans' terms and conditions vary for different Participants.
The First Plan. The plan for one group of Participants (the “First Plan”) requires that the Participants provide services to the Group within a certain time period. If the services are terminated before the vesting date, First Plan Participants retain their rights under the First Plan pro rata to the period of service provided. The shares granted are vested to each Participant annually in tranches. Each tranche equals 20 percent of the total shares granted provided that the Participant is continuously employed by the Company from the grant date until the applicable vesting date. Each tranche is accounted for as a separate arrangement and expensed, together with a corresponding increase in shareholders’ equity, on a straight–line basis over the vesting periods.
For the years ended 31 December 2014 and 2013, the Group recognised RR 11,580 and RR 7,554, respectively, as expenses under the First Plan and a corresponding increase in other equity reserves.
The Second Plan. The plan for the other Participants (the “Second Plan”) was immediately vested. Second Plan Participants partially paid for the shares granted with the remainder to be paid for at a later date with interest. For the year ended 31 December 2013, the Group recognised RR 340 as past service costs under the Second Plan and a corresponding increase in the equity reserves.

PAO SIBUR HOLDING NOTES TO THE IFRS CONSOLIDATED FINANCIAL STATEMENTS (In millions of Russian roubles, unless otherwise stated)
228
34 RELATED PARTIES (CONTINUED)
e) Joint ventures
The Group’s transactions and balances with its joint ventures as of the end of and during the relevant periods are set forth below:
Year ended 31 December 2014 2013
Operating and investing activities Purchases of materials, goods and services 9,345 7,442 Purchases of processing services 1,079 4,900 Sales of materials 3,099 1,327 Interest income 104 208 Interest expense 81 81 Other income (expense) 27 (4)
31 December 2014 31 December 2013 Loans receivable 1,179 1,703 Short-term debt - 1,697 Long-term debt 800 - Trade and other receivables 183 279 Trade and other payables 2,636 2,585
Balances outstanding as of 31 December 2013 and transactions for the years ended 31 December 2014 and 2013 included OOO Yugragazpererabotka, a subsidiary that was deconsolidated and had been disclosed as a joint venture since March 2013 (see Note 4) and was then reconsolidated following its acquisition by the Group in March 2014 (see Note 4), as follows:
Year ended 31 December 2014 2013
Operating and investing activities Purchases of materials, goods and services 4 83 Purchases of processing services 1,079 4,900 Sales of materials, goods and services 120 928 Interest income 17 78 Other income (expense) 2 (9)
31 December 2014 31 December 2013 Loans receivable - 1,288 Trade and other receivables - 192 Trade and other payables - 1,231
The Group has issued a short-term finance guarantee for the value-added tax liabilities of OOO Yugragazpererabotka as of 31 December 2013; the maximum credit risk exposures as of 31 December 2013 due to financial guarantees issued for OOO Yugragazpererabotka were RR 1,290.
35 COMMITMENTS, CONTINGENCIES AND OPERATING RISKS
Operating environment. The Russian Federation displays certain characteristics of an emerging market. Its economy is particularly sensitive to oil and gas prices. The legal, tax and regulatory frameworks continue to develop and are subject to varying interpretations.
The ongoing uncertainty and volatility in financial markets, particularly in Europe, and other risks could have significant negative effects on the Russian financial and corporate sectors. The future economic and regulatory situation may differ from management’s current expectations.
Recent developments in Ukraine have had and may continue to have a negative impact on the Russian economy, including difficulties in obtaining international funding. These and other events, in case of escalation, may have a significant impact on the operating environment in the Russian Federation.

PAO SIBUR HOLDING NOTES TO THE IFRS CONSOLIDATED FINANCIAL STATEMENTS (In millions of Russian roubles, unless otherwise stated)
229
35 COMMITMENTS, CONTINGENCIES AND OPERATING RISKS (CONTINUED)
In the year 2014, the USA and EU imposed a number of sectorial and personal sanctions against some of Russian companies and Russian citizens. These sanctions restrict certain US and EU persons and companies from providing financing, goods and services to certain entities. The Group considers these sanctions in its activities, continuously monitors them and analyses the effect of the sanctions on the Group's financial position and results of operations. As of 31 December 2014 the Group were not subject to economic sanctions and restrictions imposed by USA and EU.
Russia’s future economic development is dependent upon both external factors and government measures to sustain growth and change the tax, legal and regulatory environment. Management believes it is taking all necessary measures to support the sustainability and development of the Group’s business in the current business and economic environment.
Legal proceedings. During the reporting period, the Group was involved in a number of lawsuits (as both plaintiff and defendant) arising in the ordinary course of business. Management believes there are no current legal proceedings or other outstanding claims that could have a material adverse effect on the Group’s operational results or financial position, and which have not been accrued or disclosed in the consolidated financial statements.
Certain agreements under which the Group has disposed of various businesses and assets contain warranties and indemnities in favour of purchasers related to title, environmental and other matters. Although the Group’s potential obligations under such warranties and indemnities may be material, the scope of such potential obligations cannot be accurately assessed until a specific claim is filed.
Taxation. Russian tax, currency and customs legislation is subject to varying interpretations and frequent changes. The Group management’s interpretation of such legislation, as applied to the Group’s transactions and activity, may be challenged by the relevant federal and regional authorities.
The Russian tax authorities may take a more assertive position in their interpretation of the law and assessments, and it is possible that transactions and activities that have not been challenged in the past may now be challenged. As a result, significant additional taxes, penalties and interest may be assessed. Fiscal periods remain open to review by the authorities in respect of taxes for the three calendar years preceding the year under review.
Amendments to Russian transfer pricing legislation took effect on 1 January 2012. These new transfer pricing rules appear more technically elaborate and, to a certain extent, better aligned with the international transfer pricing principles developed by the Organisation for Economic Cooperation and Development (OECD). This new legislation allows the tax authorities to make transfer pricing adjustments and impose additional tax liabilities in respect of controlled transactions (transactions with related parties and some types of transactions with unrelated parties), provided that the transaction price is not arm's length. The Group’s management exercises its judgment about whether or not the transfer pricing documentation that the relevant entity has prepared, as required by the new legislation, provides sufficient evidence to support the entity's tax positions and related tax returns. Given that the practice of implementing the new Russian transfer pricing rules has not yet fully developed, the impact of any challenge to an entity's transfer prices cannot be reliably predicted; however, it may be significant to the financial condition and/or overall operations of the Group.
The Group includes companies incorporated outside of Russia. The Group’s tax liabilities are determined on the assumption that these companies are not subject to Russian income tax, if they are not permanently established in Russia. Russian tax law does not provide detailed rules on the taxation of foreign companies. With the evolution of the interpretation of these rules and changes in the Russian tax authorities’ approach, it is possible that the non-taxable status of some or all of the Group’s foreign companies in Russia may be challenged. The impact of any such challenge cannot be reliably assessed; however, it may be significant to the financial condition and/or overall operations of the entity.
The Group’s management believes that its interpretation of the relevant legislation is appropriate and

PAO SIBUR HOLDING NOTES TO THE IFRS CONSOLIDATED FINANCIAL STATEMENTS (In millions of Russian roubles, unless otherwise stated)
230
35 COMMITMENTS, CONTINGENCIES AND OPERATING RISKS (CONTINUED)
that the Group's tax, currency and customs positions will be sustained. Where the Group’s management believes it is probable that a position cannot be sustained, an appropriate amount has been accrued for in these IFRS consolidated financial statements.
Environmental matters. The enforcement of environmental regulations in the Russian Federation is evolving, and the enforcement posture of government authorities is continually being reconsidered. The Group periodically evaluates its obligations under environmental regulations. Obligations are recognised as soon as they are determined. Potential liabilities that could arise as a result of changes in existing regulations, civil litigation or legislation, cannot be estimated, but could be material. Management believes that there are no likely liabilities for environmental damage, that would have a materially adverse impact on the Group’s financial position or operating results.
Social commitments. The Group contributes to the maintenance and upkeep of the local infrastructure and the welfare of employees in those areas where it has production operations, including contributions to the construction, development and maintenance of housing, hospitals, transport services, recreational facilities and other social infrastructure. Such funding is expensed as incurred.
Compliance with covenants. The Group is subject to certain covenants primarily related to its debt. Non-compliance with such covenants may result in negative consequences for the Group, i.e. increased borrowing costs. Management believes that the Group is in compliance with its covenants.
Operating lease commitments. Where the Group is a lessee in a lease that does not substantially transfer all risks and rewards incidental to ownership from the lessor to the Company, the total lease payments (as specified in a lease contract) are charged to profit or loss for the year on a straight-line basis over the lease term. The Company has two types of lease contracts in place: fixed-term agreements and continuous contracts. The vast majority of fixed-term contracts are non-cancellable before the expiry date and only a few of them may be terminated by the lessee at its sole discretion. The continuous contracts may be terminated by either party by giving proper notice of termination. The lease term is the non-cancellable period for which the lessee has contracted to lease the asset together with any further terms for which the lessee has the option to continue to lease the asset, with or without further payment, when at the inception of the lease it is reasonably certain that the lessee will exercise the option. Lease payments include payments for non-lease elements in the arrangement such as scheduled maintenance expenses, insurance expenses, pollution charges and related taxes. Payments for the non-lease elements are not specifically predetermined in the contracts and may vary depending on the level of servicing required. Accordingly, it would not be practicable to disclose them separately.
31 December 2014 31 December 2013 No later than 1 year 6,846 5,652 Later than 1 year, but no later than 5 years 25,737 18,766 Later than 5 years 9,649 10,507 Total operating lease commitments 42,232 34,925
Capital commitments. In the normal course of business, the Group has entered into contracts for the purchase of property, plant and equipment. On 11 September 2014, the Company’s Board of Directors voted to expand the 2014 capital expenditures budget by including the ZapSib-2 investment project budget in the overall capex budget. As of 31 December 2014, the Group had contractual capital expenditure commitments of RR 168,938, including RR 141,121 related to ZapSib-2 investment project (31 December 2013: RR 28,660, including RR 299 related to ZapSib-2 investment project).

PAO SIBUR HOLDING NOTES TO THE IFRS CONSOLIDATED FINANCIAL STATEMENTS (In millions of Russian roubles, unless otherwise stated)
231
36 NEW ACCOUNTING DEVELOPMENTS
Certain new standards and interpretations have been issued that are mandatory for annual periods beginning on or after 1 January 2014 or later, which have not had a material impact on the Group’s financial position or operations:
Offsetting Financial Assets and Financial Liabilities – Amendments to IAS 32 (issued in December 2011 and effective for annual periods beginning on or after 1 January 2014). The amendment added application guidance to IAS 32 to address inconsistencies identified in applying some of the offsetting criteria. This includes clarifying the meaning of “currently has a legally enforceable right of set-off” and that some gross settlement systems may be considered equivalent to net settlement.
Amendments to IFRS 10, IFRS 12 and IAS 27, – Investment Entities (issued on 31 October 2012 and effective for annual periods beginning 1 January 2014). The amendment introduced the definition of an investment entity as an entity that (i) obtains funds from investors for the purpose of providing them with investment management services, (ii) commits to its investors that its business purpose is to invest funds solely for capital appreciation or investment income, and (iii) measures and evaluates its investments on a fair value basis. An investment entity will be required to account for its subsidiaries at fair value through profit or loss, and to consolidate only those subsidiaries that provide services that are related to the entity's investment activities. IFRS 12 was amended to introduce new disclosures, including any significant judgements made in determining whether an entity is an investment entity and information about financial or other support to an unconsolidated subsidiary, whether intended or already provided to the subsidiary.
IFRIC 21, Levies (issued on 20 May 2013 and effective for annual periods beginning 1 January 2014). The interpretation clarifies the accounting for an obligation to pay a levy that is not income tax. The obligating event that gives rise to a liability is the event identified by the legislation that triggers the obligation to pay the levy. The fact that an entity is economically compelled to continue operating in a future period, or prepares its financial statements under the going concern assumption, does not create an obligation. The same recognition principles apply in interim and annual financial statements. The application of the interpretation to liabilities arising from emissions trading schemes is optional.
Amendments to IAS 36, Recoverable Amount Disclosures for Non-Financial Assets (issued on 29 May 2013 and effective for annual periods beginning 1 January 2014; earlier application is permitted if IFRS 13 is applied for the same accounting and comparative period). The amendments remove the requirement to disclose the recoverable amount when a CGU contains goodwill or intangible assets with indefinite useful lives but there has been no impairment.
Amendments to IAS 39, Novation of Derivatives and Continuation of Hedge Accounting (issued on 27 June 2013 and effective for annual periods beginning 1 January 2014). The amendments will allow hedge accounting to continue in a situation where a derivative that has been designated as a hedging instrument, is novated (i.e. the parties have agreed to replace their original counterparty with a new one) to effect clearing with a central counterparty as a result of laws or regulation, if specific conditions are met.
PAO SIBUR HOLDING NOTES TO THE IFRS CONSOLIDATED FINANCIAL STATEMENTS (In millions of Russian roubles, unless otherwise stated)
232
37 NEW ACCOUNTING PRONOUNCEMENTS
Certain new standards and interpretations have been issued that are mandatory for annual periods beginning on or after 1 January 2015, and which the Group has not early adopted:
IFRS 9, Financial Instruments: Classification and Measurement (issued in July 2014 and effective for annual periods beginning on or after 1 January 2018). The standard reflects all phases of the financial instruments project and replaces all previous versions of IFRS 9. The standard introduces new requirements for classification and measurement, impairment, and hedge accounting. The Group is considering the implications of the standard, the impact on the Group and the timing of its adoption by the Group.
Defined Benefit Plans: Employee Contributions - Amendments to IAS 19 (issued in November 2013 and effective for annual periods beginning 1 July 2014). The amendment allows entities to recognise employee contributions as a reduction in the service cost in the period in which the related employee service is rendered, instead of attributing the contributions to the periods of service, if the amount of the employee contributions is independent of the number of years of service.
Annual Improvements to IFRSs 2012 (issued in December 2013 and effective for annual periods beginning on or after 1 July 2014, unless otherwise stated below). The improvements consist of changes to seven standards. IFRS 2 was amended to clarify the definition of a ‘vesting condition’ and to define separately ‘performance condition’ and ‘service condition’; The amendment is effective for share-based payment transactions for which the grant date is on or after 1 July 2014. IFRS 3 was amended to clarify that (1) an obligation to pay contingent consideration which meets the definition of a financial instrument is classified as a financial liability or as equity, on the basis of the definitions in IAS 32, and (2) all non-equity contingent consideration, both financial and non-financial, is measured at fair value at each reporting date, with changes in fair value recognised in profit and loss. Amendments to IFRS 3 are effective for business combinations where the acquisition date is on or after 1 July 2014.
IFRS 8 was amended to require (1) disclosure of the judgements made by management in aggregating operating segments, including a description of the segments which have been aggregated and the economic indicators which have been assessed in determining that the aggregated segments share similar economic characteristics, and (2) a reconciliation of segment assets to the entity’s assets when segment assets are reported. The basis for conclusions on IFRS 13 was amended to clarify that deletion of certain paragraphs in IAS 39 upon publishing of IFRS 13 was not made with an intention to remove the ability to measure short-term receivables and payables at invoice amount where the impact of discounting is immaterial. IAS 16 and IAS 38 were amended to clarify how the gross carrying amount and the accumulated depreciation are treated where an entity uses the revaluation model. IAS 24 was amended to include, as a related party, an entity that provides key management personnel services to the reporting entity or to the parent of the reporting entity (‘the management entity’), and to require to disclose the amounts charged to the reporting entity by the management entity for services provided.
Annual Improvements to IFRSs 2013 (issued in December 2013 and effective for annual periods beginning on or after 1 July 2014). The following changes may impact the Group’s consolidated financial statements:
IFRS 3, Business Combinations, was amended to clarify that it does not apply to the accountingfor the formation of any joint arrangement under IFRS 11, Joint Arrangements. The amendmentalso clarifies that the scope exemption only applies in the financial statements of the jointarrangement itself.
The amendment of IFRS 13, Fair Value Measurement, clarifies that the portfolio exception inIFRS 13, which allows an entity to measure the fair value of a group of financial assets andfinancial liabilities on a net basis, applies to all contracts (including contracts to buy or sell non-financial items) that are within the scope of IAS 39, Financial Instruments: Recognition andMeasurement, or IFRS 9, Financial Instruments.

PAO SIBUR HOLDING NOTES TO THE IFRS CONSOLIDATED FINANCIAL STATEMENTS (In millions of Russian roubles, unless otherwise stated)
233
37 NEW ACCOUNTING PRONOUNCEMENTS (CONTINUED)
Accounting for Acquisitions of Interests in Joint Operations - Amendments to IFRS 11 (issued on 6 May 2014 and effective for periods beginning on or after 1 January 2016). This amendment adds new guidance on how to account for the acquisition of an interest in a joint operation that constitutes a business.
IFRS 15, Revenue from Contracts with Customers (issued on 28 May 2014 and effective for periods beginning on or after 1 January 2017). The new standard introduces the core principle that revenue must be recognised when the relevant goods or services are transferred to the customer, at the transaction price. Any discounts on the contract price must generally be allocated to the separate elements. When the consideration varies for any reason, minimum amounts must be recognised if they are not at significant risk of reversal. Costs incurred to secure contracts with customers must be capitalised and amortised over the period when the benefits of the contract are consumed. The Group is considering the implications of the standard, the impact on the Group and the timing of its adoption by the Group.
Amendments to IFRS 10, Consolidated Financial Statements, and IAS 28, Investments in Associates and Joint Ventures (issued on 11 September 2014 and effective for annual periods beginning on or after 1 January 2016). These amendments address an inconsistency between the requirements in IFRS 10 and those in IAS 28 in dealing with the sale or contribution of assets between an investor and its associate or joint venture. The amendments stipulate that a full gain or loss is recognised when a transaction involves a business. A partial gain or loss is recognised when a transaction involves assets that do not constitute a business, even if these assets are held by a subsidiary. The Group is currently assessing the impact of the amendments on its consolidated financial statements.
Annual Improvements to IFRSs 2014 (issued on 25 September 2014 and effective for annual periods beginning on or after 1 January 2016). The following change may impact the Group’s consolidated financial statements:
IFRS 5, Non-Current Assets for Sale and Discontinued Operations, was amended to clarify that achange in the manner of disposal (reclassification from “held for sale” to “held for distribution”or vice versa) does not constitute a change to a plan of sale or distribution, and does not have tobe accounted for as such.
Amendments to IAS 1, Presentation of Financial Statements (issued in December 2014 and effective for annual periods on or after 1 January 2016). The standard was amended to clarify the concept of materiality and explains that an entity need not provide a specific disclosure required by an IFRS if the information resulting from that disclosure is not material, even if the IFRS contains a list of specific requirements or describes them as minimum requirements. The standard also provides new guidance on subtotals in financial statements. The Group is currently assessing the impact of the amendments on its consolidated financial statements.
The Group is currently assessing the impact of the amendments on its consolidated financial statements.
The Group’s head office:
PAO SIBUR Holding 16/1 Krzhizhanovskogo St. Moscow, GSP-7, 117997 Russia Tel./fax: +7 (495) 777 5500 Website: www.sibur.ru (Russian) www.sibur.com (English)

Additional information
234SIBUR 2014 Annual Review

Additional Information
The first ZapSibNeftekhim (ZapSib - 2) pile, February 2015
Abbreviations and Units
Nameplate Capacity and Production Capacity Utilisation Rates
Reportable Segments and Product Groups
Disclaimer
Contact Information
Content
235SIBUR 2014 Annual Review
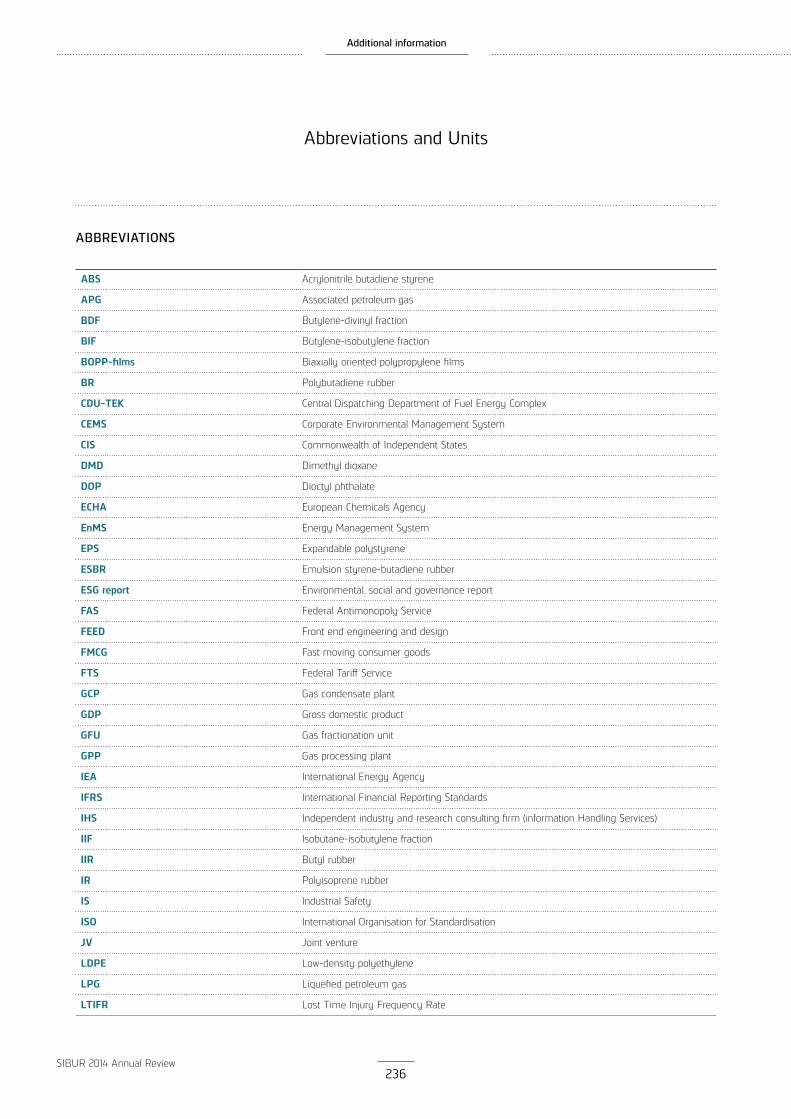
236 SIBUR 2014 Annual Review
ABBREVIATIONS
ABS Acrylonitrile butadiene styrene
APG Associated petroleum gas
BDF Butylene-divinyl fraction
BIF Butylene-isobutylene fraction
BOPP-films Biaxially oriented polypropylene films
BR Polybutadiene rubber
CDU-TEK Central Dispatching Department of Fuel Energy Complex
CEMS Corporate Environmental Management System
CIS Commonwealth of Independent States
DMD Dimethyl dioxane
DOP Dioctyl phthalate
ECHA European Chemicals Agency
EnMS Energy Management System
EPS Expandable polystyrene
ESBR Emulsion styrene-butadiene rubber
ESG report Environmental, social and governance report
FAS Federal Antimonopoly Service
FEED Front end engineering and design
FMCG Fast moving consumer goods
FTS Federal Tariff Service
GCP Gas condensate plant
GDP Gross domestic product
GFU Gas fractionation unit
GPP Gas processing plant
IEA International Energy Agency
IFRS International Financial Reporting Standards
IHS Independent industry and research consulting firm (information Handling Services)
IIF Isobutane-isobutylene fraction
IIR Butyl rubber
IR Polyisoprene rubber
IS Industrial Safety
ISO International Organisation for Standardisation
JV Joint venture
LDPE Low-density polyethylene
LPG Liquefied petroleum gas
LTIFR Lost Time Injury Frequency Rate
Abbreviations and Units
Additional information

Additional information
237SIBUR 2014 Annual Review
UNITS
MTBE Methyl tertiary butyl ether
NBR Nitrile-butadiene rubber
nd-PBR Polybutadiene rubber (Neodymium based)
NGLs Natural gas liquids
NGO Non-governmental organisation
OHS Occupational Health and Safety
PDH facility Propane dehydrogenation facility
PE Polyethylene
PET Polyethylene terephthalate
PP Polypropylene
PTA Terephthalic acid
PVC Polyvinyl chloride
RAS Russian Accounting Standards
Raw NGL Raw natural gas liquid
REACH Registration, Evaluation and Authorization of Chemicals
SBR Styrene-butadiene rubber
SBS Styrene-butadiene-styrene thermoplastic elastomers
SDS Safety data sheets
SPS SIBUR production system
SSBR Solution styrene-butadiene rubber
TPA Terephthalic acid
UGSS Unified Gas Supply System
VAT Value added tax
VHI Voluntary Health Insurance
barrel One stock tank barrel, or 42 US gallons of liquid volume
bbl Barrel(s)
bcm / bcmpa Billion cubic metres / Billion cubic metres per annum
EUR Euro
Gcal Gigacalories
kt / ktpa Thousand tonnes / Thousand tonnes per annum
km Kilometres
kWh Kilowatt-hour
mcm Million cubic metres
mt / mtpa Million tonnes / Million tonnes per annum
MW Megawatt
RR Russian rouble
USD United States dollar
y-o-y Year-on-year

238SIBUR 2014 Annual Review
Nameplate Capacity and Production Capacity Utilisation Rates
The nameplate capacity of our production sites is the capacity registered with the Federal Service for Environmental, Technological and Nuclear Supervision (“Rostekhnadzor”). It is defined as the volume of products that could be produced by a plant or a unit if it operates a certain number of hours per annum, usually less than the number of hours in a calendar year. As such, the nameplate capacity implicitly assumes scheduled shutdowns, but it does not take into account possible cyclicality of scheduled shutdowns (for example,two year maintenance cycle adopted at some of SIBUR’s facilities). The nameplate capacity also does not take into account quality, grade and other characteristics of the products produced.
Capacity utilisation below 100% at other production facilities is driven more by a combination of market demand for each particular productand our decision and ability to switch the production between different types of products. In addition, capacity utilisation levels below 100% may reflect lost days of production due to unscheduled shutdowns at our own facilities as well as at facilities of our suppliers or customers. Capacity utilisation exceeds 100% when we are able to run a facility more efficiently over time, upgrading the technology and implementing various debottlenecking measures. As the nameplate capacity includes scheduled shutdowns, the capacity utilisation at a particular facility may exceed 100% during those periods in which the frequency and duration of shutdowns is less than scheduled.
For our petrochemical facilities we provide capacity for each product group separately, since certain petrochemicals are used forproduction of other products. Capacity utilisation is calculated as total production as a percentage of the weighted average capacity during the year. Weighted average capacity during the year may differ from nameplate capacity as of the year-end, if the capacity was expanded or the asset was consolidated during the respective period. We seek to operate our production facilities at optimal levels of capacity utilisation, taking into consideration prevailing general economic conditions, availability of feedstock, demand for our products and other factors. Capacity utilisationbelow 100% at GPPs is driven primarily by availability of feedstock at a particular location.
Additional information

Additional Information
239SIBUR 2014 Annual Review
Reportable Segments and Product Groups
OPERATING AND REPORTABLE SEGMENTS
Our business comprises two segments: feedstock & energy; and petrochemicals.
Feedstock & energy segment comprises (i) gathering and processing of associated petroleum gas (APG) that we purchase from major Russian oil companies (ii) transportation, fractionation and other processing of natural gas liquids (NGLs) that we produce internally or purchase from major Russian oil and gas companies and (iii) marketing and sales of energy products, such as natural gas, liquefied petroleum gases (LPG), naphtha, raw NGL, methyl tertiary butyl ether (MTBE) and other fuels and fuel additives. We sell these energy products on the Russian and international markets and use some of them as feedstock for our petrochemicals segment.
Petrochemicals segment comprises production and sale of a wide range of petrochemical products, including basic polymers, synthetic rubbers, plastics and organic synthesis products as well as intermediates and other chemicals.
Energy products include LPG, naphtha, natural gas, raw NGL, MTBE, other fuels and fuel additives. Petrochemical products include such product groups as basic polymers, synthetic rubbers, plastics and organic synthesis products, and intermediates and other chemicals. The deviations between revenue split by product group and by segment are explained primarily by the following:
most of our production facilities in both feedstock & energy and in petrochemicals segments provide a range of services to third parties. Such services primarily represent processing of feedstock and intermediates, rental services, energy supply,repairs and maintenance. Revenue from these services is not included in any product group revenue and is reported separately as sales of processing services and other sales;
our petrochemicals segment sells certain volumes of energyproducts, such as LPG and naphtha, to its established clients, which prefer “single window” service.
We define our operating and reportable segments on the basis of the principal production facilitiesoperated by each of the segments and key customers that each segment supplies to. These operating and reportable segments vary significantly in their end-user markets, supply and demand trends, value drivers and consequently current and long-term profitability. SIBUR management measures the performance of the operating and reportable segments based on the EBITDA contribution of each segment. The revenue and expenses of some of our subsidiaries, which provide primarilyenergy supply, transportation,processing, managerial and other services to SIBUR, are not allocated to operating and reportable segments and are reported as unallocated.
KEY PRODUCT GROUPS AND PRODUCTS
In addition to our operating and reportable segments, we monitor our operational performance on the basis of our product groups or products, which we organise into two categories: energy products and petrochemical products.

240SIBUR 2014 Annual Review
Disclaimer
The information contained in this Annual Review pertaining to SIBUR (the “Group”) has been provided by the Company solely for information purposes. By reading this Annual Review, you agree to be bound by the limitations set out below.
The material contained in this Annual Review is presented solely for information purposes and is not to be construed as providing investment advice. As such, it has no regard to the specific investment objectives, financial situation or particular needs of any recipient. It should not be regarded by recipients as a substitute for the exercise of their own judgment.
The Company may not actually achieve or realize its plans, intentions or expectations. There can be no assurance that the Company’s actual results will not differ materially from the expectations set forth in such forward-looking statements. Factors that could cause actual results to differ from such expectations include, but are not limited to, the state of the global economy, the ability of the petrochemical sector to maintain levels of growth and development, risks related to petrochemical prices and regional political and securityconcerns. The above is not an exhaustive list of the factors that could cause actual results to differ materially from the expectations set forth in such forward-looking statements. The Company and its Affiliates are under no obligation to update the information, opinions or forward-looking statements in this Annual Review.
There may be material variances between estimated data set forth in this Annual Review and actual results, and between the data set forth in this Annual Review and corresponding data previously published by or on behalf of the Company.
This Annual Review contains forward-looking statements, including (without limitation) statements, based on the current expectations and projections of the Company about future events and are subject to change without notice. All statements, other than statements of historical fact, contained herein are forward-looking statements. Forward-looking statements are subject to inherent risks and uncertainties, such that future events and actual results may differ materially from those set forth in, contemplated by or underlying such forward-looking statements.
Additional information
Additional information
241SIBUR 2014 Annual Review
Contact Information
LEGAL OFFICE
Building 30, No. 6, Quarter 1, Vostochniy Industrial District,Tobolsk, Tyumen Region, 626150Tel./Fax: +7 (3456) 266 686
HEAD OFFICE
16/1 Krzhizhanovskogo St.Moscow, GSP-7, 117997Tel./Fax: +7 (495) 777 5500
MEDIA CENTER
Anna Lebed-LastukhinaInternational Media RelationsTel.: + 7 (495) 937 1726E-mail: [email protected]
INVESTOR RELATIONS
Olga KostyurinaDarya BelovaTatyana StepanovaTel.: +7 (495) 777 5500 (*34-99)E-mail: [email protected]
OUR WEBSITE
http://investors.sibur.com


![EN SE FI DK NO ET LT LV … · 10. Hastighetsknappar: Hög, medel, låg [BLN-006] Hastighetsvred [BLN-005, BLN-007] 11. Timer-knappar: 35, 60 och 90 sekunder [BLN-006] För din säkerhet](https://static.fdocuments.net/doc/165x107/5f8778a08ff0f16fc94b1049/en-se-fi-dk-no-et-lt-lv-10-hastighetsknappar-hg-medel-lg-bln-006-hastighetsvred.jpg)