ANNUAL RESULTS ANNOUNCEMENT FOR THE YEAR ENDED 31 MARCH...
27
ANNUAL RESULTS ANNOUNCEMENT FOR THE YEAR ENDED 31 MARCH 2013
-
Upload
nguyenliem -
Category
Documents
-
view
215 -
download
0
Transcript of ANNUAL RESULTS ANNOUNCEMENT FOR THE YEAR ENDED 31 MARCH...

ANNUAL RESULTS ANNOUNCEMENT FOR THE YEAR ENDED 31 MARCH 2013

- 2 -
Highlights For the year ended 31 Mar 2012 2013 Change
(million €)
913.4 1,043.4 +14.2%
Gross profit 755.5 855.5 +13.2% Gross profit margin 82.7% 82.0% -0.7 pp
Operating profit 152.3 158.3 +3.9% Operating profit margin 16.7% 15.2% -1.5 pp
Profit for the year 124.2 125.6 +1.1% Net profit margin 13.6% 12.0% -1.6 pp
Earnings per share (€ per share) 0.082 0.083 +1.6%
Dividend per share (€ per share)* 0.0247 0.0292 +18.3%
30% 35%
Net cash 239.1 237.2 -0.8%
Net sales
Dividend payout ratio*
* The figure illustrates dividends declared for the period indicated, not actual dividends paid during the period indicated. Final dividend proposed for the year ended 2013 was €0.0292 per share, which is subject to the approval of the shareholders of the Company at the forthcoming Annual General Meeting.

Sell-out75%
Sell-inB-to-B25%
(FY2012: 25%)
(FY2012: 75%)
Net sales breakdown
Retail led growth from Sell-out Exposure to growth markets
- 3 -
Japan21%
USA12%
Hong Kong11%France
8%China
7%
Russia5%
UK5%
Brazil4%
Taiwan3%
Other countries
24%

- 4 -
Net sales up 14.2%
(1) Includes mail-order and other sales (2) Excluding foreign currency translation effects
0
100
200
300
400
500
600
Compstores
Non-compstores
OtherSell-Out
Sell-in FX rates
million €
FY2012
FY2013
12%
overall sales growth: 14.2%local currency growth: 11.3%
currencies: 2.9%
Contributionto growth(2):
12% 65% 1% 22%
+2.3%
+58%
+11%
+10%
(1)

0
20
40
60
80
100
120
140
France UK USA Brazil Russia
FY2012 FY2013
4% 6% 13% 3%
+6%
+13%
13%
+7%+30%
Contribution
to growth(1):
+14%
million €
Sales growth by geography – 1 (local currency)
- 5 -
(1) Excluding foreign currency translation effects

Sales growth by geography – 2 (local currency)
- 6 -
(1) Excluding foreign currency translation effects
0
50
100
150
200
250
300
Japan Hong Kong China Taiwan Othercountries FX rates
FY2012 FY2013
1% 12% 12% 1% 33%
+1%
+14%
+24% +4%
+17%
Contribution
to growth(1):
million €

Sales growth in other major countries (local currency)
- 7 -
Korea Canada Germany Spain Italy
FY2012 FY2013
+16%
+20%
+23%
+8% +17%

Stores network: global expansion on track
- 8 -
*
* includes 10 stores from the acquisition of distributor in Ireland
1,053
1,198
1,029 1,166
FY2012 FY2013
own stores non-own stores
2,082 2,364 +282
+145
+14%
+14%

Net stores openings by region* Retail expansion on track, 135 own stores added during FY2013
*Excluding acquisitions, 16 stores from distributor in Malaysia and 10 stores from distributor in Ireland as at 31 March 2012 and 31 March 2013, respectively.
- 9 -
64
25
53
142
50
28
57
135
Asia-Pacific Americas Europe Total
FY2012 FY2013
Net store openings profile
- 10 -
7
23
1
26
2
Brazil Russia India China Mexico
10 8
16
3 5 7 84
Japan Korea USA Canada UK Germany Spain Italy

Same Store Sales Growth profile FY2013 as compared to FY2012
- 11 -
5.0%
15.4% 10.7% 13.3% 15.3%6.1% 7.7% 8.4%
-7.0%
9.4%
France UK USA Brazil Russia
-3.1%
29.6%
18.2%
1.7%6.6% 6.7%
-4.9%
5.1% 9.1%
-4.8%
3.8% 2.3%
Japan Hong Kong China Taiwan Othercountries
Group
FY2012 FY2013
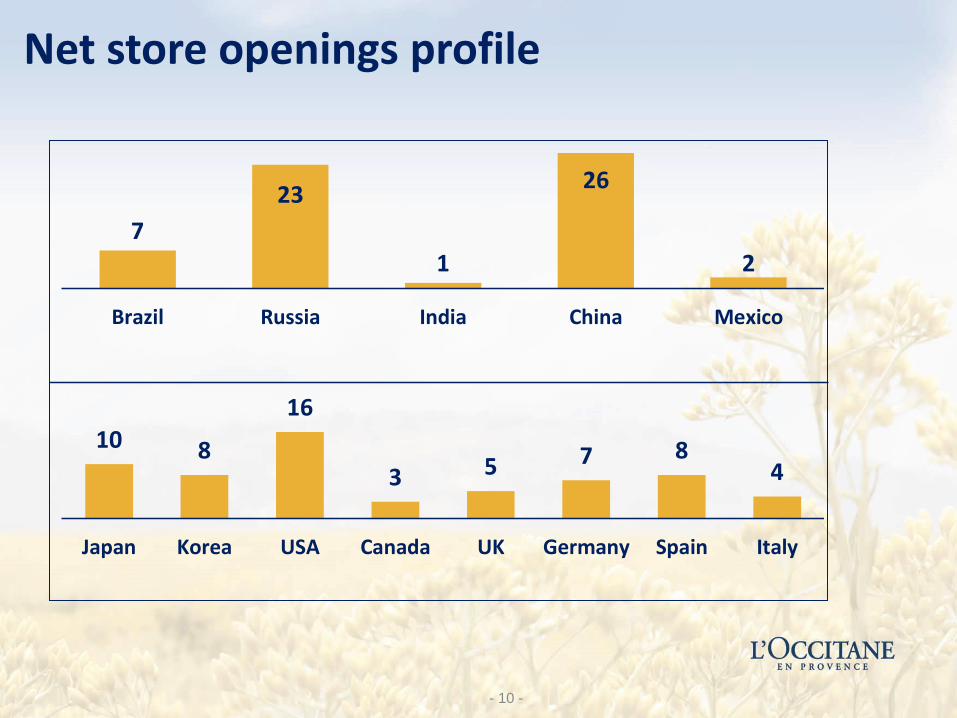
Profitability analysis
- 12 -
% of net sales
For the year ended 31 Mar 2012 2013 Change
Gross profit margin 82.7 82.0 (0.7)
Distribution expenses (44.9) (45.9) (1.0)
Marketing expenses (10.1) (10.3) (0.2)
Research & development expenses (0.7) (0.9) (0.2)
General & administrative expenses (10.2) (9.7) 0.5
Other (losses) / gains (0.1) (0.1) 0.1
Operating profit margin 16.7 15.2 (1.5)

Gross margin
- 13 -
82.7%
-1.0-0.6 -0.4 +0.5 +0.3 +0.5
82.0%
FY2012 promoarticles
timingfreight &
duties
brand &country
mix,production
Salesprices,
productmix
channelmix &other
FX FY2013

Distribution expenses (as % of net sales)
- 14 -
(44.9%)
-0.7 -0.3-0.3 +0.1 +0.2
(45.9%)
FY2012 investmentschannel
mix
retailcost
increase FX reclass FY2013

Marketing expenses (as % of net sales)
- 15 -
(10.1%)
-0.6 -0.1 +0.1 +0.2 +0.2
(10.3%)
FY 2012 investments other FXpromotools leverage FY 2013
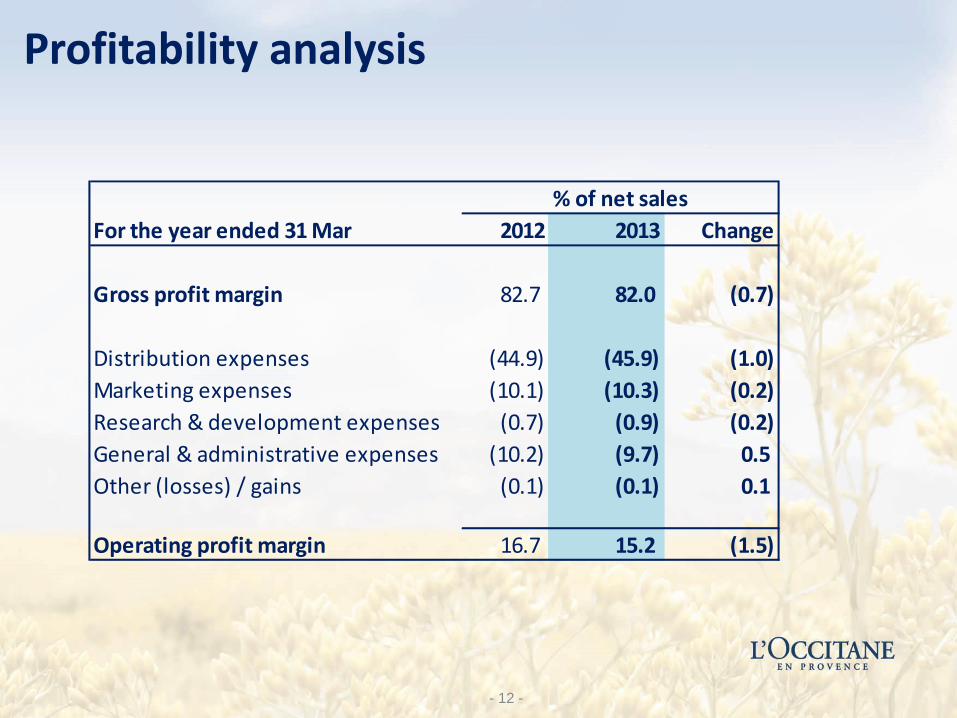
(10.2%)
+0.5+0.2 -0.2
(9.7%)
FY2012 leverage FX investments FY2013
G & A expenses (as % of net sales)
- 16 -

Operating profit margin
- 17 -
16.7%
-1.7
-0.6-0.6 -0.3 +0.5 +0.6
+0.6
15.2%
FY2012 investments timingfreight &
duties
brandchannelcountry
mix
retailcost
increase
prices,product
mix
leverage FX FY2013

263
+11 -8 -10
256
FY2012 MPPsBoxes
recognition
raw mat.components
localcoverage
FY2013
Working capital ratios
Inventory turnover days
- 18 -
as at: 31 Mar 2012 31 Mar 2013 Change
Inventory turnover days ( based on cost of sales) 263 256 -7
Trade receivables turnover days (based on net sales) 27 29 1
Trade payables turnover days (based on cost of sales) 181 174 -7
Cash cycle (days of net sales) 41 43 2

Cash flow from operations
- 19 -
* Profit before tax, adjusted from non-cash items
196
-17
-43
135
206
-19 -42
144
Profit* Changeworkingcapital
Incometax paid
Cash flowfrom
operations
million €
FY2012 FY2013
+5% +9 million €

Capital expenditures
- 20 -
3.4
29.8
8.4 4.7 3.1
49.4
12.6
32.6
11.821.4
5.1
83.4
4.6
39.8
13.8
38.3
4.3
100.9
acquisitionof
subsidiaries
stores Info.Tech.
factoriesR&D
others Total
million €
FY2011 FY2012 FY2013

As at: (million €)
31 Mar 2012
31 Mar 2013
% Change
Profit before tax, adj. for non-cash items 196.2 205.6 4.8%
Changes in working capital (17.3) (19.2) 10.9%
Income tax paid (43.5) (42.0) -3.4%
Net cash flow from operations 135.4 144.4 6.6%
Cash outflow from investing (83.4) (100.9)
Cash flow from financing (37.8) (28.7)
Effect of the exchange rate changes (5.8) (3.3)
Net change in cash and cash equivalents 8.4 11.5
Cash flow analysis
- 21 -

Balance sheet ratios
For the year ended 31 Mar 2012 2013
Profitability
Return on Capital Employed (ROCE)(1) 29.8% 25.5%
Return on equity (ROE)(2) 18.6% 16.8%
Liquidity
Current ratio (times)(3) 3.38 3.41
Quick ratio (times)(4) 2.62 2.63
Capital adequacy
Gearing ratio(5) 7.6% 8.0%
Debt to equity ratio(6) Net cash Net cash
(1) Net Operating Profit After Tax / Capital Employed (2) Net profit attributable to equity owners / shareholders' equity excluding minority interest (3) Current assets / current liabilities (4) Current assets - stocks / current liabilities (5) Total debt / total assets (6) Net debt / (total assets - total liabilities) * 100%
NOPAT = (Operating Profit + foreign currency net gains or losses) x (1 - effective tax rate)
Capital Employed = Non-current assets - (deferred tax liabilities + other financial liabilities + other non-current liabilities) + working capital
- 22 -

FY2013 marked a key milestone
• The Group’s net sales surpasses billion euro mark
Continued investing for future growth
• Maintained strong double-digit top-line growth
• Global retail network expansion strategy on track
• Russia and China remained fastest growing countries
• E-commerce - A key growth driver
Strategic review
- 23 -

Strategic review
Strong Brand Portfolio
The Group now has five brands Building core brand & broadening
depth and accessibility of each brand o Extending L’Occitane brand –
new stores, renovations and digital marketing
o L’Occitane au Brésil – exclusive in Brazil
o Melvita – new management team
o Le Couvent des Minimes – develop wholesale business in the United States and Japan
o Acquiring Erborian – expand current network channels and diversify product categories
- 24 -
Operational Excellence
Executing and delivering sustainable profitable growth over the long term
Operational excellence
o Expanding manufacturing, logistics and R&D capacity
o Leveraging the information investment o Building customer centricity with
digital investments

1. Extending the Group’s top-line growth platform
Further expansion of stores network Two new large format stores in Japan Accelerate strong store renovation program Further digital initiatives Innovation focus to create new textures, new active ingredients
and new processes Strengthen the respective brand’s product portfolio
• Committed to overall corporate strategy
Prospects
2. Striving at operational and financial excellence
New Manosque facility fully operational in November - major benefits in capacity and quality Implementation of SAP - production environment benefit in
terms of improved efficiencies SAP roll-out - USA and Japan will go live in FY2014 and expect
further roll-out in more countries during FY2015 Global assessment of back-office and indirect structures – to
optimize ROI in systems and key human resources
- 25 -

This document is for information purposes only without any binding effect; in case of any inaccuracies, incompleteness or inconsistency with other documents, only the Company’s latest issued annual or interim report for detailed financials shall prevail and shall be deemed to be the only official document.
Disclaimer