Annual Results 2015 Corporate Presentation
21
Annual Results 2015 Corporate Presentation March 2016
Transcript of Annual Results 2015 Corporate Presentation

Annual Results 2015
Corporate Presentation
March 2016
經營回顧
Contents
Business Review
Future Plans
Appendix
Financial Review

Financial Review
3
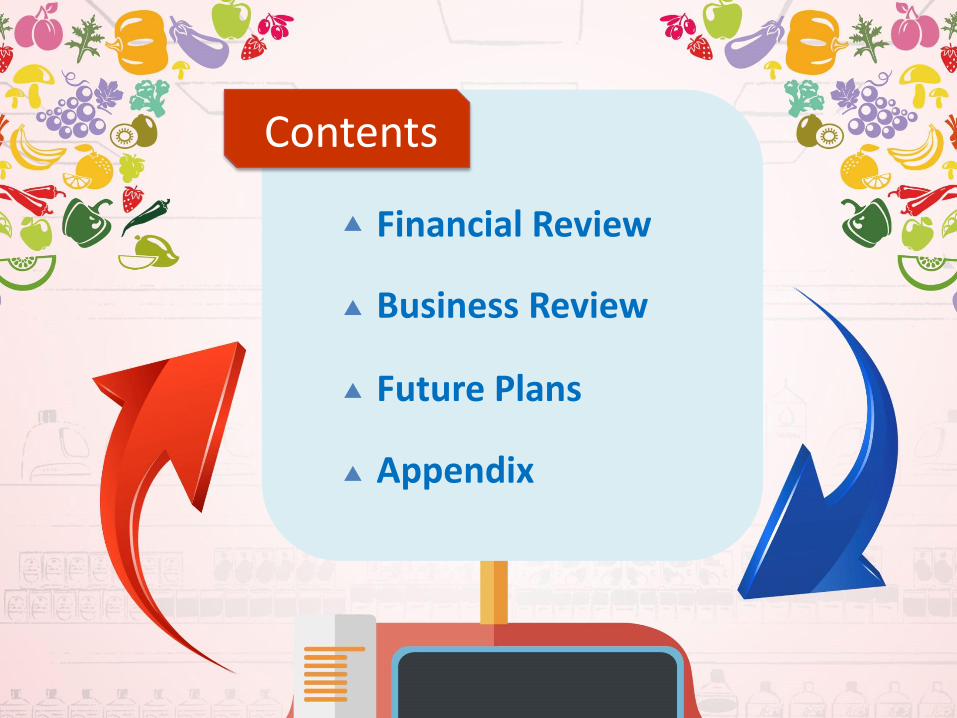
Financial Summary
(RMB ‘000) 2015 2014 +/- Change
Revenue from principal business 10,572,672 10,007,135 565,537 5.7%
EBIT 275,325 317,260 -41,935 -13.2%
Interest expenses 161,946 184,757 -22,811 -12.3%
Profit before tax 113,379 132,503 -19,124 -14.4%
Profit attributable to shareholders 24,865 41,330 -16,465 -39.8%
Basic EPS (RMB) 0.06 0.10 -0.04 -40.0%

4
Financial Summary – gross profit & other income
(RMB ‘000) 2015 2014 +/- Change
Revenue from principal business 10,572,672 10,007,135 565,537 5.7%
Gross profit 1,352,009 1,331,557 20,452 1.5%
Other income 959,805 883,624 76,181 8.6%
Gross profit & other income 2,311,814 2,215,181 96,633 4.4%
(Gross profit & other income)/ revenue from principal business
21.9% 22.1% - -0.2p.p
5
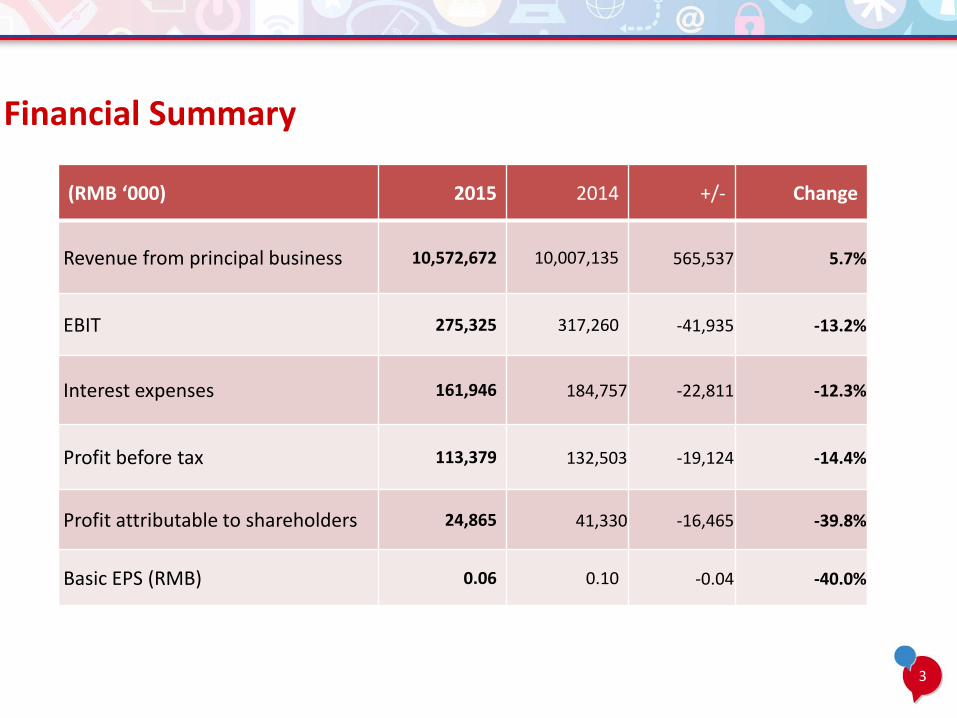
Financial Summary – cost breakdown
(RMB ‘000) 2015 2014 +/- Change
Selling and distribution costs & administration expenses
1,980,691 1,857,477 123,214 6.6%
(Selling and distribution costs & administration expenses)/ revenue from principal business
18.7% 18.6% - 0.1p.p
Including:
Labor cost 731,792 628,861 102,931 16.4%
Labor cost / revenue from principal business
6.9% 6.3% - 0.6p.p
Advertisement fee 361,859 282,311 79,548 28.2%

6
Retail Business (directly-operated)
• Refers to the GP margin of directly-operated hypermarkets, supermarkets and convenience stores.
0
500
1,000
1,500
2,000
2,500
3,000
3,500
4,000
4,500
5,000
2014 2015
Department Stores
Convenience Stores
Supermarkets
Hypermarkets
1,300
2,937
2,901
329 306
52.347.7
-7.1%
-8.7%
(RMB million)
1,325-1.9%
-1.2%
Revenue Breakdown by Retail Segments
Gross Profit Margin*
15.9%15.7%
10%
11%
12%
13%
14%
15%
16%
17%
2014 2015
7
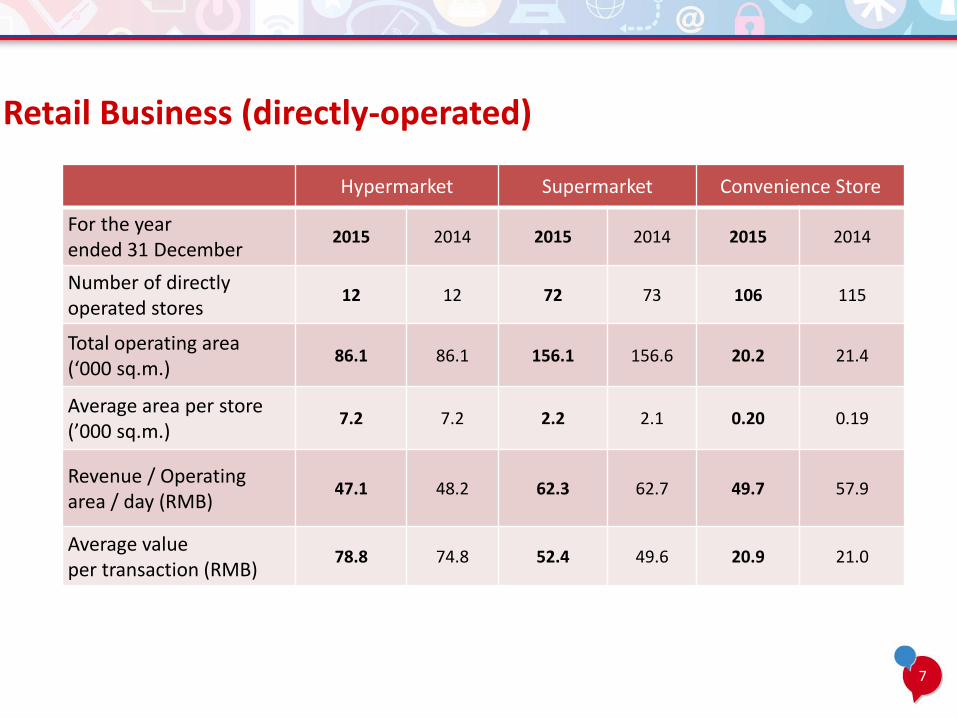
Retail Business (directly-operated)
Hypermarket Supermarket Convenience Store
For the year ended 31 December
2015 2014 2015 2014 2015 2014
Number of directly operated stores
12 12 72 73 106 115
Total operating area (‘000 sq.m.)
86.1 86.1 156.1 156.6 20.2 21.4
Average area per store(’000 sq.m.)
7.2 7.2 2.2 2.1 0.20 0.19
Revenue / Operatingarea / day (RMB)
47.1 48.2 62.3 62.7 49.7 57.9
Average valueper transaction (RMB)
78.8 74.8 52.4 49.6 20.9 21.0

8
2014 2015
Wholesale Business
* Refers to revenue from principal business recognised by Chaopi Trading and its subsidiaries including intersegment sales.
Revenue from principal business*
(RMB million)
+11.2%
5,858
6,513
2015
Online e-commerce suppliers business
Wholesale merchant business
25.69%
74.31%
2014
Online e-commerce suppliers business
Wholesale merchant business
16.33%
83.67%
9
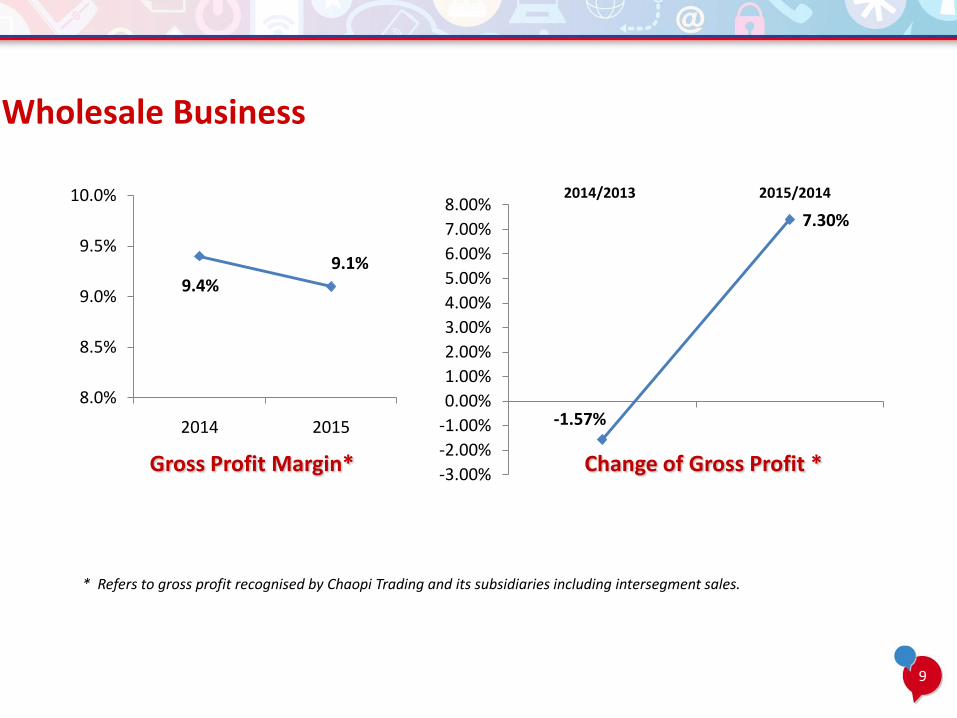
8.0%
8.5%
9.0%
9.5%
10.0%
2014 2015
9.4%
Wholesale Business
* Refers to gross profit recognised by Chaopi Trading and its subsidiaries including intersegment sales.
Gross Profit Margin*
9.1%
-1.57%
7.30%
-3.00%
-2.00%
-1.00%
0.00%
1.00%
2.00%
3.00%
4.00%
5.00%
6.00%
7.00%
8.00%
Change of Gross Profit *
2015/20142014/2013

10
Financial figures – turnover days
Retail Business Wholesale Business
2015 2014 2015 2014
Inventory turnover days 35 34 69 73
Debtor turnover days 2 2 98 104
Creditor turnover days 74 72 43 40

Business Review

Prudently expanded the retail network
Retail Business
12
Adjusted store-opening strategies and strived to improve the environment of the stores :
Renovated and upgraded 9 stores (including 4 supermarkets and 5 convenience stores)
Opened 5 franchise-operated convenience stores
Number and net operating area of retail outlets as at 31 December 2015
Department stores
Hypermarket Supermarket Convenience Stores
Total
Number of retail outlets:
Directly-operated 2 12 72 106 192
Franchise-operated - - 1 68 69
Total 2 12 73 174 261
Net operating area (square meters):
Directly-operated 39,742 86,089 156,134 20,214 302,179
Franchise-operated - - 880 13,631 14,511
Total 39,742 86,089 157,014 33,845 316,690

Retail Business improvement
13
Paid attention to the business operation of live and fresh merchandise and
brought out the advantages in physical stores
Diversified marketing approaches
Launched mobile e-commerce operation and consolidated online and offline
business operations

Wholesale Business improvement
14
Strived hard to develop the business of supplying through e-commerce
Extended towards upstream operations and optimized product mix
Upgraded the logistics and distribution system for better services
Chaopi’s products of private labels

Future Plans

Retail Business
Future Plans
16
Utilize mobile internet technologies to expand advantages in community-based physical
retail stores:
Keep on utilizing the advantage of resources of physical stores, and continually improve
and enrich functions of the online mobile app
Enrich online marketing activities using the principles of "goods, services and costs" as a
starting point and will realize the concurrent development of online and offline businesses
To innovate a small-scale development operation model and will try to open community
stores with live and fresh merchandise

Wholesale Business
Future Plans
17
Adapt to new changes in the e-commerce market by carrying out transformation of the
wholesale business :
Innovate the traditional mode of business operation and, through exchange and sharing
of information and data, reform its relationship with suppliers and retailers
Emphasize constructing a system of "Online Chaopi"
Keep on enriching the types and brands of goods in online business operation, which will
supplement offline product categories
Accelerate the development of its own brands, tailor-made goods and imported
goods, so as to gain the advantage of systematic development

Appendix
19
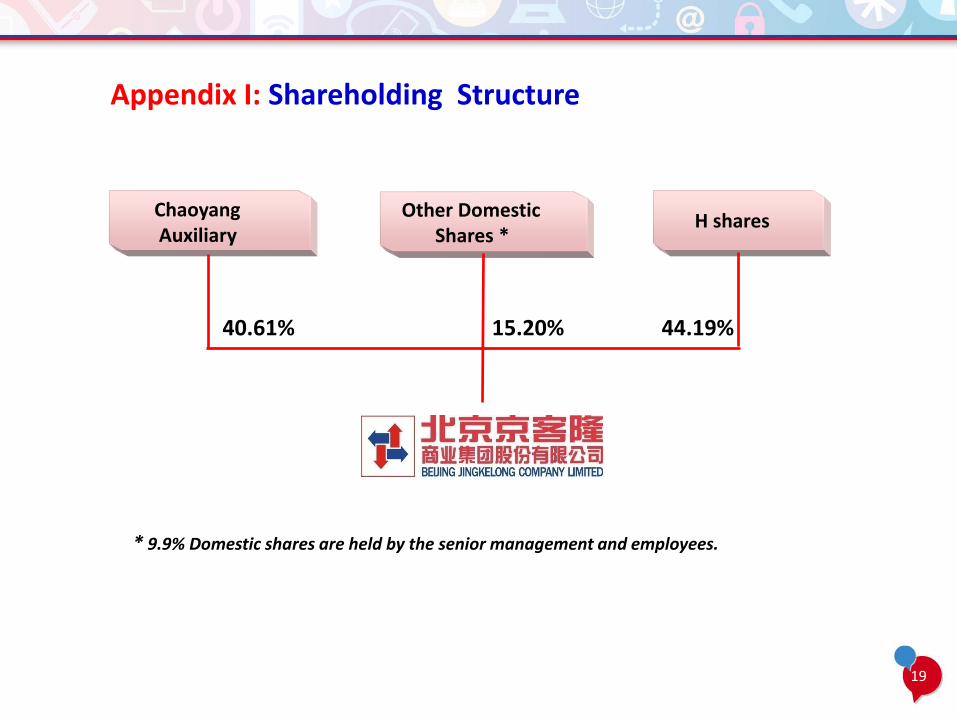
Appendix I: Shareholding Structure
ChaoyangAuxiliary
Other DomesticShares *
H shares
40.61% 15.20% 44.19%
* 9.9% Domestic shares are held by the senior management and employees.

20
Retailing
Hypermarkets
Supermarkets
Convenience StoresNormal -Temperature
Logistics Center
Live and FreshProduce Logistics
Center
Wholesaling
Tianjin Distribution Center
Beijing Distribution Center
28 Subsidiaries
Department Stores79.85%
Appendix II: Business Structure