ANNUAL REPORT - Warrigal Road · Warrigal Road State School 2016 ANNUAL REPORT ... The key...
15
1 Warrigal Road State School 2016 ANNUAL REPORT Queensland State School Reporting Inspiring minds. Creating opportunities. Shaping Queensland’s future. Every student succeeding. State Schools Strategy 2016-2020 Department of Education and Training
Transcript of ANNUAL REPORT - Warrigal Road · Warrigal Road State School 2016 ANNUAL REPORT ... The key...

1
Warrigal Road State School
2016 ANNUAL REPORT
Queensland State School Reporting
Inspiring minds. Creating opportunities. Shaping Queensland’s future. Every student succeeding. State Schools Strategy 2016-2020
Department of Education and Training

2
Contact Information
Postal address: 314 Warrigal Road Eight Mile Plains 4113
Phone: (07) 3340 5333
Fax: (07) 3340 5300
Email: [email protected]
Webpages: Additional reporting information pertaining to Queensland state schools is located on the My School website and the Queensland Government data website.
Contact Person: Mrs Dianne Carter

3
School Overview
Warrigal Road School is a learning community whose members work together to create a quality educational environment for students, staff and parents. We place a high priority on achieving and maintaining excellent standards in Literacy, Numeracy and Science. We are proud of the achievements of our students in the sporting and cultural arenas and equally proud of their social skills and respect for themselves and others. Our school is highly multicultural and inclusive. We welcome and support families from all over the world and value and foster positive behaviours, tolerance and understanding of difference. All members of staff are committed to the achievement of high standards in learning and teaching. They strive to improve their knowledge and skills as educators and co-learners and create dynamic, stimulating and vibrant learning environments for all students. We offer a broad curriculum and extensive extra-curricular programs which enable students to experience new challenges and opportunities beyond the classroom. Students, parents and staff are actively involved in the life of the school and share a commitment to its future development and growth.
The school values are evident in the school rules which state: I am respectful, I am responsible, I am safe and I am an active learner.
Principal’s Foreword
Introduction
The following report provides information on the profile of the school, the priorities undertaken in 2016 and the progress that has been made towards achieving the goals set for these priorities. It also provides an insight into the future direction the school will take and the reasoning behind this.
School Progress towards its goals in 2016
In 2016, the priorities for Warrigal Road State School were: Every child every day achieving his/her best through High Yield teaching strategies. This was to be enabled by timely appropriate targeted intervention for every child and specific data analysis that informs planning and teaching. The journey in regard to high yield teaching strategies began in 2015 and will continue to inform the improvement agenda.
Future Outlook
With the work already done in Reading, Numeracy had taken prominence in 2015 and the strategic planning focussed on developing commonalities between reading and numeracy in terms of high yield teaching strategies. The work done in 2015 in high yield teaching strategies was continued with implementation of these methods across the school including: the gradual release model; guided reading, writing and mathematics; the use of Mazano’s Art and Science of Teaching in the formation of the Pedagogical Framework; the use of WALT and WILF; goal setting; and individual student differentiation and tracking .
From the belief that the success of all plans is in the implementation, the school embarked on a drive to ensure that the implementation process of the school’s key priorities stayed focused, narrow and sharp until practices were embedded in school culture and practice. The key priorities were to drive improvement into 2016 and beyond, developing a consistency of practice through strong distributed leadership principles.
Triangulation of data from different sources, that is, NAPLAN, other normed forms of tes ting such as Pat reading and so on, and school based A-E data, has better informed student achievement tracking. Student achievement tracking drives differentiated instruction and targeted support and intervention at the micro-level. Student achievement also informs the teaching cycle, so that high yield teaching strategies can be selected to match learning needs. This has resulted in improved results in the upper two bands in NAPLAN in 2016.

4
Professional development for teachers and teacher-aides is available in the form of after-school and before school offerings based on the needs expressed by the staff in their developing performance conversations. The smorgasbord of offerings enable s teachers to tailor their professional development to meet their self -identified needs. The model of professional development also involves coaching and mentoring,

5
Our School at a Glance
School Profile
Coeducational or single sex: Coeducational
Independent Public School: No
Year levels offered in 2016: Prep Year - Year 6
Student enrolments for this school:
Total Girls Boys Indigenous
Enrolment Continuity
(Feb – Nov)
2014 1328 645 683 11 96%
2015* 1226 608 618 14 96%
2016 1258 622 636 14 95%
Student counts are based on the Census (August) enrolment collection.
*From 2015, data for all state high schools include Year 7 students. Prior to 2015, only state high schools offering Year 7 had these students included in their counts.
Little Warrigals is a program that is offered in terms 3 and 4 for those students who are enrolled to begin Prep in 2016. This program is delivered by the Prep teachers and aims to enable a smooth transition to school. *Pre-Prep is a kindergarten program for Aboriginal and Torres Strait Islander children, living across 35 Aboriginal and Torres Strait Islander communities, in the year before school (http://deta.qld.gov.au/earlychildhood/families/pre-prep-indigenous.html).
Characteristics of the Student Body
Overview As a multi-cultural school, Warrigal Road State School values diversity. Students with Australian, Chinese, Korean and Indian cultural backgrounds form the majority of the schools’ population. As a large urban school, with approximately 60 students participating in the Special Education Program, Warrigal Road promotes an inclusive culture for all students. 1% of students represent the Indigenous population, and the school has over 50 different cultures represented. An Enrolment Management Policy is employed to ensure consistency of student numbers, so that existing resources can support student learning programs effectively. Our total enrolment continues to grow and 60% of students speak a language other than English at home. Average Class Sizes The following table shows the average class size information for each phase of schooling.
AVERAGE CLASS SIZES
Phase 2014 2015* 2016
Prep – Year 3 24 24 24
Year 4 – Year 7 25 26 27
Year 8 – Year 10
Year 11 – Year 12
*From 2015, data for all state high schools include Year 7 students. Prior to 2015, only state high schools offering Year 7 had these students included in their counts.

6
Curriculum Delivery
Our Approach to Curriculum Delivery
Instrumental Music Program
Focused teaching strategies
Little Warrigals Program for Pre-prep students
Parenting Programs
Early Intervention programs
LOTE (Mandarin)
Guided reading, writing and Mathematics
Moderated year level assessment tasks
Extensive sports program
Robotics program
High Yield teaching strategies
Co-curricular Activities
ICAS competitions
Readers Club
Chess Club
Playground Buddies
Senior buddies
Optiminds
Writers Workshops
Coding Clubs
Drama Club
Science Expo
Student Council
Mates Club
Craft Club
Music – bands and choirs
After school sports program
How Information and Communication Technologies are used to Assist Learning
In 2016, the number of Laptop classes in years 4 to 6 was 6. Students in other classes have access
to 6 computers and 6 i-pads in most classrooms to support learning. The pedagogical approach is
based on the SAMR model and Technology is used as a means to differentiate instruction. All
classrooms are equipped with interactive white boards
Social Climate
Overview Warrigal Road State School is a SWPBS school (School Wide Positive Behavior Support). The
leadership team and a SWPBS committee attended training and through weekly meetings and an
extensive consultation process, developed The Warrigal Way framework. This ensures a consistent
positive approach to behaviour management at a whole school level. The Din family of dingoes
(Warrigal means ‘dingo’ in the local indigenous language) were devised to help communicate our four
school rules: be respectful, be responsible, be safe and be an active learner. Positive reward systems
and systems for dealing with rule violations were developed and resources to support these systems
were produced and purchased.
7
Students at Warrigal Road currently employ the Hi Five strategy to manage incidents in the
playground. Bullying is not tolerated at Warrigal Road State School and parents and students have
communicated that they are satisfied the school provides a safe environment. The school has an
alternate playground program which it uses to assist students in the early years and older students
who need extra support to develop those social skills necessary to transition into the mainstream
playground. Warrigal Road State School is also a Responsible Thinking School, and students who do
not follow the class rules are sent to a buddy class to reflect on their behaviour and create a plan for
improved behaviour in the future. Playground Buddies are used in the school and they work with the
younger students, teaching them a variety of games and activities so that break time is social and
enjoyable.
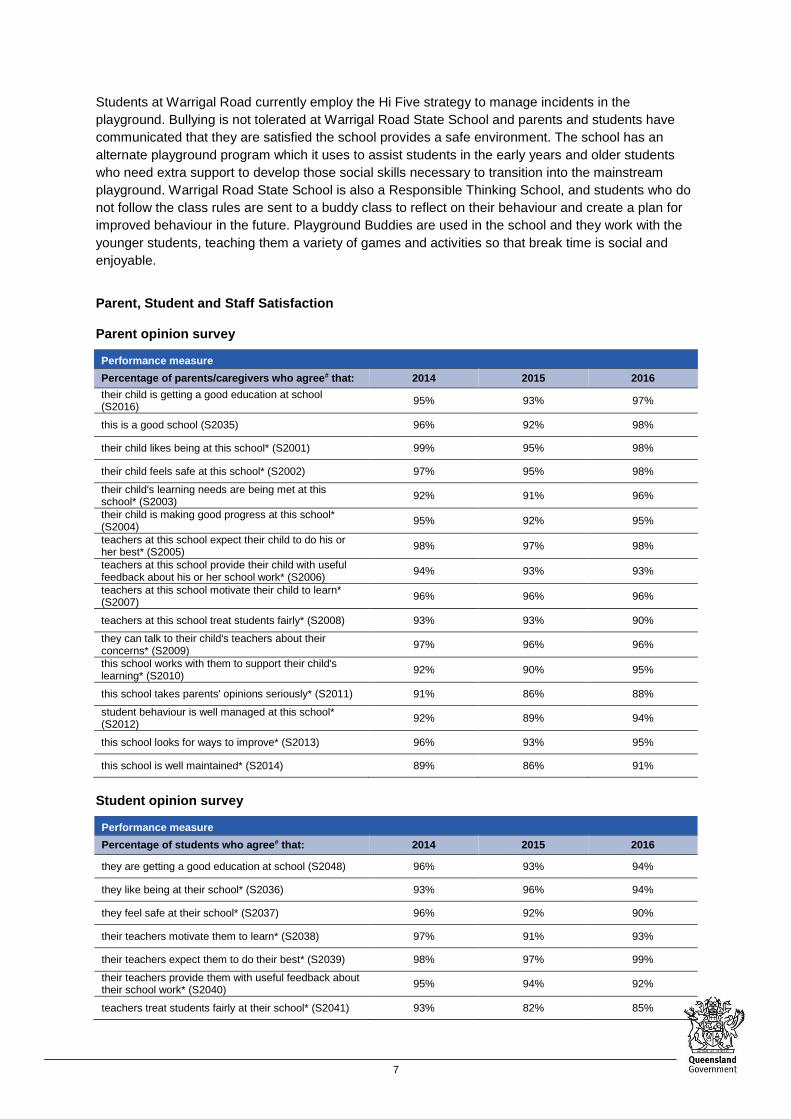
Parent, Student and Staff Satisfaction Parent opinion survey
Performance measure
Percentage of parents/caregivers who agree# that: 2014 2015 2016
their child is getting a good education at school (S2016)
95% 93% 97%
this is a good school (S2035) 96% 92% 98%
their child likes being at this school* (S2001) 99% 95% 98%
their child feels safe at this school* (S2002) 97% 95% 98%
their child's learning needs are being met at this school* (S2003)
92% 91% 96%
their child is making good progress at this school* (S2004)
95% 92% 95%
teachers at this school expect their child to do his or her best* (S2005)
98% 97% 98%
teachers at this school provide their child with useful feedback about his or her school work* (S2006)
94% 93% 93%
teachers at this school motivate their child to learn* (S2007)
96% 96% 96%
teachers at this school treat students fairly* (S2008) 93% 93% 90%
they can talk to their child's teachers about their concerns* (S2009)
97% 96% 96%
this school works with them to support their child's learning* (S2010)
92% 90% 95%
this school takes parents' opinions seriously* (S2011) 91% 86% 88%
student behaviour is well managed at this school* (S2012)
92% 89% 94%
this school looks for ways to improve* (S2013) 96% 93% 95%
this school is well maintained* (S2014) 89% 86% 91%
Student opinion survey
Performance measure
Percentage of students who agree# that: 2014 2015 2016
they are getting a good education at school (S2048) 96% 93% 94%
they like being at their school* (S2036) 93% 96% 94%
they feel safe at their school* (S2037) 96% 92% 90%
their teachers motivate them to learn* (S2038) 97% 91% 93%
their teachers expect them to do their best* (S2039) 98% 97% 99%
their teachers provide them with useful feedback about their school work* (S2040)
95% 94% 92%
teachers treat students fairly at their school* (S2041) 93% 82% 85%

8
Performance measure
Percentage of students who agree# that: 2014 2015 2016
they can talk to their teachers about their concerns* (S2042)
84% 80% 83%
their school takes students' opinions seriously* (S2043)
90% 83% 87%
student behaviour is well managed at their school* (S2044)
80% 80% 82%
their school looks for ways to improve* (S2045) 97% 90% 95%
their school is well maintained* (S2046) 95% 89% 92%
their school gives them opportunities to do interesting things* (S2047)
93% 86% 89%
Staff opinion survey
Performance measure
Percentage of school staff who agree# that: 2014 2015 2016
they enjoy working at their school (S2069) 96% 94% 98%
they feel that their school is a safe place in which to work (S2070)
99% 97% 96%
they receive useful feedback about their work at their school (S2071)
78% 83% 91%
they feel confident embedding Aboriginal and Torres Strait Islander perspectives across the learning areas (S2114)
84% 90% 81%
students are encouraged to do their best at their school (S2072)
99% 99% 99%
students are treated fairly at their school (S2073) 97% 94% 99%
student behaviour is well managed at their school (S2074)
98% 93% 98%
staff are well supported at their school (S2075) 86% 82% 92%
their school takes staff opinions seriously (S2076) 82% 70% 91%
their school looks for ways to improve (S2077) 97% 93% 97%
their school is well maintained (S2078) 89% 74% 92%
their school gives them opportunities to do interesting things (S2079)
89% 90% 92%
* Nationally agreed student and parent/caregiver items # ‘Agree’ represents the percentage of respondents who Somewhat Agree, Agree or Strongly Agree with the statement. DW = Data withheld to ensure confidentiality.
Parent and community engagement As first educators, parents are highly valued at Warrigal Road State School. In 2016, a number of workshops were provided for parents across key learning areas: Strategies to assist a child to read, Numeracy, NAPLAN, assessment, etc. Parents volunteer to support learning in the classrooms and each year we celebrate our volunteer program with a Morning Tea function.
The school is seen as a hub in the community and celebrations such as Warrigala, class showcases, Mother’s Day, Science Expo, Father’s Day and sports days are well attended. Provisions are made for a diversity of religious instruction attended with parent permission, Interpreters are provided to ensure that communication is facilitated with our deaf community, and the school has a sister school program with a school in Beijing.
We have partnerships with several organizations to enrich our students learning experiences. In the field of Science we have partnerships with Griffith University and Toohey Forest Environmental Park. Other examples of community engagement are as follows:
A uniform shop and a tuckshop is provided by the P&C for community convenience, and various sub-committees raise funds to support the school’s facilities program.
Curriculum programs are differentiated and support is provided through the school’s intervention program which has been commended in our whole school review.

9
Assemblies
Interagency relationships to support our intervention. Respectful relationships programs
The school implements a social skilling program and personal safety program that includes ‘Day for Daniel’ and a term focus each year on safe behaviours. Currently, the school is in stage 2 of implementing ‘Kidsmatter’, a well recognised child health program. Though our intervention processes, we are able to identify and cater for students who need extra support. . School Disciplinary Absences The following table shows the count of incidents for students recommended for each type of school disciplinary absence reported at the school.
SCHOOL DISCIPLINARY ABSENCES
Type 2014* 2015** 2016
Short Suspensions – 1 to 5 days 28 23 26
Long Suspensions – 6 to 20 days 1 0 0
Exclusions 1 0 1
Cancellations of Enrolment 0 0 0
* Caution should be used when comparing post 2013 SDA data as amendments to EGPA
disciplinary provisions and changes in methodology created time series breaks in 2014 and 2015.
**From 2015, Exclusion represents principal decisions to exclude rather than recommendations for exclusion. From 2015 where a principal decided not to exclude, a small number of recommendations for exclusions have been counted as a long suspension. Exclusions, Cancellations and Long & Charge Suspensions may be upheld or set aside through an appeals process.
Environmental Footprint
Reducing the school’s environmental footprint Water usage is kept to a minimum as the school has a bore used for grounds maintenance. Gardens are regularly mulched to restrict evaporation. We encourage lights to be turned off when rooms are vacant and this is a procedure adhered to by many staff. The maintenance schedule is closely monitored to ensure prompt responses to leaking taps/toilets etc.
ENVIRONMENTAL FOOTPRINT INDICATORS
Years Electricity
kWh Water
kL
2013-2014 284,223 2,058
2014-2015 283,752 1,811
2015-2016 272,363 3,474
The consumption data is compiled from sources including ERM, Ergon reports and utilities data entered into OneSchool by each school. The data provides an indication of the consumption trend in each of the utility categories which impact on the school’s environmental footprint.
School Funding
School income broken down by funding source School income, reported by financial year accounting cycle using standardized national methodologies and broken down by funding source is available via the My School website at http://www.myschool.edu.au/.
To access our income details, click on the My School link above. You will then be taken to the My School website with the following ‘Find a school’ text box.

10
Where it states ‘School name’, type in the name of the school you wish to view, select the school from the drop-down list and select <GO>. Read and follow the instructions on the next screen; you will be asked to confirm that you are not a robot then by clicking continue, you acknowledge that you have read, accepted and agree to the Terms of Use and Privacy Policy before being given access to the school’s profile webpage.
School financial information is available by selecting ‘School finances’ in the menu box in the top left corner of the school’s profile webpage. If you are unable to access the internet, please contact the school for a paper copy of income by funding source.
Our Staff Profile
Workforce Composition
Staff composition, including Indigenous staff
2016 WORKFORCE COMPOSITION
Description Teaching Staff Non-Teaching Staff Indigenous Staff
Headcounts 88 56 <5
Full-time Equivalents 80 35 <5
Qualification of all teachers
TEACHER* QUALIFICATIONS
Highest level of qualification Number of classroom teachers and school
leaders at the school
Doctorate 0
Masters 7
Graduate Diploma etc.** 13
Bachelor degree 60
Diploma 8
Certificate
*Teaching staff includes School Leaders **Graduate Diploma etc. includes Graduate Diploma, Bachelor Honours Degree, and Graduate Certificate.

11
Professional Development Expenditure On and Teacher Participation in Professional Development
The total funds expended on teacher professional development in 2016 were $90853.00.
The major professional development initiatives are as follows:
Book club, for example, Putting the Faces on the Data, Visible Learning and so on.
Optional learning opportunities – sessions on topics such as Questioning Techniques, analysing data, quality control of PM levels, coding, etc.
Coaching and mentoring
Professional development on using ICTs for learning
External professional development according to need eg. reading
In-class support eg. Science
Essential skills
The proportion of the teaching staff involved in professional development activities during 2016 was 100%.
Staff Attendance and Retention Staff attendance
AVERAGE STAFF ATTENDANCE (%)
Description 2014 2015 2016
Staff attendance for permanent and temporary staff and school leaders.
95% 96% 95%
Proportion of Staff Retained from the Previous School Year
From the end of the previous school year, 89% of staff was retained by the school for the entire 2016.
Performance of Our Students
Key Student Outcomes
Student Attendance
Student attendance
The table below shows the attendance information for all students at this school:

12
STUDENT ATTENDANCE 2016
Description 2014 2015 2016
The overall attendance rate* for the students at this school (shown as a percentage).
95% 95% 95%
The attendance rate for Indigenous students at this school (shown as a percentage).
91% 77% 77%
*The student attendance rate is generated by dividing the total of full-days and part-days that students attended, and comparing this to the total of all possible days for students to attend, expressed as a percentage.
The overall student attendance rate in 2016 for all Queensland Primary schools was 93%.
AVERAGE STUDENT ATTENDANCE RATE* (%) FOR EACH YEAR LEVEL
Year Level
Prep
Year 1
Year 2
Year 3
Year 4
Year 5
Year 6
Year 7
Year 8
Year 9
Year 10
Year 11
Year 12
2014 93% 93% 94% 95% 96% 95% 95% 96%
2015 95% 94% 95% 95% 95% 96% 95%
2016 94% 95% 95% 95% 96% 95% 95%
*Attendance rates effectively count attendance for every student for every day of attendance in Semester 1. The student attendance rate is generated by dividing the total of full-days and part-days that students attended, and comparing this to the total of all possible days for students to attend, expressed as a percentage.
DW = Data withheld to ensure confidentiality. Student Attendance Distribution The proportions of students by attendance range:
Description of how non-attendance is managed by the school Non-attendance is managed in state schools in line with the DET procedures, Managing Student Absences and Enforcing Enrolment and Attendance at State Schools and Roll Marking in State Schools, which outline processes for managing and recording student attendance and absenteeism. Non-attendance is managed in state schools in line with the DET procedures, Managing Student Absences and Enforcing Enrolment and Attendance at State Schools and Roll Marking in State Schools, which outline processes for managing and recording student attendance and absenteeism.
A same-day electronic attendance notification is in place to notify parents in the case of student absence. Students arriving late are signed in at the office before they proceed to their classroom. A record is also maintained of students who are consistently picked up from school late. Repeat offenders are spoken to and reminded of duty of care responsibilities and school expectations.
7
7
8
6
9
7
20
20
22
67
64
63
0% 20% 40% 60% 80% 100%
2016
2015
2014
Proportion of Students
Attendance Rate: 0% to <85% 85% to <90% 90% to <95% 95% to 100%

13
An Admin officer is responsible for ensuring rolls are marked daily and reasons for absences are entered on One School. A letter is issued requesting the parents notify the school of the reason for absence is sent to any student who is away with an explained absences.
Teachers are asked to notify their Deputy Principal if a student is repeatedly absent, if there are trends in their absences or they are away for a prolonged period of time. The DP then follows up by contacting the parent. If the DP suspects that the parent is neglecting their duty by failing to ensure their child gets to school, an SP4 will be completed and sent to the correct authorities. For students with significant absences and little or no response from parents, the Adopt-a-cop follows up with families involved.
NAPLAN
Our reading, writing, spelling, grammar and punctuation, and numeracy results for the Years 3, 5, 7 and 9 are available via the My School website at http://www.myschool.edu.au/.
To access our NAPLAN results, click on the My School link above. You will then be taken to the My
School website with the following ‘Find a school’ text box.
Where it states ‘School name’, type in the name of the school you wish to view, select the school from the drop-down list and select <GO>. Read and follow the instructions on the next screen; you will be asked to confirm that you are not a robot then by clicking continue, you acknowledge that you have read, accepted and agree to the Terms of Use and Privacy Policy before being given access to the school’s profile webpage.
School NAPLAN information is available by selecting ‘NAPLAN’ in the menu box in the top left corner of the school’s profile webpage. If you are unable to access the internet, please contact the school for a paper copy of our school’s NAPLAN results.
Conclusion
Warrigal Road State School continues to grow productive relationships with the wider educational community in order to share quality teaching practices. The school’s standing in both the educational and wider community continues to grow in prominence with a sound basis of values and
14
vision driven school improvement. The staff and students strive to ‘learn and grow’ and achieve to our greatest potential.

15